the schiehallion fund limited
TRANSCRIPT

THE SCHIEHALLION FUND LIMITED
Interim Financial Report31 July 2021

Investment ObjectiveThe Schiehallion Fund Limited seeks to generate capital growth for investors through making long-term minority investments in later stage private businesses that the Company considers to have transformational growth potential and to have the potential to become publicly traded.
Principal and Emerging Risks and UncertaintiesThe principal and emerging risks facing the Company are:
Investment and Strategic Risks – Liquidity of investments; Market, Economic, Political and Environmental Risks; Valuation Risk; Investment Strategy Risk; and Discount Risk.
External Risks – Political and Associated Economic Risk; Legal and Regulatory Risk; and Covid-19.
Operational Risks – Performance and Reliance on Third Party Service Providers; Cyber Security Threats; and Key Professionals.
Emerging Risks – Cyber risk and coronavirus; and Environmental Social and Governance issues (ESG).
An explanation of these risks and how they are managed is set out on pages 5 to 8 of the Company’s Annual Report and Financial Statements for the year to 31 January 2021 which is available on the Company’s website: schiehallionfund.com. The principal risks and uncertainties have not changed since the date of the Annual Report and Financial Statements.
Responsibility StatementThe Directors of The Schiehallion Fund Limited confirm that to the best of their knowledge:
a) the Interim Financial Report has been prepared in accordance with IAS 34 Interim Financial Reporting and the Directors have elected to prepare financial statements that comply with International Financial Reporting Standards as issued by the International Accounting Standards Board;
b) the Interim Management Report includes a fair review of the information required by:
(i) DTR 4.2.7R of the Disclosure Guidance and Transparency Rules, being an indication of important events that have occurred during the first six months of the financial year and their impact on the condensed set of financial statements, and a description of the principal risks and uncertainties for the remaining six months of the financial year; and
(ii) DTR 4.2.8R of the Disclosure Guidance and Transparency Rules, being related party transactions that have taken place in the first six months of the current financial year and that have materially affected the financial position or the performance of the enterprise during that period.
By Order of the Board Linda Yueh Chairperson 2 September 2021
The Directors are responsible for the maintenance and integrity of the corporate and financial information included on the Company’s website, and for the preparation and dissemination of financial statements. Legislation in Guernsey governing the preparation and dissemination of financial statements may differ from legislation in other jurisdictions.

The Schiehallion Fund Limited 01
Ordinary shares 31 July 202131 January 2021
(audited) % change
Shareholders’ funds US$810.66m US$706.08m
Net asset value per ordinary share 164.19¢ 146.99¢ 11.7
Share price 203.00¢ 180.00¢ 12.8
Premium† 23.6% 22.5%
Number of shares in issue 493,730,002 480,350,002
Market capitalisation US$1,002.27m US$864.63m
Six months to 31 July 2021
Six months to 31 July 2020
Revenue earnings per share (0.75¢) 0.13¢
For the period from 26 April 2021, launch and first day of trading, to 31 July 2021
C shares 31 July 2021 26 April 2021 # % change
Shareholders’ funds US$698.31m US$694.78m
Net asset value per ordinary share 99.76¢ 99.25¢ 0.5
Share price 125.00¢ 124.00¢ 0.8
Premium† 25.3% 24.9%
Number of shares in issue 700,000,000 700,000,000
Market capitalisation US$875.00m US$868.00m
Period from 26 April 2021 # to 31 July 2021
Revenue earnings per share (0.04¢)
Notes* For a definition of terms see Glossary of Terms and Alternative Performance Measures on page 20.† Alternative performance measure, see Glossary of Terms and Alternative Performance Measures on page 20. # 26 April 2021, the date the Company’s C shares were admitted to trading on the Specialist Fund Segment of the
Main Market of the London Stock Exchange.
Summary of Unaudited Results*
All investment strategies have the potential for profit and loss.
Past performance is not a guide to future performance

02 Interim Financial Report 2021
Summary of Unaudited Results* (continued)
All investment strategies have the potential for profit and loss.
Past performance is not a guide to future performance
Period’s High and Low
Six months to 31 July 2021 Year to 31 January 2021
Ordinary shares High Low High Low
Net asset value per ordinary share 164.19¢ 146.57¢ 146.99¢ 102.01¢
Share price 203.00¢ 180.00¢ 180.00¢ 121.50¢
Premium† 25.7% 17.4% 31.8% 2.5%
Period from 26 April 2021 # to 31 July 2021
C shares High Low
Net asset value per ordinary share 99.76¢ 99.23¢
Share price 125.00¢ 124.00¢
Premium† 26.0% 24.9%
Performance Since Inception
Ordinary shares 31 July 2021 27 March 2019 ‡ % change
Net asset value per ordinary share 164.19¢ 99.66¢ 64.8
Share price 203.00¢ 100.00¢ 103.0
C shares 31 July 2021 26 April 2021 # % change
Net asset value per C share 99.76¢ 99.25¢ 0.5
Share price 125.00¢ 124.00¢ 0.8
Notes* For a definition of terms see Glossary of Terms and Alternative Performance Measures on page 20.† Alternative performance measure, see Glossary of Terms and Alternative Performance Measures on page 20.# 26 April 2021, the date the Company’s C shares were admitted to trading on the Specialist Fund Segment of the
Main Market of the London Stock Exchange. ‡ 27 March 2019, the date the Company’s ordinary shares were admitted to trading on the Specialist Fund Segment
of the Main Market of the London Stock Exchange.

The Schiehallion Fund Limited 03
Interim Management Report
In April this year, Schiehallion raised US$700m in capital via a conversion or C share issuance. We want to say a deep ‘thank you’ to everyone who supported and participated in this process, and to welcome our new C shareholders. At the time of the raise, the capital in the Schiehallion ordinary share class was 95% invested.
This raise represents an important bridge. In our long-term portfolio management task, we make no distinction between our ordinary and C shareholders. Whilst in the short term both have exposure to different parts of the Schiehallion portfolio, over the medium to long term, everyone will be a shareholder in the combined portfolio. The capital raised therefore enables Schiehallion ordinary shareholders to benefit from the continued flow of investment opportunities over the medium term until the recycling of capital within the portfolio, from maturing investments to new investments, starts occurring naturally. Given our investment time horizon is five to ten years, and beyond, this is not a process that we expect to start overnight.
Indeed, it remains our thesis that it is possible to gain access to some of the best opportunities in private markets via being a truly long-term and aligned investor. Sadly, many early-stage private investors are constrained to become forced sellers after private companies pass into the listed markets. This necessarily drives an increased investor focus on avoiding short-term tactical missteps that is often frustrating to founders and management teams who remain intent on seizing the long-term strategic opportunity. The Schiehallion offering, of being a long-term investor for whom listing events are just another step in the journey, is designed to stand out in this context.
We continue to see encouraging signs of this thesis playing out. Our pipeline remains as healthy as ever, with the team continuing to broaden our contacts across industries in North America, as well as engaging more deeply with companies in international geographies that are after many years approaching our investment sweet-spot such as India and Brazil, and working closely with our Shanghai team to engage with a new generation of Chinese local champions. We are also continuing to monitor the evolving regulatory environment in China, with these factors being incorporated into our investment analysis under the ‘social license to operate’ component of our research framework.
Drawing on this work, the last six months has seen us deploy capital into seven new investee companies: Brex, Faire, Loft, Daily Hunt, Rappi, Masterclass and PsiQuantum. Within their respective spheres – small business finance, wholesale, real estate, social media, delivery, entertainment and computer hardware – each has the clear potential to build a profoundly distinctive and valuable operation.
A couple of these businesses are particularly worth highlighting. Loft, Daily Hunt and Rappi are all companies based in geographies that we’ve been deepening our understanding of and sourcing work in for many years. In the case of two of them, Daily Hunt and Rappi, our conversations with the businesses have spanned much of that time. However, it’s only now that we’re finding that the operations and opportunities in these geographies are hitting the sweet spot for us to start deploying capital. We’re excited to see great bottom-up investment cases emerging in these and other geographies as their innovation ecosystems ripen. In the case of Daily Hunt, it’s perhaps also worth noting that the investment was made entirely from ordinary share capital as it is not possible for the C share pool to access the Indian market.
PsiQuantum also deserves a mention. The vast majority of our investee companies have robust revenue lines and clear unit economics, with the main debate focused on business model advantage and the scope for scale. This is very much our sweet spot. That said, we believe that there is room in the portfolio for a minority of companies with different characteristics. These businesses are typically in industries where value is created less by refinements in product-market fit or distribution, and more via technological innovations. Here we seek to clearly understand the technical abilities of the core team and their track record in reaching key milestones. PsiQuantum, whose work in photonic quantum computing leads the field, is an operation that we have followed over many years; however, we now believe that it has turned a corner in de-risking its approach, and so has become a highly attractive investment opportunity in its own right. As with any holding, there can be no certainty of success.
We have also seen Oscar Health, Wise and Zymergen enter the publicly listed section of the portfolio. Per our philosophy, we are continuing to be patient and long-term supporters of these

04 Interim Financial Report 2021
businesses. Short-term volatility in share prices in the months and quarters immediately following a listing matters less to us than tracking whether fundamental business performance continues to support the long-term investment opportunity. We’re lucky to be able to work within the broader Baillie Gifford investment floor, with our public market colleagues adding an extra layer of analysis to our own as these businesses become more widely appreciated within public markets.
Across the portfolio, many of our holdings have continued to perform extremely strongly, the difficulties of the Covid-19 era notwithstanding. In the last six months, we have taken advantage of opportunities to put more capital to work in existing holdings, including Workrise, Tanium, Stripe, SpaceX, Northvolt and Epic Games – all cases where our conviction in the upside has deepened faster than their valuations have risen. Other holdings have had a tougher time of it, with the focus remaining on keeping their organisations and balance sheets stable through the pandemic. Here, as before, our conversations with management teams have focused on the importance of retaining key employees and customer relationships, preserving their ability to grow profitably as economic conditions improve.
The principal risks and uncertainties facing the Company are set out on the inside front cover of this report.
Peter Singlehurst Robert Natzler
The Schiehallion Fund Limited 05
Baillie Gifford Statement on Stewardship
Reclaiming Activism for Long-Term InvestorsBaillie Gifford’s over-arching ethos is that we are ‘actual’ investors. We have a responsibility to behave as supportive and constructively engaged long-term investors. We invest in companies at different stages in their evolution, across vastly different industries and geographies and we celebrate their uniqueness. Consequently, we are wary of prescriptive policies and rules, believing that these often run counter to thoughtful and beneficial corporate stewardship. Our approach favours a small number of simple principles which help shape our interactions with companies.
Our Stewardship PrinciplesPrioritisation of long-term value creation We encourage company management and their boards to be ambitious and focus their investments on long-term value creation. We understand that it is easy for businesses to be influenced by short-sighted demands for profit maximisation but believe these often lead to sub-optimal long-term outcomes. We regard it as our responsibility to steer businesses away from destructive financial engineering towards activities that create genuine economic value over the long run. We are happy that our value will often be in supporting management when others do not.
A constructive and purposeful board We believe that boards play a key role in supporting corporate success and representing the interests of minority shareholders. There is no fixed formula, but it is our expectation that boards have the resources, cognitive diversity and information they need to fulfil these responsibilities. We believe that a board works best when there is strong independent representation able to assist, advise and constructively test the thinking of management.
Long-term focused remuneration with stretching targets We look for remuneration policies that are simple, transparent and reward superior strategic and operational endeavour. We believe incentive schemes can be important in driving behaviour, and we encourage policies which create alignment with genuine long-term shareholders. We are
accepting of significant pay-outs to executives if these are commensurate with outstanding long-run value creation, but plans should not reward mediocre outcomes. We think that performance hurdles should be skewed towards long-term results and that remuneration plans should be subject to shareholder approval.
Fair treatment of stakeholders We believe it is in the long-term interests of companies to maintain strong relationships with all stakeholders, treating employees, customers, suppliers, governments and regulators in a fair and transparent manner. We do not believe in one-size-fits-all governance and we recognise that different shareholder structures are appropriate for different businesses. However, regardless of structure, companies must always respect the rights of all equity owners.
Sustainable business practices We look for companies to act as responsible corporate citizens, working within the spirit and not just the letter of the laws and regulations that govern them. We believe that corporate success will only be sustained if a business’s long-run impact on society and the environment is taken into account. Management and boards should therefore understand and regularly review this aspect of their activities, disclosing such information publicly alongside plans for ongoing improvement.

06 Interim Financial Report 2021
List of Investments as at 31 July 2021 (unaudited)
Name
Business
Country
2021Ordinary
sharesvalue
US$’000
2021C shares
valueUS$’000
2021Totalvalue
US$’000
2021 % of net assets *
Wise PLC – Listed Online international money transfer service
United Kingdom 61,551 20,459 82,010 5.4
ByteDance Limited Social media and news aggregation company China 59,920 – 59,920 4.0
Stripe Inc Online payment platform United States 51,035 – 51,035 3.4
Affirm Holdings Inc – Listed
Online platform which provides point of sale consumer finance United States 50,181 – 50,181 3.3
Space Exploration Technologies Corp
Designs, manufactures and launches advanced rockets and spacecraft United States 42,322 – 42,322 2.8
Warby Parker (JAND Inc) Online and physical corrective eyewear retailer United States 41,844 – 41,844 2.8
Scopely Inc Online gaming company United States 40,024 – 40,024 2.7
Epic Games Inc Video game developer United States 32,837 – 32,837 2.2
Tempus Labs Inc Oncological records aggregator and diagnostic testing provider United States 30,356 – 30,356 2.0
Daily Hunt (Ver se Innovation Limited)
Telephone voice, data, text messaging and roaming services India 30,058 – 30,058 2.0
Rappi Inc Provider of an on demand delivery platform designed to connect consumers with local stores United States – 30,000 30,000 2.0
Tanium Inc Online security management United States 28,573 – 28,573 1.9
Northvolt AB Lithium ion battery manufacturer Sweden 24,177 3,431 27,608 1.8
FlixMobility GmbH European mobility provider Germany 13,363 13,411 26,774 1.8
Workrise Technologies Inc Jobs marketplace for the energy sector United States 26,238 – 26,238 1.7
Allbirds Inc Sustainable direct-to- customer footwear brand United States 23,211 – 23,211 1.5
Zymergen Inc – Listed† Synthetic biology United States 21,193 – 21,193 1.4
Loft Holdings Ltd Online property platform Brazil – 20,000 20,000 1.3

The Schiehallion Fund Limited 07
Name
Business
Country
2021Ordinary
sharesvalue
US$’000
2021C shares
valueUS$’000
2021Totalvalue
US$’000
2021 % of net assets *
Indigo Agriculture Inc Microbial seed treatments to increase crop yields and grain marketplace United States 19,579 – 19,579 1.3
Grail Inc# Oncology testing United States 17,874 – 17,874 1.2
Graphcore Limited Computer chip developer United Kingdom 15,622 – 15,622 1.0
Chime Financial Inc Digital current account provider United States 15,442 – 15,442 1.0
PsiQuantum Corp Silicon photonic quantum computing United States – 15,000 15,000 1.0
Cohesity Inc Data storage United States 14,940 – 14,940 1.0
Oscar Health Inc – Listed‡
Healthcare insurance provider United States 13,909 – 13,909 0.9
Convoy Inc Marketplace for truckers and shippers United States 13,700 – 13,700 0.9
Faire Wholesale Inc Online wholesale market place United States – 13,333 13,333 0.9
Carbon Inc Manufactures and develops 3D printers United States 12,642 – 12,642 0.8
Away (JRSK Inc) Travel and lifestyle brand United States 12,153 – 12,153 0.8
HeartFlow Inc Develops software for cardiovascular disease diagnosis and treatment United States 11,314 – 11,314 0.7
Jiangxiaobai Holdings Ltd
Producer of alcoholic beverages China 11,273 – 11,273 0.7
Airbnb Inc – Listed Online market place for travel accommodation United States 11,069 – 11,069 0.7
Brex Inc Corporate credit cards for start-ups United States 10,210 – 10,210 0.7
Nuro Inc Developer of autonomous delivery vehicles United States 10,000 – 10,000 0.7
Yanka Industries Inc Online education platform United States 10,000 – 10,000 0.7
Honor Technology Inc Provider of home-care services United States 5,565 – 5,565 0.4
Total investments 782,175 115,634 897,809 59.5

08 Interim Financial Report 2021
Name
2021Ordinary
sharesvalue
US$’000
2021C shares
valueUS$’000
2021Totalvalue
US$’000
2021 % of net assets *
US Treasury Bill 12/08/2021 – 96,299 96,299 6.4
US Treasury Bill 07/10/2021 – 96,296 96,296 6.4
US Treasury Bill 04/11/2021 – 96,296 96,296 6.4
US Treasury Bill 27/01/2022 – 96,237 96,237 6.4
US Treasury Bill 24/03/2022 – 96,222 96,222 6.3
US Treasury Bill 16/06/2022 – 96,240 96,240 6.4
Total US Treasury Bills – 577,590 577,590 38.3
Cash 29,751 5,363 35,114 2.3
Other current assets and liabilities (1,264) (275) (1,539) (0.1)
Net current assets 28,487 582,678 611,165 2.2
Total net assets 810,662 698,312 1,508,974 100.0
Allocation of Net Assets (unaudited)
Name
2021Ordinary
sharesvalue
US$’000
2021C shares
valueUS$’000
2021Totalvalue
US$’000
2021 % of net assets *
Listed investments 157,903 20,459 178,362 11.8
Private company investments 624,272 95,175 719,447 47.7
US Treasury Bills – 577,590 577,590 38.3
Cash and cash equivalents 29,751 5,363 35,114 2.3
Net current assets (1,264) (275) (1,539) (0.1)
Total net assets 810,662 698,312 1,508,974 100.0
* See Glossary of Terms and Alternative Performance Measures on page 20.† Listed security, in line with the conditions of the IPO, investors with holdings prior to the listing are subject to a lock in
period preventing trading of the holding. This expires on 19 October 2021.# Subsequent to the period end Illumina announced its acquisition of Grail.‡ Listed security, in line with the conditions of the IPO, investors with holdings prior to the listing are subject to a lock in
period preventing trading of the holding. This expired on 30 August 2021.
The Company may hold various classes of shares in investee companies, some of which may have a preference on winding up.
List of Investments as at 31 July 2021 (unaudited) (continued)
The Schiehallion Fund Limited 09
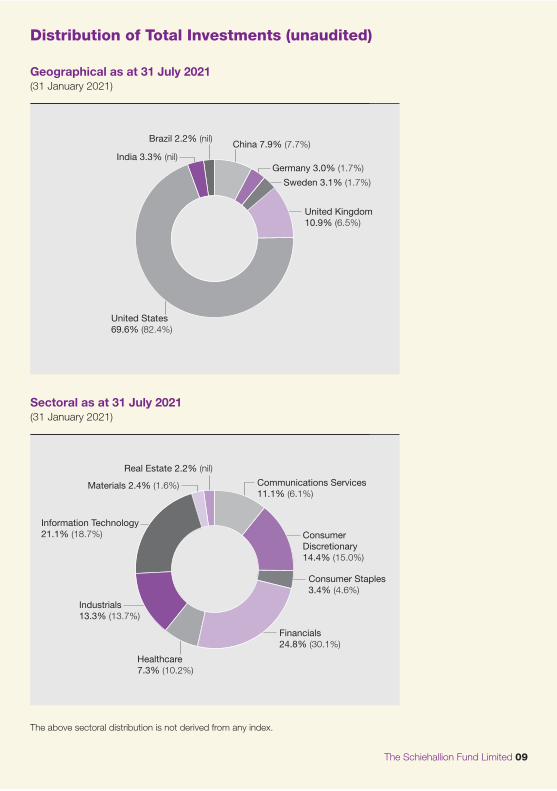
The above sectoral distribution is not derived from any index.
Distribution of Total Investments (unaudited)
Geographical as at 31 July 2021 (31 January 2021)
Sectoral as at 31 July 2021 (31 January 2021)
Industrials 13.3% (13.7%)
Consumer Discretionary 14.4% (15.0%)
Consumer Staples 3.4% (4.6%)
Information Technology 21.1% (18.7%)
Healthcare 7.3% (10.2%)
Communications Services 11.1% (6.1%)
Financials 24.8% (30.1%)
Real Estate 2.2% (nil)
Materials 2.4% (1.6%)
Germany 3.0% (1.7%)
China 7.9% (7.7%)
United Kingdom 10.9% (6.5%)
Brazil 2.2% (nil)
United States 69.6% (82.4%)
India 3.3% (nil)
Sweden 3.1% (1.7%)

10 Interim Financial Report 2021 The Schiehallion Fund Limited 11
Income Statement (unaudited)
The total column of this Statement represents the Statement of Comprehensive Income of the Company. The supplementary revenue and capital columns are prepared under guidance published by the Association of Investment Companies.
All revenue and capital items in this statement derive from continuing operations.
For the six months to 31 July 2021 For the six months to 31 July 2020 For the year to 31 January 2021
NotesRevenueUS$’000
CapitalUS$’000
TotalUS$’000
RevenueUS$’000
CapitalUS$’000
TotalUS$’000
RevenueUS$’000
CapitalUS$’000
TotalUS$’000
Gains on investments – 86,674 86,674 – 20,809 20,809 – 209,901 209,901
Currency gains/(losses) – 338 338 – 24 24 – (1) (1)
Income 2 148 – 148 2,191 – 2,191 2,764 – 2,764
Investment management fee 3 (3,534) – (3,534) (1,252) – (1,252) (3,603) – (3,603)
Other administrative expenses 4 (509) – (509) (331) – (331) (759) – (759)
Operating profit before taxation (3,895) 87,012 83,117 608 20,833 21,441 (1,598) 209,900 208,302
Tax on ordinary activities – – – – – – – – –
Profit and total comprehensive income for the period (3,895) 87,012 83,117 608 20,833 21,441 (1,598) 209,900 208,302
For the six months to 31 July 2021 For the six months to 31 July 2020 For the year to 31 January 2021
RevenueUS$’000
CapitalUS$’000
TotalUS$’000
RevenueUS$’000
CapitalUS$’000
TotalUS$’000
RevenueUS$’000
CapitalUS$’000
TotalUS$’000
Total comprehensive income/(loss) for the period analysed as follows:
Attributable to Ordinary shareholders (3,645) 83,252 79,607 608 20,833 21,441 (1,598) 209,900 208,302
Attributable to C shareholders (250) 3,760 3,510 – – – – – –
Profit and total comprehensive income for the period (3,895) 87,012 83,117 608 20,833 21,441 (1,598) 209,900 208,302
(Loss)/earnings per Ordinary share (0.75¢) 17.15¢ 16.40¢ 0.13¢ 4.37¢ 4.50¢ (0.33¢) 43.94¢ 43.61¢
(Loss)/earnings per C share (0.04¢) 0.54¢ 0.50¢ – – – – – –

12 Interim Financial Report 2021
Statement of Financial Position (unaudited)
Notes
At 31 July 2021
US$’000
At 31 July 2021
US$’000
At 31 January 2021
US$’000
At 31 January 2021
US$’000
Fixed assetsInvestments held at fair value through profit or loss 7 897,809 614,179
Current assetsUS Treasury Bills 577,590 77,000Cash and cash equivalents 35,114 16,113Debtors 611 426
613,315 93,539
Current liabilitiesAmounts falling due within one year (2,150) (1,638)
Net current assets 611,165 91,901
Net assets 1,508,974 706,080
Capital and reservesShare capital 8 1,200,117 480,340Capital reserve 307,990 220,978Revenue reserve 867 4,762
Shareholders’ funds 1,508,974 706,080
Shareholders’ funds per ordinary share (US$’000) 810,662 706,080
Net asset value per ordinary share 164.19¢ 146.99¢Number of ordinary shares in issue 493,730,002 480,350,002
Shareholders’ funds per C share (US$’000) 698,312 –
Net asset value per C share 99.76¢ –Number of C shares in issue 700,000,000 –

The Schiehallion Fund Limited 13
Statement of Changes in Equity (unaudited)
Six months to 31 July 2021
Notes
Sharecapital
US$’000
Capital reserve * US$’000
Revenuereserve
US$’000
Shareholders’funds
US$’000
Shareholders’ funds at 31 January 2021 480,340 220,978 4,762 706,080Ordinary shares issued 8 24,975 – – 24,975C shares issued 8 694,802 – – 694,802Total comprehensive income for the period – Ordinary shares – 83,252 (3,645) 79,607Total comprehensive income – C shares – 3,760 (250) 3,510
Shareholders’ funds at 31 July 2021 1,200,117 307,990 867 1,508,974
Six months to 31 July 2020
Sharecapital
US$’000
Capital reserve * US$’000
Revenuereserve
US$’000
Shareholders’funds
US$’000
Shareholders’ funds at 31 January 2020 475,642 11,078 6,360 493,080
Ordinary shares issued 131 – – 131
Total comprehensive income for the period – 20,833 608 21,441
Shareholders’ funds at 31 July 2020 475,773 31,911 6,968 514,652
* Includes investment holdings gains of US$307,643,000 (31 July 2020 – US$8,250,000).

14 Interim Financial Report 2021
Statement of Cash Flows (unaudited)
Six months to 31 July 2021
Six months to 31 July 2020
US$’000 US$’000 US$’000 US$’000
Cash flows from operating activitiesOperating profit before taxation 83,117 21,441US Treasury Bills interest (78) (2,394)Net gains on investments (86,674) (20,809)Currency gains (338) (24) Changes in debtors and creditors 481 552
Net cash used in operating activities* (3,492) (1,234)
Cash flows from investing activitiesAcquisitions of US Treasury Bills (752,036) (120,028) Disposals of US Treasury Bills 251,524 250,943 Acquisitions of investments (196,956) (124,999) Disposals of investments – –
Net cash (used in)/from investing activities (697,468) 5,916
Cash flows from financing activitiesOrdinary shares issued 24,821 131 C shares issued 694,802 –
Net cash from financing activities 719,623 131
Net increase in cash and cash equivalents 18,663 4,813 Effect of exchange rate fluctuations on cash and cash equivalents 338 24 Cash and cash equivalents at start of period 16,113 10,133
Cash and cash equivalents at 31 July 35,114 14,970
* Cash from operations includes interest received of US$1,000 (2020 – US$17,000).

The Schiehallion Fund Limited 15
Notes to the Financial Statements (unaudited)
1 Basis of Accounting The condensed Financial Statements for the six months to 31 July 2021 comprises the statements set
out on the previous pages together with the related notes on pages 15 to 19. They have been prepared in accordance with International Financial Reporting Standards (IFRS). The Financial Statements for the six months to 31 July 2021 have been prepared on the basis of the same accounting policies as set out in the Company’s Annual Report and Financial Statements at 31 January 2021.
Equity Investment The Ordinary shares and C shares of the Company are classified as equity in accordance with the definition
of equity instruments under IAS 32 Financial Instruments: presentation (IAS 32). The proceeds from the issue of shares are recognised in the Statement of Changes in Equity net of incremental issuance costs.
Going Concern In accordance with The Financial Reporting Council’s guidance on going concern and liquidity risk,
including its Covid-19 guidance, the Directors have undertaken a rigorous review of the Company’s ability to continue as a going concern and specifically in the context of the coronavirus pandemic.
Having considered the Company’s principal risks and uncertainties, as set out in the inside front cover, together with its current position, investment objective and policy, its assets and liabilities, and projected income and expenditure, it is the Directors’ opinion that the Company has adequate resources to continue in operational existence for the foreseeable future. The Directors have considered the Company’s principal and emerging risks as detailed on pages 5 to 8 of the Company’s Annual Report and Financial Statements for the year to 31 January 2021 and the Investment Manager ensures that the Company holds at all times a proportion of assets that is sufficiently liquid to enable it to discharge its payment obligations. Accordingly, the Directors consider it appropriate to adopt the going concern basis of accounting in preparing these Financial Statements and confirm that they are not aware of any material uncertainties which may affect the Company’s ability to continue to do so over a period of at least twelve months from the date of approval of the Financial Statements.
2 Income
Six months to 31 July 2021
US$’000
Six months to 31 July 2020
US$’000
Year to 31 January 2021
US$’000
US Treasury Bills interest 148 2,394 2,899Overseas interest – (220) (153)Deposit interest – 17 18
Total income 148 2,191 2,764
3 Investment Management Fee
Six months to 31 July 2021
US$’000
Six months to 31 July 2020
US$’000
Year to 31 January 2021
US$’000
Investment management fee 3,534 1,252 3,603
The Company has appointed Baillie Gifford & Co Limited as its Investment Manager (the ‘Investment Manager’). As the entity appointed to be responsible for risk management and portfolio management, the Investment Manager has also been appointed as the Company’s Alternative Investment Fund Manager (‘AIFM’). Baillie Gifford & Co Limited has delegated portfolio management services to Baillie Gifford Overseas Limited. The Investment Management Agreement is terminable on not less than six months’ notice.

16 Interim Financial Report 2021
3 Investment Management Fee (continued) Under the terms of the Investment Management Agreement, the Investment Manager will be entitled
to an annual fee (exclusive of VAT, which shall be added where applicable) of: 0.9% on the net asset value excluding cash or cash equivalent assets up to and including US$650 million; 0.8% on the net asset value of the Company excluding cash or cash equivalent assets exceeding US$650 million up to and including US$1.3 billion; and 0.7% on the net asset value excluding cash or cash equivalent assets exceeding US$1.3 billion. Management fees are calculated and payable quarterly.
4 Other Administrative Expenses
Six months to 31 July 2021
US$’000
Six months to 31 July 2020
US$’000
Year to 31 January 2021
US$’000
General administrative expenses 239 168 323Administrator’s fee 55 47 83Auditor’s remuneration for audit services 113 46 206Directors’ fees* 102 70 147
509 331 759
Expenses relating directly to a share class are charged directly to that share class. Expenses pertaining to both Ordinary and C shares are split equally between the share classes.* Each Director received a one-off fee of £5,000 (US$6,953 equivalent) which covered services relating to the initial
listing of the Company’s C shares.
5 Earnings per Share
Six months to 31 July 2021
Six months to 31 July 2020
Year to 31 January 2021
Ordinary shares US$’000 ¢ US$’000 ¢ US$’000 ¢
Revenue return on ordinary activities after taxation (3,645) (0.75) 608 0.13 (1,598) (0.33)
Capital return on ordinary activities after taxation 83,252 17.15 20,833 4.37 209,900 43.94
Profit and total comprehensive income for the period 79,607 16.40 21,441 4.50 208,302 43.61
Weighted average number of shares in issue 485,476,079 477,267,310 477,670,487
Notes to the Financial Statements (unaudited) (continued)

The Schiehallion Fund Limited 17
5 Earnings per Share (continued)
Period from 26 April 2021
to 31 July 2021
C shares US$’000 ¢
Revenue return on ordinary activities after taxation (250) (0.04)
Capital return on ordinary activities after taxation 3,760 0.54
Profit and total comprehensive income for the period 3,510 0.50
Weighted average number of C shares in issue 700,000,000
Net return per share is based on the above totals of revenue and capital and the weighted average number of shares in issue during each period. There are no dilutive or potentially dilutive shares in issue.
6 Ordinary Dividends There were no dividends paid or proposed in respect of the six months for either the Ordinary shares or
for the C shares (2020 – none).
7 Financial Instruments Fair Value Hierarchy The fair value hierarchy used to analyse the fair values of financial assets is described below. The levels
are determined by the lowest (that is the least reliable or least independently observable) level of input that is significant to the fair value measurement for the individual investment in its entirety as follows:
Level 1 – using unadjusted quoted prices for identical instruments in an active market;
Level 2 – using inputs, other than quoted prices included within Level 1, that are directly or indirectly observable (based on market data); and
Level 3 – using inputs that are unobservable (for which market data is unavailable).
As at 31 July 2021Level 1
US$’000Level 2
US$’000Level 3
US$’000Total
US$’000
Listed equities 178,362 – – 178,362
Unlisted ordinary shares – – 124,541 124,541
Unlisted preference shares* – – 589,735 589,735
Unlisted convertible promissory notes – – 5,171 5,171
Total financial asset investments 178,362 – 719,447 897,809

18 Interim Financial Report 2021
7 Financial Instruments (continued)
As at 31 January 2021Level 1
US$’000Level 2
US$’000Level 3
US$’000Total
US$’000
Listed equities 102,442 – – 102,442
Unlisted ordinary shares – – 79,352 79,352
Unlisted preference shares* – – 429,710 429,710
Unlisted convertible promissory notes – – 2,675 2,675
Total financial asset investments 102,442 – 511,737 614,179
* The investments in preference shares are not classified as equity holdings as they include liquidation preference rights that determine the repayment (or multiple thereof) of the original investment in the event of a liquidation event such as a take-over.
During the six months to 31 July 2021, investments with a fair value (IPO price) of US$85,165,000 were transferred from Level 3 to Level 1 on becoming listed. During the year ended 31 January 2021, investments with a fair value (IPO price) of US$47,656,000 were transferred from Level 3 to Level 1 on becoming listed.
The valuation techniques used by the Company are explained in the accounting policies on page 42 of the Company’s Annual Report and Financial Statements for the year to 31 January 2021. Listed investments are categorised as Level 1 if they are valued using unadjusted quoted prices for identical instruments in an active market and as Level 2 if they do not meet all these criteria but are, nonetheless, valued using market data. The Company’s holdings in unlisted investments are categorised as Level 3 as unobservable data is a significant input to their fair value measurements.
8 Share Capital
31 July 2021Number
31 July 2021US$’000
31 January 2021Number
31 January 2021US$’000
Allotted, called up and fully paid ordinary shares of US$1 each 493,730,002 505,315 480,350,002 480,340
Allotted, called up and fully paid C shares of US$1 each 700,000,000 694,802 – –
By way of a special resolution dated 15 March 2019 the Directors have a general authority to allot up to 720,000,000 ordinary shares or C shares, such figure to include the ordinary shares issued at the initial placing. 477,250,000 ordinary shares were issued at the Company’s initial placing hence the Company has the ability to issue a further 242,750,000 shares under this existing authority which expires at the end of the period concluding immediately prior to the Annual General Meeting of the Company to be held in 2024 (or, if earlier, five years from the date of the resolution). During the six months to 31 July 2021 the Company issued 13,380,000 ordinary shares raising net proceeds of US$24,974,000. As at 31 July 2021 the Company has the authority to issue 229,370,000 ordinary shares. In the period from 1 August 2021 to 1 September 2021 the Company issued a further 1,660,000 shares raising net proceeds of US$3,436,000.
By way of a special resolution dated 18 March 2021 the Directors have a general authority to allot up to 700,000,000 C share. On 26 April 2021, the Company issued 700,000,000 C shares of US$1 each and raised gross proceeds of US$700,000,000. The issue costs in respect of the C share issue were US$5,198,000. These costs consisted of mainly broker commission (US$4,066,000), legal fees (US$601,000) and listing fees (US$396,000).
Notes to the Financial Statements (unaudited) (continued)
The Schiehallion Fund Limited 19
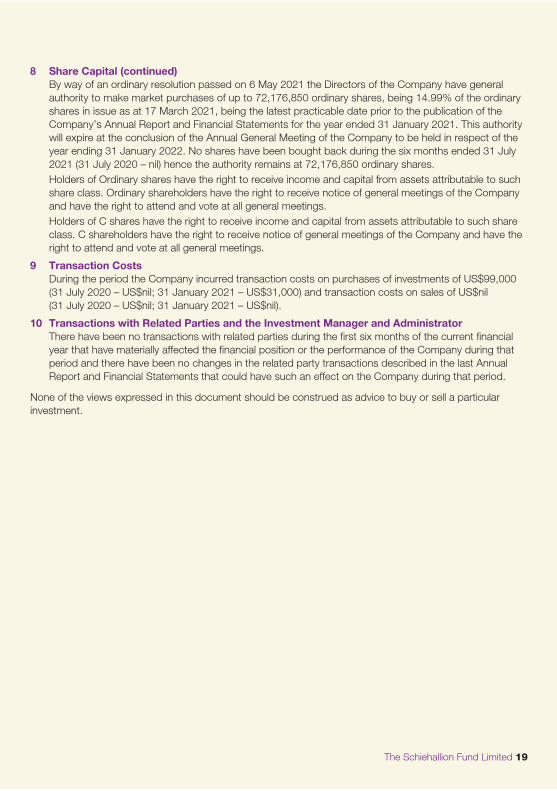
8 Share Capital (continued) By way of an ordinary resolution passed on 6 May 2021 the Directors of the Company have general
authority to make market purchases of up to 72,176,850 ordinary shares, being 14.99% of the ordinary shares in issue as at 17 March 2021, being the latest practicable date prior to the publication of the Company’s Annual Report and Financial Statements for the year ended 31 January 2021. This authority will expire at the conclusion of the Annual General Meeting of the Company to be held in respect of the year ending 31 January 2022. No shares have been bought back during the six months ended 31 July 2021 (31 July 2020 – nil) hence the authority remains at 72,176,850 ordinary shares.
Holders of Ordinary shares have the right to receive income and capital from assets attributable to such share class. Ordinary shareholders have the right to receive notice of general meetings of the Company and have the right to attend and vote at all general meetings.
Holders of C shares have the right to receive income and capital from assets attributable to such share class. C shareholders have the right to receive notice of general meetings of the Company and have the right to attend and vote at all general meetings.
9 Transaction Costs During the period the Company incurred transaction costs on purchases of investments of US$99,000
(31 July 2020 – US$nil; 31 January 2021 – US$31,000) and transaction costs on sales of US$nil (31 July 2020 – US$nil; 31 January 2021 – US$nil).
10 Transactions with Related Parties and the Investment Manager and Administrator There have been no transactions with related parties during the first six months of the current financial
year that have materially affected the financial position or the performance of the Company during that period and there have been no changes in the related party transactions described in the last Annual Report and Financial Statements that could have such an effect on the Company during that period.
None of the views expressed in this document should be construed as advice to buy or sell a particular investment.
20 Interim Financial Report 2021
Total Assets The total value of all assets held less all liabilities (other than liabilities in the form of borrowings).
Shareholders’ Funds and Net Asset ValueShareholders’ Funds is the value of all assets held less all liabilities, with borrowings deducted at book cost. Net Asset Value (NAV) is the value of all assets held less all liabilities, with borrowings deducted at either fair value or par value. Per share amounts are calculated by dividing the relevant figure by the number of ordinary shares in issue.
Net Liquid AssetsNet liquid assets comprise current assets less current liabilities (excluding borrowings).
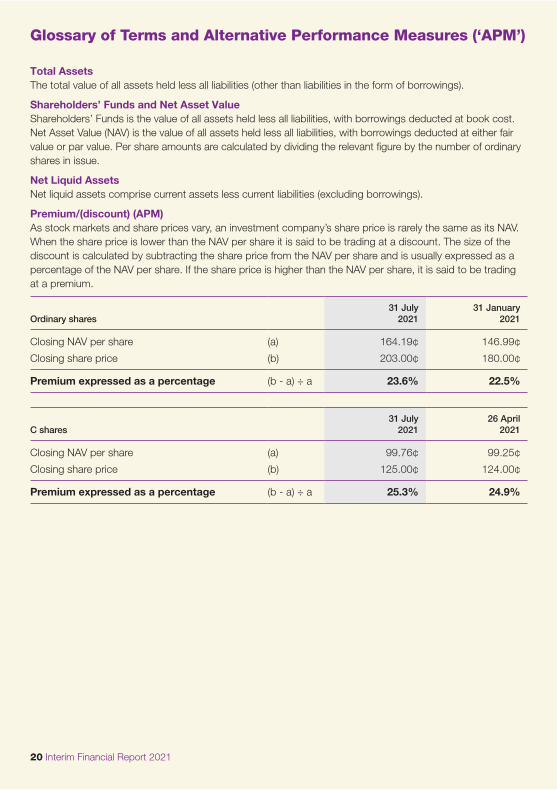
Premium/(discount) (APM)As stock markets and share prices vary, an investment company’s share price is rarely the same as its NAV. When the share price is lower than the NAV per share it is said to be trading at a discount. The size of the discount is calculated by subtracting the share price from the NAV per share and is usually expressed as a percentage of the NAV per share. If the share price is higher than the NAV per share, it is said to be trading at a premium.
Ordinary shares
31 July 2021
31 January 2021
Closing NAV per share (a) 164.19¢ 146.99¢
Closing share price (b) 203.00¢ 180.00¢
Premium expressed as a percentage (b - a) ÷ a 23.6% 22.5%
C shares
31 July 2021
26 April 2021
Closing NAV per share (a) 99.76¢ 99.25¢
Closing share price (b) 125.00¢ 124.00¢
Premium expressed as a percentage (b - a) ÷ a 25.3% 24.9%
Glossary of Terms and Alternative Performance Measures (‘APM’)

The Schiehallion Fund Limited 21
DirectorsMr David Chiswell and Mr Richard Holmes were appointed Directors of the Company on 2 September 2021.
Automatic Exchange of Information In order to fulfil its legal obligations under the Guernsey Common Reporting Standard Legislation relating to the Automatic Exchange of Information, the Company is required to collect and report certain information about certain shareholders.
The legislation will require investment companies to provide personal information to the Guernsey authorities on certain investors who purchase shares in investment funds. As an affected company, The Schiehallion Fund Limited will have to provide information annually to the local authority on the tax residencies of non-UK based certificated shareholders and corporate entities.
Other Shareholder Information
Foreign Account Tax Compliance ActPursuant to the reciprocal information sharing inter-governmental agreement entered into by the States of Guernsey and the US Treasury, and for the purposes of the US Foreign Account Tax Compliance Act (‘FATCA’) of the Company registered with the Internal Revenue Service (‘IRS’) as a Foreign Financial Institution (‘FFI’) and received a Global Intermediary Identification Number (R2NXXB.9999.SL.831). The Company can be located on the IRS FFI list.

Registrar Computershare Investor Services (Guernsey) LimitedFirst FloorTudor HouseLe BordageSt Peter Port GuernseyChannel IslandsGY1 1DB
Directors Chairperson: Dr Linda Yueh
John Mackie CBEDavid ChiswellTrudi ClarkRichard Holmes
Administrator, Secretary, Designated Manager and Registered OfficeAlter Domus (Guernsey) LimitedFirst FloorAlbert HouseSouth EsplanadeSt Peter Port GuernseyChannel IslandsGY1 1AJ
Investment Manager and Alternative Investment Fund ManagerBaillie Gifford & Co LimitedCalton Square1 Greenside RowEdinburghEH1 3AN
DepositaryThe Bank of New York Mellon (International) Limited 1 Canada SquareLondonE14 5AL
Corporate BrokerWinterflood Securities LimitedThe Atrium BuildingCannon Bridge House25 Dowgate HillLondonEC4R 2GA
Independent AuditorKPMG Channel Islands LimitedGlategny CourtGlategny EsplanadeSt Peter Port GuernseyChannel IslandsGY1 1WR
Company Detailsschiehallionfund.comCompany Registration No. 65915ISIN GG00BJ0CDD21Sedol BJ0CDD2Ticker MNTN
Legal Entity Identifier 213800NQOLJA1JCWXQ56