the royal bank of scotland group plc/media/files/r/rbs-ir/credit-ratings/...outlook the stable...
TRANSCRIPT
The Royal Bank of Scotland GroupPLC
Primary Credit Analyst:
Alexandre Birry, London (44) 20-7176-7108; [email protected]
Secondary Contact:
Dhruv Roy, London (44) 20-7176-6709; [email protected]
Table Of Contents
Major Rating Factors
Outlook
Rationale
Related Criteria And Research
WWW.STANDARDANDPOORS.COM/RATINGSDIRECT AUGUST 3, 2016 1
1686198 | 301308293

The Royal Bank of Scotland Group PLC
Major Rating Factors
Counterparty Credit Rating
BBB+/Stable/A-2
Strengths: Weaknesses:
• Strong position in U.K. commercial and corporate
banking and a leading position in U.K. retail banking.
• Funding and liquidity profiles compare well with
U.K. peers.
• Improving capitalization and asset quality.
• Long-running restructuring and execution risk in
completing the repositioning of the bank's business
model and performance, with possible headwinds
from weaker economic prospects following the
outcome of the EU referendum.
• Conduct and litigation charges likely to drag on
earnings prospects in 2016, and possibly beyond.
• The stock of nonperforming assets remains larger
than that of U.K. peers.
WWW.STANDARDANDPOORS.COM/RATINGSDIRECT AUGUST 3, 2016 2
1686198 | 301308293

Outlook
The stable outlook on The Royal Bank of Scotland Group PLC (RBSG) and its main subsidiaries balances a
potential increase in the economic risks that U.K. banks face--on the back of the outcome of the EU
referendum--against the group's improved capitalization and progress with its restructuring.
We could lower the ratings on non-operating holding company (NOHC) RBSG in the next 18-24 months if a
material increase in economic risks were to lead us to revise down the starting point for our ratings on U.K. banks
(the anchor), and if an improved assessment of capital and earnings did not offset this. This could occur, for
instance, if one-off charges--including those related to conduct and litigation--prevented the prospective RAC ratio
from sustainably exceeding 10%, and if increased economic risks or additional restructuring requirements were to
further delay the group's return to statutory profitability. We also note that any future organization of the group to
comply with U.K. ring-fencing regulations could change the creditworthiness of the group or individual group
entities.
We could raise the ratings if the outcome of the referendum doesn't lead to a material increase in systemwide risks,
and if we believe that RBS' RAC ratio will remain sustainably above our 10% threshold for a higher capital and
earnings assessment--even allowing for probable large conduct and litigation charges during 2016 and the possible
return to shareholder distributions at the outer edges of our two-year outlook horizon. For the operating
subsidiaries of the group, this is also based on the assumption that RBS' ALAC buffer will not fall materially below
our projections, even though the "excess" total adjusted capital (TAC) element of the ALAC would fall away under
a higher capital assessment.
The outlook on the main operating subsidiaries of RBSG mirrors that on RBSG. It also incorporates our expectation
that the bank will maintain an ALAC buffer in excess of 8.5%. At this time, we don't expect to remove the
one-notch negative adjustment that we incorporate in the issuer credit rating. This adjustment reflects our
expectation that RBS will remain a relative underperformer in terms of statutory profits in 2016 compared with
similarly rated peers and our view of its operating performance as less predictable than that of peers.
Rationale
Our ratings on RBS reflect the 'bbb+' anchor, which we then adjust for the following four bank-specific factors in order
to derive the 'bbb' unsupported GCP:
• An adequate business position that balances our view of the group's diversified U.K. banking franchise with its
extended and long-running restructuring program, including the underperformance and ongoing down-sizing of its
investment banking division.
• An adequate capital and earnings assessment, in spite of our projection of a RAC ratio somewhat above 10% in the
next 18-24 months, because we assume that RBS will remain loss-making on a statutory basis this year, and possibly
next.
• A moderate risk position assessment, reflecting our understanding of the group's substantial, but difficult to quantify,
WWW.STANDARDANDPOORS.COM/RATINGSDIRECT AUGUST 3, 2016 3
1686198 | 301308293
The Royal Bank of Scotland Group PLC

exposure to conduct and litigation-related risks, the complexity of RBS' restructuring, as well as the poor asset
quality track record.
• Average funding and adequate liquidity, in light of the bank's stable deposit franchise, manageable wholesale
funding reliance, and sound liquidity metrics.
We then adjust the 'bbb' unsupported GCP upward by two notches, reflecting our expectation of ALAC available to the
group. Finally, we make a one-notch negative adjustment to the ICR to reflect our view that RBS is a relative
underperformer versus similar banks, to arrive at the 'BBB+' ICR on the main operating entity of the group, The Royal
Bank of Scotland PLC. The 'BBB-' ICR on the non-operating holding company (NOHC), The Royal Bank of Scotland
Group PLC, reflects our standard one-notch negative adjustment from the 'bbb' unsupported GCP to reflect our view of
structural subordination, and that ALAC does not benefit holding company creditors.
Anchor: 'bbb+'
Our bank criteria use our Banking Industry Country Risk Assessment (BICRA) economic and industry risk scores to
determine a bank's anchor, the starting point in assigning an ICR. The anchor for banks operating primarily in the U.K.,
such as RBS, is 'bbb+'.
We see a negative trend for economic risk in the U.K. banking sector due to the growing risk of adverse economic
developments arising from the "leave" result in the June 2016 U.K. referendum on EU membership ('Brexit), which
may undermine the U.K.'s economic resilience. A downward revision of economic risk could materialize if: a significant
correction in asset prices becomes increasingly likely, with credit losses jumping to levels well above the 69 bps
long-term average, and closer to levels seen during the global financial crisis; or factors such as another referendum in
Scotland leading to Scottish independence, or sterling's loss of status as a reserve currency, result in significant further
institutional, financial, and economic uncertainty. We could also revise our view of economic risk if this trend
accelerates and if the uncertainty following the vote creates a weaker operating environment for banks, which are
confidence-sensitive institutions. We also believe there is now a risk of a contraction of housing prices and slowing
credit growth arising from the uncertainty generated by Brexit. Households' high share of property assets increases the
sensitivity of consumer demand to housing prices, and ultimately may put additional pressure on corporate returns
and eventually result in losses in the banking sector.
We view the industry risk trend as stable. The domestic reform agenda is well advanced and banks now have more
clarity on their future operating environment, although proposed changes at the international level regarding the use of
internal capital models represents a material additional capital requirement if implemented as proposed. The
ring-fencing of retail and SME deposits from 2019 may give rise to operational risk in implementation, but with the
rules now largely in place we believe that banks are well-placed to manage this risk. We assume that changes in
regulatory structures will support market discipline, constrain risk appetites, and yield adequate profitability. Downside
sensitivities to our industry risk assessment include the risk of delays in banks' restructuring plans and the subsequent
impact on the path to earning returns above the cost of capital. Our base-case scenario is that the capital and debt
markets volatility, which follows the Brexit vote, will not, over time, affect banks' access to, and cost of, wholesale
funding.
WWW.STANDARDANDPOORS.COM/RATINGSDIRECT AUGUST 3, 2016 4
1686198 | 301308293
The Royal Bank of Scotland Group PLC

Table 1
The Royal Bank of Scotland Group PLC Key Figures
--Year-ended Dec. 31--
(Mil. £) 2015 2014 2013 2012 2011
Adjusted assets 808,871.0 1,042,399.0 1,015,510.0 1,298,750.0 1,492,009.0
Customer loans (gross) 315,111.0 412,801.0 416,041.0 451,338.0 473,995.0
Adjusted common equity 39,297.0 19,085.0 15,076.0 23,198.0 25,500.0
Operating revenues 13,446.0 14,720.0 18,660.0 20,861.0 22,924.0
Noninterest expenses 8,522.0 9,885.0 13,665.0 14,097.0 16,026.0
Core earnings 5,628.0 4,278.0 (3,819.0) 1,016.0 (3,061.0)
N.A.--Not available. N/A--Not applicable. N.M.--Not meaningful.
Business position: Multi-year restructuring stretches out to 2019
We assess RBS' business position as adequate, which balances our view of its strong franchises in core markets with its
elongated restructuring and inability to report a statutory annual profit. We consider that RBS has strong franchises in
U.K. commercial and corporate banking; in particular it is the largest lender to U.K. small and midsize enterprises
(SMEs). It also has a leading position in U.K. retail banking and its total revenue streams are diverse.
Our business position assessment is generally compared with all banks in its home country. The other major providers
of universal banking services in the U.K. (Barclays PLC, HSBC Bank PLC, and Lloyds Banking Group PLC) are the
primary peers for RBS, along with retail focused Santander UK Group Holdings PLC and Nationwide Building Society.
We note that RBS is the only one of the top six U.K. lenders whose unsupported GCP is below the U.K.'s 'bbb+'
anchor.
We acknowledge that a more negative assessment might appear appropriate for RBS, given that it has reported an
attributable loss to ordinary shareholders for eight straight years. Moreover, we assume that RBS will report another
statutory loss in 2016 owing to our expectation of further litigation charges that might arise in the year, and
restructuring costs. However, we have a line of sight that RBS is becoming a smaller bank that is easier to manage than
in the recent past, with a predominant focus on U.K. retail and commercial banking, which ordinarily should produce
sound and predictable statutory earnings.
We note that RBS was supported by the U.K. government during the financial crisis; the U.K. government's equity
stake was marginally reduced in August 2015 to 72.6%, from around 78%, but no further progress has been made
owing to subsequent weakness in RBS' stock price as well as market conditions. We believe that the sell-down process,
once it eventually resumes and which the government has stated it is committed to doing, will take several years. On
balance we consider that the ongoing government ownership has a neutral impact on our assessment.
RBS announced in February 2015 an update to its 2013 restructuring plan, which stretches out to 2019. While we
consider this updated strategy, which includes an enhanced focus on its core U.K. retail and commercial banking
franchises, to be both plausible and sensible, our business position assessment assumes no major setbacks of note or a
further strategic shift.
To date, we believe that RBS is making useful progress in implementing its strategy. In particular, we believe that
WWW.STANDARDANDPOORS.COM/RATINGSDIRECT AUGUST 3, 2016 5
1686198 | 301308293
The Royal Bank of Scotland Group PLC
operating performance is sound, and will remain so, in its two largest divisions--U.K. Personal & Business Banking (UK
PBB) and Commercial Banking, which between them represented almost two-thirds of total income in 2015.
Conversely, we observe little evidence of a turnaround in performance at its investment banking division, Corporate &
Institutional Banking (CIB). In addition, progress in disposing of Williams & Glyn (W&G), which RBS is required to sell
by the end of 2017 as part of its agreed restructuring plan with the European Commission, is proving to be slow.
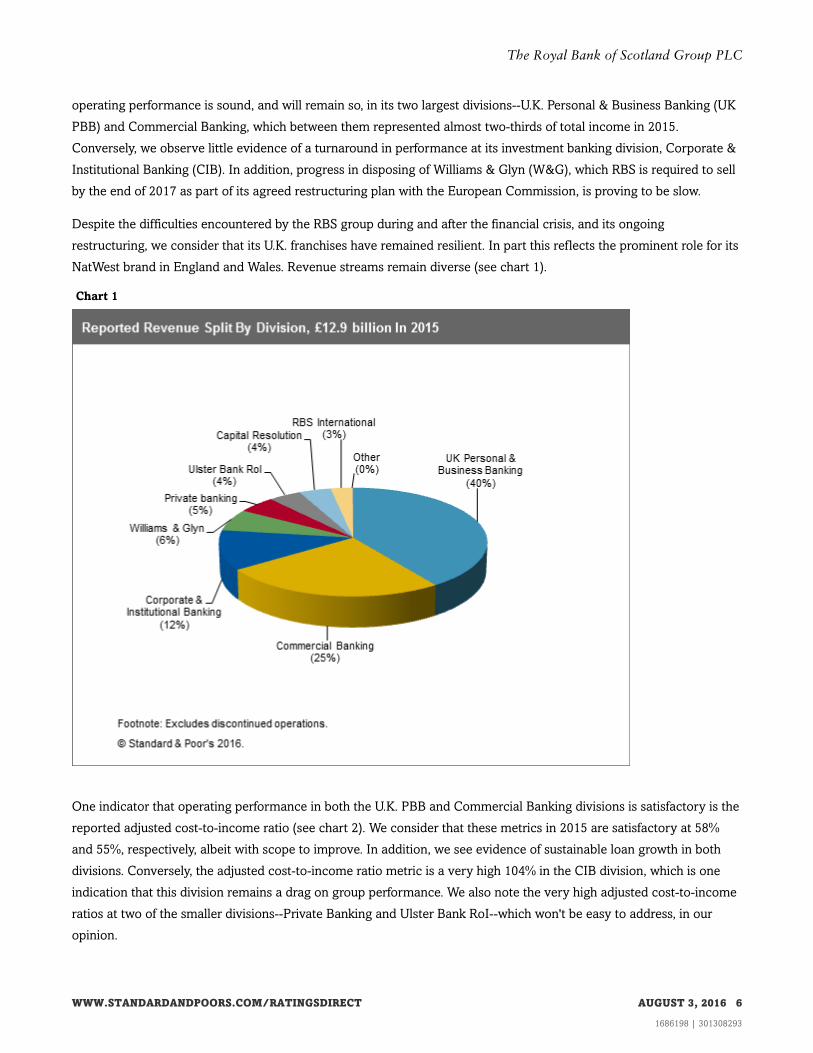
Despite the difficulties encountered by the RBS group during and after the financial crisis, and its ongoing
restructuring, we consider that its U.K. franchises have remained resilient. In part this reflects the prominent role for its
NatWest brand in England and Wales. Revenue streams remain diverse (see chart 1).
Chart 1
One indicator that operating performance in both the U.K. PBB and Commercial Banking divisions is satisfactory is the
reported adjusted cost-to-income ratio (see chart 2). We consider that these metrics in 2015 are satisfactory at 58%
and 55%, respectively, albeit with scope to improve. In addition, we see evidence of sustainable loan growth in both
divisions. Conversely, the adjusted cost-to-income ratio metric is a very high 104% in the CIB division, which is one
indication that this division remains a drag on group performance. We also note the very high adjusted cost-to-income
ratios at two of the smaller divisions--Private Banking and Ulster Bank RoI--which won't be easy to address, in our
opinion.
WWW.STANDARDANDPOORS.COM/RATINGSDIRECT AUGUST 3, 2016 6
1686198 | 301308293
The Royal Bank of Scotland Group PLC
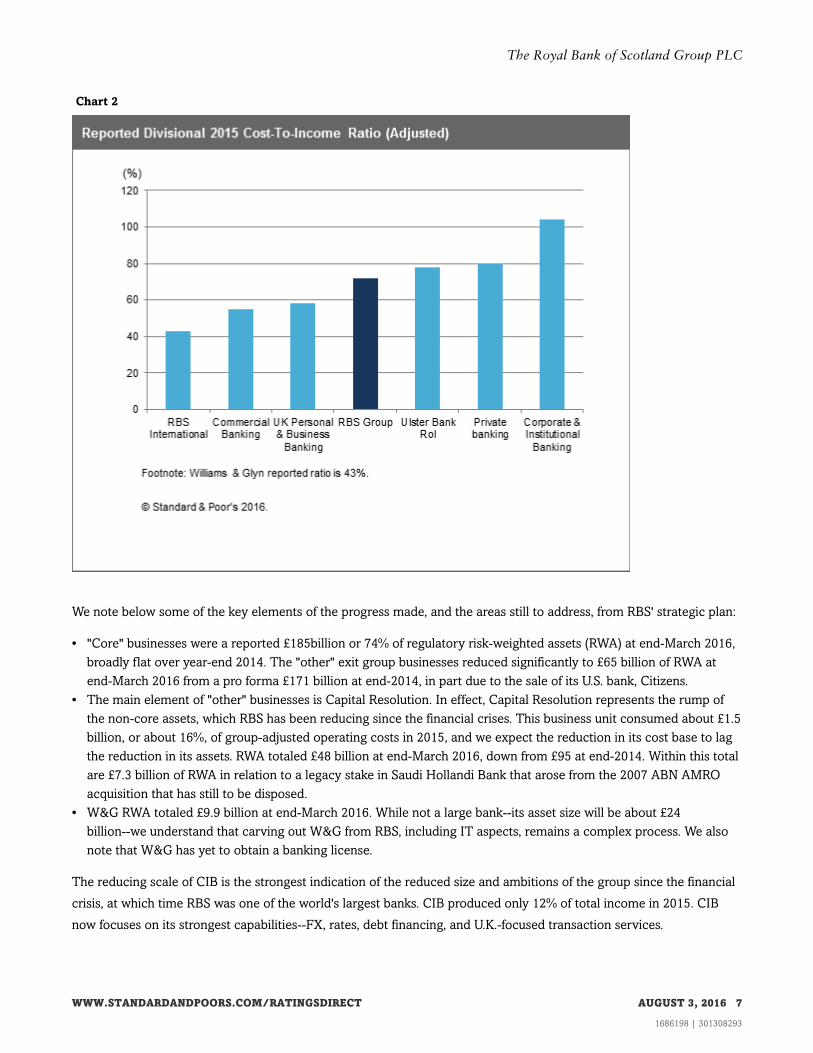
Chart 2
We note below some of the key elements of the progress made, and the areas still to address, from RBS' strategic plan:
• "Core" businesses were a reported £185billion or 74% of regulatory risk-weighted assets (RWA) at end-March 2016,
broadly flat over year-end 2014. The "other" exit group businesses reduced significantly to £65 billion of RWA at
end-March 2016 from a pro forma £171 billion at end-2014, in part due to the sale of its U.S. bank, Citizens.
• The main element of "other" businesses is Capital Resolution. In effect, Capital Resolution represents the rump of
the non-core assets, which RBS has been reducing since the financial crises. This business unit consumed about £1.5
billion, or about 16%, of group-adjusted operating costs in 2015, and we expect the reduction in its cost base to lag
the reduction in its assets. RWA totaled £48 billion at end-March 2016, down from £95 at end-2014. Within this total
are £7.3 billion of RWA in relation to a legacy stake in Saudi Hollandi Bank that arose from the 2007 ABN AMRO
acquisition that has still to be disposed.
• W&G RWA totaled £9.9 billion at end-March 2016. While not a large bank--its asset size will be about £24
billion--we understand that carving out W&G from RBS, including IT aspects, remains a complex process. We also
note that W&G has yet to obtain a banking license.
The reducing scale of CIB is the strongest indication of the reduced size and ambitions of the group since the financial
crisis, at which time RBS was one of the world's largest banks. CIB produced only 12% of total income in 2015. CIB
now focuses on its strongest capabilities--FX, rates, debt financing, and U.K.-focused transaction services.
WWW.STANDARDANDPOORS.COM/RATINGSDIRECT AUGUST 3, 2016 7
1686198 | 301308293
The Royal Bank of Scotland Group PLC
Our business position assessment benefits from our view of the capability of the RBS management team. RBS has a
strong track record demonstrating that it can deleverage successfully, and while the remaining tasks remain
substantial, we consider that the "endgame" may now be in sight. Moreover, in addition to the improved operating
performance and business activity at the two largest divisions there is early evidence that the enhanced management
focus on customer service, and other similar metrics, will bear fruit. This shift in management culture is timely, not
only because it acknowledges that parts of RBS have been lagging peers in this respect, but that the U.K. banking
industry is undergoing fundamental change.
Finally, like other large U.K. banking groups, RBS is required to implement ring-fencing by Jan. 1, 2019. RBS has stated
that its target organizational structure is similar to its current division structure and that about 80% of current core
RWAs are expected to be committed to the ring-fenced bank.
Capital and earnings: RAC ratio has improved, but uncertainties persist
We view RBS' capital and earnings as adequate and we project its RAC ratio will be somewhat in excess of 10% in the
next 18-24 months. We calculate this ratio to have been 11.7% as of Dec. 31, 2015, up from 9.4% a year before. The
increase was partly due to the benefits from selling Citizens. Notwithstanding the progress that RBS has made in
deleveraging, projecting a RAC ratio remains more difficult for RBS than most peers. This is because its substantial
restructuring remains incomplete and because relatively high uncertainty persists in relation to its conduct and
litigation charges, still undermining the prospective quality of earnings for the group. As a result, we maintain an
adequate assessment despite the current and projected RAC ratio implying a potentially strong assessment.
RBS reported an attributable loss of £1.2 billion in 2015. Key drivers of the weak performance were conduct and
litigation charges of £3.6 billion and restructuring costs of £2.9 billion. Performance was helped by an impairment
release of £727 million.
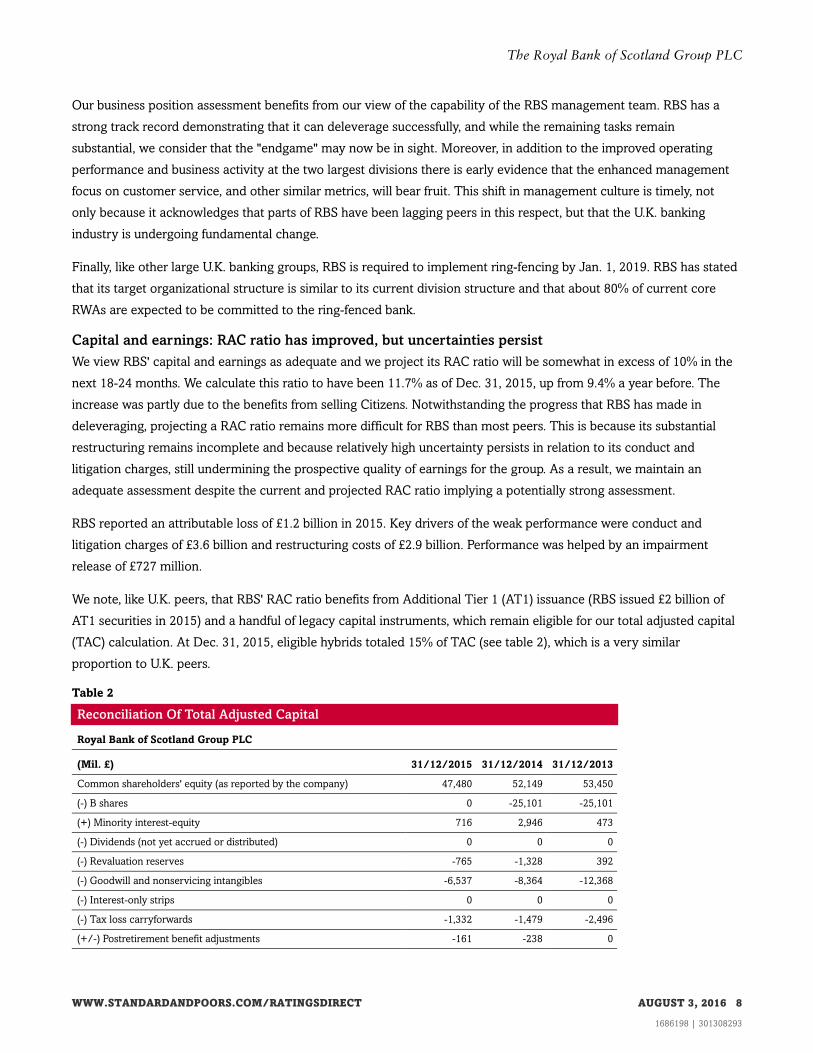
We note, like U.K. peers, that RBS' RAC ratio benefits from Additional Tier 1 (AT1) issuance (RBS issued £2 billion of
AT1 securities in 2015) and a handful of legacy capital instruments, which remain eligible for our total adjusted capital
(TAC) calculation. At Dec. 31, 2015, eligible hybrids totaled 15% of TAC (see table 2), which is a very similar
proportion to U.K. peers.
Table 2
Reconciliation Of Total Adjusted Capital
Royal Bank of Scotland Group PLC
(Mil. £) 31/12/2015 31/12/2014 31/12/2013
Common shareholders' equity (as reported by the company) 47,480 52,149 53,450
(-) B shares 0 -25,101 -25,101
(+) Minority interest-equity 716 2,946 473
(-) Dividends (not yet accrued or distributed) 0 0 0
(-) Revaluation reserves -765 -1,328 392
(-) Goodwill and nonservicing intangibles -6,537 -8,364 -12,368
(-) Interest-only strips 0 0 0
(-) Tax loss carryforwards -1,332 -1,479 -2,496
(+/-) Postretirement benefit adjustments -161 -238 0
WWW.STANDARDANDPOORS.COM/RATINGSDIRECT AUGUST 3, 2016 8
1686198 | 301308293
The Royal Bank of Scotland Group PLC
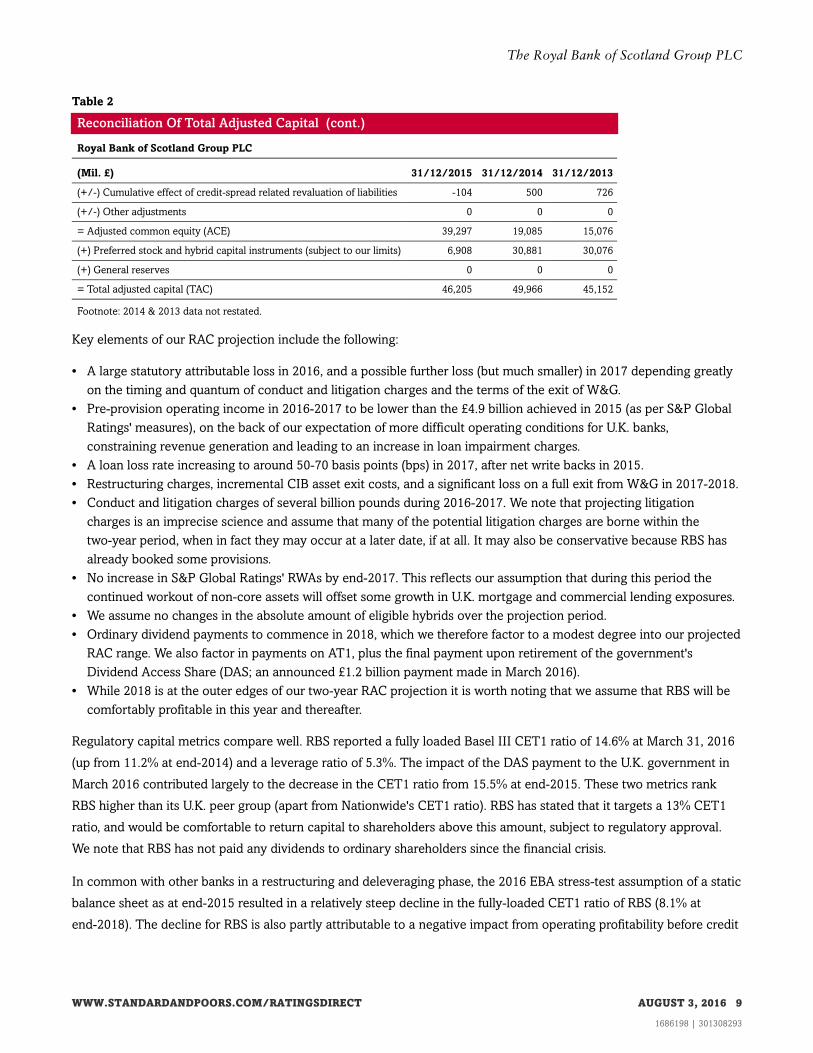
Table 2
Reconciliation Of Total Adjusted Capital (cont.)
Royal Bank of Scotland Group PLC
(Mil. £) 31/12/2015 31/12/2014 31/12/2013
(+/-) Cumulative effect of credit-spread related revaluation of liabilities -104 500 726
(+/-) Other adjustments 0 0 0
= Adjusted common equity (ACE) 39,297 19,085 15,076
(+) Preferred stock and hybrid capital instruments (subject to our limits) 6,908 30,881 30,076
(+) General reserves 0 0 0
= Total adjusted capital (TAC) 46,205 49,966 45,152
Footnote: 2014 & 2013 data not restated.
Key elements of our RAC projection include the following:
• A large statutory attributable loss in 2016, and a possible further loss (but much smaller) in 2017 depending greatly
on the timing and quantum of conduct and litigation charges and the terms of the exit of W&G.
• Pre-provision operating income in 2016-2017 to be lower than the £4.9 billion achieved in 2015 (as per S&P Global
Ratings' measures), on the back of our expectation of more difficult operating conditions for U.K. banks,
constraining revenue generation and leading to an increase in loan impairment charges.
• A loan loss rate increasing to around 50-70 basis points (bps) in 2017, after net write backs in 2015.
• Restructuring charges, incremental CIB asset exit costs, and a significant loss on a full exit from W&G in 2017-2018.
• Conduct and litigation charges of several billion pounds during 2016-2017. We note that projecting litigation
charges is an imprecise science and assume that many of the potential litigation charges are borne within the
two-year period, when in fact they may occur at a later date, if at all. It may also be conservative because RBS has
already booked some provisions.
• No increase in S&P Global Ratings' RWAs by end-2017. This reflects our assumption that during this period the
continued workout of non-core assets will offset some growth in U.K. mortgage and commercial lending exposures.
• We assume no changes in the absolute amount of eligible hybrids over the projection period.
• Ordinary dividend payments to commence in 2018, which we therefore factor to a modest degree into our projected
RAC range. We also factor in payments on AT1, plus the final payment upon retirement of the government's
Dividend Access Share (DAS; an announced £1.2 billion payment made in March 2016).
• While 2018 is at the outer edges of our two-year RAC projection it is worth noting that we assume that RBS will be
comfortably profitable in this year and thereafter.
Regulatory capital metrics compare well. RBS reported a fully loaded Basel III CET1 ratio of 14.6% at March 31, 2016
(up from 11.2% at end-2014) and a leverage ratio of 5.3%. The impact of the DAS payment to the U.K. government in
March 2016 contributed largely to the decrease in the CET1 ratio from 15.5% at end-2015. These two metrics rank
RBS higher than its U.K. peer group (apart from Nationwide's CET1 ratio). RBS has stated that it targets a 13% CET1
ratio, and would be comfortable to return capital to shareholders above this amount, subject to regulatory approval.
We note that RBS has not paid any dividends to ordinary shareholders since the financial crisis.
In common with other banks in a restructuring and deleveraging phase, the 2016 EBA stress-test assumption of a static
balance sheet as at end-2015 resulted in a relatively steep decline in the fully-loaded CET1 ratio of RBS (8.1% at
end-2018). The decline for RBS is also partly attributable to a negative impact from operating profitability before credit
WWW.STANDARDANDPOORS.COM/RATINGSDIRECT AUGUST 3, 2016 9
1686198 | 301308293
The Royal Bank of Scotland Group PLC

risk and market risk losses due--we believe--to operational risk (conduct risk) and other exceptional charges linked to
its complex restructuring. These are already reflected in our assessment of RBS' risk position.
Table 3
Royal Bank of Scotland Group PLC (The) RACF [Risk-Adjusted Capital Framework] Data
(Mil. £) Exposure*
Basel III
RWA
Average Basel
III RW (%)
Standard &
Poor's RWA
Average Standard &
Poor's RW (%)
Credit risk
Government and central banks 142,255 4,566 3 5,064 4
Institutions 27,797 12,259 44 6,966 25
Corporate 205,328 113,846 55 186,355 91
Retail 193,650 43,182 22 103,244 53
Of which mortgage 150,932 25,358 17 58,259 39
Securitization§ 10,242 3,413 33 7,377 72
Other assets 10,460 8,428 81 13,571 130
Total credit risk 589,732 185,694 31 322,578 55
Market risk
Equity in the banking book† 1,718 4,082 238 1,731 101
Trading book market risk -- 21,255 -- 31,579 --
Total market risk -- 25,336 -- 33,310 --
Insurance risk
Total insurance risk -- -- -- 0 --
Operational risk
Total operational risk -- 31,597 -- 37,796 --
(Mil. £)
Basel II
RWA
Standard &
Poor's RWA
% of Standard &
Poor's RWA
Diversification adjustments
RWA before diversification 242,628 393,684 100
Total Diversification/Concentration
Adjustments
-- (72,865) (19)
RWA after diversification 242,628 320,820 81
(Mil. £)
Tier 1
capital Tier 1 ratio (%)
Total adjusted
capital
Standard & Poor's
RAC ratio (%)
Capital ratio
Capital ratio before adjustments 39,600 16.3 46,205 11.7
Capital ratio after adjustments‡ 39,600 16.3 46,205 14.4
*Exposure at default. §Securitisation Exposure includes the securitisation tranches deducted from capital in the regulatory framework. †Exposure
and Standard & Poor's risk-weighted assets for equity in the banking book include minority equity holdings in financial institutions. ‡Adjustments
to Tier 1 ratio are additional regulatory requirements (e.g. transitional floor or Pillar 2 add-ons). RWA--Risk-weighted assets. RW--Risk weight.
RAC--Risk-adjusted capital. Sources: Company data as of Dec. 31, 2015, Standard & Poor's.
WWW.STANDARDANDPOORS.COM/RATINGSDIRECT AUGUST 3, 2016 10
1686198 | 301308293
The Royal Bank of Scotland Group PLC
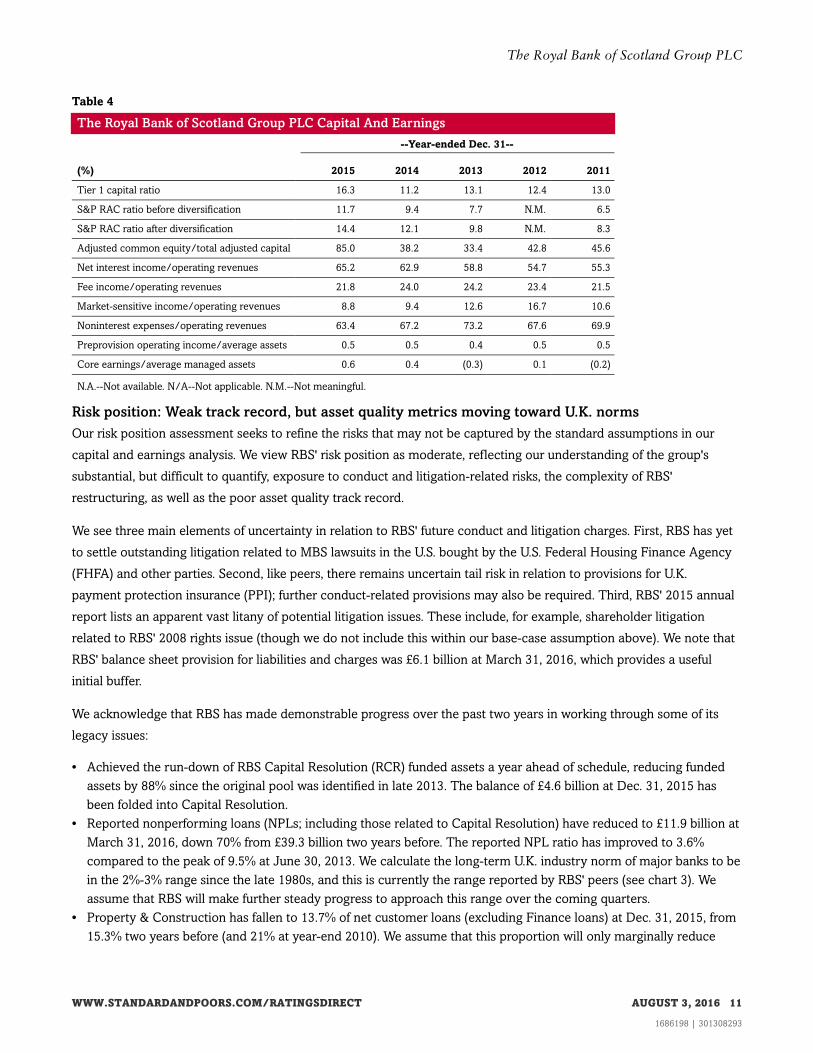
Table 4
The Royal Bank of Scotland Group PLC Capital And Earnings
--Year-ended Dec. 31--
(%) 2015 2014 2013 2012 2011
Tier 1 capital ratio 16.3 11.2 13.1 12.4 13.0
S&P RAC ratio before diversification 11.7 9.4 7.7 N.M. 6.5
S&P RAC ratio after diversification 14.4 12.1 9.8 N.M. 8.3
Adjusted common equity/total adjusted capital 85.0 38.2 33.4 42.8 45.6
Net interest income/operating revenues 65.2 62.9 58.8 54.7 55.3
Fee income/operating revenues 21.8 24.0 24.2 23.4 21.5
Market-sensitive income/operating revenues 8.8 9.4 12.6 16.7 10.6
Noninterest expenses/operating revenues 63.4 67.2 73.2 67.6 69.9
Preprovision operating income/average assets 0.5 0.5 0.4 0.5 0.5
Core earnings/average managed assets 0.6 0.4 (0.3) 0.1 (0.2)
N.A.--Not available. N/A--Not applicable. N.M.--Not meaningful.
Risk position: Weak track record, but asset quality metrics moving toward U.K. norms
Our risk position assessment seeks to refine the risks that may not be captured by the standard assumptions in our
capital and earnings analysis. We view RBS' risk position as moderate, reflecting our understanding of the group's
substantial, but difficult to quantify, exposure to conduct and litigation-related risks, the complexity of RBS'
restructuring, as well as the poor asset quality track record.
We see three main elements of uncertainty in relation to RBS' future conduct and litigation charges. First, RBS has yet
to settle outstanding litigation related to MBS lawsuits in the U.S. bought by the U.S. Federal Housing Finance Agency
(FHFA) and other parties. Second, like peers, there remains uncertain tail risk in relation to provisions for U.K.
payment protection insurance (PPI); further conduct-related provisions may also be required. Third, RBS' 2015 annual
report lists an apparent vast litany of potential litigation issues. These include, for example, shareholder litigation
related to RBS' 2008 rights issue (though we do not include this within our base-case assumption above). We note that
RBS' balance sheet provision for liabilities and charges was £6.1 billion at March 31, 2016, which provides a useful
initial buffer.
We acknowledge that RBS has made demonstrable progress over the past two years in working through some of its
legacy issues:
• Achieved the run-down of RBS Capital Resolution (RCR) funded assets a year ahead of schedule, reducing funded
assets by 88% since the original pool was identified in late 2013. The balance of £4.6 billion at Dec. 31, 2015 has
been folded into Capital Resolution.
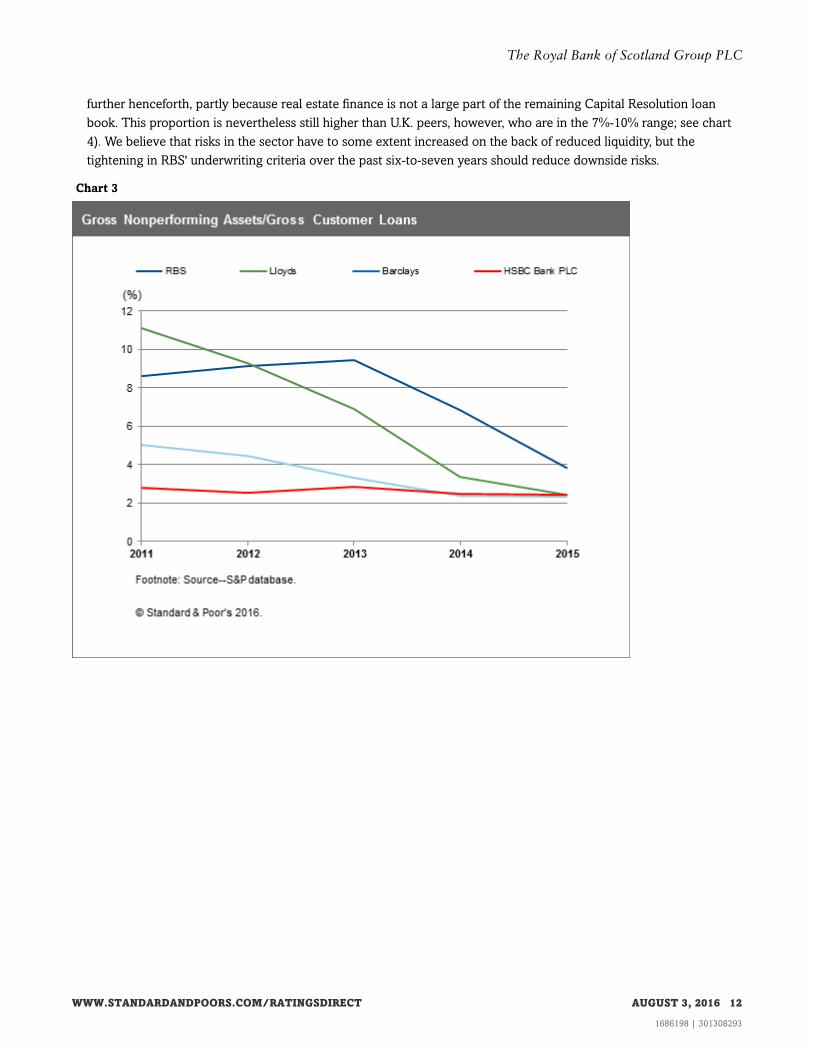
• Reported nonperforming loans (NPLs; including those related to Capital Resolution) have reduced to £11.9 billion at
March 31, 2016, down 70% from £39.3 billion two years before. The reported NPL ratio has improved to 3.6%
compared to the peak of 9.5% at June 30, 2013. We calculate the long-term U.K. industry norm of major banks to be
in the 2%-3% range since the late 1980s, and this is currently the range reported by RBS' peers (see chart 3). We
assume that RBS will make further steady progress to approach this range over the coming quarters.
• Property & Construction has fallen to 13.7% of net customer loans (excluding Finance loans) at Dec. 31, 2015, from
15.3% two years before (and 21% at year-end 2010). We assume that this proportion will only marginally reduce
WWW.STANDARDANDPOORS.COM/RATINGSDIRECT AUGUST 3, 2016 11
1686198 | 301308293
The Royal Bank of Scotland Group PLC
further henceforth, partly because real estate finance is not a large part of the remaining Capital Resolution loan
book. This proportion is nevertheless still higher than U.K. peers, however, who are in the 7%-10% range; see chart
4). We believe that risks in the sector have to some extent increased on the back of reduced liquidity, but the
tightening in RBS' underwriting criteria over the past six-to-seven years should reduce downside risks.
Chart 3
WWW.STANDARDANDPOORS.COM/RATINGSDIRECT AUGUST 3, 2016 12
1686198 | 301308293
The Royal Bank of Scotland Group PLC
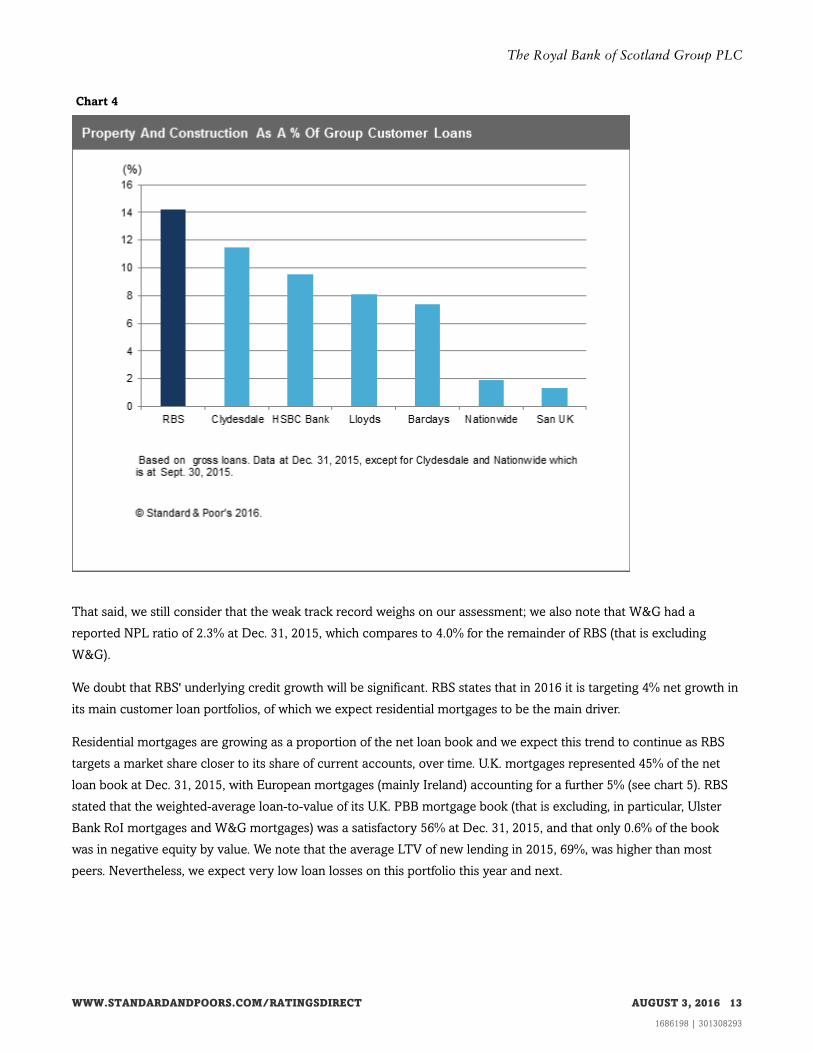
Chart 4
That said, we still consider that the weak track record weighs on our assessment; we also note that W&G had a
reported NPL ratio of 2.3% at Dec. 31, 2015, which compares to 4.0% for the remainder of RBS (that is excluding
W&G).
We doubt that RBS' underlying credit growth will be significant. RBS states that in 2016 it is targeting 4% net growth in
its main customer loan portfolios, of which we expect residential mortgages to be the main driver.
Residential mortgages are growing as a proportion of the net loan book and we expect this trend to continue as RBS
targets a market share closer to its share of current accounts, over time. U.K. mortgages represented 45% of the net
loan book at Dec. 31, 2015, with European mortgages (mainly Ireland) accounting for a further 5% (see chart 5). RBS
stated that the weighted-average loan-to-value of its U.K. PBB mortgage book (that is excluding, in particular, Ulster
Bank RoI mortgages and W&G mortgages) was a satisfactory 56% at Dec. 31, 2015, and that only 0.6% of the book
was in negative equity by value. We note that the average LTV of new lending in 2015, 69%, was higher than most
peers. Nevertheless, we expect very low loan losses on this portfolio this year and next.
WWW.STANDARDANDPOORS.COM/RATINGSDIRECT AUGUST 3, 2016 13
1686198 | 301308293
The Royal Bank of Scotland Group PLC
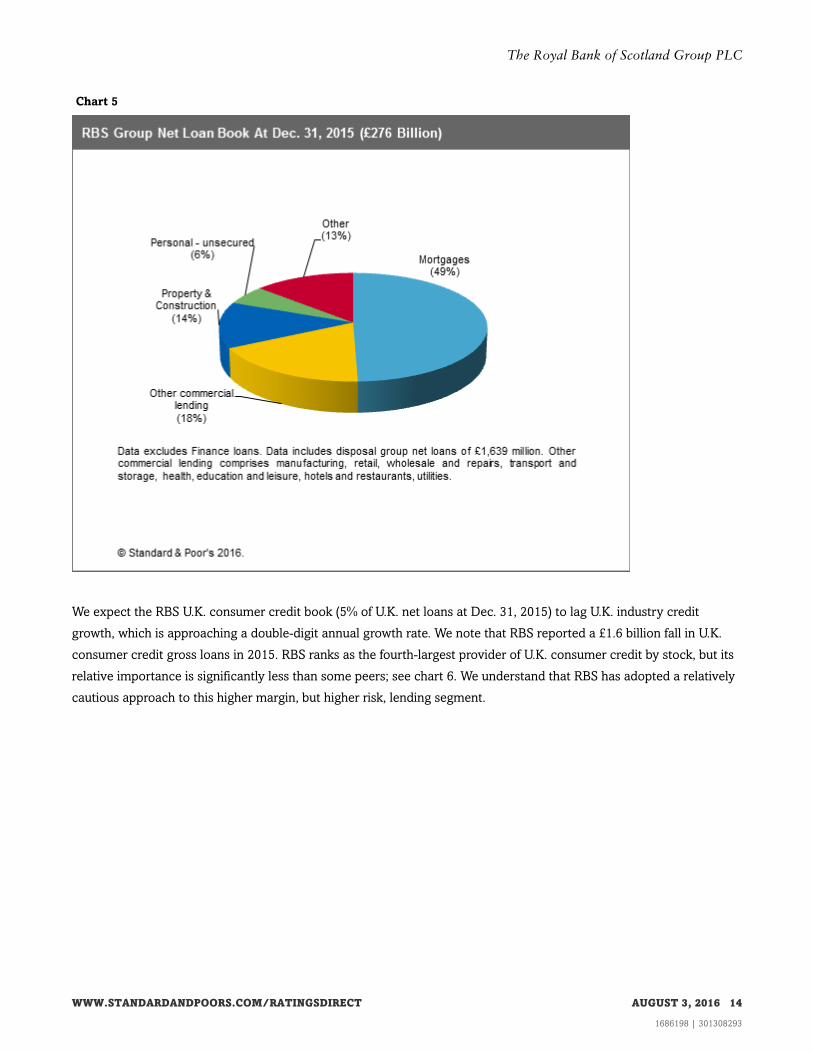
Chart 5
We expect the RBS U.K. consumer credit book (5% of U.K. net loans at Dec. 31, 2015) to lag U.K. industry credit
growth, which is approaching a double-digit annual growth rate. We note that RBS reported a £1.6 billion fall in U.K.
consumer credit gross loans in 2015. RBS ranks as the fourth-largest provider of U.K. consumer credit by stock, but its
relative importance is significantly less than some peers; see chart 6. We understand that RBS has adopted a relatively
cautious approach to this higher margin, but higher risk, lending segment.
WWW.STANDARDANDPOORS.COM/RATINGSDIRECT AUGUST 3, 2016 14
1686198 | 301308293
The Royal Bank of Scotland Group PLC
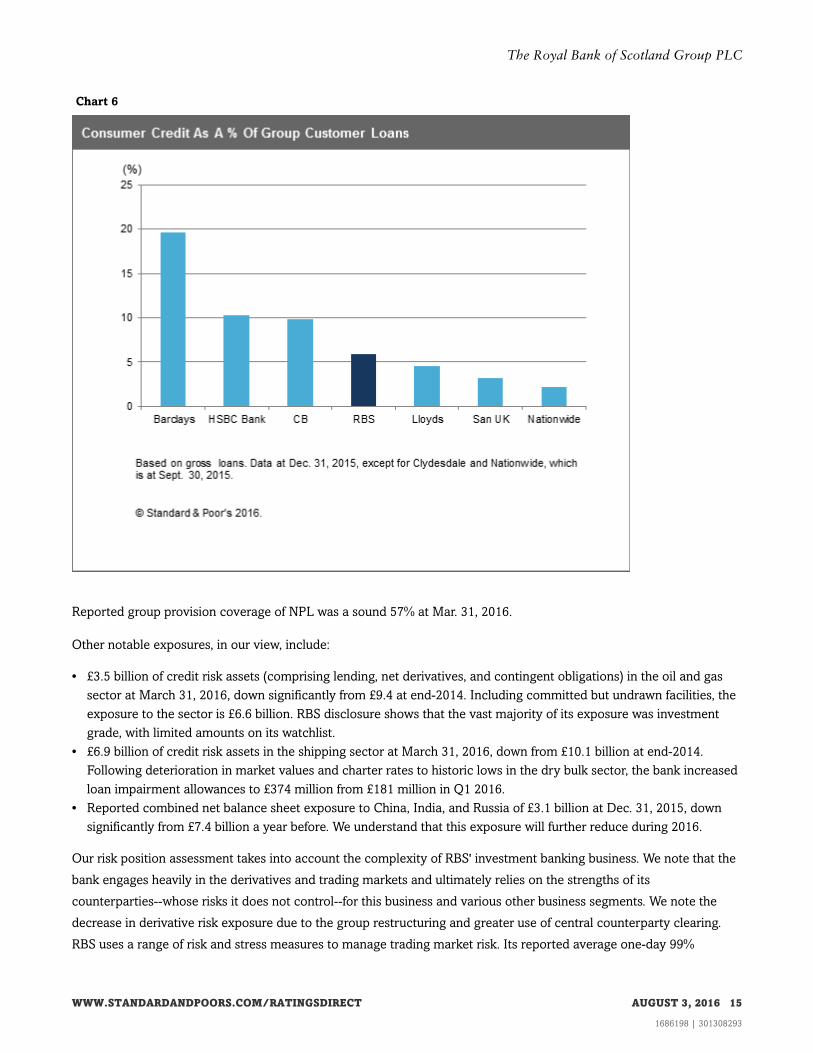
Chart 6
Reported group provision coverage of NPL was a sound 57% at Mar. 31, 2016.
Other notable exposures, in our view, include:
• £3.5 billion of credit risk assets (comprising lending, net derivatives, and contingent obligations) in the oil and gas
sector at March 31, 2016, down significantly from £9.4 at end-2014. Including committed but undrawn facilities, the
exposure to the sector is £6.6 billion. RBS disclosure shows that the vast majority of its exposure was investment
grade, with limited amounts on its watchlist.
• £6.9 billion of credit risk assets in the shipping sector at March 31, 2016, down from £10.1 billion at end-2014.
Following deterioration in market values and charter rates to historic lows in the dry bulk sector, the bank increased
loan impairment allowances to £374 million from £181 million in Q1 2016.
• Reported combined net balance sheet exposure to China, India, and Russia of £3.1 billion at Dec. 31, 2015, down
significantly from £7.4 billion a year before. We understand that this exposure will further reduce during 2016.
Our risk position assessment takes into account the complexity of RBS' investment banking business. We note that the
bank engages heavily in the derivatives and trading markets and ultimately relies on the strengths of its
counterparties--whose risks it does not control--for this business and various other business segments. We note the
decrease in derivative risk exposure due to the group restructuring and greater use of central counterparty clearing.
RBS uses a range of risk and stress measures to manage trading market risk. Its reported average one-day 99%
WWW.STANDARDANDPOORS.COM/RATINGSDIRECT AUGUST 3, 2016 15
1686198 | 301308293
The Royal Bank of Scotland Group PLC
value-at-risk was £18.9 million in 2015, down from £27.8 million in 2014 and £79.3 million in 2013. Other indicators
also showed a lower risk appetite.
The fairly high 19% RAC diversification benefit demonstrates the spread of RBS' activities by business line and risk
type. The RACF does not capture the non-trading market risk of its large defined-benefit pension fund exposure. The
fair value of post-retirement scheme assets was £34.7 billion at year-end 2015, of which quoted equities represented a
relatively modest 21%. The banks made a payment of £4.2 billion to the pension scheme in early 2016, as an
accelerated payment of existing committed future contributions.
Table 5
The Royal Bank of Scotland Group PLC Risk Position
--Year-ended Dec. 31--
(%) 2015 2014 2013 2012 2011
Growth in customer loans (23.7) (0.8) (7.8) (4.8) (9.0)
Total diversification adjustment / S&P RWA before diversification (18.5) (22.2) (21.2) N.M. (22.2)
Total managed assets/adjusted common equity (x) 20.7 55.1 68.2 56.6 59.1
New loan loss provisions/average customer loans (0.2) (0.3) 1.9 1.1 1.8
Net charge-offs/average customer loans 2.4 1.2 0.9 0.8 0.8
Gross nonperforming assets/customer loans + other real estate owned 3.9 6.8 9.5 9.1 8.6
Loan loss reserves/gross nonperforming assets 58.7 63.9 64.1 51.7 48.7
N.A.--Not available. N/A--Not applicable. N.M.--Not meaningful.
Funding and liquidity: Stable deposit franchise and good metrics
We regard RBS' funding as average and its liquidity position as adequate.
Customer deposits have demonstrated stability despite RBS' ongoing losses. Indeed, with a reported loan-to-deposit
ratio of 89% at Dec. 31, 2015, RBS ranks more favorably than most U.K. peers in this respect (see chart 7; the median
for the top-20 domestic U.K. banks, by revenues, is 105%). We expect RBS' strong and granular deposit base to remain
the cornerstone of its funding position, noting that deposits comfortably exceed loans in both its U.K. PBB and its
Commercial Banking divisions. The group has stated that it targets a loan-to-deposit metric around the 100% mark, but
we assume that this transition will be slow (and will be barely affected by the W&G exit).
WWW.STANDARDANDPOORS.COM/RATINGSDIRECT AUGUST 3, 2016 16
1686198 | 301308293
The Royal Bank of Scotland Group PLC
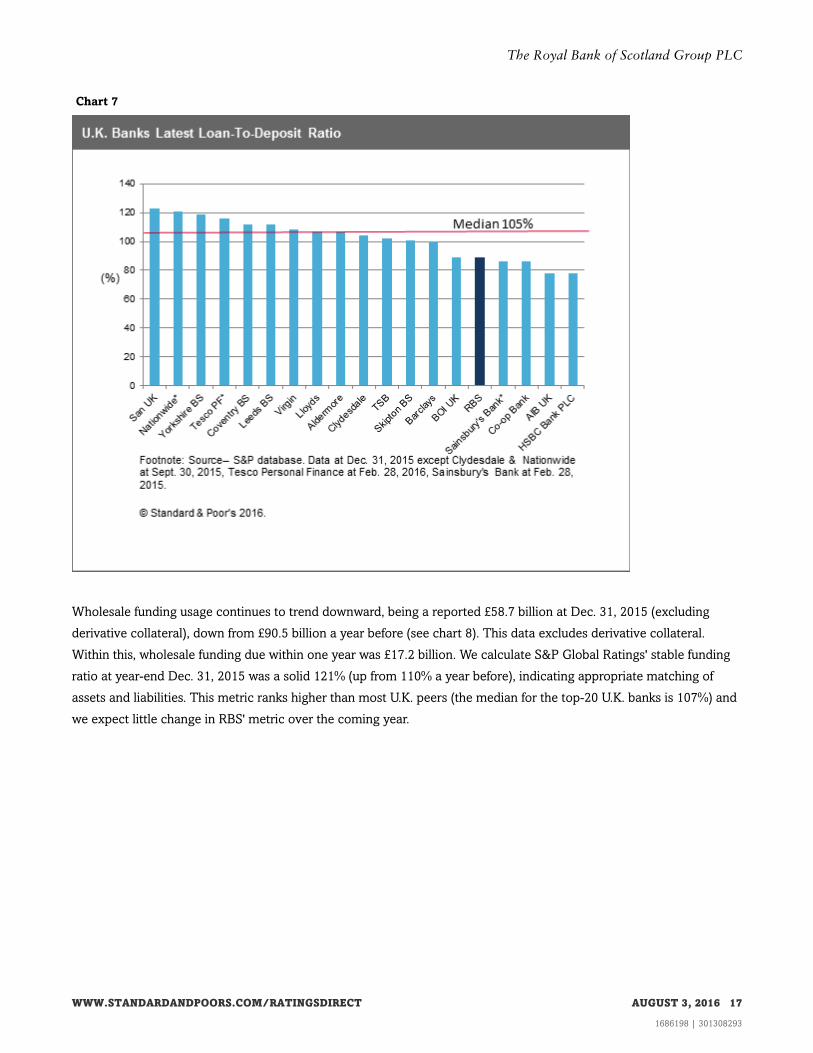
Chart 7
Wholesale funding usage continues to trend downward, being a reported £58.7 billion at Dec. 31, 2015 (excluding
derivative collateral), down from £90.5 billion a year before (see chart 8). This data excludes derivative collateral.
Within this, wholesale funding due within one year was £17.2 billion. We calculate S&P Global Ratings' stable funding
ratio at year-end Dec. 31, 2015 was a solid 121% (up from 110% a year before), indicating appropriate matching of
assets and liabilities. This metric ranks higher than most U.K. peers (the median for the top-20 U.K. banks is 107%) and
we expect little change in RBS' metric over the coming year.
WWW.STANDARDANDPOORS.COM/RATINGSDIRECT AUGUST 3, 2016 17
1686198 | 301308293
The Royal Bank of Scotland Group PLC
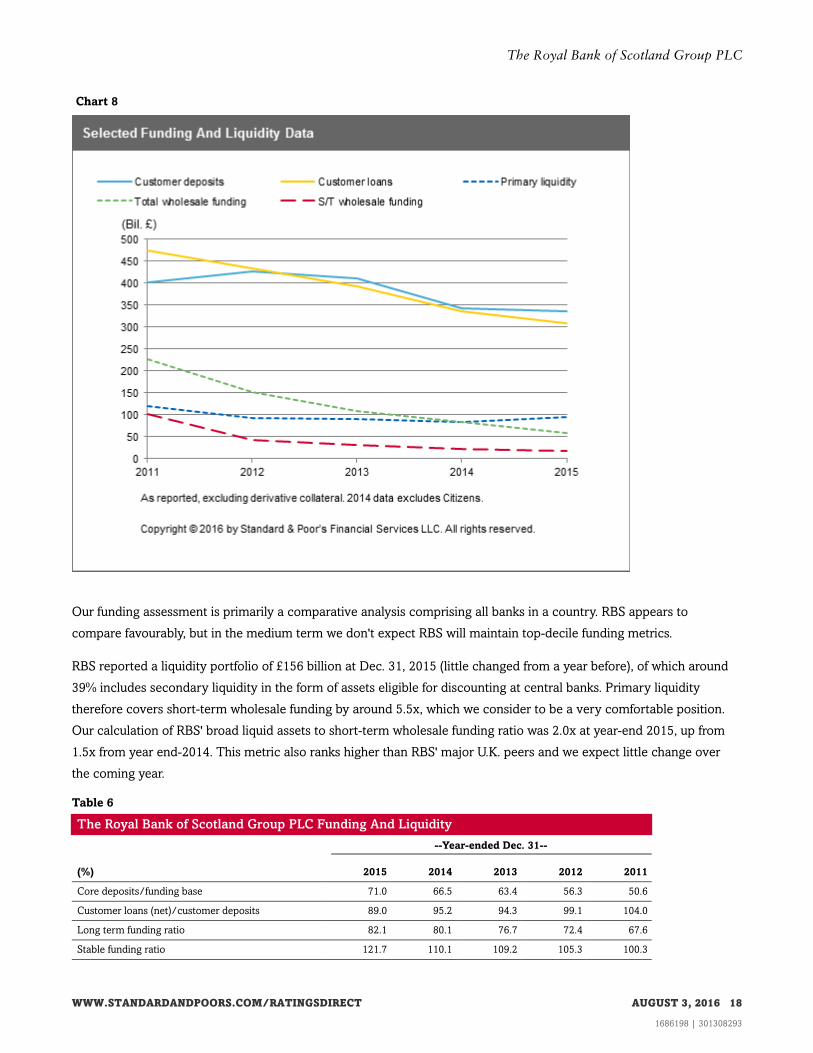
Chart 8
Our funding assessment is primarily a comparative analysis comprising all banks in a country. RBS appears to
compare favourably, but in the medium term we don't expect RBS will maintain top-decile funding metrics.
RBS reported a liquidity portfolio of £156 billion at Dec. 31, 2015 (little changed from a year before), of which around
39% includes secondary liquidity in the form of assets eligible for discounting at central banks. Primary liquidity
therefore covers short-term wholesale funding by around 5.5x, which we consider to be a very comfortable position.
Our calculation of RBS' broad liquid assets to short-term wholesale funding ratio was 2.0x at year-end 2015, up from
1.5x from year end-2014. This metric also ranks higher than RBS' major U.K. peers and we expect little change over
the coming year.
Table 6
The Royal Bank of Scotland Group PLC Funding And Liquidity
--Year-ended Dec. 31--
(%) 2015 2014 2013 2012 2011
Core deposits/funding base 71.0 66.5 63.4 56.3 50.6
Customer loans (net)/customer deposits 89.0 95.2 94.3 99.1 104.0
Long term funding ratio 82.1 80.1 76.7 72.4 67.6
Stable funding ratio 121.7 110.1 109.2 105.3 100.3
WWW.STANDARDANDPOORS.COM/RATINGSDIRECT AUGUST 3, 2016 18
1686198 | 301308293
The Royal Bank of Scotland Group PLC
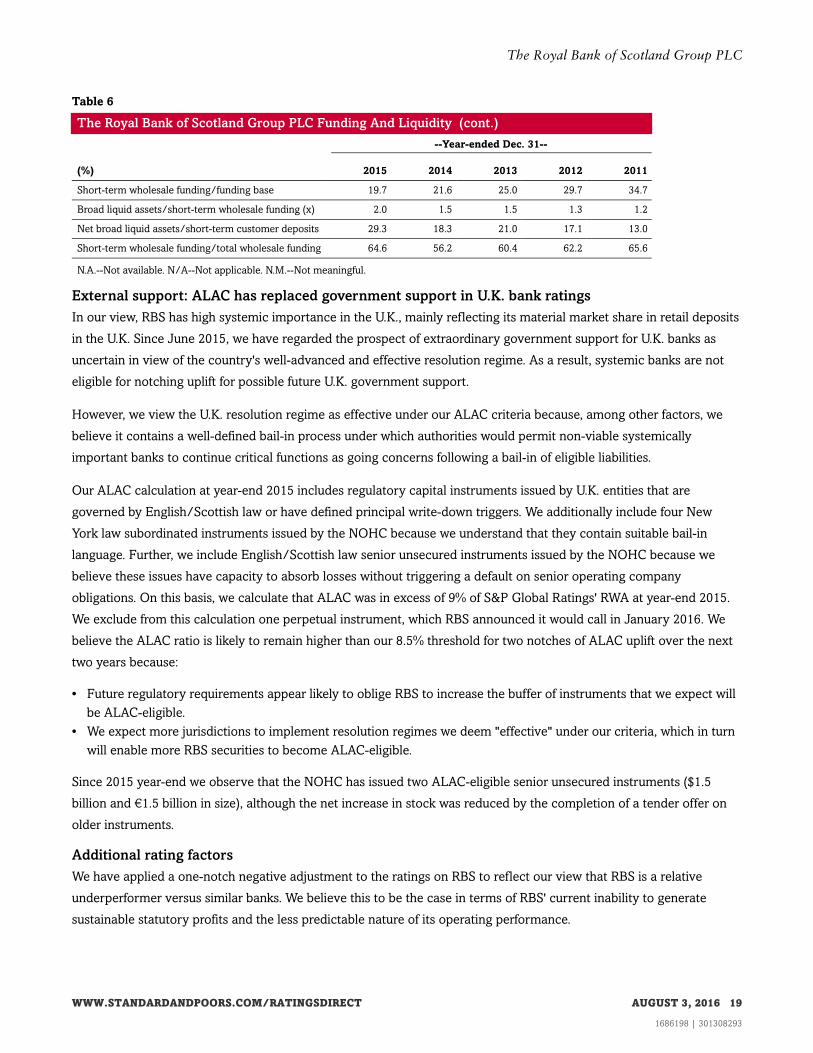
Table 6
The Royal Bank of Scotland Group PLC Funding And Liquidity (cont.)
--Year-ended Dec. 31--
(%) 2015 2014 2013 2012 2011
Short-term wholesale funding/funding base 19.7 21.6 25.0 29.7 34.7
Broad liquid assets/short-term wholesale funding (x) 2.0 1.5 1.5 1.3 1.2
Net broad liquid assets/short-term customer deposits 29.3 18.3 21.0 17.1 13.0
Short-term wholesale funding/total wholesale funding 64.6 56.2 60.4 62.2 65.6
N.A.--Not available. N/A--Not applicable. N.M.--Not meaningful.
External support: ALAC has replaced government support in U.K. bank ratings
In our view, RBS has high systemic importance in the U.K., mainly reflecting its material market share in retail deposits
in the U.K. Since June 2015, we have regarded the prospect of extraordinary government support for U.K. banks as
uncertain in view of the country's well-advanced and effective resolution regime. As a result, systemic banks are not
eligible for notching uplift for possible future U.K. government support.
However, we view the U.K. resolution regime as effective under our ALAC criteria because, among other factors, we
believe it contains a well-defined bail-in process under which authorities would permit non-viable systemically
important banks to continue critical functions as going concerns following a bail-in of eligible liabilities.
Our ALAC calculation at year-end 2015 includes regulatory capital instruments issued by U.K. entities that are
governed by English/Scottish law or have defined principal write-down triggers. We additionally include four New
York law subordinated instruments issued by the NOHC because we understand that they contain suitable bail-in
language. Further, we include English/Scottish law senior unsecured instruments issued by the NOHC because we
believe these issues have capacity to absorb losses without triggering a default on senior operating company
obligations. On this basis, we calculate that ALAC was in excess of 9% of S&P Global Ratings' RWA at year-end 2015.
We exclude from this calculation one perpetual instrument, which RBS announced it would call in January 2016. We
believe the ALAC ratio is likely to remain higher than our 8.5% threshold for two notches of ALAC uplift over the next
two years because:
• Future regulatory requirements appear likely to oblige RBS to increase the buffer of instruments that we expect will
be ALAC-eligible.
• We expect more jurisdictions to implement resolution regimes we deem "effective" under our criteria, which in turn
will enable more RBS securities to become ALAC-eligible.
Since 2015 year-end we observe that the NOHC has issued two ALAC-eligible senior unsecured instruments ($1.5
billion and €1.5 billion in size), although the net increase in stock was reduced by the completion of a tender offer on
older instruments.
Additional rating factors
We have applied a one-notch negative adjustment to the ratings on RBS to reflect our view that RBS is a relative
underperformer versus similar banks. We believe this to be the case in terms of RBS' current inability to generate
sustainable statutory profits and the less predictable nature of its operating performance.
WWW.STANDARDANDPOORS.COM/RATINGSDIRECT AUGUST 3, 2016 19
1686198 | 301308293
The Royal Bank of Scotland Group PLC

Group structure, rated subsidiaries, and hybrids
Royal Bank of Scotland Group PLC is the ultimate holding company of the group that it heads, and is a NOHC.
The group operates through two principal U.K. banking subsidiaries: The Royal Bank of Scotland PLC (RBS plc) and
National Westminster Bank PLC (Natwest). We continue to see RBS plc and Natwest as "core" to the group and expect
that regulators would intervene at the point of nonviability, bailing-in junior liabilities and, if necessary, NOHC
liabilities, to ensure that senior obligations are honored. Our ratings on these entities are therefore in line with the
ALAC-supported GCP, adjusted for the one-notch negative adjustment factor.
We do not include notches for ALAC support in the ratings on NOHCs because we do not believe that their senior
obligations would continue to receive full and timely payment in a resolution scenario. As a result of this, the NOHC is
rated one notch below the 'bbb' unsupported GCP.
The hybrid capital instruments issued by the above entities and related special purpose entities are notched down from
the unsupported GCP, being notched down in accordance with tables 1 and 2 of the bank hybrid criteria, depending on
their features. In all cases, the instruments issued by, or relying on a guarantee by, the NOHC have ratings that are one
notch below the equivalent instrument issued by an operating company.
Related Criteria And Research
Related Criteria
• Bank Rating Methodology And Assumptions: Additional Loss-Absorbing Capacity, April 27, 2015
• Bank Hybrid Capital And Nondeferrable Subordinated Debt Methodology And Assumptions, Jan. 29, 2015
• Group Rating Methodology, Nov. 19, 2013
• Revised Market Risk Charges For Banks In Our Risk-Adjusted Capital Framework, June 22, 2012
• Banks: Rating Methodology And Assumptions, Nov. 9, 2011
• Banking Industry Country Risk Assessment Methodology And Assumptions, Nov. 9, 2011
• Bank Capital Methodology And Assumptions, Dec. 6, 2010
• Use Of CreditWatch And Outlooks, Sept. 14, 2009
Related Research
• U.K. Banks Bolster Capital, But Economic Headwinds May Start To Blow, July 25, 2016
• Various U.K. Bank Outlooks Revised Due To Potential Economic Deterioration Following Brexit Vote, July 7, 2016
• Low Credit Losses For Even Longer: The Silver Lining For U.K. Banks, April 5, 2016
• Industry Report Card: U.K. Banks Face Up To Brexit Uncertainty, March 14, 2016
Ratings Detail (As Of August 3, 2016)
The Royal Bank of Scotland PLC
Counterparty Credit Rating BBB+/Stable/A-2
Certificate Of Deposit
Foreign Currency A-2
Commercial Paper
Foreign Currency A-2
Junior Subordinated BB
WWW.STANDARDANDPOORS.COM/RATINGSDIRECT AUGUST 3, 2016 20
1686198 | 301308293
The Royal Bank of Scotland Group PLC

Ratings Detail (As Of August 3, 2016) (cont.)
Junior Subordinated BB-
Senior UnsecuredGreater China Regional Scale cnA+
Senior Unsecured BBB+
Short-Term Debt A-2
Subordinated BB+
Counterparty Credit Ratings History
07-Jul-2016 BBB+/Stable/A-2
19-Jan-2016 BBB+/Positive/A-2
09-Jun-2015 BBB+/Stable/A-2
03-Feb-2015 A-/Watch Neg/A-2
07-Nov-2013 A-/Negative/A-2
31-May-2013 A/Negative/A-1
29-Nov-2011 A/Stable/A-1
Sovereign Rating
United Kingdom AA/Negative/A-1+
Related Entities
National Westminster Bank PLC
Issuer Credit Rating BBB+/Stable/A-2
Junior Subordinated BB
Junior Subordinated BB-
Preference Stock BB-
Senior Unsecured BBB+
Short-Term Debt A-2
Subordinated BB+
RBS Holdings N.V.
RBS Securities Inc.
Issuer Credit Rating BBB+/Stable/A-2
Royal Bank of Scotland N.V. (Milan Branch)
Issuer Credit Rating BBB+/Stable/A-2
Royal Bank of Scotland PLC (Connecticut Branch) (The)
Issuer Credit Rating BBB+/Stable/A-2
The Royal Bank of Scotland Group PLC
Issuer Credit Rating BBB-/Stable/A-3
Commercial Paper A-3
Junior Subordinated B
Junior Subordinated B+
Junior Subordinated BB-
Preference Stock B+
Preferred Stock B+
Senior Unsecured BBB+
Senior Unsecured BBB-
Short-Term Debt A-2
Short-Term Debt A-3
WWW.STANDARDANDPOORS.COM/RATINGSDIRECT AUGUST 3, 2016 21
1686198 | 301308293
The Royal Bank of Scotland Group PLC
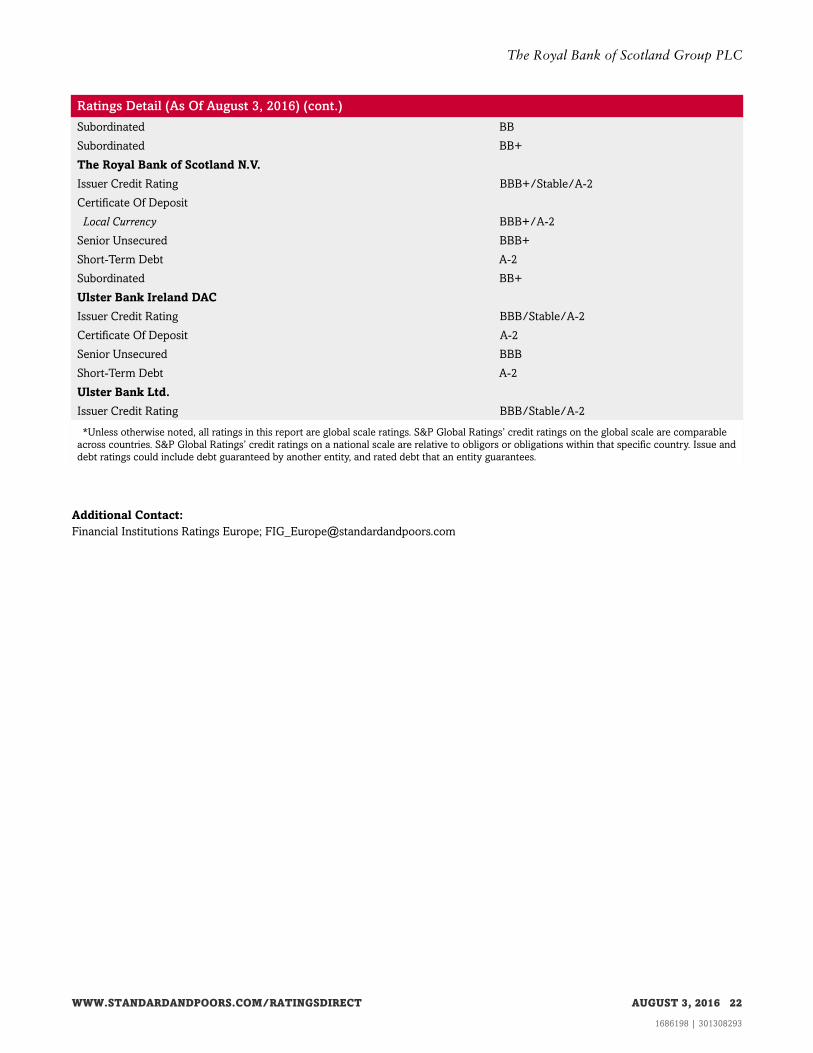
Ratings Detail (As Of August 3, 2016) (cont.)
Subordinated BB
Subordinated BB+
The Royal Bank of Scotland N.V.
Issuer Credit Rating BBB+/Stable/A-2
Certificate Of Deposit
Local Currency BBB+/A-2
Senior Unsecured BBB+
Short-Term Debt A-2
Subordinated BB+
Ulster Bank Ireland DAC
Issuer Credit Rating BBB/Stable/A-2
Certificate Of Deposit A-2
Senior Unsecured BBB
Short-Term Debt A-2
Ulster Bank Ltd.
Issuer Credit Rating BBB/Stable/A-2
*Unless otherwise noted, all ratings in this report are global scale ratings. S&P Global Ratings’ credit ratings on the global scale are comparable
across countries. S&P Global Ratings’ credit ratings on a national scale are relative to obligors or obligations within that specific country. Issue and
debt ratings could include debt guaranteed by another entity, and rated debt that an entity guarantees.
Additional Contact:
Financial Institutions Ratings Europe; [email protected]
WWW.STANDARDANDPOORS.COM/RATINGSDIRECT AUGUST 3, 2016 22
1686198 | 301308293
The Royal Bank of Scotland Group PLC

STANDARD & POOR'S, S&P and RATINGSDIRECT are registered trademarks of Standard & Poor's Financial Services LLC.
S&P may receive compensation for its ratings and certain analyses, normally from issuers or underwriters of securities or from obligors. S&P
reserves the right to disseminate its opinions and analyses. S&P's public ratings and analyses are made available on its Web sites,
www.standardandpoors.com (free of charge), and www.ratingsdirect.com and www.globalcreditportal.com (subscription) and www.spcapitaliq.com
(subscription) and may be distributed through other means, including via S&P publications and third-party redistributors. Additional information
about our ratings fees is available at www.standardandpoors.com/usratingsfees.
S&P keeps certain activities of its business units separate from each other in order to preserve the independence and objectivity of their respective
activities. As a result, certain business units of S&P may have information that is not available to other S&P business units. S&P has established
policies and procedures to maintain the confidentiality of certain nonpublic information received in connection with each analytical process.
To the extent that regulatory authorities allow a rating agency to acknowledge in one jurisdiction a rating issued in another jurisdiction for certain
regulatory purposes, S&P reserves the right to assign, withdraw, or suspend such acknowledgement at any time and in its sole discretion. S&P
Parties disclaim any duty whatsoever arising out of the assignment, withdrawal, or suspension of an acknowledgment as well as any liability for any
damage alleged to have been suffered on account thereof.
Credit-related and other analyses, including ratings, and statements in the Content are statements of opinion as of the date they are expressed and
not statements of fact. S&P's opinions, analyses, and rating acknowledgment decisions (described below) are not recommendations to purchase,
hold, or sell any securities or to make any investment decisions, and do not address the suitability of any security. S&P assumes no obligation to
update the Content following publication in any form or format. The Content should not be relied on and is not a substitute for the skill, judgment
and experience of the user, its management, employees, advisors and/or clients when making investment and other business decisions. S&P does
not act as a fiduciary or an investment advisor except where registered as such. While S&P has obtained information from sources it believes to be
reliable, S&P does not perform an audit and undertakes no duty of due diligence or independent verification of any information it receives.
No content (including ratings, credit-related analyses and data, valuations, model, software or other application or output therefrom) or any part
thereof (Content) may be modified, reverse engineered, reproduced or distributed in any form by any means, or stored in a database or retrieval
system, without the prior written permission of Standard & Poor's Financial Services LLC or its affiliates (collectively, S&P). The Content shall not be
used for any unlawful or unauthorized purposes. S&P and any third-party providers, as well as their directors, officers, shareholders, employees or
agents (collectively S&P Parties) do not guarantee the accuracy, completeness, timeliness or availability of the Content. S&P Parties are not
responsible for any errors or omissions (negligent or otherwise), regardless of the cause, for the results obtained from the use of the Content, or for
the security or maintenance of any data input by the user. The Content is provided on an "as is" basis. S&P PARTIES DISCLAIM ANY AND ALL
EXPRESS OR IMPLIED WARRANTIES, INCLUDING, BUT NOT LIMITED TO, ANY WARRANTIES OF MERCHANTABILITY OR FITNESS FOR
A PARTICULAR PURPOSE OR USE, FREEDOM FROM BUGS, SOFTWARE ERRORS OR DEFECTS, THAT THE CONTENT'S FUNCTIONING
WILL BE UNINTERRUPTED, OR THAT THE CONTENT WILL OPERATE WITH ANY SOFTWARE OR HARDWARE CONFIGURATION. In no
event shall S&P Parties be liable to any party for any direct, indirect, incidental, exemplary, compensatory, punitive, special or consequential
damages, costs, expenses, legal fees, or losses (including, without limitation, lost income or lost profits and opportunity costs or losses caused by
negligence) in connection with any use of the Content even if advised of the possibility of such damages.
Copyright © 2016 by S&P Global Market Intelligence, a division of S&P Global Inc. All rights reserved.
WWW.STANDARDANDPOORS.COM/RATINGSDIRECT AUGUST 3, 2016 23
1686198 | 301308293