the royal bank of scotland group plc annual report · pdf filethe royal bank of scotland group...
TRANSCRIPT
THE ROYAL BANK OF SCOTLAND GROUP plc
ANNUAL REPORT ON FORM 20-FFOR THE YEAR ENDED SEPTEMBER 30, 1999
CONTENTS
Item Item Caption Page
Presentation of Information ............................................................................................ 2
Exchange Rates ............................................................................................................ 3
1 Description of Business ................................................................................................. 4
Description of Assets and Liabilities ............................................................................ 10
Competition ............................................................................................................ 23
Monetary Policy ...................................................................................................... 23
Supervision and Regulation........................................................................................ 25
2 Description of Property.................................................................................................. 27
3 Legal Proceedings......................................................................................................... 27
4 Control of Registrant ..................................................................................................... 27
5 Nature of Trading Market............................................................................................... 28
6 Exchange Controls and Other Limitations Affecting Security Holders..................................... 29
7 Taxation ..................................................................................................................... 30
8 Selected Consolidated Financial Data ............................................................................... 34
9 ManagementÕs Discussion and Analysis of Financial Condition and Results of Operations.......... 37
Divisional Analysis .................................................................................................. 38
Results of Operations of the Group.............................................................................. 48
Capital Resources .................................................................................................... 59
Quantitative and Qualitative Disclosures about Market Risk............................................. 60
10,11,12 Directors and Officers of Registrant; Remuneration of Directors and Officers; Options to
Purchase Securities from Registrant or Subsidiaries ........................................................ 66
13 Interest of Management in Certain Transactions.................................................................. 72
14 Description of Securities to be Registered.......................................................................... *
15 Defaults upon Senior Securities ....................................................................................... *
16 Changes in Securities and Changes in Security for Registered Securities ................................. *
17 Financial Statements ..................................................................................................... *
18 Financial Statements ..................................................................................................... 73
19 Exhibits ...................................................................................................................... *
Signatures ................................................................................................................... 143
* Not applicable or the answer is in the negative.

2
PRESENTATION OF INFORMATION
In this Report, ÒcompanyÓ means The Royal Bank of Scotland Group plc and ÒGroupÓ means the company and itssubsidiaries.
Certain financial and statistical information in this Report is presented separately for domestic and foreign activities. Theterm ÒForeign activitiesÓ refers to transactions in which the debtor or customer is domiciled outside the United Kingdom (ÒUKÓ).ÒForeign activitiesÓ are further divided into ÒForeign-UK basedÓ, ÒContinental EuropeÓ, ÒUnited StatesÓ and ÒRest of the WorldÓ.The term ÒForeign-UK basedÓ refers to those Foreign activities conducted by offices in the UK. Foreign activities allocated toÒContinental EuropeÓ, ÒUnited StatesÓ or ÒRest of the WorldÓ involve transactions in which the customer is domiciled in thecountries included in these respective categories. For purposes of such financial and statistical information, the UK includes theChannel Islands and the Isle of Man. The separate presentation of domestic and foreign activities reflects allocations of loan capitalinterest, certain centralised expenditure and taxes that in some cases are necessarily subjective and to an extent arbitrary.
The breakdown into UK and overseas sectors contained in the Average Interest Rates, Yields, Spreads and Marginspresented on page 49 of this Report and the Average Balance Sheets and tables of Interest Rates presented on page 50 of this Reporthave been compiled on the basis of location of office. We believe that the presentation of the Average Balance Sheets and Inte restRates on such a basis provides more useful information on the yields, spreads and margins of the GroupÕs activities in the UK andoverseas. Presenting the Average Balance Sheets and Interest Rates on the basis of the domestic and foreign activities analysis usedelsewhere in this Report would not provide useful information because the average assets and liabilities arising from ÒForeign - UKbasedÓ activities do not match. In its UK branch network, the Bank attracts more deposits from customers domiciled outside the UKthan it lends to such customers; therefore, the interest spreads and margins obtained from an analysis into domestic and foreignwould be distorted to the extent of this imbalance. Ignoring the effect of this distortion would result in materially different yields,spreads and margins for the foreign sector.
Where average balances are shown in this Report, cleared balances are used in the case of The Royal Bank of Scotland plc(the ÒBankÓ), the UK clearing bank subsidiary of the company. Cheques deposited in an account by a customer which are awaitingclearance are therefore not included in these balances. In addition, where arrangements exist with a customer under which loans toand deposits from the customer are netted for the purpose of determining interest due to or from the customer, such loans anddeposits are similarly netted for the purpose of computing average balances. As a result, the average balances shown are lower thanthey would be if the book values of customersÕ accounts were used. Average balances, where used, are based upon daily averagesfor the Bank and Citizens Financial Group (ÒCFGÓ) and averages not less frequent than monthly for other Group operations. Allsuch balances are considered to be fairly representative of the operations of the Group.
The Group prepares its Consolidated Financial Statements on the basis of a fiscal year beginning on October 1 and endingon September 30 of the following year. References to a year in this Report are, unless otherwise indicated, references to the GroupÕsfiscal year ending on September 30 of such year.
The Group publishes its Consolidated Financial Statements in pounds sterling (Ò£Ó or ÒsterlingÓ). In this Report, referencesto ÒUS dollarsÓ, Ò$Ó or ÒcentsÓ are to United States currency and references to Òpounds sterlingÓ, ÒsterlingÓ, Ò£Ó, ÒpenceÓ or ÒpÓ areto UK currency.
Forward-looking statements
Certain statements in this document may be considered to be Òforward-looking statementsÓ as that term is defined in theUnited States Private Securities Litigation Reform Act of 1995, such as statements that include the words ÒexpectÓ, ÒestimateÓ,ÒprojectÓ, ÒanticipateÓ, ÒshouldÓ, ÒintendÓ, ÒprobabilityÓ, ÒriskÓ, ÒVaRÓ, ÒtargetÓ, ÒgoalÓ, ÒobjectiveÓ and similar expressions orvariations on such expressions. In particular, this document includes forward-looking statements relating, but not limited, to theGroupÕs potential exposures to various types of market risks, such as interest rate risk, foreign exchange rate risk and commodity andequity price risk. See ÒLiquidity riskÓ, ÒMarket riskÓ, ÒValue at RiskÓ elsewhere in this document. Such statements are subject tocertain risks and uncertainties. For example, certain of the market risk disclosures are dependent on choices about key modelcharacteristics and assumptions and are subject to various limitations. See ÒMarket RiskÓ and ÒValue at RiskÓ. By their nature,certain of the market risk disclosures are only estimates and could be materially different from what actually occurs in the future. Asa result, actual future gains and losses could materially differ from those that have been estimated. Other factors that could causeactual results to differ materially from those estimated by the forward-looking statements contained in this document include, but arenot limited to: general economic conditions in the UK and in other countries in which the Group has significant business activities orinvestments, including the United States and Spain; the monetary and interest rate policies of the Bank of England, the Board ofGovernors of the Federal Reserve System and other G-7 central banks; inflation; deflation; unanticipated turbulence in interest rates,foreign currency exchange rates, commodity prices and equity prices; the effects of non-linear market behaviour that cannot becaptured by linear statistical models such as the Value at Risk model used by the Group; changes in UK and foreign laws,regulations and taxes; changes in competition and pricing environments; natural disasters; the inability to hedge certain riskseconomically; the adequacy of loss reserves; acquisitions or restructurings; technological changes; changes in consumer spendingand saving habits; and the success of the Group in managing the risks involved in the foregoing.
The forward-looking statements contained in this document speak only as of the date of this report, and the Group does notundertake to update any forward-looking statement to reflect events or circumstances after the date hereof or to reflect the occurrenceof unanticipated events.
EXCHANGE RATES
3
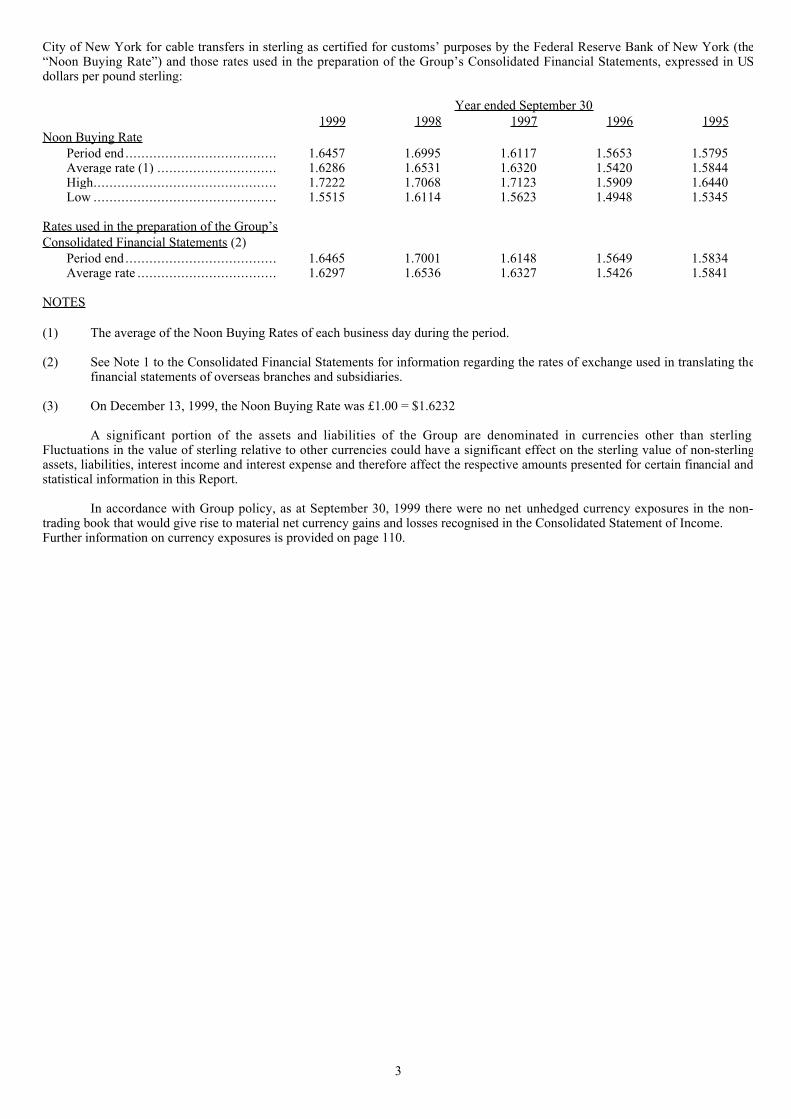
City of New York for cable transfers in sterling as certified for customsÕ purposes by the Federal Reserve Bank of New York (theÒNoon Buying RateÓ) and those rates used in the preparation of the GroupÕs Consolidated Financial Statements, expressed in USdollars per pound sterling:
Year ended September 30 1999 1998 1997 1996 1995
Noon Buying RatePeriod end ...................................... 1.6457 1.6995 1.6117 1.5653 1.5795Average rate (1) .............................. 1.6286 1.6531 1.6320 1.5420 1.5844High.............................................. 1.7222 1.7068 1.7123 1.5909 1.6440Low .............................................. 1.5515 1.6114 1.5623 1.4948 1.5345
Rates used in the preparation of the GroupÕs Consolidated Financial Statements (2)
Period end ...................................... 1.6465 1.7001 1.6148 1.5649 1.5834Average rate ................................... 1.6297 1.6536 1.6327 1.5426 1.5841
NOTES
(1) The average of the Noon Buying Rates of each business day during the period.
(2) See Note 1 to the Consolidated Financial Statements for information regarding the rates of exchange used in translating thefinancial statements of overseas branches and subsidiaries.
(3) On December 13, 1999, the Noon Buying Rate was £1.00 = $1.6232
A significant portion of the assets and liabilities of the Group are denominated in currencies other than sterlingFluctuations in the value of sterling relative to other currencies could have a significant effect on the sterling value of non-sterlingassets, liabilities, interest income and interest expense and therefore affect the respective amounts presented for certain financial andstatistical information in this Report.
In accordance with Group policy, as at September 30, 1999 there were no net unhedged currency exposures in the non-trading book that would give rise to material net currency gains and losses recognised in the Consolidated Statement of Income.Further information on currency exposures is provided on page 110.
4
ITEMÊ1.ÊDESCRIPTIONÊOFÊBUSINESS
Introduction
The Group is a diversified financial services group engaged in a wide range of banking, financial and finance-relatedactivities in the UK and overseas. The GroupÕs operations are principally centered in the UK. At and for the year ended September30, 1999, based on domicile of customer, no country outside the UK or the United States accounted for more than 10% of total assetsor net income available for ordinary shares of the Group - see Note 50 to the Consolidated Financial Statements. At September 30,1999, the Group had total assets of £88.9 billion (1998 - £79.7 billion), total deposits of £61.6 billion (1998 - £55.1 billion) andshareholdersÕ equity of £4,202 million (1998 - £2,953 million). At September 30, 1999, the Group employed 32,670 staff (1998 Ð31,680).
The Bank is the companyÕs principal operating subsidiary and it controls, directs and promotes the operations of thesubsidiary companies. The Bank is a major UK clearing bank whose predecessors date back to 1727. At September 30, 1999, theBank had 634 branches in the UK. The Bank was created by the merger in 1985 of the former The Royal Bank of Scotland plc, thelargest of the Scottish clearing banks, and Williams & GlynÕs Bank plc, a wholly-owned English clearing bank subsidiary of thecompany.
The Group is organised by division, each focusing on a key market segment. The UK Bank provides banking and otherrelated financial services to individuals and small to medium-sized corporate clients through a UK-wide branch network, certaincentralised banking services and various subsidiary companies. It also provides banking and other related financial services to largercorporate and institutional clients in the UK and internationally. Angel Trains acquires rolling stock from manufacturers and leasesit to train operating companies. RBS Cards provides credit and debit card services and holds credit card receivables. The RoyalBank of Scotland International Limited provides offshore banking services to local and international customers. Investor Servicesprovided investment administration solutions to institutional investors until the date of its sale on October 31, 1999. Direct LineInsurance principally provides automobile and household insurance. CFG constitutes the GroupÕs North American division. Thevarious new businesses started by the Group in recent years are grouped together in a separate classification, New Retail FinancialServices Businesses. Support is provided by central functions dealing with finance, strategy, legal and regulatory matters andexternal affairs.
The UK Bank
The operations of the UK Bank comprise three divisions, Retail Banking, Corporate and Institutional Banking and Serviceand Operations which are described below.
Retail Banking
Through its UK branch network and certain centralised banking services, Retail Banking provides a wide range of banking,insurance and other related financial services to individuals and to small business clients. It also operates direct banking telephoneservices and has complementary subsidiary businesses covering life assurance and pensions, and private banking.
In the personal banking market, Retail Banking offers money transmission, savings and loan facilities (comprisingmortgages, consumer loans and overdraft facilities). It also acts as a point of sale for credit cards on behalf of RBS Cards. In itssmall business banking market, Retail Banking provides a range of services which includes money transmission and cashmanagement, short, medium and long-term finance and retail and wholesale deposit taking products. Through the operations ofRoyal Scottish Assurance (ÒRSAÓ), Retail Banking provides a wide range of life assurance, pension and unit linked investmen tproducts, together with discretionary portfolio management.
Private Banking
Adam & Company PLC, which is a wholly owned subsidiary of the Bank, provides private banking services in Scotlandand England.
RSA
RSA was established as a joint venture to offer a wide range of life, pensions and investment products through the BankÕsUK branch network. Initially, the Bank held an 80% shareholding in RSA. In May 1997, the Bank acquired the remaining 20% ofRSA from Scottish Equitable plc and then later that month sold a 30% interest in RSA to Scottish Widows Fund and Life AssuranceSociety (ÒScottish WidowsÓ), resulting in a 70% shareholding held by the Bank. Scottish Widows provides administration,processing, investment management and other services to RSA. On November 26, 1999, it was announced that the Group and CGUplc had entered into a memorandum of understanding for the provision of life, pensions and investment products to the RBS Group.CGU has agreed to acquire a 50% interest in RSA and will replace Scottish Widows in this venture.

5
Corporate and Institutional Banking
Corporate and Institutional Banking provides commercial banking and other financial services to the BankÕs corporate andinstitutional clients selling a wide range of products to meet their financial needs. It consists of the following businesses:
Corporate and Commercial Banking
Corporate and Commercial Banking focuses on the needs of the BankÕs corporate customers and financial institutions. Dueto their size and complexity, these customers demand a wide range of corporate banking skills which can best be provided by aseparate dedicated business. Corporate and Commercial Banking provides a number of products and services including clearing,money transmission, syndicated lending and corporate finance. The Bank is committed to the concept of Òrelationship bankingÓwhere each customer has one principal point of contact within the Bank. To achieve this, Corporate and Commercial Banking hassmall teams of managers in each of the BankÕs major centres (London, Edinburgh and Manchester) which are devoted exclusively tostrengthening and deepening the BankÕs involvement with these customers.
Treasury and Capital Markets
The BankÕs Treasury and Capital Markets operation, based in London, Edinburgh and Manchester, is responsible for thefunding and liquidity position of the Bank and for managing the BankÕs foreign exchange risk. Treasury and Capital Markets alsooffers a wide product range to an expanding customer base serviced from dealing rooms in London, Edinburgh and Manchester.Dealing operations are also located in New York and Singapore. The Bank operates in foreign exchange markets, sterling marketsand the Eurocurrency deposit markets. The London operation controls all positions, both in the money markets and foreignexchange markets, within constraints established either by the applicable regulatory authorities or the BankÕs senior management asappropriate. Treasury and Capital Markets participates in the derivative markets to meet the financing needs of customers, to reducethe BankÕs exposure to fluctuations in exchange and interest rates and as an integral part of its trading activities. SeeÒManagementÕs Discussion and Analysis of Financial Condition and Results of Operations - Risk ManagementÓ.
Investment Finance
The principal business units within Investment Finance are Leveraged Finance and Royal Bank Development CapitalLimited.
Leveraged Finance has established itself as one of the leading debt providers in the UK market. It has capabilities inarranging funds for acquisitions, for management buy-ins and buy-outs and for other situations requiring the arrangement ofleveraged debt facilities. During 1998 RBS Mezzanine Limited, a mezzanine capital business, was launched and is already provingprofitable and, during 1999, Leveraged Finance expanded into Europe, opening offices in Paris and Frankfurt. In July 1999, theGroup formed a 50% joint venture company, Caledonian Capital Limited, with the Bank of Scotland to provide a single independentEuropean underwriting capability for high value senior debt financing to leveraged buy-out transactions.
Royal Bank Development Capital Limited provides equity finance for companies that have little or no access to capitalmarkets. The companyÕs activities cover start-ups, development capital situations, management buy-outs and buy-ins and sharerestructurings.
Structured Finance
The constituent areas of this business are loan syndications, leasing, project and export finance, shipping, structured tradefinance and structured asset finance. It also has a specialist team to provide finance under the UK GovernmentÕs Private FinanceInitiative.
Royal Bank Leasing Limited provides asset based finance for large capital equipment projects. Over the past few years, ithas concentrated on developing its reputation for providing individual financing solutions. Royal Bank Leasing Limited generatesnew business from its offices in London, Glasgow and its head office in Cheltenham.
The Shipping unit provides mortgage finance together with corporate and personal banking services to the worldÕs majorshipping companies and high net worth individuals connected with the sector, from its two operational centres in London andPiraeus.
Loan syndications within the Bank are managed by a dedicated team which is involved in the arrangement, structuring andunderwriting of major corporate facilities and is acknowledged as a top ranking arranger/co-arranger of UK corporate debttransactions.
The project and export finance group is active in a wide range of UK based and international project finance businesses andhas a dedicated export credit team. A global mandate is pursued through its representation in London, Edinburgh, Singapore,Sydney and New York.
UK and International Banking Services
UK and International Banking Services is the BankÕs domestic and international payments and cash management business.
Service and Operations

6
Service and Operations provides banking services, property and facilities management and technology for the UK Bank. Italso provides support to the UK Bank through a network of Service Centres, Cash Centres and the Mortgage Centre in Greenock,Scotland.
New Retail Financial Services Businesses
In recent years, the Group has established various new retail businesses to extend and complement its existing financialservices to customers.
Direct Line Financial Services Limited was established in 1993 to provide personal financial services using a telephonebased delivery system. The company offers mortgages, personal loans and savings products and recently launched its own low costcredit card. At September 30, 1999, the company had over 130,000 accounts.
Privilege Insurance was established in 1994 and provides non-standard motor insurance through a telephone based deliverysystem and motor and household insurance through affinity schemes with third parties. At September 30, 1999, the company had445,000 policies in-force.
In 1994, Direct Line Group Limited entered into a joint venture agreement with Bank Inter S.A., a Spanish bank, to set up adirect marketing automobile insurance operation in Spain. The joint venture company, Linea Directa Aseguradora S.A., is 50%owned by Direct Line Group Limited. At September 30, 1999, there were 212,000 in-force policies (September 1998 Ð 177,000).
In July 1997, a partnership between Direct Line and Scottish Widows resulted in the formation of a 50% joint venture.Through two subsidiary companies of Direct Line Life Holdings Ltd, the joint venture holding company, life insurance, personalpensions, Individual Savings Accounts and unit trust investment products are offered directly to the public by telephone.
Direct Line Accident Management had four accident repair centres operational at September 30, 1999, having closed twocentres during the year.
In July 1997, the Group established a joint venture in financial services with Tesco PLC, one of the UKÕs leadingsupermarket groups. The new venture, Tesco Personal Finance Group Limited, allies the strengths of the Group with TescoÕs largecustomer base.
In October 1997, the Group established a joint venture with Virgin Direct, Virgin Direct Personal Finance Limited. A 24hour telephone based bank account, with a mortgage element, the Virgin One Account, was launched to VirginÕs own customers inOctober 1997 and more broadly in May 1998.
Angel Trains
Angel Trains was acquired by the company in December 1997. It is one of the three rolling stock leasing companies in theUK which were privatised in 1996. Angel Trains acquires rolling stock from manufacturers, leases the rolling stock to train operatingcompanies and sub-contracts the maintenance of the rolling stock.
During 1999, Angel Trains won the contract to invest in 53 new high-tech ÔAdvanced Tilting TrainsÕ to be leased to VirginRail Group for use on the West Coast main line.
RBS Cards
RBS Cards provides credit and debit card services including its own low cost, no fee MasterCard and Visa credit cards andthe BankÕs multi-functional Highline debit cards, which can be used in every ATM in the UK. These debit cards incorporate theCirrus and Maestro facilities which provide the ability to use both ATMÕs and debit card facilities worldwide.
The BankÕs card services business has expanded in recent years with a series of joint ventures. In 1997, a new company,RBS Cards Limited, was created to lead the development of new products. Its first launch, the AU Gold MasterCard, offers lowrates of interest to its target market of low-risk customers.
In May 1995, a joint venture, RBS Advanta, was entered into with the Advanta Corporation of Pennsylvania (ÒAdvantaCorporationÓ) to promote and service credit cards in the UK. In July 1998, the Bank acquired Advanta CorporationÕs 49% minorityshareholding to become sole shareholder of RBS Advanta.
At September 30, 1999, credit card balances were over £2.2 billion and the number of accounts over 2.2 million.
Investor Services
On October 31, 1999, the Group completed the sale of its main investor services businesses to The Bank of New York.
Direct Line Insurance
7
p ( ) g pdomestic household insurance policies. Direct Line sells insurance by telephone directly to customers and does not use insurancebrokers or other intermediaries. Direct Line operates with its head office and South of England regional office in Croydon and hasregional offices in five other major cities in the UK.
In the automobile insurance market Direct Line has increased the number of in-force motor policies by 6% to approximately2.2 million at September 30, 1999 (1998 - 2.1 million), ranking it as one of the largest underwriters of private automobile insurancepolicies in the UK.
Direct Line continued to expand its household insurance portfolio (including buildings, contents and personal possessions)with nearly 894,000 in-force policies at September 30, 1999 (1998 - 863,000 policies). Direct Line also offers creditor insurance topersonal loan and credit card customers of the Bank and Direct Line Financial Services Limited, offering protection to thosecustomers against inability to service debt due to unemployment, sickness or accident. It also offers travel and pet insurance andcertain other ancillary services to its customers, including the arrangement of roadside assistance and recovery.
In November 1999, Direct Line completed the acquisition of the roadside rescue specialist, Green Flag, which, with therapidly growing Direct Line Rescue business, will make Direct Line the UKÕs third largest operator in this business sector, withalmost three million customers.
Citizens Financial Group (ÒCFGÓ)
Citizens Financial Group, Inc. is a US bank holding company incorporated in 1984, the principal banking subsidiaries ofwhich are Citizens Bank of Rhode Island, Citizens Bank of Connecticut, Citizens Bank of Massachusetts and Citizens Bank NewHampshire (ÒCBNHÓ). CFG has 280 branches covering Rhode Island, Connecticut, Massachusetts and New Hampshire and is thesecond largest bank in New England.
CFG provides a range of retail and corporate banking services. Approximately half of its loan portfolio relates to personalbanking, including residential mortgages and home equity loans, and half to corporate lending. See ÒDescription of Assets andLiabilities - Lending ConcentrationsÓ on page 11 of this Report. In addition, CFG engages in a wide variety of consumer lendingactivities, ATM and debit card services, trust services and retail investment services. CFG also operates subsidiaries primarilyengaged in equipment lease financing.
On April 26, 1996, the Group and Bank of Ireland completed the merger of their US banking operations in New England.This transaction involved the merger of CFG and Bank of Ireland First Holdings, the holding company of CBNH, and resulted in theGroup retaining a holding of 76.5% of CFGÕs enlarged share capital, with the remaining 23.5% being held by Bank of Ireland. InSeptember 1998, the Bank acquired the Bank of IrelandÕs 23.5% minority shareholding in CFG for a cash consideration of $750million.
On October 16, 1998, CFG completed the acquisition of four branches from Branford Savings Bank, a subsidiary of NorthFork Bancorp, for a premium of $6 million over net assets acquired, payable in cash.
On October 1, 1999, CFG completed the acquisition of the major part of the commercial banking business of State StreetCorporation for a cash premium of $350 million over net assets acquired. This business has commercial loans totalling $2.3 billionand deposits of $1.1 billion.
On June 21, 1999, it was announced that CFG had entered into an agreement to acquire the entire issued share capital ofUST Corp. of Boston, Massachusetts (ÒUSTÓ) for a consideration of approximately $1.4 billion. As at March 31, 1999, UST hadassets of $5.9 billion and deposits of $4.2 billion. The consideration will be payable in cash at completion, which is expected to takeplace in early 2000, subject to obtaining the consent of Federal and State regulators in the US.
At September 30, 1999, CFG had total assets of $19.5 billion (including total loans of $11 billion and a securities portfolioof $7 billion), total customer deposits of $14 billion and stockholdersÕ equity of $1.5 billion. All figures are stated in accordancewith UK GAAP unless stated otherwise.

8
The Royal Bank of Scotland International Limited (ÒRBSIÓ)
RBSI provides a wide range of offshore banking services to local and international customers through its subsidiaries in theChannel Islands, the Isle of Man, the Bahamas and Gibraltar. These offshore banking services include corporate banking, custod y,treasury and personal banking.
In October 1999, RBSI completed the sale of 30% of its investor services businesses to The Bank of New York.
Central items
Central items include the GroupÕs principal associated undertakings, head office department costs (excluding thoserecharged to other divisions) and income from surplus capital less central financing costs.
Relationship with Banco Santander Central Hispano, S.A.
In October 1988, the Group and Banco Santander entered into an agreement (Òthe agreementÓ) whereby the Group andBanco Santander and its subsidiaries agreed to co-operate in certain banking and financial services activities in Europe, includingrepresentation in each otherÕs bank branches to service their respective customers, offshore and investment banking, technologydevelopment, operational co-operation and the development of representation in Europe and the Far East. In January 1999, BancoSantander announced its intention to merge with Banco Central Hispanoamericano, another Spanish banking group. This merge rwas completed in April 1999 and the merged entity is called Banco Santander Central Hispano, S.A. (ÒBSCHÓ).
At September 30, 1999, the Group held 2.23% of BSCHÕs capital stock. The total cost of this shareholding is £160 millionand the market value as at September 30, 1999 was £514 million. During the year ended September 30, 1998 the Group sold 3.6million shares in Banco Santander realising a gain of £57 million. At September 30, 1999, BSCH held 9.64% of the companyÕsordinary shares.
The Group also has a 12.8% shareholding in Banco Santander, Portugal S.A., with the remainder of the shares being held byBSCH.
Recent events
On November 29, 1999, the Group announced that it had made an offer to acquire National Westminster Bank Plc(ÒNatWestÓ). The company has offered new ordinary shares and loan notes in exchange for NatWest ordinary shares in proportionssuch that existing shareholders in the company would hold approximately 38% of the issued share capital of the enlarged groupfollowing the offer, whilst NatWest shareholders would hold approximately 62%.
9
Staff involvement
At September 30, 1999, the Group employed 32,670 people. The Group encourages staff involvement by a process ofcommunication and consultation. This takes the form of the provision of information through normal management channels, internalpublications, video communication, regular dialogue with staff representatives and an opportunity for staff to voice their views in aconfidential manner via an annual staff opinion survey.
Significant developments to enhance staff involvement in the last year have included the introduction of a training andcommunication network which allows employees to participate in interactive training sessions from their place of work via theirpersonal computer. Also launched within the last year was the BankÕs Intranet which gives employees electronic access toinformation including policies, employment information, job vacancies, news, publications and departmental information.
Profit sharing schemes have existed since 1980 and these have included the opportunity to acquire shares in the company.Included in expenses for the year ended September 30, 1999 are sums totalling £47 million for payments to staff eligible toparticipate in the GroupÕs profit sharing schemes (1998 - £43 million).
Staff option schemes were introduced in 1986. On June 3, 1999, options were granted over 3,525,518 ordinary shares, at aprice of 1085p per share, under the companyÕs sharesave scheme. On December 7, 1998, March 4 and June 3, 1999, options weregranted over 935,209 ordinary shares, at prices of 943p, 1205.5p and 1291p per share respectively, under the companyÕs executiveshare option scheme.
Equal opportunities
The company is committed to providing equality of opportunity. The employment practices of companies in the Groupfollow the best practice of each country in which they operate. In the recruitment of staff and their subsequent career development,individuals are considered solely on the basis of their aptitude and ability, irrespective of sex, marital status, race, age, sexualorientation, religion or disability.
The number of women in management positions continues to grow and women now make up almost 37% of middlemanagement and over 11% of senior management. For serving employees who become disabled, every help is given to ensure theircontinued employment and to arrange rehabilitative training. An Occupational Health Service provides in-house expertise on suchrehabilitation programmes. The Bank is a member of the EmployerÕs Forum on Disability and is committed to action to improve theposition of disabled people both as valued employees and as customers of the Bank. The Bank is also a member of Race forOpportunity and is committed to eliminating racism in the workplace.
Environmental issues
The Group recognises that environmental and social responsibility is integral to the way we do business. Environmentaland social imperatives are shaping all our futures and the diversity and flexibility of our businesses enable us to anticipate andrespond to those changes. Our philosophy is that business excellence, of necessity, requires that we meet changing customerexpectations and needs.
The Group recognises this challenge and has adopted policies and management regimes which reinforce these wider humanand material concerns. Our Values, Balanced Scorecard, Change Management, Staff Development, Equal Opportunities, EmployeeAssistance, Health, Safety and Environment programmes all reinforce these wider business principles. The objective is not only tomanage the obvious direct operational impacts on the environment, such as energy, raw material, waste and transport, but also tointegrate environmental and social concerns into all of our financial services activities.

10
Description of Assets and Liabilities
Assets
Loan Portfolio
The GroupÕs loan portfolio consists of loans (including overdraft facilities) and instalment credit and finance leasereceivables. The BankÕs overdraft facilities provide the customer with a demand deposit account and demand credit facilitycombined in a single checking (current) account. An overdraft is effected whenever a customerÕs drawings on a demand depositaccount exceed the credit balance of the account, the balance of which may alternate between debit and credit. While overdrafts arecontractually repayable on demand unless a fixed term has been agreed, in practice customers will from time to time make deposi tsinto the account, thereby reducing indebtedness or increasing a credit balance in accordance with their business requirements.Borrowing limits on the overdraft facility are established, and full repayment is required only if the customer fails to honour theconditions on which the limit was granted or his financial position has so deteriorated that it is necessary to take protective action.Overdraft facilities are usually reviewed at least annually. Interest is generally calculated on the daily outstanding balance byreference to the BankÕs base rate and is typically charged monthly. Overdrafts accounted for approximately 10.8% of the BankÕstotal domestic loan portfolio at September 30, 1999 and 12% at September 30, 1998.
Analysis of Loans to Customers by Geographical Area and Type of Customer
The following table analyses loans (including instalment credit and finance lease receivables) by geographical area and typeof customer at September 30 for each of the five years ended September 30, 1999. The domestic categories of customer are based onthe asset classification requirements of the Bank of England.
SeptemberÊ301999 1998 1997 1996 1995£m £m £m £m £m
Domestic:Central and local government............................. 150 78 116 90 112Manufacturing................................................. 2,715 2,075 1,739 1,732 1,682Construction ................................................... 648 543 404 530 471Finance.......................................................... 2,891 2,197 3,100 3,173 3,231Service industries............................................. 5,585 4,968 4,660 3,374 3,296Agriculture, forestry and fishing ......................... 673 643 613 493 473Property......................................................... 3,668 2,935 2,617 1,525 1,263Business and other services................................ 2,477 2,011 2,140 2,715 2,384Individuals - home mortgages........................... 9,544 8,317 7,371 6,532 6,201
- other.......................................... 6,283 4,550 3,530 2,713 2,319Instalment credit and other loans......................... 1,059 900 856 630 660Finance leases ................................................. 2,555 2,587 2,569 2,333 1,623
Total domestic loans ...................................... 38,248 31,804 29,715 25,840 23,715
Foreign:Foreign Ð UK based ......................................... 2,799 2,248 1,880 1,403 1,178Continental Europe .......................................... 1,046 484 426 408 350United States .................................................. 6,807 5,811 6,063 5,416 3,942Rest of the World............................................. 1,177 1,303 981 853 572
Total foreign loans ........................................ 11,829 9,846 9,350 8,080 6,042
Total loans ................................................... 50,077 41,650 39,065 33,920 29,757 Less allowance for loan losses ......................... (737 ) (633 ) (459 ) (474 ) (540 )
Loans to customers (net of provisions) ................. 49,340 41,017 38,606 33,446 29,217
Analysis of foreign loans by type of borrower:
Governments and official institutions................... 225 179 24 125 99Other financial institutions................................. 47 78 79 93 31Commercial and industrial................................. 7,692 5,834 4,873 3,895 2,943Other............................................................. 3,865 3,755 4,374 3,967 2,969
Total foreign loans ........................................ 11,829 9,846 9,350 8,080 6,042
For further information regarding the GroupÕs operations by geographical area, see Note 50 to the Consolidated FinancialStatements.
11
Lending Concentrations
One of the principal factors influencing the quality of the GroupÕs earnings is the diversification of its loan portfolio bygeographical area within the UK, by industry classification and by individual customer. The spread of the GroupÕs assets reducesconcentration of risk.
The Bank has a widely spread UK lending base through 634 branches servicing a broad range of corporate and personalcustomers. With the exception of lending to the service industries sector and to individuals in the UK, there were no loanconcentrations to any individual sector or industry which exceeded 10% of total loans to customers (before provisions). Instalmentcredit loans and direct finance leases are largely conducted through the consumer and industrial finance business of RoyScot Trustand Royal Bank Leasing
At September 30, 1999, loans to customers by CFG totalled $10.9 billion and comprised residential mortgages of $2.1billion, commercial mortgages of $2.2 billion, commercial loans of $2.6 billion, consumer loans of $3.3 billion and other loans andleases of $0.7 billion.
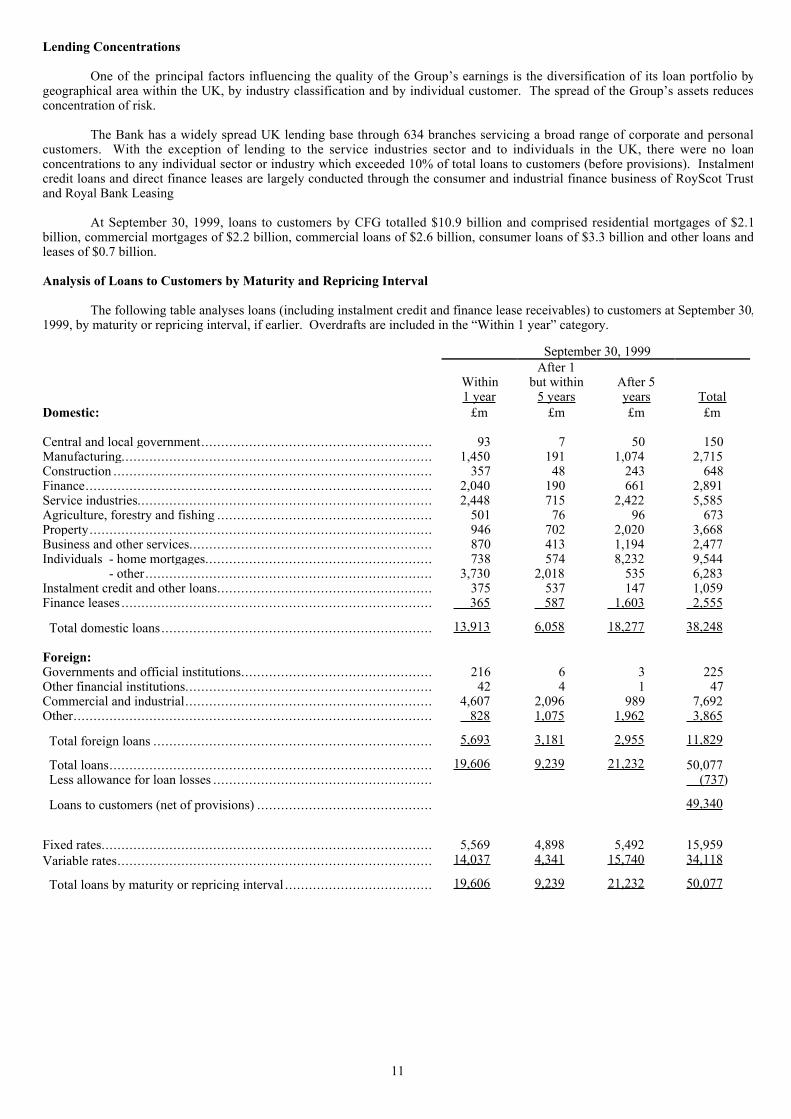
Analysis of Loans to Customers by Maturity and Repricing Interval
The following table analyses loans (including instalment credit and finance lease receivables) to customers at September 30,1999, by maturity or repricing interval, if earlier. Overdrafts are included in the ÒWithin 1 yearÓ category.
SeptemberÊ30, 1999After 1
Within but within After 51Êyear 5Êyears years Total
Domestic: £m £m £m £m
Central and local government.......................................................... 93 7 50 150Manufacturing.............................................................................. 1,450 191 1,074 2,715Construction ................................................................................ 357 48 243 648Finance....................................................................................... 2,040 190 661 2,891Service industries.......................................................................... 2,448 715 2,422 5,585Agriculture, forestry and fishing ...................................................... 501 76 96 673Property...................................................................................... 946 702 2,020 3,668Business and other services............................................................. 870 413 1,194 2,477Individuals - home mortgages......................................................... 738 574 8,232 9,544
- other........................................................................ 3,730 2,018 535 6,283Instalment credit and other loans...................................................... 375 537 147 1,059Finance leases .............................................................................. 365 587 1,603 2,555
Total domestic loans.................................................................... 13,913 6,058 18,277 38,248
Foreign:Governments and official institutions................................................ 216 6 3 225Other financial institutions.............................................................. 42 4 1 47Commercial and industrial.............................................................. 4,607 2,096 989 7,692Other.......................................................................................... 828 1,075 1,962 3,865
Total foreign loans ...................................................................... 5,693 3,181 2,955 11,829
Total loans................................................................................. 19,606 9,239 21,232 50,077 Less allowance for loan losses ....................................................... (737 )
Loans to customers (net of provisions) ............................................ 49,340
Fixed rates................................................................................... 5,569 4,898 5,492 15,959Variable rates............................................................................... 14,037 4,341 15,740 34,118
Total loans by maturity or repricing interval ..................................... 19,606 9,239 21,232 50,077
12
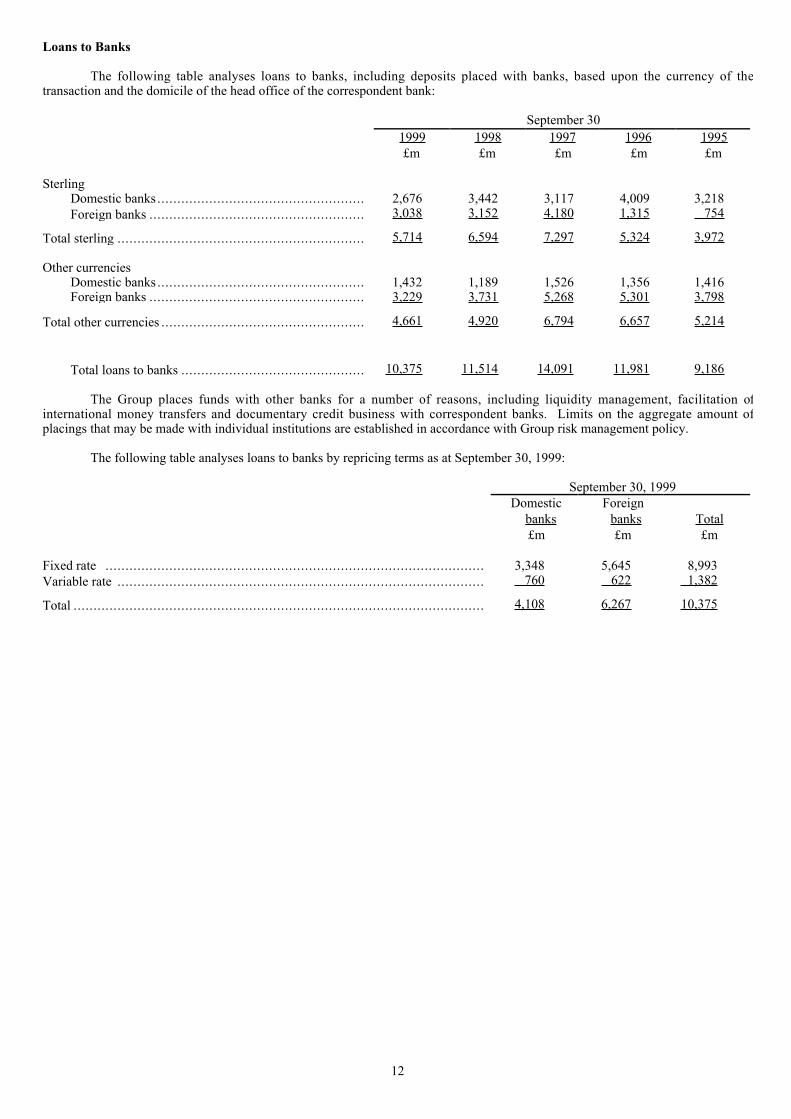
Loans to Banks
The following table analyses loans to banks, including deposits placed with banks, based upon the currency of thetransaction and the domicile of the head office of the correspondent bank:
SeptemberÊ301999 1998 1997 1996 1995 £m £m £m £m £m
SterlingDomestic banks .................................................... 2,676 3,442 3,117 4,009 3,218Foreign banks ...................................................... 3,038 3,152 4,180 1,315 754
Total sterling .............................................................. 5,714 6,594 7,297 5,324 3,972
Other currenciesDomestic banks .................................................... 1,432 1,189 1,526 1,356 1,416
Foreign banks ...................................................... 3,229 3,731 5,268 5,301 3,798
Total other currencies ................................................... 4,661 4,920 6,794 6,657 5,214
Total loans to banks .............................................. 10,375 11,514 14,091 11,981 9,186
The Group places funds with other banks for a number of reasons, including liquidity management, facilitation ofinternational money transfers and documentary credit business with correspondent banks. Limits on the aggregate amount ofplacings that may be made with individual institutions are established in accordance with Group risk management policy.
The following table analyses loans to banks by repricing terms as at September 30, 1999:
September 30, 1999Domestic Foreign
banks banks Total£m £m £m
Fixed rate ............................................................................................... 3,348 5,645 8,993Variable rate ............................................................................................ 760 622 1,382
Total ....................................................................................................... 4,108 6,267 10,375

13
Cross-Border Outstandings
Cross-border outstandings consist of loans to banks and customers, instalment credit and finance lease receivables,acceptances and other monetary assets, including non-local currency claims of overseas offices on local residents. The Groupmonitors the geographical breakdown of outstandings based on the country of domicile of the borrower or guarantor of ultimate risk.CFG has no material amount of cross-border outstandings.
Cross-Border Outstandings in Excess of 1% of Total Assets
The following table identifies countries where the GroupÕs cross-border outstandings to borrowers exceeded 1% of totalassets and acceptances:
Banks Commercial,As % of and other Governments industrial and
total financial and official other privateassets (1) Total institutions institutions sector
% £m £m £m £mSeptember 30, 1999United States .............................................. 3.8 3,452 1,482 264 1,706Germany.................................................... 3.5 3,135 2,880 39 216France ....................................................... 1.9 1,722 1,567 37 118
September 30, 1998Germany.................................................... 3.5 2,810 2,679 - 131United States .............................................. 3.1 2,481 675 145 1,661France ....................................................... 2.5 2,022 1,932 - 90Japan......................................................... 1.3 1,043 999 - 44Spain......................................................... 1.2 1,001 832 46 123
September 30, 1997United States .............................................. 4.3 3,139 1,363 410 1,366France ....................................................... 2.5 1,863 1,766 - 97Japan......................................................... 1.5 1,135 1,100 - 35Belgium..................................................... 1.4 1,056 1,050 - 6Germany ................................................... 1.1 796 717 - 79
NOTE
(1) Assets comprise total assets, as reported in the Consolidated Balance Sheet, and acceptances, which together totalled£89,746 million at September 30, 1999 (September 30, 1998 - £80,700 million, September 30, 1997 - £73,464 million).
Cross-Border Outstandings Between 0.75% and 1% of Total Assets
At September 30, 1999, cross-border outstandings totalling £2,434 million to borrowers in Belgium, Canada and Spaineach amounted to between 0.75% and 1% of total assets.
At September 30, 1998, cross-border outstandings totalling £2,608 million to borrowers in Canada, Belgium, theNetherlands and Italy each amounted to between 0.75% and 1% of total assets.
At September 30, 1997, cross-border outstandings totalling £1,327 million to borrowers in the Netherlands and Italy eachamounted to between 0.75% and 1% of total assets.
14
Provision and Allowance for Loan Losses
Provisioning Policy
Within the Bank and those of its subsidiaries engaged in banking (excluding CFG - see below), loan officers regularlyreview the quality of loans for which they are responsible. Specific provisions are made against loans when, as a result of a detailedappraisal of the loan portfolio, it is considered that recovery is doubtful, which depends in each case on the individual circumstancesof the loan, including, among other things, the adequacy of any collateral securing the loan. Provisions made during a year (lessamounts released and recoveries of amounts charged-off in previous years) are charged against income. Interest receivable ondoubtful loans is brought into the Consolidated Statement of Income as it accrues only so long as its collectibility is not subject tosignificant doubt. Loans classified as bad debts are charged-off to their estimated net realisable value when there is no realisticprospect of recovery.
In addition, general provisions are maintained at levels considered appropriate by management to cover losses from loanswhich have not been separately identified but are known from experience to be present in any portfolio of bank loans. Reviews ofthe level of general provisions are conducted throughout the year. A factor in establishing the level of general provisions is thescope and detail of the specific provisioning procedures in place at the time of the review.
There are differences between the provisioning policies of banks in the UK and the United States. In the UK loans andrelated accrued interest are charged-off only when, as a matter of banking judgement, there is no realistic prospect of recovery.When management determines that a charge-off is appropriate, the principal amount and accrued interest on the obligation arewritten down to estimated net realisable value. Interest receivable on loans is recognised as income as it accrues provided that itscollectibility is not subject to significant doubt. In contrast, banks in the United States (including CFGÕs bank subsidiaries) typicallystop accruing interest when loans become overdue by 90 days and recovery is doubtful, and charge-off loans more rapidly. Thecumulative effect of the GroupÕs policies is to increase the relative size of the GroupÕs loan portfolio and the allowance for loanlosses compared with those of US banks, which has the effect of increasing the GroupÕs loan loss allowance ratios compared withthose which would result from the application of US bank provisioning policies. The GroupÕs policies do not, however, result in asignificant adjustment to the GroupÕs net income, shareholdersÕ funds and total assets for restatement under US GAAP. See Note 52to the Consolidated Financial Statements.
CFG
Loan officers in CFG evaluate the adequacy of the allowance for possible credit losses by performing reviews of certainindividual loans and leases, analysing changes in the composition and size of the portfolio, reviewing previous loss experience andconsidering current and anticipated economic factors. The allowance is established through charges to earnings in the form of aprovision for credit losses and is maintained at a level which management considers adequate based on the results of this evaluation.Amounts determined to be uncollectable are deducted from the allowance and subsequent recoveries, if any, are added to theallowance.
Non-performing loans and leases consist of (a) non-accrual loans and leases and (b) accruing loans which are contractuallypast due 90 days or more. Loans and leases are generally placed on non-accrual when 90 days or more past due, or earlier whenmanagement deems the probability of collection to be insufficient to warrant further accrual. Certain loans, primarily consumercredits, remain on accrual when contractually past due 90 days or more if considered by management to be collectible.
15
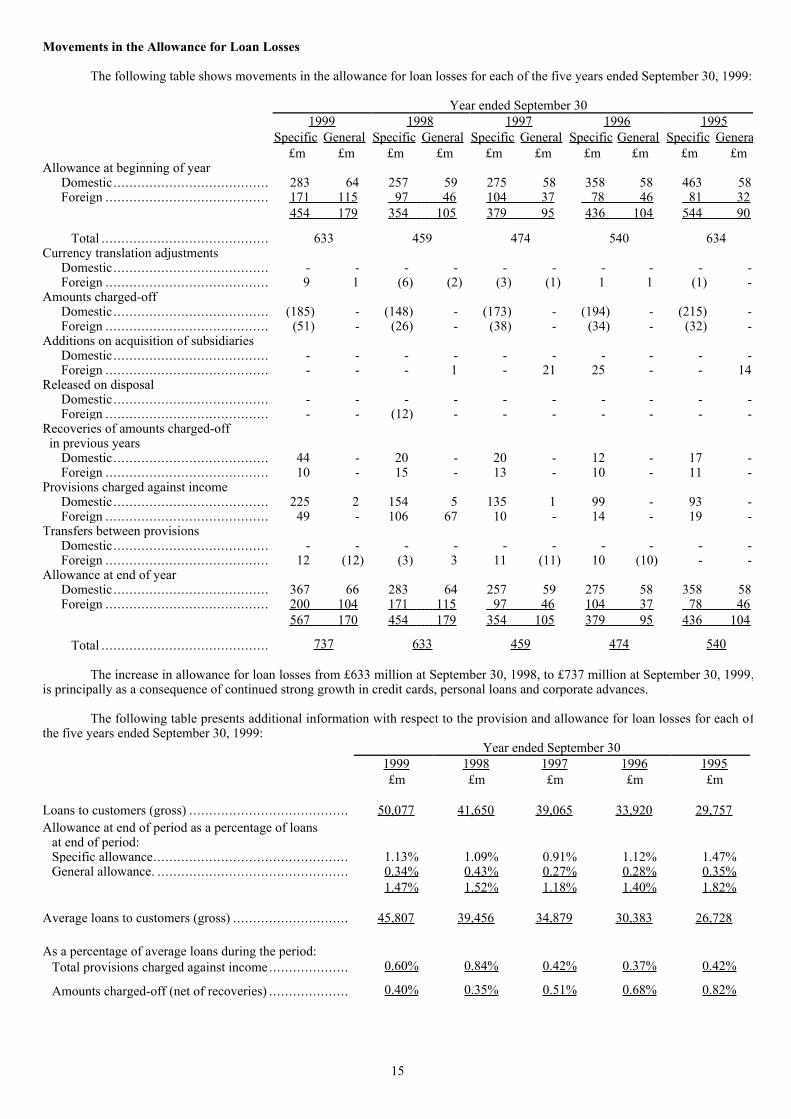
Movements in the Allowance for Loan Losses
The following table shows movements in the allowance for loan losses for each of the five years ended September 30, 1999:
YearÊendedÊSeptemberÊ301999 1998 1997 1996 1995
Specific General Specific General Specific General Specific General Specific Genera£m £m £m £m £m £m £m £m £m £m
Allowance at beginning of yearDomestic....................................... 283 64 257 59 275 58 358 58 463 58Foreign ......................................... 171 115 97 46 104 37 78 46 81 32
454 179 354 105 379 95 436 104 544 90
Total .......................................... 633 459 474 540 634Currency translation adjustments
Domestic....................................... - - - - - - - - - -Foreign ......................................... 9 1 (6) (2) (3) (1) 1 1 (1) -
Amounts charged-offDomestic....................................... (185) - (148) - (173) - (194) - (215) -Foreign ......................................... (51) - (26) - (38) - (34) - (32) -
Additions on acquisition of subsidiariesDomestic....................................... - - - - - - - - - -Foreign ......................................... - - - 1 - 21 25 - - 14
Released on disposalDomestic....................................... - - - - - - - - - -Foreign ......................................... - - (12) - - - - - - -
Recoveries of amounts charged-off in previous years
Domestic....................................... 44 - 20 - 20 - 12 - 17 -Foreign ......................................... 10 - 15 - 13 - 10 - 11 -
Provisions charged against incomeDomestic....................................... 225 2 154 5 135 1 99 - 93 -Foreign ......................................... 49 - 106 67 10 - 14 - 19 -
Transfers between provisionsDomestic....................................... - - - - - - - - - -Foreign ......................................... 12 (12) (3) 3 11 (11) 10 (10) - -
Allowance at end of yearDomestic....................................... 367 66 283 64 257 59 275 58 358 58Foreign ......................................... 200 104 171 115 97 46 104 37 78 46
567 170 454 179 354 105 379 95 436 104
Total .......................................... 737 633 459 474 540
The increase in allowance for loan losses from £633 million at September 30, 1998, to £737 million at September 30, 1999,is principally as a consequence of continued strong growth in credit cards, personal loans and corporate advances.
The following table presents additional information with respect to the provision and allowance for loan losses for each ofthe five years ended September 30, 1999:
YearÊendedÊSeptemberÊ301999 1998 1997 1996 1995 £m £m £m £m £m
Loans to customers (gross) ........................................ 50,077 41,650 39,065 33,920 29,757Allowance at end of period as a percentage of loans
at end of period:Specific allowance................................................. 1.13% 1.09% 0.91% 1.12% 1.47%General allowance. ................................................ 0.34% 0.43% 0.27% 0.28% 0.35%
1.47% 1.52% 1.18% 1.40% 1.82%
Average loans to customers (gross) ............................. 45,807 39,456 34,879 30,383 26,728
As a percentage of average loans during the period:Total provisions charged against income.................... 0.60% 0.84% 0.42% 0.37% 0.42%
Amounts charged-off (net of recoveries) .................... 0.40% 0.35% 0.51% 0.68% 0.82%

16
Charge-offs and Recoveries
The following table shows amounts charged-off for each of the five years ended September 30, 1999:
Charge-offs YearÊendedÊSeptemberÊ301999 1998 1997 1996 1995 £m £m £m £m £m
Domestic:Manufacturing........................................................ 4 11 5 10 10Construction .......................................................... 5 5 11 10 9Finance ................................................................. 1 2 1 7 4Service industries.................................................... 22 35 58 56 51Agriculture, forestry and fishing................................. 1 2 1 3 2Property ................................................................ 4 4 7 12 18Business and other services....................................... 16 6 21 23 31Individuals - home mortgages ................................... 9 5 3 4 1 - others.................................................. 117 74 63 63 71Finance leases and instalment credit............................ 6 4 3 6 18
Total domestic............................................... 185 148 173 194 215Foreign .................................................................... 51Ê 26 38 34 32
Total charge-offs ........................................... 236 174 211 228 247
Charge-offs increased from £174 million in the year ended September 30, 1998 to £236 million in the current year. Theincrease in ÔIndividuals Ð othersÕ was due to the increase in credit card lending. This increase was partly offset by a decrease of £13million in Service industries.
The following table shows recoveries of amounts charged-off in previous years for each of the five years ended September30, 1999:
Recoveries YearÊendedÊSeptemberÊ301999 1998 1997 1996 1995 £m £m £m £m £m
Domestic:Manufacturing........................................................ 2 1 1 - -Construction .......................................................... 1 3 3 - -Finance ................................................................. 8 1 1 - -Service industries.................................................... 4 5 8 5 7Property ................................................................ - 1 1 1 4Business and other services ....................................... - 1 - - -Individuals - home mortgages ................................... 1 - - - -
- others ................................................ 28 8 6 6 6
Total domestic............................................... 44 20 20 12 17
Foreign .................................................................... 10 15 13 10 11
Total recoveries ............................................. 54 35 33 22 28
For a discussion of the factors considered in determining the amount of the provision for loan losses, see ÒProvision forLoan LossesÓ on page 53.
17
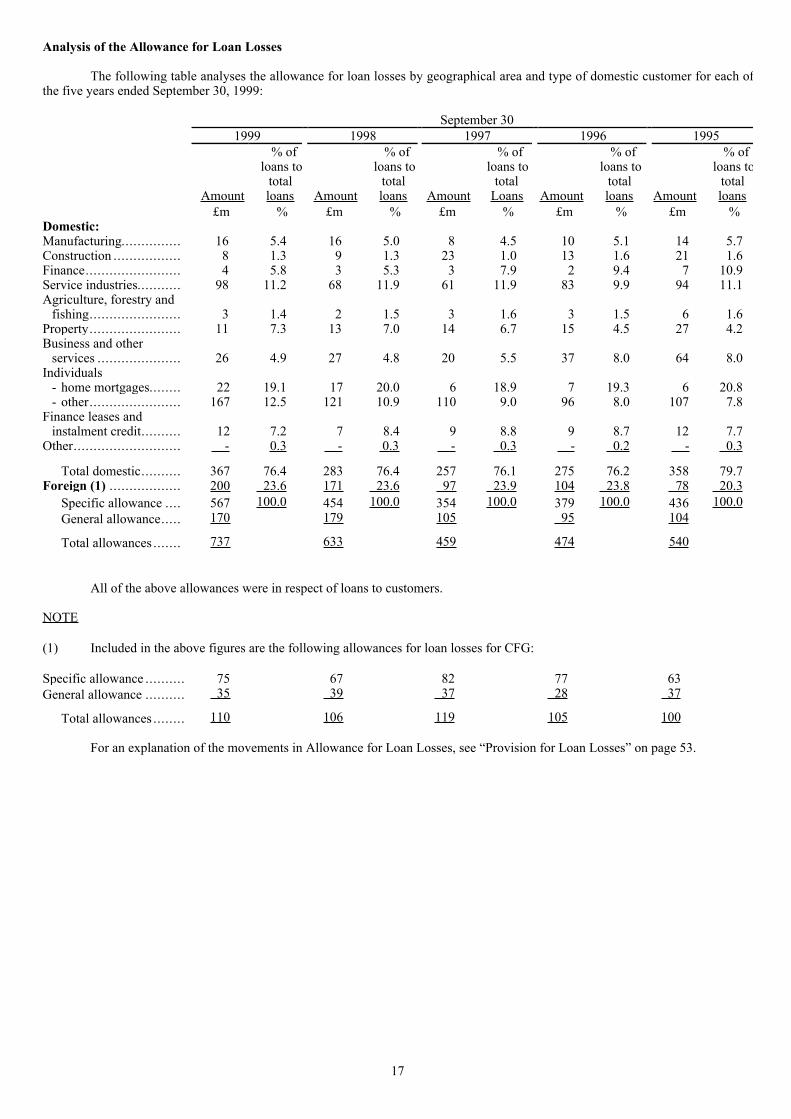
Analysis of the Allowance for Loan Losses
The following table analyses the allowance for loan losses by geographical area and type of domestic customer for each ofthe five years ended September 30, 1999:
September 301999 1998 1997 1996 1995
% of % of % of % of % ofloans to loans to loans to loans to loans to
total total total total totalAmount loans Amount loans Amount Loans Amount loans Amount loans
£m % £m % £m % £m % £m %Domestic:Manufacturing............... 16 5.4 16 5.0 8 4.5 10 5.1 14 5.7Construction ................. 8 1.3 9 1.3 23 1.0 13 1.6 21 1.6Finance........................ 4 5.8 3 5.3 3 7.9 2 9.4 7 10.9Service industries........... 98 11.2 68 11.9 61 11.9 83 9.9 94 11.1Agriculture, forestry and
fishing....................... 3 1.4 2 1.5 3 1.6 3 1.5 6 1.6Property....................... 11 7.3 13 7.0 14 6.7 15 4.5 27 4.2Business and other
services ..................... 26 4.9 27 4.8 20 5.5 37 8.0 64 8.0Individuals
- home mortgages........ 22 19.1 17 20.0 6 18.9 7 19.3 6 20.8- other....................... 167 12.5 121 10.9 110 9.0 96 8.0 107 7.8
Finance leases andinstalment credit.......... 12 7.2 7 8.4 9 8.8 9 8.7 12 7.7
Other........................... - 0.3 - 0.3 - 0.3 - 0.2 - 0.3
Total domestic.......... 367 76.4 283 76.4 257 76.1 275 76.2 358 79.7Foreign (1) .................. 200 Ê23.6 171 23.6 97 23.9 104 23.8 78 20.3
Specific allowance .... 567 100.0 454 100.0 354 100.0 379 100.0 436 100.0General allowance..... 170 179 105 95 104
Total allowances ....... 737 633 459 474 540
All of the above allowances were in respect of loans to customers.
NOTE
(1) Included in the above figures are the following allowances for loan losses for CFG:
Specific allowance .......... 75 67 82 77 63General allowance .......... 35 39 37 28 37
Total allowances ........ 110 106 119 105 100
For an explanation of the movements in Allowance for Loan Losses, see ÒProvision for Loan LossesÓ on page 53.
18
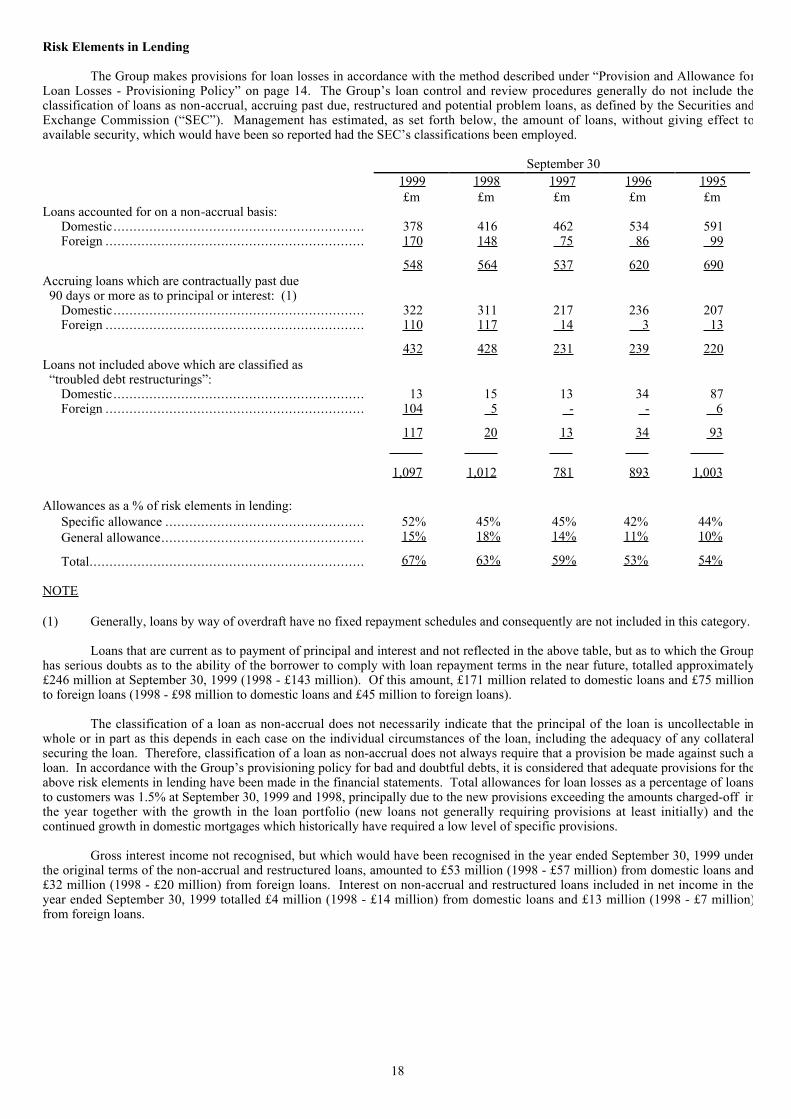
Risk Elements in Lending
The Group makes provisions for loan losses in accordance with the method described under ÒProvision and Allowance forLoan Losses - Provisioning PolicyÓ on page 14. The GroupÕs loan control and review procedures generally do not include theclassification of loans as non-accrual, accruing past due, restructured and potential problem loans, as defined by the Securities andExchange Commission (ÒSECÓ). Management has estimated, as set forth below, the amount of loans, without giving effect toavailable security, which would have been so reported had the SECÕs classifications been employed.
SeptemberÊ301999 1998 1997 1996 1995 £m £m £m £m £m
Loans accounted for on a non-accrual basis:Domestic............................................................... 378 416 462 534 591Foreign ................................................................. 170 148 75 86 99
548 564 537 620 690Accruing loans which are contractually past due 90 days or more as to principal or interest: (1)
Domestic............................................................... 322 311 217 236 207Foreign ................................................................. 110 117 14 3 13
432 428 231 239 220Loans not included above which are classified as Òtroubled debt restructuringsÓ:
Domestic............................................................... 13 15 13 34 87Foreign ................................................................. 104 5 - - 6
117 20 13 34 93ÊÊÊÊÊÊÊÊÊÊ ÊÊÊÊÊÊÊÊÊÊ ÊÊÊÊÊÊÊ ÊÊÊÊÊÊÊ ÊÊÊÊÊÊÊÊÊÊ
1,097 1,012 781 893 1,003
Allowances as a % of risk elements in lending:Specific allowance .................................................. 52% 45% 45% 42% 44%General allowance................................................... 15% 18% 14% 11% 10%
Total..................................................................... 67% 63% 59% 53% 54%
NOTE
(1) Generally, loans by way of overdraft have no fixed repayment schedules and consequently are not included in this category.
Loans that are current as to payment of principal and interest and not reflected in the above table, but as to which the Grouphas serious doubts as to the ability of the borrower to comply with loan repayment terms in the near future, totalled approximately£246 million at September 30, 1999 (1998 - £143 million). Of this amount, £171 million related to domestic loans and £75 millionto foreign loans (1998 - £98 million to domestic loans and £45 million to foreign loans).
The classification of a loan as non-accrual does not necessarily indicate that the principal of the loan is uncollectable inwhole or in part as this depends in each case on the individual circumstances of the loan, including the adequacy of any collateralsecuring the loan. Therefore, classification of a loan as non-accrual does not always require that a provision be made against such aloan. In accordance with the GroupÕs provisioning policy for bad and doubtful debts, it is considered that adequate provisions for theabove risk elements in lending have been made in the financial statements. Total allowances for loan losses as a percentage of loansto customers was 1.5% at September 30, 1999 and 1998, principally due to the new provisions exceeding the amounts charged-off inthe year together with the growth in the loan portfolio (new loans not generally requiring provisions at least initially) and thecontinued growth in domestic mortgages which historically have required a low level of specific provisions.
Gross interest income not recognised, but which would have been recognised in the year ended September 30, 1999 underthe original terms of the non-accrual and restructured loans, amounted to £53 million (1998 - £57 million) from domestic loans and£32 million (1998 - £20 million) from foreign loans. Interest on non-accrual and restructured loans included in net income in theyear ended September 30, 1999 totalled £4 million (1998 - £14 million) from domestic loans and £13 million (1998 - £7 million)from foreign loans.
19
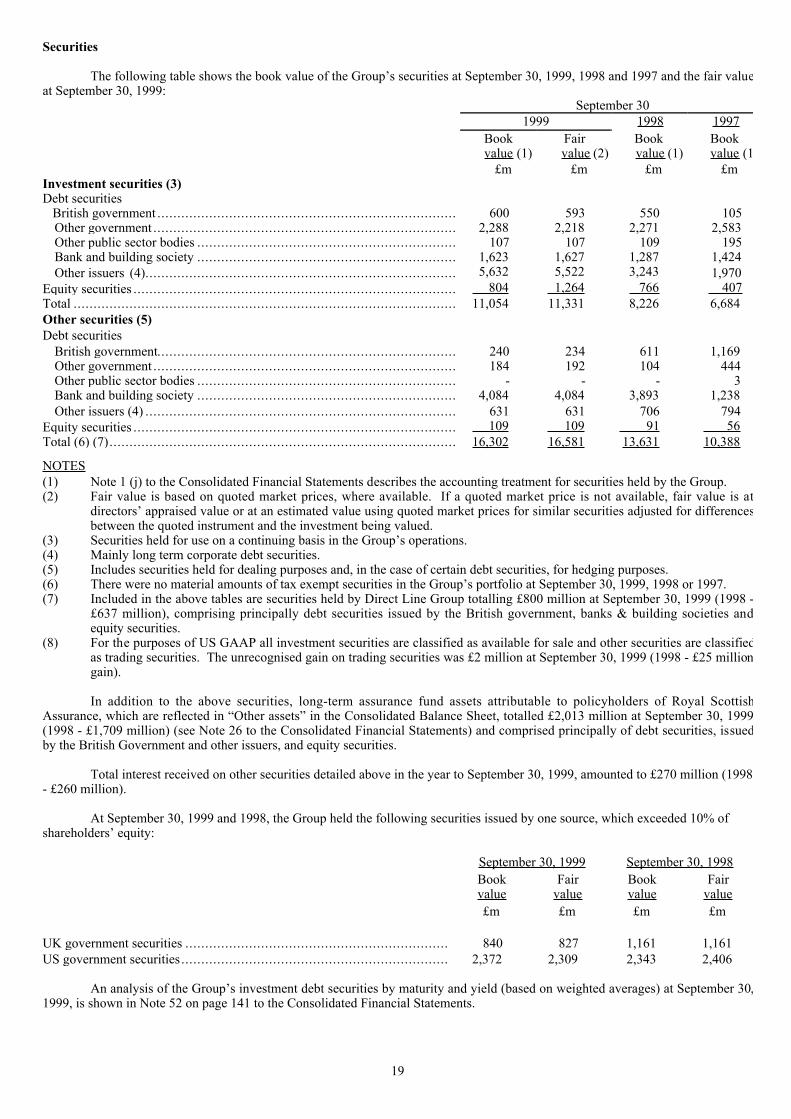
Securities
The following table shows the book value of the GroupÕs securities at September 30, 1999, 1998 and 1997 and the fair valueat September 30, 1999:
SeptemberÊ301999 1998 1997
Book Fair Book Bookvalue (1) value (2) value (1) value (1
£m £m £m £mInvestment securities (3)Debt securities British government ........................................................................... 600 593 550 105
Other government ............................................................................ 2,288 2,218 2,271 2,583Other public sector bodies ................................................................. 107 107 109 195Bank and building society ................................................................. 1,623 1,627 1,287 1,424Other issuers (4).............................................................................. 5,632 5,522 3,243 1,970
Equity securities ................................................................................. 804 1,264 766 407Total ................................................................................................ 11,054 11,331 8,226 6,684Other securities (5)Debt securities British government........................................................................... 240 234 611 1,169
Other government ............................................................................ 184 192 104 444Other public sector bodies ................................................................. - - - 3Bank and building society ................................................................. 4,084 4,084 3,893 1,238Other issuers (4) .............................................................................. 631 631 706 794
Equity securities ................................................................................. 109 109 91 56Total (6) (7)....................................................................................... 16,302 16,581 13,631 10,388
NOTES(1) Note 1 (j) to the Consolidated Financial Statements describes the accounting treatment for securities held by the Group.(2) Fair value is based on quoted market prices, where available. If a quoted market price is not available, fair value is at
directorsÕ appraised value or at an estimated value using quoted market prices for similar securities adjusted for differencesbetween the quoted instrument and the investment being valued.
(3) Securities held for use on a continuing basis in the GroupÕs operations.(4) Mainly long term corporate debt securities.(5) Includes securities held for dealing purposes and, in the case of certain debt securities, for hedging purposes.(6) There were no material amounts of tax exempt securities in the GroupÕs portfolio at September 30, 1999, 1998 or 1997.(7) Included in the above tables are securities held by Direct Line Group totalling £800 million at September 30, 1999 (1998 -
£637 million), comprising principally debt securities issued by the British government, banks & building societies andequity securities.
(8) For the purposes of US GAAP all investment securities are classified as available for sale and other securities are classifiedas trading securities. The unrecognised gain on trading securities was £2 million at September 30, 1999 (1998 - £25 milliongain).
In addition to the above securities, long-term assurance fund assets attributable to policyholders of Royal ScottishAssurance, which are reflected in ÒOther assetsÓ in the Consolidated Balance Sheet, totalled £2,013 million at September 30, 1999(1998 - £1,709 million) (see Note 26 to the Consolidated Financial Statements) and comprised principally of debt securities, issuedby the British Government and other issuers, and equity securities.
Total interest received on other securities detailed above in the year to September 30, 1999, amounted to £270 million (1998- £260 million).
At September 30, 1999 and 1998, the Group held the following securities issued by one source, which exceeded 10% ofshareholdersÕ equity:
September 30, 1999 September 30, 1998Book Fair Book Fairvalue value value value£m £m £m £m
UK government securities .................................................................. 840 827 1,161 1,161US government securities................................................................... 2,372 2,309 2,343 2,406
An analysis of the GroupÕs investment debt securities by maturity and yield (based on weighted averages) at September 30,1999, is shown in Note 52 on page 141 to the Consolidated Financial Statements.

20
Liabilities
Deposits
A substantial portion of the GroupÕs assets are funded by deposits, principally current accounts and various types of interestbearing deposit accounts, collected through the BankÕs UK branch network, CFG and RBSI. The remainder of the assets of theBank, CFG and RBSI are funded by wholesale deposits, debt securities in issue, loan capital and shareholdersÕ equity.
At September 30, 1999, 1998 and 1997, approximately 8.9%, 11% and 14.4% respectively, of domestic deposits were innon-interest bearing current accounts. At September 30, 1999, 1998 and 1997, approximately 57.8%, 56.0% and 52.4% respectively,of domestic deposits were interest bearing deposits repayable on demand. Interest bearing demand deposits are current accountswith credit balances and retail deposits repayable on demand, obtained primarily through the BankÕs UK branch networks, andwholesale deposits repayable on demand, booked mainly within the BankÕs treasury operation. Interest rates applicable to suchdeposits are generally calculated on the basis of a margin under the BankÕs base rate. Deposits in currencies other than sterling arecollected principally by Corporate and Institutional Banking, CFG and RBSI. The former raises most of its deposits through thewholesale markets whereas CFGÕs and RBSIÕs deposits are principally demand and savings deposits.
Savings deposits are specific products which are designed to attract larger savings from personal customers who do notrequire withdrawals on demand and therefore in general offer better rates of return than interest bearing demand deposits. AtSeptember 30, 1999, 1998 and 1997, approximately 7.5%, 10.0% and 8.7% respectively, of the BankÕs domestic deposits were insavings deposits.
Other time deposits are collected centrally from the money market to bridge the gap between retail resources and sterlingassets. Chief sources of wholesale deposits are the inter-bank market, corporations and non-bank financial institutions which placefunds on the inter-bank market, and issuance of certificates of deposit and medium term notes. All are priced in relation to moneymarket rates. Rate considerations and the ability to provide funds in the maturity periods required by the Bank to fulfil its liquiditymanagement objectives affect the choice of instrument. Customers are offered rates related to inter-bank market rates for the term ofthe deposit depending on the amounts and term. Larger deposits (typically £1 million and over) earn the money market rates paid inthe inter-bank market, and smaller amounts earn progressively wider spreads under the money market rate. Rates are centrallycommunicated throughout the Bank by the BankÕs central treasury operation. While competitive rates influence the quantity ofdeposits obtained through the branch network, the branch network enables a wide variety of local depositor sources to be accessed.
Analysis of Deposits
The following table shows the distribution of deposits by banks and customer accounts by sterling and other currencies atSeptember 30, 1999, 1998 and 1997:
SeptemberÊ301999 1998 1997£m £m £m
Deposits by banks Sterling .................................................................................................. 3,347 1,958 1,217 Other currencies....................................................................................... 3,071 2,479 4,178
Total deposits by banks........................................................................... 6,418 4,437 5,395
Customer accounts Sterling .................................................................................................. 36,663 33,785 30,827 Other currencies (1).................................................................................. 18,517 16,900 16,755
Total customer accounts......................................................................... 55,180 50,685 47,582
Total deposits....................................................................................... 61,598 55,122 52,977
NOTE
(1) Includes non-sterling deposits in CFG of £8,919 million at September 30, 1999 (1998 - £8,065 million, 1997 - £8,300 million).

21
Average Deposits and Average Interest Rates
The following table shows details of the GroupÕs average deposits in each of the past three years:
Year ended SeptemberÊ30ÊÊÊÊÊÊÊÊÊÊÊÊÊÊ1999ÊÊÊÊÊÊÊÊÊÊÊÊÊ ÊÊÊÊÊÊÊÊÊÊÊÊÊÊ1998ÊÊÊÊÊÊÊÊÊÊÊÊÊ ÊÊÊÊÊÊÊÊÊÊÊÊÊÊ1997ÊÊÊÊÊÊÊÊÊÊÊÊÊAverage Average Average Average Average Averagebalance rate balance rate balance rate
£m % £m % £m %Domestic offices Interest free demand ................................. 1,899 - 1,920 - 1,858 - Deposits by banks .................................... 5,344 5.4 4,144 6.6 3,935 5.8 Customer accounts Demand................................................ 20,370 3.8 18,912 5.2 16,156 4.3 Savings ................................................ 8,783 4.9 4,136 6.0 2,819 5.0 Other time............................................. 10,622 5.8 12,265 7.2 10,769 6.1
Total domestic office deposits ................. 47,018 4.9 41,377 5.8 35,537 4.8
Foreign offices Interest free demand ................................. 1,111 - 957 - 858 - Deposits by banks .................................... 1,038 4.6 1,289 5.7 1,583 5.4 Customer accounts Demand................................................ 995 1.6 2,131 5.1 1,840 3.8 Savings ................................................ 6,441 4.0 6,253 4.1 5,963 4.4 Other time............................................. 1,272 5.1 348 5.0 327 4.9
Total foreign office deposits ................... 10,857 3.6 10,978 4.2 10,571 4.1
Total average deposits ........................... 57,875 4.3 52,355 5.4 46,108 4.7
Certificates of Deposit and Other Time Deposits
The following table shows details of the GroupÕs certificates of deposit issued and other time deposits over £50,000 (or theequivalent of $100,000 for currencies other than sterling) by time remaining until maturity:
SeptemberÊ30,Ê1999Over 3 but Over 6 but
Within within 6 within 12 Over 123Êmonths months months months Total
£m £m £m £m £mUK based companies and branches
Certificates of deposit .................................. 2,798 811 367 65 4,041Other time deposits...................................... 14,639 1,061 173 601 16,474
Overseas based companies and branchesCertificates of deposit .................................. 516 9 3 - 528Other time deposits...................................... 2,032 293 200 141 2,666
Total ....................................................... 19,985 2,174 743 807 23,709
22
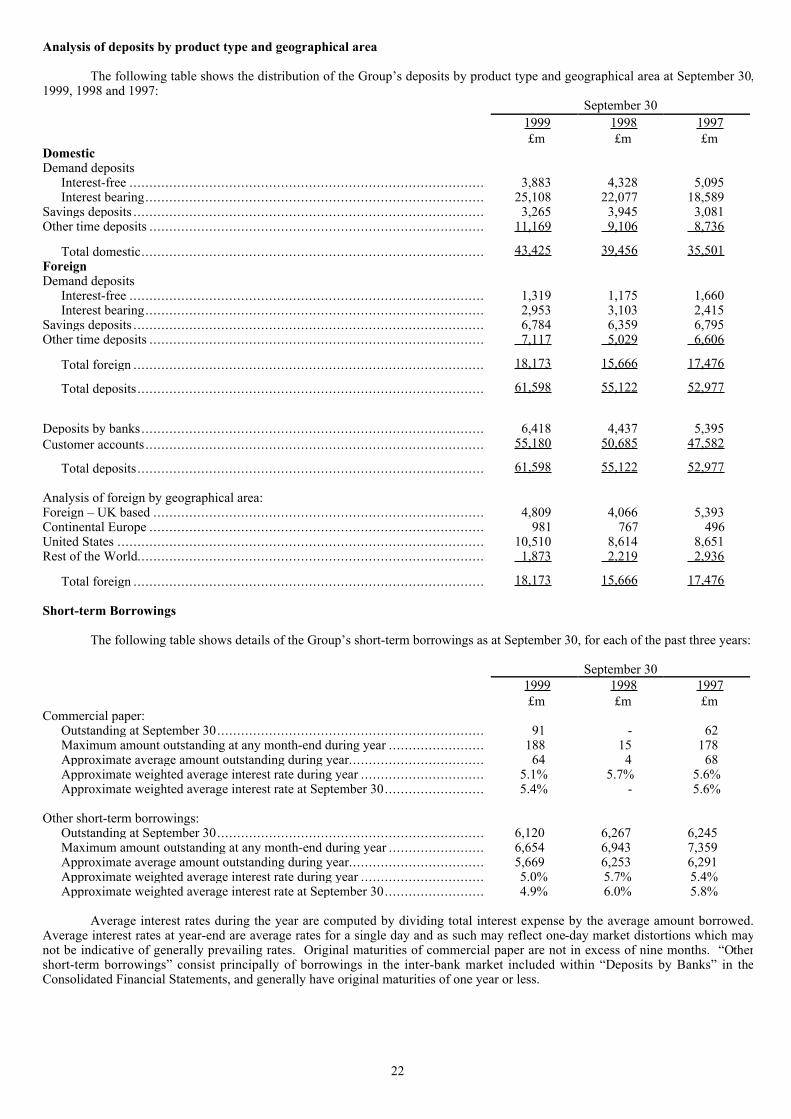
Analysis of deposits by product type and geographical area
The following table shows the distribution of the GroupÕs deposits by product type and geographical area at September 30,1999, 1998 and 1997:
SeptemberÊ301999 1998 1997£m £m £m
DomesticDemand deposits
Interest-free ......................................................................................... 3,883 4,328 5,095Interest bearing..................................................................................... 25,108 22,077 18,589
Savings deposits ........................................................................................ 3,265 3,945 3,081Other time deposits .................................................................................... 11,169 9,106 8,736
Total domestic...................................................................................... 43,425 39,456 35,501ForeignDemand deposits
Interest-free ......................................................................................... 1,319 1,175 1,660Interest bearing..................................................................................... 2,953 3,103 2,415
Savings deposits ........................................................................................ 6,784 6,359 6,795Other time deposits .................................................................................... 7,117 5,029 6,606
Total foreign ........................................................................................ 18,173 15,666 17,476
Total deposits....................................................................................... 61,598 55,122 52,977
Deposits by banks...................................................................................... 6,418 4,437 5,395Customer accounts..................................................................................... 55,180 50,685 47,582
Total deposits....................................................................................... 61,598 55,122 52,977
Analysis of foreign by geographical area:Foreign Ð UK based ................................................................................... 4,809 4,066 5,393Continental Europe .................................................................................... 981 767 496United States ............................................................................................ 10,510 8,614 8,651Rest of the World....................................................................................... 1,873 2,219 2,936
Total foreign ........................................................................................ 18,173 15,666 17,476
Short-term Borrowings
The following table shows details of the GroupÕs short-term borrowings as at September 30, for each of the past three years:
SeptemberÊ301999 1998 1997£m £m £m
Commercial paper:Outstanding at September 30................................................................... 91 - 62Maximum amount outstanding at any month-end during year ........................ 188 15 178Approximate average amount outstanding during year.................................. 64 4 68Approximate weighted average interest rate during year ............................... 5.1% 5.7% 5.6%Approximate weighted average interest rate at September 30......................... 5.4% - 5.6%
Other short-term borrowings:Outstanding at September 30................................................................... 6,120 6,267 6,245Maximum amount outstanding at any month-end during year ........................ 6,654 6,943 7,359Approximate average amount outstanding during year.................................. 5,669 6,253 6,291Approximate weighted average interest rate during year ............................... 5.0% 5.7% 5.4%Approximate weighted average interest rate at September 30......................... 4.9% 6.0% 5.8%
Average interest rates during the year are computed by dividing total interest expense by the average amount borrowed.Average interest rates at year-end are average rates for a single day and as such may reflect one-day market distortions which maynot be indicative of generally prevailing rates. Original maturities of commercial paper are not in excess of nine months. ÒOthershort-term borrowingsÓ consist principally of borrowings in the inter-bank market included within ÒDeposits by BanksÓ in theConsolidated Financial Statements, and generally have original maturities of one year or less.
23
Competition
In the UK, the Bank competes principally with other UK clearing banks, building societies (which are similar to savings andloan associations in the US) and with major international banks represented in London.
In the UK corporate sector, competition continues to increase as capital markets offer more opportunities fordisintermediation and specialist overseas banks compete in niche markets. Large, principally US and European, financial institutionsare also active, offering combined commercial and investment banking capabilities. Angel Trains competes with UK and Europeanleasing companies in the provision of specialist railway rolling stock leasing finance.
In the UK personal sector, competition continues to intensify. As well as existing banks, building societies and otherfinancial institutions, a number of new entrants have been active in the personal sector including major retail groups, life insurancecompanies and supermarkets. Royal Scottish Assurance competes with other life assurance companies in the UK.
In credit cards, new entrants such as specialist US credit card companies have made the market more competitive. Thegrowth of affinity card schemes and the development by retailers of loyalty programmes linked to card usage have further increasedcompetition. In the domestic market, a number of insurance companies, utilities and major retail groups have entered the marketwith very competitive prices.
Royal Bank of Scotland International competes with other UK and international banking groups providing offshorefinancial products.
Direct Line competes with other insurance companies that deal with automobile, household and other general insurancelines, a number of which also offer direct telephone sales. Direct Line operates in an extremely competitive market, particularly inthe automobile lines, and management expects competition to remain intense through 2000.
In the United States, the Bank faces competition in the corporate wholesale banking market, principally from US moneycenter banks and international banks in the US. CFG, through its banking subsidiaries, competes principally in the New Englandretail and mid-corporate banking markets with banks and other financial institutions, including regional banking organisations thatconduct banking activities in more than one state as a result of the continued relaxation of interstate banking restrictions.
In other international markets, the Group faces competition from international banks and the leading banks in thosefinancial markets outside the UK in which the Group conducts business.
The provision of financial services through the internet has gathered pace and is expected to accelerate in the future. In1999, the Group expanded its internet banking services by introducing on-line approval for personal savings and loan accounts andlaunching its internet-based service, Business Banking Direct, to meet the needs of small businesses. In addition, Direct Lineintroduced on-line quote and buy internet facilities for motor, home and motor breakdown insurance.
Monetary Policy
The earnings of the Group are not only affected by general economic conditions, both at home and abroad, but also thepolicies of the UK government. The conduct of monetary policy underwent a profound change in May 1997, with the granting ofoperational independence to the Bank of England in setting short-term interest rates. While the government continues to nominatethe inflation target, it is now the job of the Bank of EnglandÕs Monetary Policy Committee (ÒMPCÓ) to change interest rates toachieve this goal. These arrangements follow a global trend towards Central Bank autonomy and are expected to reduce politicalbias, while promoting stability and credibility. Monetary policies have had a significant impact on the operations of UK banks in thepast and can be expected to continue to do so in future. Similarly, the Group is affected by monetary conditions wherever else in theworld it operates, most notably those in the US. The Group cannot predict with certainty the future impact of such policies onlending and deposit volumes or earnings.
Towards the end of 1998, monetary policy was hastily loosened in response to highly uncertain global financial conditions.Interest rate cuts slowed down during the early part of 1999, with short-term rates falling to 5% by June 1999. An improved globalenvironment combined with a rapid recovery in the domestic economy rekindled concerns about inflation. This turnaround in theoutlook caused the MPC to raise interest rates by 25 basis points in September 1999 and again in November 1999. This tighteningtrend has been reflected in all the other major economies, except Japan.
The value of sterling is also important for UK monetary conditions. Although the authorities have no explicit target, thepound has played an important role in several MPC decisions in the last year. Sterling weakened in late 1998, but this trend did notcontinue. The introduction of the euro has been a major influence. The new currency was weakened by the impact of the post-Russian turmoil on the core economies of Europe and has yet to fully recover. Movements relative to the dollar have been les smarked, but overall sterling has appreciated considerably since the start of 1999.
24
European Economic and Monetary Union (EMU)
The third stage of EMU commenced on schedule on January 1, 1999. During the course of 1998, it was determined thateleven countries (Austria, Belgium, Finland, France, Germany, Ireland, Italy, Luxembourg, the Netherlands, Portugal and Spain)would participate. The UK, along with Denmark, exercised its right to opt out at this stage and Sweden also determined not to bepart of this first wave. Greece was deemed not to have qualified in terms of the criteria set down in the Maastricht Treaty.
The new European single currency, the euro, came into being on January 1, 1999. On December 31, 1998, the EuropeanCurrency Unit (the ECU) was replaced by the euro in the international currency markets, on a one for one basis. The rates for theeuro against other international currencies were based upon the official closing rates for the ECU. The bilateral rates for the legacycurrencies of the participating states were derived from their central rates within the Exchange Rate Mechanism and the closingvalue of the ECU. These rates, between the legacy currencies and between these currencies and the euro, were irrevocably locked asof January 1, 1999. The euro is now the formal currency for all eleven participating states. However, the legacy currencies will stillexist as notes and coins until 2002. Euro notes and coins will be introduced into circulation on January 1, 2002 and legacy currencynotes and coins will be withdrawn by June 30, 2002.
Also on January 1, 1999, the European Central Bank (ÒECBÓ) took over responsibility for the operation of monetary policythroughout the euro zone. They now set one short term interest rate to cover all eleven countries. In the run up to the start of stagethree of EMU, the central banks of the participating states agreed with the ECB that short term rates should be co-ordinated at 3%.At their first meeting in 1999, the ECB indicated that rates would remain at that level for Ôthe foreseeable futureÕ.
The UK Government has indicated that the UK will not adopt the single currency until this is seen as being in the UKÕseconomic interests and also not until there has been a positive vote at a referendum. It is almost certain that any referendum will bedelayed until after the next General Election. The Chancellor of the Exchequer has laid down five key economic conditions for UKparticipation. Nevertheless discussion continues as to how the UK private and public sectors should be responding to EMU whilethe UK remains ÔoutÕ and, potentially, prepare for the UK being ÔinÕ. A discussion of the GroupÕs preparation for EMU is containedon page 56.

25
Supervision and Regulation
UK banking business
Under the authority of the Banking Act 1987, the Bank of England was responsible for the supervision of the UK bankingsystem and was the principal regulatory body supervising Group operations. On June 1, 1998 the prudential supervision of bank swas transferred to the Financial Services Authority (ÒFSAÓ). The Financial Services and Markets Bill (Òthe BillÓ) was published inJuly 1998 and it is intended to replace the Financial Services Act 1986, the Insurance Companies Act 1982, the Banking Act 1987 ,and large parts of the Building Societies Act 1986 and Friendly Societies Act 1992. The Bill has begun its passage throughParliament and is expected to receive Royal Assent in the Spring of 2000. The Bill will create a new statutory regime under whichthe FSA will take over the responsibilities of, and have powers at least equivalent to, those of the existing regulators as noted. Inparticular, the FSA specifically monitors the operations of the Bank, RoyScot Trust plc, Adam & Company, Direct Line FinancialServices Limited, RBS Trust Bank Ltd. and Tesco Personal Finance Limited which are authorised institutions under the Banking Act1987. In addition, the company and the Bank, as the holding companies of such companies, are directly supervised by the FSA.
Broadly, the FSA is empowered to request information from and make recommendations to authorised institutions. TheFSA also sets standards and ratios that serve as guidelines for the banks under its supervision. Each bank submits regular reports tothe FSA, which provide material for supervisory assessment. Senior management of banks also meet regularly with the FSA todiscuss such topics as risk control, loan portfolio composition, profitability, capital adequacy and liquidity management,organisational changes and operating practices. The FSAÕs supervision has become increasingly formalised through the issue ofnotices drawn up by the FSA in consultation with the banks, relating to, among other things, the implementation of consolidatedsupervision, capital adequacy, liquidity and foreign currency exposure, large exposures to related borrowers, the adequacy ofaccounting procedures and controls, advertising, the FSAÕs relationship with a bankÕs external auditors and loan transfers andsecuritisation of loans.
The Banking Act 1987 also permits the FSA to obtain independent reports from the auditors of authorised institutions,acting as reporting accountants, as to the accuracy of accounting records and prudential returns and the adequacy of internal controls.In addition, the FSA has statutory powers to object on prudential grounds or by direction of the UK Treasury, on grounds of lack ofreciprocity, to persons who are, or who intend to become, controllers of 10% or more of the voting power of an authorisedinstitution.
Cash ratio deposit
UK banks are required to maintain, in interest-free accounts at the Bank of England, a non-operational cash balance of0.15% of eligible liabilities (primarily sterling deposits less amounts on loan to other monetary institutions). From time to time inthe past, authorised institutions have also been required to make special deposits with the Bank of England to reduce excess liquidity,although no such deposits have been called for in recent years.
Large exposures
The FSA requires banks to report, and in some cases obtain consent for, large single exposures and large exposures torelated borrowers. Generally, a bank is not permitted to have exposures exceeding 25% of its capital.
Liquidity
The FSA monitors the liquidity of the UK banking sector through a series of periodic returns covering both sterling andnon-sterling operations - see ÒManagementÕs Discussion and Analysis of Financial Condition and Results of Operations - RiskManagement - Liquidity RiskÓ on page 60 of this Report.
Deposit compensation
Deposit compensation under the EC Directive on Deposit Protection Schemes, implemented in the UK on July 1, 1995, isavailable to depositors with authorised institutions. Depositors with a failed institution will receive 90% of their protected depositsfrom the UK deposit protection fund. A protected deposit is limited to a maximum amount of £20,000 (or the sterling equivalent ofeuro 22,222, whichever is the higher), including both principal and accrued interest. The deposit protection fund is financed by alevy on all authorised institutions in proportion to their deposit base which includes deposits in sterling, other European EconomicArea currencies and euros. The maximum level of the initial levy on each institution is £300,000 with arrangements existing forraising further contributions (which may not exceed £300,000 each) and special contributions in certain circumstances, but themaximum amount of any such further or special contribution is limited (after taking into account such contribution, together withany previous initial, further and special contributions, and after allowing for any repayments) to 0.3% of the authorised institutionÕsdeposit base. Under certain circumstances specified in the Banking Act 1987, the figures referred to above may be varied.
26
Securities and investment business
The GroupÕs securities and investment businesses in the UK, including the sale of personal financial services in theinvestment field through the BankÕs branch network, are regulated under the Financial Services Act 1986 (the ÒFinancial ServicesActÓ), which established a framework for strengthening investor protection by the regulation of investment businesses and securitiesmarkets. Authority for various aspects of the regulatory regime established by the Financial Services Act has been vested in theTreasury since 1992. Certain of the TreasuryÕs powers have been delegated to the FSA which has further delegated variousregulatory functions to a number of self-regulating organisations (SROs) and recognised professional bodies which authorise andsupervise most securities and investment businesses. Under the Bill, the SROs will be amalgamated under the FSA. The activitiesof the Group currently fall within the scope of a number of SROs. In particular, since January 1995, the Bank has been regulated bythe Personal Investment Authority (PIA), which was formed in 1994 to take responsibility for the regulation of investment businessfor retail investors.
Pursuant to rules promulgated under the Financial Services Act, the Bank is required to decide whether to market theinvestment products of only one company or to become an independent intermediary providing its customers with advice across abroader range of products. On October 1, 1990, Royal Scottish Assurance plc (ÒRSAÓ), a life insurance joint venture company,commenced operations offering a full range of unit-linked products, including pensions, life insurance and investment and mortgageinsurance. The Bank became its appointed representative for the purposes of the Financial Services Act. Since May 1997 the Bankhas held a 70% shareholding in RSA, with the remaining 30% being held by Scottish Widows Fund and Life Assurance Society(ÒScottish WidowsÓ). In November 1999 the composite insurer, CGU, agreed to acquire a 50% interest in RSA, replacing ScottishWidows in this venture. The Bank markets through its branches RSA insurance products and is not permitted to provide advice inrelation to products more generally. However, independent advice is available to customers who require it through the BankÕssubsidiary company, Royal Bank Insurance Services (Independent Financial Advisers) Limited.
Life assurance and general insurance business
The business of RSA and Direct Line (which is authorised to write general Ònon-lifeÓ business) is regulated by the FSA,which sets capital requirements. They are required to submit regular statistical returns covering reserves and solvency to the FSA.
United States
The BankÕs United States branch in New York is subject to the reserve requirements established by the Board of Governorsof the Federal Reserve System (the ÒBoardÓ) pursuant to the International Banking Act of 1978 (the ÒIBAÓ) and is subject toexamination by the Board. The IBA also imposes limitations on the types of business conducted in the United States and on thelocation and expansion of banking operations in the United States.
As the indirect owner of CFG, the company is subject to the provisions of the Federal Bank Holding Company Act of 1956,together with regulations thereunder (ÒBHCAÓ), which requires the company to be a source of strength for CFG. The BHCAprohibits the company from engaging in certain tying arrangements in connection with any extension of credit or provision of anyproperty or services. The BHCA also generally prohibits the company from, directly or indirectly, acquiring more than 5% of thevoting shares of any company engaged in non-banking activities in the United States unless the Board has determined, by order orregulation, that such proposed activities are so closely related to banking or managing or controlling banks as to be a proper incidentthereto. In addition, the BHCA requires the company to obtain the prior approval of the Board before acquiring, directly orindirectly, the ownership or control of more than 5% of the voting shares of any United States bank or bank holding company. CFGis also subject to regulation under the BHCA as a bank holding company. In addition, CFGÕs banking subsidiaries are subject toregulation by state authorities and the Federal Deposit Insurance Corporation. Federal law imposes limitations on the ability of theGroup to engage in certain aspects of the securities business in the United States.

27
At September 30, 1999, the Group operated from approximately 1,000 locations world-wide, principally in the UK. TheBank had 634 branches in the UK and 5 branches and offices abroad. CFG had 278 retail banking offices covering Rhode Island,Connecticut, Massachusetts and New Hampshire at that date. A substantial majority of the UK branches are owned by the Bank andits subsidiaries or are held under leases with unexpired terms of over 50 years. The GroupÕs principal properties include the BankÕsheadquarters at St Andrew Square, Edinburgh, the London headquarters at Waterhouse Square, the administration centre at RegentÕsHouse, Islington, London and the Drummond House administration centre located at South Gyle, Edinburgh.
It is the GroupÕs policy to carry out annual valuations of its principal freehold and long leasehold (more than fifty yearsunexpired) premises. Any increase or deficit on revaluation is reflected in the carrying value of premises at that time. Anyimpairment in the value of premises is charged to the Consolidated Statement of Income after eliminating previous revaluationsurpluses arising on the premises, unless there has been a clear consumption of economic benefits in which case a charge is made tothe Consolidated Statement of Income. Any profit from the sale of revalued premises is calculated by deducting the revaluedamount from the net proceeds. The revaluation of premises during the year ended September 30, 1999, resulted in a net £28 millionincrease in property revaluation reserves.
ITEM 3. LEGAL PROCEEDINGS
The Group is party to various legal proceedings in the ordinary course of business, the ultimate resolution of which is notexpected to have a material adverse effect on the liquidity, financial position or the results of the operations of the Group.
ITEMÊ4.ÊCONTROLÊOFÊREGISTRANT
The company is not directly or indirectly owned or controlled by another corporation or any foreign government.
There were no aggregate shareholdings of 10% or more of the companyÕs ordinary shares, as notified to the company atNovember 30, 1999. The following table shows the aggregate shareholdings of the directors and executive officers of the companyat November 30, 1999:
TitleÊofÊClass IdentityÊofÊPersonÊorÊGroup NumberÊOwned %ÊofÊClass
Ordinary shares Directors and executiveof 25p each officers of the company (1) 364,073 0.04%
NOTE
(1) At November 30, 1999, the directors and executive officers of the company had options to purchase a total of 1,582,047ordinary shares of 25p each of the company.
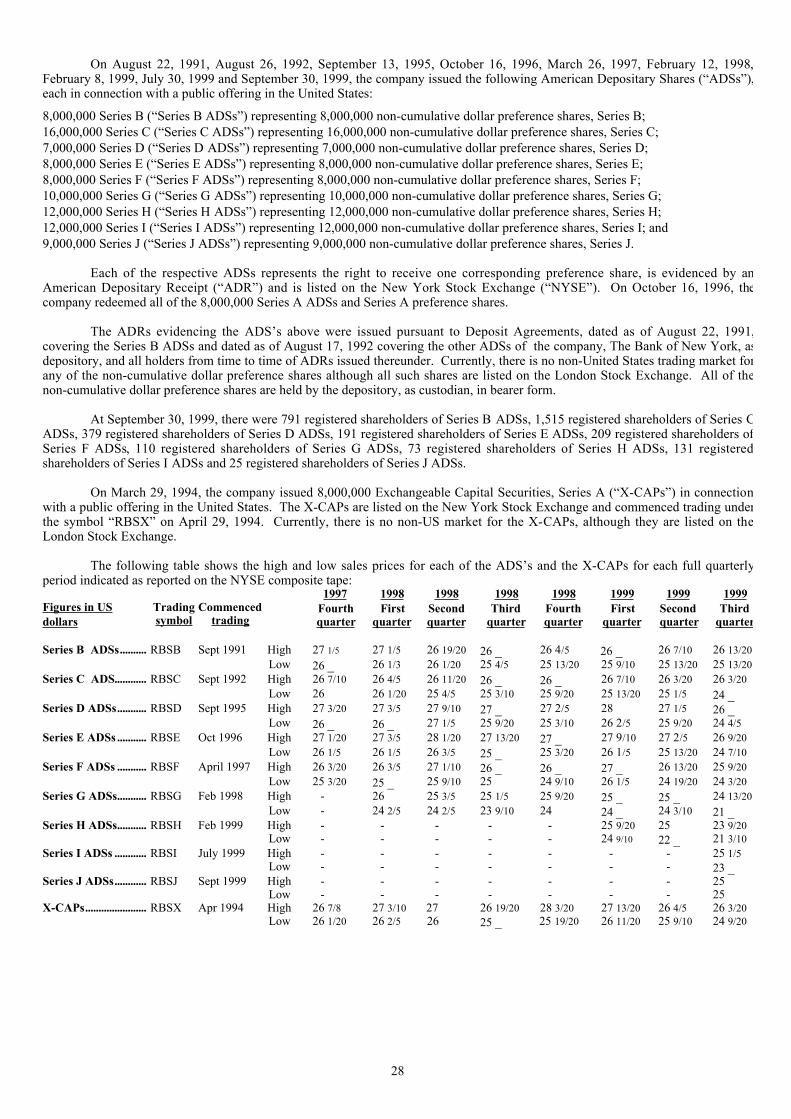
28
On August 22, 1991, August 26, 1992, September 13, 1995, October 16, 1996, March 26, 1997, February 12, 1998,February 8, 1999, July 30, 1999 and September 30, 1999, the company issued the following American Depositary Shares (ÒADSsÓ),each in connection with a public offering in the United States:
8,000,000 Series B (ÒSeries B ADSsÓ) representing 8,000,000 non-cumulative dollar preference shares, Series B;16,000,000 Series C (ÒSeries C ADSsÓ) representing 16,000,000 non-cumulative dollar preference shares, Series C;7,000,000 Series D (ÒSeries D ADSsÓ) representing 7,000,000 non-cumulative dollar preference shares, Series D;8,000,000 Series E (ÒSeries E ADSsÓ) representing 8,000,000 non-cumulative dollar preference shares, Series E;8,000,000 Series F (ÒSeries F ADSsÓ) representing 8,000,000 non-cumulative dollar preference shares, Series F;10,000,000 Series G (ÒSeries G ADSsÓ) representing 10,000,000 non-cumulative dollar preference shares, Series G;12,000,000 Series H (ÒSeries H ADSsÓ) representing 12,000,000 non-cumulative dollar preference shares, Series H;12,000,000 Series I (ÒSeries I ADSsÓ) representing 12,000,000 non-cumulative dollar preference shares, Series I; and9,000,000 Series J (ÒSeries J ADSsÓ) representing 9,000,000 non-cumulative dollar preference shares, Series J.
Each of the respective ADSs represents the right to receive one corresponding preference share, is evidenced by anAmerican Depositary Receipt (ÒADRÓ) and is listed on the New York Stock Exchange (ÒNYSEÓ). On October 16, 1996, thecompany redeemed all of the 8,000,000 Series A ADSs and Series A preference shares.
The ADRs evidencing the ADSÕs above were issued pursuant to Deposit Agreements, dated as of August 22, 1991,covering the Series B ADSs and dated as of August 17, 1992 covering the other ADSs of the company, The Bank of New York, asdepository, and all holders from time to time of ADRs issued thereunder. Currently, there is no non-United States trading market forany of the non-cumulative dollar preference shares although all such shares are listed on the London Stock Exchange. All of thenon-cumulative dollar preference shares are held by the depository, as custodian, in bearer form.
At September 30, 1999, there were 791 registered shareholders of Series B ADSs, 1,515 registered shareholders of Series CADSs, 379 registered shareholders of Series D ADSs, 191 registered shareholders of Series E ADSs, 209 registered shareholders ofSeries F ADSs, 110 registered shareholders of Series G ADSs, 73 registered shareholders of Series H ADSs, 131 registeredshareholders of Series I ADSs and 25 registered shareholders of Series J ADSs.
On March 29, 1994, the company issued 8,000,000 Exchangeable Capital Securities, Series A (ÒX-CAPsÓ) in connectionwith a public offering in the United States. The X-CAPs are listed on the New York Stock Exchange and commenced trading underthe symbol ÒRBSXÓ on April 29, 1994. Currently, there is no non-US market for the X-CAPs, although they are listed on theLondon Stock Exchange.
The following table shows the high and low sales prices for each of the ADSÕs and the X-CAPs for each full quarterlyperiod indicated as reported on the NYSE composite tape:
Figures in USdollars
Tradingsymbol
Commencedtrading
1997Fourthquarter
1998First
quarter
1998Secondquarter
1998Third
quarter
1998Fourthquarter
1999First
quarter
1999Secondquarter
1999Third
quarter
Series B ADSs.......... RBSB Sept 1991 High 27 1/5 27 1/5 26 19/20 26 _ 26 4/5 26 _ 26 7/10 26 13/20Low 26 _ 26 1/3 26 1/20 25 4/5 25 13/20 25 9/10 25 13/20 25 13/20
Series C ADS............ RBSC Sept 1992 High 26 7/10 26 4/5 26 11/20 26 _ 26 _ 26 7/10 26 3/20 26 3/20Low 26 26 1/20 25 4/5 25 3/10 25 9/20 25 13/20 25 1/5 24 _
Series D ADSs........... RBSD Sept 1995 High 27 3/20 27 3/5 27 9/10 27 _ 27 2/5 28 27 1/5 26 _Low 26 _ 26 _ 27 1/5 25 9/20 25 3/10 26 2/5 25 9/20 24 4/5
Series E ADSs........... RBSE Oct 1996 High 27 1/20 27 3/5 28 1/20 27 13/20 27 _ 27 9/10 27 2/5 26 9/20Low 26 1/5 26 1/5 26 3/5 25 _ 25 3/20 26 1/5 25 13/20 24 7/10
Series F ADSs ........... RBSF April 1997 High 26 3/20 26 3/5 27 1/10 26 _ 26 _ 27 _ 26 13/20 25 9/20Low 25 3/20 25 _ 25 9/10 25 24 9/10 26 1/5 24 19/20 24 3/20
Series G ADSs........... RBSG Feb 1998 High - 26 25 3/5 25 1/5 25 9/20 25 _ 25 _ 24 13/20Low - 24 2/5 24 2/5 23 9/10 24 24 _ 24 3/10 21 _
Series H ADSs........... RBSH Feb 1999 High - - - - - 25 9/20 25 23 9/20Low - - - - - 24 9/10 22 _ 21 3/10
Series I ADSs ............ RBSI July 1999 High - - - - - - - 25 1/5Low - - - - - - - 23 _
Series J ADSs............ RBSJ Sept 1999 High - - - - - - - 25Low - - - - - - - 25
X-CAPs....................... RBSX Apr 1994 High 26 7/8 27 3/10 27 26 19/20 28 3/20 27 13/20 26 4/5 26 3/20Low 26 1/20 26 2/5 26 25 _ 25 19/20 26 11/20 25 9/10 24 9/20

29
ITEM 6. EXCHANGE CONTROLS AND OTHER LIMITATIONS AFFECTING SECURITY HOLDERS
The company has been advised that there are currently no UK laws, decrees or regulations which would prevent theremittance of dividends or other payments to non-UK resident holders of the companyÕs non-cumulative dollar preference shares.
There are no restrictions under the Articles of Association of the company or under UK law, as currently in effect, whichlimit the right of non-UK resident owners to hold or, when entitled to vote, freely to vote the companyÕs non-cumulative dollarpreference shares.
30
ITEM 7. TAXATION
The following discussion summarises certain US federal and UK tax consequences of the acquisition, ownership anddisposition of non-cumulative dollar preference shares, ADSs or X-CAPs by a beneficial owner of non-cumulative dollar preferenceshares, ADSs evidenced by ADRs or X-CAPs that is a citizen or resident of the United States or that otherwise will be subject to USfederal income tax on a net income basis in respect of the non-cumulative dollar preference shares, X-CAPs or ADSs (a ÒUSHolderÓ). This summary does not address the tax consequences to a US Holder (i) that is resident (or, in the case of an individual,ordinarily resident) in the UK for UK tax purposes or, generally, (ii) that is a corporation which alone or together with one or moreassociated companies, controls, directly or indirectly, 10% or more of the voting stock of the company.
The statements regarding US and UK tax laws (including the US/UK double taxation convention relating to income andcapital gains) (the ÒTreatyÓ) and the US/UK double taxation convention relating to estate and gift taxes (the ÒEstate Tax TreatyÓ) andpractices set forth below are based (i) on those laws and practices as in force and as applied in practice on the date of this Report and(ii) in part, on representations of the depository, and assume that each obligation in the Deposit Agreement and any relatedagreement will be performed in accordance with its terms. The US and the UK are currently negotiating the terms of a new taxtreaty, which might alter the rules described in this discussion. This summary is not exhaustive of all possible tax considerations andholders are advised to satisfy themselves as to the overall tax consequences, including specifically the consequences under USfederal, state, local and other laws, of the acquisition, ownership and disposition of non-cumulative dollar preference shares, ADSsevidenced by ADRs or X-CAPs by consulting their own tax advisers.
For the purposes of the Treaty and the Estate Tax Treaty and for purposes of the US Internal Revenue Code of 1986, asamended (the ÒCodeÓ), US Holders of ADRs will be treated as owners of the non-cumulative dollar preference shares underlyingsuch ADRs.
With effect from April 6, 1999, significant changes were made to the UK tax treatment of dividends and other distributionsmade by UK companies. The effect of these changes for US Holders are that no amount will be payable to them pursuant to theTreaty and therefore no amount in respect of Treaty Payments (as defined below) will be payable under what were known as the ÒHArrangementsÓ or will be otherwise refundable by the Inland Revenue.
Preference Shares or ADSs evidenced by ADRs
Taxation of Dividends
The company is not required to withhold tax at source from dividend payments it makes or from any amount (including anyamounts in respect of accrued dividends) distributed by the company.
When the company pays a dividend, an amount equal to 10/90ths of the amount of the cash dividend is generally allowed asa credit (the ÒTax CreditÓ) against the UK tax liability of individuals who receive (or who are treated as receiving) the dividend andwho are resident in the UK for UK tax purposes.
Under the Treaty, an Eligible US Holder (as defined below) is entitled to a payment from the United Kingdom of the TaxCredit to which an individual resident in the UK for UK tax purposes would have been entitled (the ÒTax Credit AmountÓ). Suchpayment will be subject to a deduction withheld of an amount not exceeding 15% of the sum of the cash dividend and the Tax CreditAmount (the ÒUK Withholding TaxÓ), but not in excess of the Tax Credit Amount. Accordingly, Eligible US Holders will notreceive any actual payment since the actual withholding will equal the Tax Credit Amount. In addition, Eligible US Holders willhave no further UK tax liability in respect of such excess of the UK Withholding Tax over the Tax Credit Amount or otherwise inrespect of the dividend. For the purposes of this Report, the term ÒEligible US HolderÓ means a US Holder that is a beneficial ownerof a non-cumulative dollar preference share or an ADS evidenced by an ADR and of the cash dividend paid thereon, and thatsatisfies the following conditions: the US Holder (i) is an individual or a corporation resident in the United States for purposes of theTreaty (and, in the case of a corporation, is not also resident in the UK for UK tax purposes); (ii) is not a corporation which, alone ortogether with one or more associated corporations, controls, directly or indirectly, 10% or more of the voting stock of the company;(iii) whose holding of the non-cumulative dollar preference shares or ADRs is not effectively connected with a permanentestablishment in the UK through which such US Holder carries on business or with a fixed base in the UK from which such USHolder performs independent personal services; (iv) under certain circumstances, is not an investment or holding company, 25% ormore of the capital of which is owned, directly or indirectly, by persons that are not individuals resident in, and are not nationals of,the United States; (v) under certain circumstances, is not exempt from federal income tax on dividend income in the United States;and (vi) under certain circumstances, does not own 10% or more of the series of non-cumulative dollar preference shares in respectof which the dividend is paid.

31
A US Holder that is a partnership, trust or estate may be entitled to the benefit of the Treaty in respect of a cash dividendpaid by the company but only to the extent that dividend income derived by such US Holder is taxable in the United States as theincome of a US resident in the hands of such US Holder or of its partners or beneficiaries, as the case may be.
Cash distributions made with respect to the non-cumulative dollar preference shares or ADSs representing preference shareswill constitute dividends for US federal income tax purposes to the extent paid out of current or accumulated earnings and profits ofthe Group, as determined for US federal income tax purposes.
An Eligible US Holder will realise dividend income for US federal income tax purposes in an amount equal to the sum ofany cash dividend paid by the company and the amount of any dividend deemed to have been received as a result of the Tax CreditAmount associated with such dividend. Dividends paid by the company will not be eligible for the dividends received deductionallowed to corporations under the Code.
Subject to certain limitations and restrictions, the UK Withholding Tax withheld in accordance with the Treaty will betreated for US tax purposes as a UK withholding tax that may be claimed as a credit against the US federal income tax liability of theEligible US Holder. The limitation on foreign taxes eligible for credit is calculated separately with respect to specific classes ofincome. For this purpose, dividends paid by the company with respect to the non-cumulative dollar preference shares will generallyconstitute Òpassive incomeÓ or, in the case of certain US Holders, Òfinancial services incomeÓ.
Taxation of Capital Gains
A US Holder that is not resident (or, in the case of an individual, ordinarily resident) in the UK will not normally be liablefor UK tax on capital gains realised on the disposition of such holderÕs non-cumulative dollar preference share or ADR unless at thetime of the disposal such US Holder carries on a trade, profession or vocation in the UK through a branch or agency and such non-cumulative dollar preference share or ADR is or has been used, held or acquired for the purposes of such trade (or profession orvocation), branch or agency. Special rules apply to individuals who are temporarily not resident or ordinarily resident in the UK. AUS Holder will, upon the sale, exchange or redemption of a non-cumulative dollar preference share or ADS representing preferenceshares, generally recognise capital gains or losses for US federal income tax purposes (assuming in the case of a redemption, thatsuch US Holder does not own, and is not deemed to own, any ordinary shares of the company) in an amount equal to the differencebetween the amount realised (excluding in the case of a redemption any amount treated as a dividend for US federal income taxpurposes) and the US HolderÕs tax basis in the non-cumulative dollar preference share or ADS. A US Holder who is liable for bothUK and US tax on a gain recognised on the disposal of the non-cumulative dollar preference share or ADS will generally be entitled,subject to certain limitations, to credit the UK tax against its US federal income tax liability in respect of such gain.
Estate and Gift Tax
A non-cumulative dollar preference share or ADR held by an individual, whose domicile is determined to be the UnitedStates for purposes of the Estate Tax Treaty and who is not a national of the UK, will not be subject to UK inheritance tax on theindividualÕs death or on a lifetime transfer of the non-cumulative dollar preference share or ADR, except in certain cases where thenon-cumulative dollar preference share or ADR (i) is comprised in a settlement (unless, at the time of the settlement, the settlor wasdomiciled in the United States and was not a national of the UK); (ii) is part of the business property of a UK permanentestablishment of an enterprise; or (iii) pertains to a UK fixed base of an individual used for the performance of independent personalservices. The Estate Tax Treaty generally provides a credit against US federal tax liability for the amount of any tax paid in the UKin a case where the non-cumulative dollar preference share or ADR is subject both to UK inheritance tax and to US federal estate orgift tax.
Redemption
UK Stamp Duty and Stamp Duty Reserve Tax
The following is a summary of the UK stamp duty and stamp duty reserve tax consequences of transferring an ADR inregistered form (otherwise than to the custodian on cancellation of the ADR). It does not set out the UK stamp duty or stamp dutyreserve tax consequences of transferring, or agreeing to transfer, non-cumulative dollar preference shares or any interest therein orright thereto (other than interests in ADRs) on which investors should consult their own tax advisers.

32
UK Stamp Duty and Stamp Duty Reserve Tax (continued)
No UK stamp duty will be payable on the transfer of, or written agreement to transfer, an ADR or beneficial ownership ofan ADR, provided that (i) the ADR (and any separate instrument of transfer or written agreement to transfer) remains at all timesoutside the UK; (ii) any instrument of transfer or written agreement to transfer is not executed in the UK; and (iii) the transfer is nototherwise effected in the UK. In any other case, the transfer of, or written agreement to transfer, an ADR or beneficial ownership ofan ADR could give rise to a UK stamp duty liability generally at the rate of 0.5% of the consideration paid rounded up to £5 ormultiples thereof.
UK stamp duty reserve tax will not be payable in respect of an agreement to transfer ADRs or the beneficial ownership ofADRs.
X-CAPs
Taxation of Payments of Interest
Payments of interest will not be subject to withholding or deduction for or on account of UK taxation as long as X-CAPs areissued, and remain at all times, in bearer form and are listed on the New York Stock Exchange or some other Òrecognised stockexchangeÓ within the meaning of Section 841 of the Income and Corporation Taxes Act 1988 and as long as payments on the X-CAPs are made by or through a paying agent outside the UK.
As interest payments on X-CAPs will have a UK source, they will be potentially chargeable to UK tax by direct assessment,even if paid without withholding or deduction. However, a US Holder who would in any case be entitled to receive interestpayments free of withholding or deduction under the Treaty will not be subject to such tax. Furthermore, interest with a UK sourcereceived without deduction or withholding on account of UK tax will not be chargeable to UK tax in the hands of a US Holder whodoes not carry on a trade, profession or vocation in the UK through a UK branch or agency in connection with which the interest isreceived or to which the X-CAPs are attributable. There are exemptions for interest received by certain categories of agent (such assome brokers and investment managers).
Where a UK collecting agent either:
(a) acts as custodian of the X-CAPs and receives interest on the X-CAPs or directs that interest on the X-CAPs be paid to anotherperson or consents to such a payment; or
(b) collects or secures payment of (or otherwise acts to arrange the collection or securing of) or receives interest on the X-CAPs foran X-CAPs holder or holder of rights to interest, except solely by means of clearing a cheque or arranging for the clearing of acheque;
the collecting agent will be required to withhold on account of income tax at the lower rate (currently 20%), unless inter alia, theperson beneficially entitled to the interest is either not resident in the UK and beneficially owns the relevant X-CAPs or is specifiedby regulations. Conditions imposed by further regulations may have to be satisfied in order for the relevant exception to beavailable.
Interest payments on X-CAPs in registered form will be made by the company under deduction of UK income tax at thelower rate unless the company has previously been directed by the Inland Revenue, in relation to a particular holding of X-CAPs, tomake payment free of deduction or subject to a reduced deduction by virtue of relief available to the holder of such X-CAPs underthe provisions of an applicable double taxation treaty. Certain US Holders may be entitled to receive interest payments free of UKincome tax under the Treaty and may therefore be able to obtain such a direction from the Inland Revenue. However, suchdirections will be issued only on prior application to the relevant tax authorities by the holder in question. If such a direction is notgiven, the company will be required to withhold tax, although a US Holder entitled to relief under the Treaty may subsequentlyclaim the amount withheld from the Inland Revenue.
Notwithstanding that interest payments are received subject to deduction of income tax, holders of X-CAPs in registeredform who are resident in the UK for UK tax purposes or holders who are non-resident and are carrying on a trade in the UK througha branch or agency to which the X-CAPs are attributable, may either be liable to pay further UK tax on the interest paymentsreceived or be entitled to a refund of all or part of the tax deducted at source depending on their particular circumstances.
The company will not pay any additional amounts to holders of X-CAPs in registered form by way of compensation for anywithholding or deduction for or on account of tax that is, or hereinafter may be, required to be made in respect of interest paymentson X-CAPs in registered form.
33
The UK Inland Revenue confirmed at around the time of the issue that interest payments would not be treated asdistributions for UK tax purposes (i) by reason of the fact that interest may be deferred under the terms of issue or (ii) by reason ofthe undated nature of the X-CAPs, provided that at the time an interest payment is made, the X-CAPs are not held by a companywhich is ÒassociatedÓ with the company or by a Òfunded companyÓ. A company will be associated with the company if, broadlyspeaking, it is in the same group as the company. A company will be a Òfunded companyÓ for these purposes if there arearrangements involving that company being put in funds (directly or indirectly) by the company, or an entity associated with thecompany. In this respect, the Inland Revenue has confirmed that a company holding an interest in X-CAPs which incidentally hasbanking facilities with any company associated with the company will not be a Òfunded companyÓ by virtue of such facilities.
Disposal (including Redemption)
A disposal (including redemption) of X-CAPs by a US Holder, who is an individual or other non corporation tax payer, willnot give rise to any liability to UK taxation on capital gains unless the US Holder carries on a trade (which for this purpose includesa profession or vocation) in the UK through a branch or agency and the X-CAPs are, or have been, held or acquired for the purposesof that trade or branch or agency. However, the exchange by such a US Holder of X-CAPs for ADRs pursuant to the companyÕsexercise of its exchange right will not give rise to a charge to UK tax on capital gains.
A transfer of X-CAPs by a US Holder will not give rise to a charge to UK tax on accrued but unpaid interest payments,unless the US Holder is an individual or other non corporation tax payer and at any time in the relevant year of assessment oraccounting period carries on a trade in the UK through a branch or agency to which the X-CAPs are attributable.
Annual Tax Charges
Corporate holders of X-CAPs may be subject to annual UK tax charges (or relief) by reference to fluctuations in exchangerates and in respect of profits, gains and losses arising from the X-CAPs, in place of the tax treatment referred to in the twopreceding paragraphs. These rules will not, however, apply to corporate US Holders who do not carry on a trade, profession orvocation in the UK through a branch or agency in the UK to which the X-CAPs are attributable.
Inheritance Tax
X-CAPs in bearer form physically held outside the UK should not be subject to UK inheritance tax in respect of a lifetimetransfer by, or the death of, a US Holder who is not domiciled in the UK for inheritance tax purposes. However, in relation toX-CAPs held through DTC (or any other clearing system), the position is not free from doubt and the Inland Revenue are known toconsider that the situs of securities held in this manner is not necessarily determined by the place in which the securities arephysically held. If X-CAPs in bearer form are or become situated in the UK, or if X-CAPs are held in registered form, there may bea charge to UK inheritance tax as a result of a lifetime transfer at less than fair market value by, or on the death of, such a US HolderHowever, exemption from, or a reduction of, any such UK tax liability may be available under the Estate Tax Treaty in the samemanner as for non-cumulative dollar preference shares.
Stamp Duty and Stamp Duty Reserve Tax
No UK stamp duty is payable on the transfer by delivery or redemption of bearer X-CAPs, whether in definitive form or inthe form of one or more global X-CAPs. No stamp duty reserve tax is payable on any agreement to transfer bearer X-CAPs providedthat the agreement is not made in contemplation of, or in part of an arrangement for, a takeover of the company. No UK stamp dutywill be payable in respect of any instrument of transfer of depositary interests respectively representing X-CAPs, provided that anyinstrument relating to such a transfer is not executed in the UK, and remains at all times outside the UK. The transfer on the sale ofX-CAPs in registered form will attract ad valorem UK stamp duty or (if an unconditional agreement to transfer X-CAPs is notcompleted by a duly stamped transfer) UK stamp duty reserve tax generally, at the rate of 0.5% of the consideration paid, which, inthe case of stamp duty, will be rounded up to £5 or multiples thereof. The transfer of X-CAPs in registered form (I) to, or to anominee, or agent for, a person whose business is or includes issuing depositary receipts or (ii) to, or to a nominee for, a personwhose business is or includes the provision of clearance services, will give rise to a liability to UK stamp duty or (to the extent thatUK stamp duty is not paid on an instrument of transfer) UK stamp duty reserve tax, generally, at the rate of 1.5% of the price of theX-CAPs transferred, which, in the case of stamp duty, will be rounded up to £5 or multiples thereof. A charge to UK stamp dutyreserve tax will also arise on the issue of X-CAPs in registered form (I) to, or to a nominee or agent for, a person whose business isor includes issuing depositary receipts or (ii) to, or to a nominee for, a person whose business is or includes the provision ofclearance services generally at the rate of 1.5% of the price of the X-CAPs issued.
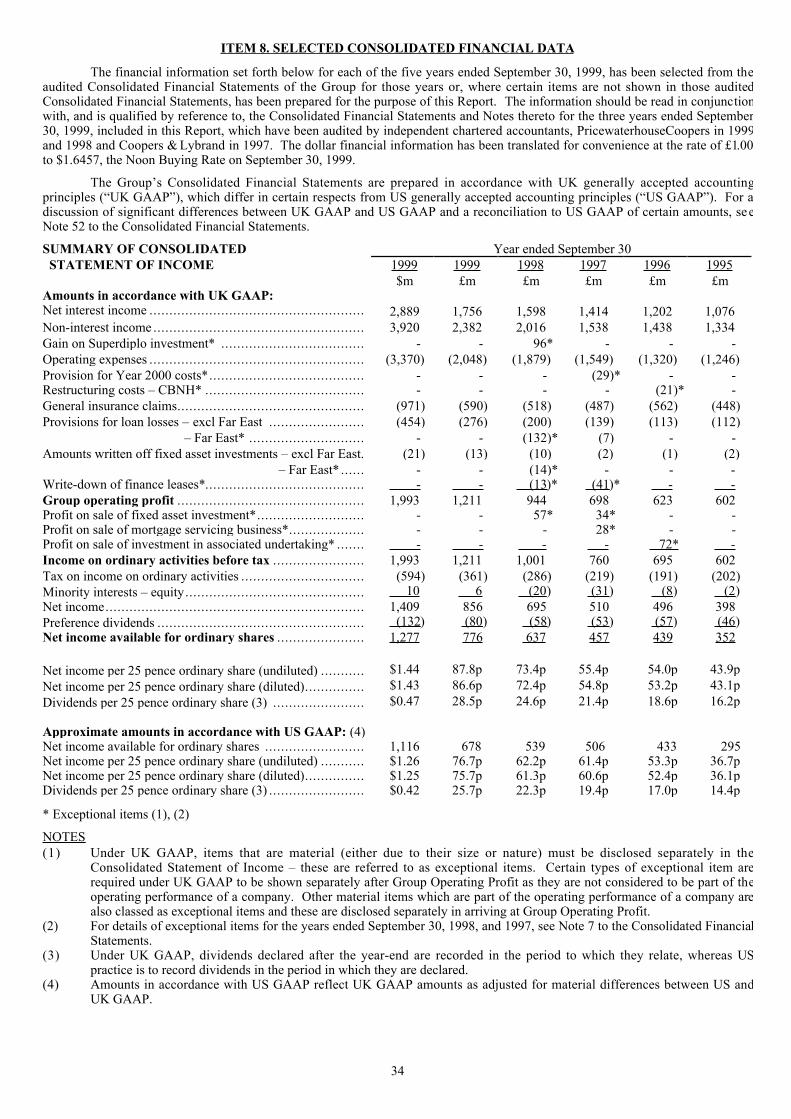
34
ITEM 8. SELECTED CONSOLIDATED FINANCIAL DATA
The financial information set forth below for each of the five years ended September 30, 1999, has been selected from theaudited Consolidated Financial Statements of the Group for those years or, where certain items are not shown in those auditedConsolidated Financial Statements, has been prepared for the purpose of this Report. The information should be read in conjunctionwith, and is qualified by reference to, the Consolidated Financial Statements and Notes thereto for the three years ended September30, 1999, included in this Report, which have been audited by independent chartered accountants, PricewaterhouseCoopers in 1999and 1998 and Coopers & Lybrand in 1997. The dollar financial information has been translated for convenience at the rate of £1.00to $1.6457, the Noon Buying Rate on September 30, 1999.
The GroupÕs Consolidated Financial Statements are prepared in accordance with UK generally accepted accountingprinciples (ÒUK GAAPÓ), which differ in certain respects from US generally accepted accounting principles (ÒUS GAAPÓ). For adiscussion of significant differences between UK GAAP and US GAAP and a reconciliation to US GAAP of certain amounts, seeNote 52 to the Consolidated Financial Statements.
SUMMARY OF CONSOLIDATED Year ended September 30 STATEMENT OF INCOME 1999 1999 1998 1997 1996 1995
$m £m £m £m £m £mAmounts in accordance with UK GAAP:Net interest income ...................................................... 2,889 1,756 1,598 1,414 1,202 1,076Non-interest income ..................................................... 3,920 2,382 2,016 1,538 1,438 1,334Gain on Superdiplo investment* .................................... - - 96* - - -Operating expenses ...................................................... (3,370) (2,048) (1,879) (1,549) (1,320) (1,246)Provision for Year 2000 costs*....................................... - - - (29)* - -Restructuring costs Ð CBNH* ........................................ - - - - (21)* -General insurance claims............................................... (971) (590) (518) (487) (562) (448)Provisions for loan losses Ð excl Far East ........................ (454) (276) (200) (139) (113) (112)
Ð Far East* ............................. - - (132)* (7) - -Amounts written off fixed asset investments Ð excl Far East. (21) (13) (10) (2) (1) (2) Ð Far East* ...... - - (14)* - - -Write-down of finance leases*........................................ - - (13 )* (41 )* - -Group operating profit ............................................... 1,993 1,211 944 698 623 602Profit on sale of fixed asset investment*........................... - - 57* 34* - -Profit on sale of mortgage servicing business*................... - - - 28* - -Profit on sale of investment in associated undertaking* ....... - - - - 72* -Income on ordinary activities before tax ....................... 1,993 1,211 1,001 760 695 602Tax on income on ordinary activities ............................... (594) (361) (286) (219) (191) (202)Minority interests Ð equity............................................. 10 6 (20 ) (31 ) (8 ) (2 )Net income................................................................. 1,409 856 695 510 496 398Preference dividends .................................................... (132 ) (80 ) (58 ) (53 ) (57 ) (46 )Net income available for ordinary shares ...................... 1,277 776 637 457 439 352
Net income per 25 pence ordinary share (undiluted) ........... $1.44 87.8p 73.4p 55.4p 54.0p 43.9pNet income per 25 pence ordinary share (diluted)............... $1.43 86.6p 72.4p 54.8p 53.2p 43.1pDividends per 25 pence ordinary share (3) ....................... $0.47 28.5p 24.6p 21.4p 18.6p 16.2p
Approximate amounts in accordance with US GAAP: (4)Net income available for ordinary shares ......................... 1,116 678 539 506 433 295Net income per 25 pence ordinary share (undiluted) ........... $1.26 76.7p 62.2p 61.4p 53.3p 36.7pNet income per 25 pence ordinary share (diluted)............... $1.25 75.7p 61.3p 60.6p 52.4p 36.1pDividends per 25 pence ordinary share (3) ........................ $0.42 25.7p 22.3p 19.4p 17.0p 14.4p
* Exceptional items (1), (2)
NOTES (1) Under UK GAAP, items that are material (either due to their size or nature) must be disclosed separately in the
Consolidated Statement of Income Ð these are referred to as exceptional items. Certain types of exceptional item arerequired under UK GAAP to be shown separately after Group Operating Profit as they are not considered to be part of theoperating performance of a company. Other material items which are part of the operating performance of a company arealso classed as exceptional items and these are disclosed separately in arriving at Group Operating Profit.
(2) For details of exceptional items for the years ended September 30, 1998, and 1997, see Note 7 to the Consolidated FinancialStatements.
(3) Under UK GAAP, dividends declared after the year-end are recorded in the period to which they relate, whereas USpractice is to record dividends in the period in which they are declared.
(4) Amounts in accordance with US GAAP reflect UK GAAP amounts as adjusted for material differences between US andUK GAAP.
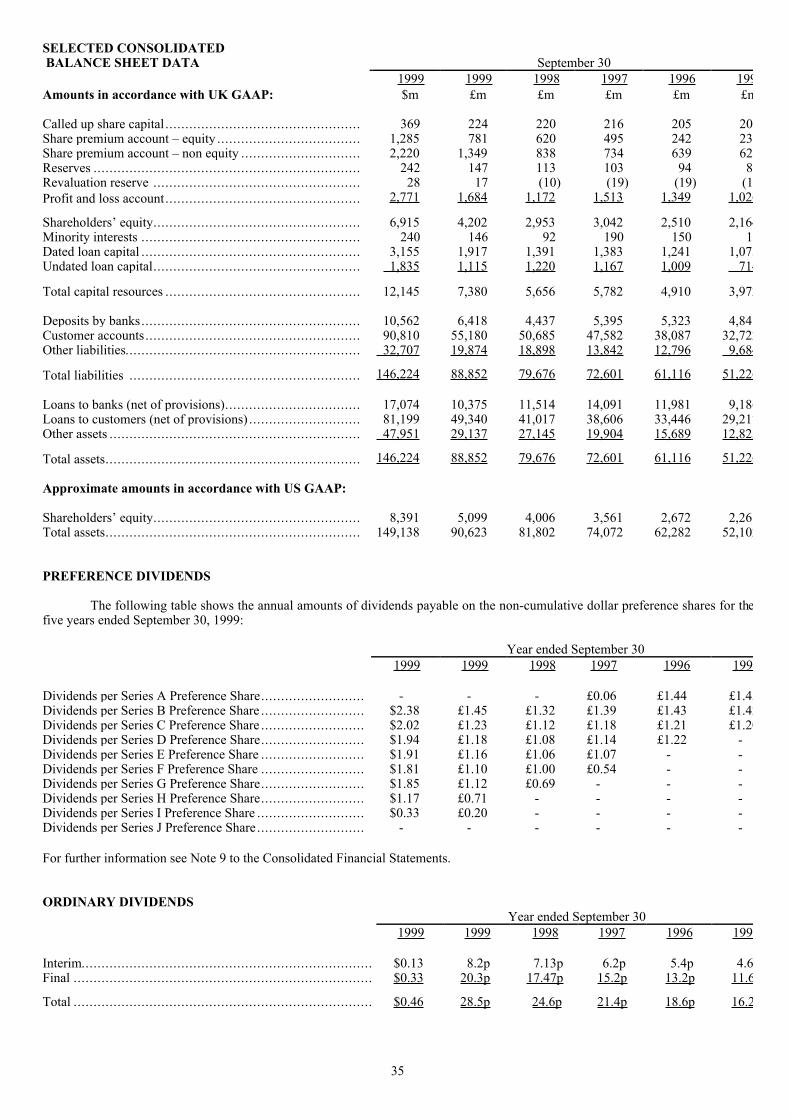
35
SELECTED CONSOLIDATED BALANCE SHEET DATA September 30
1999 1999 1998 1997 1996 199Amounts in accordance with UK GAAP: $m £m £m £m £m £m
Called up share capital ................................................. 369 224 220 216 205 20Share premium account Ð equity .................................... 1,285 781 620 495 242 23Share premium account Ð non equity .............................. 2,220 1,349 838 734 639 62Reserves ................................................................... 242 147 113 103 94 8Revaluation reserve .................................................... 28 17 (10) (19) (19) (1Profit and loss account................................................. 2,771 1,684 1,172 1,513 1,349 1,026
ShareholdersÕ equity.................................................... 6,915 4,202 2,953 3,042 2,510 2,164Minority interests ....................................................... 240 146 92 190 150 1Dated loan capital ....................................................... 3,155 1,917 1,391 1,383 1,241 1,075Undated loan capital.................................................... 1,835 1,115 1,220 1,167 1,009 714
Total capital resources ................................................. 12,145 7,380 5,656 5,782 4,910 3,972
Deposits by banks....................................................... 10,562 6,418 4,437 5,395 5,323 4,84Customer accounts...................................................... 90,810 55,180 50,685 47,582 38,087 32,722Other liabilities........................................................... 32,707 19,874 18,898 13,842 12,796 9,684
Total liabilities .......................................................... 146,224 88,852 79,676 72,601 61,116 51,226
Loans to banks (net of provisions).................................. 17,074 10,375 11,514 14,091 11,981 9,186Loans to customers (net of provisions) ............................ 81,199 49,340 41,017 38,606 33,446 29,217Other assets ............................................................... 47,951 29,137 27,145 19,904 15,689 12,823
Total assets................................................................ 146,224 88,852 79,676 72,601 61,116 51,226
Approximate amounts in accordance with US GAAP:
ShareholdersÕ equity.................................................... 8,391 5,099 4,006 3,561 2,672 2,26Total assets................................................................ 149,138 90,623 81,802 74,072 62,282 52,102
PREFERENCE DIVIDENDS
The following table shows the annual amounts of dividends payable on the non-cumulative dollar preference shares for thefive years ended September 30, 1999:
Year ended September 301999 1999 1998 1997 1996 199
Dividends per Series A Preference Share.......................... - - - £0.06 £1.44 £1.43Dividends per Series B Preference Share .......................... $2.38 £1.45 £1.32 £1.39 £1.43 £1.42Dividends per Series C Preference Share .......................... $2.02 £1.23 £1.12 £1.18 £1.21 £1.20Dividends per Series D Preference Share.......................... $1.94 £1.18 £1.08 £1.14 £1.22 -Dividends per Series E Preference Share .......................... $1.91 £1.16 £1.06 £1.07 - -Dividends per Series F Preference Share .......................... $1.81 £1.10 £1.00 £0.54 - -Dividends per Series G Preference Share.......................... $1.85 £1.12 £0.69 - - -Dividends per Series H Preference Share.......................... $1.17 £0.71 - - - -Dividends per Series I Preference Share ........................... $0.33 £0.20 - - - -Dividends per Series J Preference Share ........................... - - - - - -
For further information see Note 9 to the Consolidated Financial Statements.
ORDINARY DIVIDENDSYearÊendedÊSeptemberÊ30
1999 1999 1998 1997 1996 199
Interim......................................................................... $0.13 8.2p 7.13p 6.2p 5.4p 4.6Final ........................................................................... $0.33 20.3p 17.47p 15.2p 13.2p 11.6
Total ........................................................................... $0.46 28.5p 24.6p 21.4p 18.6p 16.2
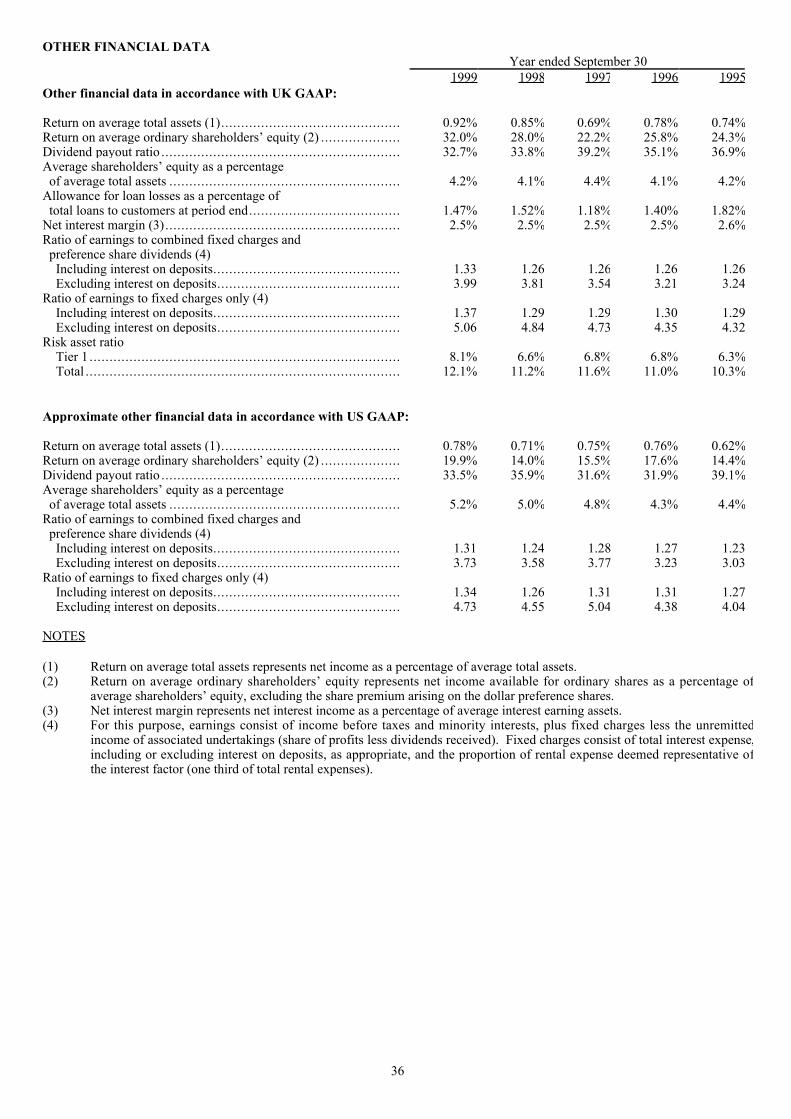
36
OTHER FINANCIAL DATAYearÊendedÊSeptemberÊ30
1999 1998 1997 1996 1995Other financial data in accordance with UK GAAP:
Return on average total assets (1)............................................. 0.92% 0.85% 0.69% 0.78% 0.74%Return on average ordinary shareholdersÕ equity (2) .................... 32.0% 28.0% 22.2% 25.8% 24.3%Dividend payout ratio ............................................................ 32.7% 33.8% 39.2% 35.1% 36.9%Average shareholdersÕ equity as a percentage of average total assets .......................................................... 4.2% 4.1% 4.4% 4.1% 4.2%Allowance for loan losses as a percentage of total loans to customers at period end...................................... 1.47% 1.52% 1.18% 1.40% 1.82%Net interest margin (3)........................................................... 2.5% 2.5% 2.5% 2.5% 2.6%Ratio of earnings to combined fixed charges and preference share dividends (4) Including interest on deposits............................................... 1.33 1.26 1.26 1.26 1.26 Excluding interest on deposits.............................................. 3.99 3.81 3.54 3.21 3.24Ratio of earnings to fixed charges only (4) Including interest on deposits............................................... 1.37 1.29 1.29 1.30 1.29 Excluding interest on deposits.............................................. 5.06 4.84 4.73 4.35 4.32Risk asset ratio Tier 1 .............................................................................. 8.1% 6.6% 6.8% 6.8% 6.3% Total ............................................................................... 12.1% 11.2% 11.6% 11.0% 10.3%
Approximate other financial data in accordance with US GAAP:
Return on average total assets (1)............................................. 0.78% 0.71% 0.75% 0.76% 0.62%Return on average ordinary shareholdersÕ equity (2) .................... 19.9% 14.0% 15.5% 17.6% 14.4%Dividend payout ratio ............................................................ 33.5% 35.9% 31.6% 31.9% 39.1%Average shareholdersÕ equity as a percentage of average total assets .......................................................... 5.2% 5.0% 4.8% 4.3% 4.4%Ratio of earnings to combined fixed charges and preference share dividends (4) Including interest on deposits............................................... 1.31 1.24 1.28 1.27 1.23 Excluding interest on deposits.............................................. 3.73 3.58 3.77 3.23 3.03Ratio of earnings to fixed charges only (4) Including interest on deposits............................................... 1.34 1.26 1.31 1.31 1.27 Excluding interest on deposits.............................................. 4.73 4.55 5.04 4.38 4.04
NOTES
(1) Return on average total assets represents net income as a percentage of average total assets.(2) Return on average ordinary shareholdersÕ equity represents net income available for ordinary shares as a percentage of
average shareholdersÕ equity, excluding the share premium arising on the dollar preference shares.(3) Net interest margin represents net interest income as a percentage of average interest earning assets.(4) For this purpose, earnings consist of income before taxes and minority interests, plus fixed charges less the unremitted
income of associated undertakings (share of profits less dividends received). Fixed charges consist of total interest expense,including or excluding interest on deposits, as appropriate, and the proportion of rental expense deemed representative ofthe interest factor (one third of total rental expenses).
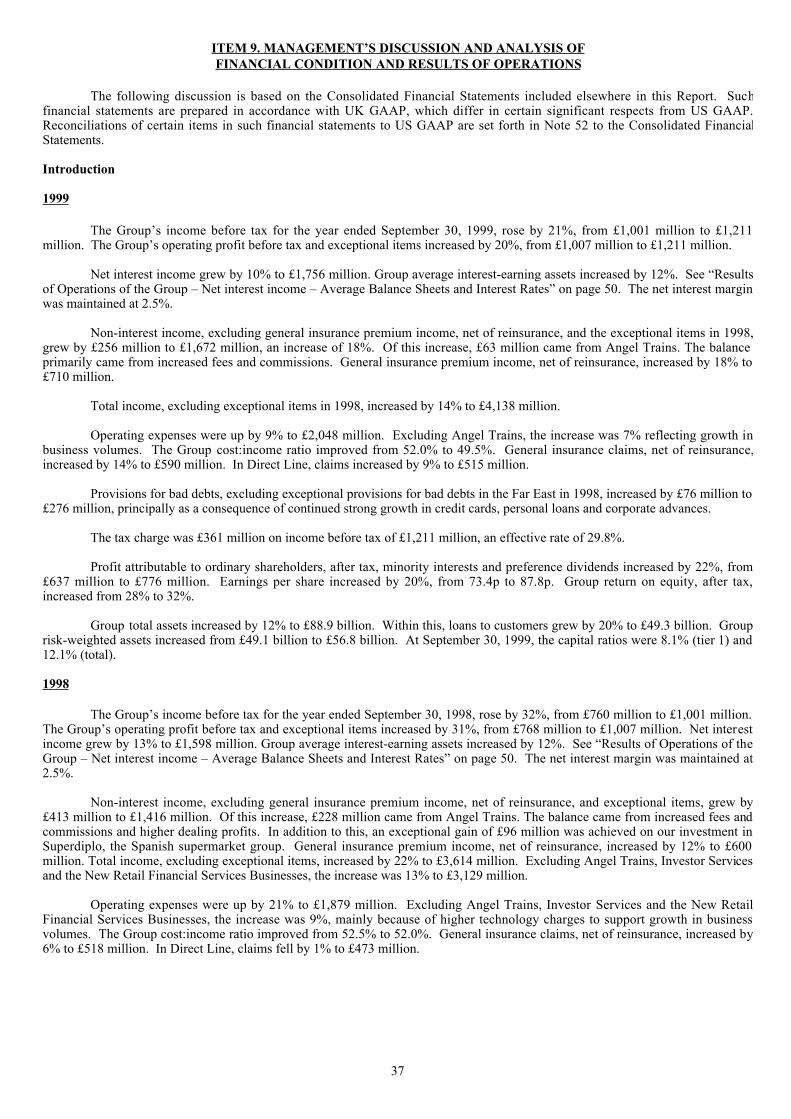
37
ITEM 9. MANAGEMENTÕS DISCUSSION AND ANALYSIS OFFINANCIAL CONDITION AND RESULTS OF OPERATIONS
The following discussion is based on the Consolidated Financial Statements included elsewhere in this Report. Suchfinancial statements are prepared in accordance with UK GAAP, which differ in certain significant respects from US GAAP.Reconciliations of certain items in such financial statements to US GAAP are set forth in Note 52 to the Consolidated FinancialStatements.
Introduction
1999
The GroupÕs income before tax for the year ended September 30, 1999, rose by 21%, from £1,001 million to £1,211million. The GroupÕs operating profit before tax and exceptional items increased by 20%, from £1,007 million to £1,211 million.
Net interest income grew by 10% to £1,756 million. Group average interest-earning assets increased by 12%. See ÒResultsof Operations of the Group Ð Net interest income Ð Average Balance Sheets and Interest RatesÓ on page 50. The net interest marginwas maintained at 2.5%.
Non-interest income, excluding general insurance premium income, net of reinsurance, and the exceptional items in 1998,grew by £256 million to £1,672 million, an increase of 18%. Of this increase, £63 million came from Angel Trains. The balanceprimarily came from increased fees and commissions. General insurance premium income, net of reinsurance, increased by 18% to£710 million.
Total income, excluding exceptional items in 1998, increased by 14% to £4,138 million.
Operating expenses were up by 9% to £2,048 million. Excluding Angel Trains, the increase was 7% reflecting growth inbusiness volumes. The Group cost:income ratio improved from 52.0% to 49.5%. General insurance claims, net of reinsurance,increased by 14% to £590 million. In Direct Line, claims increased by 9% to £515 million.
Provisions for bad debts, excluding exceptional provisions for bad debts in the Far East in 1998, increased by £76 million to£276 million, principally as a consequence of continued strong growth in credit cards, personal loans and corporate advances.
The tax charge was £361 million on income before tax of £1,211 million, an effective rate of 29.8%.
Profit attributable to ordinary shareholders, after tax, minority interests and preference dividends increased by 22%, from£637 million to £776 million. Earnings per share increased by 20%, from 73.4p to 87.8p. Group return on equity, after tax,increased from 28% to 32%.
Group total assets increased by 12% to £88.9 billion. Within this, loans to customers grew by 20% to £49.3 billion. Grouprisk-weighted assets increased from £49.1 billion to £56.8 billion. At September 30, 1999, the capital ratios were 8.1% (tier 1) and12.1% (total).
1998
The GroupÕs income before tax for the year ended September 30, 1998, rose by 32%, from £760 million to £1,001 million.The GroupÕs operating profit before tax and exceptional items increased by 31%, from £768 million to £1,007 million. Net interestincome grew by 13% to £1,598 million. Group average interest-earning assets increased by 12%. See ÒResults of Operations of theGroup Ð Net interest income Ð Average Balance Sheets and Interest RatesÓ on page 50. The net interest margin was maintained at2.5%.
Non-interest income, excluding general insurance premium income, net of reinsurance, and exceptional items, grew by£413 million to £1,416 million. Of this increase, £228 million came from Angel Trains. The balance came from increased fees andcommissions and higher dealing profits. In addition to this, an exceptional gain of £96 million was achieved on our investment inSuperdiplo, the Spanish supermarket group. General insurance premium income, net of reinsurance, increased by 12% to £600million. Total income, excluding exceptional items, increased by 22% to £3,614 million. Excluding Angel Trains, Investor Servicesand the New Retail Financial Services Businesses, the increase was 13% to £3,129 million.
Operating expenses were up by 21% to £1,879 million. Excluding Angel Trains, Investor Services and the New RetailFinancial Services Businesses, the increase was 9%, mainly because of higher technology charges to support growth in businessvolumes. The Group cost:income ratio improved from 52.5% to 52.0%. General insurance claims, net of reinsurance, increased by6% to £518 million. In Direct Line, claims fell by 1% to £473 million.
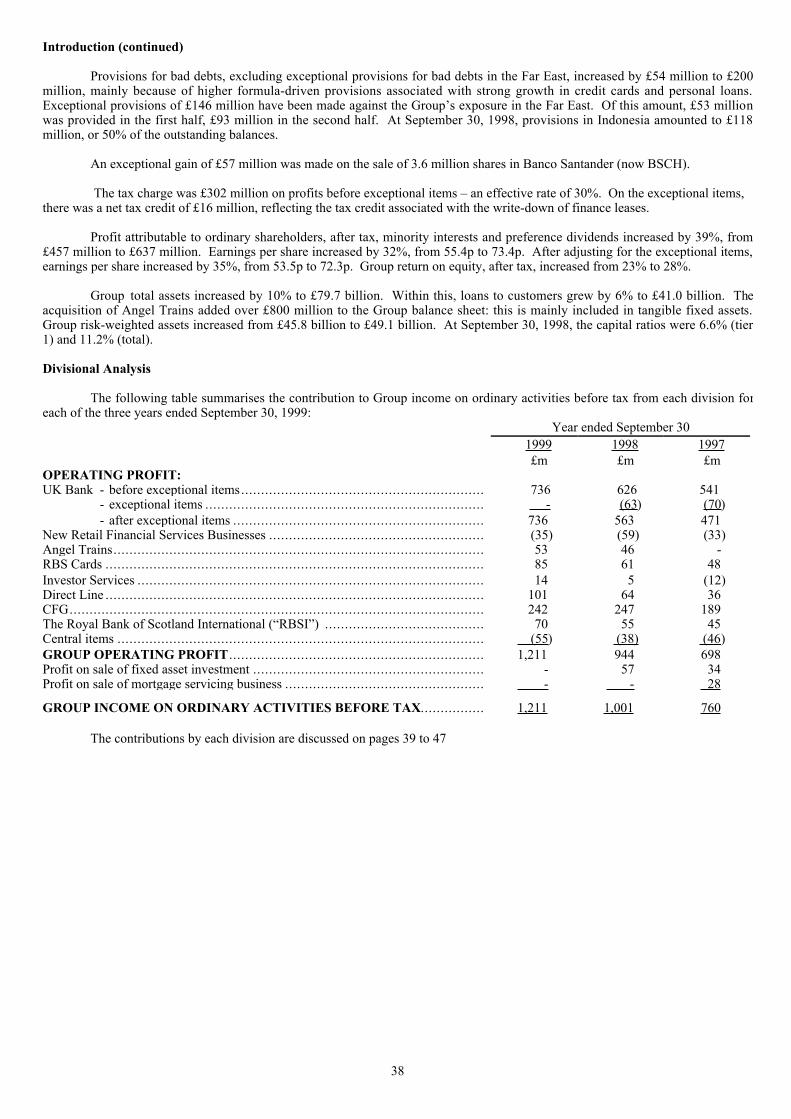
38
Introduction (continued)
Provisions for bad debts, excluding exceptional provisions for bad debts in the Far East, increased by £54 million to £200million, mainly because of higher formula-driven provisions associated with strong growth in credit cards and personal loans.Exceptional provisions of £146 million have been made against the GroupÕs exposure in the Far East. Of this amount, £53 millionwas provided in the first half, £93 million in the second half. At September 30, 1998, provisions in Indonesia amounted to £118million, or 50% of the outstanding balances.
An exceptional gain of £57 million was made on the sale of 3.6 million shares in Banco Santander (now BSCH).
The tax charge was £302 million on profits before exceptional items Ð an effective rate of 30%. On the exceptional items,there was a net tax credit of £16 million, reflecting the tax credit associated with the write-down of finance leases.
Profit attributable to ordinary shareholders, after tax, minority interests and preference dividends increased by 39%, from£457 million to £637 million. Earnings per share increased by 32%, from 55.4p to 73.4p. After adjusting for the exceptional items,earnings per share increased by 35%, from 53.5p to 72.3p. Group return on equity, after tax, increased from 23% to 28%.
Group total assets increased by 10% to £79.7 billion. Within this, loans to customers grew by 6% to £41.0 billion. Theacquisition of Angel Trains added over £800 million to the Group balance sheet: this is mainly included in tangible fixed assets.Group risk-weighted assets increased from £45.8 billion to £49.1 billion. At September 30, 1998, the capital ratios were 6.6% (tier1) and 11.2% (total).
Divisional Analysis
The following table summarises the contribution to Group income on ordinary activities before tax from each division foreach of the three years ended September 30, 1999:
YearÊendedÊSeptemberÊ301999 1998 1997£m £m £m
OPERATING PROFIT:UK Bank - before exceptional items............................................................. 736 626 541
- exceptional items ...................................................................... - (63 ) (70 )- after exceptional items ............................................................... 736 563 471
New Retail Financial Services Businesses ...................................................... (35) (59) (33)Angel Trains............................................................................................. 53 46 -RBS Cards ............................................................................................... 85 61 48Investor Services ....................................................................................... 14 5 (12)Direct Line ............................................................................................... 101 64 36CFG........................................................................................................ 242 247 189The Royal Bank of Scotland International (ÒRBSIÓ) ........................................ 70 55 45Central items ............................................................................................ (55 ) (38) (46 )GROUP OPERATING PROFIT ................................................................ 1,211 944 698Profit on sale of fixed asset investment .......................................................... - 57 34Profit on sale of mortgage servicing business .................................................. - - 28
GROUP INCOME ON ORDINARY ACTIVITIES BEFORE TAX................ 1,211 1,001 760
The contributions by each division are discussed on pages 39 to 47
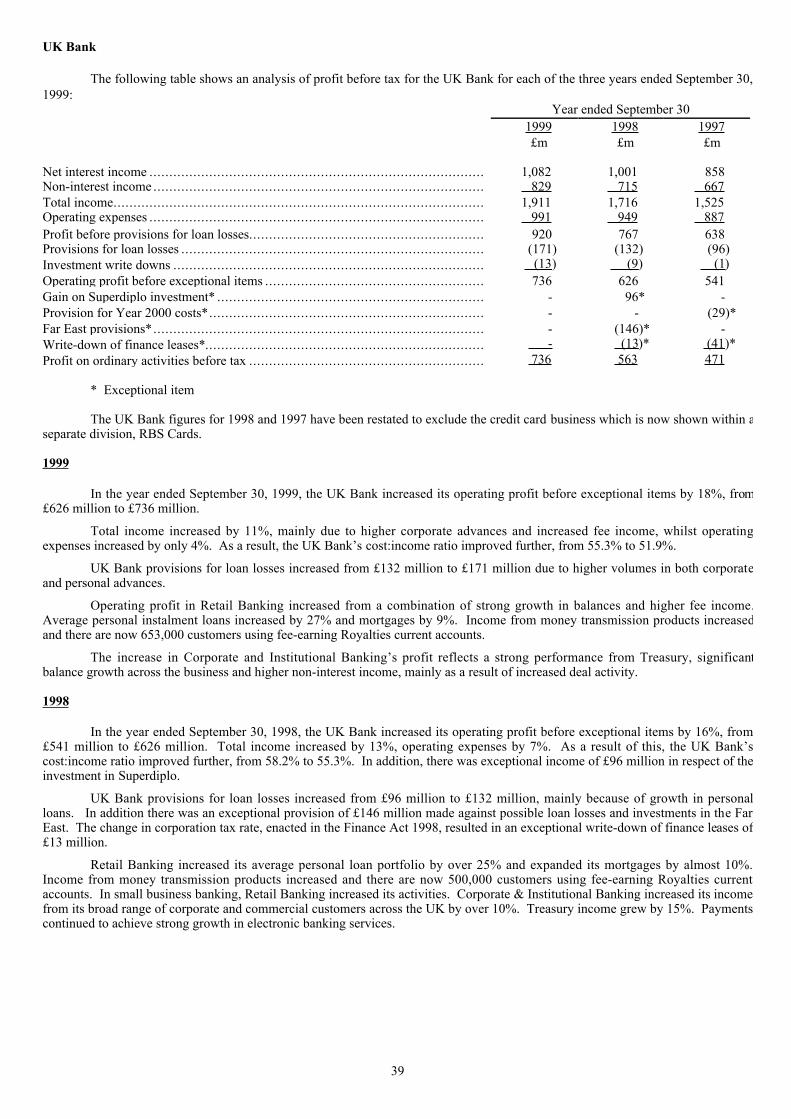
39
UK Bank
The following table shows an analysis of profit before tax for the UK Bank for each of the three years ended September 30,1999:
YearÊendedÊSeptemberÊ301999 1998 1997£m £m £m
Net interest income .................................................................................... 1,082 1,001 858Non-interest income ................................................................................... 829 715 667Total income............................................................................................. 1,911 1,716 1,525Operating expenses .................................................................................... 991 949 887Profit before provisions for loan losses........................................................... 920 767 638Provisions for loan losses ............................................................................ (171) (132) (96)Investment write downs .............................................................................. (13 ) (9 ) (1 )Operating profit before exceptional items ....................................................... 736 626 541Gain on Superdiplo investment* ................................................................... - 96* -Provision for Year 2000 costs*..................................................................... - - (29)*Far East provisions*................................................................................... - (146)* -Write-down of finance leases*...................................................................... ÊÊÊÊÊÊ- (13 )* (41 )*Profit on ordinary activities before tax ........................................................... 736 563 471
* Exceptional item
The UK Bank figures for 1998 and 1997 have been restated to exclude the credit card business which is now shown within aseparate division, RBS Cards.
1999
In the year ended September 30, 1999, the UK Bank increased its operating profit before exceptional items by 18%, from£626 million to £736 million.
Total income increased by 11%, mainly due to higher corporate advances and increased fee income, whilst operatingexpenses increased by only 4%. As a result, the UK BankÕs cost:income ratio improved further, from 55.3% to 51.9%.
UK Bank provisions for loan losses increased from £132 million to £171 million due to higher volumes in both corporateand personal advances.
Operating profit in Retail Banking increased from a combination of strong growth in balances and higher fee income.Average personal instalment loans increased by 27% and mortgages by 9%. Income from money transmission products increasedand there are now 653,000 customers using fee-earning Royalties current accounts.
The increase in Corporate and Institutional BankingÕs profit reflects a strong performance from Treasury, significantbalance growth across the business and higher non-interest income, mainly as a result of increased deal activity.
1998
In the year ended September 30, 1998, the UK Bank increased its operating profit before exceptional items by 16%, from£541 million to £626 million. Total income increased by 13%, operating expenses by 7%. As a result of this, the UK BankÕscost:income ratio improved further, from 58.2% to 55.3%. In addition, there was exceptional income of £96 million in respect of theinvestment in Superdiplo.
UK Bank provisions for loan losses increased from £96 million to £132 million, mainly because of growth in personalloans. In addition there was an exceptional provision of £146 million made against possible loan losses and investments in the FarEast. The change in corporation tax rate, enacted in the Finance Act 1998, resulted in an exceptional write-down of finance leases of£13 million.
Retail Banking increased its average personal loan portfolio by over 25% and expanded its mortgages by almost 10%.Income from money transmission products increased and there are now 500,000 customers using fee-earning Royalties currentaccounts. In small business banking, Retail Banking increased its activities. Corporate & Institutional Banking increased its incomefrom its broad range of corporate and commercial customers across the UK by over 10%. Treasury income grew by 15%. Paymentscontinued to achieve strong growth in electronic banking services.
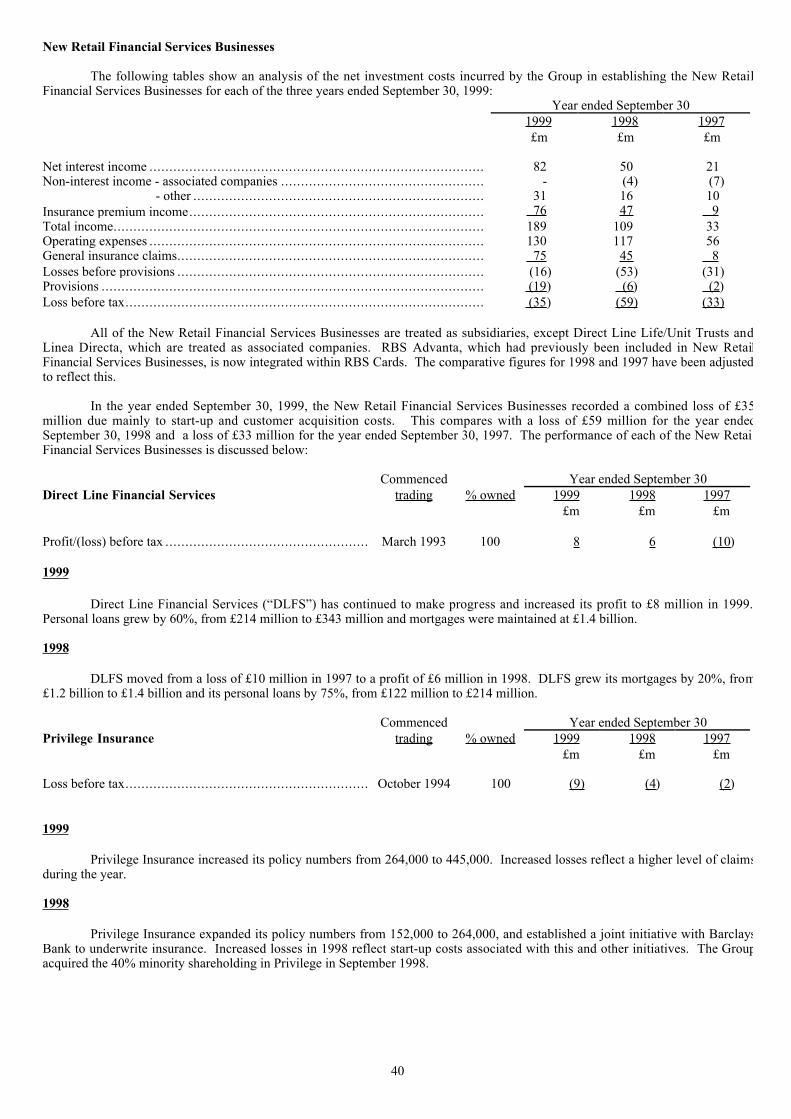
40
New Retail Financial Services Businesses
The following tables show an analysis of the net investment costs incurred by the Group in establishing the New RetailFinancial Services Businesses for each of the three years ended September 30, 1999:
YearÊendedÊSeptemberÊ301999 1998 1997£m £m £m
Net interest income .................................................................................... 82 50 21Non-interest income - associated companies ................................................... - (4) (7) - other ......................................................................... 31 16 10Insurance premium income.......................................................................... 76 47 9Total income............................................................................................. 189 109 33Operating expenses .................................................................................... 130 117 56General insurance claims............................................................................. 75 45 8Losses before provisions ............................................................................. (16) (53) (31)Provisions ................................................................................................ (19 ) (6 ) (2 )Loss before tax.......................................................................................... (35 ) (59) (33)
All of the New Retail Financial Services Businesses are treated as subsidiaries, except Direct Line Life/Unit Trusts andLinea Directa, which are treated as associated companies. RBS Advanta, which had previously been included in New RetailFinancial Services Businesses, is now integrated within RBS Cards. The comparative figures for 1998 and 1997 have been adjustedto reflect this.
In the year ended September 30, 1999, the New Retail Financial Services Businesses recorded a combined loss of £35million due mainly to start-up and customer acquisition costs. This compares with a loss of £59 million for the year endedSeptember 30, 1998 and a loss of £33 million for the year ended September 30, 1997. The performance of each of the New RetaiFinancial Services Businesses is discussed below:
Commenced Year ended September 30Direct Line Financial Services trading % owned 1999 1998 1997
£m £m £m
Profit/(loss) before tax ................................................... March 1993 100 8 6 (10 )
1999
Direct Line Financial Services (ÒDLFSÓ) has continued to make progress and increased its profit to £8 million in 1999.Personal loans grew by 60%, from £214 million to £343 million and mortgages were maintained at £1.4 billion.
1998
DLFS moved from a loss of £10 million in 1997 to a profit of £6 million in 1998. DLFS grew its mortgages by 20%, from£1.2 billion to £1.4 billion and its personal loans by 75%, from £122 million to £214 million.
Commenced Year ended September 30Privilege Insurance trading % owned 1999 1998 1997
£m £m £m
Loss before tax............................................................. October 1994 100 (9) (4 ) (2 )
1999
Privilege Insurance increased its policy numbers from 264,000 to 445,000. Increased losses reflect a higher level of claimsduring the year.
1998
Privilege Insurance expanded its policy numbers from 152,000 to 264,000, and established a joint initiative with BarclaysBank to underwrite insurance. Increased losses in 1998 reflect start-up costs associated with this and other initiatives. The Groupacquired the 40% minority shareholding in Privilege in September 1998.
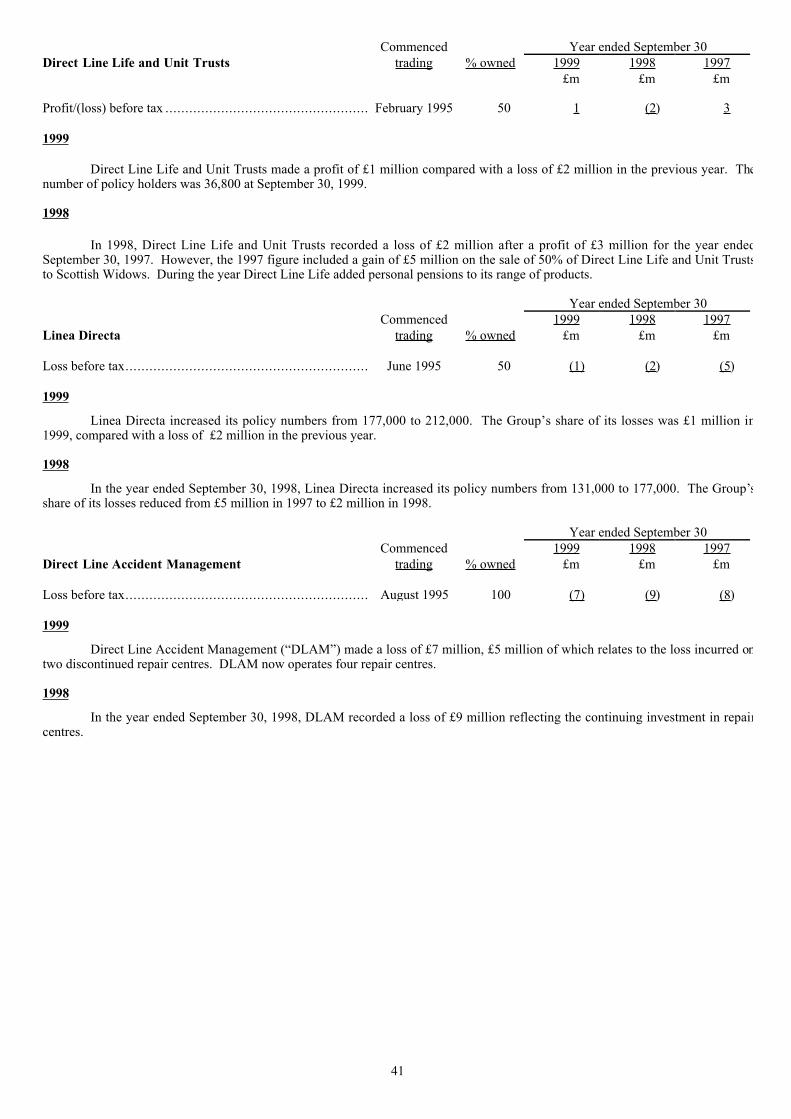
41
Commenced Year ended September 30Direct Line Life and Unit Trusts trading % owned 1999 1998 1997
£m £m £m
Profit/(loss) before tax ................................................... February 1995 50 1 (2 ) 3
1999
Direct Line Life and Unit Trusts made a profit of £1 million compared with a loss of £2 million in the previous year. Thenumber of policy holders was 36,800 at September 30, 1999.
1998
In 1998, Direct Line Life and Unit Trusts recorded a loss of £2 million after a profit of £3 million for the year endedSeptember 30, 1997. However, the 1997 figure included a gain of £5 million on the sale of 50% of Direct Line Life and Unit Truststo Scottish Widows. During the year Direct Line Life added personal pensions to its range of products.
Year ended September 30Commenced 1999 1998 1997
Linea Directa trading % owned £m £m £m
Loss before tax............................................................. June 1995 50 (1) (2 ) (5 )
1999
Linea Directa increased its policy numbers from 177,000 to 212,000. The GroupÕs share of its losses was £1 million in1999, compared with a loss of £2 million in the previous year.
1998
In the year ended September 30, 1998, Linea Directa increased its policy numbers from 131,000 to 177,000. The GroupÕsshare of its losses reduced from £5 million in 1997 to £2 million in 1998.
Year ended September 30Commenced 1999 1998 1997
Direct Line Accident Management trading % owned £m £m £m
Loss before tax............................................................. August 1995 100 (7) (9 ) (8 )
1999
Direct Line Accident Management (ÒDLAMÓ) made a loss of £7 million, £5 million of which relates to the loss incurred ontwo discontinued repair centres. DLAM now operates four repair centres.
1998
In the year ended September 30, 1998, DLAM recorded a loss of £9 million reflecting the continuing investment in repaircentres.

42
New Retail Financial Services Businesses (continued)
Year ended September 30Commenced 1999 1998 1997
Tesco Personal Finance trading % owned £m £m £m
Loss before tax............................................................. July 1997 50 (12) (35 ) (11 )
1999
Tesco Personal Finance made a loss of £12 million compared with a loss of £35 million in the previous year. By the end ofthe year, the venture was trading profitably. At September 30, 1999, Tesco Personal Finance had deposits of £978 million (1998 -£735 million) and advances of £846 million (1998 - £259 million).
1998
During the year to September 30, 1998 Tesco Personal Finance extended its range of financial products, with the launch ofpersonal loans, home and travel insurance. By September 30, 1998, Tesco Personal Finance had acquired over 600,000 customers.Its loss of £35 million in 1998 reflects start-up costs. After minority interests, the GroupÕs share of this loss was £17.5 million. In1998, the second half loss of £12 million was substantially lower than the £23 million loss in the first half.
Year ended September 30Commenced 1999 1998 1997
Virgin Direct Personal Finance trading % owned £m £m £m
Loss before tax............................................................ October 1997 50 (15) (13 ) ÊÊÊÊ-
1999
In 1999, Virgin Direct Personal Finance made a loss of £15 million, mainly due to marketing costs, compared with a loss of£13 million in the previous year. At September 30, 1999, Virgin Direct Personal Finance had advances of £790 million comparedwith £155 million at September 30, 1998.
1998
The loss in the year to September 30, 1998 of £13 million was caused by start-up and customer acquisition costs. VirginDirect Personal Finance launched its innovative One Account to VirginÕs own customers in October 1997 and more broadly in May1998.
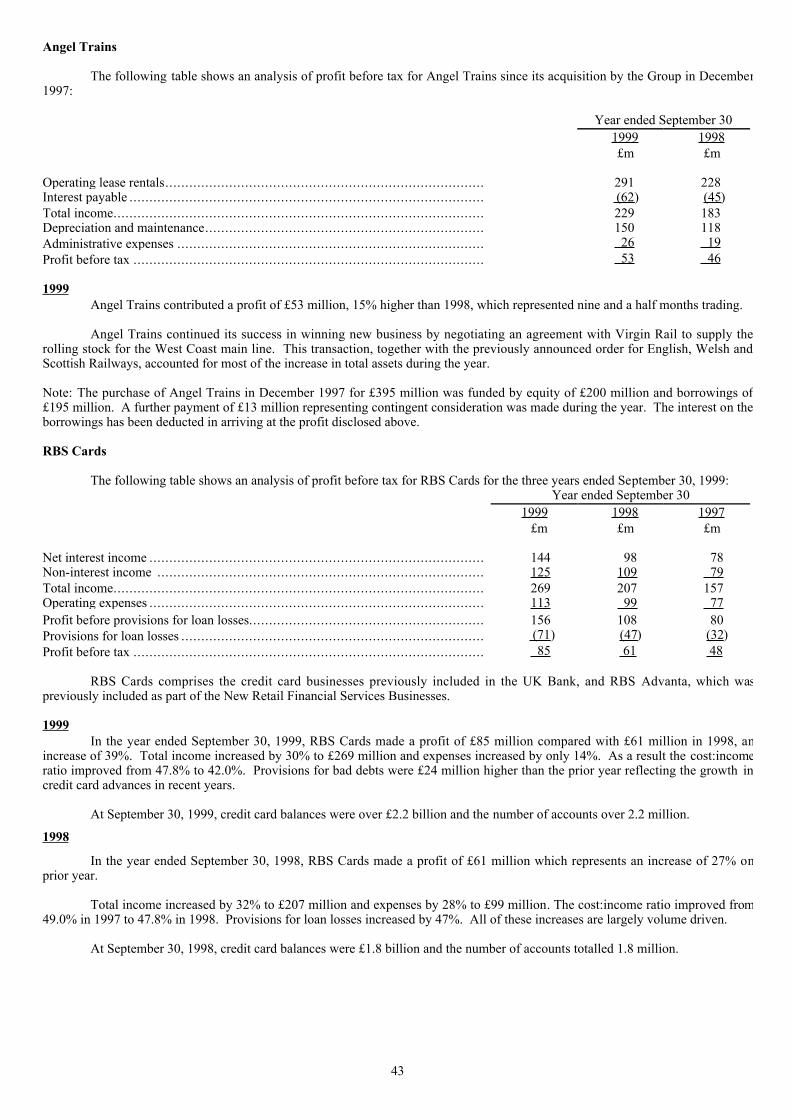
43
Angel Trains
The following table shows an analysis of profit before tax for Angel Trains since its acquisition by the Group in December1997:
YearÊendedÊSeptemberÊ301999 1998£m £m
Operating lease rentals................................................................................ 291 228Interest payable ......................................................................................... (62 ) (45 )Total income............................................................................................. 229 183Depreciation and maintenance...................................................................... 150 118Administrative expenses ............................................................................. 26 19Profit before tax ........................................................................................ 53 46
1999Angel Trains contributed a profit of £53 million, 15% higher than 1998, which represented nine and a half months trading.
Angel Trains continued its success in winning new business by negotiating an agreement with Virgin Rail to supply therolling stock for the West Coast main line. This transaction, together with the previously announced order for English, Welsh andScottish Railways, accounted for most of the increase in total assets during the year.
Note: The purchase of Angel Trains in December 1997 for £395 million was funded by equity of £200 million and borrowings of£195 million. A further payment of £13 million representing contingent consideration was made during the year. The interest on theborrowings has been deducted in arriving at the profit disclosed above.
RBS Cards
The following table shows an analysis of profit before tax for RBS Cards for the three years ended September 30, 1999:YearÊendedÊSeptemberÊ30
1999 1998 1997£m £m £m
Net interest income .................................................................................... 144 98 78Non-interest income .................................................................................. 125 109 79Total income............................................................................................. 269 207 157Operating expenses .................................................................................... 113 99 77Profit before provisions for loan losses........................................................... 156 108 80Provisions for loan losses ............................................................................ (71 ) (47 ) (32 )Profit before tax ........................................................................................ 85 61 48
RBS Cards comprises the credit card businesses previously included in the UK Bank, and RBS Advanta, which waspreviously included as part of the New Retail Financial Services Businesses.
1999In the year ended September 30, 1999, RBS Cards made a profit of £85 million compared with £61 million in 1998, an
increase of 39%. Total income increased by 30% to £269 million and expenses increased by only 14%. As a result the cost:incomeratio improved from 47.8% to 42.0%. Provisions for bad debts were £24 million higher than the prior year reflecting the growth incredit card advances in recent years.
At September 30, 1999, credit card balances were over £2.2 billion and the number of accounts over 2.2 million.
1998
In the year ended September 30, 1998, RBS Cards made a profit of £61 million which represents an increase of 27% onprior year.
Total income increased by 32% to £207 million and expenses by 28% to £99 million. The cost:income ratio improved from49.0% in 1997 to 47.8% in 1998. Provisions for loan losses increased by 47%. All of these increases are largely volume driven.
At September 30, 1998, credit card balances were £1.8 billion and the number of accounts totalled 1.8 million.
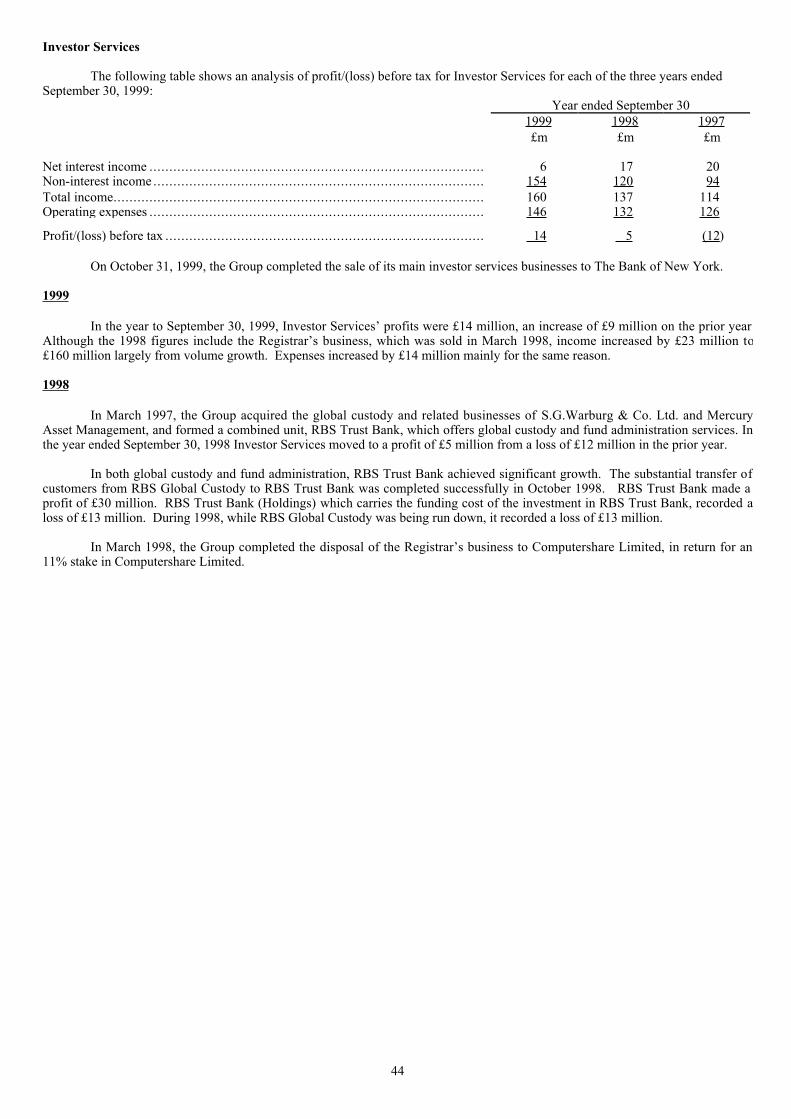
44
Investor Services
The following table shows an analysis of profit/(loss) before tax for Investor Services for each of the three years endedSeptember 30, 1999:
YearÊendedÊSeptemberÊ301999 1998 1997£m £m £m
Net interest income .................................................................................... 6 17 20Non-interest income ................................................................................... 154 120 94Total income............................................................................................. 160 137 114Operating expenses .................................................................................... 146 132 126
Profit/(loss) before tax ................................................................................ 14 5 (12 )
On October 31, 1999, the Group completed the sale of its main investor services businesses to The Bank of New York.
1999
In the year to September 30, 1999, Investor ServicesÕ profits were £14 million, an increase of £9 million on the prior yearAlthough the 1998 figures include the RegistrarÕs business, which was sold in March 1998, income increased by £23 million to£160 million largely from volume growth. Expenses increased by £14 million mainly for the same reason.
1998
In March 1997, the Group acquired the global custody and related businesses of S.G.Warburg & Co. Ltd. and MercuryAsset Management, and formed a combined unit, RBS Trust Bank, which offers global custody and fund administration services. Inthe year ended September 30, 1998 Investor Services moved to a profit of £5 million from a loss of £12 million in the prior year.
In both global custody and fund administration, RBS Trust Bank achieved significant growth. The substantial transfer ofcustomers from RBS Global Custody to RBS Trust Bank was completed successfully in October 1998. RBS Trust Bank made aprofit of £30 million. RBS Trust Bank (Holdings) which carries the funding cost of the investment in RBS Trust Bank, recorded aloss of £13 million. During 1998, while RBS Global Custody was being run down, it recorded a loss of £13 million.
In March 1998, the Group completed the disposal of the RegistrarÕs business to Computershare Limited, in return for an11% stake in Computershare Limited.
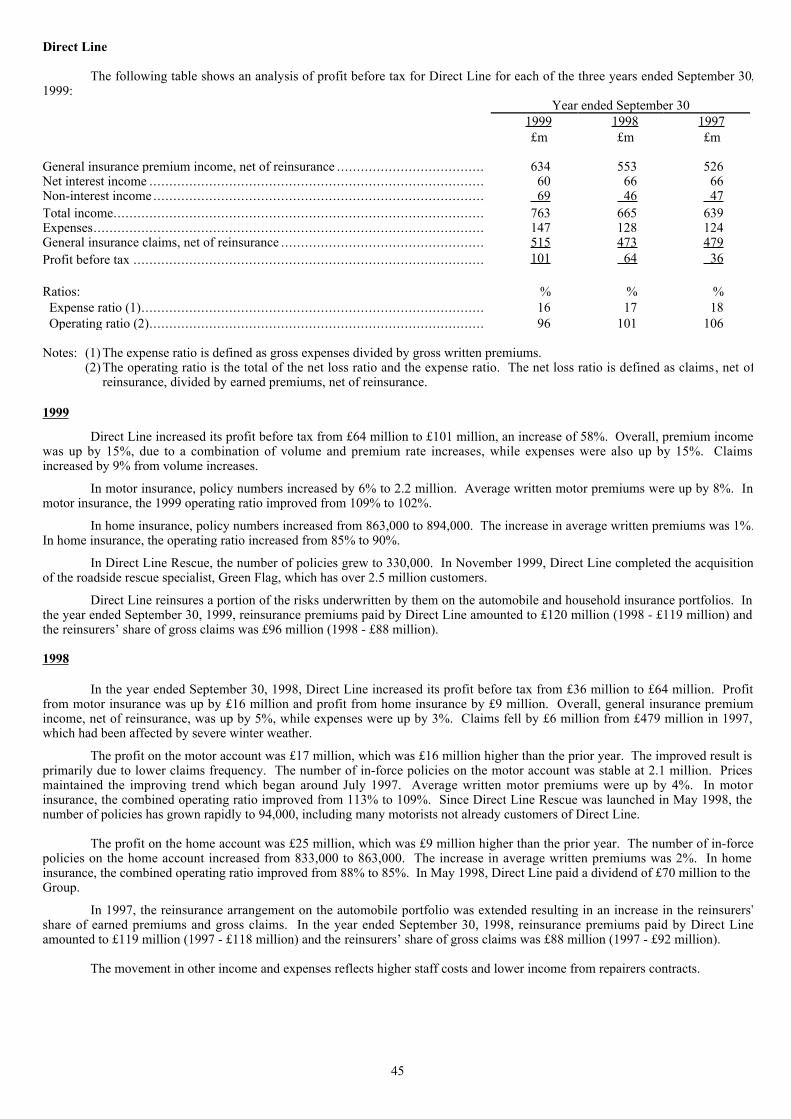
45
Direct Line
The following table shows an analysis of profit before tax for Direct Line for each of the three years ended September 30,1999:
YearÊendedÊSeptemberÊ301999 1998 1997£m £m £m
General insurance premium income, net of reinsurance ..................................... 634 553 526Net interest income .................................................................................... 60 66 66Non-interest income ................................................................................... 69 46 47Total income............................................................................................. 763 665 639Expenses.................................................................................................. 147 128 124General insurance claims, net of reinsurance ................................................... 515 473 479Profit before tax ........................................................................................ 101 ÊÊ64 36
Ratios: % % % Expense ratio (1)...................................................................................... 16 17 18 Operating ratio (2).................................................................................... 96 101 106
Notes: (1) The expense ratio is defined as gross expenses divided by gross written premiums.(2) The operating ratio is the total of the net loss ratio and the expense ratio. The net loss ratio is defined as claims, net of
reinsurance, divided by earned premiums, net of reinsurance.
1999
Direct Line increased its profit before tax from £64 million to £101 million, an increase of 58%. Overall, premium incomewas up by 15%, due to a combination of volume and premium rate increases, while expenses were also up by 15%. Claimsincreased by 9% from volume increases.
In motor insurance, policy numbers increased by 6% to 2.2 million. Average written motor premiums were up by 8%. Inmotor insurance, the 1999 operating ratio improved from 109% to 102%.
In home insurance, policy numbers increased from 863,000 to 894,000. The increase in average written premiums was 1%.In home insurance, the operating ratio increased from 85% to 90%.
In Direct Line Rescue, the number of policies grew to 330,000. In November 1999, Direct Line completed the acquisitionof the roadside rescue specialist, Green Flag, which has over 2.5 million customers.
Direct Line reinsures a portion of the risks underwritten by them on the automobile and household insurance portfolios. Inthe year ended September 30, 1999, reinsurance premiums paid by Direct Line amounted to £120 million (1998 - £119 million) andthe reinsurersÕ share of gross claims was £96 million (1998 - £88 million).
1998
In the year ended September 30, 1998, Direct Line increased its profit before tax from £36 million to £64 million. Profitfrom motor insurance was up by £16 million and profit from home insurance by £9 million. Overall, general insurance premiumincome, net of reinsurance, was up by 5%, while expenses were up by 3%. Claims fell by £6 million from £479 million in 1997,which had been affected by severe winter weather.
The profit on the motor account was £17 million, which was £16 million higher than the prior year. The improved result isprimarily due to lower claims frequency. The number of in-force policies on the motor account was stable at 2.1 million. Pricesmaintained the improving trend which began around July 1997. Average written motor premiums were up by 4%. In motorinsurance, the combined operating ratio improved from 113% to 109%. Since Direct Line Rescue was launched in May 1998, thenumber of policies has grown rapidly to 94,000, including many motorists not already customers of Direct Line.
The profit on the home account was £25 million, which was £9 million higher than the prior year. The number of in-forcepolicies on the home account increased from 833,000 to 863,000. The increase in average written premiums was 2%. In homeinsurance, the combined operating ratio improved from 88% to 85%. In May 1998, Direct Line paid a dividend of £70 million to theGroup.
In 1997, the reinsurance arrangement on the automobile portfolio was extended resulting in an increase in the reinsurersÕshare of earned premiums and gross claims. In the year ended September 30, 1998, reinsurance premiums paid by Direct Lineamounted to £119 million (1997 - £118 million) and the reinsurersÕ share of gross claims was £88 million (1997 - £92 million).
The movement in other income and expenses reflects higher staff costs and lower income from repairers contracts.

46
CFG
The following table shows an analysis of income before tax for CFG for each of the three years ended September 30, 1999:YearÊendedÊSeptemberÊ30
1999 1998 1997£m £m £m
Net interest income .................................................................................... 408 376 352Non-interest income ................................................................................... 141 117 98Total income............................................................................................. 549 493 450Operating expenses .................................................................................... 292 264 245Income before provisions for loan losses ........................................................ 257 229 205Provisions for loan losses ............................................................................ (15 ) (15 ) (16 )
242 214 189Gain on sale of consumer credit card portfolio................................................. - 33 -Gain on sale of mortgage servicing business ................................................... - - 28Income before tax ...................................................................................... 242 247 217
1999
CFGÕs income before tax of £242 million for the year ended September 30, 1999 was 13% higher than the prior year profitadjusted for the one-off gain of £33 million in 1998 on the sale of its consumer credit card portfolio. Excluding this gain, thecost:income ratio shows an improvement from 53.5% to 53.2%.
Income, excluding the one-off gain in 1998, was up by 11%, and operating expenses were also up by 11%. The increase inCFGÕs income reflects strong volume growth in both commercial and consumer loans and increased income from service fees.
In the year ended September 30, 1999, CFGÕs income on ordinary activities before tax under US GAAP increased by 14%to $344 million, excluding the $55 million one-off gain in 1998. Net interest income increased by $50 million to $671 million. Non-interest income, excluding the $55 million one-off gain, increased from $202 million to $234 million and operating expenses by 8%to $540 million.
In October 1999, CFG completed the acquisition of the major part of the commercial banking business of State StreetCorporation for a cash premium of US$350 million over net assets acquired. This business has commercial loans totalling US$2.3billion and deposits of US$1.1 billion.
In June 1999, CFG announced that it had entered into an agreement to acquire, by way of merger, the entire issued sharecapital of UST Corp. of Boston, Massachusetts for a consideration of approximately US$1.4 billion. The acquisition is expected tocomplete in early 2000.
1998
In the year ended September 30, 1998, CFG increased its income before tax, exceptional items and one-off gains, by 13%,from £189 million to £214 million.
In the year ended September 30, 1998, total income was up by 17% and operating expenses by 8%. This led to animprovement in the cost:income ratio from 54.4% to 50.2%. Provisions for bad debts were similar to 1997. The increase in CFGÕsincome reflects strong volume growth in loans and deposits. CFG also increased its income from service fees, mutual funds andtrust funds, and made a profit of £33 million on the sale of its consumer credit card portfolio.
In September 1998, the Group acquired the Bank of IrelandÕs 23.5% minority shareholding in CFG for $750 million.
In the year ended September 30, 1998, CFGÕs income before taxes under US GAAP increased by 16% to $356 million. Netinterest income increased by $49 million to $621 million. The increase was due to continued growth in consumer and commerciallending and increased interest from securities. Non-interest income increased from $169 million to $202 million. Expensesincreased by 9% to $499 million. Operating expenses increased from $364 million to $457 million and was mainly attributable tothe impact of the acquisitions and an increase of $11 million in the amortisation of goodwill and core deposit intangibles.

47
The Royal Bank of Scotland International (ÒRBSIÓ)
The following table shows an analysis of profit before tax for RBSI for each of the three years ended September 30, 1999:
YearÊendedÊSeptemberÊ301999 1998 1997£m £m £m
Net interest income .................................................................................... 85 68 56Non-interest income ................................................................................... 44 36 30Total income............................................................................................. 129 104 86Operating expenses .................................................................................... 59 49 40Profit before provisions for loan losses........................................................... 70 55 46Investment write-downs .............................................................................. - - (1 )Operating profit before exceptional items ....................................................... 70 55 45Profit on sale of fixed asset investment .......................................................... - - 10Profit before tax ........................................................................................ 70 55 55
1999
RBSI, headquartered in Jersey, increased its profit from offshore banking by 27% to £70 million (1998 - £55 million)Total income rose by 24% and operating expenses by 20%, reflecting continued growth in the business.
RBSI continues to make good progress in each of its four main activities: offshore personal banking, investor services, thetreasury operation and its corporate banking services.
On October 31, 1999, RBSI completed the sale of 30% of its investor services businesses to The Bank of New York.
1998
In the year to September 30, 1998, RBSI increased its operating profit before exceptional items by 22% to £55 million(1997 - £45 million). Total income rose by 21% and operating expenses rose by 22%, reflecting growth in the business and the full-year impact of the acquisition in March 1997 of the offshore custody business of S.G.Warburg & Co. Ltd. Excluding the custodybusiness, total income was up by 12% and operating expenses by 9%.
In offshore personal banking, profits increased by 24%. The two custody businesses have been integrated and the combinedbusiness is one of the largest custodians in Jersey, responsible for funds amounting to £14 billion. The treasury operation has aleading position in offshore money market and foreign exchange business and its income grew by 26%. RBSI expanded itscorporate banking services, including electronic banking services, for offshore financial intermediaries.
Central items
The following table shows an analysis of Central items for each of the three years ended September 30, 1999:
YearÊendedÊSeptemberÊ301999 1998 1997£m £m £m
Central income less expenses ....................................................................... 16 2 (16)Funding costs............................................................................................ (71 ) (40 ) (30 )
Loss before exceptional items ...................................................................... (55) (38) (46)Profit on sale of fixed asset investment .......................................................... - 57 24
(Loss)/profit before tax ............................................................................... (55 ) 19 (22 )
Central items comprise the GroupÕs central management expenses, net central financing costs of investments in the GroupÕsbusiness units and the GroupÕs share of profits of certain associated undertakings.
The loss before exceptional items for the year ended September 30, 1999 was £55 million compared with £38 million in theprevious year with the increase primarily due to the cost of funding increased investments in the GroupÕs business units. In 1998, anexceptional gain of £57 million was realised on the disposal of 3.6 million shares in Banco Santander (now BSCH).
In 1997, an exceptional gain of £24 million was realised from the disposal of that part of the GroupÕs shareholding in BancoEspanol de Credito held in Central items.
Results of Operations of the Group

48
Net interest income
The following table shows net interest income for each of the three years ended September 30, 1999:
YearÊendedÊSeptemberÊ301999 1998 1997£m £m £m
Interest receivable...................................................................................... 4,996 5,123 4,125Interest payable (including interest on dated and undated loan capital) ................. (3,240 ) (3,525 ) (2,711 )
1,756 1,598 1,414
The principal factors affecting the level of net interest income earned by the Group are the volume of average interestearning assets, the difference between the average rate of interest earned on average interest earning assets and the average rate ofinterest paid on average interest bearing liabilities (the interest spread), the general level of interest rates, and the proportion ofinterest earning assets financed by interest-free liabilities and shareholdersÕ equity.
1999
In the year ended September 30, 1999, the GroupÕs net interest income increased by 10% to £1,756 million. This reflectsthe growth of 12% in the GroupÕs average interest-earning assets with the net interest margin maintained at 2.5%. Strong growt hwas achieved in both corporate and personal lending.
Interest spreads in the UK and overseas widened resulting in an increase in the GroupÕs overall interest spread from 2.0% in1998 to 2.1% in 1999.
During the year, average interest-earning assets increased by £7.4 billion with loans to customers increasing by £6.2 billion.This growth was largely funded by customer deposits of £4.4 billion and debt securities in issue of £1.7 billion.
In the UK Bank, average loans increased by 10%, with business lending up by 19%, personal loans by 18% and mortgagesby 9%. CFGÕs average loans increased by 14% from a combination of higher debt securities and corporate lending. Average loansincreased by 25% in RBS Cards. Average loans in the New Retail Financial Services Businesses, mainly personal loans, increase dby over 60%.
On the liability side, the UK BankÕs average deposits grew by 7% and CFGÕs average deposits by 14%, with the increasescoming from both retail and wholesale sources. RBSIÕs average banking liabilities grew by 15% mainly from retail deposits.
1998
In the year ended September 30, 1998, the GroupÕs net interest income increased by 13% to £1,598 million. The increase innet interest is volume driven reflecting growth of 12% in average interest-earning assets. Higher business lending volumes arelargely in Corporate Banking, Structured Finance, Risk Finance and RetailÕs business segment. Personal instalment loan volumeshave increased through both direct loans and the branch network. Compared with the year ended September 30, 1997, averageinterest-earning assets increased by 12%. Within this overall increase corporate advances increased by £2.5 billion or 15%, andpersonal advances increased by 23%. Credit card advances increased by £600 million or 60%. Debt securities increased by £2.1billion or 25%. On the deposit side higher rate retail deposits increased by £4.9 billion or 29%, and wholesale deposits increased by£2.1 billion or 15%.
The net interest margin for the Group was unchanged at 2.5%. In the UK, interest spreads and margins improved slightlycompared with 1997. Overseas the interest spread reduced from 2.9% to 2.8% resulting in the Group interest spread remainingunchanged at 2.0%. During the year there were increases in wholesale and higher interest rate retail deposits which funded growth inpersonal and corporate advances.
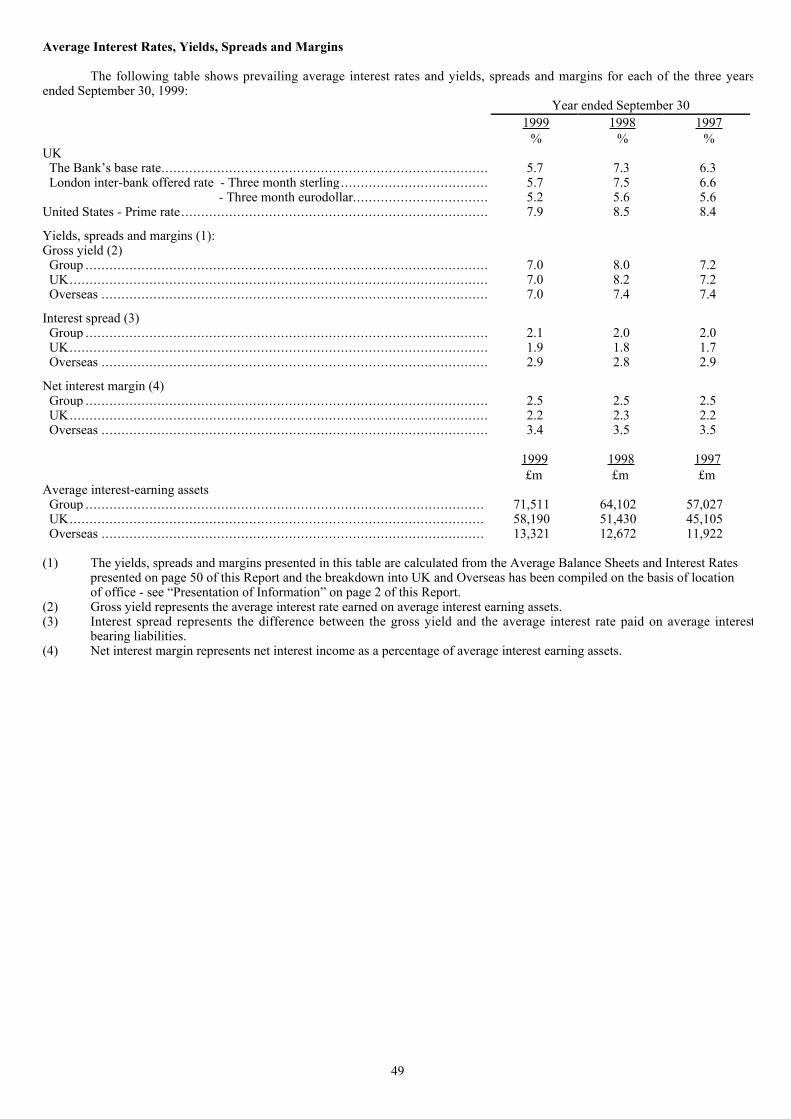
49
Average Interest Rates, Yields, Spreads and Margins
The following table shows prevailing average interest rates and yields, spreads and margins for each of the three yearsended September 30, 1999:
YearÊendedÊSeptember 301999 1998 1997
% % %UK The BankÕs base rate.................................................................................. 5.7 7.3 6.3 London inter-bank offered rate - Three month sterling..................................... 5.7 7.5 6.6 - Three month eurodollar.................................. 5.2 5.6 5.6United States - Prime rate............................................................................. 7.9 8.5 8.4
Yields, spreads and margins (1):Gross yield (2) Group ..................................................................................................... 7.0 8.0 7.2 UK......................................................................................................... 7.0 8.2 7.2 Overseas ................................................................................................. 7.0 7.4 7.4
Interest spread (3) Group ..................................................................................................... 2.1 2.0 2.0 UK......................................................................................................... 1.9 1.8 1.7 Overseas ................................................................................................. 2.9 2.8 2.9
Net interest margin (4) Group ..................................................................................................... 2.5 2.5 2.5 UK......................................................................................................... 2.2 2.3 2.2 Overseas ................................................................................................. 3.4 3.5 3.5
1999 1998 1997£m £m £m
Average interest-earning assets Group .................................................................................................... 71,511 64,102 57,027 UK........................................................................................................ 58,190 51,430 45,105 Overseas ................................................................................................ 13,321 12,672 11,922
(1) The yields, spreads and margins presented in this table are calculated from the Average Balance Sheets and Interest Rates presented on page 50 of this Report and the breakdown into UK and Overseas has been compiled on the basis of location of office - see ÒPresentation of InformationÓ on page 2 of this Report.
(2) Gross yield represents the average interest rate earned on average interest earning assets.(3) Interest spread represents the difference between the gross yield and the average interest rate paid on average interest
bearing liabilities.(4) Net interest margin represents net interest income as a percentage of average interest earning assets.

50
Average Balance Sheets and Interest Rates
The following table shows average balances and interest rates (stated on a fully taxable equivalent basis) for each of the pastthree years. Interest income figures, when used, include interest income on non-accruing loans to the extent that cash payments havebeen received.
Year ended September 301999 1998 1997
Average Average Average Average Average Averagebalance Interest rate balance Interest rate balance Interest rate
ASSETS £m £m % £m £m % £m £m %Treasury bills and other eligible bills
UK............................................................. 740 45 6.1 646 49 7.5 633 39 6.2Overseas.................................................... 3 - 4.8 30 1 5.0 38 2 4.8
Loans to banksUK............................................................. 9,157 491 5.4 11,804 783 6.6 11,262 621 5.5Overseas.................................................... 960 46 4.8 1,582 91 5.7 1,769 101 5.7
Loans to customers (1)UK............................................................. 34,209 2,625 7.7 28,777 2,550 8.9 24,927 1,980 7.9Overseas.................................................... 7,911 594 7.5 7,188 593 8.3 6,667 554 8.3
Instalment credit and finance lease receivablesUK............................................................. 3,408 282 8.3 3,358 301 9.0 3,207 264 8.2Overseas.................................................... 279 18 6.3 133 10 7.4 78 6 7.5
Debt securitiesUK............................................................. 10,676 626 5.9 6,845 503 7.4 5,076 342 6.7Overseas.................................................... 4,168 269 6.5 3,739 242 6.5 3,370 216 6.4
Total interest earning assets ÊÊÊÊÊÊÊÊÊ ÊÊÊÊÊÊÊÊ Ê ÊÊÊÊÊÊ ÊÊÊÊÊÊUK............................................................. 58,190 4,069 7.0 51,430 4,186 8.1 45,105 3,246 7.2Overseas.................................................... 13,321 927 7.0 12,672 Ê Ê937 7.4 11,922 879 7.4
Interest earning assets ...................................... 71,511 4,996 7.0 64,102 5,123 8.0 57,027 4,125 7.2Non-interest earning assets............................... 12,946 10,538 8,895Total average assets.......................................... 84,457 74,640 65,922
Percentage of assets applicable to overseas activities ...................................... 17.5% 18.6% 19.6%
LIABILITIES AND SHAREHOLDERSÕ EQUITY Deposits by banks
UK............................................................. 5,344 286 5.4 4,144 273 6.6 3,935 229 5.8Overseas.................................................... 1,038 48 4.6 1,289 74 5.7 1,583 86 5.4
Customer accountsDemand deposits
UK............................................................. 20,370 774 3.8 18,912 983 5.2 16,156 697 4.3Overseas.................................................... 995 16 1.6 2,131 109 5.1 1,840 69 3.8
Savings depositsUK............................................................. 8,783 433 4.9 4,136 247 6.0 2,819 142 5.0Overseas.................................................... 6,441 259 4.0 6,253 257 4.1 5,963 263 4.4
Other time depositsUK............................................................. 10,622 617 5.8 12,265 881 7.2 10,769 655 6.1Overseas.................................................... 1,272 65 5.1 348 17 5.0 327 16 4.9
Debt securities in issueUK............................................................. 6,594 410 6.2 5,750 417 7.2 5,132 313 6.1Overseas.................................................... 1,674 81 4.9 812 41 5.0 621 31 5.0
Dated and undated loan capital ........................ 2,901 251 8.7 2,517 226 9.0 2,386 210 8.8Total interest bearing liabilities:
UK............................................................. 54,614 2,771 5.1 47,724 3,027 6.3 41,197 2,246 5.5Overseas.................................................... 11,420 469 4.1 10,833 ÊÊÊ498 4.6 10,334 465 4.5
Interest bearing liabilities................................. 66,034 3,240 4.9 58,557 3,525 6.0 51,531 2,711 5.2Interest-free liabilities
Demand deposits....................................... 3,010 2,877 2,716Other liabilities.......................................... 11,893 10,144 8,760
ShareholdersÕ equity......................................... 3,520 Ê3,062 2,915Total average liabilities.................................... 84,457 74,640 65,922
Percentage of liabilities applicable to overseas activities ...................................... 16.9% 17.6% 17.3%
Note: (1) Loans to customers include non accrual loans and loans classified as doubtful. See ÒDescription of Assets and Liabilities ÐAssets Ð Provision and Allowance for Loan LossesÓ on page 14.

51
Changes in Net Interest Income - Volume and Rate Analysis
The following table allocates changes in net interest income between volume and rate for 1999 compared with 1998 and1998 compared with 1997. Volume and rate variances have been calculated based on movements in average balances over theperiod and changes in interest rates on average interest earning assets and average interest bearing liabilities. Changes due to acombination of volume and rate are allocated to volume.
1999 over 1998 1998 over 1997Increase/(decrease)ÊdueÊtoÊchangesÊin:
Average Average Net Average Average Netvolume rate change volume rate change
£m £m £m £m £m £mINTEREST EARNING ASSETS
Treasury bills and other eligible billsUK........................................................................ 6 (10) (4) 1 9 10Overseas............................................................... (1) - (1) (1) - (1)
Loans to banksUK........................................................................ (142) (150) (292) 36 126 162Overseas............................................................... (30) (15) (45) (10) - (10)
Loans to customersUK........................................................................ 417 (342) 75 341 229 570Overseas............................................................... 54 (53) 1 44 (5) 39
Instalment credit and finance lease receivablesUK........................................................................ 4 (23) (19) 13 24 37Overseas............................................................... 9 (1) 8 4 - 4
Debt SecuritiesUK........................................................................ 225 (102) 123 130 31 161Overseas............................................................... 27 - 27 24 2 26
Total interest income.......................................... 569 (696 ) (127 ) 582 416 998
INTEREST BEARING LIABILITIES
Deposits by banksUK........................................................................ 64 (51) 13 14 30 44Overseas............................................................... (11) (15) (26) (16) 4 (12)
Customer accountsDemand deposits
UK........................................................................ 55 (264) (209) 143 143 286Overseas...................................................................... (18) (75) (93) 15 25 40Savings deposits
UK........................................................................ 229 (43) 186 78 27 105Overseas............................................................... 8 (6) 2 12 (18) (6)
Other time depositsUK........................................................................ (95) (169) (264) 107 119 226Overseas............................................................... 47 1 48 1 - 1
Debt securities in issueUK........................................................................ 52 (59) (7) 45 59 104Overseas............................................................... 42 (2) 40 10 - 10
Dated and undated loan capital ................................... 33 (8 ) 25 11 5 16
Total interest expense........................................... 406 (691 ) (285) 420 394 814
Net interest incomeUK........................................................................ (172) 33 139 123 36 159Overseas............................................................... 9 (28 ) 19 39 (14 ) 25
Net interest income ............................................ (163 ) 5 158 162 22 184
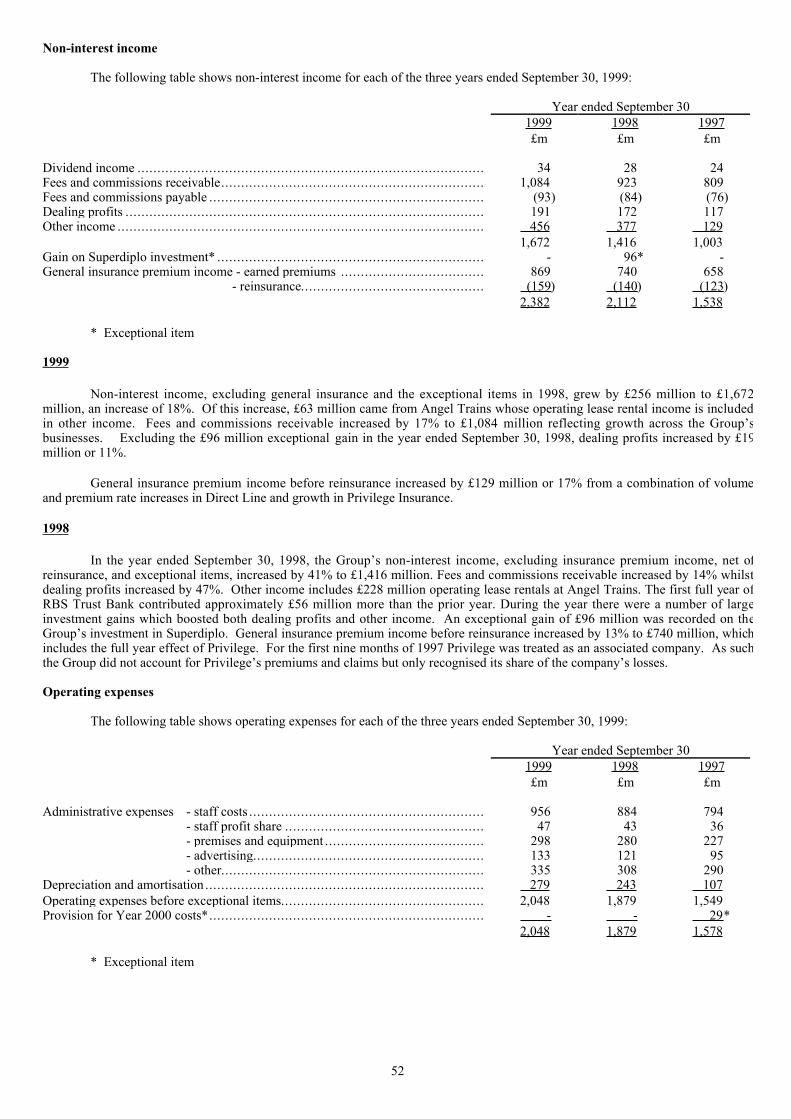
52
Non-interest income
The following table shows non-interest income for each of the three years ended September 30, 1999:
Year ended September 301999 1998 1997£m £m £m
Dividend income ....................................................................................... 34 28 24Fees and commissions receivable.................................................................. 1,084 923 809Fees and commissions payable ..................................................................... (93) (84) (76)Dealing profits .......................................................................................... 191 172 117Other income ............................................................................................ 456 377 129
1,672 1,416 1,003Gain on Superdiplo investment* ................................................................... - 96* -General insurance premium income - earned premiums .................................... 869 740 658 - reinsurance.............................................. (159 ) (140 ) (123 )
2,382 2,112 1,538
* Exceptional item
1999
Non-interest income, excluding general insurance and the exceptional items in 1998, grew by £256 million to £1,672million, an increase of 18%. Of this increase, £63 million came from Angel Trains whose operating lease rental income is includedin other income. Fees and commissions receivable increased by 17% to £1,084 million reflecting growth across the GroupÕsbusinesses. Excluding the £96 million exceptional gain in the year ended September 30, 1998, dealing profits increased by £19million or 11%.
General insurance premium income before reinsurance increased by £129 million or 17% from a combination of volumeand premium rate increases in Direct Line and growth in Privilege Insurance.
1998
In the year ended September 30, 1998, the GroupÕs non-interest income, excluding insurance premium income, net ofreinsurance, and exceptional items, increased by 41% to £1,416 million. Fees and commissions receivable increased by 14% whilstdealing profits increased by 47%. Other income includes £228 million operating lease rentals at Angel Trains. The first full year ofRBS Trust Bank contributed approximately £56 million more than the prior year. During the year there were a number of largeinvestment gains which boosted both dealing profits and other income. An exceptional gain of £96 million was recorded on theGroupÕs investment in Superdiplo. General insurance premium income before reinsurance increased by 13% to £740 million, whichincludes the full year effect of Privilege. For the first nine months of 1997 Privilege was treated as an associated company. As suchthe Group did not account for PrivilegeÕs premiums and claims but only recognised its share of the companyÕs losses.
Operating expenses
The following table shows operating expenses for each of the three years ended September 30, 1999:
Year ended September 301999 1998 1997£m £m £m
Administrative expenses - staff costs ........................................................... 956 884 794- staff profit share .................................................. 47 43 36- premises and equipment ........................................ 298 280 227- advertising.......................................................... 133 121 95- other.................................................................. 335 308 290
Depreciation and amortisation ...................................................................... 279 243 107Operating expenses before exceptional items................................................... 2,048 1,879 1,549Provision for Year 2000 costs*..................................................................... - - 29 *
2,048 1,879 1,578
* Exceptional item
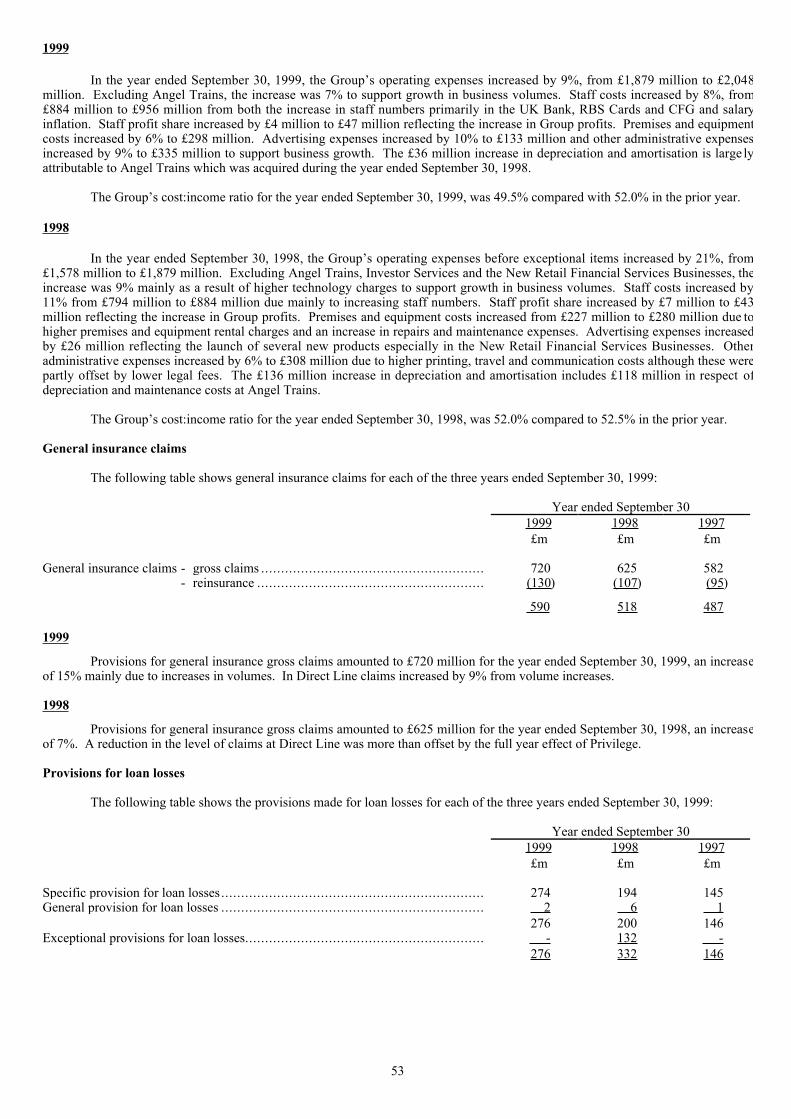
53
1999
In the year ended September 30, 1999, the GroupÕs operating expenses increased by 9%, from £1,879 million to £2,048million. Excluding Angel Trains, the increase was 7% to support growth in business volumes. Staff costs increased by 8%, from£884 million to £956 million from both the increase in staff numbers primarily in the UK Bank, RBS Cards and CFG and salaryinflation. Staff profit share increased by £4 million to £47 million reflecting the increase in Group profits. Premises and equipmentcosts increased by 6% to £298 million. Advertising expenses increased by 10% to £133 million and other administrative expensesincreased by 9% to £335 million to support business growth. The £36 million increase in depreciation and amortisation is large lyattributable to Angel Trains which was acquired during the year ended September 30, 1998.
The GroupÕs cost:income ratio for the year ended September 30, 1999, was 49.5% compared with 52.0% in the prior year.
1998
In the year ended September 30, 1998, the GroupÕs operating expenses before exceptional items increased by 21%, from£1,578 million to £1,879 million. Excluding Angel Trains, Investor Services and the New Retail Financial Services Businesses, theincrease was 9% mainly as a result of higher technology charges to support growth in business volumes. Staff costs increased by11% from £794 million to £884 million due mainly to increasing staff numbers. Staff profit share increased by £7 million to £43million reflecting the increase in Group profits. Premises and equipment costs increased from £227 million to £280 million due tohigher premises and equipment rental charges and an increase in repairs and maintenance expenses. Advertising expenses increasedby £26 million reflecting the launch of several new products especially in the New Retail Financial Services Businesses. Otheradministrative expenses increased by 6% to £308 million due to higher printing, travel and communication costs although these werepartly offset by lower legal fees. The £136 million increase in depreciation and amortisation includes £118 million in respect ofdepreciation and maintenance costs at Angel Trains.
The GroupÕs cost:income ratio for the year ended September 30, 1998, was 52.0% compared to 52.5% in the prior year.
General insurance claims
The following table shows general insurance claims for each of the three years ended September 30, 1999:
YearÊendedÊSeptemberÊ301999 1998 1997£m £m £m
General insurance claims - gross claims ........................................................ 720 625 582 - reinsurance ......................................................... (130 ) (107 ) (95 )
590 518 487
1999
Provisions for general insurance gross claims amounted to £720 million for the year ended September 30, 1999, an increaseof 15% mainly due to increases in volumes. In Direct Line claims increased by 9% from volume increases.
1998
Provisions for general insurance gross claims amounted to £625 million for the year ended September 30, 1998, an increaseof 7%. A reduction in the level of claims at Direct Line was more than offset by the full year effect of Privilege.
Provisions for loan losses
The following table shows the provisions made for loan losses for each of the three years ended September 30, 1999:
YearÊendedÊSeptemberÊ301999 1998 1997£m £m £m
Specific provision for loan losses.................................................................. 274 194 145General provision for loan losses .................................................................. 2 6 1
276 200 146Exceptional provisions for loan losses............................................................ - 132 -
276 332 146
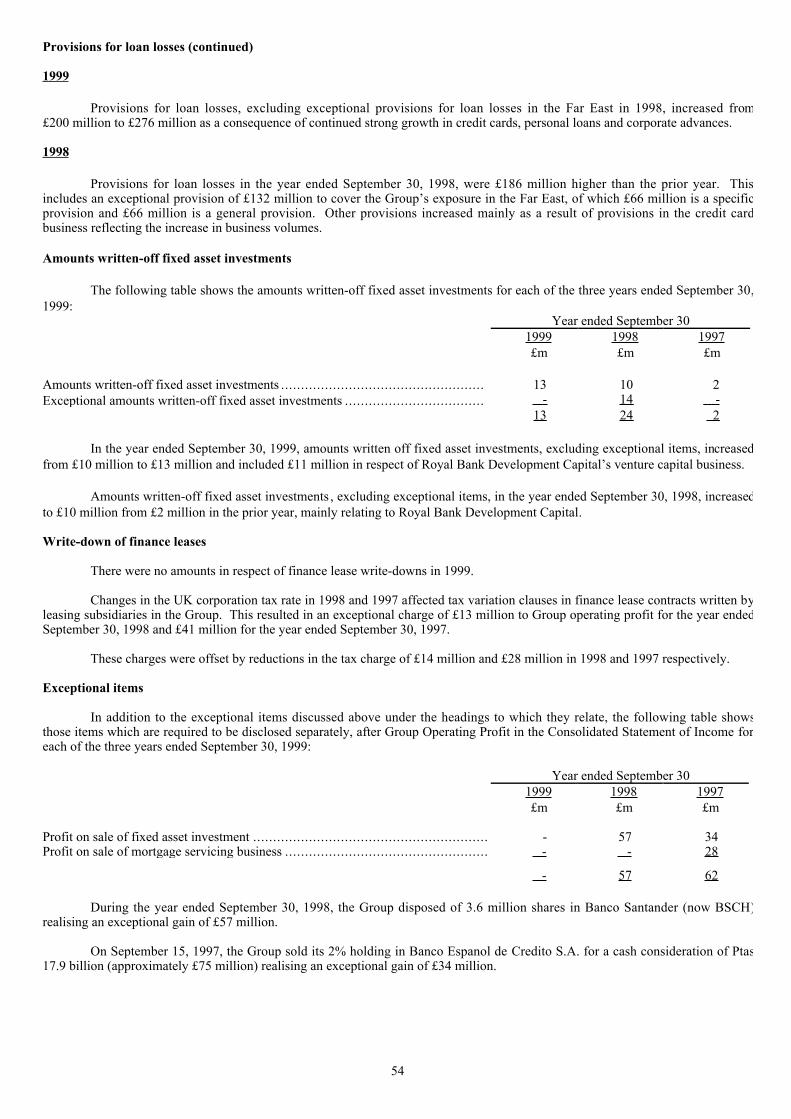
54
Provisions for loan losses (continued)
1999
Provisions for loan losses, excluding exceptional provisions for loan losses in the Far East in 1998, increased from£200 million to £276 million as a consequence of continued strong growth in credit cards, personal loans and corporate advances.
1998
Provisions for loan losses in the year ended September 30, 1998, were £186 million higher than the prior year. Thisincludes an exceptional provision of £132 million to cover the GroupÕs exposure in the Far East, of which £66 million is a specificprovision and £66 million is a general provision. Other provisions increased mainly as a result of provisions in the credit cardbusiness reflecting the increase in business volumes.
Amounts written-off fixed asset investments
The following table shows the amounts written-off fixed asset investments for each of the three years ended September 30,1999:
YearÊendedÊSeptemberÊ301999 1998 1997£m £m £m
Amounts written-off fixed asset investments ................................................... 13 10 2Exceptional amounts written-off fixed asset investments ................................... - 14 -
13 24 2
In the year ended September 30, 1999, amounts written off fixed asset investments, excluding exceptional items, increasedfrom £10 million to £13 million and included £11 million in respect of Royal Bank Development CapitalÕs venture capital business.
Amounts written-off fixed asset investments , excluding exceptional items, in the year ended September 30, 1998, increasedto £10 million from £2 million in the prior year, mainly relating to Royal Bank Development Capital.
Write-down of finance leases
There were no amounts in respect of finance lease write-downs in 1999.
Changes in the UK corporation tax rate in 1998 and 1997 affected tax variation clauses in finance lease contracts written byleasing subsidiaries in the Group. This resulted in an exceptional charge of £13 million to Group operating profit for the year endedSeptember 30, 1998 and £41 million for the year ended September 30, 1997.
These charges were offset by reductions in the tax charge of £14 million and £28 million in 1998 and 1997 respectively.
Exceptional items
In addition to the exceptional items discussed above under the headings to which they relate, the following table showsthose items which are required to be disclosed separately, after Group Operating Profit in the Consolidated Statement of Income foreach of the three years ended September 30, 1999:
YearÊendedÊSeptemberÊ301999 1998 1997£m £m £m
Profit on sale of fixed asset investment ........................................................... - 57 34Profit on sale of mortgage servicing business ................................................... - - 28
- 57 62
During the year ended September 30, 1998, the Group disposed of 3.6 million shares in Banco Santander (now BSCH)realising an exceptional gain of £57 million.
On September 15, 1997, the Group sold its 2% holding in Banco Espanol de Credito S.A. for a cash consideration of Ptas17.9 billion (approximately £75 million) realising an exceptional gain of £34 million.

55
Applicable income taxes
The following table shows applicable income taxes and tax rates for each of the three years ended September 30, 1999:
YearÊendedÊSeptemberÊ301999 1998 1997£m £m £m
Applicable income taxes ............................................................................. 361 286 219
% % %UK corporate tax rate ................................................................................. 30.5 31.0 32.0Effective tax rate ....................................................................................... 29.8 30.0 28.8
The actual tax charge differs from the expected tax charge computed by applying the UK corporation tax rate as follows:
YearÊendedÊSeptemberÊ301999 1998 1997£m £m £m
Expected tax charge ................................................................................... 369 310 243Deferred taxation not provided ..................................................................... (8) (8) -Gain on sale of Banco Espanol de Credito S.A. ............................................... - - (9)Gain on sale of Royal Scottish Assurance 30% shareholding .............................. - - (7)Contribution to employee share trust ............................................................. - - (7)Non-deductible items.................................................................................. 32 21 11Non-taxable items...................................................................................... (27) (30) (13)Foreign profits taxed at other rates ................................................................ (1) 3 -Taxable foreign exchange movements............................................................ - - 1Prior year items ......................................................................................... (6) (14) 5Unutilised losses carried forward .................................................................. 2 4 -Other items............................................................................................... ÊÊÊÊÊ- - (5 )
Actual tax charge....................................................................................... 361 286 219
The effective tax rate of 29.8% for the year ended September 30, 1999 was lower than the average UK corporation tax rateof 30.5%. This was primarily due to profits outwith the UK being subject to lower taxation rates.
The effective tax rate of 30% for the year ended September 30, 1998 was lower than the average UK corporation tax rate of31%. This was primarily due to a net tax credit of £16 million on the exceptional items, reflecting the tax credit associated with thewrite-down of finance leases.
56
The Year 2000 Issue
The Year 2000 problem concerns the inability of information systems, primarily computer software programs, properly torecognise and process date sensitive information prior to, during and after the Year 2000. The Group, many of its customers and thethird parties it deals with, use software and related technology throughout their businesses that could be affected by the Year 2000problem and may therefore not be Year 2000 compliant.
The GroupÕs management recognised early the significance of the Year 2000 issue and started its compliance programme inmid 1996. Each of the GroupÕs main entities has monitored closely its progress via a Year 2000 Steering Group reporting to a seniorexecutive of the entity. In addition, the overall GroupÕs Year 2000 compliance programme is monitored on a monthly basis by theGroup Board.
The Group has conducted a Year 2000 compliance programme designed to achieve Year 2000 compliance by:
(a) testing and obtaining assurances that existing IT business critical systems and business critical processes (ÒSystemsÓ )operate through critical dates including testing new products before purchase and implementation;
(b) reviewing customer credit risk in the light of their Year 2000 preparations;
(c) liaising with key third parties to determine the Year 2000 compliance of their Systems;
(d) conducting interface testing to ensure the continued operation of third party interface systems through the critical dates;and
(e) preparing contingency plans to ensure business continuity including the development of an incident managementstructure and command centre to monitor and manage the operation of the Group through the critical dates.
As a result of the measures undertaken and described above, the directors believe that the GroupÕs Systems are, and willremain, Year 2000 compliant. In forming this view, the directors have relied on assurances given by third parties including hardwareand software suppliers, experts and key third parties with which the Group deals. However, there can be no assurance that theSystems of any company will perform as expected or that measures taken or to be taken by the Group or by third parties willsuccessfully minimise or eliminate the effects of the Year 2000 problem. Any failure could have a materially adverse impact on thefinancial condition and results of the Group and may not be embraced by the GroupÕs contingency plans.
The total estimated cost of the GroupÕs Year 2000 compliance programme is expected to be £66 million. Of this amount,£62 million has been expended to September 30, 1999.
EMU
The UK Bank was in a position to fully meet customersÕ EMU requirements from January 1999, when the euro came intobeing as the currencies of the eleven participating states were irrevocably locked. We continue to monitor demand levels for europroducts and services to ensure that we are meeting customersÕ requirements as the transition phase unfolds for the first-waveparticipants.
Following our successful preparation for the ÔUK outÕ period, attention has been focused on the potential implications forthe Group and our customers of the UK joining EMU. Publication of the first Outline National Changeover Plan in February 1999confirmed that the GovernmentÕs formal stance on the UKÕs position had not changed. Subsequently, whilst the commitment inprinciple appears unchanged, the uncertainties on timing have tended to increase. This makes planning for banking sectorpreparations increasingly problematic. The Group is continuing its planning work to ascertain the detailed requirements in the eventthat the UK should decide to join, but timing of entry will need to be more certain before we commit the investment required for fullscale euro preparation.

57
US GAAP
The GroupÕs net income available for ordinary shares in accordance with US GAAP amounted to £678 million for the yearended September 30, 1999, as compared with £539 million in 1998. For a reconciliation of net income under UK GAAP to USGAAP, see Note 52 to the Consolidated Financial Statements - ÒSignificant differences between UK and US generally acceptedaccounting principlesÓ.
Application of UK Financial Reporting Standards (ÒFRSÓ)
In February 1999, the Accounting Standards Board in the UK issued FRS 15 ÒTangible Fixed AssetsÓ, effective foraccounting periods ending on or after March 23, 2000. The standard sets out the principles of accounting for the initialmeasurement, valuation and depreciation of tangible fixed assets. The standard will be adopted by the Group in the year endingSeptember 30, 2000.
Application of US Statements of Financial Accounting Standards (ÒSFASÓ)
In June 1998, the FASB issued SFAS No. 133 ÒAccounting for Derivative Instruments and Hedging ActivitiesÓ. On May19, 1999, members of the FASB voted to delay the new standard to fiscal years beginning after June 5, 2000. SFAS 133 requiresthat all derivative instruments be recorded on the balance sheet at their fair value. Changes in the fair value of derivatives arerecorded each period in current earnings or other comprehensive income, depending on whether a derivative is designated as part ofa hedge transaction and, if it is, the type of hedge transaction. The Group has not yet determined the impact that the adoption ofSFAS No. 133 will have on its earnings or statement of financial position.
In October 1998, the FASB issued SFAS No. 134 ÒAccounting for Mortgage-Backed Securities Retained after theSecuritisation of Mortgage Loans Held for Sale by a Mortgage Banking EnterpriseÓ. This statement requires that after thesecuritisation of a mortgage loan held for sale, an entity engaged in mortgage banking activities classify the resulting mortgage-backed security as a trading security. The standard is effective for fiscal years beginning after December 5, 1998. The Group iscurrently reviewing the impact of this standard.
In June 1999, the FASB issued SFAS No. 136 ÒTransfers of Assets to a Not-for-Profit Organisation or Charitable TrustThat Raises or Holds Contributions for OthersÓ. This statement will not have a material impact on the Group.

58
The GroupÕs principal objective is to create value for shareholders. It seeks to achieve this by allocating capital to developestablished businesses and to create new businesses, and through acquisitions, disposals and joint ventures.
In the UK Bank, there is a clear separation between corporate and retail banking, and activities are divided into customerfacing businesses. Retail Banking focuses entirely on small businesses and personal customers. Corporate and Institutional Bankingcovers all corporate and commercial customers throughout the UK and through US overseas branches. Each area within the UKBank has the appropriate structure, products, people and skills, culture and incentives to enable it to meet the needs of its customers.This provides a solid base for further growth. It also provides the UK Bank with opportunities for broader product growth across theUK population and through different brands using low cost distribution channels.
Retail Banking has a wide product range and an excellent reputation for customer service. It will continue to expand itsbusiness through the branch network and also grow its customer base through alternative distribution channels such as the Internet(where it has already established a leading position in on-line banking), telephone and postal accounts. Having completed acomprehensive programme for change, Retail Banking is in a position to extend its customer base and to develop opportunities tocross-sell products such as mortgages and life insurance.
To develop its business, Corporate and Institutional Banking will continue to build on its relationship management culture.It will seek to continue to grow customer numbers and to deepen its relationships with them by offering a product range andinfrastructure expected from a successful corporate bank. The Bank has already achieved lead or important bank status with manycorporate customers. This year has also seen the successful expansion into Europe of its Structured Finance business. Opportunitiesexist for growing the BankÕs existing businesses and expanding its franchise in the mid-corporate and commercial sectors. FurtherEuropean and new product development will also provide growth opportunities.
RBS Cards, which comprises the credit card businesses previously included in the UK Bank, and RBS Advanta, willcontinue to grow its business through a range of credit card products which appeal to different customer segments.
Offshore, RBSI has just launched a new web enabled, networkable, multi-currency electronic banking service for itscorporate and trust clients that provides real time access to a wide range of the bankÕs services. In addition, RBSI will continue todevelop new added-value products and services for the offshore market.
Angel Trains, one of the three UK rolling stock leasing companies which were privatised in 1996, continues to be successfulin winning new business.
Direct Line has excellent prospects. It is cost efficient and has an expense ratio of 16% (expenses divided by gross writtenpremiums) which is half that of many of its competitors and, over time, it is benefiting as motor insurance premiums rise. DirectLine Rescue has made a successful start and it is expected to grow in the future, particularly in conjunction with the acquisition ofGreen Flag. The GroupÕs growing customer base will also provide opportunities to expand the home insurance business.
New Retail Financial Services Businesses continue to introduce new customers and markets to the Group and help developthe customer base. Direct Line Financial Services and Direct Line Life and Unit Trusts have already demonstrated their ability to sella wider product range by telephone. They will seek to develop the brand name, to build loyalty and confirm Direct Line as asupplier of a broad range of financial services. Tesco Personal Finance has continued to attract business and is now tradingprofitably. The Virgin One Account at Virgin Direct Personal Finance has grown rapidly during the year.
Over the past five years, total assets at CFG have grown from $9.4 billion to $19.5 billion. With the October 1999acquisition of State StreetÕs commercial banking business and the expected closing of the UST Corp. of Boston transaction in early2000, total assets will reach $28 billion, reinforcing CFGÕs position as the second largest bank in New England. This acceleratedtransition into a full-service commercial bank will enable CFG to better serve its primary markets, including retail and small businesscustomers.
Recent Events
On November 29, 1999, the Group announced that it had made an offer to acquire National Westminster Bank plc.
Investment for the future
The Group allocates capital to its various businesses to create value for shareholders. Investment is made to grow thecustomer base and to improve the product range available through multiple distribution channels. In assessing the extent to whichthis investment has been successful in creating value, the Group uses a variety of performance indicators such as economic valueadded, discounted cash flows, return on equity, cost:income ratio and return on risk weighted assets.
Improvements to the GroupÕs infrastructure continue with increased expenditure on premises. Total capital expenditure onpremises, computers and other equipment for the year ended September 30, 1999 was £246 million (1998 - £254 million). Contractsentered into for future capital expenditure but not provided for in the financial statements for the year ended September 30, 1999amounted to £8 million (1998 - £18 million).
Shareholder value
The GroupÕs profits have again improved to record levels and the increased dividend is comfortably covered 3.1 times.
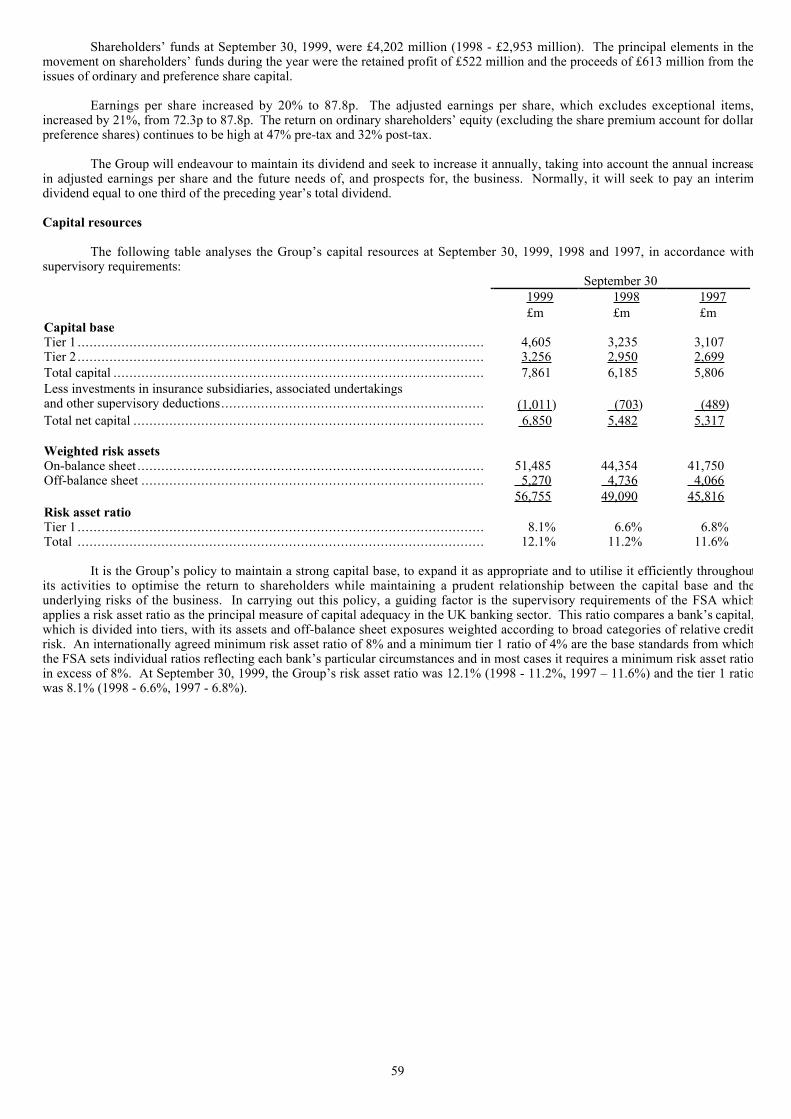
59
ShareholdersÕ funds at September 30, 1999, were £4,202 million (1998 - £2,953 million). The principal elements in themovement on shareholdersÕ funds during the year were the retained profit of £522 million and the proceeds of £613 million from theissues of ordinary and preference share capital.
Earnings per share increased by 20% to 87.8p. The adjusted earnings per share, which excludes exceptional items,increased by 21%, from 72.3p to 87.8p. The return on ordinary shareholdersÕ equity (excluding the share premium account for dollarpreference shares) continues to be high at 47% pre-tax and 32% post-tax.
The Group will endeavour to maintain its dividend and seek to increase it annually, taking into account the annual increasein adjusted earnings per share and the future needs of, and prospects for, the business. Normally, it will seek to pay an interimdividend equal to one third of the preceding yearÕs total dividend.
Capital resources
The following table analyses the GroupÕs capital resources at September 30, 1999, 1998 and 1997, in accordance withsupervisory requirements:
SeptemberÊ301999 1998 1997£m £m £m
Capital baseTier 1 ...................................................................................................... 4,605 3,235 3,107Tier 2 ...................................................................................................... 3,256 2,950 2,699Total capital ............................................................................................. 7,861 6,185 5,806Less investments in insurance subsidiaries, associated undertakingsand other supervisory deductions.................................................................. (1,011 ) (703 ) (489 )Total net capital ........................................................................................ 6,850 5,482 5,317
Weighted risk assetsOn-balance sheet ....................................................................................... 51,485 44,354 41,750Off-balance sheet ...................................................................................... 5,270 4,736 4,066
56,755 49,090 45,816Risk asset ratioTier 1 ...................................................................................................... 8.1% 6.6% 6.8%Total ...................................................................................................... 12.1% 11.2% 11.6%
It is the GroupÕs policy to maintain a strong capital base, to expand it as appropriate and to utilise it efficiently throughoutits activities to optimise the return to shareholders while maintaining a prudent relationship between the capital base and theunderlying risks of the business. In carrying out this policy, a guiding factor is the supervisory requirements of the FSA whichapplies a risk asset ratio as the principal measure of capital adequacy in the UK banking sector. This ratio compares a bankÕs capital,which is divided into tiers, with its assets and off-balance sheet exposures weighted according to broad categories of relative creditrisk. An internationally agreed minimum risk asset ratio of 8% and a minimum tier 1 ratio of 4% are the base standards from whichthe FSA sets individual ratios reflecting each bankÕs particular circumstances and in most cases it requires a minimum risk asset ratioin excess of 8%. At September 30, 1999, the GroupÕs risk asset ratio was 12.1% (1998 - 11.2%, 1997 Ð 11.6%) and the tier 1 ratiowas 8.1% (1998 - 6.6%, 1997 - 6.8%).
60
Quantitative and qualitative disclosures about market risk
(a) Risk Management
Through its normal operations, the Group is exposed to a number of risks, the most significant of which are liquidity, credit,operational and market risk; responsibility for these is vested in the Group Executive Management Committee (ÒGEMCÓ), a sub-committee of the Board of Directors. Beneath this, Group Risk Management are responsible for formulating high level risk policies,setting standards, monitoring concentrations and providing an independent review. The Group Asset and Liability ManagementCommittee also operates as a sub-committee of the GEMC and sets policy for the management of the overall Group balance sheet inrelation to capital ratios, structural hedging and liquidity. Operational responsibility for asset and liability management is in turndelegated to sub-committees or equivalent management bodies in each major business grouping.
Liquidity Risk
In the UK, the FSA requires that the Group should be able to meet its sterling obligations without recourse to the wholesalemoney market for a period of at least five business days. The Group also maintains a similar policy for its currency obligations inthe UK. Monthly reports are made to the FSA for both sterling and other currency liquidity. Subsidiaries and branches of the Groupin other countries operate similar policies in compliance with their local regulatory requirements. In order to meet theserequirements, the Group measures and manages its cashflow commitments on a daily basis, and maintains a diversified portfolio ofhigh quality liquid and marketable assets. Liquidity risk is also mitigated through the GroupÕs well diversified retail and corporatecustomer deposit base and through the raising of longer term funds of appropriate maturities via its Euro Medium Term Note(ÒEMTNÓ) programme. At September 30, 1999, the Group had raised £2.5 billion of term funds through EMTN issues.
The Group uses various methods, including predictions of daily cash positions, to monitor and manage its liquidity risk toavoid undue concentration of funding requirements at any point in time or from any particular source. Maturity mismatches betweenlending and funding are managed within internal risk policy limits.
The GroupÕs banking businesses require a stable flow of funds both to replace existing deposits as they mature and to satisfydemands of customers for additional borrowing. Undrawn borrowing facility commitments and the level of outstanding contingentobligations arising from financial instruments with off-balance sheet risk are taken into consideration in monitoring the GroupÕsliquidity position. The overall objective is to raise deposits at the lowest possible cost while ensuring that maturity mismatchesbetween lending and funding are managed within prudent risk policy limits set by the GEMC. These limits are designed to provide abalance between the risk of reliance solely on short-term deposits to fund longer term assets and the additional cost of raising long-term funds. Close control is exercised over the pricing, volume and quality of short-term deposits with sources and maturities beingmanaged to avoid concentration of funding requirements at any one time from any one source. Of crucial importance is themaintenance of depositorsÕ confidence in the Group, in both the wholesale and retail markets, to ensure the ready availability offunds at competitive market rates. The widespread customer base of the Group, together with the geographic spread of its branchesin the UK, have ensured that its retail deposit base has a core stability and is widely dispersed.
In the wholesale markets, the Group has a significant involvement in both the London and New York markets. Thisinvolvement and the underlying strength of the GroupÕs earnings and balance sheet are important factors in ensuring the continuedavailability of wholesale deposits to the Group at competitive market rates.
During the year ended September 30, 1999, there was an increase in cash of £1,875 million. The major contributory factorsto this increase were net cash inflows of £5,059 million from operating activities and £959 million from financing activities. Theseinflows were partly offset by net cash outflows of £3,415 million arising from capital expenditure and investment activities, £295million from servicing of finance and £311 million taxation paid. At September 30, 1999, the ratio of cash to total assets was 6.5%(1998 Ð 4.9%).
Credit Risk
Credit risk arises where the possibility exists of a counterparty defaulting on its obligations. The most important step inmanaging this risk is the initial decision whether or not to extend credit. The GroupÕs strong credit culture extends to themanagement of resultant exposures via individual counterparty and concentration limits and the on-going monitoring of counterpartycredit worthiness.
The day-to-day management of credit risk is devolved to individual business units, each of which has specialist creditfunctions which perform regular appraisals of counterparty credit quality through the analysis of qualitative and quantitativeinformation. Credit authority is based on defined limits with responsibility for significant transactions residing with a Group CreditCommittee.
If the Group requires collateral, this may be cash, or more commonly, security over a customerÕs assets.
Transactions with the same counterparty are netted where the Group has the legal right to insist on net settlement.
61
Operational Risk
Operational risk arises from the potential for inadequate systems (including systems breakdown), errors, poor management,breaches in internal controls, fraud and external events to result in financial loss or reputational damage. The GroupÕs business unitsmanage this risk through appropriate risk controls and loss mitigation actions. These actions include a balance of policies,procedures, internal controls and business continuity arrangements.
Group Risk Management ensure progress occurs on significant risk issues and provide the businesses with the assistance,tools and techniques to improve operational risk management.
Market risk Ð measures for trading and non-trading risk
Market risk is the risk that changes in the level of interest rates, the levels of exchange between currencies or the price ofsecurities and other financial contracts, including derivatives, will have an adverse financial impact. The primary market risks withinthe GroupÕs activities are interest rate and currency risk.
The GroupÕs management of its exposure to market risk recognises a fundamental distinction between the core (non-trading) balance sheet and the GroupÕs foreign exchange, money market and trading activities.
Non-trading market risk
Interest rate risk arises in the GroupÕs core consolidated balance sheet as a result of fixed rate, variable rate and non-interestbearing assets and liabilities. Exposure to interest rate movements arises when there is a mismatch between interest rate sensitiveassets and liabilities. The composition of non-trading interest rate risk in each Group company and division is closely monitored andmanaged, by either the Group Treasury function or local treasury units (in the case of CFG and RBSI) where professional treasuryexpertise and systems exist to control the risks taken on a day to day basis. Interest rate risk is managed by Group Treasury withinapproved total Value at Risk limits, or in certain entities by using asset and liability management models which look at the sensitivityof earnings to movements in interest rates to measure overall exposure which may then be hedged in accordance with policy limits.
The most significant foreign currencies in which the Group has transactions are US dollars and the euro. Non-tradingcurrency risk exposure arises primarily out of the GroupÕs investments in overseas branches, subsidiaries and other foreign currencyinvestments, (principally CFG and BSCH). As a result the GroupÕs Consolidated Balance Sheet is affected by movements in theexchange rates between the functional (or operational) currencies of these activities and sterling. These currency exposures arereferred to as structural currency exposures. Translation gains and losses arising from these exposures are recognised in thestatement of total recognised gains and losses. The Group mitigates the effect of these exposures by financing a significantproportion of its net investment in its overseas operations with borrowings in the same currencies as the functional currenciesinvolved. The Group also has currency exposures relating to transactional (or non-structural) positions. Such exposures comprisethe monetary assets and monetary liabilities of the Group that are not denominated in the operating (or functional) currency of theoperating unit involved, other than certain non-sterling borrowings treated as hedges of net investments in overseas operations andinvestments. Foreign currency exposures in the non-trading book are transferred to the trading book where professional treasuryexpertise and systems enable risks to be managed within mandated risk limits. Details of non-trading currency risk exposures areshown in Note 39 to the Consolidated Financial Statements.
The Group does not have any material exposure to adverse movements in the value of equities and commodities other thanits holdings of equity shares as shown in Note 19 to the Consolidated Financial Statements. At September 30, 1999, equity sharesheld as investment securities had a book value of £804 million (1998 - £766 million) and a valuation of £1,264 million (1998 - £956million).

62
Trading market risk - Value at Risk
The GroupÕs primary mechanism for estimating potential losses is a mathematical methodology, Value at Risk (ÒVaRÓ)which estimates the GroupÕs exposure to market risk within a given level of confidence, over a defined time period. This is regularlyreviewed to ensure it remains relevant and captures all significant risks. The Group uses a 97.5% confidence interval. This meansthat daily losses exceeding the VaR figure are likely to occur, on average, in only one in every 40 business days. All exposurearising from trading activities is assessed over a one day holding period and an historic market rate data observation period of oneyear.
The instruments covered by the VaR include all money market products, foreign exchange products, securities andderivatives within the GroupÕs treasury and trading units. The value of these instruments is assumed to vary in a linear fashion withchanges in the market rates used to compute the present value of the cash flows associated with those instruments. This type of linearrelationship does not hold for options. Optionality is dealt with using scenario analysis by identifying the greatest loss arising onvarying both the price and volatility of the underlying instrument. Risk of changes in credit spreads for positions in corporatesecurities is also included in the VaR.
Known limitations of the VaR methodologies include the fact that changes in market rates may not tend to a normaldistribution (specifically, that very large movements are more likely than predicted by the normal distribution assumption), thatcorrelations between market rate movements can vary (especially during periods of stress in the markets), that the changes in presentvalues are not perfectly linearly related to changes in market rates and that the use of a one-day time horizon does not fully capturethe market risk of positions that cannot be liquidated in one day. Additionally, the models are based on past movements and may notbe indicative of future market conditions, irrespective of the historical time period selected. As a result of these limitations theGroup has a research and development programme to refine the techniques used to quantify market risk. This includes the use ofhistorical simulations and stress testing with specified scenarios. A major objective of this research is to understand the shortcomingsof the VaR methodology and to ensure that other complementary measures are used where appropriate. The Group has also adoptedstress testing to simulate extreme conditions.
Other risk management controls used to manage trading market risk include more detailed limits and individual tradermandates, designed to supplement the VaR framework. This enables market risk exposure to be monitored throughout the day at adetailed, disaggregated level and on a consolidated basis. An analysis of market risk related VaR for the Group is shown below.

63
(b) Market Risk - numerical disclosures
The table below shows details of the market risk related VaR for the Group analysed into trading and non-trading activitiesat the year end and as an average for the year and the high and low during the year. The VaR is further analysed between interest raterisk and foreign currency exchange risk. As there are compensating positions between the trading and non trading positions the VaRfor market risk related activities is not additive. Both CFG and RBSI have independent treasury operations and employ their owntechniques for measuring and monitoring market risk. CFG uses a Daily Earnings at Risk (ÒDeaRÓ) methodology (see below),which although somewhat different from the VaR methodology described above under ÒValue at RiskÓ, has the same principalassumptions, limitations and parameters as those described for the GroupÕs VaR methodology (e.g. normal distribution assumptionsuse of historical data, 97.5% confidence interval and one-day holding period). RBSI, which at September 30, 1999 accounted forapproximately 9% of the GroupÕs assets, used a matched book methodology to measure and manage interest-rate and foreign-exchange-rate risk, with maximum allowed mismatches, instead of a VaR methodology. Included in the figures in the table below isthe addition of managementÕs estimate of the exposure to market risk translated to a VaR methodology for CFG and RBSI, withoutadjusting for any diversification or other effect resulting from this aggregation method.
As at As atSeptember 30 Year to September 30, 1999 September 30 Year to September 30, 1998
1999 Average High Low 1998 Average High Low£m £m £m £m £m £m £m £m
VaRMarket risk related Ð aggregate... 6.2 4.4 6.9 2.5 4.2 3.4 4.7 2.5
Non-trading - Total................................... 4.4 2.8 4.6 1.8 3.4 2.9 4.2 2.2 - Interest rate related................ 4.4 2.8 4.5 1.8 3.2 2.7 3.6 2.0 - Foreign exchange related........ - - - - 0.6 0.5 0.9 0.2
Trading - Total................................... 2.6 1.9 2.9 1.0 1.1 1.1 1.8 0.6 - Interest rate related................ 2.4 1.8 2.8 0.8 1.0 0.9 2.1 0.5 - Foreign exchange related........ 0.4 0.4 0.9 0.2 0.1 0.2 0.8 0.1
The approaches to measuring and monitoring market risk used by CFG and RBSI are described below.
CFG
CFG compute a figure for DeaR and this has been translated to a figure for VaR for inclusion in the Group figures disclosedabove. Based on this approach, the maximum VaR for CFG during the year ended September 30, 1999 is £0.7 million, all of whichrelates to non-trading interest rate related activities.
RBSI
RBSI operates a nominal limit basis within approved spot foreign exchange limits and deposit maturity mismatch limits.The positions are monitored each day by the risk control area of the Treasury back office and any limit breaks are advised to RBSIÕsDirector of Treasury and Finance Director. Any limit breaks over £1 million are also reported to the RBSI Board on a quarterlybasis. RBSI moved to a VaR methodology after the year ended September 30, 1999. Based on these exposure limits it is estimatedthat the maximum VaR for RBSI during the year ended September 30, 1999 is £0.2 million, mainly relating to non-trading interestrate related activities.
Trading and non-trading revenues
The table below shows the average daily revenues for non-trading and trading activities for the Group. Standard deviationindicates the distribution of those earnings over the year. In the table, revenue from non-trading activities is presented on an accrualsbasis and trading activities on a present value basis. This treatment of revenues is consistent with the financial statements and is inaccordance with UK and US GAAP.
Standard StandardAverage for Average for deviation for deviation forthe year to the year to the year to the year to
September 30 September 30 September 30 September 301999 1998 1999 1998
Daily revenues £m £m £m £m
Market risk relatedNon-trading .............................................................. 0.4 0.6 0.1 0.5Trading..................................................................... 0.7 0.1 0.5 0.2
(c) Financial Instruments

64
associated with financial instruments are a significant component of the risks faced by the Group. Financial instruments create,modify or reduce the liquidity, credit and market risks of the GroupÕs Consolidated Balance Sheet. Each of these risks and theGroupÕs policies and objectives for managing such risks are discussed above.
The purpose for which the Group holds or issues financial instruments can be classified into five main categories.
Customer loans and deposits
Customer loans and deposits (both retail and institutional) form a substantial part of the GroupÕs business. The customerloan portfolio is the GroupÕs largest asset and the interest received from such loans is the GroupÕs core source of income.
The Group has detailed policies and strategies in respect of its customer loans and deposits which seek to minimise the risksassociated with these financial instruments.
Investments (equity shares and debt securities)
The Group holds shares and other securities, excluding strategic investments, for use on a continuing basis in the GroupÕsactivities. The objective of holding such financial instruments is to generate funds over the term of the investment in the form ofdistributions and/or appreciation in value. Funds generated are used in the GroupÕs operations.
Control over quoted investments is held by the Group Investment Committee (ÒGICÓ). The GIC determines which Groupentity holds the investment and whether the investment is strategic. The GIC also sets guidelines for the disposal and hedging ofnon-strategic investments.
Finance (money market loans and deposits, loan capital, debt securities in issue, preference shares)
The Group issues financial instruments to fund that portion of the GroupÕs assets not funded by the customer deposits. Theobjective of using financial instruments for financing purposes is to manage the GroupÕs balance sheet in terms of minimisingmarket risk. Responsibility for overseeing and implementing balance sheet management lies with Group Treasury Services.
Trading (foreign exchange, derivatives, debt securities, loans and deposits)
The Group trades in financial instruments for customer facilitation and as principal. The objective of trading in financialinstruments is to maximise short term gains for both the customer and/or the Group. Trading activity is restricted to certain areas inthe Group and is subject to strict policies and limits. Responsibility for setting trading policies and monitoring adherence thereto lieswith Group Risk Management. Derivatives used for trading purposes are discussed in more detail below.
Hedging (derivatives, loans and deposits, debt securities)
Where financial instruments form part of the GroupÕs risk management strategy they are classified as hedges. The objectivefor holding financial instruments as hedges is to match or eliminate the risk arising because of adverse movements in interest rates,exchange rates, credit ratings, equity prices or commodity prices. Derivatives are the main instruments used for hedging and arediscussed further below.
Funding in the form of loans and deposits and preference shares is used to hedge certain of the GroupÕs equity investments. Fixedrate debt securities are periodically used to hedge issued preference shares.

65
(d) Derivatives
In the normal course of business, the Group enters into a variety of derivative transactions principally in the foreignexchange and interest rate markets. These are used to provide financial services to customers and to actively take, hedge and modifypositions as part of trading activities. Derivatives are also used to hedge or modify risk exposures arising on the balance sheet from avariety of activities including lending and securities investment. The majority of the counterparties in the GroupÕs derivativetransactions are banks and other financial institutions. The risks involved in derivatives include market, credit and liquidity risk. Fordetails of the GroupÕs accounting policies on Derivatives see Note 1 (n) to the Consolidated Financial Statements. Analyses of thederivatives entered into by the Group both for trading and non-trading purposes are provided in Note 39 to the ConsolidatedFinancial Statements. The principal types of derivative contracts into which the Group enters are described below.
Swaps
These are over-the-counter (ÒOTCÓ) agreements between two parties to exchange periodic payments of interest, orpayments for the change in value of a commodity, or related index, over a set period based on notional principal amounts. TheGroup enters into swap transactions in several markets. Interest rate swaps exchange fixed rates for floating rates of interest basedon notional amounts. Basis swaps exchange floating or fixed interest calculated using different bases. Cross currency swaps are theexchange of interest based on notional values of different currencies. Equity and commodity swaps exchange interest for the returnon an equity or commodity, or equity or commodity index.
Options
Currency and interest rate options confer the right, but not the obligation, on the buyer to receive or pay a specific quantityof an asset or financial instrument for a specified price at or before a specified date. Options may be exchange traded or OTCagreements. The Group principally buys and sells currency and interest rate options.
Futures and forwards
Short term interest rate futures, bond futures and forward foreign exchange contracts are all agreements to deliver or takedelivery of, a specified amount of an asset or financial instrument based on the specified rate, price or index applied against theunderlying asset or financial instrument, at a specified date. Futures are exchange traded at standardised amounts of the underlyingasset or financial instrument. Forward contracts are OTC agreements and are principally dealt in by the Group in interest rate s asforward rate agreements and currency as forward foreign exchange contracts.
Collateral
The Group may require collateral in respect of the credit risk in derivative transactions. The amount of credit risk isprincipally the positive fair value of contracts. Collateral may be in the form of cash or more commonly is in the form of a lien overa customerÕs assets entitling the Group to make a claim for current and future liabilities.
The following table sets forth activities of a non-trading nature undertaken by the Group, the related risks associated withsuch activities and provides details of the types of derivatives used in managing such risks.
Activity
Management of the return on variable rateassets funded by shareholdersÕ funds andnet non-interest bearing liabilities
Fixed-rate lending funded by floatingrate liabilities
Fixed-rate retail and wholesale funding
Fixed-rate asset investments
Investment in foreign currency assets
Profit earned in foreign currencies
Risk
Reduced profitability due to falls inshort-term interest rates
Sensitivity to increases in short-terminterest ratesSensitivity to decreases in medium/longterm interest rates, due to prepayment
Sensitivity to falls in short-term interestrates
Sensitivity to increases in short-terminterest rates
Sensitivity to strengthening of sterlingagainst other currencies
Sensitivity to strengthening of sterlingagainst other currencies
Type of Hedge
Receive fixed interest rate swapsPurchased interest rate options
Pay fixed interest rate swapsPurchased interest rate caps
Receive fixed interest rate swaps
Pay fixed interest rate swaps
Cross-currency swapsForeign currency funding
Forward foreign exchange contractsPurchased currency options
66
ITEMS 10, 11 AND 12. DIRECTORS AND OFFICERS OF REGISTRANT; REMUNERATION OF DIRECTORS ANDOFFICERS; OPTIONS TO PURCHASE SECURITIES FROM REGISTRANT OR SUBSIDIARIES
Throughout the year the company has applied the Principles of Good Governance relating to directorsÕ remuneration as setout in the Combined Code which is appended to the Listing Rules of the London Stock Exchange (Òthe CodeÓ). The followingreport by the board follows the provisions in Schedule B to the Code.
Remuneration Committee
The Remuneration Committee comprises Viscount Younger (chairman) and the following non-executive directors: Sir IainVallance, Sir Angus Grossart, Mr C. M. Stuart and Mr W. M. Wilson. While the chairmanship of the Committee is not compliantwith provision B.2.2 of the Code, the board and the Remuneration Committee are satisfied that, as Viscount Younger has noinvolvement in the day to day running of the business, there is no conflict of interest in his position as chairman of the Group andBank boards and as chairman of the Remuneration Committee.
The Remuneration Committee is responsible for considering and making recommendations to the board, within agreedterms of reference, on the companyÕs remuneration policies, the remuneration arrangements of directors and senior executives andthe operation of the companyÕs employee share schemes.
Policies
In particular, the Remuneration CommitteeÕs role is:
• to monitor the remuneration policy of the company and its subsidiaries having regard to relevant market comparisons andpractice;
• to consider and make recommendations to the board of directors on the remuneration arrangements including bonuses, shareoptions, pension rights, service contracts and compensation payments of executive directors of the company;
• to decide whether, and in what amount, grants of options should be made under the executive share option scheme and thesharesave scheme;
• to determine annually, where appropriate, the staff profit share under the companyÕs profit sharing schemes;
• to review employee share schemes in light of legislative and market developments and overall remuneration policy;
• and to consider, determine and, where appropriate, approve the remuneration arrangements including bonuses, share options,pension rights, service contracts and compensation payments of senior executives of the Bank.
Remuneration, salaries and fees
The remuneration of the board of directors and the salaries of the executive directors of the company and the Bank are setby the board based on the recommendations of the Remuneration Committee.
It is the policy of the Board to reward executive directors competitively having regard to the remuneration paid to the seniormanagement of comparable public companies. For guidance, the Remuneration Committee seeks advice from external consultantsand uses published specific job-matched surveys of similar companies. Further surveys are also commissioned as necessary.Executive directorsÕ remuneration is reviewed annually and is determined after a review of the performance and responsibilities ofeach individual director.
In respect of non-executive directors, the level of fees is reviewed annually, with reference to the levels of fees paid to non-executive directors of comparable public companies.

67
Share option schemes
The executive directors participate in the companyÕs executive share option and sharesave schemes and details of theirinterests in the companyÕs shares arising from their participation are contained on pages 70 and 71 of this Report. It is thecompanyÕs policy that executive share options be awarded only to those executives who can genuinely influence the companyÕsperformance over the medium term. Executive share options are normally granted on a regular, phased basis although a block ofoptions was awarded to Mr F.A.Goodwin on December 7, 1998 as part of the remuneration package agreed when he joined thecompany. The exercise of options granted under the companyÕs executive share option scheme from 1996 to 1998 is subject to aperformance condition whereby options may not normally be exercised unless the growth in the companyÕs adjusted earnings pershare has exceeded the growth in the Retail Price Index over a three year period by an average of at least two per cent per annum.For options granted in 1999 the relevant percentage has been increased to three per cent per annum. The condition is reviewedannually.
Profit sharing schemes
The company provides profit sharing for employees. Two schemes are in force, which provide that a total of up to five percent of available profits may be distributed to eligible employees, including executive directors, either in shares or in cash afterdeduction of income tax.
Benefits in kind
Executive directors receive benefits in kind, which include the provision of a company car for their use, medical healthinsurance and beneficial loans, on similar terms to other senior executives.
Service agreements
The service agreement of Mr I.S. Robertson is terminable on 24 monthsÕ notice by the Bank and six monthsÕ notice by MrRobertson.
Mr L.K. FishÕs employment agreement with CFG is terminable on 24 monthsÕ notice by CFG and 12 monthsÕ notice by MrFish.
The board of directors and the Remuneration Committee considers the relevant notice periods noted above to be in the bestinterests of the company and its shareholders. No other director has a notice period in excess of 12 months.
Incentive schemes
The companyÕs UK-based executive directors participate in a discretionary performance-related incentive scheme for seniorexecutives, payments under which are determined by the Remuneration Committee. The scheme provides for payments to be madeby reference to the achievement of financial and other targets which are set for each participant by the Remuneration Committee atthe beginning of each financial year. The maximum payment is 60% of salary for Sir George Mathewson, 50% of salary for Mr F.A.Goodwin and Mr I.S. Robertson and 40% of salary for Mr N.C. McLuskie. One half of each payment is applied to purchase ordinaryshares in the company which are held in a restricted share trust for three years.
In terms of his service contract with CFG, Mr L.K. Fish participates in its annual and long-term cash incentive plans whichapply to the senior executives of CFG. Awards under the plans require the achievement of pre-determined financial and otherperformance targets. Under the long-term plan, awards are linked to three year performance targets based on CFGÕs budgets. Aseparate three year cycle commences each financial year. Mr Fish also participates in a shadow equity plan in terms of which seniorexecutives of CFG participate in the appreciation above a specific target in the capital value of CFG over the period of the plan. Theplan commenced on October 1, 1993, and will terminate on September 30, 2000. The shadow equity units granted to Mr Fish vestedtwo years after the date of grant. In the year ended September 30, 1999, the value of the units held by Mr Fish increased by$2,312,100 and as at September 30, 1999, the value of units held by Mr Fish was $9,641,520. The increase in the value of units isincluded in the remuneration table shown below. To date no cash withdrawals have been made by Mr Fish.
68
DirectorsÕ pension arrangements
Viscount Younger, Sir George Mathewson, Mr F.A. Goodwin, Mr I.S. Robertson and Mr N.C. McLuskie participate in TheRoyal Bank of Scotland Staff Pension Scheme (Òthe SchemeÓ). The Scheme is a defined benefit scheme which provides pensionsand other benefits within Inland Revenue limits. Viscount Younger is provided with life assurance benefits only under the Scheme;these are restricted by Inland Revenue limits as set out in the Finance Act 1989. Additional life assurance cover in excess of thatprovided by the Scheme is secured under separate arrangements. Provision for his pension entitlement is made under a personalpension contract which is a defined contribution arrangement and an unfunded defined benefit arrangement. In the case of MrRobertson, his pension entitlement in the Scheme is restricted by Inland Revenue limits as set out in the Finance Act 1989; additionallife assurance cover in excess of these limits is provided by a separate arrangement. Mr GoodwinÕs pension entitlement in theScheme is similarly restricted by Inland Revenue limits as set out in the Finance Act 1989. Arrangements have been made toprovide Mr Goodwin with additional pension benefits and life assurance cover outwith the Scheme. The figures in the table belowinclude the accrual in respect of these arrangements. Mr Fish accrues pension benefits under a number of arrangements in the US.Defined benefits are built up under the CFGÕs Qualified Plan, Excess Plan and Employee Arrangement. In addition, he is a memberof two defined contribution arrangements Ð a Qualified 401(K) Plan and Executive Supplemental Benefit Plan. The London StockExchange requires disclosure of directorsÕ pension entitlement on the basis of the Institute and Faculty of ActuariesÕrecommendations. The tables below provide information on both defined benefit and defined contribution arrangements in line withthe revised rules.
Transfer value for theadditional pension
Additional pension earned earned during theAge nearest at during the year ended Accrued entitlement at year ended
September 30, 1999 September 30, 1999 September 30, 1999 September 30, 1999£000 £000 £000
Viscount Younger.................................................................................................
68 21 111 312
Sir George Mathewson....................... 59 32 253 541F.A. Goodwin....................................... 41 81 82 714I.S. Robertson....................................... 54 2 17 31N.C. McLuskie..................................... 55 8 83 125L.K. Fish - Qualified Plan..................................
551 12 6
- Excess Plan ...................................... 19 70 99 - Employee Arrangement................. - 46 -
Contributions paid in the year ended September 30, 1999 under defined contribution arrangements were:
£000 £000
Viscount Younger................................ 36 L.K. Fish......................... 28
Note: Mr R. Speirs was a director until October 23, 1998. A nominal contribution was paid in respect of the period fromOctober 1, 1998 until his retirement.
Directors remuneration
The undernoted tables report the remuneration received by each director in the years ended September 30, 1999 and 1998who served during the current year. Further information on the aggregate remuneration of directors and executive officers of thecompany is contained on page 71 of this Report.
Performancerelated Profit Total Total
Salary bonuses sharing Benefits Other 1999 1998£000 £000 £000 £000 £000 £000 £000
ChairmanViscount Younger............................... 274 - - 11 - 285 262
Executive directorsSir George Mathewson ........................ 487 285 46 18 - 836 753F.A.Goodwin ..................................... 382 190 6 14 - 592 153L.K. Fish........................................... 494 2,399 - 10 - 2,903 3,224N.C. McLuskie................................... 254 97 24 15 - 390 352I.S. Robertson .................................... 395 192 37 33 - 657 534R. Speirs (retired October 23, 1998)....... 24 - 26 1 575 626 405
ÊÊÊÊÊÊÊÊÊ ÊÊÊÊÊÊÊÊÊÊ ÊÊÊÊÊÊÊ ÊÊÊÊÊÊ ÊÊÊÊÊÊ ÊÊÊÊÊÊÊÊÊÊ ÊÊÊÊÊÊÊÊÊÊ1999................................................. 2,310 3,163 139 102 575 6,289 ÊÊÊÊÊÊÊÊÊÊ1998................................................. 2,017 3,386 110 80 90 5,683
Mr R. Speirs received a discretionary bonus payment of £575,395 on his retirement from the Group.
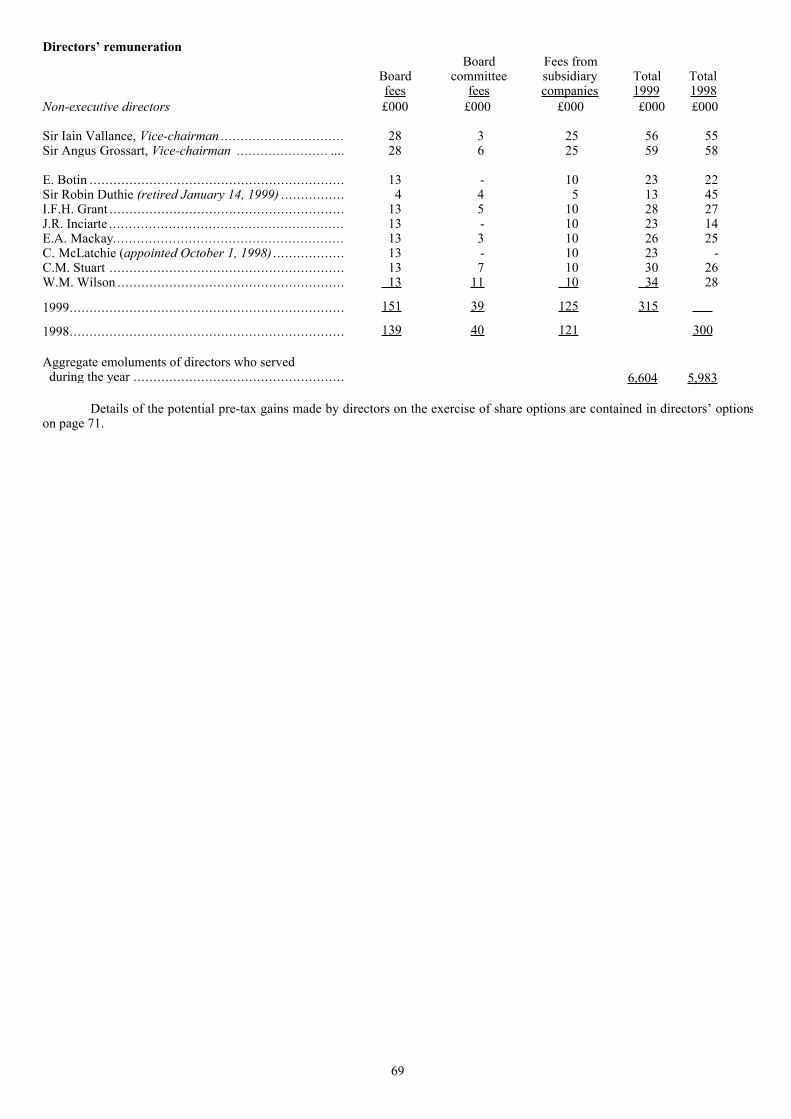
69
DirectorsÕ remunerationBoard Fees from
Board committee subsidiary Total Totalfees fees companies 1999 1998
Non-executive directors £000 £000 £000 £000 £000
Sir Iain Vallance, Vice-chairman ............................... 28 3 25 56 55Sir Angus Grossart, Vice-chairman .......................É. 28 6 25 59 58
E. Botin ................................................................ 13 - 10 23 22Sir Robin Duthie (retired January 14, 1999) ................ 4 4 5 13 45I.F.H. Grant ........................................................... 13 5 10 28 27J.R. Inciarte ........................................................... 13 - 10 23 14E.A. Mackay.......................................................... 13 3 10 26 25C. McLatchie (appointed October 1, 1998) .................. 13 - 10 23 -C.M. Stuart ........................................................... 13 7 10 30 26W.M. Wilson ......................................................... 13 11 10 34 28
1999..................................................................... 151 39 125 315 ÊÊÊÊÊÊ
1998..................................................................... 139 40 121 300
Aggregate emoluments of directors who served during the year ..................................................... 6,604 5,983
Details of the potential pre-tax gains made by directors on the exercise of share options are contained in directorsÕ optionson page 71.

70
DirectorsÕ interests in shares
Certain information as of November 30, 1999 concerning the directors and executive officers of the company and theirownership of ordinary shares of 25p each of the company and options to purchase such ordinary shares is set forth below:
Beneficially ownedat November 30, 1999
Shares ofName Occupation DirectorÊsince 25pÊeach Options *
ChairmanViscount Younger of Leckie (1) (2) Chairman of the company (since 1991) 1989 13,251 102,300
Vice-ChairmenSir Angus Grossart (1) (2) (3) Chairman and Managing Director, Noble Grossart Limited 1985 - -
Sir Iain Vallance (1) (2) Chairman, British Telecommunications plc 1993 2,500 -
Executive Directors
Sir George Mathewson (1) (4) Group Chief Executive (since 1992; executive officer since 1987) 1987 70,650 495,161
Frederick Anderson Goodwin (1) Deputy Group Chief Executive 1998 - 180,770
Lawrence Kingsbaker Fish Chairman, President and Chief Executive Officer, Citizens FinancialGroup, Inc. (since 1993) 1993 - 100,000
Iain Samuel Robertson (1) Chief Executive, UK Bank 1993 48,597 287,292
Norman Cardie McLuskie (4) Deputy Chief Executive, UK Bank 1992 86,832 251,199
Non-executive DirectorsEmilio Botin Chairman, Banco Santander Central Hispano S.A. 1989 - -
Ian Faulconer Heathcoat Grant (4) Managing Director, Glenmoriston Estates Limited 1985 4,628 -
Juan Rodriguez Inciarte Director and General Manager, Banco Santander Central Hispano S.A. 1998 - -
Eileen Alison Mackay (3) Retired Civil Servant 1996 3,156 -
Cameron McLatchie Chairman and Chief Executive, British Polythene Industries PLC 1998 - -
Charles Murray Stuart (2) (3) (4) Chairman, Scottish Power plc 1996 3,301 -
William Moore Wilson (2) (3) Chartered Accountant and Company Director 1993 7,951 -
SecretaryMiller Roy McLean (1) Secretary of the company Secretary 123,207 165,325
since 1994364,073 1,582,047
Ê
* Further details of the Executive share option plan are given in Note 5 to the Consolidated Financial Statements. (1) Member of the ChairmanÕs Advisory Group/Nomination Committee(2) Member of the Remuneration Committee(3) Member of the Audit Committee(4) Member of the Personnel Committee

71
DirectorsÕ Options
Options to subscribe for ordinary shares of 25p each in the company granted to and exercised by directors during the year toSeptember 30, 1999, are included in the table below:
Optionsheld at
October 1 Market Potential Options1998 or date Average Options granted Options exercised price at pre-tax gain held at Aver
of appointment exercise date of at date of September 30 exercif later price Price Price exercise exercise 1999 pricNumber £ Number £ Number £ £ £ Number £
L.K. Fish......................... 100,000 10.065 - - - - - - 100,000 10.06F.A. Goodwin................. - - 152,704 9.43 - - - - 180,770 9.96
2,748 12.05525,318 12.91
Sir George Mathewson... 495,161 5.53 - - - - - - 495,161 5.53N.C. McLuskie............... 233,095 5.60 8,217 12.055 782 3.44 13.32 7,726 251,199 6.13
10,530 12.91139 10.85
I.S. Robertson................. 351,637 5.23 76,655 12.055 101,000 2.65 12.17 1,281,520 287,292 8.1124,000 4.29 12.1716,000 3.99 12.17
R. Speirs......................... 121,000 4.50 - - 107,000 4.53 14.58 1,219,410 - -(retired October 23, 1998) 14,000 4.29 14.58Viscount Younger .......... 282,300 3.69 - - 180,000 2.65 9.17 1,173,600 102,300 5.52
At November 30, 1999, the directors and executive officers of the company, as a group, had options to purchase 1,582,047ordinary shares of 25p each of the company.
Except as disclosed above, there has been no change in the directorsÕ interests in the shares of the company shown abovebetween September 30, 1999, and November 30, 1999. The market price of the companyÕs ordinary shares at September 30, 1999,was 1303p and the range during the year to September 30, 1999, was 561p to 1475p. No director held a non-beneficial interest in theshares of the company at October 1, 1998 or date of appointment if later, and September 30, 1999.
Terms of Office of Directors
At each annual general meeting of shareholders of the company, the terms of office of directors appointed since theprevious annual general meeting, together with the terms of one-third by rotation of the remaining directors, expire.
Aggregate Remuneration of Directors and Officers
The aggregate remuneration of all directors and executive officers of the company as a group (18 persons) for the yearended September 30, 1999, totalled £10.6 million, including amounts paid under profit sharing and incentive schemes and potentialpre-tax gain on the exercise of share options. See Note 5 to the Consolidated Financial Statements. The aggregate amount paid bythe Group under defined contribution pension schemes for the year ended September 30, 1999, to provide pension benefits fordirectors and executive officers of the company totalled £65,000.
The emoluments of the highest paid director, Mr L.K. Fish were as follows:
1999 1998£000 $000 £000 $000
Aggregate emoluments and gains on exercise of share options...................... 2,903 4,731 3,343 5,528Pension contributions ........................................................................... 28 46 78 129Defined benefit pension scheme Ð accrued pension at end of year.................. 129 210 108 179

72
ITEM 13. INTEREST OF MANAGEMENT IN CERTAIN TRANSACTIONS
At September 30, 1999, £398,233 was outstanding in respect of loans by Group companies to 12 persons who weredirectors of the company (or persons connected with them) at any time during the financial year and £65,715 to one person who wasan officer of the company at any time during the year.
At September 30, 1998, £22,737,019 was outstanding in respect of loans by Group companies to 13 persons who weredirectors of the company (or persons connected with them) at any time during the financial year and £242,348 to one person whowas an officer of the company at any time during the year. At the same date, there was in existence one guarantee of £100,000 inrespect of certain obligations of one director.
At September 30, 1997, £11,330,320 was outstanding in respect of loans by Group companies to 14 persons who weredirectors of the company (or persons connected with them) at any time during the financial year and £242,771 to one person whowas an officer of the company at any time during the year. At the same date, there was in existence one guarantee of £41,500 inrespect of certain obligations of one connected person.
Except as stated above, there were no contracts material to the business of the company and its subsidiaries during the threeyears ended, or at, September 30, 1999, in which any director of the company had a material interest.

73
ITEM 18. CONSOLIDATED FINANCIAL STATEMENTS
CONTENTS
Page
Reports of Independent Chartered Accountants and Registered Auditors ................................................................. 74
Statement of DirectorsÕ Responsibilities ............................................................................................................ 75
The Royal Bank of Scotland Group plc
Consolidated Statement of Income for the years ended September 30, 1999, 1998 and 1997 .............................. 76
Consolidated Balance Sheet at September 30, 1999 and 1998....................................................................... 77
Statement of Total Recognised Gains and Losses for the years ended September 30, 1999, 1998 and 1997 ........... 78
Note of Historical Cost Profits and Losses for the years ended September 30, 1999, 1998 and 1997 .................... 78
Consolidated Statement of Changes in Retained Income and Other Reserves for the years ended September 30, 1999, 1998 and 1997 ..................................................................................................... 78
Cash Flow Statement for the years ended September 30, 1999, 1998 and 1997 ................................................ 79
Notes to Consolidated Financial Statements.............................................................................................. 80
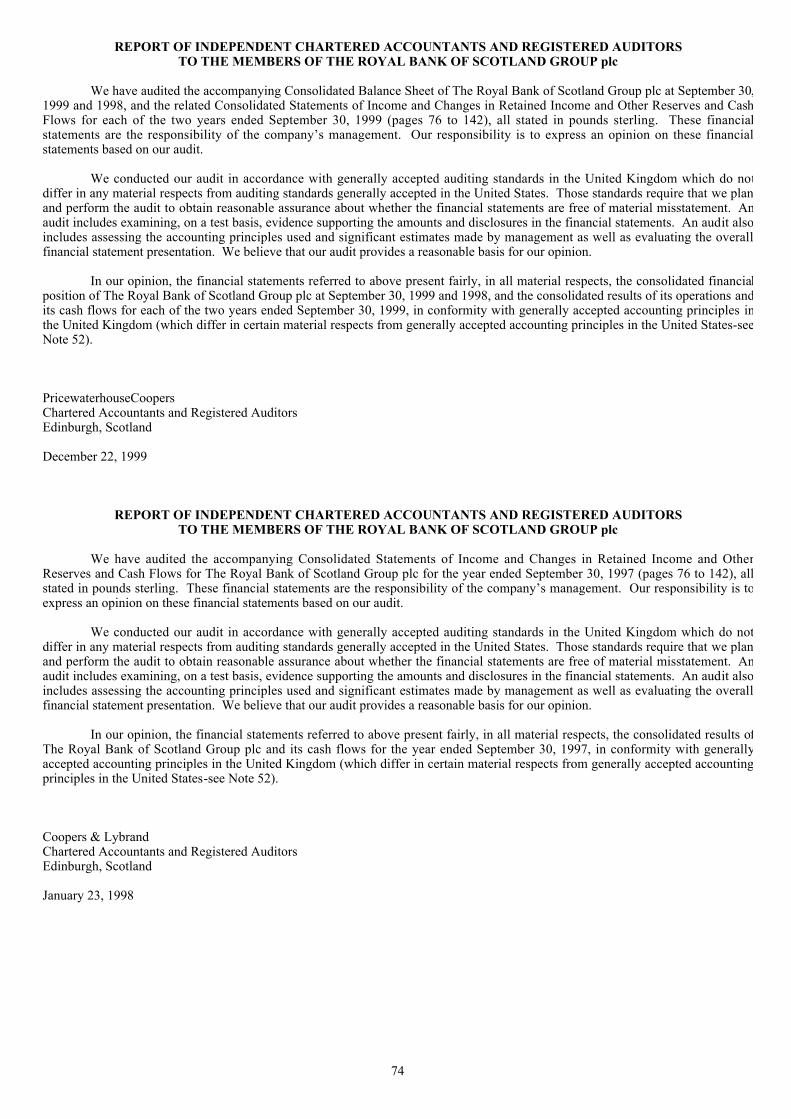
74
REPORT OF INDEPENDENT CHARTERED ACCOUNTANTS AND REGISTERED AUDITORSTO THE MEMBERS OF THE ROYAL BANK OF SCOTLAND GROUP plc
We have audited the accompanying Consolidated Balance Sheet of The RoyalÊBank of Scotland Group plc at September 30,1999 and 1998, and the related Consolidated Statements of Income and Changes in Retained Income and Other Reserves and CashFlows for each of the two years ended September 30, 1999 (pages 76 to 142), all stated in pounds sterling. These financialstatements are the responsibility of the companyÕs management. Our responsibility is to express an opinion on these financialstatements based on our audit.
We conducted our audit in accordance with generally accepted auditing standards in the United Kingdom which do notdiffer in any material respects from auditing standards generally accepted in the United States. Those standards require that we planand perform the audit to obtain reasonable assurance about whether the financial statements are free of material misstatement. Anaudit includes examining, on a test basis, evidence supporting the amounts and disclosures in the financial statements. An audit alsoincludes assessing the accounting principles used and significant estimates made by management as well as evaluating the overallfinancial statement presentation. We believe that our audit provides a reasonable basis for our opinion.
In our opinion, the financial statements referred to above present fairly, in all material respects, the consolidated financialposition of The Royal Bank of Scotland Group plc at September 30, 1999 and 1998, and the consolidated results of its operations andits cash flows for each of the two years ended September 30, 1999, in conformity with generally accepted accounting principles inthe United Kingdom (which differ in certain material respects from generally accepted accounting principles in the United States-seeNote 52).
PricewaterhouseCoopersChartered Accountants and Registered AuditorsEdinburgh, Scotland
December 22, 1999
REPORT OF INDEPENDENT CHARTERED ACCOUNTANTS AND REGISTERED AUDITORSTO THE MEMBERS OF THE ROYAL BANK OF SCOTLAND GROUP plc
We have audited the accompanying Consolidated Statements of Income and Changes in Retained Income and OtherReserves and Cash Flows for The Royal Bank of Scotland Group plc for the year ended September 30, 1997 (pages 76 to 142), allstated in pounds sterling. These financial statements are the responsibility of the companyÕs management. Our responsibility is toexpress an opinion on these financial statements based on our audit.
We conducted our audit in accordance with generally accepted auditing standards in the United Kingdom which do notdiffer in any material respects from auditing standards generally accepted in the United States. Those standards require that we planand perform the audit to obtain reasonable assurance about whether the financial statements are free of material misstatement. Anaudit includes examining, on a test basis, evidence supporting the amounts and disclosures in the financial statements. An audit alsoincludes assessing the accounting principles used and significant estimates made by management as well as evaluating the overallfinancial statement presentation. We believe that our audit provides a reasonable basis for our opinion.
In our opinion, the financial statements referred to above present fairly, in all material respects, the consolidated results ofThe Royal Bank of Scotland Group plc and its cash flows for the year ended September 30, 1997, in conformity with generallyaccepted accounting principles in the United Kingdom (which differ in certain material respects from generally accepted accountingprinciples in the United States-see Note 52).
Coopers & LybrandChartered Accountants and Registered AuditorsEdinburgh, Scotland
January 23, 1998

75
STATEMENT OF DIRECTORSÕ RESPONSIBILITIES
UK company law requires the directors to prepare financial statements for each financial year which give a true and fairview of the state of affairs of the company and the Group and of the profit or loss for that year. In preparing those financialstatements, the directors are required to:
• select suitable accounting policies and then apply them consistently;• make judgements and estimates that are reasonable and prudent;• state whether applicable accounting standards have been followed, subject to any material departures disclosed and explained in
the financial statements; and• prepare the financial statements on the going concern basis unless it is inappropriate to presume that the Group will continue in
business.
The directors are responsible for keeping proper accounting records which disclose with reasonable accuracy at any time thefinancial position of the Group and to enable them to ensure that the financial statements comply with the Companies Act 1985.They are also responsible for safeguarding the assets of the Group and hence for taking reasonable steps for the prevention anddetection of fraud and other irregularities.
By order of the board.
M.R. McLeanSecretaryEdinburgh, Scotland
December 17, 1999

76
THE ROYAL BANK OF SCOTLAND GROUP plc
CONSOLIDATED STATEMENT OF INCOME
YearÊendedÊSeptemberÊ30Note 1999 1998 1997
£m £m £mInterest receivable - interest receivable and similar income arising from debt securities .............. 2 895 745 558 - other interest receivable and similar income ............................................ 2 4,101 4,378 3,567Interest payable ..................................................................................... 3 (3,240 ) (3,525) (2,711 )NET INTEREST INCOME ..................................................................... 1,756 1,598 1,414
Dividend income from equity shares.......................................................... 34 28 24Fees and commissions receivable.............................................................. 1,084 923 809Fees and commissions payable ................................................................. (93) (84) (76)Dealing profits*..................................................................................... 191 268 117General insurance premium income (net of reinsurance)................................ 710 600 535Other income ........................................................................................ 456 377 129NON-INTEREST INCOME .................................................................... 2,382 2,112 1,538TOTAL INCOME ................................................................................. 4,138 3,710 2,952
Administrative expenses - staff costs .......................................................................................... 4 956 884 794 - staff profit share.................................................................................. 5 47 43 36 - premises and equipment ....................................................................... 298 280 227 - advertising......................................................................................... 133 121 95 - other................................................................................................. 335 308 290Depreciation and amortisation .................................................................. 279 243 107Provision for Year 2000 costs** ............................................................... - - 29 *OPERATING EXPENSES ...................................................................... 2,048 1,879 1,578
PROFIT BEFORE OTHER OPERATING CHARGES ................................. 2,090 1,831 1,374General insurance claims (net of reinsurance).............................................. (590 ) (518 ) (487 )PROFIT BEFORE PROVISIONS FOR LOAN LOSSES .............................. 1,500 1,313 887Provision for loan losses - excluding Far East............................................. 15 (276) (200) (139)Provision for loan losses - Far East**........................................................ 15 - (132)* (7)Amounts written off fixed asset investments Ð excluding Far East ................... (13) (10) (2)Amounts written off fixed asset investments Ð Far East* ............................... - (14)* -Write-down of finance leases**................................................................ ÊÊÊÊÊÊÊÊ- (13 )* (41 )*GROUP OPERATING PROFIT ............................................................... 1,211 944 698Exceptional items .................................................................................. - 57 62INCOME ON ORDINARY ACTIVITIES BEFORE TAX............................. 1,211 1,001 760Tax on income on ordinary activities ......................................................... 8 (361) (286) (219)Minority interests................................................................................... 6 (20 ) (31 )NET INCOME...................................................................................... 856 695 510Preference dividends .............................................................................. 9 (80 ) (58 ) (53 )NET INCOME AVAILABLE FOR ORDINARY SHARES........................... 776 637 457
NET INCOME PER 25 PENCE ORDINARY SHARE ................................. 87.8p 73.4p 55.4p
NET INCOME PER 25 PENCE ORDINARY SHARE (diluted)..................... 86.6p 72.4p 54.8p
* 1998 includes a gain of £96 million on the investment in Superdiplo which has been treated as an exceptional item.** Exceptional item.
With the exception of the disposal of the investor services business which contributed £14 million to the Group operatingprofit for the year ended September 30, 1999, all items dealt with in arriving at Group operating profit for the year ended September30, 1999 relate to continuing operations.
The accompanying Notes 1 to 53 are an integral part of the Consolidated Financial Statements.

77
THE ROYAL BANK OF SCOTLAND GROUP plc
CONSOLIDATED BALANCE SHEETSeptemberÊ30
Note 1999 1998£m £m
ASSETSCash and balances at central banks ......................................................................... 1,394 1,295Treasury bills and other eligible bills ...................................................................... 12 701 639Loans to banks ................................................................................................... 13 10,375 11,514Items in course of collection due from other banks .................................................... 1,655 1,652Loans to customers ............................................................................................. 14 49,340 41,017Debt securities ................................................................................................... 15,632 13,021Less: non-recourse borrowings .............................................................................. (243) (247)
18 15,389 12,774Equity shares ..................................................................................................... 19 913 857Interests in associated undertakings ........................................................................ 20 43 43Intangible fixed assets.......................................................................................... 24 11 -Tangible fixed assets ........................................................................................... 25 2,526 2,005Other assets ....................................................................................................... 26 5,339 6,801Prepayments and accrued income........................................................................... 1,166 1,079
TOTAL ASSETS................................................................................................ 88,852 79,676
LIABILITIESDeposits by banks............................................................................................... 27 6,418 4,437Items in course of collection due to other banks ........................................................ 975 520Customer accounts.............................................................................................. 28 55,180 50,685Debt securities in issue......................................................................................... 29 9,199 7,459Other liabilities................................................................................................... 30 6,647 8,076Accruals and deferred income ............................................................................... 2,582 2,419Provisions for liabilities and charges - deferred taxation ............................................................................................. 31 465 395 - pensions and other similar obligations ................................................................ 32 6 20 - other provisions .............................................................................................. 32 - 9Subordinated liabilities - dated loan capital ............................................................................................ 33 1,917 1,391 - undated loan capital ......................................................................................... 34 1,115 1,220Minority interests - equity ........................................................................................................... 108 73 - non-equity ..................................................................................................... 38 19
SHAREHOLDERSÕ EQUITYCalled up share capital ......................................................................................... 35 224 220Share premium account........................................................................................ 36 2,130 1,458Reserves ........................................................................................................... 36 147 113Revaluation reserve............................................................................................. 36 17 (10)Profit and loss account......................................................................................... 36 1,684 1,172
4,202 2,953
TOTAL LIABILITIES AND SHAREHOLDERSÕ EQUITY....................................... 88,852 79,676
The accompanying Notes 1 to 53 are an integral part of the Consolidated Financial Statements.SeptemberÊ30
Note 1999 1998£m £m
MEMORANDUM ITEMS: 41Contingent liabilities - acceptances and endorsements............................................................................ 894 1,024 - guarantees and assets pledged as collateral security ................................................ 958 921 - other contingent liabilities.................................................................................. 876 869
2,728 2,814
Commitments (standby facilities, credit lines and other) ............................................ 20,922 15,581
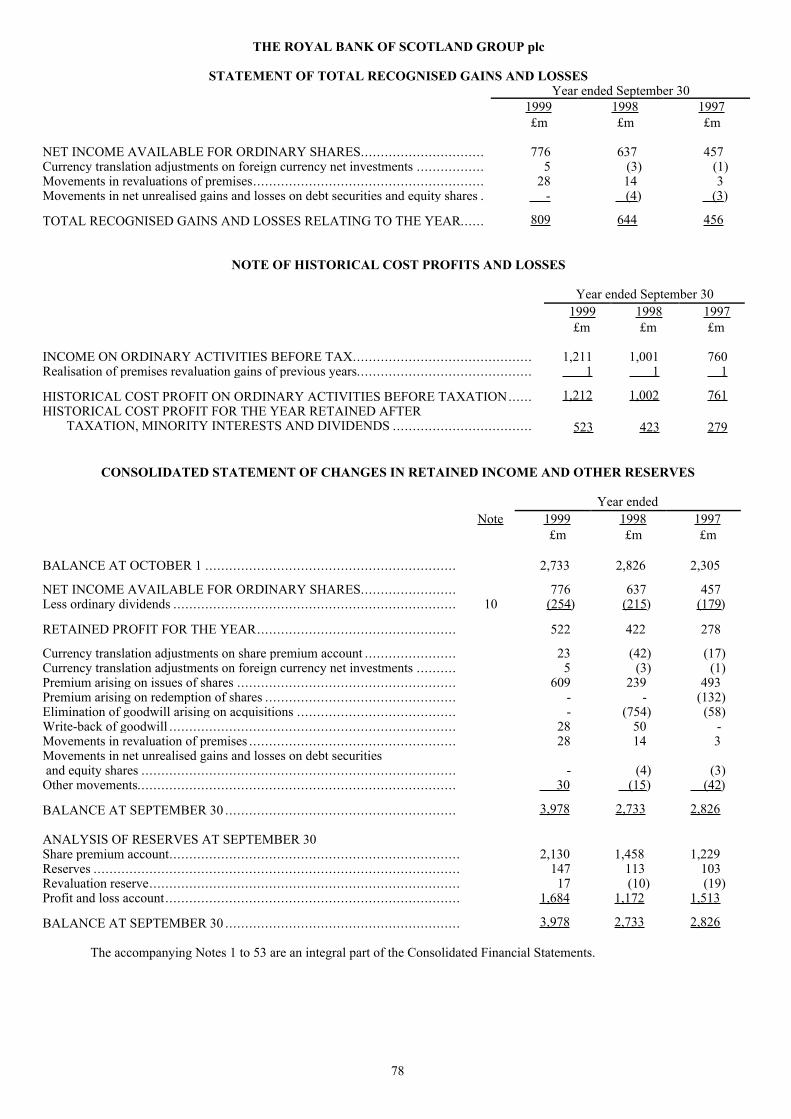
78
THE ROYAL BANK OF SCOTLAND GROUP plc
STATEMENT OF TOTAL RECOGNISED GAINS AND LOSSESYear ended SeptemberÊ30
1999 1998 1997£m £m £m
NET INCOME AVAILABLE FOR ORDINARY SHARES............................... 776 637 457Currency translation adjustments on foreign currency net investments ................. 5 (3) (1)Movements in revaluations of premises.......................................................... 28 14 3Movements in net unrealised gains and losses on debt securities and equity shares . - (4 ) (3 )
TOTAL RECOGNISED GAINS AND LOSSES RELATING TO THE YEAR...... 809 644 456
NOTE OF HISTORICAL COST PROFITS AND LOSSES
YearÊendedÊSeptemberÊ301999 1998 1997£m £m £m
INCOME ON ORDINARY ACTIVITIES BEFORE TAX............................................. 1,211 1,001 760Realisation of premises revaluation gains of previous years............................................ 1 1 1
HISTORICAL COST PROFIT ON ORDINARY ACTIVITIES BEFORE TAXATION...... 1,212 1,002 761HISTORICAL COST PROFIT FOR THE YEAR RETAINED AFTER
TAXATION, MINORITY INTERESTS AND DIVIDENDS ................................... 523 423 279
CONSOLIDATED STATEMENT OF CHANGES IN RETAINED INCOME AND OTHER RESERVES
YearÊendedÊNote 1999 1998 1997
£m £m £m
BALANCE AT OCTOBER 1 ............................................................... 2,733 2,826 2,305
NET INCOME AVAILABLE FOR ORDINARY SHARES........................ 776 637 457Less ordinary dividends ....................................................................... 10 (254 ) (215 ) (179 )
RETAINED PROFIT FOR THE YEAR.................................................. 522 422 278
Currency translation adjustments on share premium account ....................... 23 (42) (17)Currency translation adjustments on foreign currency net investments .......... 5 (3) (1)Premium arising on issues of shares ....................................................... 609 239 493Premium arising on redemption of shares ................................................ - - (132)Elimination of goodwill arising on acquisitions ........................................ - (754) (58)Write-back of goodwill ........................................................................ 28 50 -Movements in revaluation of premises .................................................... 28 14 3Movements in net unrealised gains and losses on debt securities and equity shares ............................................................................... - (4) (3)Other movements................................................................................ 30 (15 ) (42 )
BALANCE AT SEPTEMBER 30 .......................................................... 3,978 2,733 2,826
ANALYSIS OF RESERVES AT SEPTEMBER 30Share premium account......................................................................... 2,130 1,458 1,229Reserves ............................................................................................ 147 113 103Revaluation reserve.............................................................................. 17 (10) (19)Profit and loss account.......................................................................... 1,684 1,172 1,513
BALANCE AT SEPTEMBER 30 ........................................................... 3,978 2,733 2,826
The accompanying Notes 1 to 53 are an integral part of the Consolidated Financial Statements.
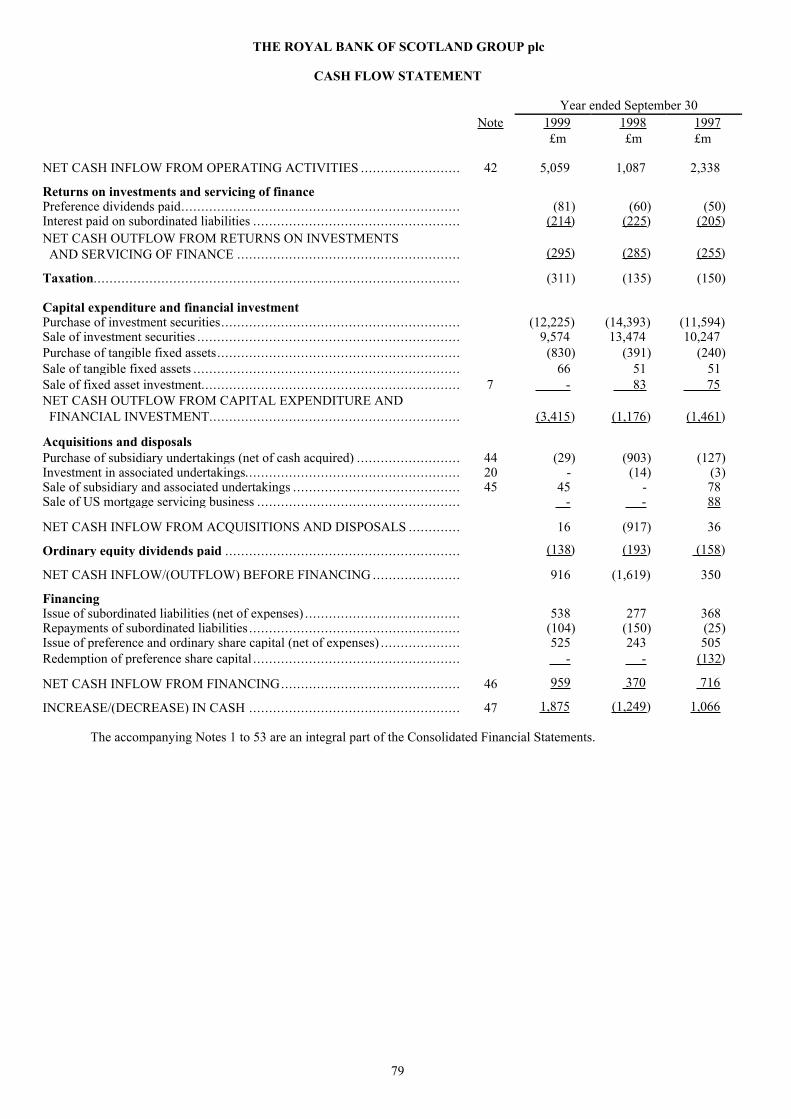
79
THE ROYAL BANK OF SCOTLAND GROUP plc
CASH FLOW STATEMENT
YearÊendedÊSeptemberÊ30Note 1999 1998 1997
£m £m £m
NET CASH INFLOW FROM OPERATING ACTIVITIES ......................... 42 5,059 1,087 2,338
Returns on investments and servicing of financePreference dividends paid...................................................................... (81) (60) (50)Interest paid on subordinated liabilities .................................................... (214 ) (225 ) (205 )NET CASH OUTFLOW FROM RETURNS ON INVESTMENTS AND SERVICING OF FINANCE ........................................................ (295 ) (285 ) (255 )
Taxation............................................................................................ (311) (135) (150)
Capital expenditure and financial investmentPurchase of investment securities............................................................ (12,225) (14,393) (11,594)Sale of investment securities .................................................................. 9,574 13,474 10,247Purchase of tangible fixed assets............................................................. (830) (391) (240)Sale of tangible fixed assets ................................................................... 66 51 51Sale of fixed asset investment................................................................. 7 - 83 75NET CASH OUTFLOW FROM CAPITAL EXPENDITURE AND FINANCIAL INVESTMENT............................................................... (3,415 ) (1,176 ) (1,461 )
Acquisitions and disposalsPurchase of subsidiary undertakings (net of cash acquired) .......................... 44 (29) (903) (127)Investment in associated undertakings...................................................... 20 - (14) (3)Sale of subsidiary and associated undertakings .......................................... 45 45 - 78Sale of US mortgage servicing business ................................................... - - 88
NET CASH INFLOW FROM ACQUISITIONS AND DISPOSALS ............. 16 (917) 36
Ordinary equity dividends paid ........................................................... (138 ) (193 ) (158 )
NET CASH INFLOW/(OUTFLOW) BEFORE FINANCING ...................... 916 (1,619) 350
FinancingIssue of subordinated liabilities (net of expenses) ....................................... 538 277 368Repayments of subordinated liabilities ..................................................... (104) (150) (25)Issue of preference and ordinary share capital (net of expenses) .................... 525 243 505Redemption of preference share capital .................................................... - - (132 )
NET CASH INFLOW FROM FINANCING............................................. 46 959 370 716
INCREASE/(DECREASE) IN CASH ..................................................... 47 1,875 (1,249 ) 1,066
The accompanying Notes 1 to 53 are an integral part of the Consolidated Financial Statements.

80
THE ROYAL BANK OF SCOTLAND GROUP plc
NOTES TO CONSOLIDATED FINANCIAL STATEMENTS
1. Accounting Policies
(a) Accounting convention and bases of consolidation
The financial statements are prepared in accordance with UK generally accepted accounting principles under the historicalcost convention, modified by the periodic valuations of premises and certain investments.
The preparation of financial statements requires management to make estimates and assumptions that affect the reportedamounts of assets and liabilities at the date of the financial statements and the reported amounts of revenues and expenses during thereporting period. Actual results could differ from those estimates but any difference should not be material. Estimates that areparticularly susceptible to significant change in the near term relate to the determination of the allowance for possible credit lossesand insurance reserves.
The Consolidated Financial Statements deal with the financial statements of the Group on the basis of a fiscal year endingSeptember 30.
In accounting for subsidiaries, the Group consolidates fully their assets, liabilities and results for the year and showsseparately the interests of minority shareholders therein. All inter-company balances and transactions are eliminated from theConsolidated Financial Statements.
(b) Goodwill
Goodwill is the excess of cost over fair value of the GroupÕs share of net assets acquired. Goodwill arising on acquisitionsof subsidiaries and associates after October 1, 1998 is generally capitalised on the balance sheet and amortised over its useful life. Incertain circumstances goodwill may not be amortised or the amortisation period may be more than 20 years, although stringentannual tests are applied in such cases. Goodwill which is identified as being impaired is written off to the Profit and Loss accountwhen the impairment is identified.
Goodwill arising on acquisitions of subsidiaries and associates prior to October 1, 1998 previously charged against theprofit and loss account reserves will remain eliminated and will be written back and reflected in the calculation of future gains andlosses only on disposal.
(c) Rates of exchange
The balance sheets of overseas branches and subsidiaries are translated into sterling at the rates of exchange ruling atSeptember 30 and their statements of income are translated at the average rates of exchange for the year to September 30. Exchangedifferences relating to trading are reflected in the Consolidated Statement of Income; those arising from the application of closingrates of exchange to the opening net assets are taken to profit and loss account reserves. The principal foreign currency requiringtranslation was US dollars and at September 30, 1999 the rate of exchange was $1.6465= £1.00 (1998 - $1.7001 = £1.00; 1997 -$1.6148 = £1.00). The average rate for the year to September 30, 1999, was $1.6297 = £1.00 (1998 - $1.6536 = £1.00; 1997 -$1.6327 = £1.00).
(d) Pensions and other post retirement benefits
The Group provides post-retirement benefits in the form of pensions and health care plans to eligible employees. The costof providing benefits under defined benefit pension schemes and health care plans is assessed by independent professionallyqualified actuaries and is recognised on a systematic basis over employeesÕ service lives. Contributions to defined contributionpension schemes are recognised in the Consolidated Statement of Income.
(e) Lease income receivable
Total gross earnings under finance leases are allocated to accounting periods to give a constant periodic rate of return on thenet cash investment. Finance lease receivables are stated in the balance sheet at the amount of the net investment in the lease.Progress payments made prior to the commencement of the lease are included at cost. Operating lease rentals are credited to theConsolidated Statement of Income on a receivable basis over the term of the lease.

81
THE ROYAL BANK OF SCOTLAND GROUP plc
NOTES TO CONSOLIDATED FINANCIAL STATEMENTS - Continued
(f) Insurance business
In calculating operating profit from general insurance activities, premiums are recognised in the accounting period in whichthey begin. Unearned premiums represent the proportion of the premiums which relate to periods of insurance after the balancesheet date and are calculated on a daily or a pro-rata basis of apportionment. Provision is made where necessary for the estimatedamount required over and above unearned premiums to meet future claims and related expenses and is calculated by class ofbusiness on the basis of a separate carry forward of deferred acquisition expenses after making allowance for investment income.Acquisition expenses relating to new and renewed automobile and household policies are deferred over the period during which thepremiums are earned, generally twelve months. The principal acquisition costs so deferred are direct advertising expenditure andcosts associated with the telesales and underwriting staff. Claims are accounted for in the accounting period in which the loss occursby making a provision for the full cost of settling outstanding claims at the balance sheet date. In addition, provisions are made forclaims estimated to have been incurred but not yet reported at that date, and claims handling expenses. The salary and other relatedcosts of engineers, employed to inspect claims, are included in claims.
(g) Value of long-term life assurance business
A value is placed on the GroupÕs long-term life assurance and in-force pensions policies written by Royal ScottishAssurance plc. The value is a prudent estimate of the net present value of the profits inherent in such policies and is determinedannually in consultation with an independent actuary. Changes in the value are included in Group operating profit as other income,grossed up at the underlying rate of taxation.
(h) Taxation
Provision is made for taxation at current rates on the taxable income and relief for overseas taxation is taken whereappropriate. Certain items of income and expenditure are accounted for in different periods for financial reporting purposes and fortaxation purposes. Deferred taxation is provided on the liability method in respect of timing differences to the extent that they arelikely to crystallise in the foreseeable future.
(i) Loans and advances
Specific provisions are made against loans and other lendings when, as a result of a detailed appraisal of the loan portfolio,it is considered that recovery is doubtful. A general provision is made against loans and other lendings to cover losses which havenot been separately identified but are known from experience to be present in any portfolio of bank loans. The specific and generalprovisions are deducted from loans for presentation in the GroupÕs Consolidated Balance Sheet. Provisions made during the year(less amounts released and recoveries of amounts charged-off in previous years) are charged against income. Interest receivable ondoubtful loans is brought into the Consolidated Statement of Income as it accrues provided that its collectibility is not subject tosignificant doubt. Interest debited to borrowersÕ accounts, the collectibility of which is subject to significant doubt is credited to aninterest in suspense account which is netted off against loans to customers. Loans classified as bad debts are charged-off in part or inwhole when there is no realistic prospect of recovery. Fee income relating to loans is recognised in the Consolidated Statement ofIncome to match the cost of providing a continuing service to the borrower, except where the fee is charged in lieu of interest when itis recognised on a level yield basis over the life of the advance. Other fees are recognised when they are receivable.
(j) Debt securities and equity shares
Debt securities and equity shares intended for use on a continuing basis in the GroupÕs activities are classified as investmentsecurities and are stated at cost less provisions for any impairment in value. The cost of dated investment securities is adjusted forthe amortisation of premiums or discounts over periods to redemption and any such amortisation is included in interest receivable.Debt securities held for the purpose of hedging are carried at a value which reflects the accounting treatment of the items hed gedDebt securities and equity shares held for dealing purposes are included in the Consolidated Balance Sheet at fair value. Whererepresentative market prices are not available, the fair value is calculated by applying current market information to pricing orvaluation models. Fair value includes, where appropriate, adjustments or income deferrals for items such as credit risk, liquidity riskand future operational costs.
Gains and losses on sales of securities are reflected in the Consolidated Statement of Income as they arise.
82
THE ROYAL BANK OF SCOTLAND GROUP plc
NOTES TO CONSOLIDATED FINANCIAL STATEMENTS - Continued
1. Accounting Policies (continued)
(k) Shares in subsidiary undertakings
The companyÕs shares in subsidiary undertakings are stated in the unconsolidated balance sheet of the company at adirectorsÕ valuation which takes account of the subsidiary undertakingsÕ net asset values.
(l) Interests in associated undertakings
Interests in associated undertakings are accounted for by the equity method and are stated in the Consolidated Balance Sheetat the investing companyÕs share of their net tangible assets. The investing companyÕs share of the results of associated undertakingsis included in the Consolidated Statement of Income. For this purpose, the latest available audited accounts are used together withavailable unaudited interim accounts.
(m) Tangible fixed assets
Freehold and long leasehold premises are maintained in a state of good repair with regular maintenance expenditure beingcharged against income. Depreciation is not charged on freehold and long leasehold premises as any such charge is considered to beinsignificant in view of their useful economic lives and estimated residual values. The costs of adapting premises for the use of theGroup are separately identified and depreciated on a straight-line basis over fifteen years. Short leasehold premises are amortised byequal annual instalments over the unexpired term of the lease. Valuations of premises are carried out annually by the BankÕs internalprofessional surveyors and in some instances by independent valuers. Any increase or deficit on revaluation is reflected in thecarrying value of premises at that time. Any impairment in the value of premises is charged to the Consolidated Statement ofIncome after eliminating previous revaluation surpluses arising on the premises. When impairment is due to a clear consumption ofeconomic benefits, a charge is made to the Consolidated Statement of Income for the amount of impairment. Any profit from thesale of revalued premises is calculated by deducting the revalued amount from the net proceeds. Computers, vehicles and officeequipment are depreciated on a straight-line basis over five years, office furniture and fittings over ten years and plant and equipmentover fifteen years. Assets on operating leases are depreciated on a straight-line basis over periods related to the estimated usefullives of such assets.
(n) Derivative transactions
A description of the derivatives into which the Group enters for both trading and non-trading purposes is given on page 64.The accounting treatment for these instruments is dependent upon whether they are entered into for trading or non-trading (hedging)purposes.
Trading
Trading derivatives are those actively traded or held under constant review of both their realisable value and potential futurereturn. Trading transactions are recognised in the financial statements at fair value. The resultant gains or losses arising fromchanges in the fair value are shown under dealing profits in the Consolidated Statement of Income and are included within net cashinflow from operating activities in the Cash Flow Statement. Assets, or positive fair values, arising from transactions in theseinstruments, are shown under other assets in the Consolidated Balance Sheet. Liabilities, or negative fair values, arising fromtransactions in these instruments, are shown under other liabilities in the Consolidated Balance Sheet. For many derivativeinstruments, fair value is determined by market prices. Where representative market prices are not available, the fair value iscalculated by applying current market information to pricing or valuation models. Fair value includes, where appropriate,adjustments or income deferrals for items such as credit risk, liquidity risk and future operational costs.
Non-trading
Non-trading derivatives are entered into by the Group to close out or reduce (hedge) the market risk arising on transactionsentered into in the normal course of banking activities.
Non-trading transactions entered into for hedging purposes are recognised in the financial statements in accordance with theaccounting treatment of the underlying transaction or transactions being hedged. They are therefore recognised as adjustments to theincome and expenditure, balance or cash flow of the transaction or transactions being hedged. To the extent necessary to achieve acommon timing of income recognition on the transaction or transactions being hedged, deferred gains and losses are included in theConsolidated Balance Sheet under accruals and deferred income and prepayments and accrued income respectively.
A non-trading derivative hedge transaction must significantly reduce the market risk arising on the underlying transaction,transactions, or part thereof, to be classified as a hedge. Also, in order for a non-trading derivative transaction to be accounted for asa hedge, it must have a demonstrable link to an individual underlying transaction, pool of underlying transactions or specific futuretransactions. Specified future transactions must have a reasonable degree of certainty of arising in order for the derivative to beaccounted for as a hedge.

83
THE ROYAL BANK OF SCOTLAND GROUP plc
NOTES TO CONSOLIDATED FINANCIAL STATEMENTS - ContinuedIn the event that a non-trading derivative transaction is terminated or ceases to be an effective hedge, the derivative is fair
valued and the resulting profit or loss is amortised over the remaining life of the underlying transaction or transactions being hedged.If the accumulation of the fair valuation of the derivative and the expected future revenues of the underlying transaction result in anet loss, that loss will be recognised immediately. In the case of hedges of specific future transactions, if it is determined that theanticipated transactions are no longer likely to occur, the hedge is fair valued and any resultant profits or losses recognisedimmediately. Where the underlying item being hedged is removed, any profits or losses arising on the hedge will be recognised onthe same basis as the profits or losses arising on the removed underlying transaction.
Material deferred gains or losses arising on hedges of specific future transactions or as a result of the termination of hedgesare disclosed in Note 39 to the Consolidated Financial Statements.
(o) Sale and repurchase transactions
Securities which have been sold with an agreement to repurchase continue to be shown on the balance sheet and the saleproceeds recorded as a deposit. Securities acquired in reverse sale and repurchase transactions are not recognised in the balancesheet and the purchase price is treated as a loan. The difference between the sale price and repurchase price is accrued evenly overthe life of the transaction and charged or credited to the profit and loss account as interest payable or receivable.
(p) Securitisations
Certain Group undertakings have issued debt securities, or have entered into funding arrangements with lenders, in order tofinance the purchase of certain portfolios of loan and investment assets. These obligations are secured on the assets of theundertakings. Where the Group has retained significant benefits and risks relating to the portfolios of assets, the assets and therelated liabilities are presented within the relevant headings in the Group balance sheet.
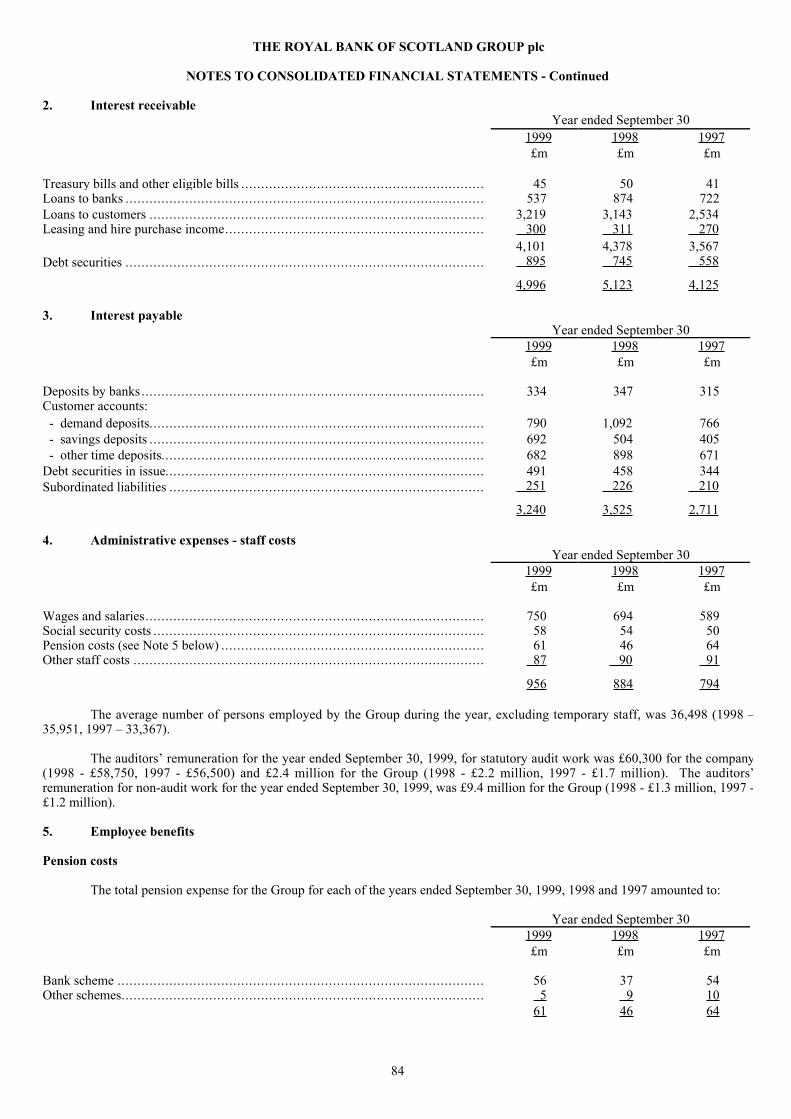
84
THE ROYAL BANK OF SCOTLAND GROUP plc
NOTES TO CONSOLIDATED FINANCIAL STATEMENTS - Continued
2. Interest receivableYearÊendedÊSeptemberÊ30
1999 1998 1997£m £m £m
Treasury bills and other eligible bills ............................................................. 45 50 41Loans to banks .......................................................................................... 537 874 722Loans to customers .................................................................................... 3,219 3,143 2,534Leasing and hire purchase income................................................................. 300 311 270
4,101 4,378 3,567Debt securities .......................................................................................... 895 745 558
4,996 5,123 4,125
3. Interest payableYearÊendedÊSeptemberÊ30
1999 1998 1997£m £m £m
Deposits by banks...................................................................................... 334 347 315Customer accounts: - demand deposits.................................................................................... 790 1,092 766 - savings deposits .................................................................................... 692 504 405 - other time deposits................................................................................. 682 898 671Debt securities in issue................................................................................ 491 458 344Subordinated liabilities ............................................................................... 251 226 210
3,240 3,525 2,711
4. Administrative expenses - staff costsYearÊendedÊSeptemberÊ30
1999 1998 1997£m £m £m
Wages and salaries..................................................................................... 750 694 589Social security costs ................................................................................... 58 54 50Pension costs (see Note 5 below) .................................................................. 61 46 64Other staff costs ........................................................................................ 87 90 91
956 884 794
The average number of persons employed by the Group during the year, excluding temporary staff, was 36,498 (1998 Ð35,951, 1997 Ð 33,367).
The auditorsÕ remuneration for the year ended September 30, 1999, for statutory audit work was £60,300 for the company(1998 - £58,750, 1997 - £56,500) and £2.4 million for the Group (1998 - £2.2 million, 1997 - £1.7 million). The auditorsÕremuneration for non-audit work for the year ended September 30, 1999, was £9.4 million for the Group (1998 - £1.3 million, 1997 -£1.2 million).
5. Employee benefits
Pension costs
The total pension expense for the Group for each of the years ended September 30, 1999, 1998 and 1997 amounted to:
YearÊendedÊSeptemberÊ301999 1998 1997£m £m £m
Bank scheme ............................................................................................ 56 37 54Other schemes........................................................................................... 5 9 10
61 46 64
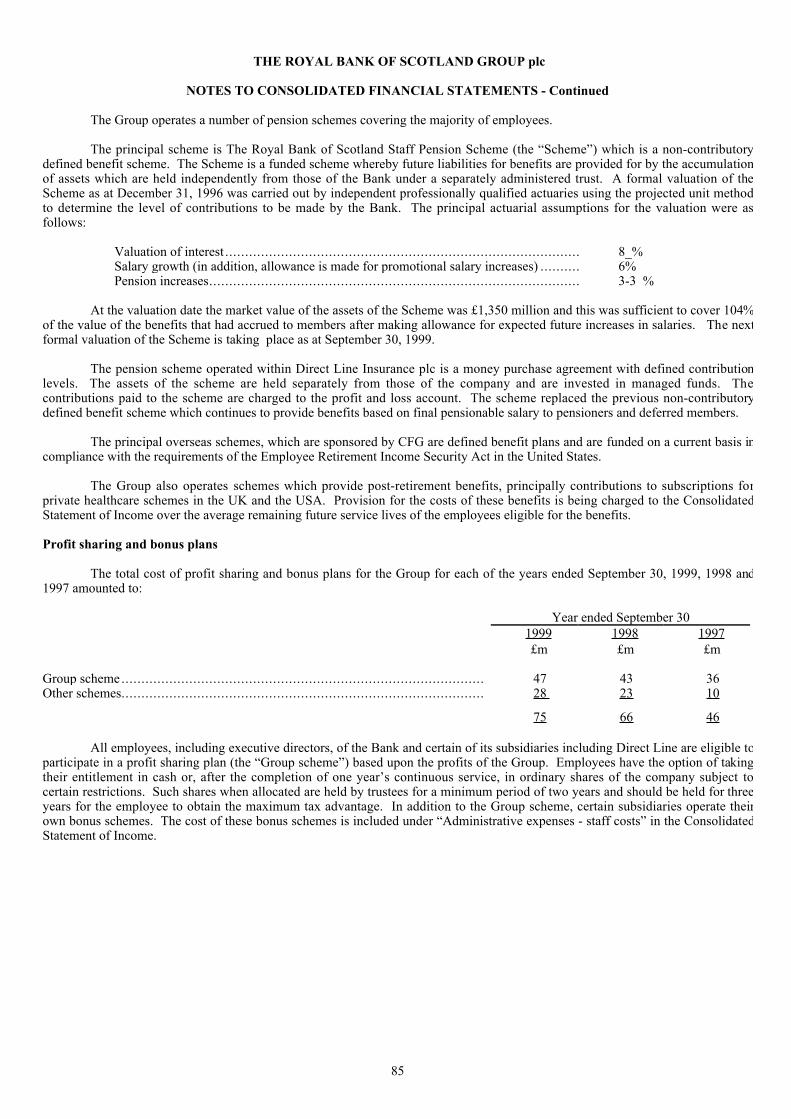
85
THE ROYAL BANK OF SCOTLAND GROUP plc
NOTES TO CONSOLIDATED FINANCIAL STATEMENTS - Continued
The Group operates a number of pension schemes covering the majority of employees.
The principal scheme is The Royal Bank of Scotland Staff Pension Scheme (the ÒSchemeÓ) which is a non-contributorydefined benefit scheme. The Scheme is a funded scheme whereby future liabilities for benefits are provided for by the accumulationof assets which are held independently from those of the Bank under a separately administered trust. A formal valuation of theScheme as at December 31, 1996 was carried out by independent professionally qualified actuaries using the projected unit methodto determine the level of contributions to be made by the Bank. The principal actuarial assumptions for the valuation were asfollows:
Valuation of interest ......................................................................................... 8_%Salary growth (in addition, allowance is made for promotional salary increases) .......... 6%Pension increases............................................................................................. 3-3_%
At the valuation date the market value of the assets of the Scheme was £1,350 million and this was sufficient to cover 104%of the value of the benefits that had accrued to members after making allowance for expected future increases in salaries. The nextformal valuation of the Scheme is taking place as at September 30, 1999.
The pension scheme operated within Direct Line Insurance plc is a money purchase agreement with defined contributionlevels. The assets of the scheme are held separately from those of the company and are invested in managed funds. Thecontributions paid to the scheme are charged to the profit and loss account. The scheme replaced the previous non-contributorydefined benefit scheme which continues to provide benefits based on final pensionable salary to pensioners and deferred members.
The principal overseas schemes, which are sponsored by CFG are defined benefit plans and are funded on a current basis incompliance with the requirements of the Employee Retirement Income Security Act in the United States.
The Group also operates schemes which provide post-retirement benefits, principally contributions to subscriptions forprivate healthcare schemes in the UK and the USA. Provision for the costs of these benefits is being charged to the ConsolidatedStatement of Income over the average remaining future service lives of the employees eligible for the benefits.
Profit sharing and bonus plans
The total cost of profit sharing and bonus plans for the Group for each of the years ended September 30, 1999, 1998 and1997 amounted to:
YearÊendedÊSeptemberÊ301999 1998 1997£m £m £m
Group scheme ........................................................................................... 47 43 36Other schemes........................................................................................... 28Ê 23 10
75 66 46
All employees, including executive directors, of the Bank and certain of its subsidiaries including Direct Line are eligible toparticipate in a profit sharing plan (the ÒGroup schemeÓ) based upon the profits of the Group. Employees have the option of takingtheir entitlement in cash or, after the completion of one yearÕs continuous service, in ordinary shares of the company subject tocertain restrictions. Such shares when allocated are held by trustees for a minimum period of two years and should be held for threeyears for the employee to obtain the maximum tax advantage. In addition to the Group scheme, certain subsidiaries operate theirown bonus schemes. The cost of these bonus schemes is included under ÒAdministrative expenses - staff costsÓ in the ConsolidatedStatement of Income.
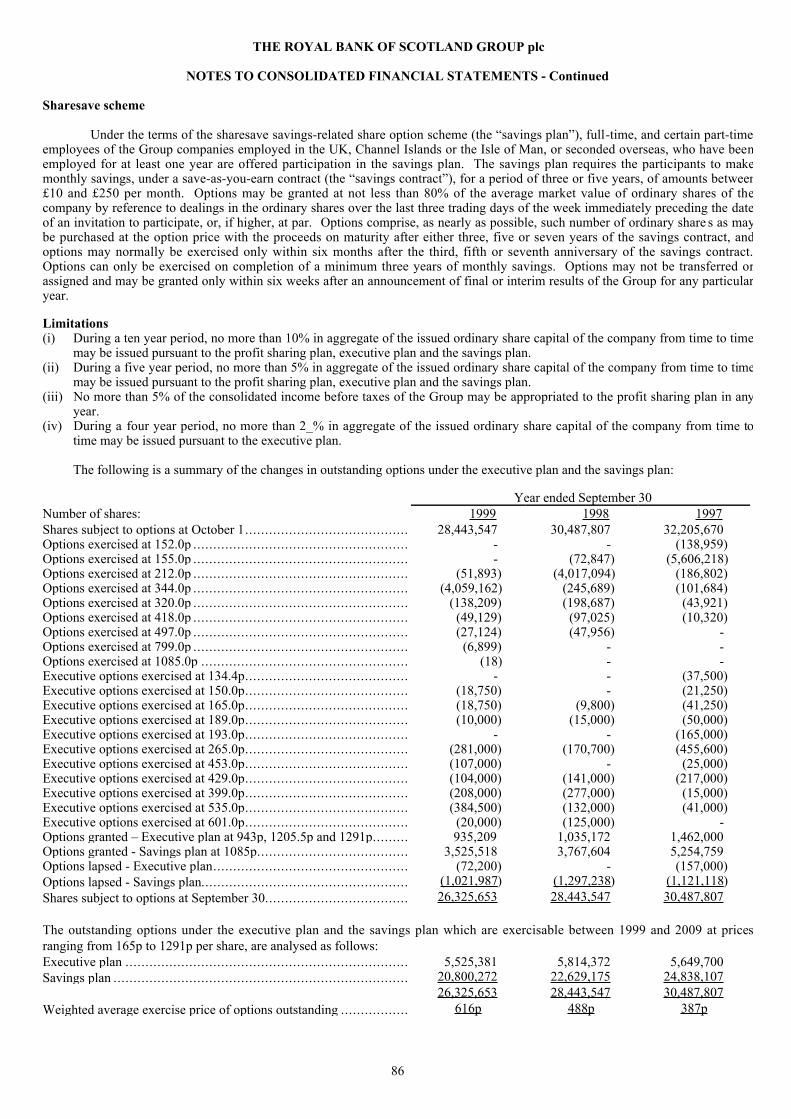
86
THE ROYAL BANK OF SCOTLAND GROUP plc
NOTES TO CONSOLIDATED FINANCIAL STATEMENTS - Continued
Sharesave scheme
Under the terms of the sharesave savings-related share option scheme (the Òsavings planÓ), full-time, and certain part-timeemployees of the Group companies employed in the UK, Channel Islands or the Isle of Man, or seconded overseas, who have beenemployed for at least one year are offered participation in the savings plan. The savings plan requires the participants to makemonthly savings, under a save-as-you-earn contract (the Òsavings contractÓ), for a period of three or five years, of amounts between£10 and £250 per month. Options may be granted at not less than 80% of the average market value of ordinary shares of thecompany by reference to dealings in the ordinary shares over the last three trading days of the week immediately preceding the dateof an invitation to participate, or, if higher, at par. Options comprise, as nearly as possible, such number of ordinary share s as maybe purchased at the option price with the proceeds on maturity after either three, five or seven years of the savings contract, andoptions may normally be exercised only within six months after the third, fifth or seventh anniversary of the savings contract.Options can only be exercised on completion of a minimum three years of monthly savings. Options may not be transferred orassigned and may be granted only within six weeks after an announcement of final or interim results of the Group for any particularyear.
Limitations(i) During a ten year period, no more than 10% in aggregate of the issued ordinary share capital of the company from time to time
may be issued pursuant to the profit sharing plan, executive plan and the savings plan.(ii) During a five year period, no more than 5% in aggregate of the issued ordinary share capital of the company from time to time
may be issued pursuant to the profit sharing plan, executive plan and the savings plan.(iii) No more than 5% of the consolidated income before taxes of the Group may be appropriated to the profit sharing plan in any
year.(iv) During a four year period, no more than 2_% in aggregate of the issued ordinary share capital of the company from time to
time may be issued pursuant to the executive plan.
The following is a summary of the changes in outstanding options under the executive plan and the savings plan:
ÊYearÊendedÊSeptemberÊ30Number of shares: 1999 1998 1997Shares subject to options at October 1......................................... 28,443,547 30,487,807 32,205,670Options exercised at 152.0p ...................................................... - - (138,959)Options exercised at 155.0p ...................................................... - (72,847) (5,606,218)Options exercised at 212.0p ...................................................... (51,893) (4,017,094) (186,802)Options exercised at 344.0p ...................................................... (4,059,162) (245,689) (101,684)Options exercised at 320.0p ...................................................... (138,209) (198,687) (43,921)Options exercised at 418.0p ...................................................... (49,129) (97,025) (10,320)Options exercised at 497.0p ...................................................... (27,124) (47,956) -Options exercised at 799.0p ...................................................... (6,899) - -Options exercised at 1085.0p .................................................... (18) - -Executive options exercised at 134.4p......................................... - - (37,500)Executive options exercised at 150.0p......................................... (18,750) - (21,250)Executive options exercised at 165.0p......................................... (18,750) (9,800) (41,250)Executive options exercised at 189.0p......................................... (10,000) (15,000) (50,000)Executive options exercised at 193.0p......................................... - - (165,000)Executive options exercised at 265.0p......................................... (281,000) (170,700) (455,600)Executive options exercised at 453.0p......................................... (107,000) - (25,000)Executive options exercised at 429.0p......................................... (104,000) (141,000) (217,000)Executive options exercised at 399.0p......................................... (208,000) (277,000) (15,000)Executive options exercised at 535.0p......................................... (384,500) (132,000) (41,000)Executive options exercised at 601.0p......................................... (20,000) (125,000) -Options granted Ð Executive plan at 943p, 1205.5p and 1291p......... 935,209 1,035,172 1,462,000Options granted - Savings plan at 1085p...................................... 3,525,518 3,767,604 5,254,759Options lapsed - Executive plan................................................. (72,200) - (157,000)Options lapsed - Savings plan.................................................... (1,021,987 ) (1,297,238 ) (1,121,118 )Shares subject to options at September 30.................................... 26,325,653 28,443,547 30,487,807
The outstanding options under the executive plan and the savings plan which are exercisable between 1999 and 2009 at pricesranging from 165p to 1291p per share, are analysed as follows:Executive plan ....................................................................... 5,525,381 5,814,372 5,649,700Savings plan .......................................................................... 20,800,272 22,629,175 24,838,107
26,325,653 28,443,547 30,487,807Weighted average exercise price of options outstanding ................. 616p 488p 387p
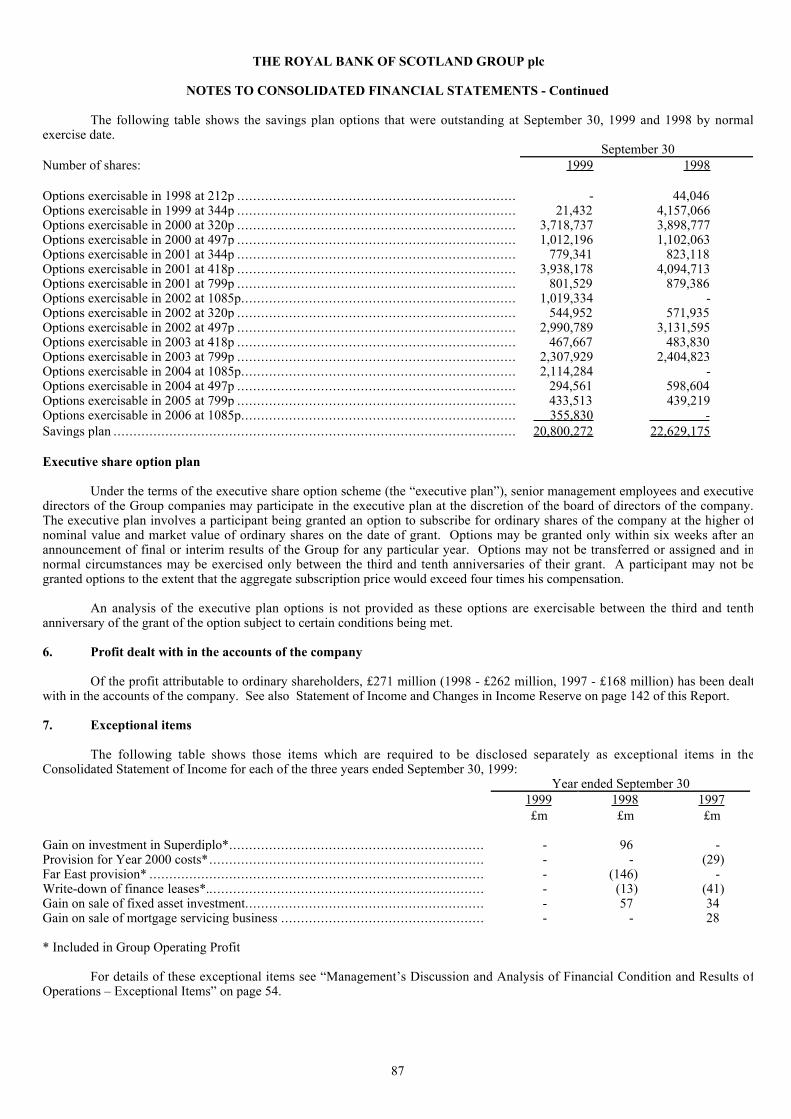
87
THE ROYAL BANK OF SCOTLAND GROUP plc
NOTES TO CONSOLIDATED FINANCIAL STATEMENTS - Continued
The following table shows the savings plan options that were outstanding at September 30, 1999 and 1998 by normalexercise date.
September 30Number of shares: 1999 1998
Options exercisable in 1998 at 212p ...................................................................... - 44,046Options exercisable in 1999 at 344p ...................................................................... 21,432 4,157,066Options exercisable in 2000 at 320p ...................................................................... 3,718,737 3,898,777Options exercisable in 2000 at 497p ...................................................................... 1,012,196 1,102,063Options exercisable in 2001 at 344p ...................................................................... 779,341 823,118Options exercisable in 2001 at 418p ...................................................................... 3,938,178 4,094,713Options exercisable in 2001 at 799p ...................................................................... 801,529 879,386Options exercisable in 2002 at 1085p..................................................................... 1,019,334 -Options exercisable in 2002 at 320p ...................................................................... 544,952 571,935Options exercisable in 2002 at 497p ...................................................................... 2,990,789 3,131,595Options exercisable in 2003 at 418p ...................................................................... 467,667 483,830Options exercisable in 2003 at 799p ...................................................................... 2,307,929 2,404,823Options exercisable in 2004 at 1085p..................................................................... 2,114,284 -Options exercisable in 2004 at 497p ...................................................................... 294,561 598,604Options exercisable in 2005 at 799p ...................................................................... 433,513 439,219Options exercisable in 2006 at 1085p..................................................................... 355,830 -Savings plan ..................................................................................................... 20,800,272 22,629,175
Executive share option plan
Under the terms of the executive share option scheme (the Òexecutive planÓ), senior management employees and executivedirectors of the Group companies may participate in the executive plan at the discretion of the board of directors of the company.The executive plan involves a participant being granted an option to subscribe for ordinary shares of the company at the higher ofnominal value and market value of ordinary shares on the date of grant. Options may be granted only within six weeks after anannouncement of final or interim results of the Group for any particular year. Options may not be transferred or assigned and innormal circumstances may be exercised only between the third and tenth anniversaries of their grant. A participant may not begranted options to the extent that the aggregate subscription price would exceed four times his compensation.
An analysis of the executive plan options is not provided as these options are exercisable between the third and tenthanniversary of the grant of the option subject to certain conditions being met.
6. Profit dealt with in the accounts of the company
Of the profit attributable to ordinary shareholders, £271 million (1998 - £262 million, 1997 - £168 million) has been dealtwith in the accounts of the company. See also Statement of Income and Changes in Income Reserve on page 142 of this Report.
7. Exceptional items
The following table shows those items which are required to be disclosed separately as exceptional items in theConsolidated Statement of Income for each of the three years ended September 30, 1999:
YearÊendedÊSeptemberÊ301999 1998 1997£m £m £m
Gain on investment in Superdiplo*................................................................ - 96 -Provision for Year 2000 costs*..................................................................... - - (29)Far East provision* .................................................................................... - (146) -Write-down of finance leases*...................................................................... - (13) (41)Gain on sale of fixed asset investment............................................................ - 57 34Gain on sale of mortgage servicing business ................................................... - - 28
* Included in Group Operating Profit
For details of these exceptional items see ÒManagementÕs Discussion and Analysis of Financial Condition and Results ofOperations Ð Exceptional ItemsÓ on page 54.
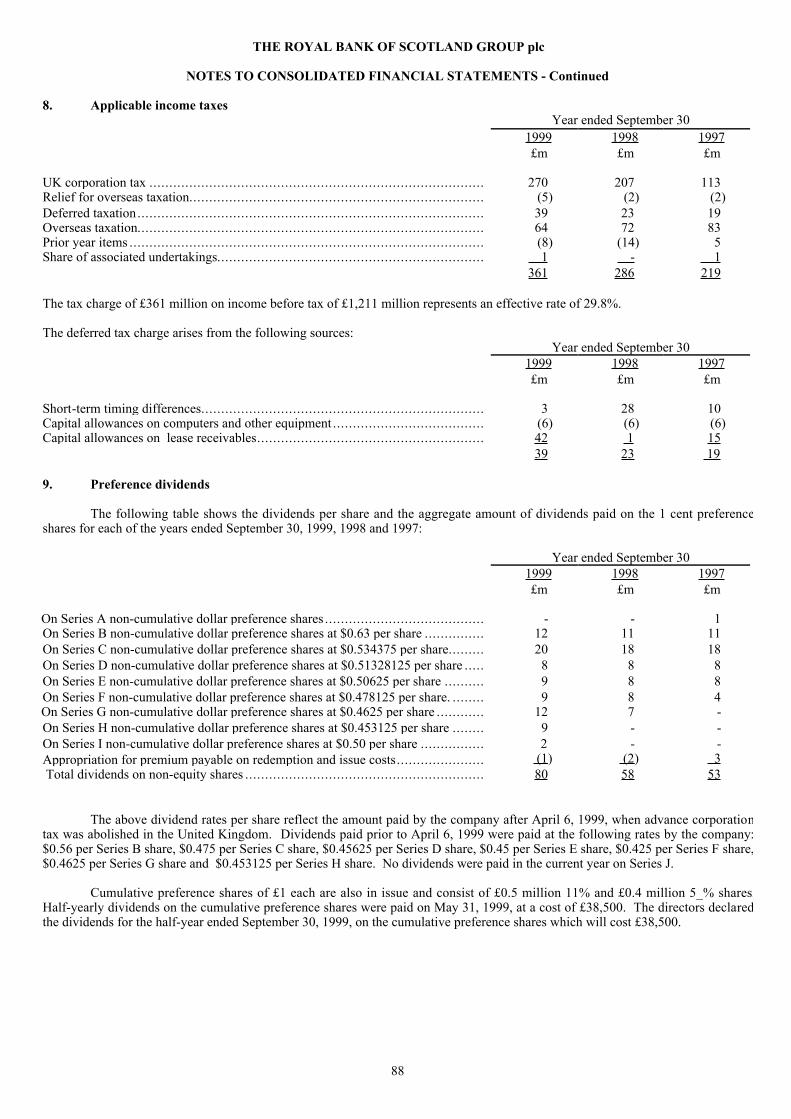
88
THE ROYAL BANK OF SCOTLAND GROUP plc
NOTES TO CONSOLIDATED FINANCIAL STATEMENTS - Continued
8. Applicable income taxesYearÊendedÊSeptemberÊ30
1999 1998 1997£m £m £m
UK corporation tax .................................................................................... 270 207 113Relief for overseas taxation.......................................................................... (5) (2) (2)Deferred taxation....................................................................................... 39 23 19Overseas taxation....................................................................................... 64 72 83Prior year items ......................................................................................... (8) (14) 5Share of associated undertakings................................................................... 1 - 1
361 286 219
The tax charge of £361 million on income before tax of £1,211 million represents an effective rate of 29.8%.
The deferred tax charge arises from the following sources:YearÊendedÊSeptemberÊ30
1999 1998 1997£m £m £m
Short-term timing differences....................................................................... 3 28 10Capital allowances on computers and other equipment ...................................... (6) (6) (6)Capital allowances on lease receivables......................................................... 42 1 15
39 23 19
9. Preference dividends
The following table shows the dividends per share and the aggregate amount of dividends paid on the 1 cent preferenceshares for each of the years ended September 30, 1999, 1998 and 1997:
YearÊendedÊSeptemberÊ301999 1998 1997£m £m £m
On Series A non-cumulative dollar preference shares ........................................ - - 1On Series B non-cumulative dollar preference shares at $0.63 per share ............... 12 11 11On Series C non-cumulative dollar preference shares at $0.534375 per share......... 20 18 18On Series D non-cumulative dollar preference shares at $0.51328125 per share ..... 8 8 8On Series E non-cumulative dollar preference shares at $0.50625 per share .......... 9 8 8On Series F non-cumulative dollar preference shares at $0.478125 per share. ........ 9 8 4On Series G non-cumulative dollar preference shares at $0.4625 per share ............ 12 7 -On Series H non-cumulative dollar preference shares at $0.453125 per share ........ 9 - -On Series I non-cumulative dollar preference shares at $0.50 per share ................ 2 - -Appropriation for premium payable on redemption and issue costs...................... (1 ) (2 ) 3 Total dividends on non-equity shares ............................................................ 80 58 53
The above dividend rates per share reflect the amount paid by the company after April 6, 1999, when advance corporationtax was abolished in the United Kingdom. Dividends paid prior to April 6, 1999 were paid at the following rates by the company:$0.56 per Series B share, $0.475 per Series C share, $0.45625 per Series D share, $0.45 per Series E share, $0.425 per Series F share,$0.4625 per Series G share and $0.453125 per Series H share. No dividends were paid in the current year on Series J.
Cumulative preference shares of £1 each are also in issue and consist of £0.5 million 11% and £0.4 million 5_% shares.Half-yearly dividends on the cumulative preference shares were paid on May 31, 1999, at a cost of £38,500. The directors declaredthe dividends for the half-year ended September 30, 1999, on the cumulative preference shares which will cost £38,500.

89
THE ROYAL BANK OF SCOTLAND GROUP plc
NOTES TO CONSOLIDATED FINANCIAL STATEMENTS - Continued
10. Ordinary dividends
The following table shows the aggregate amount of dividends paid on ordinary shares and dividends per ordinary share foreach of the three years ended September 30, 1999:
YearÊendedÊSeptemberÊ301999 1998 1997£m £m £m
Ordinary sharesInterim.............................................................................................. 73 62 48Proposed final .................................................................................... 181 153 131
Total dividends on ordinary shares ................................................................ 254 215 179
Per 25 pence ordinary share:Interim.............................................................................................. 8.2p 7.13p 6.2pProposed final .................................................................................... 20.3p 17.47p 15.2p
Total dividend per 25 pence ordinary share ..................................................... 28.5p 24.6pÊÊ 21.4p
11. Earnings per ordinary shareYear ended SeptemberÊ30
1999 1998 1997 £m £m £m
Earnings:Net income available for ordinary shares ........................................................ 776 637 457Exceptional items ...................................................................................... - (10 ) (16 )Net income available for ordinary shares before exceptional items ...................... 776 627 441
Number of shares Ð millions
Number of ordinary shares:Weighted average number of ordinary shares in issue during the year .................. 883.8 867.2 824.6Dilutive effect of share options outstanding .................................................... 12.4 12.6 9.8Diluted weighted average number of ordinary shares in issue during the year ........ 896.2 879.8 834.4
12. Treasury bills and other eligible billsSeptemberÊ30
1999 1998£m £m
Treasury bills and similar securities...................................................................................... 106 77Other eligible bills ............................................................................................................ 595 562
701 639
13. Loans to banksSeptemberÊ30
1999 1998£m £m
Repayable on demand........................................................................................................ 4,408 2,632Remaining maturity
- three months or less...................................................................................................... 4,244 7,379- one year or less but over three months.............................................................................. 1,167 1,252- five years or less but over one year.................................................................................. 320 64- over five years............................................................................................................. 236 187
10,375 11,514
Certain subsidiary undertakings are required to maintain balances with the Bank of England which, at September 30, 1999amounted to £46 million (1998 - £41 million). Certain subsidiary undertakings are required by law to maintain average reservebalances with the Federal Reserve Bank in the United States. Such reserve balances amounted to $162 million at September 30,1999 (1998 - $163 million).
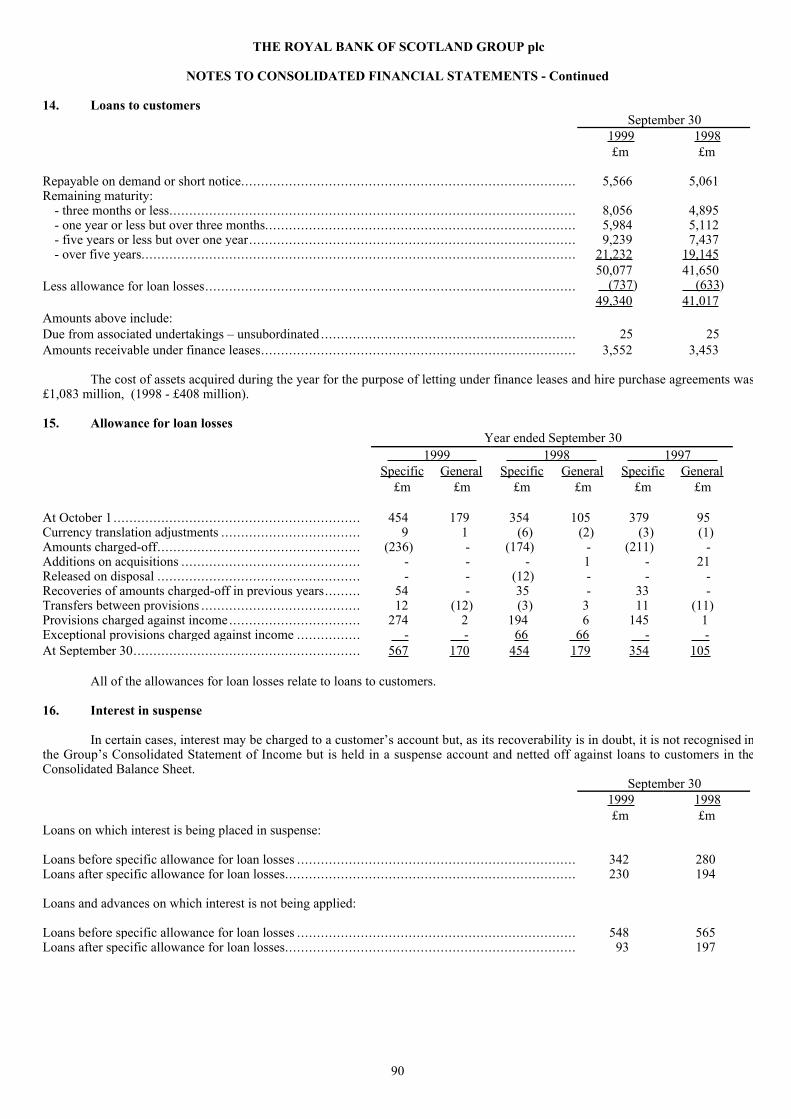
90
THE ROYAL BANK OF SCOTLAND GROUP plc
NOTES TO CONSOLIDATED FINANCIAL STATEMENTS - Continued
14. Loans to customersSeptemberÊ30
1999 1998£m £m
Repayable on demand or short notice.................................................................................... 5,566 5,061Remaining maturity:
- three months or less...................................................................................................... 8,056 4,895- one year or less but over three months.............................................................................. 5,984 5,112- five years or less but over one year.................................................................................. 9,239 7,437- over five years............................................................................................................. 21,232 19,145
50,077 41,650Less allowance for loan losses............................................................................................. (737 ) (633 )
49,340 41,017Amounts above include:Due from associated undertakings Ð unsubordinated ................................................................ 25 25Amounts receivable under finance leases............................................................................... 3,552 3,453
The cost of assets acquired during the year for the purpose of letting under finance leases and hire purchase agreements was£1,083 million, (1998 - £408 million).
15. Allowance for loan lossesYearÊendedÊSeptemberÊ30
ÊÊÊÊÊÊÊÊÊÊÊ1999ÊÊÊÊÊÊÊÊ ÊÊÊÊÊÊÊÊÊÊÊ1998ÊÊÊÊÊÊÊÊ ÊÊÊÊÊÊÊÊÊÊÊ1997ÊÊÊÊÊÊÊÊSpecific General Specific General Specific General
£m £m £m £m £m £m
At October 1 .............................................................. 454 179 354 105 379 95Currency translation adjustments ................................... 9 1 (6) (2) (3) (1)Amounts charged-off................................................... (236) - (174) - (211) -Additions on acquisitions ............................................. - - - 1 - 21Released on disposal ................................................... - - (12) - - -Recoveries of amounts charged-off in previous years......... 54 - 35 - 33 -Transfers between provisions ........................................ 12 (12) (3) 3 11 (11)Provisions charged against income................................. 274 2 194 6 145 1Exceptional provisions charged against income ................ - - 66 66 - -At September 30......................................................... 567 170 454 179 354 105
All of the allowances for loan losses relate to loans to customers.
16. Interest in suspense
In certain cases, interest may be charged to a customerÕs account but, as its recoverability is in doubt, it is not recognised inthe GroupÕs Consolidated Statement of Income but is held in a suspense account and netted off against loans to customers in theConsolidated Balance Sheet.
SeptemberÊ301999 1998£m £m
Loans on which interest is being placed in suspense:
Loans before specific allowance for loan losses ...................................................................... 342 280Loans after specific allowance for loan losses......................................................................... 230 194
Loans and advances on which interest is not being applied:
Loans before specific allowance for loan losses ...................................................................... 548 565Loans after specific allowance for loan losses......................................................................... 93 197
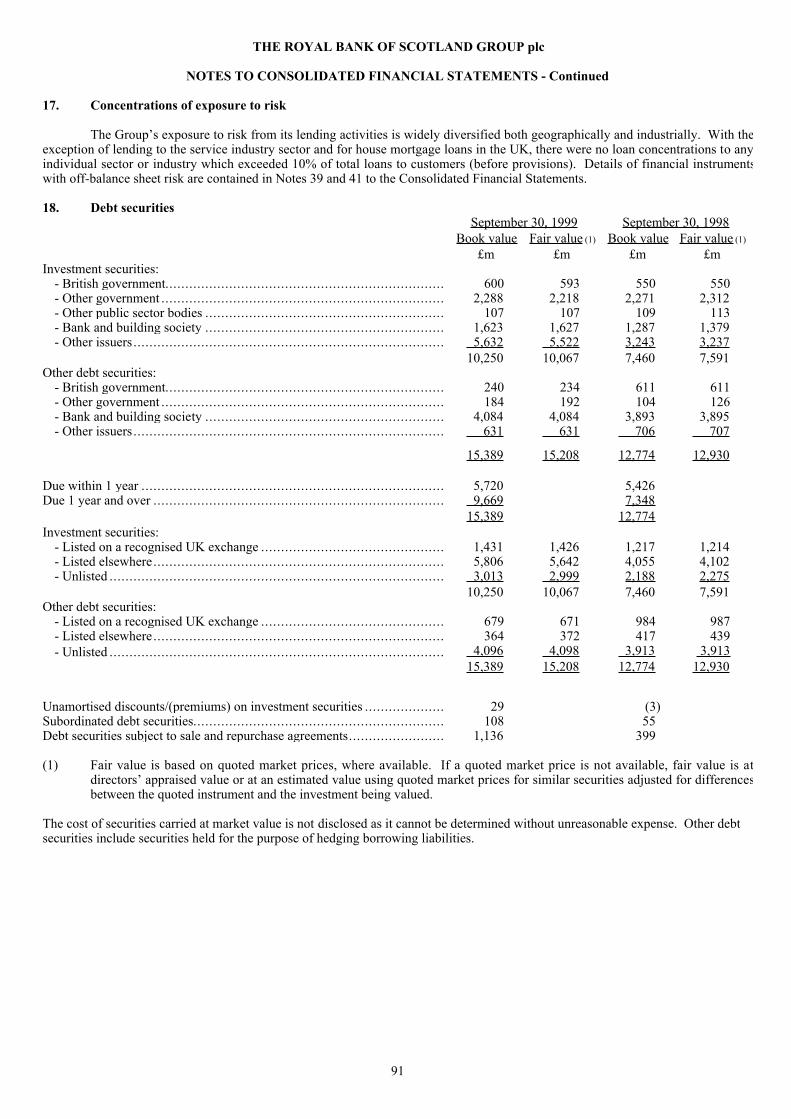
91
THE ROYAL BANK OF SCOTLAND GROUP plc
NOTES TO CONSOLIDATED FINANCIAL STATEMENTS - Continued
17. Concentrations of exposure to risk
The GroupÕs exposure to risk from its lending activities is widely diversified both geographically and industrially. With theexception of lending to the service industry sector and for house mortgage loans in the UK, there were no loan concentrations to anyindividual sector or industry which exceeded 10% of total loans to customers (before provisions). Details of financial instrumentswith off-balance sheet risk are contained in Notes 39 and 41 to the Consolidated Financial Statements.
18. Debt securitiesSeptember 30, 1999 September 30, 1998
Book value Fair value (1) Book value Fair value (1)
£m £m £m £mInvestment securities:
- British government...................................................................... 600 593 550 550- Other government ....................................................................... 2,288 2,218 2,271 2,312- Other public sector bodies ............................................................ 107 107 109 113- Bank and building society ............................................................ 1,623 1,627 1,287 1,379- Other issuers.............................................................................. 5,632 5,522 3,243 3,237
10,250 10,067 7,460 7,591Other debt securities:
- British government...................................................................... 240 234 611 611- Other government ....................................................................... 184 192 104 126- Bank and building society ............................................................ 4,084 4,084 3,893 3,895- Other issuers.............................................................................. 631 631 706 707
15,389 15,208 12,774 12,930
Due within 1 year ............................................................................ 5,720 5,426Due 1 year and over ......................................................................... 9,669 7,348
15,389 12,774Investment securities:
- Listed on a recognised UK exchange .............................................. 1,431 1,426 1,217 1,214- Listed elsewhere......................................................................... 5,806 5,642 4,055 4,102- Unlisted .................................................................................... 3,013 2,999 2,188 2,275
10,250 10,067 7,460 7,591Other debt securities:
- Listed on a recognised UK exchange .............................................. 679 671 984 987- Listed elsewhere......................................................................... 364 372 417 439- Unlisted .................................................................................... 4,096 ÊÊ4,098 3,913 Ê3,913
15,389 15,208 12,774 12,930
Unamortised discounts/(premiums) on investment securities .................... 29 (3)Subordinated debt securities............................................................... 108 55Debt securities subject to sale and repurchase agreements........................ 1,136 399
(1) Fair value is based on quoted market prices, where available. If a quoted market price is not available, fair value is atdirectorsÕ appraised value or at an estimated value using quoted market prices for similar securities adjusted for differencesbetween the quoted instrument and the investment being valued.
The cost of securities carried at market value is not disclosed as it cannot be determined without unreasonable expense. Other debtsecurities include securities held for the purpose of hedging borrowing liabilities.

92
THE ROYAL BANK OF SCOTLAND GROUP plc
NOTES TO CONSOLIDATED FINANCIAL STATEMENTS - Continued
18. Debt securities (continued)
Movements in debt securities which are held as investment securities were as follows:
Year ended September 30, 1999Discounts and Book
Cost premiums Provisions value£m £m £m £m
At October 1, 1998........................................................................... 7,479 (7) (12) 7,460Currency translation adjustments ........................................................ 106 - - 106Additions ....................................................................................... 11,931 (15) - 11,916Disposals ....................................................................................... (9,240) 5 - (9,235)Transfers........................................................................................ 5 - - 5Provisions made .............................................................................. - - (3) (3)Provisions written off ....................................................................... - - 2 2Amortisation of discounts and premiums.............................................. - (1 ) - (1 )
At September 30, 1999 ..................................................................... 10,281 (18 ) (13 ) 10,250
Securitised asset-backed portfolio and related assets
In April 1998, the Bank sold a portfolio of asset-backed bonds amounting to £306 million to Ben Nevis One (Asset BackedSecurities) Limited (ÒBen NevisÓ). The share capital of Ben Nevis has been issued to Mourant & Co. Trustees Limited as sharetrustee. The Company does not own, directly or indirectly, any of the share capital of Ben Nevis. Ben Nevis issued floating rate notessecured on the asset-backed bonds to refinance its purchase. The issue terms of the notes include provisions that their holders haveno recourse to the Bank or any other member of the Group. Neither the Bank nor any other member of the Group are obliged, o rintend, to support any losses, should they occur, of Ben Nevis. The proceeds of the asset-backed portfolio are used to pay the capitaland interest due on borrowings and other administration expenses in order of priority to holders of Class A, Class B and Class Cnotes, respectively. Any residue is payable to the share trustee.
The balance sheet of Ben Nevis comprised principally of debt securities of £250 million, deposits with the Bank of £14million and floating rate note borrowings of £263 million, of which £20 million is held by the Group. The profit and loss account,other recognised gains and losses and cashflows of Ben Nevis are not material to the Group. Ben Nevis has also entered into certaininterest rate, basis rate and currency swaps with the Bank as follows:
In respect of each of the securities held by Ben Nevis which pay a fixed rate of interest, Ben Nevis has entered into aninterest rate swap under which it pays an amount equal to the interest receivable on those securities and receives interest at a ratelinked to LIBOR.
In respect of each of the securities held by Ben Nevis which is denominated in a currency other than US dollars, Ben Nevishas entered into a currency swap transaction under which it will pay on the interest payable date of the relevant securities, an amountequal to the interest payable and principal outstanding on those securities and will receive an amount equal to the US dollarequivalent of that amount.
In respect of each of the securities held by Ben Nevis, it has entered into a basis rate swap under which it pays an amountequal to interest calculated at the rate payable in respect of the relevant securities and will receive an amount of interest based onLIBOR.

93
THE ROYAL BANK OF SCOTLAND GROUP plc
NOTES TO CONSOLIDATED FINANCIAL STATEMENTS - Continued
19. Equity shares
SeptemberÊ30,Ê1999 SeptemberÊ30,Ê1998 BookÊvalue Fair value (1) BookÊvalue Fair value (1)
£m £m £m £mInvestment securities:
- Listed on a recognised UK exchange .............................................. 292 317 289 266- Listed elsewhere......................................................................... 307 742 231 451- Unlisted .................................................................................... 205 205 246 239
804 1,264 766 956Other securities:
- Listed on a recognised UK exchange .............................................. 9 9 7 7- Listed elsewhere......................................................................... 100 100 84 84
913 1,373 857 1,047
(1) Fair value is based on quoted market prices, where available. If a quoted market price is not available, fair value is atdirectorsÕ appraised value or at an estimated value using quoted market prices for similar securities adjusted for differencesbetween the quoted instrument and the investment being valued.
The cost of securities carried at market value is not disclosed as it cannot be determined without unreasonable expense.
Movements in equity shares which are held as investment securities were as follows:
Year ended September 30, 1999Cost Provisions BookÊvalueÊ £m £m £m
At October 1, 1998..................................................................................... 782 (16) 766Currency translation adjustments .................................................................. (1) - (1)Additions ................................................................................................. 294 - 294Disposals ................................................................................................. (261) - (261)Provisions made net of write-backs ............................................................... (2) (8) (10)Transfers.................................................................................................. 19 (3 ) 16At September 30, 1999 ............................................................................... 831 (27 ) 804
20. Interests in associated undertakings
Movements in interests in associated undertakings were as follows:Year ended
September 30, 1999Share of net assets £m
At October 1, 1998..................................................................................................................... 43Disposals ................................................................................................................................. (1)Transfers.................................................................................................................................. (4)Share of profits.......................................................................................................................... 3Other movements....................................................................................................................... 2At September 30, 1999 ............................................................................................................... 43
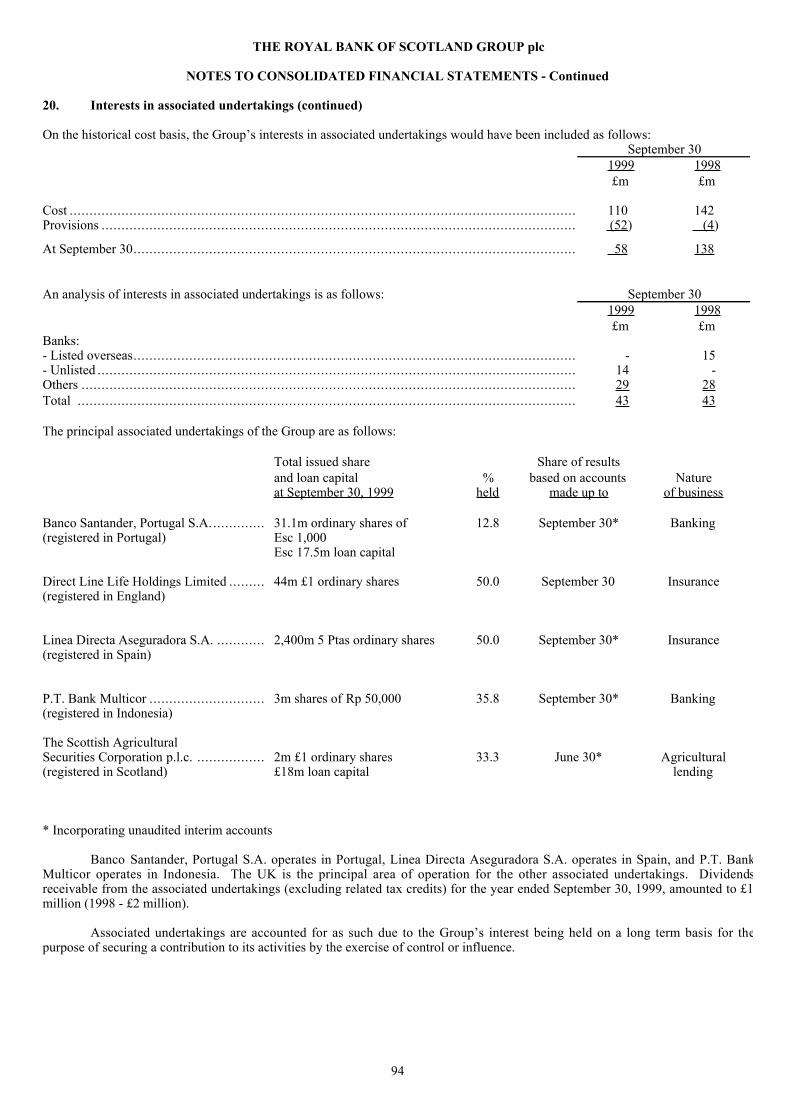
94
THE ROYAL BANK OF SCOTLAND GROUP plc
NOTES TO CONSOLIDATED FINANCIAL STATEMENTS - Continued
20. Interests in associated undertakings (continued)
On the historical cost basis, the GroupÕs interests in associated undertakings would have been included as follows:SeptemberÊ30
1999 1998£m £m
Cost ............................................................................................................................... 110 142Provisions ....................................................................................................................... (52 ) (4 )
At September 30............................................................................................................... 58 138
An analysis of interests in associated undertakings is as follows: SeptemberÊ301999 1998£m £m
Banks:- Listed overseas............................................................................................................... - 15- Unlisted ........................................................................................................................ 14 -Others ............................................................................................................................ 29 28Total ............................................................................................................................. 43 43
The principal associated undertakings of the Group are as follows:
Total issued share Share of resultsand loan capital % based on accounts Natureat September 30, 1999 held made up to of business
Banco Santander, Portugal S.A. .............(registered in Portugal)
31.1m ordinary shares ofEsc 1,000
12.8 September 30* Banking
Esc 17.5m loan capital
Direct Line Life Holdings Limited ......... 44m £1 ordinary shares 50.0 September 30 Insurance(registered in England)
Linea Directa Aseguradora S.A. ............ 2,400m 5 Ptas ordinary shares 50.0 September 30* Insurance(registered in Spain)
P.T. Bank Multicor ............................. 3m shares of Rp 50,000 35.8 September 30* Banking(registered in Indonesia)
The Scottish AgriculturalSecurities Corporation p.l.c. ................. 2m £1 ordinary shares 33.3 June 30* Agricultural(registered in Scotland) £18m loan capital lending
* Incorporating unaudited interim accounts
Banco Santander, Portugal S.A. operates in Portugal, Linea Directa Aseguradora S.A. operates in Spain, and P.T. BankMulticor operates in Indonesia. The UK is the principal area of operation for the other associated undertakings. Dividendsreceivable from the associated undertakings (excluding related tax credits) for the year ended September 30, 1999, amounted to £1million (1998 - £2 million).
Associated undertakings are accounted for as such due to the GroupÕs interest being held on a long term basis for thepurpose of securing a contribution to its activities by the exercise of control or influence.

95
THE ROYAL BANK OF SCOTLAND GROUP plc
NOTES TO CONSOLIDATED FINANCIAL STATEMENTS - Continued
21. Principal subsidiary undertakings
The principal subsidiary undertakings (all unlisted) at September 30, 1999, the capital of which consists of ordinary sharesand preference shares, are shown below. Except for Angel Train Contracts Limited and the Bank, which are owned by the company,all of the subsidiary undertakings are owned directly or indirectly through intermediate holding companies by the Bank and they areall wholly-owned except where otherwise indicated.
Country ofincorporation
Nature of business or registration Angel Train Contracts Limited Leasing EnglandThe Royal Bank of Scotland plc Banking ScotlandAdam & Company Group PLC Banking Scotland
*Citizens Bank of Rhode Island Banking USA*Citizens Bank of Connecticut Banking USA*Citizens Bank of Massachusetts Banking USA*Citizens Bank New Hampshire Banking USADirect Line Insurance plc Insurance EnglandDirect Line Financial Services Limited Banking EnglandPrivilege Insurance Company Limited Insurance EnglandRBS Advanta Credit card company ScotlandRBS Mezzanine Limited Provision of mezzanine finance ScotlandRBS Trade Services Limited Confirming house EnglandRBS Trust Bank Ltd. (sold October 1999) Custody EnglandRoyal Bank Development Capital Limited Provision of development capital ScotlandRoyal Bank Insurance Services Limited Insurance broking EnglandRoyal Bank Insurance Services (Independent Financial Insurance broking Scotland Advisers) LimitedRoyal Bank Invoice Finance Limited Factoring and invoice discounting EnglandRoyal Bank Leasing Limited Leasing and hire purchase ScotlandRoyal Scottish Assurance plc (70%) Life assurance Scotland
*ÊRoyscot International Finance B.V. Finance raising company The NetherlandsRoyScot Trust plc Instalment financing and leasing EnglandStyle Financial Services Limited Credit card company ScotlandTesco Personal Finance Limited (50%) Banking Scotland
*ÊThe Royal Bank of Scotland (Gibraltar) Limited (50%) Banking Gibraltar*ÊThe Royal Bank of Scotland International Limited Banking Jersey*ÊThe Royal Bank of Scotland Trust Company (Jersey) Limited Banking Jersey*ÊThe Royal Bank of Scotland Trust Company (Guernsey) Limited Banking Guernsey*ÊThe Royal Bank of Scotland Trust Company (I.O.M.) Limited Banking Isle of Man*ÊThe Royal Bank of Scotland (Nassau) Limited Banking Bahamas
Virgin Direct Personal Finance Limited (50%) Banking England
The undertakings marked with an asterisk operate in the country of incorporation or registration; the others operate mainlyin the UK.
22. Shares in subsidiary undertakings
The parent company balance sheet is included in Note 53 to the Consolidated Financial Statements.
Year endedSeptember 30, 1999
Movements during the year: £m
At October 1, 1998..................................................................................................................... 3,632Currency translation adjustments .................................................................................................. 23Additions: dollar preference shares issued by the Bank ..................................................................... 490 sterling preference shares issued by the Bank ................................................................... 50 ordinary shares issued by Angel..................................................................................... 13Disposals: transfer of Privilege Insurance to the Bank ....................................................................... 4Increase in net assets of subsidiary undertakings .............................................................................. 561At September 30, 1999 ............................................................................................................... 4,773
On the historical cost basis, shares in the subsidiary undertakings at September 30, 1999, would have been included at a costof £2,166 million (1998 - £1,586 million).
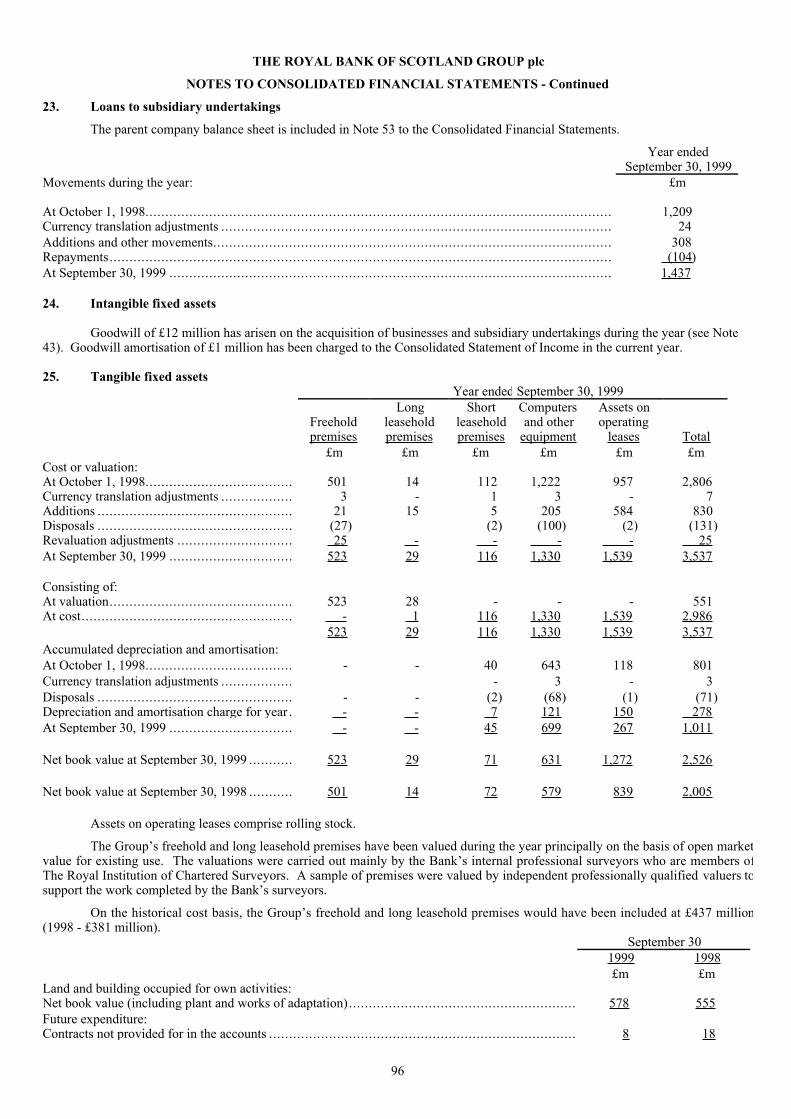
96
THE ROYAL BANK OF SCOTLAND GROUP plc
NOTES TO CONSOLIDATED FINANCIAL STATEMENTS - Continued
23. Loans to subsidiary undertakings
The parent company balance sheet is included in Note 53 to the Consolidated Financial Statements.
Year endedSeptember 30, 1999
Movements during the year: £m
At October 1, 1998..................................................................................................................... 1,209Currency translation adjustments .................................................................................................. 24Additions and other movements.................................................................................................... 308Repayments.............................................................................................................................. (104 )At September 30, 1999 ............................................................................................................... 1,437
24. Intangible fixed assets
Goodwill of £12 million has arisen on the acquisition of businesses and subsidiary undertakings during the year (see Note43). Goodwill amortisation of £1 million has been charged to the Consolidated Statement of Income in the current year.
25. Tangible fixed assets Year ended SeptemberÊ30,Ê1999
Freeholdpremises
Longleaseholdpremises
Shortleaseholdpremises
Computersand other
equipment
Assets onoperating
leases Total£m £m £m £m £m £m
Cost or valuation:At October 1, 1998..................................... 501 14 112 1,222 957 2,806Currency translation adjustments .................. 3 - 1 3 - 7Additions ................................................. 21 15 5 205 584 830Disposals ................................................. (27) (2) (100) (2) (131)Revaluation adjustments ............................. 25 - - - - 25At September 30, 1999 ............................... 523 29 116 1,330 1,539 3,537
Consisting of:At valuation.............................................. 523 28 - - - 551At cost..................................................... - 1 116 1,330 1,539 2,986
523 29 116 1,330 1,539 3,537Accumulated depreciation and amortisation:At October 1, 1998..................................... - - 40 643 118 801Currency translation adjustments .................. - 3 - 3Disposals ................................................. - - (2) (68) (1) (71)Depreciation and amortisation charge for year . - - 7 121 150 278At September 30, 1999 ............................... - - 45 699 267 1,011
Net book value at September 30, 1999 ........... 523 29 71 631 1,272 2,526
Net book value at September 30, 1998 ........... 501 14 72 579 839 2,005
Assets on operating leases comprise rolling stock.
The GroupÕs freehold and long leasehold premises have been valued during the year principally on the basis of open marketvalue for existing use. The valuations were carried out mainly by the BankÕs internal professional surveyors who are members ofThe Royal Institution of Chartered Surveyors. A sample of premises were valued by independent professionally qualified valuers tosupport the work completed by the BankÕs surveyors.
On the historical cost basis, the GroupÕs freehold and long leasehold premises would have been included at £437 million(1998 - £381 million).
SeptemberÊ301999 1998£m £m
Land and building occupied for own activities:Net book value (including plant and works of adaptation)......................................................... 578 555Future expenditure:Contracts not provided for in the accounts ............................................................................. 8 18

97
THE ROYAL BANK OF SCOTLAND GROUP plc
NOTES TO CONSOLIDATED FINANCIAL STATEMENTS - Continued
26 Other assetsSeptemberÊ30
1999 1998£m £m
Long-term assurance fund assets attributable to policyholders (see note below) ............................ 2,013 1,709Foreign exchange and interest rate contracts........................................................................... 1,150 2,603Other.............................................................................................................................. 2,176 2,489
5,339 6,801
Long-term assurance policies
The increase in the shareholdersÕ interest in the long-term assurance fund is calculated as follows:SeptemberÊ30
1999 1998£m £m
Value of shareholdersÕ interest at October 1 ........................................................................... 128 101Value of shareholdersÕ interest at September 30...................................................................... 176 128Increase for the year before tax............................................................................................ 55 39Increase for the year after tax .............................................................................................. 48 27
The value placed on long-term assurance business is calculated by discounting estimated future flows of statutory profitsfrom in-force policies at a discount rate that includes a risk margin. The future flows are based on prudent long-term economic andbusiness assumptions. The risk margin is designed to reflect uncertainties in expected future flows. The principal economicassumptions are as follows:
SeptemberÊ301999 1998
% %
Risk discount rate (net of tax).............................................................................................. 10.0 12.5Return on unit linked funds (gross of tax) .............................................................................. 7.5 10.0Return on non linked funds (gross of tax) ............................................................................. 5.0 7.0Expense inflation.............................................................................................................. 4.0 6.0
In the consolidated balance sheet the assets and liabilities of the long-term assurance funds are presented separately fromthose of other businesses in order to reflect the different nature of the shareholder interest in them. These assets and liabilities arestated at market value in the Consolidated Balance Sheet within Ôother assetsÕ and Ôother liabilitiesÕ respectively, and are as follows:
SeptemberÊ301999 1998£m £m
Investments ..................................................................................................................... 145 163Assets held to cover linked liabilities .................................................................................... 1,711 1,371Debtors and prepayments ................................................................................................... 9 20Other assets ..................................................................................................................... 148 155Assets of the long-term assurance funds ................................................................................ 2,013 1,709
Technical provisions ......................................................................................................... 114 93Technical provisions for linked liabilities .............................................................................. 1,781 1,469Other creditors ................................................................................................................. 118 147Liabilities of the long-term assurance funds ........................................................................... 2,013 1,709
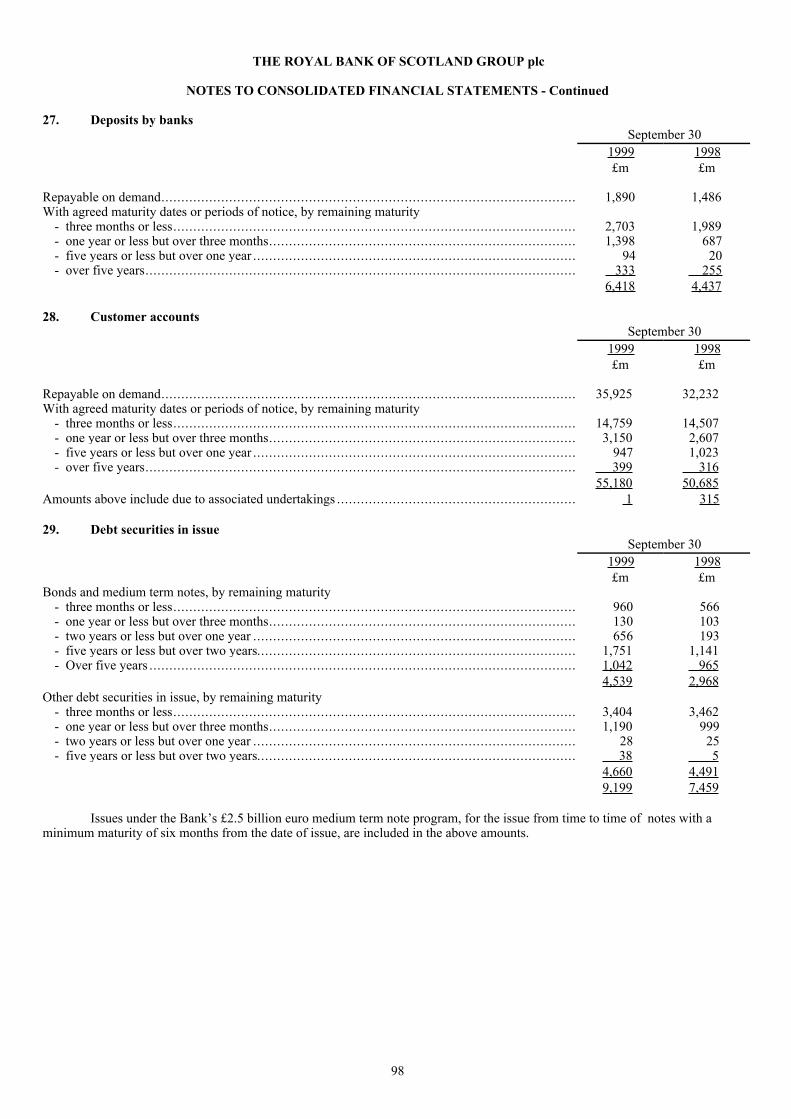
98
THE ROYAL BANK OF SCOTLAND GROUP plc
NOTES TO CONSOLIDATED FINANCIAL STATEMENTS - Continued
27. Deposits by banksSeptemberÊ30
1999 1998£m £m
Repayable on demand........................................................................................................ 1,890 1,486With agreed maturity dates or periods of notice, by remaining maturity
- three months or less..................................................................................................... 2,703 1,989 - one year or less but over three months............................................................................. 1,398 687 - five years or less but over one year ................................................................................. 94 20 - over five years............................................................................................................ 333 ÊÊÊÊ255
6,418 4,437
28. Customer accountsSeptemberÊ30
1999 1998£m £m
Repayable on demand........................................................................................................ 35,925 32,232With agreed maturity dates or periods of notice, by remaining maturity
- three months or less..................................................................................................... 14,759 14,507 - one year or less but over three months............................................................................. 3,150 2,607 - five years or less but over one year ................................................................................. 947 1,023 - over five years............................................................................................................ 399 ÊÊÊÊÊ316
55,180 50,685Amounts above include due to associated undertakings ............................................................ 1 315
29. Debt securities in issueSeptemberÊ30
1999 1998£m £m
Bonds and medium term notes, by remaining maturity- three months or less..................................................................................................... 960 566
- one year or less but over three months............................................................................. 130 103 - two years or less but over one year ................................................................................. 656 193
- five years or less but over two years................................................................................ 1,751 1,141 - Over five years ........................................................................................................... 1,042 965
4,539 2,968Other debt securities in issue, by remaining maturity
- three months or less..................................................................................................... 3,404 3,462 - one year or less but over three months............................................................................. 1,190 999 - two years or less but over one year ................................................................................. 28 25
- five years or less but over two years................................................................................ 38 54,660 4,4919,199 7,459
Issues under the BankÕs £2.5 billion euro medium term note program, for the issue from time to time of notes with aminimum maturity of six months from the date of issue, are included in the above amounts.

99
THE ROYAL BANK OF SCOTLAND GROUP plc
NOTES TO CONSOLIDATED FINANCIAL STATEMENTS - Continued
30. Other liabilitiesSeptemberÊ30
1999 1998£m £m
Notes in circulation ........................................................................................................... 873 930Long-term assurance fund liabilities to policyholders (see Note 26) ............................................ 2,013 1,709Foreign exchange and interest rate contracts........................................................................... 1,451 2,709Short positions (analysed below) ......................................................................................... 312 732Current taxation................................................................................................................ 185 229Proposed final dividend ..................................................................................................... 181 153Obligations under finance leases (analysed below) ................................................................. 190 210Other liabilities................................................................................................................. 1,442 1,404
6,647 8,076
SeptemberÊ30Short positions are analysed as follows: 1999 1998
£m £mDebt securities: British government.......................................................................................................... 249 657 Other government ........................................................................................................... 12 1 Other issuers .................................................................................................................. 51 74
312 732Debt securities: Listed on a recognised UK exchange.................................................................................. 275 688 Listed elsewhere ............................................................................................................ 37 32 Unlisted........................................................................................................................ - 12
312 732
SeptemberÊ301999 1998
Obligations under finance leases are analysed as follows: £m £m
Amounts falling due within one year .................................................................................... 20 20Amounts falling due between one and five years..................................................................... 47 59Amounts falling due after more than five years....................................................................... 123 131
190 210
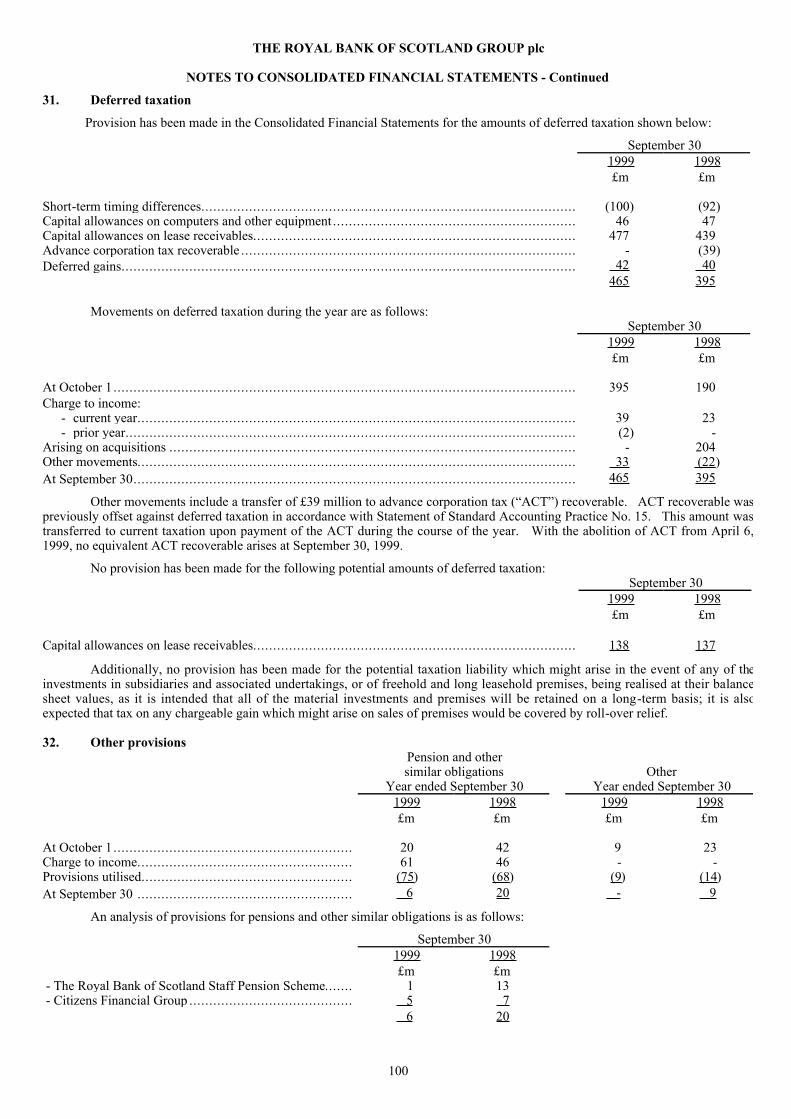
100
THE ROYAL BANK OF SCOTLAND GROUP plc
NOTES TO CONSOLIDATED FINANCIAL STATEMENTS - Continued
31. Deferred taxation
Provision has been made in the Consolidated Financial Statements for the amounts of deferred taxation shown below:
September 301999 1998£m £m
Short-term timing differences.............................................................................................. (100) (92)Capital allowances on computers and other equipment ............................................................. 46 47Capital allowances on lease receivables................................................................................. 477 439Advance corporation tax recoverable .................................................................................... - (39)Deferred gains.................................................................................................................. 42 40
465 395
Movements on deferred taxation during the year are as follows:SeptemberÊ30
1999 1998£m £m
At October 1 .................................................................................................................... 395 190Charge to income:
- current year.............................................................................................................. 39 23- prior year................................................................................................................. (2) -
Arising on acquisitions ...................................................................................................... - 204Other movements.............................................................................................................. 33 (22 )At September 30............................................................................................................... 465 395
Other movements include a transfer of £39 million to advance corporation tax (ÒACTÓ) recoverable. ACT recoverable waspreviously offset against deferred taxation in accordance with Statement of Standard Accounting Practice No. 15. This amount wastransferred to current taxation upon payment of the ACT during the course of the year. With the abolition of ACT from April 6,1999, no equivalent ACT recoverable arises at September 30, 1999.
No provision has been made for the following potential amounts of deferred taxation:SeptemberÊ30
1999 1998£m £m
Capital allowances on lease receivables................................................................................. 138 137
Additionally, no provision has been made for the potential taxation liability which might arise in the event of any of theinvestments in subsidiaries and associated undertakings, or of freehold and long leasehold premises, being realised at their balancesheet values, as it is intended that all of the material investments and premises will be retained on a long-term basis; it is alsoexpected that tax on any chargeable gain which might arise on sales of premises would be covered by roll-over relief.
32. Other provisionsPension and othersimilar obligations Other
Year ended September 30 Year ended September 301999 1998 1999 1998£m £m £m £m
At October 1 ............................................................ 20 42 9 23Charge to income...................................................... 61 46 - -Provisions utilised..................................................... (75 ) (68 ) (9 ) (14 )At September 30 ...................................................... 6 20 - 9
An analysis of provisions for pensions and other similar obligations is as follows:
September 301999 1998£m £m
- The Royal Bank of Scotland Staff Pension Scheme....... 1 13 - Citizens Financial Group ......................................... ÊÊÊ5 7
6 20
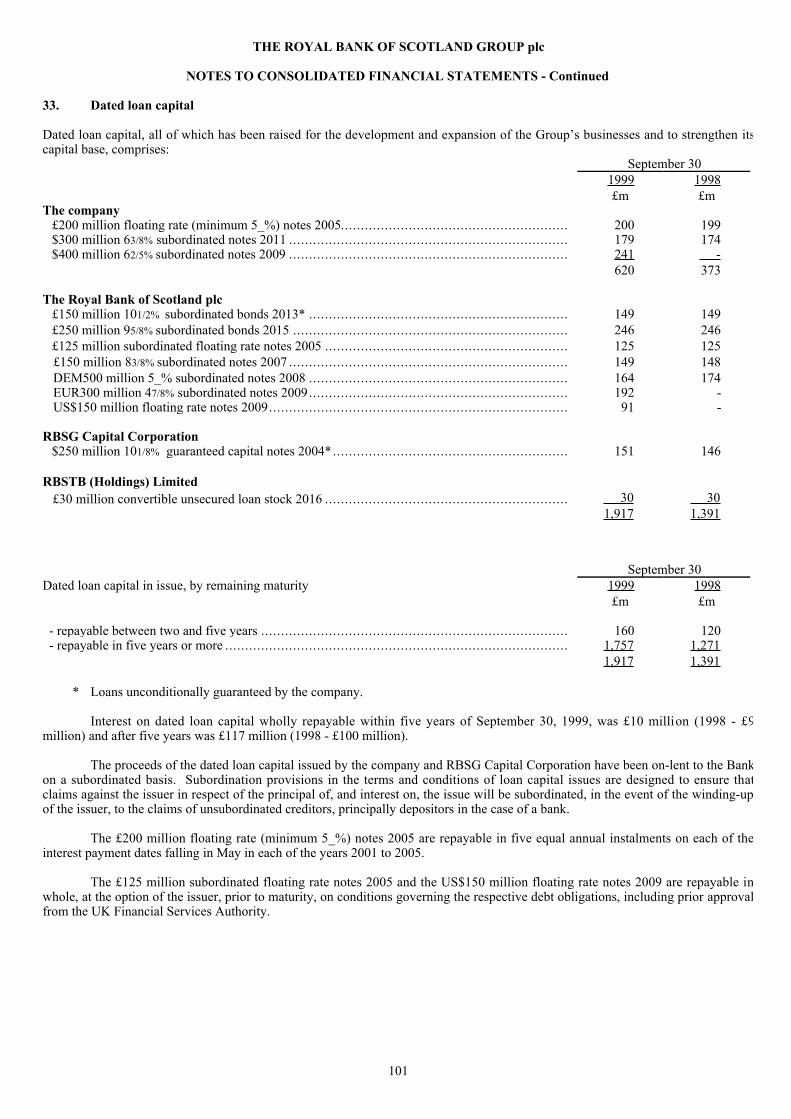
101
THE ROYAL BANK OF SCOTLAND GROUP plc
NOTES TO CONSOLIDATED FINANCIAL STATEMENTS - Continued
33. Dated loan capital
Dated loan capital, all of which has been raised for the development and expansion of the GroupÕs businesses and to strengthen itscapital base, comprises:
SeptemberÊ301999 1998£m £m
The company£200 million floating rate (minimum 5_%) notes 2005......................................................... 200 199$300 million 63/8% subordinated notes 2011 ...................................................................... 179 174$400 million 62/5% subordinated notes 2009 ...................................................................... 241 -
620 373
The Royal Bank of Scotland plc£150 million 101/2% subordinated bonds 2013* ................................................................. 149 149£250 million 95/8% subordinated bonds 2015 ..................................................................... 246 246£125 million subordinated floating rate notes 2005 ............................................................. 125 125
£150 million 83/8% subordinated notes 2007 ...................................................................... 149 148 DEM500 million 5_% subordinated notes 2008 ................................................................. 164 174 EUR300 million 47/8% subordinated notes 2009................................................................. 192 - US$150 million floating rate notes 2009........................................................................... 91 -
RBSG Capital Corporation$250 million 101/8% guaranteed capital notes 2004* ........................................................... 151 146
RBSTB (Holdings) Limited £30 million convertible unsecured loan stock 2016 ............................................................. 30 30
1,917 1,391
SeptemberÊ30Dated loan capital in issue, by remaining maturity 1999 1998
£m £m
- repayable between two and five years ............................................................................. 160 120 - repayable in five years or more ...................................................................................... 1,757 1,271
1,917 1,391
* Loans unconditionally guaranteed by the company.
Interest on dated loan capital wholly repayable within five years of September 30, 1999, was £10 million (1998 - £9million) and after five years was £117 million (1998 - £100 million).
The proceeds of the dated loan capital issued by the company and RBSG Capital Corporation have been on-lent to the Bankon a subordinated basis. Subordination provisions in the terms and conditions of loan capital issues are designed to ensure thatclaims against the issuer in respect of the principal of, and interest on, the issue will be subordinated, in the event of the winding-upof the issuer, to the claims of unsubordinated creditors, principally depositors in the case of a bank.
The £200 million floating rate (minimum 5_%) notes 2005 are repayable in five equal annual instalments on each of theinterest payment dates falling in May in each of the years 2001 to 2005.
The £125 million subordinated floating rate notes 2005 and the US$150 million floating rate notes 2009 are repayable inwhole, at the option of the issuer, prior to maturity, on conditions governing the respective debt obligations, including prior approvalfrom the UK Financial Services Authority.

102
THE ROYAL BANK OF SCOTLAND GROUP plc
NOTES TO CONSOLIDATED FINANCIAL STATEMENTS - Continued
33. Dated loan capital (continued)
On March 22, 1997, RBSTB (Holdings) Limited, a wholly owned subsidiary undertaking of the Bank and the parent of RBSTrust Bank Ltd., issued £30 million of convertible unsecured loan stock (the Òloan stockÓ) maturing in 2016 to Mercury AssetManagement Group plc (ÒMAMÓ). On October 31, 1999, in anticipation of the proposed disposal of RBSTB (Holdings) Limited,the stock was converted by MAM into fully paid ordinary shares of RBSTB (Holdings) Limited and shares equal to 30% of the totalissued ordinary share capital of RBSTB (Holdings) Limited were allotted to MAM. By virtue of an agreement between the Bank,RBSTB (Holdings) Limited, RBSI Security Services (Holdings) Limited and MAM, on conversion of the loan stock, MAM was alsoentitled to one special non-voting share in the capital of RBSI Security Services (Holdings) Limited (ÒSecurity ServicesÓ), asubsidiary undertaking of The Royal Bank of Scotland International Limited, for each £1 million of loan stock converted. OnOctober 31, 1999, MAM waived all future rights under this agreement, including its entitlement to receive the special shares inSecurity Services on conversion of the loan stock, and agreed not to seek to enforce these rights after the completion of thetransaction with The Bank of New York.
In the event of certain changes in the tax laws of the UK, all of the dated loan capital issues are redeemable in whole, butnot in part, at the option of the issuer, at the principal amount thereof plus accrued interest, subject to prior approval from the UKFinancial Services Authority.
34. Undated loan capital
Undated loan capital, all of which has been raised for the development and expansion of the GroupÕs businesses and tostrengthen its capital base, comprises:
SeptemberÊ301999 1998£m £m
The company$350 million undated floating rate primary capital notes.................................... (a) 214 206$400 million undated floating rate primary capital notes.................................... (b) - 117$200 million exchangeable capital securities, Series A ...................................... (c) 119 116$50 million undated 7.993% capital securities ................................................. (d) 30 29$35 million undated 7.755% capital securities ................................................. (d) 21 20$75 million floating rate perpetual capital securities ......................................... (d) 45 44$200 million undated 7.375% reset capital securities ........................................ (e) 120 115
549 647The Royal Bank of Scotland plc£200 million 9_% undated subordinated bonds ................................................ (f) 196 196£125 million 9_% undated subordinated step-up notes.......................................................... (g) 124 124£150 million undated subordinated floating rate step-up notes ............................ (h) 149 149FRF1,000 million 57/8% undated subordinated notes ......................................... (i) 97 104
1,115 1,220
The proceeds of the undated loan capital issued by the company have been on-lent to the Bank on a subordinated basis.
Where the issuer has the ability to redeem the undated loan capital, this is subject to prior approval from the UK FinancialServices Authority.
Notes:
(a) The $350 million undated floating rate primary capital notes may be redeemed, in whole or in part, at the option of thecompany at par on any interest payment date. Interest is payable at a rate of _% per annum over an average calculated by referenceto six-month eurodollar deposits in London for each interest period. The payment of interest is dependent upon a dividend havingbeen declared or paid on the ordinary share capital of the company in the relevant interest period. Noteholders cannot demandrepayment of the notes except in the event of a winding-up of the company.
(b) The $400 million undated floating rate primary capital notes carried interest at a variable margin above a rate determined byreference to six-month eurodollar deposits in London. During the year the company was approached by noteholders requestingrepayment of the notes. Negotiations then took place with a repackaging vehicle (not owned or controlled by the Group) on whominvestors were entitled to exercise a warrant. The repackaging vehicle agreed to the purchase of the notes from the noteholders andwas lent funds by the company in order to enable it to do so. Subsequently the repackaging vehicle approached the company andoffered to sell the notes, in satisfaction of the debt owed to the company. As a result the notes were acquired and then cancelled bythe company on September 27, 1999.

103
THE ROYAL BANK OF SCOTLAND GROUP plc
NOTES TO CONSOLIDATED FINANCIAL STATEMENTS - Continued
(c) The $200 million exchangeable capital securities, Series A, are redeemable, at the option of the company, in whole or inpart, on any interest payment date on or after June 30, 2004 or, in certain circumstances related to changes in the tax laws of the UK,in whole or in part, at the option of the company on any interest payment date. They are exchangeable, in whole or in part, at theoption of the company on any interest payment date or, in certain circumstances related to changes in the tax laws of the UK, inwhole but not in part, at the option of the company on any interest payment date, into the companyÕs non-cumulative preferenceshares of $0.01 each. The exchangeable capital securities bear interest at a rate of 8_%.
(d) The $50 million undated 7.993%, the $35 million undated 7.755% and the $75 million floating rate perpetual capitalsecurities were issued by way of private placements and are callable on the first interest payment date following the tenthanniversary of issuance, at par.
(e) The $200 million undated 7.375% reset capital securities were issued at pricing resulting in an annual yield of 7.552% tonoteholders up to April 1, 2006. The rate of interest on the capital securities will be reset at that date and on every fifth anniversarythereafter unless they have been redeemed. The capital securities have no maturity date but the company may repay all of them atpar on April 1, 2006 or on each fifth anniversary thereafter.
(f) The £200 million 9_% undated subordinated bonds may be redeemed at the option of the Bank in whole but not in part, onAugust 12, 2018 or on any fifth anniversary thereafter. The bonds bear interest at 9_% until August 12, 2018 at which time, an d ateach fifth anniversary thereafter, the interest rate is reset for a further five years by reference to a defined then current rate of interestapplying on those dates. Bondholders cannot demand repayment of the bonds except in the event of a winding-up of the Bank. Thebonds are guaranteed by the company.
(g) The £125 million 9_% undated subordinated step-up notes were issued at pricing resulting in an annual yield of 9.368% tonoteholders up to April 3, 2006. As from that date, and on each fifth anniversary thereafter, unless the notes have been redeemed,the interest rate will be reset. The notes have no maturity date but the Bank may repay all of the notes at par on April 3, 2006 or onany fifth anniversary thereafter.
(h) The £150 million undated subordinated floating rate step-up notes are callable on March 26, 2007 at the option of the Bank.
(i) The FRF1,000 million 5_% undated subordinated notes are callable on October 25, 2008 at the option of the Bankand at 5-yearly intervals thereafter.

104
THE ROYAL BANK OF SCOTLAND GROUP plc
NOTES TO CONSOLIDATED FINANCIAL STATEMENTS - Continued
35. Share capital
At September 30, 1999, the number of outstanding shares of each of the companyÕs classes of capital were as follows:
September 30Number of shares: 1999 1998
Ordinary shares of 25p each ........................................................................ 891,833,818 875,533,89211% cumulative preference shares of £1 each.................................................. 500,000 500,0005_% cumulative preference shares of £1 each.................................................. 400,000 400,000Series B non-cumulative dollar preference shares of 1 cent each ......................... 8,000,000 8,000,000Series C non-cumulative dollar preference shares of 1 cent each ......................... 16,000,000 16,000,000Series D non-cumulative dollar preference shares of 1 cent each ......................... 7,000,000 7,000,000Series E non-cumulative dollar preference shares of 1 cent each ......................... 8,000,000 8,000,000Series F non-cumulative dollar preference shares of 1 cent each.......................... 8,000,000 8,000,000Series G non-cumulative dollar preference shares of 1 cent each ......................... 10,000,000 10,000,000Series H non-cumulative dollar preference shares of 1 cent each ......................... 12,000,000 -Series I non-cumulative dollar preference shares of 1 cent each .......................... 12,000,000 -Series J non-cumulative dollar preference shares of 1 cent each .......................... 9,000,000 -
Ordinary shares YearÊendedÊSeptemberÊ301999 1998 1997£m £m £m
Authorised at September 30 ......................................................................... 260 260 260
Allotted, called up and fully paid:At October 1 ............................................................................................. 218 214 203Issued under the staff profit sharing plan, savings plan and executive plan ............ 2 2 10Issued in lieu of cash dividends during the year ............................................... 2 ÊÊÊÊ2 1At September 30........................................................................................ 222 218 214
During the year ended September 30, 1999, the ordinary share capital of the company was increased as follows:
(a) 5,495,973 ordinary shares were allotted following the exercise of options under the companyÕs executive andsharesave schemes;
(b) 9,046,027 ordinary shares were allotted in lieu of cash in respect of the final dividend for the year ended September 30,1998 and the interim dividend for the year ended September 30, 1999; and
(c) 1,757,926 ordinary shares were allotted under the companyÕs profit sharing (share-ownership) scheme.
The total value of ordinary shares issued at the issue price amounted to £61 million.
Also, during the year ended September 30, 1999, 4,460,727 options were granted under the companyÕs executive andsharesave schemes. At September 30, 1999 options under the schemes exercisable between 1999 and 2009 at prices ranging from165p to 1291p per share were outstanding in respect of 26,325,653 ordinary shares (see Note 5).

105
THE ROYAL BANK OF SCOTLAND GROUP plc
NOTES TO CONSOLIDATED FINANCIAL STATEMENTS - Continued
Preference shares (Ònon-equityÓ) Non- Non-cumulative cumulative
Cumulative dollar sterlingpreference preference preferenceshares of shares of shares of£1Êeach 1ÊcentÊeach £1Êeach Total
£m £m £m £m
Authorised at September 30, 1999..................................... 1 1 300 302
Allotted, called up and fully paid:At September 30, 1997 ................................................... 1 1 - 2Issued during the year..................................................... - - - -
At September 30, 1998 ................................................... 1 1 - 2Issued during the year..................................................... - - - -At September 30, 1999 ................................................... 1 1 - 2
Non-equity shareholdersÕ funds are £1,350 million (1998 - £838 million) comprising £1 million (1998 - £1 million) ofnominal non-cumulative dollar preference shares of 1 cent each and cumulative preference shares of £1 each, and £1,349 million(1998 - £837 million) of share premium relating thereto.
Non-cumulative dollar preference shares
Non-cumulative dollar preference shares entitle the holders thereof to receive quarterly non-cumulative preferential cashdividends at specified fixed rates set for each Series payable out of distributable profits of the company. During the year toSeptember 30, 1999, 33 million non-cumulative dollar preference shares of $0.01 each with an aggregate nominal value of $0.3million were issued, the net proceeds being $800 million.
On or after August 23, 1996, the 8.0 million Series B non-cumulative dollar preference shares are redeemable, at the optionof the company, in whole or in part from time to time, at $25.56 per share on or after August 23, 1999, and prior to August 22, 2000,and at decreasing prices thereafter declining to $25.00 per share on August 23, 2001, and thereafter, plus an amount equal todividends otherwise payable for the then current quarterly dividend period accrued to the date fixed for redemption.
On or after August 27, 1997, the 16.0 million Series C non-cumulative dollar preference shares are redeemable, at theoption of the company, in whole or in part from time to time, at $25.71 per share on or after August 27, 1999, and prior to August26, 2000, and at decreasing prices thereafter, declining to $25.00 per share on August 27, 2002, and thereafter, plus an amount equalto dividends otherwise payable for the then current quarterly dividend period accrued to the date fixed for redemption.
On or after September 14, 2005, the 7.0 million Series D non-cumulative dollar preference shares are redeemable, at theoption of the company, in whole or in part from time to time on any date that falls on or after September 14, 2005 at $25.00 per shareplus an amount equal to dividends otherwise payable for the then current quarterly dividend period accrued to the date fixed forredemption.
The 8.0 million Series E non-cumulative dollar preference shares each are redeemable at the option of the company inwhole or in part from time to time, on any date that falls on or after October 17, 2006, at $25.00 per share plus the dividendsotherwise payable for the then current quarterly dividend period accrued to the date fixed for redemption.
The 8.0 million Series F non-cumulative dollar preference shares are redeemable at the option of the company, in whole orin part from time to time, on any date that falls on or after March 31, 2007 at $25.00 per share plus the dividends otherwise payablefor the then current quarterly dividend period accrued to the date fixed for redemption.
The 10.0 million Series G non-cumulative dollar preference shares are redeemable at the option of the company, in whole orin part from time to time, on any date that falls on or after March 31, 2003 at $25.00 per share plus the dividends otherwise payablefor the then current quarterly dividend period accrued to the date fixed for redemption.
The 12.0 million Series H non-cumulative dollar preference shares are redeemable at the option of the company, in whole orin part from time to time, on any date that falls on or after March 31, 2004 at $25.00 per share plus the dividends otherwise payablefor the then current quarterly dividend period accrued to the date fixed for redemption.
106
THE ROYAL BANK OF SCOTLAND GROUP plc
NOTES TO CONSOLIDATED FINANCIAL STATEMENTS Ð Continued
35. Share capital (continued)
Non-cumulative dollar preference shares (continued)
The 12.0 million Series I non-cumulative dollar preference shares are redeemable at the option of the company, in whole orin part from time to time, on any date that falls on or after September 30, 2004 at $25.00 per share plus the dividends otherwisepayable for the then current quarterly dividend period accrued to the date fixed for redemption.
The 9.0 million Series J non-cumulative dollar preference shares are redeemable at the option of the company, in whole orin part from time to time, on any date that falls on or after December 31, 2004 at $25.00 per share plus the dividends otherwisepayable for the then current quarterly dividend period accrued to the date fixed for redemption.
Under existing requirements, no redemption or purchase of any non-cumulative dollar preference shares may be made bythe company without the prior consent of the Financial Services Authority.
On a winding up or liquidation of the company, the holders of the non-cumulative dollar preference shares will be entitledto receive, out of the surplus assets available for distribution to the companyÕs shareholders (after payment of arrears of dividends onthe cumulative preference shares up to the date of repayment), pari passu with the cumulative preference shares, the non-cumulativesterling preference shares and all other shares of the company ranking pari passu with the non-cumulative dollar preference shares asregards participation in the surplus assets of the company, a liquidation distribution of $25.00 per share together with an amountequal to dividends for the then current quarterly dividend period accrued to the date of payment, before any distribution or paymentmay be made to holders of the ordinary shares as regards participation in the surplus assets of the company.
Except as described above, the holders of the non-cumulative dollar preference shares will have no right to participate in thesurplus assets of the company.
Holders of the non-cumulative dollar preference shares are not entitled to receive notice of or attend general meetings of thecompany except if any resolution is proposed for adoption by the shareholders of the company to vary or abrogate any of the rightsattaching to the non-cumulative dollar preference shares or proposing the winding up or liquidation of the company. In any suchcase, they are entitled to receive notice of and to attend the general meeting of shareholders at which such resolution is to beproposed and will be entitled to speak and vote on such resolution (but not on any other resolution). In addition, in the event that,prior to any general meeting of shareholders, the company has failed to pay in full the three most recent quarterly dividend paymentsdue on the non-cumulative dollar preference shares, the holders shall be entitled to receive notice of, attend, speak and vote at suchmeeting on all matters together with the holders of the ordinary shares, and in these circumstances only, the rights of the holders ofthe non-cumulative dollar preference shares so to vote shall continue until the company shall have resumed the payment in full ofdividends for three consecutive quarterly dividend periods.
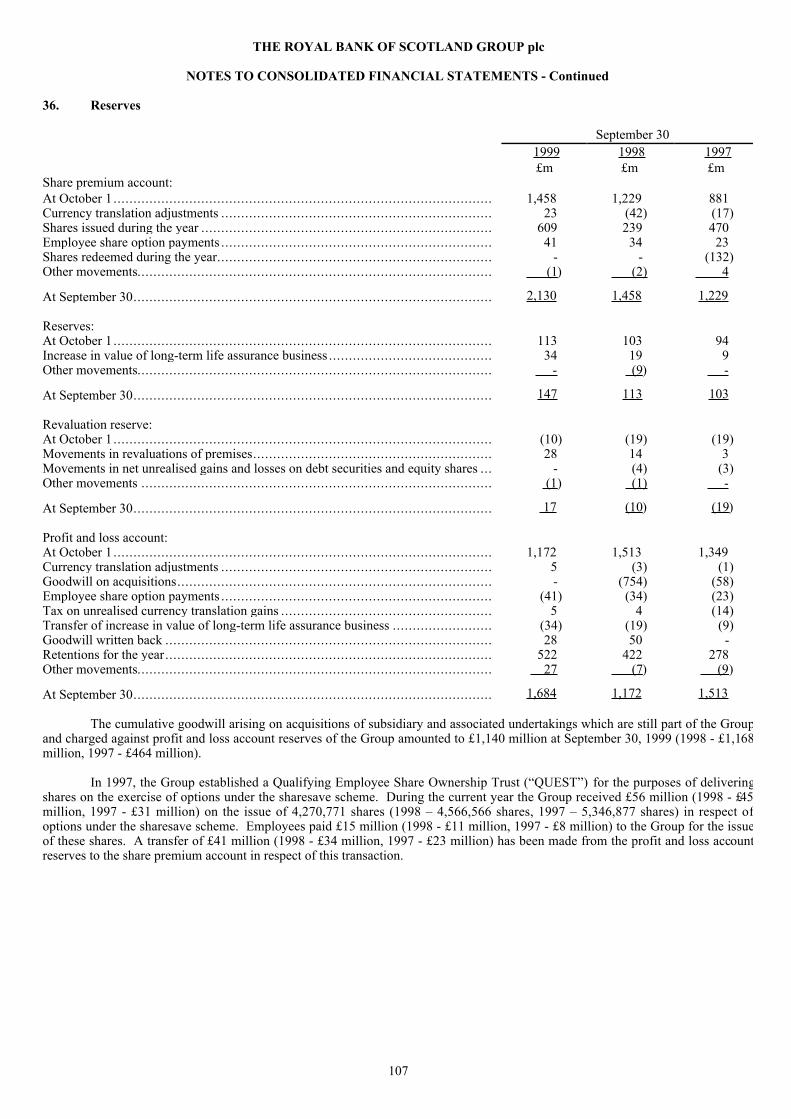
107
THE ROYAL BANK OF SCOTLAND GROUP plc
NOTES TO CONSOLIDATED FINANCIAL STATEMENTS - Continued
36. Reserves
September 301999 1998 1997£m £m £m
Share premium account:At October 1 ............................................................................................... 1,458 1,229 881Currency translation adjustments .................................................................... 23 (42) (17)Shares issued during the year ......................................................................... 609 239 470Employee share option payments .................................................................... 41 34 23Shares redeemed during the year..................................................................... - - (132)Other movements......................................................................................... (1 ) (2) 4
At September 30.......................................................................................... 2,130 1,458 1,229
Reserves:At October 1 ............................................................................................... 113 103 94Increase in value of long-term life assurance business ......................................... 34 19 9Other movements......................................................................................... - ÊÊ(9 ) -
At September 30.......................................................................................... 147 113 103
Revaluation reserve:At October 1 ............................................................................................... (10) (19) (19)Movements in revaluations of premises............................................................ 28 14 3Movements in net unrealised gains and losses on debt securities and equity shares ... - (4) (3)Other movements ........................................................................................ (1 ) (1) -
At September 30.......................................................................................... 17 (10 ) (19 )
Profit and loss account:At October 1 ............................................................................................... 1,172 1,513 1,349Currency translation adjustments .................................................................... 5 (3) (1)Goodwill on acquisitions............................................................................... - (754) (58)Employee share option payments .................................................................... (41) (34) (23)Tax on unrealised currency translation gains ..................................................... 5 4 (14)Transfer of increase in value of long-term life assurance business ......................... (34) (19) (9)Goodwill written back .................................................................................. 28 50 -Retentions for the year.................................................................................. 522 422 278Other movements......................................................................................... 27 (7 ) (9 )
At September 30.......................................................................................... 1,684 1,172 1,513
The cumulative goodwill arising on acquisitions of subsidiary and associated undertakings which are still part of the Groupand charged against profit and loss account reserves of the Group amounted to £1,140 million at September 30, 1999 (1998 - £1,168million, 1997 - £464 million).
In 1997, the Group established a Qualifying Employee Share Ownership Trust (ÒQUESTÓ) for the purposes of deliveringshares on the exercise of options under the sharesave scheme. During the current year the Group received £56 million (1998 - £45million, 1997 - £31 million) on the issue of 4,270,771 shares (1998 Ð 4,566,566 shares, 1997 Ð 5,346,877 shares) in respect ofoptions under the sharesave scheme. Employees paid £15 million (1998 - £11 million, 1997 - £8 million) to the Group for the issueof these shares. A transfer of £41 million (1998 - £34 million, 1997 - £23 million) has been made from the profit and loss accountreserves to the share premium account in respect of this transaction.

108
THE ROYAL BANK OF SCOTLAND GROUP plc
NOTES TO CONSOLIDATED FINANCIAL STATEMENTS - Continued
37. Lease commitments
At September 30, the annual rental commitments under non-cancellable operating leases were:
September 30, 1999 SeptemberÊ30,Ê1998 Premises Equipment Premises Equipment
£m £m £m £m
Years ending September 30,2000.............................................................................................. 52 9 56 92001.............................................................................................. 50 8 49 72002.............................................................................................. 48 5 47 62003.............................................................................................. 47 4 45 52004.............................................................................................. 45 1 43 4
242 27 240 31
Five year periods ending September 30,2009.............................................................................................. 191 - 193 12014.............................................................................................. 134 - 132 -Thereafter ...................................................................................... 164 - 215 -
731 27 780 32
Rentals for premises and equipment included in operating expenses for the year ended September 30, 1999, amounted to£60 million and £4 million respectively (1998 Ð premises £53 million, equipment £4 million, 1997 Ð premises £43 million,equipment £4 million).
38. Analysis of total assets and liabilities
SeptemberÊ301999 1998£m £m
Denominated in sterling ..................................................................................................... 59,329 54,854Denominated in currencies other than sterling ........................................................................ 29,523 24,822
Total assets...................................................................................................................... 88,852 79,676
Denominated in sterling ..................................................................................................... 59,181 54,526Denominated in currencies other than sterling ........................................................................ 29,671 25,150
Total liabilities ................................................................................................................. 88,852 79,676

109
THE ROYAL BANK OF SCOTLAND GROUP plc
NOTES TO CONSOLIDATED FINANCIAL STATEMENTS - Continued
39. Derivatives and other financial instruments
The GroupÕs objectives and policies in managing the risks that arise in connection with the use of financial instruments areset out under ÒRisk managementÓ on pages 60 to 62, ÒFinancial InstrumentsÓ on page 64 and ÒDerivativesÓ on page 65.
Interest rate sensitivity gap
The following table shows the contractual re-pricing for each category of non-trading asset and liability, together withmanagementÕs estimate of the interest rate sensitivity gap for the Group as at September 30, 1999. Loans to customers are shown ona gross basis before provisions for loan losses. Contractual re-pricing terms do not reflect the potential impact of early repayment orwithdrawal. Transactions without defined contractual re-pricing terms are shown according to managementÕs expectations.Positions may not be reflective of those in subsequent periods. Major changes in position can be made promptly as market outlookschange. In addition, significant variations in interest rate sensitivity may exist within the re-pricing periods presented and among thecurrencies in which the Group has interest rate positions.
The table shows an excess of non-trading liabilities over non-trading assets, due to the funding of trading assets by non-trading customer or wholesale deposits in certain business units of the Group (principally RBS Trust Bank Ltd.). In consequence,the interest rate sensitivity gap shown is in part offset by a corresponding but opposite gap in the GroupÕs trading portfolios.
After After After Non-3 months 6 months 1 year interest
Within but within but within but within After 5 bearing3 months 6 months 1 year 5 years years funds Total
£m £m £m £m £m £m £mASSETS Ð Non-tradingLoans to banks................................................................. 7,952 557 323 154 279 - 9,265Loans to customers......................................................... 32,140 3,369 2,386 8,019 3,449 - 49,363Treasury bills and other eligible bills ......................... 508 190 - - - - 698Investment securities...................................................... 3,721 882 332 2,470 2,845 ÊÊÊÊÊÊ 10,250
44,321 4,998 3,041 10,643 6,573 - 69,576Non-interest earning assets........................................... - - - - - 11,048 11,048
Total non-trading assets................................................. 44,321 4,998 3,041 10,643 6,573 11,048 80,624
LIABILITIES Ð Non-tradingDeposits by banks........................................................... 4,508 478 205 - 234 - 5,425Customer accounts ......................................................... 46,073 1,852 1,616 5,002 494 - 55,037Debt securities in issue.................................................. 5,113 848 442 1,390 1,406 - 9,199Loan capital ..................................................................... 807 45 - 270 1,910 - 3,032
56,501 3,223 2,263 6,662 4,044 - 72,693Interest free liabilities .................................................... - - - - - 9,370 9,370ShareholdersÕ equity ...................................................... - - - - - 4,202 4,202
Total non-trading liabilities .......................................... 56,501 3,223 2,263 6,662 4,044 13,572 86,265Off-balance sheet items affecting interest rate sensitivity............................................................. (2,069 ) (35 ) (95 ) (838 ) 3,037 - -
54,432 3,188 2,168 5,824 7,081 13,572 86,265
Interest rate sensitivity gap........................................... (10,111) 1,810 873 4,819 (508) (2,524)
Cumulative interest rate sensitivity gap ..................... (10,111) (8,301) (7,428) (2,609) (3,117) (5,641)
Cumulative interest rate sensitivity gap as a percentage of interest earning assets ...................... (14.6%) (11.9%) (10.7%) (3.7%) (4.5%) (8.1%)
All derivative instruments held by the Group whose effect is to alter the interest bases of the non-trading portfolio of assetsand liabilities are reflected in the above table. Short-term debtors and creditors are included in the above table and the followingtables on non-trading currency risk. All other disclosures in Note 39 exclude short-term debtors and creditors.
Non-trading assets and liabilities include interbank and other wholesale money market borrowings and placings, debtsecurities issued, and securities held for investment rather than trading purposes. Within these non-trading portfolios, interest rategap positions may be managed by central treasury units within sensitivity limits approved by the Group Executive ManagementCommittee.
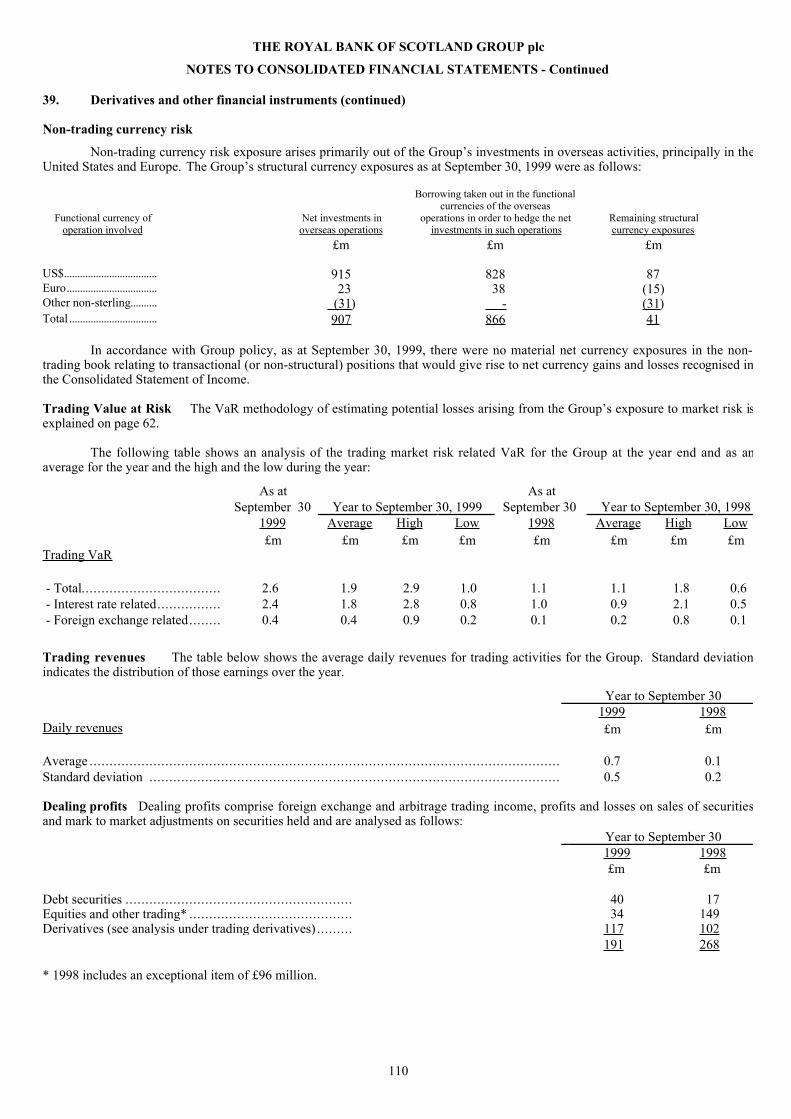
110
THE ROYAL BANK OF SCOTLAND GROUP plc
NOTES TO CONSOLIDATED FINANCIAL STATEMENTS - Continued
39. Derivatives and other financial instruments (continued)
Non-trading currency risk
Non-trading currency risk exposure arises primarily out of the GroupÕs investments in overseas activities, principally in theUnited States and Europe. The GroupÕs structural currency exposures as at September 30, 1999 were as follows:
Borrowing taken out in the functionalcurrencies of the overseas
Functional currency ofoperation involved
Net investments inoverseas operations
operations in order to hedge the netinvestments in such operations
Remaining structuralcurrency exposures
£m £m £m
US$................................... 915 828 87Euro.................................. 23 38 (15)Other non-sterling.......... (31 ) - (31 )Total ................................. 907 866 41
In accordance with Group policy, as at September 30, 1999, there were no material net currency exposures in the non-trading book relating to transactional (or non-structural) positions that would give rise to net currency gains and losses recognised inthe Consolidated Statement of Income.
Trading Value at Risk The VaR methodology of estimating potential losses arising from the GroupÕs exposure to market risk isexplained on page 62.
The following table shows an analysis of the trading market risk related VaR for the Group at the year end and as anaverage for the year and the high and the low during the year:
As at As atSeptember 30 Year to September 30, 1999 September 30 Year to September 30, 1998
1999 Average High Low 1998 Average High Low£m £m £m £m £m £m £m £m
Trading VaR
- Total................................... 2.6 1.9 2.9 1.0 1.1 1.1 1.8 0.6 - Interest rate related................ 2.4 1.8 2.8 0.8 1.0 0.9 2.1 0.5 - Foreign exchange related........ 0.4 0.4 0.9 0.2 0.1 0.2 0.8 0.1
Trading revenues The table below shows the average daily revenues for trading activities for the Group. Standard deviationindicates the distribution of those earnings over the year.
Year to September 301999 1998
Daily revenues £m £m
Average ...................................................................................................................... 0.7 0.1Standard deviation ....................................................................................................... 0.5 0.2
Dealing profits Dealing profits comprise foreign exchange and arbitrage trading income, profits and losses on sales of securitiesand mark to market adjustments on securities held and are analysed as follows:
Year to September 301999 1998£m £m
Debt securities ......................................................... 40 17Equities and other trading* ......................................... 34 149Derivatives (see analysis under trading derivatives) ......... 117 102
191 268
* 1998 includes an exceptional item of £96 million.

111
THE ROYAL BANK OF SCOTLAND GROUP plc
NOTES TO CONSOLIDATED FINANCIAL STATEMENTS - Continued
Derivatives
Net replacement cost is used to indicate the GroupÕs derivatives credit exposure. The figures in the following table representthe gross positive fair values, by maturity, less the overall effect of netting positions with the same counterparty. The netreplacement cost of internal trades is not included as there is no credit risk associated with them.
September 30, 1999 September 30, 1998Within One to Over Within One to Over
one year five years five years Total one year five years five years Total£m £m £m £m £m £m £m £m
Exchange rate contracts:Forward foreign exchange ........... 1,319 41 1 1,361 1,646 42 - 1,688Cross currency swaps ................. 22 14 16 52 15 15 7 37Currency options ...................... 19 1 - 20 51 1 - 52
1,360 56 17 1,433 1,712 58 7 1,777
Interest rate contracts:Forward rate agreements ............. 14 11 - 25 4 5 - 9Interest rate swaps...................... 98 418 454 970 77 317 412 806Interest rate options purchased...... 3 28 12 43 2 16 39 57
115 457 466 1,038 83 338 451 872
Credit derivatives....................... - 20 - 20 - - - -
Equity and commodity contracts:Swaps...................................... 1 5 - 6 23 10 - 33Options.................................... - - - - 1 - - 1
1 5 - 6 24 10 - 34
Effect of netting ........................ (1,398 ) (963 Total net replacement cost ........... 1,099 1,720
In addition to the amounts in the above table, the Group had entered into financial futures contracts with an outstandingaggregate notional principal amount of £31,726 million at September 30, 1999 (1998 - £30,144 million). Such contracts generallyinvolve lower credit risk than over-the-counter contracts because trades in such contracts are cleared through exchanges that subjecttheir participants to margining requirements and require daily settlement of gains and losses.
The Group may require collateral in respect of the credit risk in the derivatives transactions.
The following table analyses the gross replacement cost of the GroupÕs derivatives as at September 30, 1999 and September30, 1998, into financial and non-financial counterparty and also into OECD and non-OECD counterparty:
September 30, 1999 September 30, 1998
FinancialNon-
financial OECDNon-
OECD FinancialNon-
financial OECDNon-
OECD£m £m £m £m £m £m £m £m
Exchange rate contracts:Forward foreign exchange ....... 1,260 101 1,291 70 1,596 92 1,605 83Cross currency swaps ............. 30 22 51 1 27 10 37 -Currency options ................... 13 7 20 - 38 14 52 -
1,303 130 1,362 71 1,661 116 1,694 83
Interest rate contracts:Forward rate agreements ......... 18 7 25 - 7 2 9 -Interest rate swaps.................. 815 155 960 10 601 205 790 16Interest rate options................ 23 20 43 - 48 9 57 -
856 182 1,028 10 656 216 856 16
Credit derivatives................... 20 - 20 - - - - -
Equity and commodity contracts:Swaps.................................. 6 - 6 - 26 7 33 -Options................................ - - - - 1 - 1 -
6 - 6 - 27 7 34 -
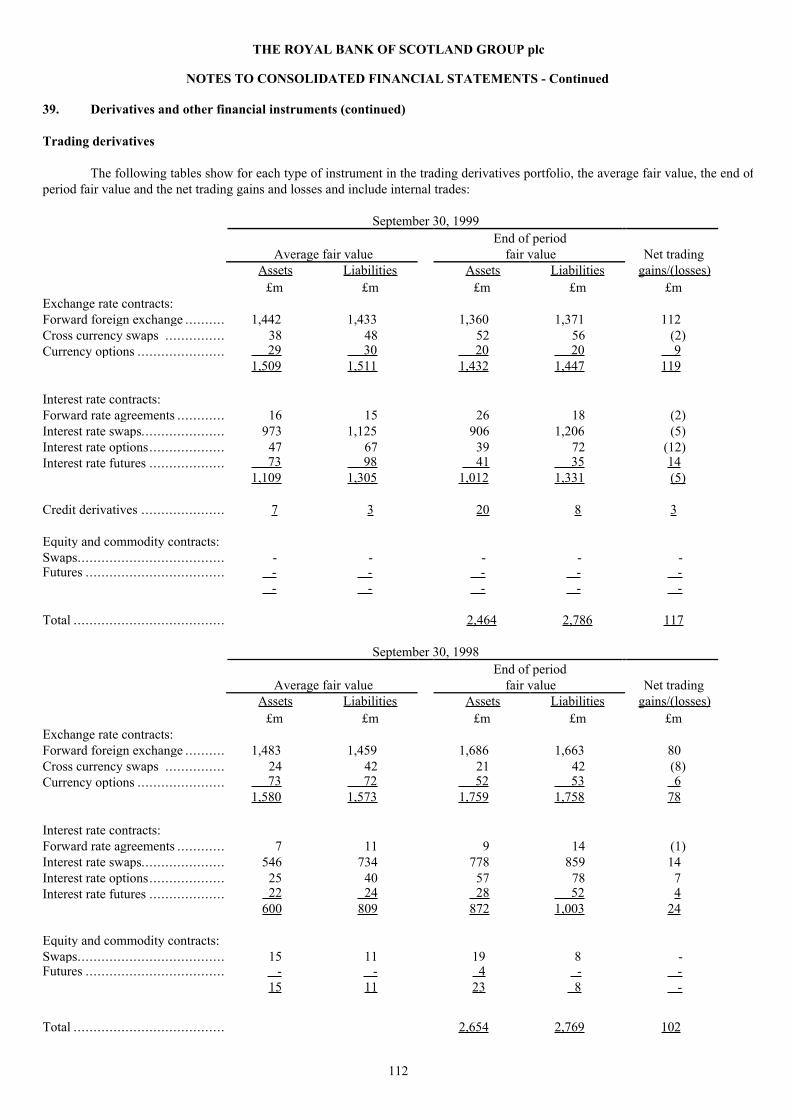
112
THE ROYAL BANK OF SCOTLAND GROUP plc
NOTES TO CONSOLIDATED FINANCIAL STATEMENTS - Continued
39. Derivatives and other financial instruments (continued)
Trading derivatives
The following tables show for each type of instrument in the trading derivatives portfolio, the average fair value, the end ofperiod fair value and the net trading gains and losses and include internal trades:
September 30, 1999
Average fair valueEnd of period
fair value Net tradingAssets Liabilities Assets Liabilities gains/(losses)
£m £m £m £m £mExchange rate contracts:Forward foreign exchange .......... 1,442 1,433 1,360 1,371 112Cross currency swaps ............... 38 48 52 56 (2)Currency options ...................... 29 30 20 20 9
1,509 1,511 1,432 1,447 119
Interest rate contracts:Forward rate agreements ............ 16 15 26 18 (2)Interest rate swaps..................... 973 1,125 906 1,206 (5)Interest rate options................... 47 67 39 72 (12)Interest rate futures ................... 73 98 41 35 14
1,109 1,305 1,012 1,331 (5)
Credit derivatives ..................... 7 3 20 8 3
Equity and commodity contracts:Swaps..................................... - - - - -Futures ................................... - - - - -
- - - - -
Total ...................................... 2,464 2,786 117
September 30, 1998
Average fair valueEnd of period
fair value Net tradingAssets Liabilities Assets Liabilities gains/(losses)
£m £m £m £m £mExchange rate contracts:Forward foreign exchange .......... 1,483 1,459 1,686 1,663 80Cross currency swaps ............... 24 42 21 42 (8)Currency options ...................... 73 72 52 53 6
1,580 1,573 1,759 1,758 78
Interest rate contracts:Forward rate agreements ............ 7 11 9 14 (1)Interest rate swaps..................... 546 734 778 859 14Interest rate options................... 25 40 57 78 7Interest rate futures ................... 22 24 28 52 4
600 809 872 1,003 24
Equity and commodity contracts:Swaps..................................... 15 11 19 8 -Futures ................................... - - 4 - -
15 11 23 8 -
Total ...................................... 2,654 2,769 102

113
THE ROYAL BANK OF SCOTLAND GROUP plc
NOTES TO CONSOLIDATED FINANCIAL STATEMENTS - Continued
The following table analyses, by maturity and contract type, the notional principal amount of the GroupÕs tradingderivatives at September 30, 1999 and September 30, 1998:
September 30, 1999 September 30, 1998Within One to Over Within One to Over
one year five years five years Total one year five years five years Total£m £m £m £m £m £m £m £m
Exchange rate contracts:Forward foreign exchange ........... 121,874 2,929 59 124,862 109,042 2,061 - 111,103Cross currency swaps ................. 573 1,252 1,214 3,039 117 269 363 749Currency options purchased......... 1,893 24 - 1,917 2,141 55 - 2,196Currency options written ............. 1,851 40 - 1,891 2,271 59 - 2,330
126,191 4,245 1,273 131,709 113,571 2,444 363 116,378
Interest rate contracts:Forward rate agreements ............. 25,523 3,575 - 29,098 10,087 2,252 - 12,339Interest rate swaps...................... 24,653 48,246 17,793 90,692 12,965 26,320 9,758 49,043Interest rate options purchased...... 235 3,278 390 3,903 1,036 2,551 740 4,327Interest rate options written.......... 1,252 3,394 330 4,976 741 3,221 841 4,803Interest rate futures .................... 15,507 12,643 3,315 31,465 11,278 18,549 33 29,860
67,170 71,136 21,828 160,134 36,107 52,893 11,372 100,372
Credit derivatives....................... 6 1,898 - 1,904 - - - -
Equity and commodity contracts:Swaps...................................... - - - - 156 10 - 166Futures .................................... 1 - - 1 1 - -
1 - - 1 157 10 - 167

114
THE ROYAL BANK OF SCOTLAND GROUP plc
NOTES TO CONSOLIDATED FINANCIAL STATEMENTS - Continued
39. Derivatives and other financial instruments (continued)
Non-trading derivative transactions
The Group establishes non-trading derivatives positions externally with third parties and also internally. It should be notedthat the following tables include the components of the internal hedging programme that transfers risks to the trading portfolios inthe Bank or to external third party participants in the derivative markets.
The following table summarises the fair values (value at reporting date) and book values (value at most recent rollover date)of derivatives held for non-trading activities, including internal trades, at September 30, 1999 and September 30, 1998:
September 30, 1999 September 30, 1998Fair value Book value Fair value Book value
Positive Negativ e
Positive Negativ e
Positive Negativ e
Positive Negativ e
£m £m £m £m £m £m £m £mExchange rate contracts:Forward foreign exchange ........ 8 9 5 4 24 32 11 11Currency swaps ...................... 3 19 2 13 20 25 3 4
11 28 7 17 44 57 14 15
Interest rate contracts:Interest rate swaps................... 374 459 325 245 341 300 296 222Interest rate options purchased... 4 - - - 9 - - -Interest rate options written....... - 4 - - - 9 - -Interest rate futures ................. - - - - 7 - - -
378 463 325 245 357 309 296 222
Credit derivatives.................... - - - - - - - -
Equity and commodity contracts:Swaps................................... 6 18 5 18 14 22 14 22Options................................. - 3 - 3 1 12 1 12Futures ................................. 2 - 2 - - - - -
8 21 7 21 15 34 15 34
Total .................................... 397 512 339 283 416 400 325 271
The following table analyses the notional principal amounts, by maturity, of the GroupÕs non-trading derivatives (third partyand internal) by contract type:
September 30, 1999 September 30, 1998Within One to Over Within One to Over
one year five years five years Total one year five years five years Total£m £m £m £m £m £m £m £m
Forward foreign exchange ......... 1,252 - - 1,252 1,812 - - 1,812Currency swaps ....................... 333 34 357 724 240 140 84 464
1,585 34 357 1,976 2,052 140 84 2,276Interest rate contracts:Forward rate agreements ........... 61 - - 61 126 - - 126Interest rate swaps.................... 17,086 8,505 5,416 31,007 5,185 6,499 4,065 15,749Interest rate options purchased.... - 50 6 56 20 30 31 81Interest rate options written........ - 50 6 56 10 30 31 71Interest rate futures .................. 156 - - 156 282 2 - 284
17,303 8,605 5,428 31,336 5,623 6,561 4,127 16,311
Credit derivatives..................... - 358 - 358 - - - -
Equity and commodity contracts:Swaps.................................... 158 1,289 42 1,489 26 674 - 700Options.................................. 23 15 - 38 - 23 - 23Futures .................................. 104 - - 104 - - - -

115
THE ROYAL BANK OF SCOTLAND GROUP plc
NOTES TO CONSOLIDATED FINANCIAL STATEMENTS - Continued
Hedges
As stated in the accounting policies note 1(n) on page 82, hedge transactions are accounted for in accordance with theaccounting treatment of the underlying transaction. As a result, any hedge gains or losses recognised during the year offset gains orlosses on the item being hedged. Hedge gains or losses are not recognised or are deferred in the Consolidated Balance Sheet to theextent necessary to achieve a common timing or recognition with the transaction being hedged.
The following table shows the unrecognised and deferred gains and losses on hedges at September 30, 1999, and themovements therein during the year:
Unrecognised DeferredTotal net Total net
Gains Losses gains/(losses ) Gains Losses gains/(losses )£m £m £m £m £m £m
At October 1, 1998.................................................. 101 124 (23) 18 5 13Gains and losses arising in previous years that wererecognised in the year ended September 30, 1999.......... 23 20 3 4 1 3
Gains and losses arising before October 1, 1998 that werenot recognised in the year ended September 30, 1999..... 78 104 (26) 14 4 10
Gains and losses arising in the year ended September 30,1999 that were not recognised in that year ................... (21 ) 134 (155 ) (13 ) 12 (25 )
At September 30, 1999 ............................................ 57 238 (181 ) 1 16 (15 )
Of which:Gains and losses expected to be recognised in the yearended September 30, 2000........................................ 11 49 (38) 1 1 -
As at September 30, 1999, there were no hedges of anticipated transactions in place.
Where a non-trading derivative no longer represents a hedge because either the underlying non-trading asset, liability orposition has been derecognised or transferred into a trading portfolio, or the hedge is no longer effective, it is restated at fair valueand any resultant gains or losses taken directly to the Consolidated Statement of Income. In this regard, losses amounting to £38million were recognised in the year to September 30, 1999.
The effect of non-trading derivatives on the Consolidated Statement of Income for the year ended September 30, 1999 wasto decrease net interest income by £32 million (1998 Ð decrease of £3 million, 1997 Ð decrease of £11 million).

116
THE ROYAL BANK OF SCOTLAND GROUP plc
NOTES TO CONSOLIDATED FINANCIAL STATEMENTS - Continued
40. Fair values of financial instruments
The term financial instruments includes both financial assets and financial liabilities and also derivatives. The fair value ofa financial instrument is the amount at which the instrument could be exchanged in a current transaction between willing parties,other than in a forced or liquidation sale. Quoted market prices are used where available; otherwise, management estimates fairvalue based on quoted market prices of financial instruments with similar characteristics or using valuation techniques such asdiscounted cash flow models. Valuation techniques involve uncertainties and require assumptions and judgments regardingprepayments, credit risk and discount rates. Changes in these assumptions will result in different valuation estimates. The fairvalues presented would not necessarily be realised in an immediate sale; nor are there plans to settle liabilities prior to contractualmaturity. As there are a wide range of valuation techniques, it may be inappropriate to compare the GroupÕs fair value informationto independent markets or to other financial institutionsÕ fair value information.
Fair value information is not provided for items that do not meet the definition of a financial instrument or for certain otherfinancial instruments. These items include short term debtors and creditors, intangible assets such as the value of the branchnetwork, the long-term relationships with depositors, premises and equipment and shareholdersÕ equity. These items are materialand accordingly the fair value information presented does not purport to represent, not should it be construed to represent, theunderlying value of the Group as a going concern at September 30, 1999.
The following table shows the carrying amount and the fair value of the GroupÕs financial instruments analysed betweentrading and non-trading assets and liabilities:
September 30, 1999 September 30, 1998Carrying Carrying
Note amount Fair value amount Fair value£m £m £m £m
AssetsTradingTreasury bills and other eligible bills ........................... (a) 3 3 - -Reverse repurchase agreements .................................. (a) 1,824 1,824 938 938Debt securities ......................................................... (a) 5,139 5,141 5,314 5,339Equity shares .......................................................... (a) 109 109 91 91Derivatives (see analysis in Note 39) ............................ (b) 2,464 2,464 2,654 2,654
Non-tradingCash and balances at central banks .............................. (a) 1,394 1,394 1,295 1,295Treasury bills and other eligible bills ........................... (a) 698 698 639 639Items in the course of collection due from other banks .... (a) 1,655 1,655 1,652 1,652Loans to banks and customers .................................... (c) 57,891 58,699 51,593 52,149Debt securities ......................................................... (d) 10,250 10,067 7,460 7,591Equity shares .......................................................... (d) 804 1,264 766 956Derivatives (see analysis in Note 39) ........................... (b) 339 397 325 416
LiabilitiesTradingRepurchase agreements ............................................. (a) 1,136 1,136 399 399Short positions in debt securities ................................. (a) 312 312 732 732Derivatives (see analysis in Note 39) ........................... (b) 2,786 2,786 2,769 2,769
Non-tradingItems in course of collection due to other banks ............. (a) 975 975 520 520Deposits by banks and customer accounts ..................... (e) 60,462 60,301 54,723 54,802Debt securities in issue .............................................. (f) 9,199 9,021 7,459 7,484Dated loan capital .................................................... (g) 1,917 1,989 1,391 1,559Undated loan capital ................................................. (g) 1,115 1,113 1,220 1,257Non-equity shareholdersÕ funds ................................. (h) 1,350 1,313 838 858Derivatives (see analysis in Note 39) ........................... (b) 283 512 271 400

117
THE ROYAL BANK OF SCOTLAND GROUP plc
NOTES TO CONSOLIDATED FINANCIAL STATEMENTS - Continued
Notes:
(a) Financial assets and financial liabilities where fair value approximates carrying value because they are carried in theConsolidated Balance Sheet at market value or they are short-term in nature or re-price frequently.
(b) Derivatives held for trading purposes are, as indicated on page 82, carried at fair values. Derivatives held for non-tradingpurposes are accounted for in accordance with the accounting treatment of the underlying transaction or transactions being hedged.Fair values are determined by market prices or, where market prices are not available, by applying current market information topricing or valuation models.
(c) For variable rate loans that reprice frequently, or are linked to the BankÕs base rate, and with no significant change in creditrisk since the commencement of the loan, carrying amounts represent a reasonable estimate of fair value. The fair values of otherloans, with no significant change in credit risk since the commencement of the loan, are estimated by discounting anticipated futurecash flows, using the current interest rates at which similar loans are being made to borrowers with similar credit ratings andremaining maturities. Generally, overdrafts are contractually repayable on demand and have no defined maturities, accordingly theirfair values are assumed to equal the net carrying amount. The carrying amount of instalment credit and finance lease receivables isconsidered a reasonable approximation of fair value.
(d) Fair values of short-term debt securities are approximately equal to their carrying amount. Fair values of other debtsecurities and equity shares are based on quoted prices where available, or where these are unavailable, are estimated using othervaluation techniques.
(e) Fair values of deposits repayable on demand are equal to their carrying value. The fair values of term deposits andnegotiable time certificates of deposit are estimated by discounting the expected future cash flows using the rates currently offeredfor deposits of similar remaining maturities.
(f) Fair values of short-term debt securities in issue are approximately equal to their carrying amount. Fair values of other debtsecurities in issue are based on quoted prices where available, or where these are unavailable, are estimated using other valuationtechniques.
(g) Fair values of dated and undated loan capital are based on quoted market prices where available. For unquoted loan capital,fair values have been estimated using other valuation techniques.
(h) Fair values of non-equity shareholdersÕ funds are based on quoted market prices.

118
THE ROYAL BANK OF SCOTLAND GROUP plc
NOTES TO CONSOLIDATED FINANCIAL STATEMENTS - Continued
41. Memorandum items - contingent liabilities and commitments
The amounts shown in the table below are intended only to provide an indication of the volume of contingent liabilities andcommitments outstanding at September 30. Although the Group is exposed to credit risk in the event of non-performance of theobligations undertaken by customers, the amounts shown do not, and are not intended to, provide any indication of the GroupÕsexpectations of future losses.
September 30, 1999 September 30, 1998Credit Risk Credit Risk
Contract equivalent weighted Contract equivalent weighted amount (1) amount (3) a mount (3) amount (1) amount (3) amount
(3)
£m £m £m £m £m £m
Contingent liabilities:Acceptances and endorsements..................... 894 894 864 1,024 1,024 816Guarantees and irrevocable letters of credit..... 956 956 769 917 917 610Assets pledged as collateral security .............. 2 - - 4 - -Other contingent liabilities........................... 876 438 425 869 434 426
2,728 2,288 2,058 2,814 2,375 1,852
Commitments:Documentary credits and trade related transactions................................... 1,709 342 201 1,207 241 142Forward asset purchases and forward deposits placed ........................................ - - - 9 9 9Undrawn note issuance and revolving underwriting facilities ............................... 29 15 10 12 6 1Undrawn formal standby facilities, credit lines and other commitments to lend - less than one year (2)............................. 15,145 - - 11,114 - - - one year and over ................................. 4,039 2,017 1,854 3,239 1,618 1,489
20,922 2,374 2,065 15,581 1,874 1,641
NOTES:
(1) Contract amount refers to the principal amount of the liability or commitment.
(2) Included in this category are facilities of £5.0 billion at September 30, 1999 (1998 - £6.9 billion) which are cancellableunconditionally at the discretion of the Group. Undrawn loan commitments which are cancellable unconditionally at anytime or which have a maturity of less than one year have a risk weighting of zero.
(3) Under the European Community Solvency Ratio Directive, credit equivalent amounts obtainable by applying creditconversion factors are risk weighted according to the nature of the counterparties. Using the minimum 8% BIS ratioindicates that £330 million of total capital would be required to support the total risk weighted amount of £4,123 million.

119
THE ROYAL BANK OF SCOTLAND GROUP plc
NOTES TO CONSOLIDATED FINANCIAL STATEMENTS - Continued
42. Reconciliation of operating profit to net cash inflow from operating activitiesYear ended September 30
1999 1998 1997£m £m £m
Operating profit Ð the company and its subsidiary undertakings ...................................... 1,211 944 690Increase in interest receivable and prepaid expenses ..................................................... (87) (150) (132)Increase in interest payable and accrued expenses ........................................................ 126 607 256(Decrease)/increase in other provisions ...................................................................... (9) (14) 23Increase/(decrease) in provisions for loan losses .......................................................... 94 182 (11)Interest payable on subordinated liabilities.................................................................. 251 226 210Depreciation and diminution in value of fixed assets..................................................... 278 243 107Profit on sales of tangible fixed assets........................................................................ (5) (10) (18)Profit on sales of investment securities....................................................................... (77) (72) (71)Profit on sale of mortgage servicing business .............................................................. - - (28)Profit on sale of associated undertaking...................................................................... (35) - -Profit on sale of fixed asset investment ...................................................................... - (57) (34)Other non-cash movements...................................................................................... 7 208 23Net cash inflow from trading activities....................................................................... 1,754 2,107 1,015
Net increase/(decrease) in deposits by banks ............................................................... 1,941 (958) (46)Net increase in customer accounts............................................................................. 4,495 3,018 6,311Net increase in loans to customers............................................................................. (8,425) (2,530) (4,432)Net decrease/(increase) in loans to banks.................................................................... 2,915 1,293 (536)Net increase/(decrease) in debt securities in issue......................................................... 1,740 1,864 (556)Increase in items in course of collection due from other banks ........................................ (3) (582) (42)Increase/(decrease) in items in course of collection due to other banks ............................. 455 (116) (139)Increase in treasury bills and other eligible bills ........................................................... (62) (10) (69)Decrease/(increase) in debt securities and equity shares (other than investment securities) ... 159 (2,480) 777Net decrease/(increase) in other assets ....................................................................... 1,823 (1,985) (737)Net (decrease)/increase in other liabilities................................................................... (1,733 ) 1,466 792Net cash inflow from operating activities.................................................................... 5,059 1,087 2,338
43. Purchase of businesses and subsidiary undertakings
The following table shows the aggregate fair values of net assets acquired in connection with the acquisition of businessesand subsidiary undertakings during the three years ended September 30, 1999. Apart from the acquisition of Angel Trains in theyear ended September 30, 1998, no significant adjustments were required to the book values of the net assets as recorded in theacquired companiesÕ books at the dates of acquisitions.
Year ended September 301999 1998 1997
Net assets acquired £m £m £m
Cash........................................................................................................ 35 17 86Debt securities .......................................................................................... - 16 2,118Equity shares ............................................................................................ - 5 -Loans to customers and banks ...................................................................... 2 109 1,292Other assets .............................................................................................. 57 10 112Prepayments and accrued income.................................................................. - 22 -Tangible fixed assets .................................................................................. - 822 23Deposits by banks and customer accounts....................................................... (40) (85) (3,355)Debt securities in issue................................................................................ - (574) -Deferred taxation....................................................................................... - (204) -Other liabilities.......................................................................................... (2) (74) -Accruals and deferred income ...................................................................... - (11) (139)Minority shareholderÕs interests.................................................................... - 166 18
52 219 155Goodwill.................................................................................................. 12 725 58
64 944 213
Satisfied by: net cash paid ........................................................................... 64 920 213debt securities issued ................................................................ - 24 -
64 944 213
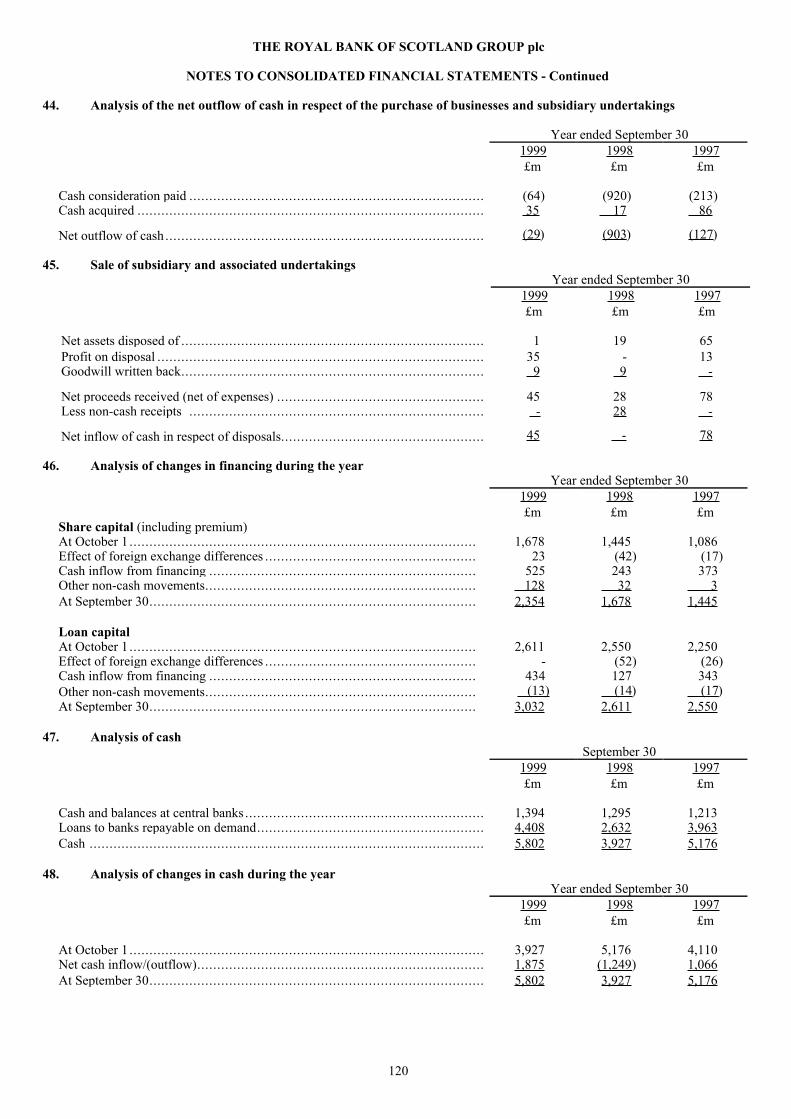
120
THE ROYAL BANK OF SCOTLAND GROUP plc
NOTES TO CONSOLIDATED FINANCIAL STATEMENTS - Continued
44. Analysis of the net outflow of cash in respect of the purchase of businesses and subsidiary undertakings
Year ended September 301999 1998 1997£m £m £m
Cash consideration paid .......................................................................... (64) (920) (213)Cash acquired ....................................................................................... 35 17 86
Net outflow of cash ................................................................................ (29 ) (903 ) (127 )
45. Sale of subsidiary and associated undertakingsYear ended September 30
1999 1998 1997£m £m £m
Net assets disposed of ............................................................................ 1 19 65Profit on disposal .................................................................................. 35 - 13Goodwill written back............................................................................ 9 9 -
Net proceeds received (net of expenses) .................................................... 45 28 78Less non-cash receipts .......................................................................... - 28 -
Net inflow of cash in respect of disposals................................................... 45 - 78
46. Analysis of changes in financing during the yearYear ended September 30
1999 1998 1997£m £m £m
Share capital (including premium)At October 1 ....................................................................................... 1,678 1,445 1,086Effect of foreign exchange differences ..................................................... 23 (42) (17)Cash inflow from financing ................................................................... 525 243 373Other non-cash movements.................................................................... 128 32 3At September 30.................................................................................. 2,354 1,678 1,445
Loan capitalAt October 1 ....................................................................................... 2,611 2,550 2,250Effect of foreign exchange differences ..................................................... - (52) (26)Cash inflow from financing ................................................................... 434 127 343Other non-cash movements.................................................................... (13) (14 ) (17 )At September 30.................................................................................. 3,032 2,611 2,550
47. Analysis of cashSeptember 30
1999 1998 1997£m £m £m
Cash and balances at central banks ............................................................ 1,394 1,295 1,213Loans to banks repayable on demand......................................................... 4,408 2,632 3,963Cash ................................................................................................... 5,802 3,927 5,176
48. Analysis of changes in cash during the yearYear ended September 30
1999 1998 1997£m £m £m
At October 1 ......................................................................................... 3,927 5,176 4,110Net cash inflow/(outflow)........................................................................ 1,875 (1,249 ) 1,066At September 30.................................................................................... 5,802 3,927 5,176
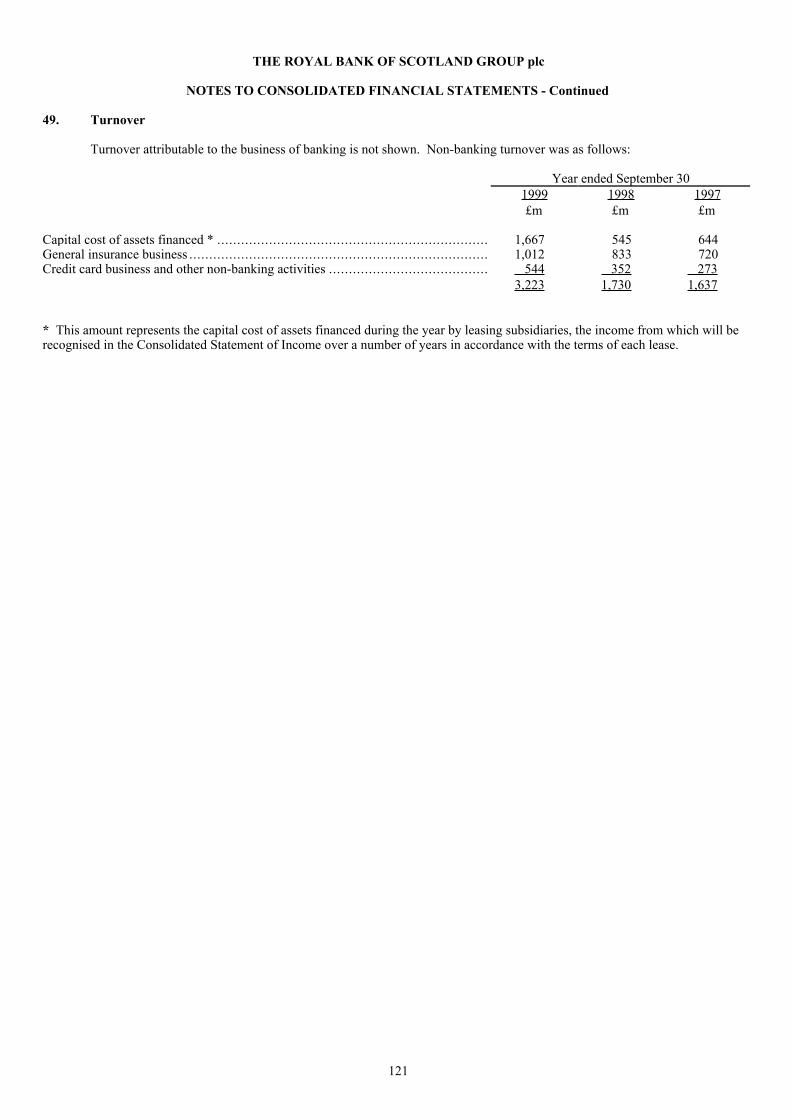
121
THE ROYAL BANK OF SCOTLAND GROUP plc
NOTES TO CONSOLIDATED FINANCIAL STATEMENTS - Continued
49. Turnover
Turnover attributable to the business of banking is not shown. Non-banking turnover was as follows:
Year ended September 301999 1998 1997£m £m £m
Capital cost of assets financed * .................................................................... 1,667 545 644General insurance business ........................................................................... 1,012 833 720Credit card business and other non-banking activities ........................................ 544 352 273
3,223 1,730 1,637
* This amount represents the capital cost of assets financed during the year by leasing subsidiaries, the income from which will berecognised in the Consolidated Statement of Income over a number of years in accordance with the terms of each lease.
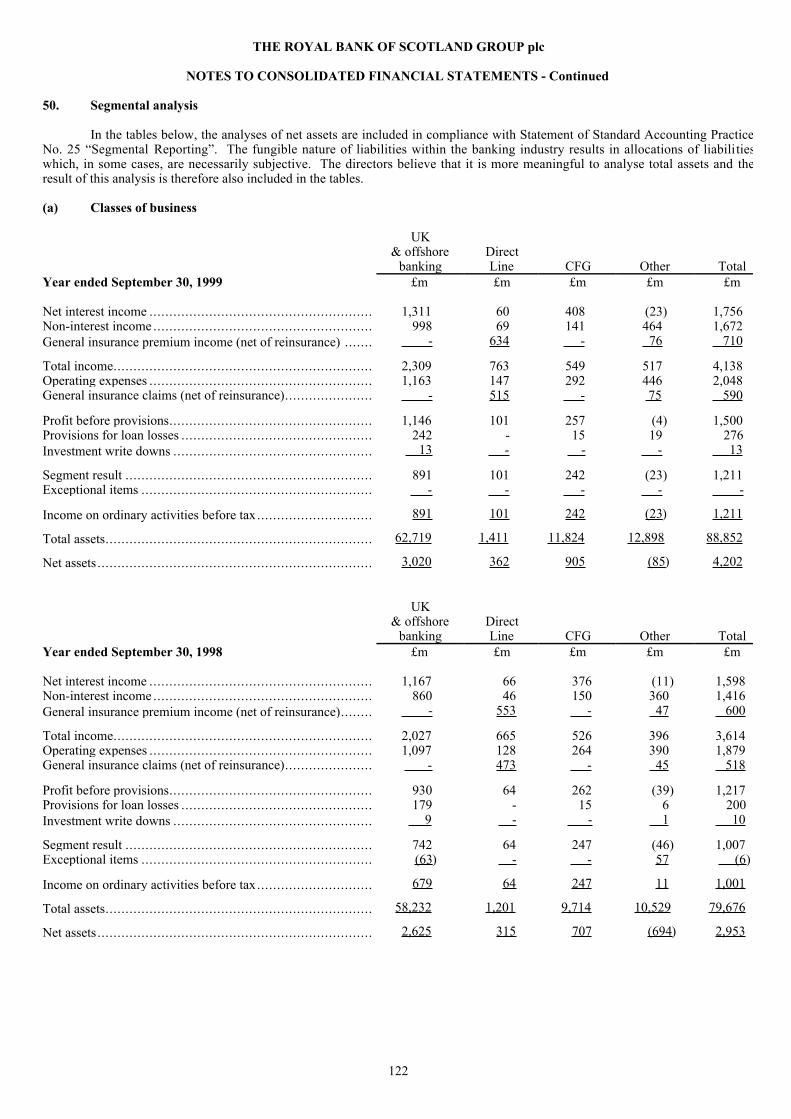
122
THE ROYAL BANK OF SCOTLAND GROUP plc
NOTES TO CONSOLIDATED FINANCIAL STATEMENTS - Continued
50. Segmental analysis
In the tables below, the analyses of net assets are included in compliance with Statement of Standard Accounting PracticeNo. 25 ÒSegmental ReportingÓ. The fungible nature of liabilities within the banking industry results in allocations of liabilitieswhich, in some cases, are necessarily subjective. The directors believe that it is more meaningful to analyse total assets and theresult of this analysis is therefore also included in the tables.
(a) Classes of business
UK& offshore Direct
banking Line CFG Other TotalYear ended September 30, 1999 £m £m £m £m £m
Net interest income ........................................................ 1,311 60 408 (23) 1,756Non-interest income ....................................................... 998 69 141 464 1,672General insurance premium income (net of reinsurance) ....... - 634 - 76 710
Total income................................................................. 2,309 763 549 517 4,138Operating expenses ........................................................ 1,163 147 292 446 2,048General insurance claims (net of reinsurance)...................... - 515 - 75 590
Profit before provisions................................................... 1,146 101 257 (4) 1,500Provisions for loan losses ................................................ 242 - 15 19 276Investment write downs .................................................. 13 - - - 13
Segment result .............................................................. 891 101 242 (23) 1,211Exceptional items .......................................................... - - - - -
Income on ordinary activities before tax............................. 891 101 242 (23 ) 1,211
Total assets................................................................... 62,719 1,411 11,824 12,898 88,852
Net assets ..................................................................... 3,020 362 905 (85 ) 4,202
UK& offshore Direct
banking Line CFG Other TotalYear ended September 30, 1998 £m £m £m £m £m
Net interest income ........................................................ 1,167 66 376 (11) 1,598Non-interest income ....................................................... 860 46 150 360 1,416General insurance premium income (net of reinsurance)........ - 553 - 47 600
Total income................................................................. 2,027 665 526 396 3,614Operating expenses ........................................................ 1,097 128 264 390 1,879General insurance claims (net of reinsurance)...................... - 473 - 45 518
Profit before provisions................................................... 930 64 262 (39) 1,217Provisions for loan losses ................................................ 179 - 15 6 200Investment write downs .................................................. 9 - - 1 10
Segment result .............................................................. 742 64 247 (46) 1,007Exceptional items .......................................................... (63 ) - - 57 (6 )
Income on ordinary activities before tax............................. 679 64 247 11 1,001
Total assets................................................................... 58,232 1,201 9,714 10,529 79,676
Net assets ..................................................................... 2,625 315 707 (694 ) 2,953

123
THE ROYAL BANK OF SCOTLAND GROUP plc
NOTES TO CONSOLIDATED FINANCIAL STATEMENTS Ð Continued
UK& offshore Direct
banking Line CFG Other TotalYear ended September 30, 1997 £m £m £m £m £m
Net interest income ......................................................... 992 66 352 4 1,414Non-interest income ........................................................ 776 47 98 82 1,003General insurance premium income (net of reinsurance)......... - 526 - 9 535
Total income.................................................................. 1,768 639 450 95 2,952Operating expenses ......................................................... 1,004 124 245 176 1,549General insurance claims (net of reinsurance)....................... - 479 - 8 487
Profit before provisions.................................................... 764 36 205 (89) 916Provisions for loan losses ................................................. 128 - 16 2 146Investment write downs ................................................... 2 - - - 2
Segment result ............................................................... 634 36 189 (91) 768Exceptional items ........................................................... (60) - 28 24 (8 )
Income on ordinary activities before tax.............................. 574 36 217 (67 ) 760
Total assets.................................................................... 56,515 1,124 9,565 5,397 72,601
Net assets ...................................................................... 2,319 343 575 (195) 3,042
UK and offshore banking comprises the UK Bank, RBS Cards and RBSI. The segment result is analysed as follows:
Year ended September 301999 1998 1997£m £m £m
UK Bank.................................................................................................. 736 626 541RBS Cards ............................................................................................... 85 61 48RBSI....................................................................................................... 70 55 45
891 742 634
Other comprises net central financing costs, central expenses, the results of Investor Services, New Retail FinancialServices Businesses and Angel Trains. The segment result is analysed as follows:
Year ended September 301999 1998 1997£m £m £m
New Retail Financial Services Businesses ...................................................... (35) (59) (33)Angel Trains............................................................................................. 53 46 -Investor Services ....................................................................................... 14 5 (12)Central costs ............................................................................................. (55 ) (38 ) (46 )
(23) (46 ) (91 )
The figures for 1998 and 1997 in the above analyses have been restated to reflect the separate disclosure of RBS Cards.

124
THE ROYAL BANK OF SCOTLAND GROUP plc
NOTES TO CONSOLIDATED FINANCIAL STATEMENTS - Continued
50. Segmental analysis (continued)
(b) Geographical segments
The geographical analyses in the tables below have been compiled on the basis of location of office. In addition to CFG,USA also includes the BankÕs New York branch. UK includes the Channel Islands and Isle of Man.
Continental Rest ofUK Europe USA the World Total
Year ended September 30, 1999 £m £m £m £m £m
Interest receivable.............................................. 3,956 64 823 153 4,996Dividend income ............................................... 19 11 4 - 34Fees and commissions receivable.......................... 935 14 132 3 1,084Dealing profits .................................................. 182 1 3 5 191General insurance premium income ...................... 710 - - - 710Other income .................................................... 434 13 11 (2) 456
Gross income.................................................... 6,236 103 973 159 7,471
Income on ordinary activities before tax................. 940 38 221 12 1,211
Total assets....................................................... 73,232 1,065 12,140 2,415 88,852
Net assets ......................................................... 2,777 561 870 (6) 4,202
Year ended September 30, 1998 £m £m £m £m £m
Interest receivable.............................................. 4,088 57 761 217 5,123Dividend income ............................................... 14 11 3 - 28Fees and commissions receivable.......................... 795 10 113 5 923Dealing profits .................................................. 262 - 3 3 268General insurance premium income ...................... 600 - - - 600Income from associated undertakings .................... 2 (3) - 1 -Other income .................................................... 311 (1 ) 67 - 377
Gross income.................................................... 6,072 74 947 226 7,319
Income on ordinary activities before tax................. 737 74 251 (61) 1,001
Total assets....................................................... 66,527 818 9,903 2,428 79,676
Net assets ......................................................... 2,037 217 700 (1) 2,953
Year ended September 30, 1997 £m £m £m £m £m
Interest receivable.............................................. 3,176 45 703 201 4,125Dividend income ............................................... 11 11 2 - 24Fees and commissions receivable.......................... 707 5 93 4 809Dealing profits .................................................. 110 1 3 3 117General insurance premium income ...................... 535 - - - 535Income from associated undertakings .................... - (6) - 1 (5)Other income .................................................... 121 - 13 - 134
Gross income.................................................... 4,660 56 814 209 5,739
Income on ordinary activities before tax................. 503 21 224 12 760
Total assets....................................................... 58,863 716 9,979 3,043 72,601
Net assets ......................................................... 2,208 203 568 63 3,042

125
THE ROYAL BANK OF SCOTLAND GROUP plc
NOTES TO CONSOLIDATED FINANCIAL STATEMENTS - Continued
51. Related party transactions
Subsidiary undertakings
Details of the principal subsidiary undertakings are shown in Note 21. In accordance with Financial Reporting Standard No8 ÒRelated Party DisclosuresÓ (ÒFRS 8Ó), transactions or balances between Group entities that have been eliminated on consolidationare not reported.
Associated undertakings
Details of the GroupÕs principal associated undertakings are shown in Note 20. The amount of loans and advances due fromassociated undertakings at September 30, 1999 is shown in Note 14 and the amount of deposits received from associatedundertakings as at September 30, 1999 is shown in Note 28. These transactions are conducted on similar terms to third partytransactions and are not material to the GroupÕs results or financial condition. Certain subsidiary undertakings in the Group providedevelopment and other types of capital support to businesses in their roles as providers of finance. These investments are made inthe normal course of business and on arms-length terms depending on their nature. In some instances, the investment may extend toownership or control over 20% or more of the voting rights of the investee company. However, these investments are not consideredto give rise to transactions of a materiality requiring disclosure under FRS 8.
The Royal Bank of Scotland Staff Pension Scheme (the ÒSchemeÓ)
The Bank recharges the Scheme with the cost of administration services incurred by it and the total amount recharged in theyear ended September 30, 1999 was £0.4 million (September 1998 - £0.3 million).
Banco Santander Central Hispano (ÒBSCHÓ)
Under the terms of an alliance agreement, the Group and BSCH co-operate in certain banking and financial activities inEurope. The Group holds 2.23% of BSCHÕs capital stock and BSCH holds 9.64% of the companyÕs ordinary shares and in additionBSCH has a 50% minority shareholding in The Royal Bank of Scotland (Gibraltar) Limited.
Directors, officers and others
Details of directorsÕ remuneration are set out on pages 66 to 71 of this Report. Details of transactions with directors,officers and others connected to them are shown on page 72.

126
THE ROYAL BANK OF SCOTLAND GROUP plc
NOTES TO CONSOLIDATED FINANCIAL STATEMENTS - Continued
52. Significant differences between UK and US generally accepted accounting principles
The accounting policies under which the Consolidated Financial Statements of the Group are prepared conform withgenerally accepted accounting principles in the UK (ÒUK GAAPÓ). Such principles differ in certain significant respects from thosegenerally accepted in the United States (ÒUS GAAPÓ) and in the case of the Group, these differences are summarised as follows:
(a) Revaluation The GroupÕs premises are carried in the Consolidated Financial Statements at original cost or subsequentvaluation. Revaluation reserves are reflected in the Consolidated Balance Sheet. Under US GAAP, revaluations of property are notpermitted to be reflected in the financial statements.
(b) Property depreciation Freehold and long leasehold premises are maintained in a state of good repair with regularmaintenance expenditure being charged against operating profit. Based on an assessment of useful life and estimated residual value,no depreciation is charged. US GAAP requires that such properties be depreciated. The Group applies depreciation for US GAA Ppurposes at a rate of 2% per annum on original cost.
(c) Deferred Tax Deferred tax is provided on the liability method in respect of timing differences which are expected to resultin a taxation liability in the foreseeable future. Under the liability method, deferred tax is calculated at the rate of tax that it isestimated will be applicable when the temporary differences crystallise. Under US GAAP, provision for deferred tax under theliability method is required in full for all timing differences. Deferred tax is calculated under US GAAP at enacted tax rates.Deferred tax assets recognised are subject to adjustment for valuation allowances when it is more likely than not that some or all ofthe deferred tax asset will not be realised.
(d) Goodwill The Group has adopted Financial Reporting Standard No. 10 ÒGoodwill and Intangible AssetsÓ, resulting ingoodwill arising on acquisitions after October 1, 1998 generally being capitalised on the balance sheet and amortised over its usefullife. Previously under UK GAAP goodwill arising on acquisitions was charged to reserves immediately. Under US GAAP,goodwill is capitalised and amortised through the Consolidated Statement of Income over the period estimated to benefit, which inthe GroupÕs case, is 25 years.
(e) Loan origination fees Accounting for advances under UK GAAP now has similar requirements to Statement of FinancialAccounting Standard (ÒSFASÓ) No. 91 ÒAccounting for non-refundable fees and costs associated with originating or acquiring loansand initial direct costs of leasesÓ and as a result there is no longer any difference in the recognition of income under UK and USGAAP in regard to these items. Previous differences are being released to the Consolidated Statement of Income over the terms ofthe loans involved.
(f) Pension costs In arriving at operating profit, the Group assesses and charges the cost of providing pensions on a regularbasis in accordance with the advice of independent professionally qualified actuaries. Contributions to UK pension funds are madeat a rate calculated by the actuaries to provide, over the average remaining service of eligible employees, for all retirement benefitsrelated to projected final salaries. For the purposes of US GAAP, the Group complies with SFAS No. 87 ÒEmployersÕ Accountingfor PensionsÓ, which prescribes the method of actuarial valuation and also requires pension fund assets to be assessed at fair valueand the assessment of liabilities to be based on current interest rates.
(g) Long-term assurance policies Under UK GAAP, long-term assurance policies are valued at the net present value of thecash flows inherent in such policies, whereas under US GAAP this treatment is not permitted to be reflected in the ConsolidatedFinancial Statements.
(h) Lease income In accordance with UK GAAP, the GroupÕs accounting policy for finance lease income receivable is toallocate total gross earnings to accounting periods using the actuarial after tax method to give a constant periodic rate of return on thenet cash investment. Application of SFAS No. 13, ÒAccounting for LeasesÓ gives rise to a level rate of return on the investment inthe lease but without taking into account tax statement payments and receipts. This results in income being recognised in differentperiods than under UK GAAP.
(i) Internal derivative trades In accordance with UK GAAP, where underlying Group subsidiaries and business unitsundertake internal derivative trades with the Group central treasury to transfer risk from the banking book to the trading book, theGroup central treasury is allowed to aggregate and/or offset trades with similar characteristics for the purposes of establishing aneffective hedge position against the underlying risk.
Under UK GAAP, where positions established with external counterparties offset the net risk, hedge accounting is applied to theinternal derivative trades. The UK accounting policy is described more fully on page 82.
Under US GAAP contemporaneous offset with external counterparties is required if hedge accounting is to be applied to internalderivative trades. As a consequence, trades not satisfying this requirement have been accounted for at fair value for US GAAPpurposes.
127
THE ROYAL BANK OF SCOTLAND GROUP plc
NOTES TO CONSOLIDATED FINANCIAL STATEMENTS - Continued
(j) Year 2000 costs In accordance with UK GAAP, the UK Bank charged £29 million to the Consolidated Statement ofIncome for the year ended September 30, 1997 as a provision for the costs of completing work on its computer systems to ensurethat they are Year 2000 compatible. Expenditure of £9 million was set against this provision during the year ended September 30,1999 (1998 - £14 million, 1997 - £6 million). The Group complies with a pronouncement under US GAAP that such costs should becharged to the Consolidated Statement of Income as incurred.
(k) Dividends Under UK GAAP, dividends declared after the year end are recorded in the period to which they relate, whereasUS practice is to record dividends in the period in which they are declared.
(l) Debt securities and equity shares Under UK GAAP, the GroupÕs investments in debt securities and equity shares areclassified as being held as investment securities, held for the purpose of hedging or held for dealing purposes. The accountingtreatment of these assets is detailed in Accounting policies item 1 (j) on page 81. For the purposes of US GAAP, the Group complieswith SFAS No. 115, ÒAccounting for Certain Investments in Debt and Equity SecuritiesÓ under which debt securities and equityshares are required to be classified between trading securities, available for sale securities and held to maturity securities. Held tomaturity securities are accounted for in the same way as securities held for investment purposes under UK GAAP. Tradingsecurities are accounted for in the same way as securities not held for investment purposes under UK GAAP. Available for salesecurities are reported at market value with unrealised gains and losses excluded from earnings but reported in a separate componentof shareholdersÕ funds.
(m) Acceptances Acceptances outstanding and the matching customersÕ liabilities are not reflected in the ConsolidatedBalance Sheet, but are disclosed as memorandum items below the Consolidated Balance Sheet. Under US GAAP, acceptancesoutstanding and the matching customersÕ liabilities are reflected in the Consolidated Balance Sheet.
(n) Provisions for loan losses Under UK GAAP, the Group establishes specific provisions against loans and advances when, asa result of a detailed appraisal of the portfolio, it is considered that recovery is doubtful. Under US GAAP, the Group complies withSFAS No. 114, ÒAccounting by Creditors for Impairment of a LoanÓ (ÒSFAS No. 114Ó), which requires that impaired loans bedetermined on the basis of the present value of expected future cash flows discounted at the loansÕ effective interest rates or at theloansÕ observable market values or the fair values of collateral if the loans are collateral dependent. Having compared the carryingvalue of its loan portfolio calculated under SFAS No. 114 with the carrying value (net of provisions for loan losses) calculated underUK GAAP, the Group has determined that there is no material effect on the reconciliation between UK GAAP and US GAAP netincome, shareholdersÕ equity and total assets.
128
THE ROYAL BANK OF SCOTLAND GROUP plc
NOTES TO CONSOLIDATED FINANCIAL STATEMENTS - Continued
52. Significant differences between UK and US generally accepted accounting principles (continued)
Selected figures in accordance with US GAAP
The following tables summarise the significant adjustments to consolidated net income, shareholdersÕ equity, and totalassets which would result from the application of US GAAP instead of UK GAAP. Where applicable, the adjustments are statedgross of tax with the tax effect shown separately in total.
YearÊendedÊSeptemberÊ301999 1998 1997
Net income £m £m £m
Net income as reported under UK GAAP ....................................................... 856 695 510Property depreciation.................................................................................. (8) - -Disposal of revalued property....................................................................... 1 1 1Deferred tax . ............................................................................................ 1 (31) -Amortisation of goodwill ............................................................................ (46) (47) (4)Loan origination fees.................................................................................. 8 12 15Pension costs (see notes below) .................................................................... (6) (2) 28Long-term assurance policies ....................................................................... (47) (26) 2Leasing.................................................................................................... (4) 6 6Internal derivative trades ............................................................................. (21) - -Year 2000 costs......................................................................................... (9) (14) 23Tax effect on the above UK/US GAAP reconciling items .................................. 33 3 (22 )Approximate net income under US GAAP...................................................... 758 597 559Preference dividends .................................................................................. (80 ) (58 ) (53 )Approximate net income available for ordinary shares under US GAAP .............. 678 539 506
Approximate net income per 25 pence ordinary share under US GAAP................ 75.7p 61.3p 60.6p
SeptemberÊ301999 1998
ShareholdersÕ equity £m £m
ShareholdersÕ equity as reported under UK GAAP ................................................................ 4,202 2,953Revaluation of property less depreciation............................................................................. (167) (133)Deferred tax .................................................................................................................. (211) (226)Goodwill....................................................................................................................... 965 1,039Loan origination fees....................................................................................................... (4) (12)Proposed dividend .......................................................................................................... 181 153Pension costs ................................................................................................................. (7) (1)Leasing......................................................................................................................... - 4Long-term assurance policies ............................................................................................ (177) (130)Debt securities and equity shares ....................................................................................... 277 322Internal derivative trades .................................................................................................. (21) -Year 2000 costs.............................................................................................................. - 9Tax effect on the above UK/US GAAP reconciling items ....................................................... 61 28Approximate shareholdersÕ equity under US GAAP .............................................................. 5,099 4,006
Year ended SeptemberÊ301999 1998
Statement of changes in shareholdersÕ equity under US GAAP £m £m
At October 1 .................................................................................................................. 4,006 3,561Net income for year......................................................................................................... 678 539Ordinary dividends paid ................................................................................................... (226) (193)Currency translation adjustments on share premium account ................................................... 23 (42)Currency translation adjustments on foreign currency net investments ...................................... 5 (3)Movement in unrealised gain on debt securities and equity shares held as available for sale .......... (45) (131)Issues of shares .............................................................................................................. 4 4Premium arising on issues of shares ................................................................................... 609 239Deferred tax................................................................................................................... 48 15Other movements............................................................................................................ ÊÊÊÊÊÊ(3 ) 17At September 30............................................................................................................. 5,099 4,006

129
THE ROYAL BANK OF SCOTLAND GROUP plc
NOTES TO CONSOLIDATED FINANCIAL STATEMENTS - Continued
SeptemberÊ301999 1998
Total assets £m £m
Total assets as reported under UK GAAP ............................................................................ 88,852 79,676Revaluation of property less depreciation ............................................................................ (167) (133)Goodwill....................................................................................................................... 965 1,039Acceptances .................................................................................................................. 893 1,023Long-term assurance policies ............................................................................................ (176) (128)Loans to customers ......................................................................................................... - 3Internal derivative trades .................................................................................................. (21) -Debt securities and equity shares ....................................................................................... 277 322
Approximate total assets under US GAAP........................................................................... 90,623 81,802
Statement of Comprehensive Income Ð SFAS No. 130
The following table shows the comprehensive income for the three years ended September 30, 1999, 1998 and 1997:
Year ended SeptemberÊ301999 1998 1997£m £m £m
Consolidated net income .............................................................................. 678 539 506Other comprehensive income - Unrealised surplus on securities available for sale .......................................... (32) (92) 232 - Translation differences on foreign currency net investment .............................. 5 (3 ) (1 )
Consolidated total income ............................................................................ 651 444 737

130
THE ROYAL BANK OF SCOTLAND GROUP plc
NOTES TO CONSOLIDATED FINANCIAL STATEMENTS - Continued
52. Significant differences between UK and US generally accepted accounting principles (continued)
Condensed Financial Statements reflecting US GAAP adjustments
The following table shows a condensed presentation of the Consolidated Statement of Income for the three years endedSeptember 30, 1999, 1998 and 1997 and the Consolidated Balance Sheet as at September 30, 1999 and 1998 reflecting the U SGAAP adjustments detailed above:
YearÊendedÊSeptemberÊ301999 1998 1997£m £m £m
NET INTEREST INCOME ......................................................................... 1,752 1,604 1,461NON INTEREST INCOME......................................................................... 2,323 2,099 1,556
TOTAL INCOME ..................................................................................... 4,075 3,703 3,017OPERATING EXPENSES .......................................................................... (2,117 ) (1,942 ) (1,502 )
PROFIT BEFORE OTHER OPERATING CHARGES ..................................... 1,958 1,761 1,515General insurance claims (net of reinsurance).................................................. (590 ) (518 ) (487 )
PROFIT BEFORE PROVISIONS FOR LOAN LOSSES .................................. 1,368 1,243 1,028Provision for loan losses ............................................................................. (276) (332) (146)Amounts written off fixed asset investments ................................................... (13) (24) (2)Write down of finance leases ....................................................................... - (13) (41 )
INCOME ON ORDINARY ACTIVITIES BEFORE TAX................................. 1,079 874 839Exceptional items ...................................................................................... - 57 (8)Tax on income on ordinary activities ............................................................. (327) (314) (241)Minority interests....................................................................................... ÊÊÊÊÊ6 (20) (31 )NET INCOME.......................................................................................... 758 597 559Preference dividends .................................................................................. (80 ) (58 ) (53 )
NET INCOME AVAILABLE FOR ORDINARY SHARES............................... 678 539 506
SeptemberÊ301999 1998£m £m
ASSETSCash and balances at central banks ..................................................................................... 1,394 1,295Treasury bills and other eligible bills .................................................................................. 701 639Loans to banks ............................................................................................................... 10,375 11,514Items in the course of collection due from other banks ........................................................... 1,655 1,652Loans to customers ......................................................................................................... 49,340 41,020Debt securities and equity shares ....................................................................................... 16,579 13,953Interests in associated undertakings .................................................................................... 43 43Tangible fixed assets ....................................................................................................... 2,359 1,872Goodwill and intangible assets .......................................................................................... 976 1,039Other assets ................................................................................................................... 6,035 7,696Prepayments and accrued income....................................................................................... ÊÊ1,166 1,079
TOTAL ASSETS............................................................................................................ 90,623 81,802
LIABILITIESDeposits by banks........................................................................................................... 6,418 4,437Items in the course of collection due to other banks ............................................................... 975 520Customer accounts.......................................................................................................... 55,180 50,685Debt securities in issue..................................................................................................... 9,199 7,459Other liabilities............................................................................................................... 7,359 8,946Accruals and deferred income ........................................................................................... 2,586 2,431Provisions for liabilities and charges................................................................................... 628 614Subordinated liabilities .................................................................................................... 3,032 2,611Minority interests Ð equity................................................................................................ 147 93ShareholdersÕ equity........................................................................................................ ÊÊ5,099 4,006
TOTAL LIABILITIES AND SHAREHOLDERSÕ EQUITY................................................... 90,623 81,802

131
THE ROYAL BANK OF SCOTLAND GROUP plc
NOTES TO CONSOLIDATED FINANCIAL STATEMENTS - Continued
Alternative presentation of Consolidated Statement of Income
For the three years ended September 30, 1999, the following items would have been classified differently under US GAAPfrom how they are presented on a UK GAAP basis in the Consolidated Statement of Income on page 76.
Provision for Year 2000 costs
Under US GAAP, the provision for Year 2000 costs of £29 million in 1997 would be included with other Administrativeexpenses and would not be presented as an exceptional item.
Write-down of finance leases
Under US GAAP, the write-down of finance leases amounting to £13 million in 1998 and £41 million in 1997 would becharged against other interest receivable and similar income and would not be presented as an exceptional item as under UK GAAP.
Profit on sale of mortgage servicing business
Under US GAAP, the profit of £28 million arising on the sale of mortgage servicing business in 1997 would be includedwithin Other income. Under UK GAAP presentation this profit has been shown as an exceptional item.
Profit on sale of fixed asset investment
Under US GAAP, the profit of £57 million arising on the sale of shares in Banco Santander (now BSCH) in the year endedSeptember 30, 1998 and the profit of £34 million arising on the sale of the GroupÕs shareholding in Banco Espanol de Credito in theyear ended September 30, 1997 would be included within Other income and would not be shown as exceptional items as under U KGAAP.
Amounts written off fixed asset investments
Under US GAAP amounts written off fixed asset investments of £13 million, £24 million and £2 million for the years endedSeptember 30, 1999, 1998 and 1997 respectively would be classified as deductions from Other income.
132
THE ROYAL BANK OF SCOTLAND GROUP plc
NOTES TO CONSOLIDATED FINANCIAL STATEMENTS - Continued
52. Significant differences between UK and US generally accepted accounting principles (continued)
Alternative presentation of Consolidated Statement of Income (continued)
The following Consolidated Statement of Income illustrates this presentation but otherwise shows amounts in conformitywith UK GAAP:
YearÊendedÊSeptemberÊ301999 1998 1997
£m £m £mInterest receivable: - interest receivable and similar income arising from debt securities .................. 895 745 558 - other interest receivable and similar income ................................................ 4,101 4,365 3,526Interest payable ......................................................................................... (3,240) (3,525 ) (2,711 )
NET INTEREST INCOME ......................................................................... 1,756 1,585 1,373
Dividend income ....................................................................................... 34 28 24Fees and commissions receivable.................................................................. 1084 923 809Fees and commissions payable ..................................................................... (93) (84) (76)Dealing profits .......................................................................................... 191 268 117General insurance premium income (net of reinsurance).................................... 710 600 535Other income ............................................................................................ 443 410 189
NON-INTEREST INCOME ........................................................................ 2,369 2,145 1,598
TOTAL INCOME ..................................................................................... 4,125 3,730 2,971
Administrative expenses: - staff costs .............................................................................................. 956 884 794 - staff profit share...................................................................................... 47 43 36 - premises and equipment ........................................................................... 298 280 227 - other..................................................................................................... 468 429 414Depreciation and amortisation ...................................................................... 279 243 107
OPERATING EXPENSES .......................................................................... 2,048 1,879 1,578
PROFIT BEFORE OTHER OPERATING CHARGES ..................................... 2,077 1,851 1,393General insurance claims (net of reinsurance)................................................. (590 ) (518 ) (487 )
PROFIT BEFORE PROVISIONS FOR LOAN LOSSES .................................. 1,487 1,333 906Provision for loan losses ............................................................................. (276) (332 ) (146 )
INCOME ON ORDINARY ACTIVITIES BEFORE TAX................................. 1,211 1,001 760Tax on income on ordinary activities ............................................................. (361) (286) (219)Minority interests....................................................................................... 6 (20 ) (31 )
NET INCOME.......................................................................................... 856 695 510Preference dividends .................................................................................. (80) (58) (53 )
NET INCOME AVAILABLE FOR ORDINARY SHARES............................... 776 637 457
133
THE ROYAL BANK OF SCOTLAND GROUP plc
NOTES TO CONSOLIDATED FINANCIAL STATEMENTS Ð Continued
Pensions
The provisions of SFAS No. 87, ÒEmployersÕ Accounting for PensionsÓ (ÒSFAS No. 87Ó), have been applied to The RoyalBank of Scotland Staff Pension Scheme (the ÒplanÓ). The disclosure requirements of this statement have, however, been amendedby SFAS No. 132 ÒEmployers Disclosures about Pension and Other Post-Retirement BenefitsÓ, and these new requirements havebeen adopted below. The plan covers approximately 90% of the GroupÕs UK employees and resulted from the merger of pensionarrangements previously established by the two constituent banks, The Royal Bank of Scotland plc and Williams & GlynÕs Bank plc.A trust fund has been established under the plan, to which payments are made, determined on an actuarial basis, designed to build upreserves during the working life of full-time employees to pay such employees or dependants a pension after retirement. Suchpensions are based on final pensionable salaries (i.e., the highest average basic salary over any twelve month period within the finalten years of employment) and are related to the length of service prior to retirement. Pensions are limited to a maximum oftwo-thirds of final salary for 40 years service or more. Staff do not make contributions for basic pensions but may make voluntarycontributions on a regular basis to purchase additional service qualification where less than 40 years service will have beencompleted by normal retirement age. The assets of the plan are held under a separate trust and, in the long-term, the funding policyis to maintain assets sufficient to cover the benefits in respect of service to date, with due allowance for future earnings increases.The plan assets consist mainly of fixed-income securities and listed securities. The investment policy followed for the plan seeks todeploy the plan assets primarily in UK and overseas equity shares and UK government securities.
The above plan covers approximately 90% of the GroupÕs UK employees. The impact of US GAAP on the other Groupschemes is considered to be immaterial.
The Ònet periodic pension costÓ of the plan under the provisions of SFAS No. 87, for the three years to September 30, 1999,is made up as follows:
Year ended September 301999 1998 1997£m £m £m
Service cost component .............................................................................. 72 65 57Interest cost component .............................................................................. 103 100 100Actual return on assets................................................................................ (366) (85) (295)Other components...................................................................................... 253 (34 ) 168
62 46 30
The following table presents the estimated funded status of the plan under SFAS No. 87:September 30
1999 1998£m £m
Actuarial present value of benefit obligations:Vested benefit obligation ............................................................................................. 1,622 1,615
Accumulated benefit obligation .................................................................................... 1,622 1,615
Funded status................................................................................................................. 263 (82)Unrecognised prior service cost ......................................................................................... 2 2Unrecognised net (gain)/loss ............................................................................................. (231) 124Unrecognised net asset arising from initial application of statement .......................................... (48 ) (56 )Net pension liability ........................................................................................................ (14 ) (12 )
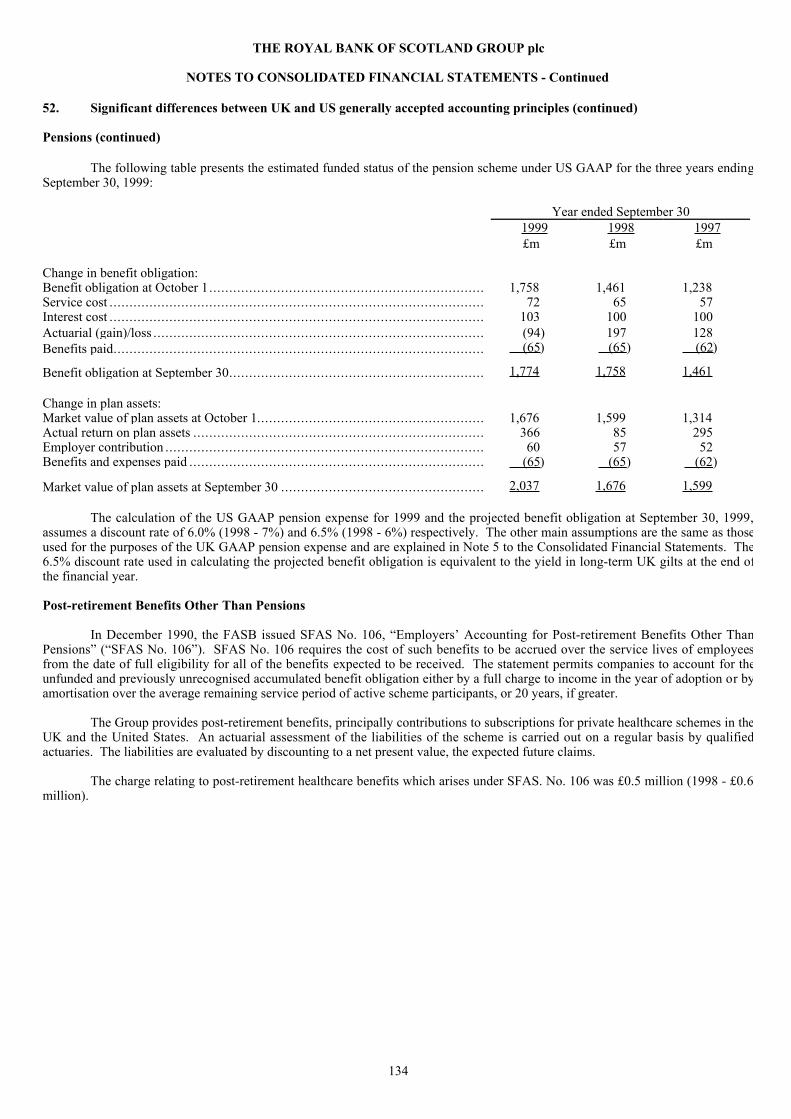
134
THE ROYAL BANK OF SCOTLAND GROUP plc
NOTES TO CONSOLIDATED FINANCIAL STATEMENTS - Continued
52. Significant differences between UK and US generally accepted accounting principles (continued)
Pensions (continued)
The following table presents the estimated funded status of the pension scheme under US GAAP for the three years endingSeptember 30, 1999:
Year ended September 301999 1998 1997£m £m £m
Change in benefit obligation:Benefit obligation at October 1..................................................................... 1,758 1,461 1,238Service cost .............................................................................................. 72 65 57Interest cost .............................................................................................. 103 100 100Actuarial (gain)/loss ................................................................................... (94) 197 128Benefits paid............................................................................................. (65 ) (65 ) (62 )
Benefit obligation at September 30................................................................ 1,774 1,758 1,461
Change in plan assets:Market value of plan assets at October 1......................................................... 1,676 1,599 1,314Actual return on plan assets ......................................................................... 366 85 295Employer contribution ................................................................................ 60 57 52Benefits and expenses paid .......................................................................... (65 ) (65 ) (62 )
Market value of plan assets at September 30 ................................................... 2,037 1,676 1,599
The calculation of the US GAAP pension expense for 1999 and the projected benefit obligation at September 30, 1999,assumes a discount rate of 6.0% (1998 - 7%) and 6.5% (1998 - 6%) respectively. The other main assumptions are the same as thoseused for the purposes of the UK GAAP pension expense and are explained in Note 5 to the Consolidated Financial Statements. The6.5% discount rate used in calculating the projected benefit obligation is equivalent to the yield in long-term UK gilts at the end ofthe financial year.
Post-retirement Benefits Other Than Pensions
In December 1990, the FASB issued SFAS No. 106, ÒEmployersÕ Accounting for Post-retirement Benefits Other ThanPensionsÓ (ÒSFAS No. 106Ó). SFAS No. 106 requires the cost of such benefits to be accrued over the service lives of employeesfrom the date of full eligibility for all of the benefits expected to be received. The statement permits companies to account for theunfunded and previously unrecognised accumulated benefit obligation either by a full charge to income in the year of adoption or byamortisation over the average remaining service period of active scheme participants, or 20 years, if greater.
The Group provides post-retirement benefits, principally contributions to subscriptions for private healthcare schemes in theUK and the United States. An actuarial assessment of the liabilities of the scheme is carried out on a regular basis by qualifiedactuaries. The liabilities are evaluated by discounting to a net present value, the expected future claims.
The charge relating to post-retirement healthcare benefits which arises under SFAS. No. 106 was £0.5 million (1998 - £0.6million).
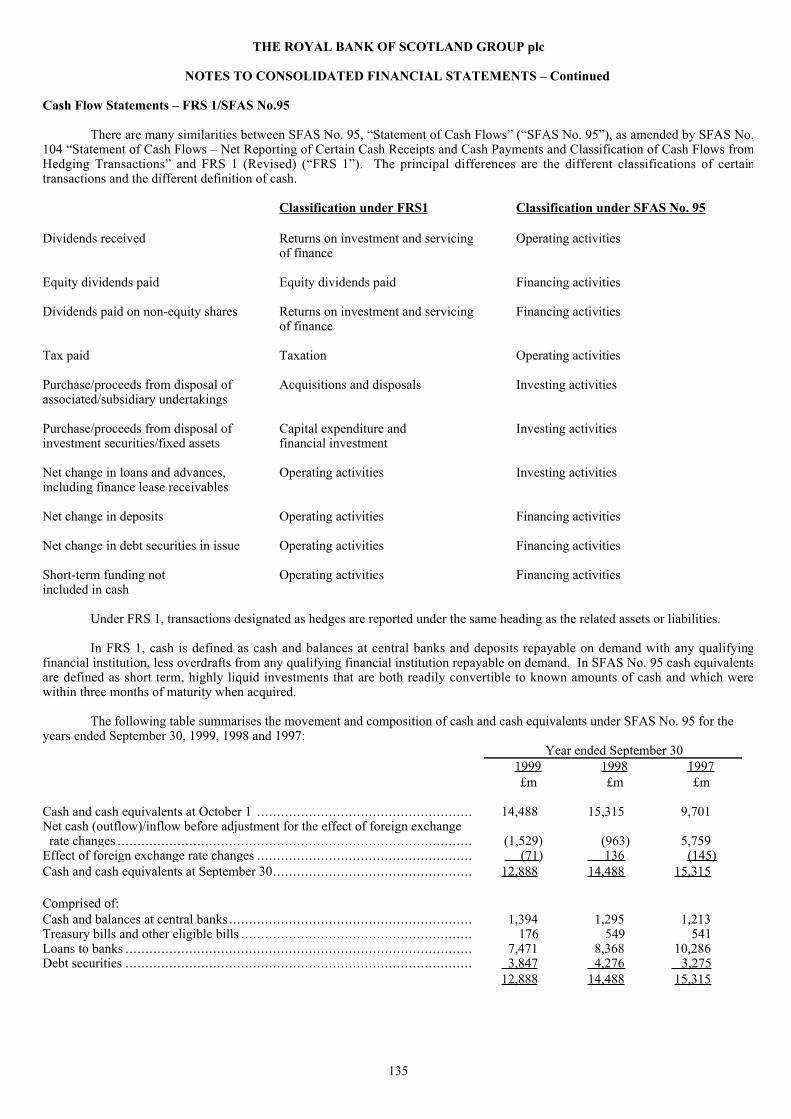
135
THE ROYAL BANK OF SCOTLAND GROUP plc
NOTES TO CONSOLIDATED FINANCIAL STATEMENTS Ð Continued
Cash Flow Statements Ð FRS 1/SFAS No.95
There are many similarities between SFAS No. 95, ÒStatement of Cash FlowsÓ (ÒSFAS No. 95Ó), as amended by SFAS No.104 ÒStatement of Cash Flows Ð Net Reporting of Certain Cash Receipts and Cash Payments and Classification of Cash Flows fromHedging TransactionsÓ and FRS 1 (Revised) (ÒFRS 1Ó). The principal differences are the different classifications of certaintransactions and the different definition of cash.
Classification under FRS1 Classification under SFAS No. 95
Dividends received Returns on investment and servicing Operating activitiesof finance
Equity dividends paid Equity dividends paid Financing activities
Dividends paid on non-equity shares Returns on investment and servicing Financing activitiesof finance
Tax paid Taxation Operating activities
Purchase/proceeds from disposal of Acquisitions and disposals Investing activitiesassociated/subsidiary undertakings
Purchase/proceeds from disposal of Capital expenditure and Investing activitiesinvestment securities/fixed assets financial investment
Net change in loans and advances, Operating activities Investing activitiesincluding finance lease receivables
Net change in deposits Operating activities Financing activities
Net change in debt securities in issue Operating activities Financing activities
Short-term funding not Operating activities Financing activitiesincluded in cash
Under FRS 1, transactions designated as hedges are reported under the same heading as the related assets or liabilities.
In FRS 1, cash is defined as cash and balances at central banks and deposits repayable on demand with any qualifyingfinancial institution, less overdrafts from any qualifying financial institution repayable on demand. In SFAS No. 95 cash equivalentsare defined as short term, highly liquid investments that are both readily convertible to known amounts of cash and which werewithin three months of maturity when acquired.
The following table summarises the movement and composition of cash and cash equivalents under SFAS No. 95 for theyears ended September 30, 1999, 1998 and 1997:
Year ended September 301999 1998 1997£m £m £m
Cash and cash equivalents at October 1 ...................................................... 14,488 15,315 9,701Net cash (outflow)/inflow before adjustment for the effect of foreign exchange rate changes ......................................................................................... (1,529) (963) 5,759Effect of foreign exchange rate changes ...................................................... (71 ) 136 (145) Cash and cash equivalents at September 30.................................................. 12,888 14,488 15,315
Comprised of:Cash and balances at central banks ............................................................. 1,394 1,295 1,213Treasury bills and other eligible bills .......................................................... 176 549 541Loans to banks ....................................................................................... 7,471 8,368 10,286Debt securities ....................................................................................... 3,847 4,276 3,275
12,888 14,488 15,315
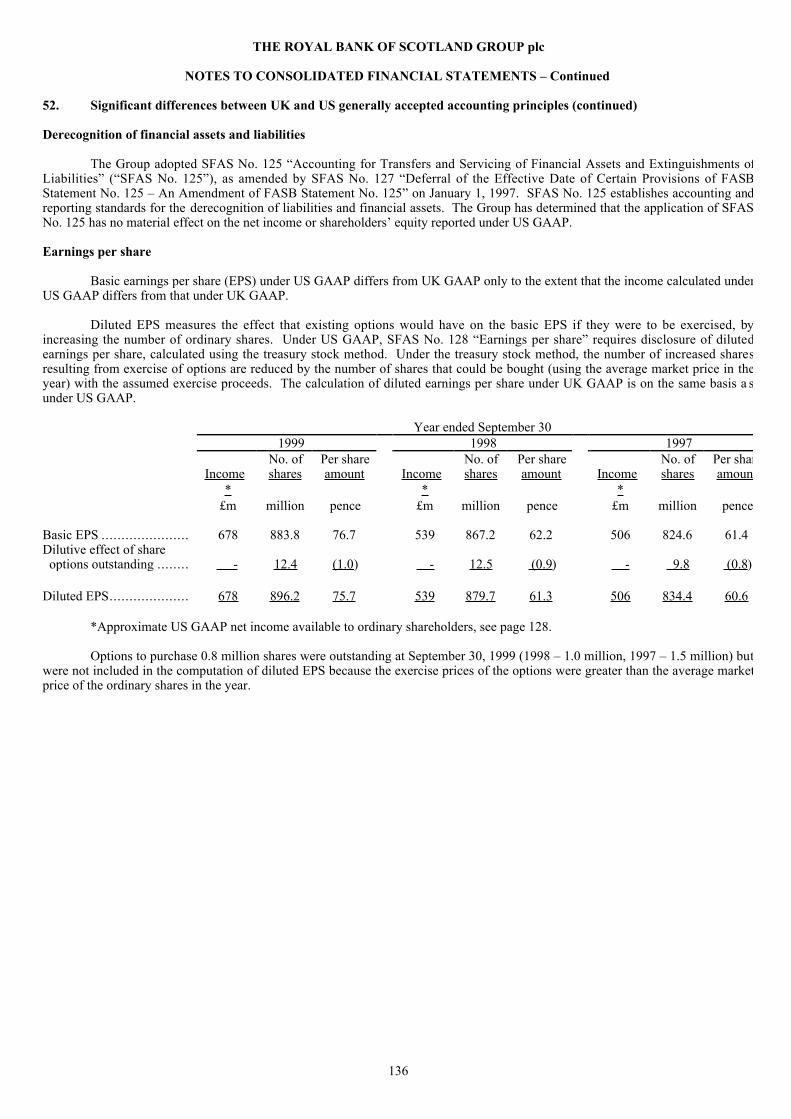
136
THE ROYAL BANK OF SCOTLAND GROUP plc
NOTES TO CONSOLIDATED FINANCIAL STATEMENTS Ð Continued
52. Significant differences between UK and US generally accepted accounting principles (continued)
Derecognition of financial assets and liabilities
The Group adopted SFAS No. 125 ÒAccounting for Transfers and Servicing of Financial Assets and Extinguishments ofLiabilitiesÓ (ÒSFAS No. 125Ó), as amended by SFAS No. 127 ÒDeferral of the Effective Date of Certain Provisions of FASBStatement No. 125 Ð An Amendment of FASB Statement No. 125Ó on January 1, 1997. SFAS No. 125 establishes accounting andreporting standards for the derecognition of liabilities and financial assets. The Group has determined that the application of SFASNo. 125 has no material effect on the net income or shareholdersÕ equity reported under US GAAP.
Earnings per share
Basic earnings per share (EPS) under US GAAP differs from UK GAAP only to the extent that the income calculated underUS GAAP differs from that under UK GAAP.
Diluted EPS measures the effect that existing options would have on the basic EPS if they were to be exercised, byincreasing the number of ordinary shares. Under US GAAP, SFAS No. 128 ÒEarnings per shareÓ requires disclosure of dilutedearnings per share, calculated using the treasury stock method. Under the treasury stock method, the number of increased sharesresulting from exercise of options are reduced by the number of shares that could be bought (using the average market price in theyear) with the assumed exercise proceeds. The calculation of diluted earnings per share under UK GAAP is on the same basis a sunder US GAAP.
Year ended September 30 1999 1998 1997
No. of Per share No. of Per share No. of Per sharIncome
*shares amount Income
*shares amount Income
*shares amoun
£m million pence £m million pence £m million pence
Basic EPS ...................... 678 883.8 76.7 539 867.2 62.2 506 824.6 61.4Dilutive effect of share options outstanding ........ - 12.4 (1.0 ) - 12.5 (0.9 ) - 9.8 (0.8 )
Diluted EPS.................... 678 896.2 75.7 539 879.7 61.3 506 834.4 60.6
*Approximate US GAAP net income available to ordinary shareholders, see page 128.
Options to purchase 0.8 million shares were outstanding at September 30, 1999 (1998 Ð 1.0 million, 1997 Ð 1.5 million) butwere not included in the computation of diluted EPS because the exercise prices of the options were greater than the average marketprice of the ordinary shares in the year.

137
THE ROYAL BANK OF SCOTLAND GROUP plc
NOTES TO CONSOLIDATED FINANCIAL STATEMENTS - Continued
Accounting for Income Taxes
Under SFAS No. 109, ÒAccounting for Income TaxesÓ, deferred tax balances should be calculated using the full provisionliability method, and a deferred tax asset may only be recognised if managementÕs judgement is that redemption of the deferred taxasset is more likely than not. The components of the net US GAAP deferred tax liability calculated in accordance with SFAS No.109 at September 30, 1999, 1998 and 1997, are summarised below:
September 301999 1998 1997
Deferred tax (assets)/liabilities arising from application of UK GAAP (see Note 31): £m £m £m
Short term timing differences ............................................................................ (100) (92) (93)Capital allowances on computers and other equipment ........................................... 46 47 57Capital allowances on lease receivables............................................................... 477 439 238Advance corporation tax recoverable .................................................................. - (39) (35)Deferred gains ................................................................................................ 42 40 23
465 395 190Additional deferred tax liabilities/(assets) arising from application of US GAAP:Debt securities and equity shares........................................................................ 83 97 140Short term timing differences ............................................................................ - - (5)Operating loss carry forwards ............................................................................ (16) (19) (12)Capital allowances on lease receivables............................................................... 138 137 101
205 215 224
Deferred tax assets arising from UK/US GAAP adjustments.................................... (61) (28) (25)Less: valuation allowance in relation to deferred tax assets...................................... 6 11 14Net deferred tax liabilities restated under US GAAP .............................................. 615 593 403
(i) The main components of the tax charge attributable to continuing operations are shown in Note 8 to the accounts.(ii) A reconciliation of tax payable at the UK standard corporation tax rate and the GroupÕs effective tax rate is shown on page 55.(iii) The valuation allowance relates primarily to unrelieved tax losses.
The tax charge of £361 million (1998 - £286 million, 1997 - £219 million) in the Consolidated Statement of Income includes£288 million (1998 - £208 million, 1997 - £136 million) for tax on UK activities and £73 million (1998 - £78 million, 1997 - £83million) on foreign activities. For UK and foreign activities respectively, income before tax was £940 million (1998 - £737 million,1997 - £503 million) and £271 million (1998 - £264 million, 1997 - £257 million).
Loan impairment
With effect from October 1, 1995, the Group adopted SFAS No. 114 ÒAccounting by Creditors for Impairment of a LoanÓand the subsequent amendment SFAS No. 118 ÒAccounting by Creditors for Impairment of a Loan - Income Recognition andDisclosuresÓ for US GAAP purposes. SFAS No. 114 applies to impaired loans only. Under SFAS No. 114, a loan is consideredimpaired, based on current information and events, if it is probable that a creditor will be unable to collect the scheduled payments ofprincipal or interest when due according to the contractual terms of the loan agreement. The measurement of impaired loans isprimarily based on the present value of expected future cash flows discounted at the loanÕs effective interest rate, except forcollateral dependent loans where impairment is based on the fair value of the collateral. Smaller balance homogeneous consumerloans, (credit card advances, residential mortgages, consumer instalment loans, overdrafts), that are collectively evaluated forimpairment, leases and debt securities are outside the scope of SFAS No. 114.
In accordance with SFAS No. 114 the GroupÕs total impaired loans are those reported as non-performing on page 18 of thisReport, less impaired loans outside the scope of SFAS No. 114, and amount to £665 million at September 30, 1999 (September 30 ,1998 - £726 million). Provisions for loan losses of £254 million (September 30, 1998 - £258 million), estimated in accordance withSFAS No. 114 were held against these loans. The average level for such impaired loans for the year to September 30, 1999 wasapproximately £696 million (year ended September 30, 1998 - £630 million). Having compared the value of the impaired loanportfolio calculated in accordance with SFAS No. 114 with the carrying value under UK GAAP, the Group has determined that noadjustment to net income or shareholdersÕ funds as stated in accordance with US GAAP is required. Estimated interest incomewhich was recognised in the year ended September 30, 1999, on impaired loans within the scope of SFAS No. 114 wasapproximately £10million, (year ended September 30, 1998 - £16 million, year ended September 30, 1997 - £1 million).
Asset impairment
With effect from October 1, 1995, the Group adopted for US GAAP purposes SFAS No. 121 ÒAccounting for theImpairment of Long-Lived Assets and for Long-Lived Assets to be Disposed ofÓ. SFAS No. 121 requires that long-lived assets andcertain identifiable intangibles which are identified as impaired should be written down to their realisable value and any loss againsttheir book value recognised in the current periodÕs statement of income. The Group has not identified any impaired assets in the yearto September 30, 1999.

138
THE ROYAL BANK OF SCOTLAND GROUP plc
NOTES TO CONSOLIDATED FINANCIAL STATEMENTS - Continued
52. Significant differences between UK and US generally accepted accounting principles (continued)
Stock-based compensation costs
The Group grants share options to executive officers under an executive share option scheme (the Òexecutive planÓ) and toemployees under a savings-related sharesave scheme (the Òsavings planÓ). Options granted under the executive plan are issued on aUK Inland Revenue approved or unapproved basis. Approved options are issued at market price and are exercisable between thethird and tenth anniversaries of the grant date. Options granted on an unapproved basis are exercisable only if performance criteriaare met. For options granted from 1996 to 1998 the criteria is that for the average growth in adjusted earnings per ordinary share toexceed the average increase in the UK Retail Prices Index by 2% per annum over a three year period. For options granted in 1999the relevant percentage has been increased to 3% per annum. Under the savings plan, eligible employees can elect to exercise theiroptions either three, five or seven years after the grant date. See Note 5 to the Consolidated Financial Statements for a description ofthe options granted under these schemes.
The number of options authorised to be granted is currently limited to 10% of issued ordinary share capital over a 10 yearperiod (or 5% over a 5 year period).
A summary of the changes in outstanding options under the executive plan and the savings plan for the three years endedSeptember 30, 1999, is provided on pages 86 and 87.
If the compensation cost for the two plans had been determined based on the fair value at the grant dates consistent with themethod encouraged by SFAS 123, net income and earnings per share would have been as shown on a pro forma basis below:
Year ended September 301999 1998 1997£m £m £m
Net income under US GAAP:As reported............................................................................................... 678 539 506Proforma.................................................................................................. 661 523 495
Earnings per share under US GAAP:As reported............................................................................................... 75.7p 61.3p 60.6pProforma.................................................................................................. 73.8p 59.5p 59.3p
The fair value of each option has been estimated as at the grant date using the Black-Scholes option pricing model using thefollowing assumptions for 1999, 1998 and 1997.
1999 1998 1997
Risk free interest rate.................................................................. 5.4% 6.0% - 6.6% 7.0% - 7.5%Dividend growth, based solely upon historic average growth ............. 3.7% 3.0% - 3.5% 3.5%Volatility based on historic data ................................................... 29% 25% 26%Expected lives of options granted under:Employee sharesave scheme ........................................................ 3, 5 and 7 years 3, 5 and 7 years 3, 5 and 7 yearsExecutive share option scheme..................................................... 3 to 10 years 3 to 10 years 3 to 10 years
The following table summarises fair values of options as at September 30, 1999 and September 30, 1998:
September 30, 1999 September 30, 1998 September 30, 1997Exercise Fair Exercise Fair Exercise Fair
price value Life price value Life price value Life£ £ Years £ £ Years £ £ Years
Executive plan (1)....... 12.05 2.88 3-10 10.065 2.67 3-10 6.01 1.35 3-10Savings plan 3 year ..................... 10.85 3.71 3 7.99 3.29 3 4.97 1.45 3 5 year ..................... 10.85 4.10 5 7.99 3.63 5 4.97 1.74 5 7 year ..................... 10.85 4.30 7 7.99 3.86 7 4.97 1.95 7
(1) For the purposes of calculating a fair value on executive plan options, an option life of 5 years, being the mid-point on the 10year option, has been assumed. Historical exercise trends have not been used as these are not felt indicative of future trends givenchanges to the scheme rules and participants in the scheme.

139
THE ROYAL BANK OF SCOTLAND GROUP plc
NOTES TO CONSOLIDATED FINANCIAL STATEMENTS - Continued
Fair values of financial instruments
SFAS No. 107, ÒDisclosures about Fair Value of Financial InstrumentsÓ (ÒSFAS No. 107Ó), requires disclosure of theestimated fair value of certain of the GroupÕs financial instruments. Financial instruments include items such as loans, deposits,securities, borrowings, commitments to lend and other items as defined in SFAS No. 107.
SFAS No. 107 does not require disclosures about fair value information for items that do not meet the definition of afinancial instrument or certain other financial instruments specifically excluded from its requirements. Further, SFAS No. 107 doesnot attempt to value future income or business. These items are material and accordingly, the fair value information presented doesnot purport to represent, nor should it be construed to represent, the underlying value of the Group as a going concern at September30, 1999.
The fair value information required by SFAS No. 107 and the methods of valuation prescribed by the standard are the sameas those required under UK Financial Reporting Standard No. 13 ÒDerivatives and other Financial Instruments: DisclosuresÓ (ÒFRS13Ó). Details of fair values calculated in accordance with FRS 13 are provided in note 40 on page 116.
Contingent liabilities and commitments
For contingent liabilities such as acceptance facilities and guarantees and for other credit related commitments, managementbelieve that, due to the diversity of the various fee structures, the absence of an established market and the difficulty of separating thevalue of such instruments from the overall value of the customer relationships, it is not meaningful to provide an estimate of theirfair value.

140
THE ROYAL BANK OF SCOTLAND GROUP plc
NOTES TO CONSOLIDATED FINANCIAL STATEMENTS - Continued
52. Significant differences between UK and US generally accepted accounting principles (continued)
Debt and equity securities
Under SFAS No. 115 ÒAccounting for Certain Investments in Debt and Equity SecuritiesÓ, securities are classified as eitherheld-to-maturity, available for sale or trading. Under UK GAAP securities are classified as either trading securities or investmentsecurities. Held-to-maturity securities and investment securities are reported at amortised cost. Trading securities are reported at fairvalue, with unrealised gains and losses included in earnings. Securities which are available for sale are reported at fair value, withunrealised gains and losses excluded from earnings and reported in a separate component of shareholdersÕ equity. For the purposesof US GAAP all investment securities are classified as available for sale and other securities are classified as trading securities.
The following table shows these classifications under UK and US GAAP at September 30, 1999 and 1998, respectively:
September 30, 1999 September 30, 1998UK GAAP US GAAP UK GAAP US GAAP
£m £m £m £m
Trading securities .......................................................................... 5,248 5,250 5,405 5,430Available for sale securities ............................................................. - 11,331 - 8,547Investment securities ...................................................................... 11,054 - 8,226 -
16,302 16,581 13,631Ê 13,977
The following tables show the amortised cost and estimated fair value of debt and equity securities at September 30, 1999and 1998:
September 30, 1999Gross Gross
Amortised unrealised unrealised Faircost gains losses value
Available for sale debt and equity securities at September 30, 1999 £m £m £m £m
British government securities ........................................................... 600 - (7) 593US Treasury and other US government securities................................. 2,240 1 (73) 2,168Other government securities............................................................. 48 1 - 49Securities issued by states of the United States .................................... 90 1 - 91Other public sector bodies ............................................................... 17 - (1) 16Corporate debt securities ................................................................. 2,690 1 (30) 2,661Mortgage-backed securities ............................................................. 2,262 - (80) 2,182Bank and building society ............................................................... 1,623 7 (3) 1,627Other securities ............................................................................. 680 - - 680Debt securities .............................................................................. 10,250 11 (194) 10,067Equity securities ............................................................................ 804 460 - 1,264Total available for sale securities ...................................................... 11,054 471 (194 ) 11,331
September 30, 1998Gross Gross
Amortised unrealised unrealised Faircost gains losses value
Available for sale debt and equity securities at September 30, 1998 £m £m £m £m
British government securities ........................................................... 550 - - 550US Treasury and other US government securities................................. 2,251 42 (1) 2,292Other government securities............................................................. 21 - (1) 20Securities issued by states of the United States .................................... 87 4 - 91Other public sector bodies ............................................................... 22 - - 22Corporate debt securities ................................................................. 2,033 5 (19) 2,019Mortgage-backed securities ............................................................. 999 9 (1) 1,007Bank and building society ............................................................... 1,286 95 (2) 1,379Other securities ............................................................................. 211 ÊÊÊÊÊ- ÊÊÊÊÊ- 211Debt securities .............................................................................. 7,460 155 (24) 7,591Equity securities ............................................................................ ÊÊÊÊ766Ê 222 (32) ÊÊÊÊ956ÊTotal available for sale securities ...................................................... ÊÊ8,226Ê 377 Ê(56) Ê8,547Ê

141
THE ROYAL BANK OF SCOTLAND GROUP plc
NOTES TO CONSOLIDATED FINANCIAL STATEMENTS - Continued
The amortised cost and estimated fair value of available for sale debt securities at September 30, 1999 and 1998 bycontractual maturities are shown below. Expected maturities may differ from contractual maturities because borrowers may have theright to call or prepay obligations with or without call or prepayment penalties.
September 30, 1999 September 30, 1998Amortised Estimated Amortised Estimated
cost fair value cost fair valueAvailable for sale debt securities £m £m £m £m
Due in 1 year or less................................................................... 1,516 1,517 1,484 1,546Due after 1 year but within 5 years ................................................ 3,113 3,094 3,435 3,479Due after 5 years but within 10 years ............................................. 2,182 2,110 1,080 1,097Due after 10 years...................................................................... 1,177 1,164 462 462
7,988 7,885 6,461 6,584Mortgage-backed securities ......................................................... 2,262 2,182 999 1,007Total debt securities ................................................................... 10,250 10,067 7,460 7,591
The following table categorises the GroupÕs investment debt securities by maturity and yield (based on weighted averages)at September 30, 1999:
After 1 but After 5 butWithin 1 year within 5 years within 10 years After 10 years Total
Amount Yield Amount Yield Amount Yield Amount Yield Amount YieldAvailable for sale debt securities £m % £m % £m % £m % £m %
British government securities .............. 5 9.0 595 7.9 - - - - 600 7.9US Treasury and other US Government securities...................... 36 6.1 389 6.2 1,815 6.4 - - 2,240 6.4Other government securities................ 2 8.0 46 5.8 - - - - 48 5.9Securities issued by states of the United States................................... - - 5 5.3 68 5.0 17 4.8 90 5.0Mortgage-backed securities ................ 123 7.2 395 6.6 1,529 6.4 215 6.1 2,262 6.5Other public sector bodies .................. - - 8 6.1 9 5.7 - - 17 5.9Corporate debt securities .................... 270 5.6 1,116 4.8 257 5.5 1,047 5.9 2,690 5.4Bank and building society .................. 1,015 7.2 545 5.3 33 5.2 30 5.7 1,623 6.5Other securities ................................ 188 3.5 409 6.2 - - 83 2.7 680 5.0Total .............................................. 1,639 6.5 3,508 5.9 3,711 6.3 1,392 5.7 10,250 6.1
The weighted average yield for each range of securities is calculated by dividing the annualised interest income prevailingat September 30, 1999, by the book value of securities held at that date.
Year ended September 301999 1998 1997
Sales of available for sale securities £m £m £m
Gross proceeds from sales ........................................................................... 3,844 3,583 6,105Gross realised losses on sales ....................................................................... 5 2 3Gross realised gains on sales ........................................................................ (27 ) (14) (14 )Amortised cost of sales ............................................................................... 3,822 3,571 6,094
At September 30, 1999, the unrealised gain in available for sale securities was £277 million (September 30, 1998 - £322million, September 30, 1997 - £453 million). The unrealised gains have been included as a separate component within thereconciliation of shareholdersÕ equity under UK GAAP to US GAAP on page 128 of this Report.
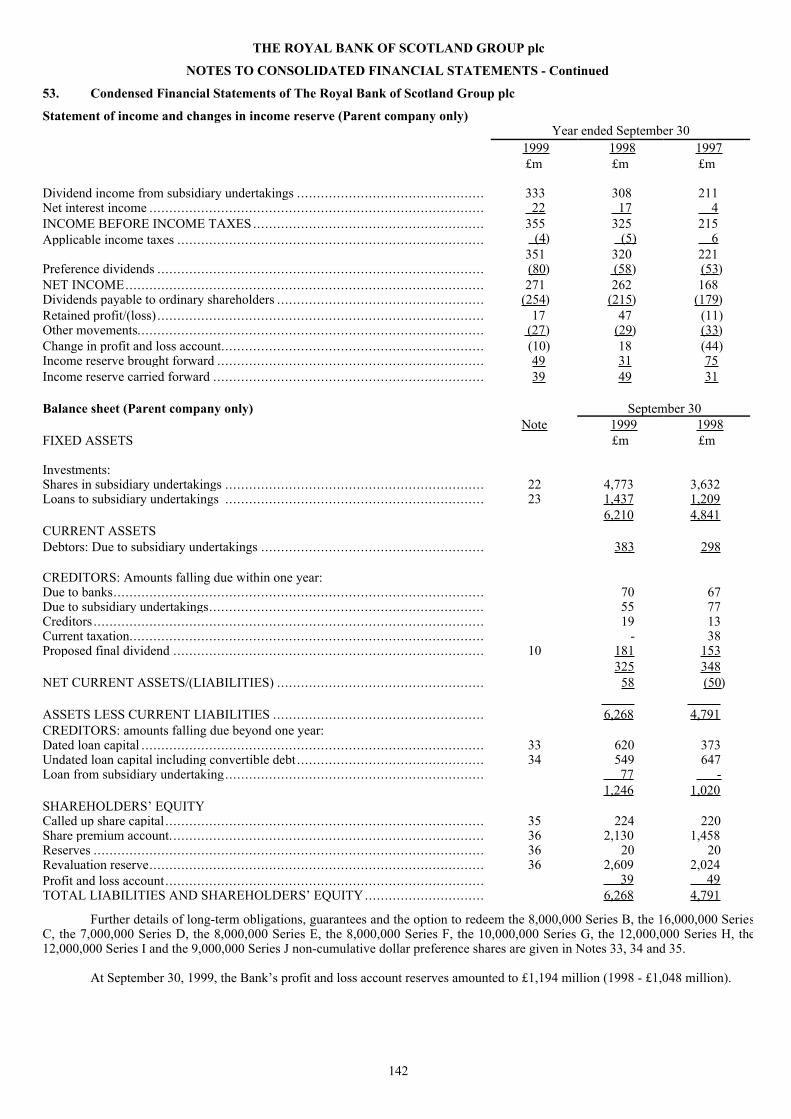
142
THE ROYAL BANK OF SCOTLAND GROUP plc
NOTES TO CONSOLIDATED FINANCIAL STATEMENTS - Continued
53. Condensed Financial Statements of The Royal Bank of Scotland Group plc
Statement of income and changes in income reserve (Parent company only)YearÊendedÊSeptemberÊ30
1999 1998 1997£m £m £m
Dividend income from subsidiary undertakings ............................................... 333 308 211Net interest income .................................................................................... 22 17 4INCOME BEFORE INCOME TAXES .......................................................... 355 325 215Applicable income taxes ............................................................................. (4 ) (5) 6
351 320 221Preference dividends .................................................................................. (80 ) (58 ) (53 )NET INCOME.......................................................................................... 271 262 168Dividends payable to ordinary shareholders .................................................... (254 ) (215 ) (179 )Retained profit/(loss) .................................................................................. 17 47 (11)Other movements....................................................................................... Ê(27 ) (29 ) (33 )Change in profit and loss account.................................................................. (10) 18 (44)Income reserve brought forward ................................................................... 49 31 75Income reserve carried forward .................................................................... 39 49 31
Balance sheet (Parent company only) SeptemberÊ30Note 1999 1998
FIXED ASSETS £m £m
Investments:Shares in subsidiary undertakings ................................................................. 22 4,773 3,632Loans to subsidiary undertakings ................................................................. 23 1,437 1,209
6,210 4,841CURRENT ASSETSDebtors: Due to subsidiary undertakings ........................................................ 383 298
CREDITORS: Amounts falling due within one year:Due to banks............................................................................................. 70 67Due to subsidiary undertakings..................................................................... 55 77Creditors .................................................................................................. 19 13Current taxation......................................................................................... - 38Proposed final dividend .............................................................................. 10 181 153
325 348NET CURRENT ASSETS/(LIABILITIES) .................................................... 58 (50 )
ÊÊÊÊÊÊÊÊ ÊÊÊÊÊÊÊÊASSETS LESS CURRENT LIABILITIES ..................................................... 6,268 4,791CREDITORS: amounts falling due beyond one year:Dated loan capital ...................................................................................... 33 620 373Undated loan capital including convertible debt ............................................... 34 549 647Loan from subsidiary undertaking................................................................. 77 -
1,246 1,020SHAREHOLDERSÕ EQUITYCalled up share capital ................................................................................ 35 224 220Share premium account............................................................................... 36 2,130 1,458Reserves .................................................................................................. 36 20 20Revaluation reserve.................................................................................... 36 2,609 2,024Profit and loss account................................................................................ 39 49TOTAL LIABILITIES AND SHAREHOLDERSÕ EQUITY.............................. 6,268 4,791
Further details of long-term obligations, guarantees and the option to redeem the 8,000,000 Series B, the 16,000,000 SeriesC, the 7,000,000 Series D, the 8,000,000 Series E, the 8,000,000 Series F, the 10,000,000 Series G, the 12,000,000 Series H, the12,000,000 Series I and the 9,000,000 Series J non-cumulative dollar preference shares are given in Notes 33, 34 and 35.
At September 30, 1999, the BankÕs profit and loss account reserves amounted to £1,194 million (1998 - £1,048 million).

143
Signatures
Pursuant to the requirements of Section 12 of the Securities Exchange Act of 1934, the registrant certifies that it meets all of therequirements for filing on Form 20-F and has duly caused this annual report to be signed on its behalf by the undersigned, thereuntoduly authorised.
The Royal Bank of Scotland Group plcRegistrant
FRED GOODWIN................................................Deputy Group Chief Executive
December 17, 1999
