the role of skills in recession and recovery by chris humphries
TRANSCRIPT

UK COMMISSION FOREMPLOYMENT AND SKILLS
The Role of Skills in Recession – and Recovery
CIPD/ACAS ConferenceLondon11 June 2009
Chris Humphries CBEChief ExecutiveUK Commission for Employment and Skills

2
UK COMMISSION FOREMPLOYMENT AND SKILLS
Skills matter to earnings
21 24 27 30 33 36 39 42 45 48 51 54 57AGE
Source: Cabinet Office, Getting On, Getting Ahead: A Discussion Paper: Analysing the Trends and Drivers of Social Mobility, 2008
Gross median annual earnings (£) by age for men, disaggregated by skill level, 1994–2006
Gro
ss e
arn
ing
s (£
000s
)

3
UK COMMISSION FOREMPLOYMENT AND SKILLS
Skills matter to employment status
Source: ONS, Labour Force Survey 2008

4
UK COMMISSION FOREMPLOYMENT AND SKILLS
Skills matter to occupational choice
Source: ONS, Labour Force Survey 2008

5
UK COMMISSION FOREMPLOYMENT AND SKILLS
Skills - the most damaging disadvantage?
The Low Skilled experience low and declining employment rates – the only disadvantaged group to do so
Source: UKCES, Ambition 2020: World Class Skills and Jobs for the UK, 2009, Chart 1.5, p 29 – DWP using Labour Force Survey

6
UK COMMISSION FOREMPLOYMENT AND SKILLS
The current recession:Who’s lost their job?
Flows into unemployment April 08 – April 09 ‘In-flows’
Numbers % of total
Managers and Senior Officials 193,985 5%
Professional Occupations 133,980 4%
Associate Professional and Technical 251,165 7%
Administrative and Secretarial 439,810 12%
Skilled Trades 500,615 13%
Personal Service 187,630 5%
Sales and Customer Service 598,725 16%
Process, Plant and Machine Operatives 427,845 11%
Elementary Occupations 1,039,050 28%
Total 3,772,805
Source: NOMIS, and Oxford Economics, May 2009

7
UK COMMISSION FOREMPLOYMENT AND SKILLS
Changing pattern of unemployment:April 2008 – April 2009
Source: The Guardian, 12 May 209 - http://www.guardian.co.uk/business/interactive/2009/jan/21/unemployment-map

8
UK COMMISSION FOREMPLOYMENT AND SKILLS
Pe
rce
nta
ge
in
em
plo
ym
en
t w
ith
Le
ve
l 4
sk
ills
an
d a
bo
ve
Percentage in employment with Level 2 skills or below
Source: UKCES, Ambition 2020: World Class Skills and Jobs for the UK, 2009, Chart 2.1 – ONS Population Survey, Jan-Dec 2007
Percentage of working age population in employment by qualifications level
252729313335373941434525.0
30.0
35.0
40.0
45.0
50.0
UK
Scotland
Wales
Northern Ireland
London
South East
South WestEast Midlands
West MidlandsEast of England
Yorkshire & Humber
North East
North West
UK national/regional skills variations

9
UK COMMISSION FOREMPLOYMENT AND SKILLS
The UK Qualifications Profile 1997-2007:Good progress over last decade!
UK QualificationAchievements
1997 2007 1997-2007 Change
1997 – 2007 % Nos (‘000s)
% Nos (‘000s)
% Nos (‘000s)
Level 5 3 1087 7 2274 110 +1187
Level 4 18 6101 24 8060 32 +1959
Level 3 18 5999 20 6738 12 +739
Level 2 21 6865 20 6912 1 +47
Below Level 2 21 7074 17 6019 -15 -1055
No Qualifications 18 5920 12 4351 -26 -1569
+44%
-26%
Source: Labour Force Survey, 2008 – Note: Working age population 19 – 59/64
10
UK COMMISSION FOREMPLOYMENT AND SKILLS
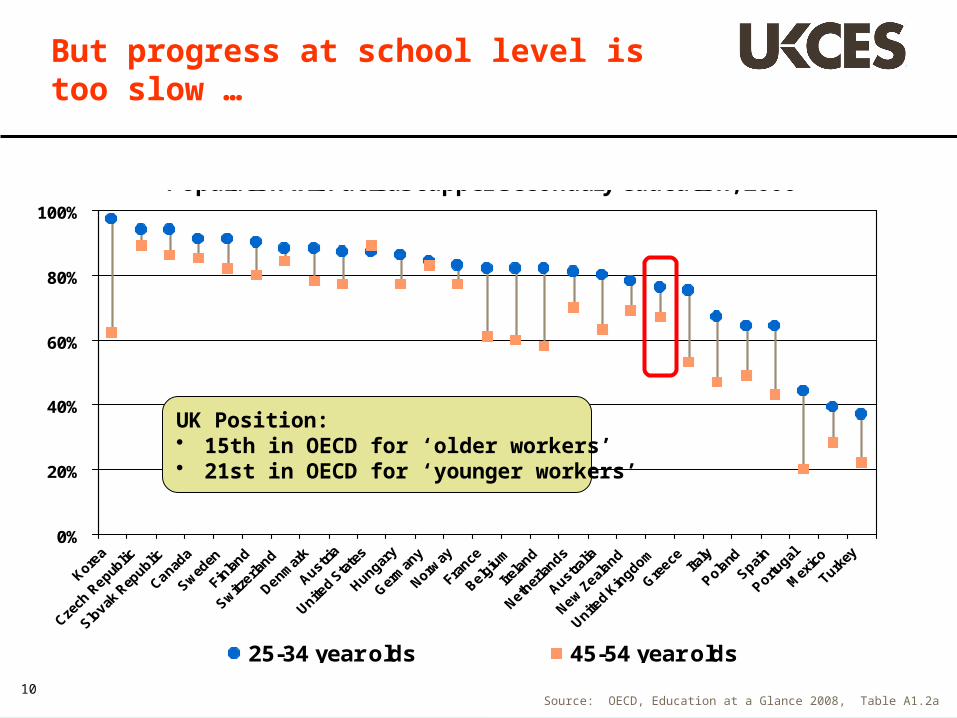
0%
20%
40%
60%
80%
100%
25-34 year olds 45-54 year olds
Population with at least upper secondary education, 2006
UK Position:• 15th in OECD for ‘older workers’• 21st in OECD for ‘younger workers’
Source: OECD, Education at a Glance 2008, Table A1.2a
But progress at school level is too slow …
11
UK COMMISSION FOREMPLOYMENT AND SKILLS
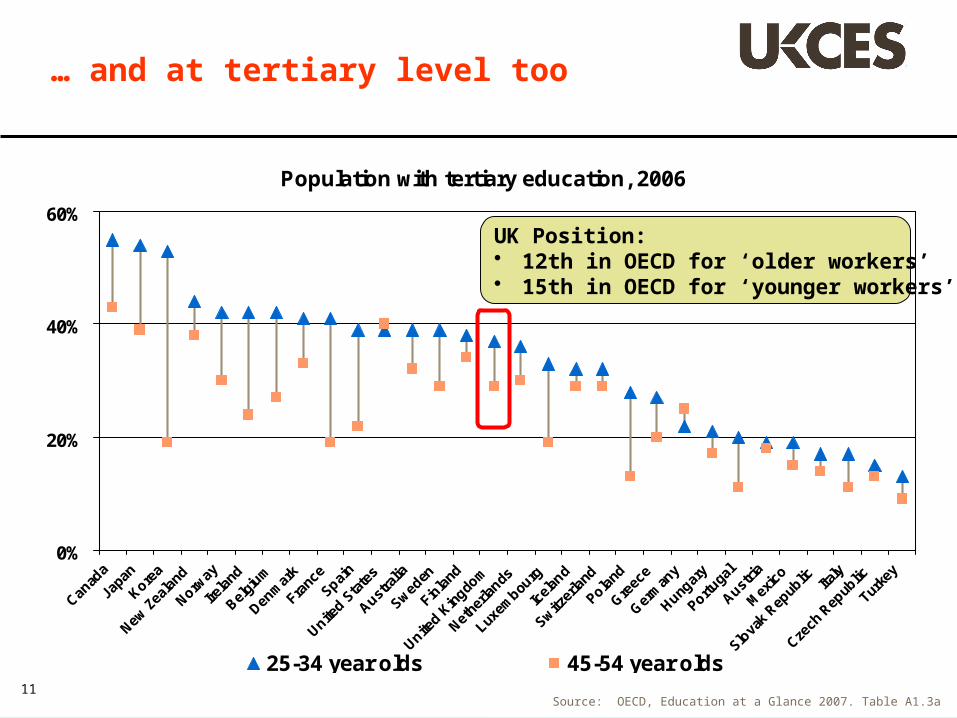
Population with tertiary education, 2006
0%
20%
40%
60%
Canad
a
Japa
n
Korea
New Z
eala
nd
Norway
Irela
nd
Belgi
um
Denm
ark
Franc
e
Spain
United S
tate
s
Austra
lia
Sweden
Finla
nd
United K
ingdo
m
Nethe
rlands
Luxem
bourg
Icela
nd
Switzer
land
Poland
Greec
e
Germ
any
Hungar
y
Portuga
l
Austria
Mex
ico
Slova
k Rep
ublic Ita
ly
Czech
Rep
ublic
Turke
y
25-34 year olds 45-54 year olds
… and at tertiary level too
Source: OECD, Education at a Glance 2007. Table A1.3a
UK Position:• 12th in OECD for ‘older workers’• 15th in OECD for ‘younger workers’

12
UK COMMISSION FOREMPLOYMENT AND SKILLS
Typical UK behaviour in recession:1990-1992
• Employer training budgets were among the first cuts
• Redundancy was length of service based, not skills based
• Government training was ‘shotgun’, not targeted
• Recession was long and deep – first ‘white collar’ recession
• Companies that didn’t train were 2.5 times more likely to fail
• Long term unemployment exceeded 1 million for first time
• Recovery was slow – and led to severe skills shortages
13
UK COMMISSION FOREMPLOYMENT AND SKILLS
Is this recession different?
The evidence strongly suggests:• Employer training budgets much more protected
– In some sectors, 80% plus protecting/increasing training budgets
• Staff retention based upon skills needed for recovery– Companies recognise that their people are their best hope
• Government training more targeted on skills for recovery– We understand more about skills for employability and success
Some personal predictions:• The recession will be deep but shorter than feared
– 2 months of +ve growth (NIESR), house prices, optimism returning• Unemployment will not reach 3 million• Unemployment will recover more quickly• Skills shortages will be much less severe

14
UK COMMISSION FOREMPLOYMENT AND SKILLS
Conclusion
“The skills of our people are our best guarantee of future
prosperity – and the best investment an employer can make in challenging times.”
UK Commission for Employment and Skills, November 2008
The UK is learning – and learning pays!