the role of sediment in controlling steady-state bedrock channel...
TRANSCRIPT

The Role of Sediment in Controlling
Steady-State Bedrock Channel Slope:
Implications of the Saltation-Abrasion Incision Model
Leonard S. Sklar1 and William E. Dietrich
2
1 Department of Geosciences, San Francisco State University
San Francisco, California, 94132, USA
2 Department of Earth and Planetary Science, University of California
Berkeley, California, 94720, USA
Submitted to: Geomorphology
April, 2004
Corresponding author:
L.S. Sklar
Department of Geosciences
San Francisco State University
1600 Holloway Avenue
San Francisco, CA 94132
Tel: (415) 338-1204
Fax: (415) 338-7705
Email: [email protected]
9 Figures
1 Table
Word count
Abstract: 382
Main text: 13087
Notation: 538
References: 1055
Figure captions: 672

2
Abstract
The saltation-abrasion model is a mechanistic model for river incision into
bedrock by saltating bedload, which we have previously derived and used experimental
data to constrain all parameter values. Here we develop a method for applying the
saltation-abrasion model at a landscape scale, use the model as a reference for evaluating
the behavior of a wide range of alternative incision models, in order to consider the
implications of the saltation-abrasion model, as well as other models, for predicting
topographic steady-state channel slope. To determine the single-valued discharge that
best represents the effects of the full discharge distribution in transporting sediment and
wearing bedrock, we assume all runoff can be partitioned between a low-flow and a high-
flow discharge, in which all bedload sediment transport occurs during high flow. We
then use the gauged discharge record and measurements of channel characteristics at a
reference field site and find that the optimum discharge has a moderate magnitude and
frequency, due to the constraints of the threshold of grain motion and bed alluviation by
high relative sediment supply. Incision models can be classified according to which of
the effects of sediment on bedrock incision are accounted for. Using the predictions of
the saltation-abrasion model as a reference, we find that the threshold of motion is the
most important effect that should be represented explicitly, followed in order of
decreasing importance by the cover effect, the tools effect and the threshold of
suspension effect. Models that lack the threshold of motion over-predict incision rate for
low shear stresses and under-predict the steady-state channel slope for low to moderate
rock uplift rates and rock strengths. Models that lack the cover effect over-predict
incision rate for high sediment supply rates, and fail to represent the degree of freedom in

3
slope adjustment provided by partial bed coverage. Models that lack the tools effect
over-predict incision rate for low sediment supply rates, and do not allow for the
possibility that incision rate can decline for increases in shear stress above a peak value.
Overall, the saltation-abrasion model predicts that steady-state channel slope is most
sensitive to changes in grain size, such that the effect of variations in rock uplift rate and
rock strength may affect slope indirectly through their possible, but as yet poorly
understood, influence on the size distribution of sediments delivered to channel networks
by hillslopes.
Keywords:
Rivers, erosion, sediment supply, grain size, magnitude-frequency, landscape evolution

4
1.0 INTRODUCTION
1.1 Motivation
One of the central problems in understanding the relief structure and topographic
texture of tectonically active landscapes is the question of what controls the slope of an
actively incising bedrock channel. Previous work over several decades has led to an
understanding of the dynamics of slope adjustment in alluvial channels (e.g. Mackin,
1948; Schumm, 1973; Bull, 1979; Snow and Slingerland, 1987), in which slope is
controlled by the long-term balance between sediment supply and sediment transport
capacity. Howard (1980) identified two distinct alluvial regimes based on the grain size
distribution of the sediment supply: a ‘active’ fine-bed regime in which the slope is set by
the total sediment supply, and a ‘threshold’ coarse-bed regime in which the slope is
controlled by the threshold of motion for the coarsest grain size supplied in amounts
sufficient to form a channel-spanning deposit. Early efforts to model landscape evolution
(e.g. Willgoose et al., 1991; Beaumont et al., 1992) treated channel incision and slope
adjustment as an essentially alluvial process. In contrast, fluvial incision and slope
adjustment are represented in the current generation of landscape evolution models (e.g.
Howard, 1994; Moglen and Bras, 1995; Tucker and Slingerland, 1996; Willett, 1999;
Bogaart et al., 2001) as controlled primarily by the rate of bedrock detachment, rather
than by the divergence of sediment transport. The rate of river incision into bedrock is
commonly assumed to scale with a flow intensity parameter, such as unit stream power,
average boundary shear stress, or the boundary shear stress in excess of a detachment
threshold. For these ‘detachment limited’ models, the dominant influences on predicted

5
channel slope are rock resistance, drainage area (a surrogate for discharge), and rates and
spatial patterns of rock uplift, rather than sediment supply or grain size characteristics.
Sediment supply and grain size should strongly influence rates of bedrock
incision, however, as we have recently shown through both experimental (Sklar and
Dietrich, 2001) and theoretical (Sklar and Dietrich, 1998; in press) studies. In particular,
sediment supplies tools that abrade exposed bedrock, but which can also inhibit incision
by forming transient deposits that limit the extent of bedrock exposure in the channel bed.
Moreover, grain size strongly influences the erosional efficiency of individual abrasive
impacts as well as the minimum shear stress needed to prevent complete alluviation of
the channel bed. Thus, the controls on the slope of a channel actively incising into
bedrock are likely to include elements drawn from alluvial models (sediment supply,
grain size and transport capacity) as well as from detachment-limited models (rock
strength, flow intensity, tectonic boundary conditions).
Here we explore the controls on bedrock channel slope using a mechanistic model
for river incision into bedrock by saltating bedload (Sklar and Dietrich, in press), in
which the dynamics of bedload sediment transport and bedrock detachment by abrasion
are directly coupled. We address three distinct issues that arise in considering the
implications of the ‘saltation-abrasion’ model for river longitudinal form.
We begin with the challenge of scaling up a model that was derived at the
temporal and spatial scale of individual bedload saltation events to the scale at which
landscapes evolve. In particular, we develop a new method for determining the
magnitude and frequency of the discharge and sediment supply that can represent the
integrated effect of the full distribution of flow events that are responsible for eroding
6
bedrock over geomorphic time. Next we compare the saltation-abrasion model with
other proposed bedrock incision models, to illustrate the importance of representing the
effects of sediment supply and grain size explicitly, and to evaluate the extent to which
other models capture those effects. Finally, we consider the implications of the saltation-
abrasion model for understanding what controls the slope of a river channel for the
limited but illustrative case when the landscape is in topographic steady state. In
particular, we contrast the predictions of several models for the variation in steady-state
channel slope with rock uplift rate, rock strength, and the magnitude and duration of the
representative erosive flow event. Because profile relief and concavity are directly
related to the integral and derivative of local channel slope with downstream distance,
this analysis provides a foundation for understanding the implications of the model for
longitudinal profile form.
1.2 Model overview
The saltation-abrasion model is based on the idea that incision rate can be treated
as the product of three terms: the average volume of rock removed by an individual
bedload impact, the impact rate per unit time per unit bed area, and the fraction of the bed
not armored by transient deposits of alluvium (Sklar and Dietrich, 1998). We used
several fundamental theoretical and experimental findings to derive expressions for each
of these terms, including: (1) wear is proportional to the flux of impact kinetic energy
normal to the bed; (2) bedload saltation trajectories can be represented as power functions
of non-dimensional excess shear stress; (3) rock resistance to bedload abrasion scales
with the square of rock tensile strength; and (4) the assumption that bed cover depends

7
linearly on the ratio of sediment supply to sediment transport capacity (Sklar and
Dietrich, in press). The predicted instantaneous rate of bedrock incision Ei can be
expressed as
Ei =0.08RbgY
kv T2 Qs
*
c* 1
1/ 2
1Qs
Qc
1
u*
w f
2
3 / 2
(1)
where Rb is the non-dimensional buoyant density [Rb = ( s – w)/ w], g is the
gravitational acceleration, Y is the rock modulus of elasticity, is the rock tensile
strength, kv is a non-dimensional rock resistance parameter (experiments indicate that kv ~
1012
; Sklar and Dietrich, in press), u* is the shear velocity [u
* = (gRhS)
1/2], wf is the grain
fall velocity in still water (calculated here using the algorithm of Dietrich, 1982), and Qs
is the mass sediment supply rate (all variables in S.I. units). In equation 1, * is the non-
dimensional shear stress
* = Rh S/RbDs (2)
where Rh is the hydraulic radius, S is the channel slope, Ds is the representative sediment
grain diameter, and c* is the value of
* at the threshold of sediment motion. Hydraulic
radius is solved for iteratively, assuming a rectangular channel cross-section [Rh =
HwW/(2Hw + W)], using the continuity equation [Qw = UwHwW] and the Manning
roughness relation

8
Uw =Rh2 / 3S1 /2
n(3)
where Hw is flow depth, Uw is mean flow velocity, W is channel width and n is the
Mannings roughness parameter. Bedload sediment transport capacity Qt is calculated
here using the Fernandez-Luque and van Beek (1976) expression
Qt = 5.7 sW (RbgDs3)1/ 2 *
c*( )3 / 2
(4).
The model is unique in three important respects. First, it predicts the rate of
bedrock incision by a single process, abrasion by saltating bedload, rather than lumping
the effects of many possible erosional mechanisms together in a single expression.
Second, because all the model parameters are independent of the model formulation, it
can be calibrated using laboratory experiments so that there are no freely adjustable
parameters. And third, because it is derived at the temporal and spatial scale at which the
erosional process occurs, it can be scaled up in space and time explicitly, so that, for
example, the role of the tradeoffs between magnitude and frequency in discharge and
sediment supply can be explored systematically.
2.0 Model application at the landscape scale
The saltation-abrasion model (Sklar and Dietrich, in press) was derived at the
temporal and spatial scale of individual bedload impacts, and predicts an instantaneous
bedrock erosion rate (Ei) for specific values of the seven input variables: channel width
(W), slope (S), discharge (Qw), coarse sediment supply rate (Qs), representative grain size

9
(Ds), rock strength ( T) and channel roughness (n). These values can be treated as
constant at a spatial scale of a channel reach, ignoring lateral variations in shear stress,
and at the temporal scale of several hours to a day. To apply the model in the field and to
explore the model implications for river longitudinal profile form and dynamics, the
model must be scaled up, in both time and space, by many orders of magnitude. The
spatial variables can be scaled using simple relationships of downstream hydraulic
geometry, while temporal scaling requires a method for integrating over the full range of
discharges and sediment supply events that the channel will experience.
Although bridging the gap in scale between the mechanistic derivation and the
landscape application requires the introduction of several additional parameters, the
physical meaning of these parameters can be explicit. Maintaining a quantitative link to
the scale of individual erosive events allows us to be mechanistically consistent and
observe the limitations imposed by the fundamental scales of the problem (Dietrich and
Montgomery, 1998). For example, the model assumptions are violated if the grain
diameter is greater than the flow depth, or if the flow is not hydraulically rough (i.e.
particle Reynolds number Rep = su*Ds /µ < 100).
To help ground the scaling up of the model in physical reality, we use the device
of a reference site, an actively incising mixed bedrock-alluvial bedded reach of the South
Fork Eel River in Northern California (Seidl and Dietrich, 1992; Howard, 1998; Sklar
and Dietrich, in press). We use gauge records of discharge, knowledge of rates of
tectonic forcing, and measurements of channel geometry, grain size, rock strength and
extent of bedrock exposure, to test whether the model predictions are consistent with the
field setting. The reference site is also useful as an anchor point in appreciating how

10
widely we vary the value of input variables in the sections below where we compare
various bedrock incision models and explore the controls on channel slope. Table 3 in the
Sklar and Dietrich (in press) lists the relevant characteristics of the South Fork Eel River
reference site.
2.1 Spatial scaling from reach to longitudinal profile
For modeling purposes, a river profile can be represented as a series of reaches of
uniform width, slope and rock strength, each with a corresponding upstream drainage
area (A). For simplicity, we treat channel roughness as constant throughout the profile,
although roughness may in fact vary systematically with channel slope and grain size
(e.g. Bathurst, 1993). Discharge for a given recurrence interval (Qw) is assumed to vary
with drainage area as a power function
Qw = bAp
(5)
where the exponent p captures the spatial variation in precipitation due to orographic or
other effects. Channel width is assumed to vary as a power function of some
geomorphically significant discharge
W = cQwf
(6)
such that width can be parameterized in terms of drainage area

11
W = cbf A
ef(7).
In all the calculations to follow we treat width as constant for a given drainage area,
consistent with the assumption of a confined bedrock gorge with a rectangular channel
cross-section, lacking any floodplain. Drainage area is parameterized as a function of
distance downstream of the channel head (x)
A = Ao + d xh
(8)
where Ao is the drainage area upstream of the channel head, d is a dimensional coefficient
and the exponent h captures the variation in drainage area shape. Note that this
formulation ignores the abrupt changes in drainage area that occur at tributary junctions.
The commonly observed downstream fining of grain size is typically treated as an
exponential function (e.g. Morris and Williams, 1999), however, many field studies have
found good agreement with a power law fining relation (e.g. Brush, 1961; Brierly and
Hickin, 1985; Ohmori, 1991). For consistency with the other spatial scaling relations we
therefore model the downstream variation in representative grain diameter of the bedload
size class as a power function of downstream distance
Ds = Do (x + xo)-
(9)
where Do is the grain size at the channel head and xo is the unchanneled distance from the
drainage divide to the channel head. Downstream changes in lithology can be

12
represented by continuous or abrupt variation in rock tensile strength; in all calculations
below we treat rock strength as uniform along the length of the profile.
Assuming that hillslope erosion rates closely track changes in rates of incision of
neighboring channels, we can express the time-averaged, or mean-annual bedload
sediment supply rate (QsM) as the integral of the upstream rates of river incision
QsM = sFbl Elt (A)dA (10a)
which for the simple case of uniform uplift becomes
QsM = s Fb Elt A (10b)
where Elt is the long-term bedrock incision rate averaged over all discharge and sediment
supply events
Elt =Ei t( )dt
dt(11)
and Fb is the fraction of the total sediment supply that is coarse enough to move as
bedload. If we assume the river profile is in topographic steady state, such that the long-
term bedrock incision rate is equal to the rock uplift rate (Elt = Ur), then, for the case of
uniform rock uplift

13
QsM = s Fb Ur A (12).
The bedload fraction of the total load (Fb) can be calculated for a given boundary
shear stress, if the full grain size distribution is specified, using a criterion for the
threshold of suspension, such as when the shear velocity (u*) is equal to the fall velocity
in still water (wf) (Rouse, 1937). However, because we use a single grain diameter (Ds) to
represent the size of sediment moving as bedload, Fb becomes a parameter that must be
estimated, rather than calculated. Measured values of Fb, from simultaneous sampling of
both bedload and suspended load, range from 0.01 to 0.5 (e.g. Leopold, 1994), although
field estimates of Fb in coarse-bedded mountain channels range as high as 0.82 (Bezinge,
1987).
2.2 Representative discharge and sediment supply
Landscape evolution models typically treat bedrock incision as a continuous
process, and do not account explicitly for the differing effects of individual discharge and
sediment supply events. This approximation may be valid for erosional processes that do
not have thresholds, but because the saltation-abrasion model is based on the dynamics of
bedload sediment transport we must consider the constraint imposed by the threshold of
sediment motion. For example, for the South Fork Eel River reference site, the mean-
annual discharge of 4 m3/s does not produce sufficient shear stress to mobilize the
representative grain size of 0.06 m, and thus causes no bedrock wear.
Ideally, to calculate a long-term incision rate, we would model a time-series of
discharges or integrate over a frequency distribution of discharges so that we could

14
account for the weighted contributions of discharges of all magnitudes. For example,
Tucker and Bras (2000) used the Poisson pulse rainfall model to derive a frequency
distribution of flood discharges, which they integrated to explore (separately) the
sensitivity of long-term rates of sediment transport and bedrock erosion to variability in
runoff. Tucker and Bras (2000) did not, however, couple sediment transport and bedrock
erosion, as we do here, as thus did not encounter the problem of specifying the
instantaneous sediment supply rate for conditions of excess sediment transport capacity.
Sediment supply from hillslopes to the channel network is inherently episodic, and the
frequency distribution of sediment supply events, such as landslides, should be to some
extent decoupled from the distribution of rainfall and runoff events.
Here we use the representative discharge concept to develop a rational method for
treating incision as a semi-continuous process while accounting for the effect of the
threshold of sediment motion. The representative discharge is a single-value flow rate of
limited duration, which we assume to represent the integrated effect of the full
distribution of discharges. The method also must specify a corresponding representative
sediment supply rate, which we also assume represents the integrated effect of the full
distribution of sediment supply events. In the analysis that follows, we seek to develop a
simple method, with a limited number of parameters, that: (1) can be constrained by
measured discharge distributions to reflect differing rainfall and runoff variability across
climatic regimes; (2) accounts for the total volume of runoff, not just flood flows; (3)
accounts for the total coarse sediment supply; and (4) accounts for the influence of grain
size on the threshold of sediment motion and thus on the bedload sediment transport
capacity of the representative discharge.

15
Perhaps the simplest approach to constraining the magnitude of the representative
discharge would assume that the total mean annual runoff was carried by the
representative discharge (QwT), such that
QwT = QwM / Ft (13)
where QwM is the mean annual discharge and Ft is an intermittency parameter equal to the
fraction of total time during which the representative discharge is assumed to occur. This
approach may exaggerate the effects of extreme events because it neglects the fraction of
annual runoff that occurs in low magnitude, high frequency discharges. Such low flows
may account for a significant fraction of the annual runoff in coarse-bedded channels
with a high threshold of motion.
To account for the potentially important role of low-magnitude flows, we define
two characteristic discharges, a representative high flow (QwH) and residual low flow
(QwL), that together carry all the annual runoff. We define a new parameter, the fraction
of the total runoff carried by the high flow (Fw), such that
QwH = QwMFw / Ft (14)
and
QwL = QwM (1 – Fw) / (1 – Ft) (15).

16
We assume that bedload transport only occurs during the high-flow discharge so that the
sediment supply during high flow is
Qs = QsM / Ft (16).
such that no sediment is supplied during low flow, because the shear stress is below the
threshold of motion.
The two magnitude-frequency parameters, Fw and Ft, are not independent, but can
be related by considering a cumulative discharge distribution. Figure 1 shows the
cumulative distribution of mean daily discharge for the South Fork Eel reference site. In
figure 1, the probability of non-exceedence (Pne) for a given discharge is computed by
ranking the entire discharge record in ascending order, such that
Pne = m/(N+1) (17)
where m is the rank of an individual discharge and N is the total number of measured
discharges.
We can define the intermittency parameter Ft as
Ft = 1 – Pne (18)
so that the fraction of the total volume of runoff carried by the high flow Fw is

17
Fw =Qw Pne( )PnedPne1 Ft
1
Qw Pne( )PnedPne0
1 (19).
Figure 2a shows the relationship between Fw and Ft for the reference site gauge
record. If the representative high flow is assumed to occur relatively frequently (Ft ~ 1) it
would carry most of the annual runoff, while a less frequent, but higher magnitude
representative high flow (Ft << 1) would carry only a small fraction of the annual runoff.
This relationship is a way of characterizing the ‘storminess’ of the discharge distribution,
for example the curve would shift to the left for storm dominated rivers, and to the right
for spring-fed or snow-melt dominated rivers. The relationship between Fw and Ft is
unlikely to be uniform within a drainage basin, for example shifting to the right with
increasing distance downstream due to the integrating effect of flow routing through the
channel network (Bras, 1990). Note that although we have used empirical data, this
approach could be generalized for use with synthetic discharge frequency distributions,
such as the log-normal or log-Pearson distributions.
Figure 2b shows the variation in the representative high-flow discharge (QwH) and
low-flow discharge (QwL) with the high-flow time fraction (Ft), for the reference site
discharge record, using equations 14, 15, and 19. Also plotted in Figure 2b is the
representative discharge that carries the total runoff (QwT, equation 13). As Ft declines
from 1.0 (where QwH = QwT = QwM, and QwL = 0), the magnitude of the high-flow
discharge increases, but the rate of increase declines because of the increasing fraction of
the total runoff that is carried by the low flow. In contrast, the rate of increase in total
runoff representative discharge is constant, so that for a 1 yr recurrence interval (i.e. Ft =

18
1/365) QwT is about an order of magnitude greater than QwH. Note that for very low values
of Ft, the QwL ~ QwM and the high flow carries a negligible fraction of the annual runoff.
The difference between QwH and QwT is most significant when we consider
sediment transport. For each discharge, we can calculate a corresponding sediment
transport capacity (Qt, equation 4). Figure 2c shows the bedload sediment transport
capacity at the reference site calculated for the high-flow (QtH) and total-runoff (QtT)
representative discharge methods. Also shown is the representative sediment supply rate
(Qs), which is inversely proportional to Ft because we assume that all coarse sediment is
moved only during high flows (equation 16). For Ft ~ 1, the average boundary shear
stress is below the threshold of motion and the transport capacity is zero. With
decreasing Ft (i.e. higher magnitude, lower frequency), once the threshold of motion is
exceeded the non-linearity of the sediment transport relation leads to a rapid increase in
transport capacity for both the high-flow and total-runoff methods. Transport capacity
exceeds supply, thus exposing bedrock and allowing incision to occur, when Ft < 0.2 (i.e.
< 70 days/yr) for the total-runoff method and when Ft < 0.08 (i.e. < 29 days/yr) for the
high-flow method. For further decreases in Ft, the extent of excess sediment transport
capacities predicted by the two methods diverge significantly. The high flow transport
capacity only exceeds the sediment supply for a narrow range of Ft (0.016 Ft 0.08),
while the total runoff transport capacity exceeds sediment supply for all Ft < 0.2.
Figure 2d shows the ratio of sediment supply to transport capacity (Qs /Qt), which
in the saltation-abrasion model corresponds to the fraction of the bed covered with
alluvium, for the high-flow discharge (Qs /QtH) and the total-discharge (Qs /QtT), for
reference site conditions. The high-flow method predicts only a limited extent of bedrock

19
exposure, at an optimum Ft, while the total-runoff method predicts very large bedrock
exposure over a wide range of Ft.
Because the representative discharge approach is intended to approximate the
long-term net effect of the full distribution of discharges, we can use the time integral of
the sediment transport capacity of the gauged discharges at the reference site as a metric
to evaluate the efficacy of the two representative discharge methods. Over the 24 year
period of record, the annual mean integrated bedload transport capacity ( QtA), for
reference conditions, is 7.26 x 10⁷ kg/yr. Plotted in Figure 2d is the ratio of the high flow
annual transport capacity to the annual capacity of the gauged discharges ( QtH / QtA),
calculated over the range of Ft.
The high flow representative discharge method approximates the net sediment
transport capacity of the actual discharge record best at the optimum Ft value of 0.0437
(i.e. ~16 days/yr), differing only by about 5%. In contrast, the total runoff method annual
net sediment transport capacity (not plotted) exceeds the actual integrated mean capacity
by a factor of 2 at Ft ~ 0.2, and grows rapidly to a ratio of greater than 95 at Ft = 0.0437,
and greater than 5000 by Ft = 0.001.
The preceding analysis provides a rational procedure for assigning values to the
magnitude-frequency scaling parameters; for the reference site we find an optimal value
of Ft = 0.0437, which corresponds to Fw = 0.41. The result that nearly 60% of the annual
discharge is carried by the representative low-flow discharge shows the importance of
using a flow partitioning approach in generating a representative discharge for simulating
bedload sediment transport as a semi-continuous process.

20
2.3 Field reference site calibration
We have used the discharge record and channel conditions of the South Fork Eel
River reference site to describe a rational method for constraining the magnitude-
frequency scaling parameter Ft. We next use the reference site to constrain the value of
the remaining free scaling parameter, the fraction of total load in the bedload size class
Fb, so that the predicted incision rates of the calibrated saltation-abrasion model are
consistent with the field conditions.
For simplicity, we assume that the reference site reach and upstream watershed
are in approximate topographic steady state, with bedrock incision and landscape
lowering rates equal to the local rate of rock uplift. From analysis of marine terraces,
Merritts and Bull (1989) mapped the variation in rock uplift rate over a 130 km transect
parallel to the Northern California coastline. For the South Fork Eel River reference site,
located at about km 80 of the transect, Merritts and Bull’s (1989) data (their figure 5)
suggest a long-term average rock uplift rate of 0.9 mm/yr. Assuming that bedrock
incision is confined to high flows that occur 16 days/yr on average (Ft = 0.0437), the
corresponding instantaneous incision rate (Ei = Elt / Ft) is 20 mm/yr. The saltation-
abrasion model predicts this incision rate if the bedload fraction Fb is set to 0.22, for the
reference site drainage area, rock strength, and channel geometry (Sklar and Dietrich, in
press; Table 3). The corresponding fraction of bed cover is 0.85, roughly consistent with
the mapped extent of bedrock exposure under contemporary conditions.
These calculations illustrate how the saltation-abrasion model, which was derived
at the scale of individual particle impacts can be scaled up in time and space to apply at
the scale of landscape adjustment to rates of rock uplift. The scaling parameters (Ft, Fw,

21
and Fb) are constrained by the gauged discharge record and by estimates of the regional
rock uplift field, to occupy a limited range of physically reasonable values. In
combination with the experimental calibration of the rock strength parameter kv, the
reference site calibration demonstrates that the saltation-abrasion model is physically
consistent with both the dynamics of individual bedload grain impacts on an exposed
bedrock bed, and the long-term evolution of river channels to climatic and tectonic
forcing.
3.0 Contrasts with other bedrock incision models
Although many other bedrock incision models have been proposed, none account
fully for the effects of sediment that emerge from a mechanistic consideration of the
coupling of bedload sediment transport and bedrock wear by bedload particle impacts. In
this section we use the saltation-abrasion model as a reference model to evaluate how
other bedrock incision models treat the effects of sediment, and explore the relative
importance of explicitly representing each of these effects. Despite the importance of
bedrock incision rules for the outcomes of landscape evolution simulations, few studies
have systematically compared the behavior of multiple incision models. Tucker and
Whipple (2002) contrasted the topographic outcomes of several incision models, some of
which explicitly represented sediment supply, however, none of the models included the
effects of grain size. Similarly, van der Beek and Bishop (2003) and Tomkin et al. (2003)
tested the ability of various incision models to simulate the evolution of specific river
longitudinal profiles, however, the effects of grain size were also not included in any of
the models investigated.

22
Sediment supply and grain size introduce four distinct effects: the tools and cover
effects, and the constraints imposed by the thresholds of motion and suspension. The
tools effect arises because there must be some coarse sediment supplied for there to be
tools available to abrade the bed. The cover effect refers to the assumption that the
sediment supply rate must be less than the sediment transport capacity for some bedrock
to be exposed in the channel bed, and thus subject to impacts by saltating bedload. The
threshold of motion, which is determined by grain size for a given shear stress, must be
exceeded for abrasion by mobile sediment to occur. Finally, particle motion must be
below the threshold of suspension, also determined by grain size for a given flow
intensity, for abrasion by bedload motion to occur. Note that the saltation-abrasion
model only applies to bedload; abrasion by suspended grains and all other incision
mechanisms are not considered here. Note, however, that the cover effect should inhibit
all bedrock detachment mechanisms, with the possible exception of dissolution.
3.1 Model classification
Bedrock incision models can be grouped according to which, if any, of the effects
of sediment are explicitly represented. Three of the four sediment effects have been
recognized to some extent in previous models, the tools effect, the cover effect, and the
threshold of motion. The fourth effect, the threshold of suspension, is introduced in the
saltation-abrasion model because bedload impacts are the only erosional mechanism
considered. Below we review model formulations that encompass the range of possible
combinations of sediment effects, including some that have not been previously

23
proposed, in order to clearly demonstrate the implications of each of the sediment effects
for predictions of bedrock incision rates.
We begin by defining a generic bedrock incision expression that can be used as a
common basis for comparing different models. Each of the published bedrock incision
models that we are aware of can be expressed in a form based on equation 1
Ei = K aQsb 1
Qs
Qt
c
1u*
wf
2
d
(20)
where is a placeholder variable for the various model measures of flow intensity (e.g.
stream power), and the coefficient K is a placeholder erosional efficiency coefficient that
represents rock strength and other factors. The tools effect, cover effect and threshold of
suspension are controlled by the exponents b, c, and d respectively, and the threshold of
motion effect is expressed in the choice of and in the choice of sediment transport
capacity relation for Qt. Table 1 summarizes the parameterization of each model
formulation in terms of the variables, coefficient and exponents of equation 20. Note that
for each model formulation the value of K is tuned to match the assumed representative
conditions and incision rate of the S. Fork Eel River reference site.
Class I: No sediment effects
The most widely used bedrock incision models do not explicitly account for any
of the possible effects of sediment. These include the stream power model (Seidl and
Dietrich, 1992)

24
E = K n (21)
the unit stream power model (Howard et al., 1994)
E = K n (22)
and the shear stress model (Howard and Kerby, 1983)
E = K n (23)
where = wgQwS is the stream power per unit downstream length, = wgQwS/W is the
stream power per unit bed area, = wgRhS is the force per unit area exerted by the flow
averaged over the channel boundary, and K , K and K are proportionality constants
intended to represent implicitly the effects of rock resistance and many other factors,
including sediment (Howard et al., 1994; Sklar and Dietrich, 1998; Whipple and Tucker,
1999). Equations 21, 22 and 23 are equivalent to equation 20 with a = n and b = c = d =
0. Considerable debate has surrounded the choice of n and , with n = 1 most commonly
used (e.g. Tucker and Slingerland, 1994; Willett, 1999) although Whipple et al. (2000)
argue for values of n ranging between 2/3 and 5/3 depending on the dominant incision
mechanism.
The excess shear stress model (Howard et al., 1994; Tucker and Slingerland,
1997)

25
E = K cr ( c-rock) n
(24)
accounts for the possibility that incision only occurs when shear stress exceeds a critical
value c-rock below which no bedrock wear occurs. A similar model could be formulated
with incision proportional to stream power in excess of a threshold. The threshold shear
stress c-rock is assumed to be a property of bedrock strength, with higher values for more
resistant lithologies. No data are available to guide parameterization of this threshold,
although Whipple et al. (2000) discuss the threshold behavior of rock erosion by the
mechanism of plucking. It is important to note that no detachment threshold was
observed in the bedrock abrasion mill experiments of Sklar and Dietrich (2001) in which
bedload abrasion was the dominant erosional mechanism. A similar detachment
threshold for cohesive hillslope materials is a key parameter in mechanistic theories for
channel initiation (e.g. Montgomery and Dietrich, 1988; 1992), and has been used in
numerical simulations of landscape evolution focused on drainage density (Tucker and
Bras, 1998).
Class II: Grain size effects only
The excess shear stress model can alternatively be defined to incorporate the
threshold of sediment motion
E = K cs ( c-sed) n
(25)

26
where c-sed is the shear stress required to mobilize non-cohesive bed sediments and is a
generally a linear function of grain size (Buffington and Montgomery, 1997). This
represents a second class of incision models in which grain size must be specified but the
tools, cover and suspension effects are neglected. The magnitude of c-rock should be
significantly greater than c-sed because of the cohesive nature of rock; for purposes of
model comparison we arbitrarily set c-rock to be five times greater than c-sed for the
reference site grain diameter of 0.06 m. The sediment-based excess shear stress model
can equivalently be expressed in non-dimensional form with = * -
*c or =
*/
*c – 1.
Like the stream power and shear stress models, the various formulations of the excess
shear stress model are represented by equation 20 with a = n and b = c = d = 0.
Another model that requires specification of the sediment grain size was proposed
by Lave and Avouac (2001). It is a modified form of the shear stress model (equation 23)
in which the flow intensity variable = * and n = 1. Although this approach does
explicitly include grain size, it does not account for the non-linear effect introduced by
the size-dependent threshold of grain motion.
Class III: Sediment supply effects only
The simplest approach to including the effect of sediment supply is to treat
bedrock incision rate as proportional to the sediment transport capacity in excess of the
supply
E = Kma (Qt – Qs) = Kma Qt (1 – Qs /Qt) (26)

27
where Qt = f( ) and Kma is an erosional efficiency constant, as first proposed by
Beaumont et al. (1992). Equation 26 represents a third class of incision models, which
capture the coverage effect but not the tools effect nor the grain size dependent effects of
the thresholds of motion and suspension. Although the term ‘undercapacity’ is often used,
we refer to models of this type as ‘modified alluvial’ because they differ from alluvial
incision models only in the value of the parameter Kma. If Kma = 1/ s(1- )WLr, where
is bed porosity and Lr is a characteristic reach length, then equation 26 is simply the
conservation of mass equation for a channel with an infinitely thick alluvial mantle. In
landscape evolution simulations Kma is typically set to a much lower value, however, to
account for the cohesive properties of bedrock (e.g. Kooi and Beaumont, 1996). In the
framework of equation 20, c = 1, b = d = 0, and a and depend on the choice of sediment
transport relation. Two variations of the modified-alluvial model have been proposed,
which assuming that sediment transport capacity is proportional to stream power (i.e. Qt
= Kqa ), can be written as
E = Knn 1 Qs Kqa( ) (27)
where n = 1 (Beaumont et al., 1992) or n = 2 (Whipple and Tucker,2002), and a = n in
equation 20.
Note that the modified-alluvial model is commonly motivated by the argument
that sediment supply inhibits incision by extracting energy from the flow for sediment
transport, energy that would otherwise be available for incision of bedrock (Beaumont et
al., 1992). However, as we argued in developing the saltation-abrasion model (Sklar and

28
Dietrich, in press), it is precisely because energy is transferred from the flow to the
sediment that bedrock erosion occurs. The coverage effect arises because grain
interactions inhibit energy transfer from the mobile sediment to the bedrock. Although
this is a subtle distinction, it may account for the omission of a tools effect term in
landscape evolution models using the modified-alluvial incision rule.
Class IV: Sediment supply and grain size effects only
If we use a bedload sediment transport relation in the modified alluvial model, we
obtain a fourth class of incision model, which, in addition to accounting for the coverage
effect, explicitly includes the threshold of motion and scales flow intensity by grain size.
Combining equations 4 and 26 we obtain
E = Kma b 5.7 sW RbgDs3( )1 / 2
c*( )3 / 2 *
c* 1
3 / 2
Qs
(28)
which can be parameterized in equation 20 with = */ c
*–1, a = 1.5, and b = 1.0.
Class V: Grain size and tools effects only
Foley’s (1980) pioneering mechanistic incision model represents a fifth class of
possible incision models, those which include the tools effect and threshold of motion,
but not the coverage effect and threshold of suspension. This model, which applies
Bitter’s (1963) impact wear theory to the saltating motion of an individual grain without
accounting for grain interaction, can be expressed as

29
E =K f wsi
2Qs
LsW(29).
Equation 29 is equivalent to equation 20 with b = 1 and c = d = 0. Unfortunately, Foley
(1980) did not specify the functional relationships Ls = f( ) and wsi = f( ), however, we
can use the empirical saltation trajectory relations developed previously (Sklar and
Dietrich, in press; equations 27 and 34) to obtain = */ c
*– 1 and a = -0.5. Another
version of the tools-based model was proposed by Howard et al. (1994) who used data
from Head and Harr (1970) and Wiberg and Smith (1987) to parameterize Foley’s (1980)
model as
E = Kh Qs W( ) Qw W( )0.5S0.4Ds
0.1(30)
for */ c
* > 1.3; this is approximately equivalent to = and a = 0.45 in equation 20.
Class VI: Cover and tools effects only
A sixth class of bedrock incision models account for both the tools and coverage
effects but neglect the thresholds of motion and suspension. For example, Whipple and
Tucker (2002), responding to our earlier findings (Sklar and Dietrich, 1998), proposed a
parabolic modification of the unit stream power model (equation 22) that can be written
as
30
E = K n 1 4 Qs /Qt 0.5( )2[ ] = Kp
n 1Qs 1 Qs /Qt( ) (31)
for Qt = Kqa and Kp = 4K /Kq . The parabolic model of equation 31 is equivalent to
equation 20 with b = c = 1, d = 0 and a = n-1. Whipple and Tucker (2002) discuss the
cases where n = 1 and n = 2.
Class VII: Tools, cover and threshold of motion only
A seventh class of incision models account for the threshold of motion along with
the tools and cover effects, neglecting only the effect of the threshold of suspension. This
is what we would obtain with the saltation-abrasion model of equation 1 if we omit the
saltation length extrapolation term [1 – (u*/wf )
2], so that a = -0.5, b = c = 1 and d = 0 in
equation 20. Note that this is equivalent to the linear parabolic model (equation 31 with n
= 1) if = */ c
*– 1 rather than (i.e. if a bedload sediment transport relation is used).
Class VIII: Tools, cover, threshold of motion and threshold of suspension
Finally, the full saltation-abrasion model (equation 1) constitutes an eighth model
class, in which each of the four principal effects of sediment are explicitly accounted for.
3.2 Model comparisons
In this section we compare the incision rates predicted by the various models
defined above, for variations in sediment supply rate and transport stage (*/ c
*). As
noted above, the coefficients of each of the models are tuned to predict the assumed long-
term incision rate at the South Fork Eel reference site. This creates a common

31
benchmark erosion rate, so that we can compare predicted deviations from that erosion
rate as we vary sediment supply and transport stage.
Figure 3 shows incision rate as a function of sediment supply, holding all other
variables, such as shear stress, grain size, and rock strength, constant at reference site
values. The reference site is indicated by the open circle. Four types of behavior can be
seen. In the trivial case, models with no sediment supply effects (Classes I and II) plot as
a horizontal line because predicted incision rate is independent of sediment supply.
Models that account for the cover effect, but not the tools effect (Classes III and IV)
predict a linear decrease in incision rate with increasing sediment supply, becoming zero
when the sediment supply equals the transport capacity; maximum incision rates occur
when sediment supply is minimized. Conversely, tools-based models (Class V) predict a
linear increase in incision rate with increasing sediment supply; incision rate is
maximized when sediment supply is greatest. The saltation-abrasion model, and the
other models that account for both the cover and tools effects (Classes VI, VII and VIII)
predict a parabolic dependence of incision rate on sediment supply, in which the peak
incision rate occurs at a moderate sediment supply rate.
To compare model predictions of incision rate as a function of transport stage, it
is convenient to use a three-dimensional depiction of the incision model functional
surface, as we have done previously (Sklar and Dietrich, in press). As shown in figure 4,
each incision model can be represented fully by plotting contours of constant incision rate
(axis out of the page) as functions of transport stage and the ratio of sediment supply to
sediment transport capacity (Qs /Qt; also referred to as relative sediment supply). Note
that the contour spacing is logarithmic to encompass incision rates ranging over many

32
orders of magnitude. Note also that transport stage occurs on two axes, because sediment
transport capacity is a non-linear function of transport stage (equation 4).
Depicting the incision functions in this format allows the principal effects of
sediment to occur along discrete axes. The thresholds of motion and suspension are
expressed along the transport stage axis, while the cover and tools effect are expressed
along the relative supply axis. As we have shown previously (Sklar and Dietrich, in
press), when incision rate is non-dimensionalized by rock strength and grain size, the
saltation-abrasion model plots in this parameter space as a unique surface, valid for all
physically reasonable combinations of discharge, slope, width, sediment supply, grain
size, rock strength and channel roughness. For model comparison purposes we have used
the dimensional instantaneous incision rate Ei (mm/yr), with model parameters tuned to
match the reference site incision rate (Table 3 in Sklar and Dietrich, in press).
The fundamental differences between the incision model classes are clearly
apparent in Figure 4. Models with no sediment effects plot as simple inclined planes
(Figures 4a and 4b), with the sensitivity to shear stress expressed by the density of
contour lines. Models that require a shear stress in excess of a threshold for incision to
occur, either a rock strength-dependent detachment threshold (Figure 4c) or the threshold
of motion (Figures 4d, 4g, 4j, 4k and 4l), have a zone of ‘no erosion’ for stresses below
the threshold. Where the cover effect is accounted for (Figures 4e, 4f, 4g, 4h, 4i, 4k and
4l), incision rate contours curve to the right as the threshold of alluviation is approached
(Qs/Qt ~ 1) and incision rate goes to zero. Similarly, where the tools affect is accounted
for (Figures 4h, 4i, 4j, 4k and 4l), incision rate contours curve to the right as sediment
supply, and thus the incision rate, approach zero. Because the saltation-abrasion model

33
also accounts for the threshold of suspension, there is also a zone of ‘no erosion’ for
shear stresses above this threshold (Figure 4l). Due to the suspension effect, the
saltation-abrasion model predicts that there is a limit to the potential rate of bedrock wear
by bedload abrasion, for all possible values of transport stage and sediment supply, as
indicated by the peak of the incision function surface (Figure 4l). All other models
considered here, which in principle are intended to represent incision by multiple
erosional mechanisms, predict continuously increasing incision rates with increasing
transport stage.
Comparison of Figure 3 and Figure 4 shows that the curves of incision rate as a
function of sediment supply, plotted in Figure 3, are simply slices through the functional
surfaces plotted in Figure 4, parallel to the relative sediment supply axis. A similar slice
through the functional surfaces can be made parallel to the transport stage axis, in order
to depict the dependence of incision rate on transport stage, independent of the influence
of transport stage on the sediment transport capacity. Figure 5 shows slices through each
of the functional surfaces of Figure 4, along a line of constant relative sediment supply
(Qs/Qt = 0.5).
Three fundamental differences between incision model classes are clearly
illustrated in Figure 5. First, models that do not account for the threshold of motion
predict significant rates of incision when the flow intensity is too weak to move bedload.
These include the stream power [SP, SP(2)], shear stress (SS), modified-alluvial [MA,
MA(2)], and parabolic stream power [SPP, SPP(2)] models. Second, with the exception
of saltation-abrasion [SA], all models neglect the threshold of suspension, and thus
predict extremely rapid rates of incision by suspended load (*/ c
* > 30), despite the

34
probability that suspended grains collide very infrequently with the channel bed. Third,
most models tend to over-predict the rate of growth of incision rate, relative to the
saltation-abrasion model, even at moderate levels of transport stage. This is particularly
true of the non-linear (n = 2) versions of the modified alluvial and parabolic stream
power models. The bedload version of the modified alluvial model [MA(bdld)] also
predicts very rapid growth in incision rate as transport stage increases beyond the
threshold of motion. Note that the excess shear stress model with a rock strength-
dependent detachment threshold [ESS(R)] plots apart from the other models in Figure 5
because we have set the threshold shear stress to a value five times larger than the
threshold of sediment motion shear stress, to account for the cohesive nature of rock.
Each incision model considered here can be tuned to be approximately equivalent
to the saltation-abrasion model, over a limited range of variation in sediment supply and
transport stage. For example, as shown in Figure 3, the modified alluvial model predicts
a similar variation incision rate for relatively high sediment supply rates and fixed
transport stage, but vastly over predicts incision rate for low sediment supply rates,
compared to the saltation-abrasion model. Similarly, each of the models that account for
the threshold of motion predict similar incision rates for relatively low transport stages
(for constant Qs/Qt; Figure 5), but diverge rapidly as */ c
* increases above ~2.0. The
bedload version of the modified alluvial model perhaps best approximates the saltation-
abrasion model, but only for the narrow range of low transport stage (*/ c
* < 3) and
high relative sediment supply (Qs/Qt > 0.8). These conditions may, however, be
relatively common in many mountain rivers when bedrock incision is taking place.

35
The fundamentally different model behaviors illustrated in Figure 4 can be
expected to correspond to large differences in predicted landscape response to changes
boundary conditions, such as rock uplift rate, rock strength and discharge regime. In the
following section we explore the implications of including or neglecting the various
effects of sediment in bedrock incision models, by considering the controls on channel
slope for the case of topographic steady state.
4.0 Controls on steady-state channel slope
The complex role of sediment in influencing bedrock incision rates has important
implications for understanding the controls on the slope of a given reach of river channel.
And because river longitudinal profile relief and concavity are directly related to the
integral and derivative of channel slope along the length of the profile respectively,
understanding the controls on local channel slope is essential to explaining river profile
form in general. For simplicity, we focus here on steady-state channel slopes.
Landscapes subject to prolonged steady rock uplift may approach an equilibrium
condition where erosion rate everywhere balances rock uplift rate and topography reaches
a steady state (Hack, 1960). At steady state, erosion rate is determined simply by the rate
of rock uplift, and channel slope becomes the dependent variable. The equilibrium slope
of an incising river is then a function of the rate of rock uplift, as well as the other
variables influencing the instantaneous incision rate, in particular sediment supply, grain
size, discharge, and rock strength. In this section we explore the implications of the
cover and tools effects and the thresholds of motion and suspension in controlling

36
channel slope at a reach scale, and contrast the predictions of the saltation-abrasion model
with the other types of models used in landscape evolution simulations.
4.1 Components of steady-state channel slope
Recognition of the constraints on bedrock incision rates imposed by the threshold
of grain motion and the threshold of alluviation, suggests that a hierarchy of channel
slopes exists. The minimum slope required for bedrock incision to occur is set by the
threshold of motion. For a given discharge and channel geometry, if slope is not steep
enough to generate shear stresses in excess of the threshold of motion, no sediment
transport and no incision occur. If the slope is steep enough to mobilize bed sediments,
but not steep enough to transport bedload out of the reach at the rate that coarse
sediments are supplied to the reach from upstream and from adjacent hillslopes, then we
assume that no bedrock will be exposed in the channel bed, incision rate will be zero, and
bed aggradation will occur. For incision to occur, we assume that the slope must be
steeper than the slope required to transport the imposed sediment load, in order to provide
the excess transport capacity to generate sufficient bedrock exposure and bedload particle
impact energy and frequency.
Therefore, steady-state total channel slope (S) can be considered to be a sum of
component terms
S = SDs + SQs + SE (32)

37
where SDs is the theshold of motion slope, SQs is the increment of slope above SDs
required to transport sediment at the rate of supply, and SE is an additional slope
increment required to erode bedrock at the rate of rock uplift. Using the bedload
sediment transport relation of Equation 4(Fernandez-Luque and van Beek, 1976), we
obtain
SD = c* Rb Ds / Rh (33)
and
SQs =RbDs
Rh
Qs
5.7 sW RbgDs3( )1 / 2
2 / 3
(34)
For the saltation abrasion model, because slope occurs in both the flow intensity term and
the cover term (equation 20; table 1), SE cannot be solved for analytically, and instead
must be solved for numerically. Below, in comparing the steady-state channel slopes
predicted by the various classes of incision models, we will use the slope component
framework to help understand the behavior of the saltation-abrasion model, and the
deviations from this behavior of the other models.
4.2 Analytical solutions for steady-state channel slope
Analytical solutions for steady-state channel slope can be derived for the other
bedrock incision models discussed in the preceding section. In order to evaluate the

38
predicted influence of rock strength on steady-state channel slope (below), we modify the
incision efficiency coefficients of each model expression to explicitly include T2 as a
proxy for rock resistance to wear. We have demonstrated previously (Sklar and Dietrich,
2001) that rock resistance to wear by bedload abrasion scales with T2. Here we assume
for simplicity that the same scaling relationship applies to rock resistance to wear by all
incisional mechanisms represented by the other model expressions. Using the unit stream
power model as an example (n = 1), we now write equation 22 as
E = K wgQwS/ T2W (35)
where K = K / T2.
Rearranging equation 35 to solve for slope we obtain
S = E T2W /K wgQw (36).
Similarly, for the shear stress model (equation 23)
S =E T
2
K wg
10/ 7W
Qwn
6/ 7
(37)
the excess shear stress model, with a rock detachment threshold (equation 24)

39
S =E T
2
K cr
+ c rock
W3 / 5
g Qwn( )3 / 5
10 / 7
(38)
the excess shear stress model, with a sediment motion threshold (equation 25)
S =E T
2
K cs
+ c sed
W3 / 5
wg Qwn( )3 / 5
10 / 7
(39)
the modified-alluvial model (equation 27), with n = 1
S =E T
2
Ka
+Qs
W
Kbl wgQw
(40)
and with n = 2
S =QsW
2Kbl wgQw
1 + 1+E T
4 4Kbl2
Qs2Ka2
1/ 2
(41)
the bedload modified alluvial model (equation 28)
S =E T
2 +QsKma b
5.7Kma b sW RbgDs3( )1.2
c*( )3 /2
2 / 3
+1
RbDs c*
Qwn
W
3 / 5
10 /7
(42)

40
the tools model (equation 30)
S =K f Qs
E T2
2
+1
RbDs c
*
Qwn
W
3 / 5
10 / 7
(43)
the parabolic stream power model (equation 31), with n = 1
S =QsW
Kbl wgQw 1 E T2Kbl 4K Qs( )
(44)
and with n = 2
S =W
wgQw
Kbl T2E
4K 2 Qs
+Qs
Kbl
(45).
4.3 Comparisons of incision model predictions of steady-state channel slope
In this section we compare the steady-state channel slope predicted by the
saltation-abrasion model with the slopes predicted by the other incision models discussed
above. Our analysis focuses on the sensitivity of steady-state slope to variations in rock
uplift rate and rock resistance to erosion, in part because the two most common incision
models in landscape evolution studies, the stream power and shear stress models, predict
linear variation in slope with both variables. As we demonstrate below, the saltation-
abrasion model predicts a highly non-linear relationship between slope and rock uplift

41
rate and very little dependence of slope on rock strength. To the extent that other models
incorporate the various effects of sediment on incision rate, they too deviate from the
linear relationships of the stream power and shear stress models.
We also evaluate the sensitivity of slope to the magnitude-frequency parameter Ft,
which, as defined above, represents the fraction of time during which the high flows that
transport sediment and incise bedrock occur. Note that because topographic steady-state
occurs when rock uplift rate is equal to the long-term incision rate Elt, the absolute values
of rock uplift rate and steady-state instantaneous erosion rate differ by a factor of Ft. As
before, to help ground the analysis in the range of physically reasonable values, we hold
all other variables constant at South Fork Eel River reference site conditions (Table 3 in
Sklar and Dietrich, in press). Note also that we consider 11 of the 12 incision models
discussed in the previous section; for clarity, we have omitted the version of the saltation-
abrasion model that lacks the threshold of suspension term.
The influence rock uplift rate on steady-state channel slope
Figure 6a shows the predicted steady-state channel slope as a function of rock
uplift rate for the various incision models. As before, the reference site is indicated by an
open circle. Over a range of rock uplift rate spanning more than five orders of
magnitude, the slope predicted by the saltation-abrasion model varies by only slightly
more than one order of magnitude. As rock uplift rate declines from the reference site
value, the steady-state saltation-abrasion model slope declines slowly until reaching a
nearly constant value, set by SDs, the threshold of motion slope. As rock uplift rate
increases from the reference site value, the predicted slope increases rapidly, until

42
reaching a maximum, denoted by an asterisk. The saltation-abrasion model predicts that
steady-state cannot be achieved for rates of rock uplift any more rapid, given the
reference site values of grain size, rock strength, and other variables held constant. This
maximum possible incision rate occurs because of the tradeoff between the increase in
particle impact energy with the decrease in impact frequency, with increasing transport
stage. As described in detail in Sklar and Dietrich (in press), for sufficiently high shear
stress, the derivative of the saltation-abrasion incision function with transport stage
becomes negative. Thus, further increases in slope beyond the peak value cause incision
rate to decline, rather than increase.
The relatively small change in steady-state channel slope predicted by the
saltation-abrasion model over a very large range of rock uplift occurs in part because of
the adjustment in the fraction of the bed exposed to erosive wear. This is shown in
Figure 6b, where the fraction of the bed covered, assumed to correspond to the relative
sediment supply (Qs/Qt), is plotted against rock uplift rate. For low rock uplift rates,
only small changes in bed cover are required to accommodate large changes in the
steady-state incision rate. As rock uplift rate becomes relatively large, and begins to
approach the maximum possible steady-state value, the extent of bedrock exposed on the
channel bed increases more rapidly.
The non-linear increase in steady-state channel slope with increasing rock uplift
rate is best understood by considering the relative contributions of each of the slope
components defined above to the total channel slope. Figure 6c shows each of the slope
components, normalized by the total channel slope, for the range of rock uplift rates. The
threshold of motion component dominates the total slope for low values of rock uplift

43
rate, but declines in importance as rock uplift becomes relatively rapid. Because
increases in steady-state rock uplift rate result in accelerated rates of erosion and
sediment production in the upstream landscape, sediment supply increases linearly with
rock uplift rate (for constant Fb). This effect influences the increase in channel slope
above SDs much more significantly than does the requirement that the channel incise at
the rate of rock uplift. For relatively high rock uplift rates, SQs is the dominant control
on channel slope. The slope increment responsible for bedrock incision SE grows
rapidly as the peak erosion rate is approached, but is never the dominant slope component
term. Overall, the saltation-abrasion model predicts that the effects of grain size and
sediment supply primarily control steady-state channel slope, over the full range of rock
uplift rates for which steady-state can be achieved by bedload abrasion.
The behavior of the saltation-abrasion model is fundamentally different from the
stream power and shear stress models, as well as the linear forms (n = 1) of the modified-
alluvial and parabolic stream power incision models. Each of these models predicts a
rapid and continuous decline in slope with reduced uplift rate, without any limit to how
low the slope can become (Figure 6a). Orders of magnitude variation in uplift rate are
accommodated by orders of magnitude change in channel slope, and thus predicted
topographic relief. This power law behavior is expected from the stream power and shear
stress models. In contrast, the modified alluvial and parabolic stream power models
explicitly include the cover effect and thus might be expected to predict changes in the
extent of bed cover with changing erosion rate and sediment supply. However, as shown
in Figure 6b, the linear form of these models predicts a constant extent of bed cover
because the reduction in sediment supply with reduced rock uplift rate is exactly matched

44
by a reduction in sediment transport capacity. The bedload version of the modified
alluvial model also predicts constant bed exposure despite large changes in rock uplift
rate and sediment supply (Figure 6a), however, this model closely follows the slope
variation predicted by the saltation-abrasion model (Figure 6a) because, as defined above,
they share the same form of sediment transport relation (equation 4).
The non-linear (n = 2) forms of the modified-alluvial and parabolic stream power
models do predict changes in bed cover with changing uplift rate, however the effect is
opposite to that predicted by the saltation-abrasion model. As shown in Figure 6b, these
models predict that the fraction of the bed covered becomes increasingly small as uplift
rate is reduced, approaching bare bedrock as erosion rate becomes negligibly small. This
occurs in the case of the non-linear modified alluvial model because steady-state slope
depends on erosion rate to a power less than unity in equation 41 (note that Qs2 appears in
the denominator of the last term), so transport capacity declines more slowly than
sediment supply as uplift rate is reduced. In the case of the non-linear parabolic stream
power model, as uplift rate is reduced the predicted steady-state slope declines to a
constant value, much like the saltation-abrasion model. However, unlike the threshold of
motion slope, this constant slope value has no physical meaning, but is merely a
mathematical artifact. At steady-state, erosion and sediment supply cancel in the first
term within the parentheses of equation 45, and the resulting constant term is independent
of grain size, sediment supply rate and rock uplift rate. Because slope remains large,
sediment transport capacity remains high as uplift rate and sediment supply decline, and
the fraction of the bed covered goes to zero.

45
The two versions of the excess shear stress model, with the critical shear stress
term set alternatively by a rock detachment threshold or the threshold of sediment
motion, both predict a non-linear variation in channel slope similar to the saltation-
abrasion model. The sediment mobilization version closely tracks the saltation-abrasion
model for low rock uplift rates where grain size is the dominant control on channel slope,
but predicts a more rapid increase in slope for relatively high uplift rates as it approaches
the power law behavior of the simple shear stress model. The rock detachment version of
the excess shear stress model is exactly parallel, only shifted up by a factor set by the
difference in the threshold value. Finally, the tools model predicts no dependence of
steady-state channel slope on rock uplift rate. This surprising result occurs because the
increase in the incision rate required to maintain steady state with increasing rock uplift
rate is exactly balanced by the increase in tools provided by the increased sediment
supply.
The influence of rock strength on steady-state channel slope
Figure 7a shows the variation in predicted steady-state channel slope as a function
of rock tensile strength for the various incision models. In this calculation, rock strength
varies by a factor of 20, which corresponds to a 400-fold difference in rock resistance to
abrasive wear (Sklar and Dietrich, 2001). For this range of rock resistance, which covers
most competent lithologies encountered in tectonically active landscapes, the saltation-
abrasion model predicts only subtle changes in steady-state channel slope. Unlike rock
uplift rate, variations in rock strength do not change the steady-state sediment supply rate,
and thus only affect slope by requiring changes in the efficiency of the incision process.

46
As shown in Figure 7b, the efficiency of the bedload abrasion mechanism is increased in
response to more resistant rock by increases in the extent of bedrock exposed in the
channel bed. Because sediment supply and grain size are constant, only small increments
in slope are required to reduce bed cover substantially. For the reference site values of
grain size and sediment supply, the slope components due to these variables are
coincidently equal (Figure 7c), and dominate the total slope except for the highly resistant
rocks. Thus, for weak and moderate strength rocks, the channel slope is essentially
independent of rock strength and is controlled by the requirement to mobilize and
transport the supplied coarse sediment load. However, at the high end of the range of
rock tensile strengths, the saltation-abrasion model predicts that bedload abrasion cannot
erode efficiently enough to match the rate of rock uplift (for reference site conditions).
Increases in channel slope above the peak value denoted by the asterisk in Figure 7a
would increase the extent of bedrock exposure, but not enough to compensate for the
accompanying reduction in the frequency of particle impacts.
In contrast, models that do not include sediment effects, such as the stream power
and shear stress models predict a simple power law dependence of steady-state channel
slope on rock tensile strength (Figure 7a). Models that include the cover effect, such as
the linear and non-linear versions of the modified alluvial and parabolic stream power
models, predict a narrow range of slopes over a wide range of rock strengths, because the
constant sediment supply rate imposes a minimum slope which must be exceeded for
incision to occur. As with the saltation-abrasion model, the reduced erosional efficiency
as rock strength increases is offset by a corresponding increase in the fraction of the bed
exposed (Figure 7b), which is accomplished with small changes in channel slope.

47
Counter-intuitively, the tools model predicts a decrease in slope with increasing rock
strength. This occurs because for this model erosional efficiency is increased by
increasing the frequency of particle impacts, which in the absence of a change in
sediment supply rate, can only be accomplished by a reduction in shear stress, which
reduces the saltation hop length.
The influence of the magnitude-frequency tradeoff on steady-state channel slopes
In this calculation we vary the magnitude-frequency parameter Ft to evaluate how
the steady-state channel slopes predicted by the various models vary with storminess. As
described in detail in section 2.2, above, when Ft = 1.0, discharge and coarse sediment
occur continuously at the mean annual rates of water and sediment delivery from the
upstream watershed. As Ft decreases, the magnitudes of both the high flow discharge
and coarse sediment supply increase, while the duration decreases. Because in this
approach discharge is partitioned into high and low flow components, but all coarse
sediment is assumed to be transport only during the high flows, sediment supply grows
more rapidly than discharge as high-flow events become increasingly infrequent (Ft <<
1.0). As before, all variables not affected by changes in Ft are held constant at South
Fork Eel River reference site values.
Figure 8a shows the variation in channel slope as a function of the high flow time
fraction Ft for the various incision models. The slope predicted by the saltation-abrasion
model is highest at the two extremes of the range of Ft, and reaches a minimum at the
reference site value of Ft. The range of predicted slopes varies by about a factor of two.
The slope is steepest for Ft = 1.0 because high flow discharge, and thus flow depth, are

48
lowest, and a high slope value is needed to exceed the threshold of motion. As shown in
Figures 8b and 8c, at Ft = 1.0 the bed is nearly completely covered, and the total slope is
dominated by the threshold of motion component SDs. Because the instantaneous erosion
rate Ei = Elt / Ft ( = Ur / Ft for steady-state), Ei is minimized at Ft = 1.0 and the slope
increment due to incision SE is also minimized.
The saltation-abrasion slope is also relatively steep for Ft << 1.0. For this highly
‘stormy’ representation of the distribution of discharges, the low frequency of high flow
events results in very high coarse sediment supply and instantaneous incision rate. In
order to transport this high load, the slope must be considerably steeper than the threshold
of motion slope, and to incise at this rapid rate, exposed bedrock must occupy a large
fraction of the channel bed (Figure 8b). For these reasons, the total slope is dominated by
SQs and SE (Figure 8c). The predicted slope reaches a minimum at the reference site
value of Ft = 0.0437 for the same reason that this value was selected in section 2.2,
because the product of discharge magnitude and duration is maximum at this value,
resulting in the maximum net annual sediment transport capacity for a given slope. (Note
that in the previous calculation slope was held constant, here slope is allowed to vary
while long-term incision rate is held constant).
Because the stream power and shear stress models do not account for the effects
of sediment, those models predict a simple continuous increase in steady-state channel
slope with increasing Ft. This results from a tradeoff between slope and discharge; as
high flow discharge declines with increasing Ft, slope increases to compensate. The rate
of slope increase is tempered by the accompanying decline in instantaneous incision rate
with increasing Ft. The excess shear stress models follow the same pattern as the shear

49
stress model, with the rock detachment version offset again by the assumed difference in
threshold value. Most of the models that account for one or more of the effects of
sediment on bedrock incision generally follow the pattern of slope variation predicted by
the saltation-abrasion model, with slope maxima at either end of the range of Ft with a
minimum at a moderate value of Ft. However, as with the previous calculation of steady-
state slope as a function of rock uplift rate, the pattern of bed coverage predicted by the
various versions of the modified alluvial and parabolic stream power models is opposite
that predicted by the saltation-abrasion model. As shown in Figure 8b, those models
predict large extents of bedrock cover during high magnitude, low frequency events (Ft
<< 1), and little alluvial cover for low magnitude, high frequency events (Ft ~ 1). The
linear parabolic stream power model cannot maintain steady state for low bed coverage;
the maximum possible steady-state value of Ft is indicated with an asterisk. This occurs
due to a reversal in the sign of the derivative of the incision function with respect to flow
intensity, as the incision function moves down into the tools-deprived region of the
parabolic sediment supply effect (Figure 3). Finally, the tools-based model shows an
exaggerated version of the slope variation pattern of most of the other sediment-
influenced models, but for the opposite reason. The slope predicted by the tools model is
very high for Ft << 1 in order to offset the large increase in the frequency of bedload
impacts, and consequent increase in incisional efficiency, caused by the high sediment
supply rate.

50
Non-dimensional representation of saltation-abrasion model slope variation
An additional way of understanding the pattern of variation in steady-state
channel slope predicted by the saltation-abrasion model in the three preceding
calculations, is by plotting the associated path across the non-dimensional representation
of the incision function surface. This is shown in Figure 9, where, unlike the contour
plots of Figure 4, we plot contours of incision rate non-dimensionalized by grain diameter
and rock tensile strength
E* =E T
2
sY gDs( )3 / 2 (46)
as derived in Sklar and Dietrich (in press). The South Fork Eel River reference site is
again indicated with an open circle. With this concise representation of the saltation-
abrasion incision function, the calculated variation in slope with rock uplift rate and with
the magnitude-frequency parameter Ft traverse the identical path. For low Ur, or high Ft,
the steady-state channel reach is just above the threshold of motion (S ~ SD; Figures 6c
and 8c), with nearly complete bed coverage (Qs/Qt ~ 1; Figures 6b and 8b), and relatively
low instantaneous incision rate SE << S (Figures 6c and 8c). As Ur increases, or Ft
decreases, the channel plotting position in Figure 9 climbs toward the peak of the
functional surface, reflecting the increase in Ei. At the maximum possible incision rate
(asterisks), it is evident that extending the curve further by increasing transport stage
would cause the plotting position to descend down the flank of the functional surface, and
result in a reduced incision rate and a failure to maintain steady-state.

51
For the calculation of slope as a function of rock strength, the plotting position in
Figure 9 for weak rocks is Qs/Qt ~ 1 (Figure 7b), but in this case */ c
* > 1 because
sediment supply is constant, and SDs ~ SQs (Figure 7c). As rock strength increases, the
plotting position climbs to higher values of E*, following a path of more subdued change
in */ c
* that reflects the small change in predicted steady-state slope (Figure 7a). Figure
9 shows again that the peak possible steady-state slope occurs as the plotting position
path is about to begin descending down the low relative supply flank of the functional
surface. The difference in the plotting position paths, between the S = f(Ur) or S = f(Ft)
cases and the S = f( T) case, is due to the fact that sediment supply varies with Ur and Ft
but not with T. The increase in sediment supply pushes the path for the Ur and Ft cases
to a much higher transport stage to achieve the approximately same extent of bed
exposure at the peak slope, than is required in the T case where sediment supply is
constant.
5.0 Discussion
The preceding analysis suggests that there is a hierarchy of factors controlling
channel slope in tectonically active landscapes that are in approximately topographic
steady-state. The grain size of the coarse fraction of the total load is the dominant factor
over a wide range of conditions, including weak to moderate strength rocks, low to
moderate rock uplift rates, and relatively uniform to moderately ‘stormy’ discharge
distributions. The supply rate of coarse sediments is the second most important factor in
setting steady-state slopes, while bedrock wear itself is only a significant control for very
resistant rocks and extremely rapid rates of rock uplift.

52
Given the importance of grain size in setting channel slopes, an obvious weakness
of the saltation-abrasion model as applied here, is the use of a single grain diameter to
represent the effect of the wide range of grain sizes that may move as bedload through a
reach of an actively incising channel. Explicitly accounting for grain size distributions
would require use of bedload sediment transport relations that predict sediment flux for
each grain size class (e.g. Parker, 1990). Also needed are new observations and insights
into the role of mixed grain sizes in controlling the thresholds of alluviation and the
relationship between sediment supply, transport capacity, and the partial coverage of
bedrock. Preliminary wear rate measurements (unpublished) using mixed grain sizes in a
bedrock abrasion mill suggest, however, that for relatively low sediment supply rates, the
presence of a grain mixture has little effect. Total wear rates are similar to what would be
obtained by a mass-weighted sum using data from uniform grain size runs.
Assessing the morphologic implications of the saltation-abrasion model is limited
by our lack of understanding of the controls on the grain size distribution of sediment
supplied to the channel network by hillslopes. Here we have treated grain size as
independent of all other variables, however, it is likely that grain size will covary with
rock uplift rate, rock strength, and other variables such as discharge. Steady-state
landscapes underlain by more resistant rocks, eroding more rapidly, or in more arid
climates, are likely to produce and deliver to channels relatively coarser grain size
distributions. Not only will grain size be affected, but the fraction of total load in the
bedload size class Fb should be larger as well.
The hierarchy of slope controlling factors identified by the saltation-abrasion
model provides a useful framework for evaluating the utility of the other incision models

53
discussed above. The most important sediment effect is the threshold of motion, which
surprisingly is not explicitly included in any other published models, although versions of
the excess shear stress model have been used without specifically linking the value to c
to sediment grain size (Tucker and Slingerland, 1997; Tucker and Bras, 1998). Treating
c as a rock strength dependent parameter potentially has the same effect in setting a
minimum slope (Figure 6a), however no direct evidence exists for the existence of a
general detachment threshold. As we noted in the previous companion paper (Sklar and
Dietrich, in press), bedrock abrasion mill experiments failed to detect a detachment
threshold for the erosional mechanism of abrasion by sediment impacts.
The influence of sediment supply on the extent of bedrock exposure in the
channel bed is the second-most important effect that consideration of sediment introduces
to the bedrock incision problem. As we have argued previously (Sklar and Dietrich,
2001), partial bed coverage introduces an important degree of freedom for channel
adjustment. As illustrated above (Figures 6b, 7b and 8b), small changes in channel slope
can result in large changes in the efficiency of bedrock incision, due to shifts in the
percentage of bed alluviation. Interestingly, models that are intended to represent the
cover effect, such as the modified alluvial and parabolic stream power models, can
predict no adjustment in partial bed coverage with variable rock uplift rate, or even
patterns of bed cover adjustment opposite to those predicted by saltation-abrasion model
(Figure 6b).
The case of the non-linear parabolic stream power model illustrates a potential
pitfall in developing geomorphic process models without a strong mechanistic basis.
That model predicts an apparent threshold slope for low uplift rates, which, as described

54
above, has no physical meaning. The non-linear version (n = 2) was proposed to
eliminate the computationally troublesome upper limit to the range of possible erosion
rates predicted by the linear version (n = 1) of the parabolic stream power model (Figure
8b). Unfortunately, choosing parameter values on the basis of mathematical convenience
can lead to profoundly counter-intuitive model behavior as well as reasonable yet wholly
artifactual results.
The tools effect is third in order of importance among sediment effects on
bedrock incision rates. For example, the tools-based model, which includes the tools
effect as well as the threshold of motion, predicts strongly counter-intuitive and highly
divergent dependencies of slope on rock strength and uplift rate. On the other hand, the
bedload version of the modified alluvial model, which includes the threshold of motion
and cover effects but not the tools effect, is arguably the most likely among the other
models discussed above to produce the results similar to those predicted by saltation-
abrasion model. And only minor differences exist between the predictions of the
published versions of the modified alluvial and parabolic stream power models, both of
which include the cover effect while only the latter accounts for the tools effect.
Finally, the suspension effect is the least important of the four sediment effects in
influencing predicted steady-state channel slopes. Although the version of the saltation-
abrasion model lacking the suspension-extrapolation term was not tested here, the fact
that the maximum possible bedload abrasion rate was encountered at low values of
transport stage relative to the threshold of suspension (Figure 9) indicates that the
suspension effect is not responsible for the existence of that instability. As discussed in
detail by Sklar and Dietrich (in press), the decline in incision rate with increasing shear

55
stress is fundamentally due to the elongation of saltation trajectories, even without any
shift in transport mode. Rather than being a computation annoyance, this result may be
evidence of a real effect in river profile evolution. Over-steepening of tributary channels
upstream of junctions could lead to hanging valleys, or formation of migrating
knickpoints. These hypotheses illustrate the benefits of developing geomorphic process
models beginning with the detailed mechanics, and remaining faithful to the original
assumptions through the subsequent steps of scaling up and exploring morphologic
implications.
6.0 Conclusion
We have demonstrated how the saltation-abrasion model, which was derived at
the spatial and temporal scale of individual bedload sediment saltation impacts, can be
scaled up for application at the scale of longitudinal profile evolution. Because the core
model has no freely adjustable parameters, the additional parameters introduced in
scaling up have explicit physical significance. As a result, the sensitivity of specific
morphologic implications, such as predicted steady-state channel slope, to those
parameter values can be meaningfully evaluated. Two important ideas are introduced in
our treatment of the problem of balancing the tradeoffs between the magnitude and
frequency of high flow events that transport bedload sediment and incise bedrock. First
is the use of a real discharge record, and estimates of long-term mean denudation rates,
from a reference field site, to make sure that the method respects the constraints that the
total average annual runoff and sediment yield must be conveyed through a given reach
of river. Second, because we recognize the contribution of low flow discharges to the

56
annual water budget, we can rationally select the representative high flow magnitude and
duration that most closely approximates the net effect of the full distribution of
discharges in transporting bedload. We find that moderate magnitude discharges best
represent the full distribution because low magnitude discharges fall below the threshold
of motion, and high magnitude discharges occur so infrequently that the associated
bedload sediment supply is too great to allow bedrock exposure in the channel bed.
Comparison of the behavior of the saltation-abrasion model with a range of other
bedrock incision models, each of which fails to capture at least one of the four effects of
sediment, reveals important differences with significant morphologic implications.
Models that lack the threshold of motion over-predict incision rate for low shear stresses
and under-predict the steady-state channel slope for low to moderate rock uplift rates and
rock strengths. Models that lack the cover effect over-predict incision rate for high
sediment supply rates, and fail to represent the degree of freedom in channel adjustment
provided by partial bed coverage. Models that lack the tools effect over-predict incision
rate for low sediment supply rates, and do not allow for the possibility that incision rate
can decline for increases in shear stress above a peak value.
Two conceptual tools help clarify the controls on steady-state channel slope
predicted by the saltation-abrasion model. The first is the idea that total slope can be
considered a sum of components, each responsible for one of three tasks of a river
channel at steady state, listed here in order of descending importance overall:
mobilization of bed sediments, transport of supplied coarse sediment load, and incision
into bedrock at the rate of rock uplift. The second is the non-dimensional representation
of the incision model as a function of transport stage and relative sediment supply. Using

57
these tools we have shown that the influence of rock uplift rate, rock strength and the
‘storminess’ of the discharge distribution on steady-state slope are expressed primarily
through their effect on relative sediment supply, which controls the extent of bed
exposure in the channel bed.
7.0 Acknowledgements
We thank G. Hauer, J. Kirchner, A. Luers, J. Roering, M. Stacey, and J. Stock for
stimulating and insightful discussions. This work was supported by the National Center
for Earth-Surface Dynamics, by NSF grant EAR 970608, and by a Switzer
Environmental Fellowship to L.S.S.

58
8.0 Notation
A Upstream drainage area (km2) L
2
Ao Drainage area at channel head (km2) L
2
b Coefficient for change in Qw with A (m3s
-1km
-2p) L
3/2pT
-1
c Coefficient for change in W with Qw (m1-3f
/sf) L
1-3fT
-f
d Coefficient for change in A with x (km2-h
) L2-h
Do Grain diameter at channel head (m) L
Ds Grain diameter (m) L
Ei Instantaneous bedrock erosion rate (m/s) LT-1
Elt Long term bedrock erosion rate (mm/yr) LT-1
E*
Non-dimensional erosion rate per unit rock resistance --
f Exponent for change in W with Qw --
Fb Fraction of total load in coarse bedload size class --
Ft Fraction of total time when high flow occurs --
Fw Fraction of total runoff carried by high flows --
g Gravitational acceleration (m/s2) LT
-2
h Exponent for change in A with x --
Kf Tools (Foley, 1980) model efficiency (ms2/kg) M
-1LT
2
Kh Tools (Howard et al., 1994) model efficiency (m0.9
s1.5
kg-1
) M-1
L0.9
T1.5
Kma Modified alluvial model efficiency (m/kg) M-1
L
Kma-b Bedload modified alluvial model efficiency (m/kg) M-1
L
Kn Stream power modified alluvial model efficiency (m2n+1
s-1
W-n
) M-n
LT3n-1

59
Kp Parabolic stream power model efficiency (m2n-1
W1-n
kg-1
) LM-n
T3(n-1)
Kqa Stream power sediment transport coefficient (kgm2s
-1W
-1) T
2
kv Saltation-abrasion rock resistance coefficient --
K Placeholder erosional efficiency coefficient --
K Stream power model efficiency (m1+n
s-1
W-n
) M-n
L1-n
T3n-1
K Unit stream power model efficiency (m2n+1
s-1
W-n
) M-n
LT3n-1
K Shear stress model efficiency (ms-1
Pa-1
) M-n
L1+n
T2n-1
K cr Excess shear stress (rock) model efficiency (ms-1
Pa-1
) M-n
L1+n
T2n-1
K cs Excess shear stress (sediment) model efficiency (ms-1
Pa-1
) M-n
L1+n
T2n-1
Ir Impact rate per unit area per unit time (1/m2-s) L
-2T
-1
Lr Representative reach length (m) L
N Number of discharges in flow record --
m Rank of individual discharge --
n Exponent in stream power and shear stress models --
p Exponent for change in Qw with A --
Pne Probability of non-exceedance --
Qs Sediment supply (kg/s) MT-1
QsM Mean annual sediment supply (kg/s) MT-1
Qt Sediment transport capacity (kg/s) MT-1
QtT Total-runoff method sediment transport capacity (kg/s) MT-1
QtH High-flow sediment transport capacity (kg/s) MT-1
Qw Discharge (m3/s) L
3T
-1
QwT Representative discharge, total-runoff method (m3/s) L
3T
-1

60
QwH Representative discharge, high flow method (m3/s) L
3T
-1
QwL Residual low flow discharge, high flow method (m3/s) L
3T
-1
Rb Non-dimensional bouyant density --
Rep Particle Reynolds number --
Rh Hydraulic radius (m) L
S Channel slope --
SD Slope component for threshold of sediment motion --
SQs Slope increment for transport of supplied sediment --
SE Slope increment for erosion of bedrock --
Ur Rock uplift rate (mm/yr) LT-1
u* Flow shear velocity (m/s) LT-1
W Channel width (m) L
wf Particle fall velocity (m/s) LT-1
x Distance downstream of channel head (km) L
xo Unchanneled distance (km) L
Y Rock modulus of elasticity (MPa) ML-1
T-2
Downstream fining exponent --
QtA Annual transport capacity summed over flow record (kg/yr) MT-1
QtH Annual transport capacity of representative high flow (kg/yr) MT-1
Placehold flow intensity variable --
Sediment porosity --
Unit stream power (W/m2) MT
-3
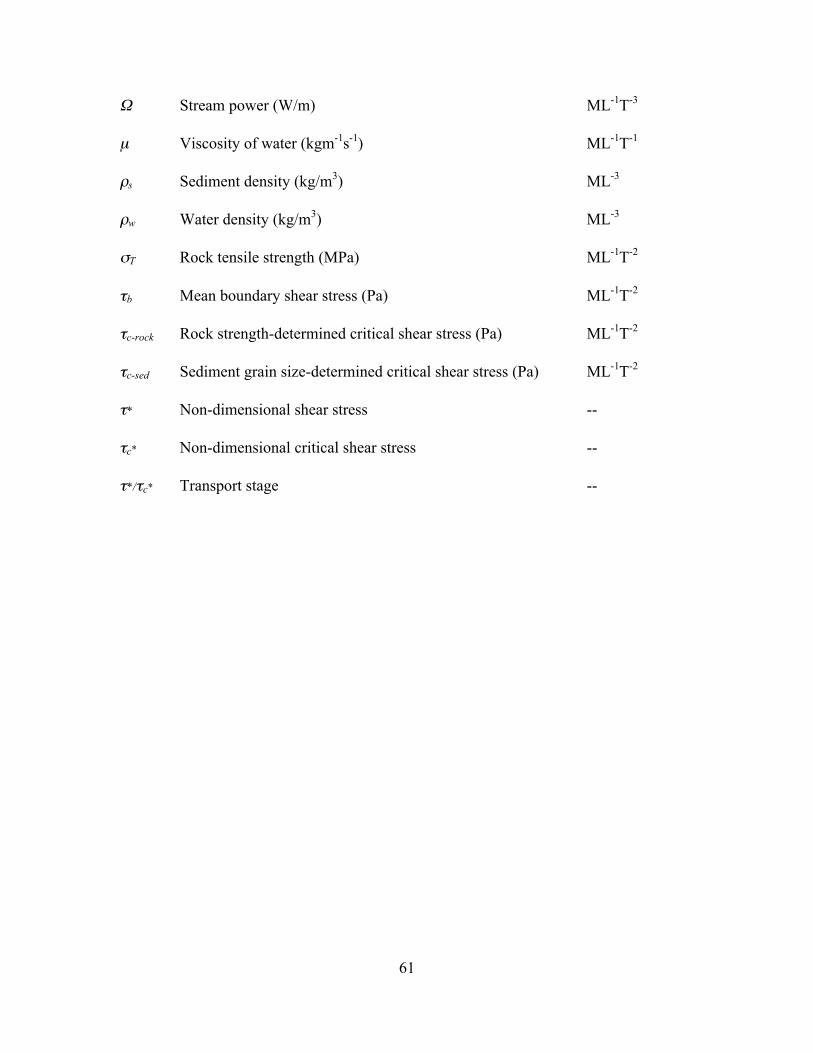
61
Stream power (W/m) ML-1
T-3
µ Viscosity of water (kgm-1
s-1
) ML-1
T-1
s Sediment density (kg/m3) ML
-3
w Water density (kg/m3) ML
-3
T Rock tensile strength (MPa) ML-1
T-2
b Mean boundary shear stress (Pa) ML-1
T-2
c-rock Rock strength-determined critical shear stress (Pa) ML-1
T-2
c-sed Sediment grain size-determined critical shear stress (Pa) ML-1
T-2
* Non-dimensional shear stress --
c* Non-dimensional critical shear stress --
*/ c* Transport stage --

62
9.0 References cited
Bathurst, J.C., 1993. Flow resistance through the channel network. In: Beven, K. and
Kirkby, M.J. (Eds.), Channel Network Hydrology. John Wiley & Sons,
Chichester.
Beaumont, C., Fullsack, P., and Hamilton, J., 1992. Erosional control of active
compressional orogens. In: McClay, K.R. (Ed.), Thrust Tectonics. Chapman and
Hall, New York, 1-18.
Bezinge, A., 1987. Glacial meltwater streams, hydrology and sediment transport: the case
of the Grande Dixence Hydroelectricity Scheme. In: Gardiner, V. (Ed.)
International Geomorphology 1986, Part I., 473-498.
Bitter, J.G.A., 1963. A study of erosion phenomena, part I. Wear, 6, 5-21.
Bogaart, P.W., Tucker, G.E., and de Vries, J.J., 2003. Channel network morphology and
sediment dynamics under alternating periglacial and temperate regimes: a
numerical simulation study. Geomorphology, 54, 257 – 277.
Bras, R.L., 1990. Hydrology: An Introduction to Hydrologic Science. Addison Wesley,
Reading Massachusetts.
Brierley, G.J. and Hickin, E.J., 1985. The downstream gradation of particle sizes in the
Squamish River, British Columbia. Earth Surface Processes and Landforms, 10,
597-606.
Brush, L.M., 1961. Drainage basins, channels, and flow characteristics of selected
streams in Central Pennsylvania. U. S. Geol. Surv. Prof. Pap., 282-F.

63
Buffington, J.M. and Montgomery, D.R., 1997. A systematic analysis of eight decades of
incipient motion studies, with special reference to gravel-bedded rivers. Water
Resources Research, 33, 1993-2029.
Bull, W. B., 1979, Threshold of critical power in streams, Geol. Soc. Amer. Bull. 90:
453-464.
Dietrich, W.E., 1982. Settling velocity of natural particles. Water Resources Research,
18, 1615-1626.
Dietrich, W.E., Montgomery, D.R., 1998. Hillslopes, channels, and landscape scale. In:
Sposito, G. (Ed), Scale dependence and scale invariance in hydrology. Cambridge
University Press, Cambridge, p. 30-60.
Fernandez-Luque, R., van Beek, R., 1976. Erosion and transport of bed-load sediment.
Journal of Hydraulic Research, 14, 127-144.
Foley, M.G., 1980. Bedrock incision by streams. Geological Society of American
Bulletin, part II, 91, 2189-2213.
Hack, J.T., 1960. Interpretation of erosional topography in humid temperate regions.
American Journal of Science, 258A, 80-97.
Head, W.J., Harr, M.E., 1970. The development of a model to predict the erosion of
materials by natural contaminants. Wear, 15, 1-46.
Howard, A.D., 1980. Thresholds in river regime. In: Coates, D.R.,Vitek, J.D. (Eds.), The
Concept of Geomorphic Thresholds. Allen and Unwin, Boston, 227-258.
Howard, A.D., 1994. A detachment-limited model of drainage basin evolution. Water
Resources Research, 30, 2261-2285.

64
Howard, A.D., 1998. Long profile development of bedrock channels: Interaction of
weathering, mass wasting, bed erosion, and sediment transport. In: Tinkler, K.,
Wohl, E.E. (Eds.), Rivers Over Rock: Fluvial Processes in Bedrock Channels.
Geophysical Monograph Series, 107, American Geophysical Union, Washington
D.C., p. 237-260.
Howard, A.D., Kerby, G., 1983. Channel changes in badlands. Geol. Soc. of Am. Bull.,
94, 739-752.
Howard, A.D., Dietrich, W.E., Seidl, M.A., 1994. Modeling fluvial erosion on regional to
continental scales. J. Geophys. Res., 99, 13,971-13,986.
Kooi, H., Beaumont, C., 1996. Large-scale geomorphology: classical concepts reconciled
and integrated with contemporary ideas via a surface processes model. J.
Geophys. Res., 101, 3361-3386.
Lave J., Avouac, J.P., 2001. Fluvial incision and tectonic uplift across the Himalayas of
central Nepal. Journal of Geophysical Research, 106(B11), 26561-26591.
Leopold, L.B., 1994. A view of the river. Harvard University Press, Cambridge, 298 p.
Mackin, J.H., 1948. Concept of the graded river. Geological Society of America Bulletin,
59, 463 – 512.
Merritts, D., Bull, W.B., 1989. Interpreting Quaternary uplift rates at the Mendocino
triple junction, northern California, from uplifted marine terraces. Geology, 17,
1020-1024.
Moglen, G.E., Bras, R.L., 1995. The effect of spatial heterogeneities on geomorphic
expression in a model of basin evolution. Water Resources Research, 31, 2613-
2623.

65
Montgomery, D.R., Dietrich, W.E., 1988. Where do channels begin? Nature, 336, 232-
234.
Montgomery, D.R., Dietrich, W.E., 1992. Channel initiation and the problem of
landscape scale. Science, 255, 826-830.
Morris, P.H., Williams, D.J., 1999. A worldwide correlation for exponential bed particle
size variation in subaerial aqueous flows. Earth Surface Processes and Landforms,
24, 835-847.
Parker, G., 1990. Surface-based bedload transport relation for gravel rivers. Journal of
Hydraulic Research, 28(4), 417-436.
Ohmori, H., 1991. Change in the mathematical function type describing the longitudinal
profile of a river through an evolutionary process. Journal of Geology, 99, 97-110.
Rouse, H., 1937. Modern conceptions of the mechanics of turbulence. Trans. ASCE, 90,
463 – 543.
Schumm, S.A., 1973. Geomorphic thresholds and complex response of drainage systems.
In: Morisawa, M. (ed.), Fluvial Geomorphology. Publications in Geomorphology,
Binghamton University (SUNY), p. 299 – 310.
Seidl, M.A., Dietrich, W.E., 1992. The problem of channel erosion into bedrock. In:
Schmidt, K.H., de Ploey, J. (Eds.), Functional geomorphology. Catena suppl. 23,
p. 101-124.
Sklar, L.S., Dietrich, W.E., 1998. River Longitudinal Profiles and Bedrock Incision
Models: Stream Power and the Influence of Sediment Supply. In: Tinkler, K.,
Wohl, E.E. (Eds.), Rivers Over Rock: Fluvial Processes in Bedrock Channels.

66
Geophysical Monograph Series, 107, American Geophysical Union, Washington
D.C., p. 237-260.
Sklar L.S., Dietrich, W.E., 2001. Sediment and Rock Strength Controls on River Incision
into Bedrock. Geology, 29, 1087-1090.
Sklar L.S., Dietrich, W.E., in press. A mechanistic model for river incision into bedrock
by saltating bedload. Water Resources Research, manuscript 2003wr002496.
Snow, R.S., Slingerland, R.L., 1987. Mathematical modeling of graded river profiles.
Journal of Geology, 95, 15-33.
Tomkin, J.H., Brandon, M.T., Pazzaglia, F.J., Barbour, J., Willett, S.D., 2003.
Quantitative testing of bedrock incision models, Clearwater River, WA. Journal
of Geophysical Research.
Tucker, G.E., Bras, R.L., 1998. Hillslope processes, drainage density, and landscape
morphology. Water Resources Research, 34, 2751-2764.
Tucker, G.E., Bras, R.L., 2000. A stochastic approach to modeling the role of rainfall
variability in drainage basin evolution. Water Resources Research, 36, 1953-
1964.
Tucker, G., Slingerland, R., 1994. Erosional dynamics, flexural isostasy, and long-lived
escarpments: a numerical modeling study. J. Geophys. Res., 99, 12,229-12,243.
Tucker, G.E. and Slingerland, R.L., 1996. Predicting sediment flux from fold and thrust
belts. Basin Research, 8, 329-349.
Tucker, G.E. and Slingerland, R., 1997. Drainage basin responses to climate change.
Water Resources Research, 33(8), 2031-2047.

67
Tucker, G.E. and Whipple, K.X., 2002. Topographic outcomes predicted by stream
erosion models: Sensitivity analysis and intermodel comparison. Journal of
Geophysical Research, 107(B9), 2179.
van der Beek, P., Bishop, P., 2003. Cenozoic river profile development in the Upper
Lachlan catchment (SE Australia) as a test of quantitative fluvial incision models, J.
Geophys. Res., 108(B6), 2309.
Whipple, K.X., Tucker, G.E., 1999. Dynamics of the stream-power river incision model:
Implications for height limits of mountain ranges, landscape response timescales,
and research needs. Journal of Geophysical Research, 104B, 17661-17674.
Whipple, K.X., Tucker, G.E., 2002. Implications of sediment-flux-dependent river
incision models for landscape evolution. Journal of Geophysical Research-Solid
Earth, Vol. 107, 2039.
Whipple, K.X., Hancock, G.S., Anderson, R.S., 2000. River incision into bedrock:
Mechanics and relative efficacy of plucking, abrasion, and cavitation. Geological
Society of America Bulletin, 112, 490-503.
Wiberg, P.L., Smith, J.D., 1985. A theoretical model for saltating grains in water. J.
Geophys. Res., 90(C4), 7341-7354.
Willett, S.D., 1999, Orogeny and orography: The effects of erosion on the structure of
mountain belts. Journal of Geophysical Research, 104, 28957-28981.
Willgoose, G., Bras, R.L., and Rodriguez-Iturbe, I., 1991. A coupled channel network
growth and hillslope evolution model 1. Theory. Water Resources Research, 27,
1671-1684.

Table 1. Incision model comparison: classification, eqn. 19 model parameters and ref. site parameterization
Class Eqn Model a b c d K (for ref. site) Original citation
I 21 Unit Stream Power [SP] 1 0 0 0 0.18 (mm/yr)/(W/m2) Seidl and Dietrich, 1992
I 22 Shear Stress [SS] 1 0 0 0 0.41 (mm/yr)/Pa Howard and Kerby, 1983
I 23 Excess Shear Stress (rock) [ESS-rock] - c (rock) 1 0 0 0 0.20 (mm/yr)/Pa Howard et al., 1994
I Dimensionless Shear Stress * 1 0 0 0 400 mm yr –1 Lave and Avouac, 2000
II 24 Excess Shear Stress (sediment) [ESS-sed] - c (sed) 1 0 0 0 1.0 (mm/yr)/Pa This study
II Dimensionless Excess Shear Stress */ c* 1 0 0 0 962 mm/yr This study
II Alt Dimensionless Excess Shear Stress */ c* - 1 1 0 0 0 28.9 mm/yr This study
III 26 Modified-Alluvial (n=1) [MA(1)] 1 0 1 0 2.7 (mm/yr)/(W/m2) Beaumont et al., 1992
III 26 Modified-Alluvial (n=2) [MA(2)] 2 0 1 0 0.0106 (mm/yr)/(W2/m4) Whipple and Tucker, 2002
IV 27 Modified-Alluvial (Bedload) [MA(bdld)] */ c* - 1 1.5 0 1 0 225 (mm/yr)/(kg/s) This study
V 28 Tools [Tools] */ c* - 1 -0.5 1 0 0 0.405 (mm/yr)/(kg/s) Foley, 1980; this study
VI 30 Parabolic Stream Power (n=1) [SPP(1)] 0 1 1 0 0.353 (mm/yr)/(W/m2) Whipple and Tucker, 2002
VI 30 Parabolic Stream Power (n=2) [SPP(2)] 1 1 1 0 0.003 (mm/yr)/(w2/m4) Whipple and Tucker, 2002
VII 1 Saltation-Abrasion (no suspension) */ c* - 1 -0.5 1 1 0 2.70 (mm/yr)/(kg/s) Sklar and Dietrich, in press
VIII 1 Saltation-Abrasion [SA] */ c*- 1 -0.5 1 1 1 2.70 (mm/yr)/(kg/s) Sklar and Dietrich, in press

69
Figure captions
Figure 1. Cumulative distribution of mean daily discharges from 24 year record of
USGS gauge at South Fork Eel River reference site, (USGS gauge
11475500) ‘near Branscom’, California.
Figure 2. Determination of a model high-flow discharge that best represents the
integrated effect of the full distribution of discharge and sediment supply
events on bedload transport and river incision into bedrock. (a) Fraction of
total runoff carried by representative high flow discharge as a function of
the fraction of total time that high flow occurs. (b) Variation in
representative discharge with high flow time fraction for two formulations,
a single discharge that carries the total annual runoff (QwT), and a pair of
low-flow (QwL) and high-flow (QwH) discharges between which total
annual runoff is partitioned. (c) Variation with high flow time fraction, for
the total runoff formulation, of sediment transport capacity (QtT), and for
the high flow formulation, sediment transport capacity (QtH) and sediment
supply (Qs), assuming all bedload transport occurs during the
representative high-flow discharge. (d) Variation with high flow time
fraction of: the ratio of sediment supply (Qs) to high flow transport
capacity (QtH), assumed equivalent to the extent of bedrock exposure; the
ratio of the net annual high flow transport capacity to the net annual
transport capacity integrated over the full gauged discharge distribution,
which peaks closest to unity at Ft = 0.0437; and the ratio of sediment

70
supply to the transport capacity of the representative discharge using the
total runoff formulation (QtT).
Figure 3. Instantaneous bedrock erosion rate as a function of sediment supply for
four classes of incision models that each account for different sets of
effects of sediment, calculated holding all other variables constant at
South Fork Eel River references site conditions. Open circle indicates the
instantaneous incision rate that corresponds to the assumed long term
bedrock erosion rate at the reference site, for Ft = 0.0437.
Figure 4. Bedrock incision rate (mm/yr) predicted by various models (contours, axis
out of the page, logarithmic spacing) as a function of transport stage and
relative sediment supply (Qs/Qt), for reference site values of grain size (Ds
= 0.06 m) and rock tensile strength ( T = 7.0 MPa).
Figure 5. Bedrock erosion rate as a function of transport stage for various incision
models, for constant relative sediment supply (Qs/Qt = 0.5). Model
abbreviations listed in Table 1.
Figure 6. Influence of variable rock uplift rate on: a. steady-state channel slope for
various models; b. fraction of bed covered for models that account for
cover effect; and c. fraction of total slope due to the slope components
responsible for grain motion (SDs), bedload sediment transport ( SQs) and
bedrock wear ( SE) as predicted by the saltation-abrasion model.
Reference site indicated by open circle. Maximum possible incision rate
for saltation-abrasion model, for reference site conditions, indicated by
asterisk.
71
Figure 7. Influence of variable rock tensile strength on: a. steady-state channel slope
for various models; b. fraction of bed covered for models that account for
cover effect; and c. fraction of total slope due to the slope components
responsible for grain motion (SDs), bedload sediment transport ( SQs) and
bedrock wear ( SE) as predicted by the saltation-abrasion model.
Reference site indicated by open circle. Maximum possible incision rate
for saltation-abrasion model, for reference site conditions, indicated by
asterisk.
Figure 8. Influence of variable high flow time fraction parameter on: a. steady-state
channel slope for various models; b. fraction of bed covered for models
that account for cover effect; and c. fraction of total slope due to the slope
components responsible for grain motion (SDs), bedload sediment transport
( SQs) and bedrock wear ( SE) as predicted by the saltation-abrasion
model. Reference site indicated by open circle. Maximum possible
incision rate for linear parabolic stream power model, for reference site
conditions, indicated by asterisk.
Figure 9. Non-dimensional bedrock erosion rate (E* = Ei T2/ sY(gDs)
3/2 x 10
-15;
contours, axis out of the page) as a function of transport stage and relative
sediment supply, showing plotting position path for the calculation of
steady-state channel slope predicted by the saltation-abrasion model
shown in Figures 6, 7 and 8.

0
0.2
0.4
0.6
0.8
1
0.01 0.1 1 10 100 1000
Non
-Exc
eede
nce
Pro
babi
lity
Pne
Mean Daily Discharge Qw (m3/s)
Figure 1

0
0.2
0.4
0.6
0.8
1
0.001 0.01 0.1 1
Hig
h F
low
Run
off f
ract
ion
Fw
a
10-1
100
101
102
103
104
0.001 0.01 0.1 1
Dis
char
ge (
m3 /s
)
bQwh
Qwt
Qwl
100
101
102
103
104
105
0.001 0.01 0.1 1
Sed
imen
t Flu
x (k
g/s)
c
Qct
Qch
Qsh
0.0
0.2
0.4
0.6
0.8
1.0
0.001 0.01 0.1 1
Sed
imen
t Flu
x R
atio
High Flow Time Fraction Ft
d
Qs / Qch
Σ Qch /Σ Qca
Qs / Qct
Figure 2

0
10
20
30
40
50
0 10 20 30 40 50
Cover and Tools EffectsCover Effect Only
Tools Effect OnlyNo Sediment Effects
Inst
anta
neou
s E
rosi
on R
ate
(mm
/yr)
Sediment Supply (kg/s)
Figure 3

0.1 1 10 100
Transport Stage (τ*/τc*)
l. Saltation-Abrasion
10 100No
ErosionNo
Erosion
Class VIII25
0
0.1 1 10 100
Transport Stage (τ*/τc*)
l. Saltation-Abrasion
10 100No
ErosionNo
Erosion
Class VIII25
0
0.1 1 10 100
Transport Stage (τ* /τc*)
k. Saltation-Abrasion (no susp.)
10
1000
100No
Erosion
Class VII
4000
0.1 1 10 100
0
0.2
0.4
0.6
0.8
1
Transport Stage (τ* /τc*)
h. Tools
10 1000
100
NoErosion
Class V
0.1 1 10 100
0
0.2
0.4
0.6
0.8
1
Transport Stage (τ* /τc*)
j. Stream Power-Parabolic (n=2)
1
500,
000
100,
000
10,0
00
1000
0.00
1
0.1
10 100
Class VI
0.1 1 10 100
0
0.2
0.4
0.6
0.8
1Transport Stage (τ* /τc*)
0.4
4000
1000
100
101
i. Stream Power-Parabolic (n=1) Class VI
0.1 1 10 100
Transport Stage (τ* /τc*)
10 10,0
00
1,00
0
100
g. Modified-Alluvial (bedload)
NoErosion
Class IV
0
0.2
0.4
0.6
0.8
1
0.1 1 10 100
Qs/Q
t
Transport Stage (τ* /τc*)
0.01
1,00
0,00
0
100,
000
10,0
00
1,00
0
100
1010.1
f. Modified-Alluvial (n=2) Class III
Transport Stage (τ*/τc*)
0.1 1 10 100
0
0.2
0.4
0.6
0.8
1
0.1 1 10 100
Qs/Q
t
Transport Stage (τ* /τc*)
5000
1000
1001
10
e. Modified-Alluvial (n=1) Class III
0
0.2
0.4
0.6
0.8
1
0.1 1 10 100
Qs/Q
t
Transport Stage (τ* /τc*)
2500
100
10
d. Excess Shear Stress (sediment) Class II
NoErosion 10
000
0.2
0.4
0.6
0.8
1
0.1 1 10 100
Qs/Q
t
Transport Stage (τ* /τc*)
400
100
10c. Excess Shear Stress (rock) Class I
NoErosion
0
0.2
0.4
0.6
0.8
1
0.1 1 10 100
Qs/Q
t
Transport Stage (τ* /τc*)
1000
100
102
b. Shear Stress Class I
0
0.2
0.4
0.6
0.8
1
0.1 1 10 100
Qs/Q
t
Transport Stage (τ* /τc*)
4000
100
101
a. Stream Power
1000
0.3
Class I
Figure 4

10-1
100
101
102
103
104
10-1 100 101 102
Ero
sion
Rat
e (m
m/y
r)
Transport Stage (τ*/τc*)
(1-Qs/Qt) = 0.5
SP
SSESS(R)
ESS(S)
MA(1)
MA(2) MA(Bdld)SPP(1)
SPP(2)
Tools
SaltationAbrasion
SA(NoSusp)
Figure 5

0
20
40
60
80
100
0.001 0.01 0.1 1 10
% B
ed C
over
ed (
Qs/
Qt)
B
SA
MA(1), MA(Bdld), SPP(1)
MA(2)SPP(2)
*
0
0.2
0.4
0.6
0.8
1
0.001 0.01 0.1 1 10
Slo
pe F
ract
ion
(∆S
i/S)
Rock Uplift Rate (mm/yr)
SDs
∆SQs
∆SE C
Saltation-Abrasion
10-4
10-3
10-2
10-1
0.001 0.01 0.1 1 10
Saltation-AbrasionSP, MA(1), SPP(1)Shear StressExcessStress(rock)ExcessStress(sed)
Modified-Alluvial(2)Mod-Alluvial(Bdld)SP-Parabolic(2)Tools
Cha
nnel
Slo
pe
A
*
Figure 6

0
20
40
60
80
100
1 10
Saltation-AbrasionMA(1), MA(Bdld), SPP(2)SPP(1)MA(2)
% B
edC
over
ed (
Qs/Q
t)
Sigma T
B
*
0
0.2
0.4
0.6
0.8
1
1 10
Slo
pe F
ract
ion
(∆S
i/S)
Rock Tensile Strength (MPa)
SDs
∆SQs
∆SE
Saltation-Abrasion
82
C
4 6 20
10-4
10-3
10-2
10-1
1 10
Saltation-AbrasionStream PowerShear StressExcessStress(rock)ExcessStress(sed)
MA (1) and SPP (2)Modified Alluvial (2)Modified Alluvial (Bdld)SP Parabolic (1)Tools
Cha
nnel
Slo
pe
Rock Tensile Strength (MPa)
A
Figure 7

0
0.2
0.4
0.6
0.8
1
0.01 0.1 1
Saltation-AbrasionMA(1), MA(Bdld), SPP(2)Modified Alluvial (2)SP Parabolic (1)
% B
edC
over
ed (
Qs/Q
t)
Sigma T
B
*
0
0.2
0.4
0.6
0.8
1
0.01 0.1 1
Slo
pe F
ract
ion
(∆S
i/S)
High Flow Time Fraction
SDs
∆SQs
∆SE
Saltation-Abrasion
C
10-3
10-2
10-1
0.01 0.1 1
Saltation-AbrasionStream PowerSS and ESS(sed)ExcessStress (rock)Modified Alluvial (1)
Modified Alluvial (2)Modified Alluvial (bdld)SP-Parabolic(1)SP-Parabolic(2)Tools
Cha
nnel
Slo
pe
A
Figure 8

S = f (σT )S = f (Ur ) and S = f (Ft )
0
0.2
0.4
0.6
0.8
1
1 10
Rel
ativ
e S
edim
ent S
uppl
y (Q
s/Q
t)
Transport Stage (τ*/τc*)
4 62 8 20 30
Figure 9
3 71 2 4 6
* *