the role of public policies for energy technology development999901/fulltext01.pdfthe role of public...
TRANSCRIPT

LICENTIATE T H E S I S
Department of Business Administration, Technology and Social SciencesEconomics Unit
The Role of Public Policies for Energy Technology Development: Their Innovation Effects and Interaction
Kristoffer Bäckström
ISSN 1402-1757ISBN 978-91-7583-252-4 (print)ISBN 978-91-7583-253-1 (pdf)
Luleå University of Technology 2015
Kristoffer B
äckström T
he Role of Public Policies for E
nergy Technology Developm
ent: Their Innovation Effects and Interaction


The Role of Public Policies for Energy Technology Development:
Their Innovation Effects and Interaction
KRISTOFFER BÄCKSTRÖM
Economics UnitLuleå University of Technology
SE-971 87 LuleåSweden
Phone: +46-920-492890E-mail: [email protected]
Licentiate Thesis2015

Printed by Luleå University of Technology, Graphic Production 2015
ISSN 1402-1757 ISBN 978-91-7583-252-4 (print)ISBN 978-91-7583-253-1 (pdf)
Luleå 2015
www.ltu.se
i
Abstract
The overall purpose of this thesis is to analyze the role of public policies for technological development (i.e., innovation) in the renewable energy sector. The thesis consists of an introductory part and three self-contained papers.
Paper I investigates the innovation effects of renewable energy support policies and their interaction in the empirical context of solar photovoltaic (PV) technology. This is achieved by using data on solar PV patent counts and policies targeting solar PV development across 13 countries over the time period 1978-2008. These policies include public R&D support to solar PV as well as two different types of production support schemes: feed-in tariffs (FIT) and renewable energy certificates (REC). The data are applied to a negative binomial model and the results indicate that: (a) both FIT and REC schemes stimulate solar PV patenting activityalthough the impact of the former is of a larger magnitude; (b) public R&D has been more influential than the production support schemes in inducing solar PV innovation; and (c) policy interaction exists in that the innovation effect of public R&D support is greater at the margin if it is accompanied by the use of FIT schemes for solar PV.
Paper II analyzes the role of pilot and demonstration plants (PDPs) in technological development. As surprisingly little explicit attention has been devoted to this issue in prior research, the existing literature is synthesized and categorized, and an agenda is proposed for future work. Scholarly work on PDPs can be found across several research fields and the discussion in the paper is organized around three research streams: engineering and natural science research, technology and innovation management, and innovation systems. Based on searches in key bibliographic databases more than 200 publications were identified and reviewed. According to the literature synthesis, the plants bridge basic knowledge generation and technological breakthroughs on the one hand (promoted by public R&D support), and exploitation of new technology for commercial use on the other (promoted by production support schemes). Still, more research on the subject is needed. For instance, the role of PDPsfor inducing innovation needs to be assessed in a rigorous empirical setting as this issue has only been researched in conceptual studies or retrospective case studies based entirely on qualitative or descriptive approaches.
Paper III provides an econometric analysis of the innovation impacts of publicly funded PDP activities in the case of advanced biofuel technology. This is achieved by using data on biofuel patent counts and PDPs across eight European countries over the time period 1980-2011. It is acknowledged that PDPs have two main objectives: testing and optimization of technology (experimental PDPs), and diffusion and commercialization of technology(exemplary PDPs). The data are applied to a negative binomial model and indicate that: (a) PDP activities are overall positively correlated with biofuel patents; (b) experimental PDPsare more innovation-promoting than exemplary PDPs; and (c) experimental PDP activitiesencourage innovation also indirectly through knowledge spillovers.
The overall conclusion is that environmental policy encourages renewable energy innovation. Public R&D support as well as production support schemes are important for inducing innovation, and there are interactions between these policy types which must be acknowledged when designing public support. As public R&D support is more innovation-promoting when accompanied by the use of certain production support schemes, these policies should be employed simultaneously. Moreover, publicly funded PDP activities fosterinnovation and thus, their role must also be acknowledged when designing public policy.


iii
To Hannah


v
Table of Contents
Abstract ...................................................................................................................................... i
Acknowledgements ................................................................................................................. vii
Preface ....................................................................................................................................... 1
Paper I: Bäckström, K., R. Lundmark, and P. Söderholm (2015). The Innovation Effects of Renewable Energy Policies and Their Interaction: The Case of Solar PV. Submitted to Energy Economics.
Paper II: Frishammar, J., P. Söderholm, K. Bäckström, H. Hellsmark, and H. Ylinenpää (2015). The role of pilot and demonstration plants in technological development: synthesis and directions for future research.Technology Analysis & Strategic Management, 27: 1-18. (Reprinted with permission.)
Paper III: Bäckström, K. (2015). What are the Innovation Effects of Pilot and Demonstration Plants? The Case of Advanced Biofuels in the Transport Sector. Accepted for presentation at the 23rd European Biomass Conference and Exhibition, Vienna, June 1-4, 2015.


vii
Acknowledgements
This thesis is the result of a two and half year long journey which has been rewarding in many aspects, but also challenging at times – which I think postgraduate studies in economicsshould be. There are a number of people who has made this journey possible, and for this they deserve my gratitude. First of all, I would like to thank my supervisor Professor Robert Lundmark. Your insightful comments and reflections on numerous drafts of this thesis have been indispensable for me when writing it, and thanks for always keeping your office door open for me and my questions. I would also like to thank my assistant supervisor Professor Patrik Söderholm. Your excellence in the field has served to raise the quality of this thesismany times over. In addition, I would also like to thank the foundations and the people behind them who have supported my work financially. Financial contributions from the Bio4Energy research environment, the Swedish Research Council Formas and the Ragnar SöderbergResearch Foundation are gratefully acknowledged.
During this journey, I’ve been given the great opportunity to receive feedback by the distinguished members of the Luleå Economics International Advisory Board: Research Professor Carol Dahl, Colorado School of Mines; Senior Fellow Carolyn Fischer, Resources for the Future; and Professor Nicholas Hanley, University of St Andrews. Thank you for all your insightful questions and comments! I am also grateful to all my past and present colleagues at the Economics Unit in Luleå: Anna K-R, Anna M, Bo, Camilla, Elin, Elisabeth, Fredrik, Hans, Jerry, Jesper, Johan, Jonas, Kristina, Linda, Magnus, Olle, Petter, Thomas, Vishal and Åsa. Thank you for your support, and especially for the nice atmosphere at our workplace!
The completion of this thesis is, of course, also a result of the imperative support of friends and family. Thank you mom for the many hours you have spent helping me to improve my skills in reading and writing when growing up, and most importantly for your endless encouragement. And thank you dad for spending so many hours to help me sharpen my skills in mathematics and academic writing, and especially for always believing in me. I’m confident that without this foundation and support, my college studies and postgraduate studies would have been much more difficult. Finally, I would also like to thank my lovely girlfriend Hannah. Your love, patience and support have made this journey so much easier! And thanks for putting up with me working so many evenings and weekends when writing this thesis.
Luleå, a sunny Thursday afternoon in March 2015
Kristoffer Bäckström


1
Preface
1. Introduction
Curbing greenhouse gas emissions is important for avoiding unacceptable impacts on the climate system. Consequently, in many countries a policy priority has been the development of renewable energy technologies, which is important not only for limiting carbon emissions but also for increasing energy security and improving air quality. As suggested by Kneese and Schultze (1975), the effects of environmental policies on technology development (i.e., innovation) may, in the long run, be one of the most prominent determinants of success or failure of environmental protection efforts, a seminal insight as valid today as when it was written. For instance, policy-induced innovation may reduce the cost of compliance with policy goals and the environmental effects of economic and social activities are greatly affected by the rate and direction of technological change.
In liberalized energy markets the circumstances can often be unfavorable for renewable energy technologies – at present they are typically relatively more expensive than the incumbent technologies and especially if the price of carbon dioxide emissions is low (e.g., IEA, 2011). There may also be path dependency in the direction of technological change, locking the economy into the use of existing fossil fuel based energy technology (Acemoglu et al., 2012). For the above reasons there is a need to understand more closely the process of technological innovation in the renewable energy sector, and the ways in which different public policies can be used to promote this process.
Empirical research linking environmental policy and innovation indicates an overall positive correlation between the two, and suggests that two main policy types are important for renewable energy innovation: public R&D support and production support schemes (e.g., Johnstone et al., 2010; Rübbelke and Weiss, 2011; Lundmark and Bäckström et al., 2015).These policies are important for technology development since they promote basic knowledge generation (resulting from public R&D), and because they encourage learning-by-doing in the sense that technology performance improves as capacity and production expands (resulting from production support schemes). However, the potential interaction effects between thepolicies have never been assessed in a rigorous empirical setting, while being discussed and emphasized in theoretical research (e.g., Sagar and van der Zwaan, 2006; Kline and Rosenberg, 1986). For instance, the introduction of new technology may affect future innovations (the re-development of a technology) through learning and vice versa. R&D programs that are entirely designed in isolation from practical applications could therefore be less effective.
While the importance of public R&D support and production support schemes has been acknowledged in scholarly work focusing on policy-induced innovation, the role of publicly (but also privately) funded pilot and demonstration plant (PDP) activities has been largely

2
overlooked. As suggested by Sagar and Gallagher (2004), PDPs can be important for innovation since they bridge basic knowledge generation and technological breakthroughs on the one hand, and industrial application and adoption on the other. For instance, these plantscan enable technology development and optimization in an industrially relevant scale, and they may reduce institutional and market related uncertainties which could hamper diffusion and learning-by-doing (e.g., tacit knowledge acquired during manufacturing) (e.g., Karlström and Sandén, 2004; Lefevre, 1984). In addition, they can also generate knowledge spillovers which are beneficial to society (e.g., Hendry et al., 2010). A lack of understanding of the importance of PDPs for technology development makes it difficult for policy makers to design appropriate support and to realize the full social benefits of these activities. The existing work on PDPs consists of conceptual studies or retrospective case studies based entirely on qualitative or descriptive approaches. While the innovation impacts of PDPs have been confirmed in such studies, their role for technical development remains to be investigated rigorously with an econometric approach.
Following the above, the overall purpose of this thesis is to analyze the role of public policies for technological innovation in the renewable energy sector. While the issue has been examined in prior work, further research is warranted in a number of important respects. First, the potential interaction effects between public R&D support and production support schemes have never been analyzed with an econometric approach. Second, while previous research efforts focus on the role of these policy types for inducing innovation, the role of publicly (but also privately) funded PDPs has been largely overlooked. Third, and finally, the innovation impacts of PDPs remain to be investigated in a quantitative empirical setting. These areas are addressed, respectively, in the three papers which follow.
2. Measuring Innovative Output with Patent Counts
Since innovative output cannot be measured in itself, some proxy variable must be employed.Still, the number of proxies available is scarce and only a few of them are suitable indicators of innovative output. Two proxies sometimes used are R&D expenditures and counts of scientific personnel. These proxies are, however, imperfect indicators at best since they constitute inputs to the innovation activities and they do not necessarily result in technical development (e.g., Johnstone et al., 2010). Patent counts are a more suitable proxy since they are outputs of such activities, and they have a close link to inventions as most economically significant inventions are patented (e.g., Dernis and Kahn, 2004). Moreover, patents contain detailed information about inventions which facilitates identification of specific technologies such as solar photovoltaic (PV) when compiling the data, and patent information is both readily available and in discrete form. While public R&D expenditures and counts of scientific personnel are also publicly available and easily subject to statistical analysis, they are generally more difficult to disaggregate to specific technologies. For these reasons, patent counts are one of the most frequently used indicators of innovation (e.g., Johnstone et al., 2010; Brunnermeier and Cohen, 2003; Popp, 2002; Lanjouw and Mody, 1996). In this thesis, the innovation impacts of public policies are examined empirically by using patent counts.

3
2.1 Fundamentals of PatentingA patent is basically a legal instrument protecting an invention by granting its holder the right to exclude others from using, making or selling the patented invention during a defined time period and in the country or countries concerned by the protection (e.g., OECD, 2009). For aninvention to be eligible for patent protection it must be novel, involve an inventive step, and be commercially viable (e.g., Dernis and Guellec, 2001). Patents are granted to inventions in all technological fields while laws of nature, natural phenomena and abstract ideas are not patentable.
The core patenting process, which is similar in all countries, starts with the filing of a patent application at a patent office. The applicant must pay administrative fees which vary significantly across patent offices, and the invention must be disclosed in detail in the application (e.g., OECD, 2009). This is followed by a novelty search where the patent office evaluates the novelty of the invention against relevant scientific and technical literature, and asearch report as well as the application is published 18 months after the filing date (with some exceptions for certain applications at specific patent offices). After this the application is studied for determining whether the invention is non-obvious to a person with ordinary skill in the art and if it is capable of industrial application.1 If granted, a patent can be maintained as long as 20 years from the filing date provided that the holder pays annual renewal fees (e.g., Dernis and Guellec, 2001). If these fees are not paid, the patent is revoked by the patent office.
Patent rights are provided only within the jurisdiction of a patent office where an application has been granted. For instance, a patent granted by the Swedish patent office will only provide protection in Sweden. To protect the same invention in Germany, an additional application must be filed to the German patent office. The applicant can file parallel applications in this way to obtain patent rights in multiple countries, but it is also possible to file an application at a regional office such as the European Patent Office (EPO), or to submit an international application via the Patent Cooperation Treaty (PCT) administered by the World Intellectual Property Organization (WIPO) which automatically designates all PCT signatory states for protection. A patent application is usually first filed to the national patent office of the applicant to protect the invention in the domestic market, and this is later followed by foreign filings. Still, an application can be filed initially to any patent office around the world and the decision to apply for patent protection in certain markets depends on the strategy of the applicant.
2.2 Patent Data Issues and Patent-Based IndicatorsCompiling patent statistics is difficult as patents are generated through complex legal and economic processes. Frietsch and Schmoch (2010) argue that meaningful interpretation of patent data necessitates that a number of issues have been considered when compiling the patent information, and these concern that: (a) the comparability of patents is limited across
1 Even though an invention is found to be novel, it is not patentable if deemed obvious to a person with ordinary skills in the art.

4
countries because of heterogeneous laws and practices (e.g., it might take one patent to protect an invention in one country, but several patents in other countries); (b) the patent propensity varies across countries and over time; (c) there are delays in the publishing of patent information causing patent applications to decrease in recent years, and these delays differ across patent offices; and (d) the value distribution of patents is highly skewed. To limit these issues when measuring innovative output in the renewable energy sector, counts of patent applications filed under the PCT as well as counts of ‘transnational patent families’ are employed in this thesis. This is in line with OECD (2009), which recommends using PCT applications or patent family counts when analyzing and comparing innovative output across countries.
2.2.1 The Patent Cooperation Treaty ProcedureThe PCT procedure is international by design since patent protection can be obtained in alarge number of countries following a single international application (i.e., a PCT application). The procedure consists of two phases: an international as well as a regional/national phase (e.g., Frietsch and Schmoch, 2010). The international phase is initiated when a PCT application is filed to WIPO, or a national or regional patent office which then transmits the application to WIPO. A PCT application must be submitted within a 12-month period following the first patent application worldwide for a given invention, the so-called ‘priority filing’, which is often filed to the national patent office of the applicant. A PCT application can, however, also be filed immediately as a priority filing (e.g., Dernis and Guellec, 2001). After the PCT application has been submitted, an international search report (ISR) is prepared which evaluates the novelty of the given invention. The report and the application are eventually published 18 months after the priority date (the date of the priority filing). Having received the ISR, the applicant may request a second evaluation of the potential patentability of the invention and in such cases an international preliminary report on patentability (IPRP) is prepared. At 30 months from the priority date, the international phase ends as the application is transferred to the PCT signatory states where the decision is made whether patent rights should be granted (however, the ISR as well as the IPRP may influence the decision). After the transfer it takes about six months before the application is published by the regional and national patent offices.
PCT application counts are a suitable proxy for innovative activity. By using PCT data, patent comparability issues across countries are avoided as only international applications are compiled (which all comply with PCT formality requirements). Because of these issues it is generally not recommended to compile statistics from different patent offices (e.g., OECD, 2009). While patent comparability issues could be avoided by compiling statistics at a single national patent office, the data would suffer from ‘home advantage bias’ (e.g., Dernis and Guellec, 2001). Applicants have a particular economic interest in their home market, and applications filed to the domestic patent office are less costly than foreign filings as applicants can work with local attorneys and reduce communication costs (e.g., Frietsch and Schmoch, 2010). Compiling application counts at a national patent office will thus produce biased results as applicants tend to file more patents in their home country than abroad due to economic factors and not because of their relative competitiveness in inventive activity.

5
PCT data suffer from relatively short publication delays when compiled at the international phase (which is what is used in this thesis), a property which is important for up-to-date policy studies. Furthermore, a significant fee is attached to the examination of a PCT application and protection is thus sought once prospects of commercialization are deemed favorable by the applicant. The fee is higher than that of a domestic patent application but it is lower than parallel application in multiple countries. These conditions provide a quality hurdle which eliminates many applications associated with inventions with potentially low economic value. Finally, the issue concerning variations in patent propensity across countries and over time can be controlled for when conducting regression analysis.
2.2.2 Transnational Patent FamiliesA patent family is a set of patents or applications protecting the same invention in different countries or regions around the world (e.g., OECD, 2009). Therefore, the distinction between PCT applications and patent families is not straightforward as PCT’s are often members of patent families already protecting inventions in certain jurisdictions. In this thesis, counts of Derwent World Patents Index (DWPI) families are used to approximate innovative output in advanced biofuel production technology. Specifically, the only DWPI families considered are those containing (at least) a PCT application and/or an application filed to the EPO, and these are commonly referred to as transnational patents (Frietsch and Schmoch, 2010).
Counts of transnational patents are a suitable measure of innovative activity. By imposing the condition that all families must contain a PCT application and/or an application filed to the EPO, all patent families considered must comply with PCT and/or EPO formality requirements. Hence, the data can be regarded as free from patent comparability issues caused by differences in patent rules and practices across countries. Indicators based on counts of transnational patent families are also largely free from home advantage bias since these families contain patents applied for through a specific set of patenting routes and where all applications have a foreign status (e.g., OECD, 2009; Frietsch and Schmoch, 2010). Moreover, transnational patents suffer from relatively short publication delays and they generally cover inventions with high economic value as cross-country patent protection is relatively costly to obtain for the applicant. Protection is thus sought only when the prospects of commercialization are regarded as favorable by the applicant. Finally, variations in patent propensity across countries and over time can be controlled for when conducting regression analysis.
3. Summary of Papers
Paper I: The Innovation Effects of Renewable Energy Policies and Their Interaction: The Case of Solar PV
The aim of this paper is to investigate the innovation impacts of different renewable energy support policies and their interaction in the case of solar photovoltaic (PV) technology. Indoing this solar PV patent counts are employed (to proxy innovation) for 13 countries over the

6
time period 1978-2008, and specific policies targeting solar PV development are included in the analysis. These policies include public R&D support to solar PV as well as two different types of production support schemes: feed-in tariffs (FIT) and renewable energy certificates(REC). Specifically, the interaction between public R&D on the one hand and the two renewable energy production support schemes on the other is tested.
FIT schemes offer price-based support in which the producers of renewable electricity sell at a pre-set (guaranteed) price per kWh generated over a given time period, and price levels are generally differentiated with respect to the technology supported (e.g., solar PV, wind power etc.). A REC scheme, on the other hand, seldom includes separate targets for different types of renewable energy technologies – instead they promote direct competition between the different energy sources. Specifically, the scheme requires retailers to purchase a predetermined amount (in MWh) of renewable electricity. Each MWh of renewable electricity produced in power plants eligible for certificates yields one certificate that can be sold, and compliance is confirmed by the possession of a sufficient number of these. Consequently, amarket for the certificates is established.
Negative binomial regression models are specified and tested in which the dependent variable, solar PV patent counts, is explained by the stringency of the different renewable energy policies, their policy interaction as well as a selection of control variables. Specifically, the paper examines: (a) whether FIT schemes are more innovation-promoting than REC schemes in the renewable energy sector (as is often claimed); (b) whether R&D support induces more solar PV innovation than support to technology diffusion through FIT and REC schemes; and (c) the issue of policy interaction by testing the null hypothesis that a marginal increase in public R&D expenditures to solar PV will have the same impact on patenting activity regardless of whether either FIT or REC schemes are in use or not.
The empirical results suggest that: (a) both FIT and REC schemes encourage solar PV patenting although the impact of the former appears to be more profound; (b) the role of public R&D support is important for solar PV innovation and it appears to be more economically significant for innovation than the different production support schemes; and (c) policy interaction exists in that the effect of public R&D support on innovation is greater at the margin if it is accompanied by the use of FIT schemes for solar PV. A corresponding interaction effect does not emerge in the case of public R&D and the use of REC schemes, possibly due to the relatively strong technology selection pressure under the latter policy.
Paper II: The role of pilot and demonstration plants in technological development: synthesis and directions for future research
The objective of this paper is to synthesize and categorize prior research on pilot and demonstration plants (PDPs), but also to propose an agenda for future work on the subject. In doing this, the ambition is not to carry out an exhaustive survey of all existing work, or to conduct a full-fledged meta-analysis. Instead, key dimensions of existing research are highlighted and it is discussed how the research field can be developed and further improved.

7
As the literature on PDPs is broad, fragmented and found in several research domains, the discussion is organized around three PDP research streams: engineering and natural science research, technology and innovation management, and innovation systems. The properties of the different research streams are described, and previous research is also synthesized into a conceptual framework for better understanding of PDPs.
The synthesis is based on more than 200 publications involving PDPs, among which about 60 is formally referred to in the paper. The bulk of these are peer-reviewed journal articles although some are books, reports, working papers or dissertations. To identify literature of relevance, searches were conducted in key bibliographic databases using key terms such as ‘pilot plant’, ‘demonstration plant’, ‘pilot runs’ etc. By conducting searches and reviewing relevant work, a better understanding of the literature successively developed and new keywords and combinations could be tested. Some references could, however, be identified through a snowball technique and this compensated for the rigidity of ‘mechanistic’ database searches. Finally, literature was chosen on the basis of whether the contents were interesting and had potential to advance knowledge about PDPs.
Based on the literature synthesis it is concluded that the PDP phase does not constitute an isolated activity in the process of new technology deployment. In practice there are loops back to basic R&D as well as from technology diffusion to PDP activities. In other words, PDP activities are closely linked to and may largely overlap basic R&D, technology diffusion, or both. This reasoning suggests that PDPs are not a homogeneous phenomenon as they generally have different roles. Some are closely related to the R&D stage (commonly referred to as experimental PDPs) while others focus on discovering and learning about market opportunities (exemplary PDPs).
The review of the literature indicates that the role of PDPs for innovation has not been rigorously examined based on an econometric approach. Furthermore, the analysis shows that a number of issues deserve increased attention in future work. For instance, there are many different forms of learning taking place in PDPs and these need to be scrutinized in more detail to better understand role of the plants in fostering technological development. Additional research is also called for concerning the issue of how to balance protection of new technology in niches on the one hand, and selection pressure on the other. If protection is too generous, innovators are not forced to deal with negative side effects associated with large scale application of a new technology. However, if selection pressure is too strong different development paths may be obstructed or precluded. Thus, this is an important question for policy makers and private firms.
Paper III: What are the Innovation Effects of Pilot and Demonstration Plants? The Case of Advanced Biofuels in the Transport Sector
The purpose of this paper is to examine the effects of publicly funded PDP activities on innovation in production technology for advanced biofuels. In doing this it is acknowledged that PDPs have two main objectives: testing and optimization of technology in an industrially

8
relevant scale (experimental PDPs), and diffusion and commercialization of products and technology (exemplary PDPs). Technical innovation is measured as patent counts related to production technology for advanced biofuels used in the transport sector.
The empirical analysis builds on a detailed panel data set of eight European countries over the time period 1980-2011. Negative binomial regression models are specified in which the dependent variable, biofuel patent counts, is explained by PDP activities along with a selection of control variables. Specifically, this paper examines: (a) the overall innovation impacts of PDP activities; (b) the innovation effects of PDPs with different objectives; and (c) whether PDPs encourage technology development also indirectly through knowledge spillovers. Sensitivity analyzes are conducted to check the robustness of the results.
Based on the econometric analysis it is concluded that: (a) PDP activities are overall positively correlated with biofuel patenting activity; (b) the main objective of PDPs determine their effectiveness in inducing innovation as experimental plants are more innovation-promoting than exemplary plants; and (c) development activities in experimental PDPsencourage innovation also indirectly through knowledge spillovers.
4. Overall Conclusions
Public policies are important for inducing technological innovation in the renewable energy sector. Public R&D expenditures are important for encouraging innovation by promoting basic knowledge generation and technical breakthroughs. Production support schemes, focusing on promoting industrial application and adoption, are also important for fosteringtechnology development. However, there are also important interaction effects between these policy types. For instance, the gradual diffusion of a technology may reveal areas where additional R&D efforts would be most innovation-promoting and for this reason, public R&D programs should not be designed in isolation from practical application (encouraged by production support schemes). In the specific case of solar photovoltaic (PV) technology it is found that public R&D support is more innovation-promoting when accompanied by the use of feed-in tariff (FIT) schemes. No interaction effect is found between public R&D and renewable energy certificate (REC) schemes. A plausible explanation for this result is that in the REC case more mature (and less costly) technologies tend to become prioritized, and this policy provides only limited opportunities for continuous technology learning in solar PV in turn augmenting the impact of R&D.
Publicly funded pilot and demonstration plants (PDPs) are also important for renewable energy innovation since they bridge technological breakthroughs on the one hand, and exploitation of new technology for commercial use on the other. For instance, the plants offer opportunities for fine-tuning and developing technology in an industrially relevant scale, and they may also function to reduce institutional and market related uncertainties which could hamper diffusion and learning-by-doing (e.g., tacit knowledge acquired during manufacturing). Econometric analysis indicates that PDP activities are overall positively correlated with innovative activity, and that the innovation impacts of PDPs are dependent on

9
their objective. Experimental PDPs, situated close to the R&D stage, are more innovation-promoting than exemplary PDPs which focus mainly on diffusion and commercialization of technology. Since creating customer awareness and discovering market opportunities is of relatively low priority in experimental plants, their development activities are conductedlargely free from pressure of customers. Hence, it is easier to pursue enduring and iterative development efforts when avoiding such pressure, at least in the case of less-developed renewable energy technology. This conclusion is also supported by the finding that FITschemes are more innovation-promoting than REC schemes in the case of solar PV. FIT schemes provide fixed production support for specific technologies such as solar PV, and thus a ‘nursing market’ where the technology may develop largely free from direct competition from other energy sources. REC schemes, on the other hand, encourage direct competition among different energy technologies because of the pressures of the bidding process and the embracement of a large number of renewable energy sources, thus building on the notion that ‘selection pressure’ is important for inducing innovation.
Finally, knowledge creation in experimental PDPs stimulates renewable energy innovation also indirectly through country-level knowledge spillovers. Still, even though these externalities are beneficial to society, it is important that too lenient policies towards sharing of publicly funded intellectual property do not remove the incentives for commercial actors to contribute to these learning processes in the first place. The ‘mixed blessing’ of knowledge spillovers deserve increased attention in future research on PDPs.
References
Acemoglu, D., P. Aghion, L. Bursztyn, and D. Hemous (2012). The Environment and Directed Technical Change. American Economic Review, vol. 102, pp. 131-166.
Brunnermeier, S., and A. Cohen (2003). Determinants of Environmental Innovation in US Manufacturing Industries. Journal of Environmental Economics and Management, vol. 45, pp. 278-293.
Dernis, H., and D. Guellec (2001). Using Patent Counts for Cross-Country Comparisons of Technology Output. STI Review, No. 27.
Dernis, H., and M. Kahn (2004). Triadic Patent Families Methodology. STI Working Paper 2004/2, OECD, Paris.
Frietsch, R., and U. Schmoch (2010). Transnational patents and international markets. Scientometrics, vol. 82, pp. 185-200.
Hendry, C., P. Harborne, and J. Brown (2010). The Uncertain Middle: Innovation lessons for low carbon energy technology from demonstration projects and trials. Advanced Institute of Management Research (AIM), London.
International Energy Agency (IEA) (2011). Technology Roadmap – Biofuels for Transport.OECD, Paris.
Innovation: Evidence Based on Patent Counts. Environmental and Resource Economics,vol. 45, pp. 133-155.

10
Karlström, M., and B. Sandén (2004). Selecting and assessing demonstration projects for technology assessment: The case of fuel cells and hydrogen systems in Sweden. Innovation: Management, Policy & Practice, vol. 6, pp. 286-93.
Kline, S., and N. Rosenberg (1986). An overview of innovation. In The positive sum strategy: Harnessing technology for economic growth, ed. R. Landau and N. Rosenberg, pp. 275-305.Washington, DC: National Academy Press.
Kneese, A., and C. Schultze (1975). Pollution, Prices, and Public Policy. Brookings Institution, Washington, DC.
Lanjouw, J., and A. Mody (1996). Innovation and the International Diffusion of Environmentally Responsive Technology. Research Policy, vol. 25, pp. 549-571.
Lefevre, S. (1984). Using Demonstration Projects to Advance Innovation in Energy. Public Administration Review, vol. 44, pp. 483-490.
Lundmark, R, and K. Bäckström (2015). Bioenergy innovation and energy policy. Economics of Innovation and New Technology, article in press.
Organization for Economic Cooperation and Development (OECD) (2009). OECD Patent Statistics Manual. OECD Publishing, Paris.
Popp, D. (2002). Induced Innovation and Energy Prices. The American Economic Review,vol. 92, pp. 160-180.
Popp, D. (2007). Using the Triadic Patent Family Database to Study Environmental Innovation. OECD, Paris.
Rübbelke, D., and P. Weiss (2011). Environmental Regulations, Market Structure and Technological Progress in Renewable Energy Technology – A Panel Data Study on Wind Turbines. FEEM Working Paper No. 581.2011, Fondazione Eni Enrico Mattei (FEEM), Milan.
Sagar, A., and K. Gallagher (2004). Energy Technology Demonstration and Deployment. In J. Holdren, W. Reilly, J. Rowe, P. Sharp, and J. Grumet (Eds.), Ending the energy stalemate: A bipartisan strategy to meet America’s energy challenges, Belfer Center for Science and International Affairs, Cambridge.
Sagar, A., and B. van der Zwaan (2006). Technological innovation in the energy sector: R&D, deployment, and learning-by-doing. Energy Policy, vol. 34, pp. 2601-2608.

I


The Innovation Effects of Renewable Energy Policies and Their Interaction: The Case of Solar PV*
KRISTOFFER BÄCKSTRÖM*, ROBERT LUNDMARK and PATRIK SÖDERHOLM
Economics UnitLuleå University of Technology
SE-971 87 Luleå, Sweden* Corresponding authorPhone: +46-920-492890
E-mail: [email protected]
AbstractThe objective of this paper is to examine the innovation impacts of different renewable energy support policies and their interaction in the empirical context of solar photovoltaic (PV) technology. This is achieved by using data on solar PV patent counts for 13 countries over the time period 1978-2008. Three policies are included in the analysis: public R&D support to solar PV, fixed feed-in tariffs (FIT), and renewable energy certificate (REC) schemes. The results are overall robust to alternative model specifications, and indicate that: (a) both FIT and REC schemes induce solar PV patenting activity even though the impact of the former policy appears to be more profound; (b) public R&D support has been more influential than FIT and REC schemes in encouraging solar PV innovation; and (c) policy interaction exists in that the impact of public R&D support on innovation is greater at the margin if it is accompanied by the use of FIT schemes for solar PV. A corresponding interaction effect does not emerge in the case of public R&D and the use of REC schemes, possibly due to the relatively strong technology selection pressure under the latter policy.
Keywords: innovation; patents; solar PV; renewable energy policy; policy interaction.
JEL classifications: O34; O38; Q55; Q58.
* An earlier version of this paper was presented at the 37th IAEE International Conference, New York, June 15-18, 2014. Financial support from the Ragnar Söderberg Research Foundation, the Swedish Research Council Formas and the Bio4Energy research environment is gratefully acknowledged, as are valuable comments by the members of the Luleå Economics International Advisory Board: Carol Dahl, Carolyn Fischer and Nicholas Hanley. Any remaining errors reside solely with the authors.


1
1. Introduction
1.1 Background and Contribution
Given the need to limit the increase in global average temperatures to avoid unacceptable impacts on the climate system, the development of low-carbon energy technology such as solar energy and wind power has been a policy priority in many countries. In liberalized energy markets the circumstances can often be unfavorable for renewable energy sources – at present these are typically relatively more expensive than the incumbent technologies and especially if the price of carbon dioxide emissions is low. Moreover, there may also be path dependency in the direction of technological change that locks the economy into the use of older fossil fuel based energy technology (Acemoglu et al., 2012). For the above reasons there is a need to understand more closely the process of technological innovation in the renewable energy sector, and the ways in which different public policies can be used to promote this process.
The empirical research linking energy and environmental policy and innovation constitutes a growing literature stream, and overall the results from such studies indicate a positive effect of public policy on innovation (e.g., Brunnermeier and Cohen, 2003; Lanjouw and Mody, 1996; Noailly and Batrakova, 2010; Popp, 2002). Previous research specifically addressing policy-induced innovation in the renewable energy sector is scarcer, and some of it is based mainly on qualitative or theoretical analysis (e.g., Menanteau et al., 2003; Foxon et al., 2005; Sagar and Zwaan, 2006; Fischer and Newell, 2008). A number of recent empirical studies usequantitative data to investigate technological change in the energy sector and the role of energy prices and policy. For instance, Lanzi and Sue Wing (2011) find a positive relationship between energy prices and innovation in the renewable energy sector. This result is confirmed in Verdolini and Galeotti (2011) who address the innovation impacts of energy prices on different types of energy technologies while also accounting for the influence of international knowledge spillovers. Other important quantitative studies addressing renewable energy innovation include Walz et al. (2008), Karmarkar-Deshmukh and Pray (2009), Rübbelke and Weiss (2011), Noailly and Smeets (2012), Peters et al. (2012), and Nesta et al. (2014). Many of the available studies, though, employ aggregate data for the renewable energy technology sector, and therefore tend to downplay the heterogeneous nature of this sector. For instance, some technologies are technically and commercially relatively mature (e.g., wind power, hydro-power etc.) while others, such as solar photovoltaic (PV), are less developed but may nevertheless show great future potentials. This suggests in turn the existence of differential policy impacts across various types of technologies.
This paper addresses the relationship between public policy support to renewable energy and innovation in the specific empirical context of solar PV, and it considers the specific policies targeting solar PV development in 13 different countries since the late 1970s. These policies include public R&D support to solar PV as well as two different types of production support schemes: feed-in tariffs (FIT) and renewable energy certificates (REC). A FIT scheme is a price-based support in which the producers of renewable electricity sell at a pre-set

2
(guaranteed) price per kWh generated over a given time period (e.g., Couture and Gagnon, 2010). The price levels are typically differentiated with respect to the technology supported. A REC scheme involves an obligation for retailers to purchase a predetermined amount (in MWh) of renewable electricity. Each MWh of renewable electricity produced in power plants eligible for certificates yields one certificate that can be sold. In this way a market for the certificates is established, where the price of these equals the premium revenue (per MWh) that renewable electricity producers must receive to fulfill the obligation. The REC schemes seldom include separate targets for different types of renewable energy technologies; instead they promote direct competition between the different energy sources (e.g., IEA, 2004, 2012a, 2012b). By focusing on the above policies we acknowledge that innovation may be induced both through basic knowledge generation resulting from public R&D, and learning-by-doing (e.g., tacit knowledge acquired during manufacturing). The latter is induced by FIT and REC schemes, which both support renewable energy technology diffusion. Moreover, the innovation impacts of these diffusion-promoting policies may vary due to differences in design (e.g., targeting single versus multiple technologies).
In the frequently cited work by Johnstone et al. (2010), the differential relationships between renewable energy policies and innovation (measured through patent application counts) are analyzed in a cross-country setting. For instance, the study supports the notion that FIT and REC schemes could have different impacts on innovation, and it is found that only the FIT schemes induce innovation in solar energy technology, while the REC schemes instead appear to favor innovation in more mature technologies (e.g., wind power). The present paper draws on this important work, but it also develops the analysis of Johnstone et al. (2010) in a number of important respects.
First, Johnstone et al. (2010) focus on solar energy as an aggregate, thus addressing also solar thermal innovation (e.g., innovations in residential solar thermal systems applied for heating and cooling). At first glance our sole focus on solar PV may appear like a marginal research contribution, but it permits us to establish a more valid link to the two renewable electricity support schemes (both focusing on electricity generation), as well as to the targeted public R&D efforts. In fact, our empirical results shed some new light on the differential impacts of FIT and REC schemes, respectively (see section 4). Second, in contrast to Johnstone et al. (2010), we provide a more detailed assessment of the role of public R&D support by addressing different ways of measuring such policy schemes. Our analysis considers both the role of direct R&D expenditures (with lagged impacts), as well as a specification in which the public R&D expenditures instead add to a knowledge stock with a time lag.
Third and finally, no previous econometric study (including Johnstone et al., 2010) devotes specific attention to the potential interactions between public R&D efforts on the one hand and policy support leading to the diffusion of renewable energy technologies on the other. While the existing theoretical and qualitative literature acknowledges the importance of both R&D and learning-by-doing for innovation outcomes (see also section 2.1), the often frequent

3
iterations between learning and R&D are typically ignored in quantitative work.1 Specifically, learning-by-doing may induce more R&D and raise the rate-of-return on basic research. In the present paper we therefore explicitly test whether the (marginal) impacts of public R&D on solar PV innovation differ depending on the presence of FIT and REC schemes, respectively.
1.2 Purpose and Overall Approach
Following the above, the specific purpose of this paper is to investigate the differential impacts of various types of renewable energy support policies on innovation in solar PV technology. In doing this we address the roles of public R&D expenditures, FIT schemes and REC schemes, as well as the interaction between public R&D on the one hand and the two renewable energy production support schemes on the other. Technical innovation is measured by using counts of patents filed under the so-called Patent Cooperation Treaty (PCT), which can be disaggregated to specific technological areas, including solar PV.
The empirical analysis builds on a detailed panel data set of 13 countries over the time period 1978-2008. We specify reduced form negative binomial (NB) regression models in which the dependent variable, solar PV patent counts, is explained by the stringency of the different renewable energy policies, their policy interaction as well as a selection of control variables (see further section 2.2). Based on the estimation results we calculate elasticities of patenting activity with respect to (marginal) changes in the independent variables, thus permitting us to comment on important differential effects of the respective policies and policy interactions.
Specifically, in the empirical section of the paper we: (a) reexamine the often made claim that FIT schemes are more innovation-promoting than REC schemes in the renewable energy sector (e.g., del Río and Bleda, 2012; Johnstone et al., 2010); (b) investigate whether R&D support induces more solar PV innovation than support to technology diffusion through FIT and REC schemes; and (c) test the null hypothesis that a marginal increase in public R&D expenditures to solar PV will have the same impact on patenting activity regardless of whether either FIT or REC schemes are in use or not. Sensitivity analyzes are conducted to check the robustness of the results.
1.3 The Case of Solar PV
Solar energy is a very promising renewable energy source (de Vries et al., 2007); the solar energy reaching Earth during a single hour roughly corresponds to the amount of energy used by all human activities during one year (IEA, 2010). Our sole focus on solar PV permits the use of clean patent categories (see further section 3.1), thus avoiding innovations in non-electric solar systems applied for residential heating and cooling and therefore facilitating the matching with relevant policy instruments.2
1 This is also evident in the literature specifying so-called two-factor learning curves for different renewable energy technologies (e.g., Klaassen et al., 2005; Ek and Söderholm, 2010), and in which public R&D (which implies learning-by-searching) and learning-by-doing are treated as variables independent of each other. 2 Solar thermal technology also includes electric systems, i.e., concentrating solar power (CSP) (Bradford, 2006; Timilsina et al., 2011). However, although CSP is also primarily used for electricity generation, the global installed capacity is only a fraction of that of solar PV (Braun et al., 2011).

4
During more than a decade solar PV has been the fastest growing renewable energy sector in terms of installed capacity (Kirkegaard et al., 2010). The global PV market has grown by an average rate of 49 percent each year during 2003-2013, and the global cumulative installed PV capacity reached more than 135 GW in 2013 (IEA, 2014a). According to IEA (2014b), the bulk of this capacity was distributed among the following countries (in 2013): Germany (with a 25 % market share), China (14 %), Italy (13 %), Japan (10 %), USA (9 %), Spain (4 %), France (4 %), UK (2 %), Australia (2 %), Belgium (2 %), and India (2 %).3 Solar PV systems can either be grid-connected or stand-alone (off-grid) systems and in 2009, about 85 percent of the global PV capacity was grid-connected (REN21, 2010). This capacity can be installed on private estates and business buildings, but it can also be installed on the ground for large scale applications.
Kirkegaard et al. (2010) argue that the increases in global solar PV capacity can largely be attributed to the implementation of domestic policy support schemes. FIT schemes, REC schemes and public R&D support are important policy instruments used to stimulate solar PV market growth (e.g., Timilsina et al., 2011; Campoccia et al., 2009; Dusonchet and Telaretti, 2010; IEA, 2004). It is frequently asserted that FIT schemes have played a particularly important role since they guarantee a specific remuneration for certain time periods and the support levels (per kWh) often have been based on technology-specific generation costs (e.g., Mendonça, 2007; Fouquet and Johansson, 2008; Langniss et al., 2009; Klein et al., 2010). In contrast, in all of the sample countries using REC schemes, the remuneration varies over the years due to demand and supply changes in the certificate market. Usually in a REC scheme, all renewable energy technologies compete and receive the same level of support (per kWh) (IEA, 2004; 2012a; 2012b). In brief, the solar PV case is motivated both because it is a very promising renewable energy technology and because of variations in the use and the stringency of policy support across countries over time.
1.4 Outline of Paper
In the next section we briefly present some key theoretical underpinnings of the empirical analysis, discuss the pros and cons of patent data as innovation proxies, and outline the model specifications as well as the related econometric issues. Section 3 presents the relevant data sources and definitions, while section 4 displays the empirical results and discusses the key implications of these. In section 5 we outline some final concluding remarks, and provide some suggestions for future research.
2. Methodological Approach and Model Estimation Issues
2.1 Endogenous Technological Change and Patenting Activity
During the last decades, the economics literature on environmental policy and innovation has devoted increased attention to the role of endogenous technological change and innovation (e.g., Gillingham et al., 2008). This implies explicitly addressing the feedback mechanisms by 3 Our data sample (see section 3) includes countries with both high and low shares of the globally installed PV capacity.

5
which market signals and policy may change the direction of technological change towards cleaner (e.g., carbon-free) technology.4 The literature suggests that public policy may induce innovation in a number of ways, and large scale models investigating the interrelationship between the energy system, the climate and the economy typically rely on one of two main channels of policy-induced innovation.5 The first channel is through learning-by-doing in the sense that performance improves as capacity and production expands (e.g., Grubb et al., 2002). In the second case endogenous technological change is instead introduced by assuming that technical progress is the result of past investments in R&D and the ensuing accumulation of a knowledge stock (e.g., Sue Wing, 2006; Löschel, 2002).
Public policies in the renewable energy sector comprise both diffusion-promoting production support (e.g., feed-in tariff (FIT) and renewable energy certificate (REC) schemes) as well as R&D efforts. However, these two policy approaches may also interact in important ways. The innovation process is typically complex, non-linear and highly iterative (e.g., Foray, 2009). For instance, the introduction of new technology will affect future innovations (the re-development of a technology) through learning and vice versa. R&D programs that are entirely designed in isolation from practical applications could therefore be less effective (Arrow et al., 2009). Hendry et al. (2010) provide empirical examples of R&D-learning iterations in the solar photovoltaic (PV) and wind power sectors, e.g., the diffusion of new technology leads to learning that in itself may raise the rate-of-return of additional R&D. Thus, while innovation may be induced directly through the use of single policy instruments, we must also acknowledge the interaction between different types of policies (e.g., production support schemes focusing on demand-driven innovation versus R&D policies addressing technological opportunities).6
Regardless of whether firms are conceptualized as rational and optimizing agents, they undertake R&D investments with the intention of making profits (e.g., Jaffe et al., 2002). The profitability of the investments is determined by their costs as well as their expected return. Schmookler (1966) suggested that increasing market demand is important for innovative activity by incentivizing R&D activities in new directions. Specifically, a larger market offers greater opportunities for firms to recoup their investments. Moreover, changing technological opportunities, for instance scientific and technical advancements, make additional innovation less costly at a fixed level of demand (e.g., Rosenberg, 1982). Finally, much of the produced know-how from R&D activities will spill over to competitors who can imitate at a fraction of
4 This notion dates back to Hicks (1932), who claimed that a change in the relative prices of two production factors will encourage innovations with the aim to economize on the use of the factor which have become relatively more expensive. See Popp (2002) and Newell et al. (1999) for empirical applications on the energy sector. 5 Innovations leading to reductions in renewable energy generation costs can possibly spur tightening of environmental standards as first suggested by Downing and White (1986). Carrión-Flores and Innes (2010) examines this issue empirically by estimating a simultaneous panel data model of environmental innovation and policy stringency, and the findings support the notion of a bi-directional relationship between policy and innovation.6 Innovative output in a country may be affected by policy support in foreign countries as well. Peters et al. (2012) and Verdolini and Galeotti (2011) study this issue by modeling and testing the impacts of international knowledge spillovers resulting from, e.g., technology-push policy support.

6
total costs incurred by the creator. Therefore, legal conditions such as intellectual property rights also determine the profitability of R&D and thus the propensity to engage in innovative activity and patenting (Jaffe, 1988). As legal conditions may differ across countries and over time, the propensity to patent will probably vary across countries and change over time within countries (Jaumotte and Pain, 2005).7
2.2 Model Specifications
The reliance on patent application data necessitates the use of so-called count data modeling. Count data models, using Poisson or negative binomial distributions, have been suggested for estimating the number of occurrences of an event, or event counts (e.g., Maddala, 1983; Cameron and Trivedi, 1998). An event count is defined as the realization of a non-negative integer-valued random variable. In our case, an event count corresponds to the number of solar PV patents filed in a given country and time period.
We first specify two models which do not address any policy interactions. The dependent variable, the total number (counts) of solar PV patent applications (PCT), is assumed to depend on the stringency of the renewable energy support schemes (FIT and REC) as well as the role of public R&D support to solar PV: , = + , + , + , + ( ) + [1] , + + ,
, = + , + , + , + ( ) + [2] , + + ,
where i indexes the cross-section unit (i.e., country) and t indexes time. In the empirical analysis we choose to test two ways of measuring the role of public R&D. The first specification (equation [1]) follows previous work (e.g., Johnstone et al., 2010), and assumes that solar PV patenting activity is influenced directly by annual public R&D expenditures although with a certain time lag (x). This variable is denoted RDEXP. In the second model specification (equation [2]) we assume instead that what matters for solar PV innovation is the build-up of a stock of knowledge over time. Hence, in this approach annual R&D expenditures add to this knowledge stock (RDSTOCK) with a time lag, and it is also assumed that knowledge depreciates over time at a certain rate. In section 3 the details of the variable specifications are presented.
7 Propensity to patent is probably also affected by changes in strategies adopted by firms to capture the rents from innovation and the strategies may differ across countries and over time as well.

7
The models outlined in equations [1]-[2] also include two control variables. In general, factors such as market conditions, scientific capacity and openness to trade will also affect the tendency to innovate (Jaumotte and Pain, 2005), and to address this overall propensity to patent we include the variable TOT, which represents all patent applications filed across the whole spectrum of technological areas. Moreover, the characteristics of intellectual property rights regimes may have a significant influence on the propensity to seek property rights protection rather than relying on some other means to protect intellectual property (e.g., industrial secrecy). For this reason the binary variable TRIPS is included to control for the so-called TRIPS agreement signed in 1994 regulating the trade related aspects of intellectual property rights. This agreement was signed by the WTO member countries, including all of the countries included in our sample, potentially making it easier and more meaningful for innovators to apply for patents (also in other countries). Finally, country-specific dummy variables (D) have been included in both model specifications to control for fixed effects attributed to unobserved factors such as regulatory framework etc. All residual variation in the two models is captured by the additive error terms ( , and , ).
In order to address the potential interaction between public R&D and the two different solar PV support schemes, we also consider two additional model specifications. Specifically, we multiply RDEXP with two discrete dummy variables indicating whether a FIT or a REC scheme, respectively, are in place for each country and time period. This gives us the following two model specifications, again differing with respect to the way in which public R&D support has been operationalized:
, = + , + , + , + ( ) + [3] , + , + , + + ,, = + , + , + , + ( ) + [4] , + , + , + + ,
where the added interaction variables are denoted EXPFIT and EXPREC, respectively. These specifications can be used to test the null hypothesis that the impact of a marginal increase in public R&D support to solar PV has the same impact on patenting activity regardless of whether FIT and/or REC schemes are in place. Finally, , and , are additive error terms.
In brief, the empirical analysis is thus based on four model specifications, hereafter denoted S1-S4: (a) no policy interaction effects and public R&D support measured through lagged R&D expenditures (S1); (b) no interaction effects and public R&D support measured through an R&D-based knowledge stock (S2); (c) interaction effects and lagged R&D expenditures (S3); and (d) interaction effects and the R&D-based knowledge stock (S4).

8
2.3 Econometric Issues
Negative binomial (NB) or Poisson estimators are generally used to fit models in which the dependent variable has a count nature. A NB estimator is used for this study since the latter estimator is derived from an equidispersed distribution (i.e., where the variance equals the mean). Patent data are generally overdispersed, meaning that the variance exceeds the mean, and when Poisson estimators are applied to such data the standard errors can be underestimated (Hilbe, 2011). A NB estimator can however accommodate overdispersion and is also used in other related work (e.g., Johnstone et al., 2010; Rübbelke and Weiss, 2011).
A number of different NB models have been developed and those most commonly used to accommodate overdispersion are the so-called NB1 and NB2 models (Cameron and Trivedi, 1998).8 Allison and Waterman (2002) analyze the performance of different fixed effects NB models, and conclude that the conditional fixed effects NB1 model proposed by Hausman et al. (1984) is not a true fixed effects estimator. Guimarães (2008) reasserts the results of Allison and Waterman (2002) by demonstrating that this model does not control for country-specific fixed effects unless a very specific set of suppositions are met. In addition, by conducting a simulation experiment, Allison and Waterman (2002) find that the unconditional NB model (i.e., a conventional NB2 model with dummy variables to address the fixed effects) performs well even though this model is accompanied by downward bias in the standard error estimates. Given these findings, for our purposes it is suitable to rely on the unconditional NB model. In order to adjust for any potential bias in the standard error estimates, bootstrapped standard errors are computed as suggested by both Hilbe (2011) and Cameron and Trivedi (1998).
All model specifications are estimated using Stata 12 and a modified Newton-Raphson algorithm (i.e., the default setting when employing maximum likelihood estimation). In order to avoid perfect collinearity, the country-specific dummy variable for Germany was omitted from the estimations. Hence, Germany is the reference country in all regressions.
3. Data Sources and Definitions
The empirical analysis in this paper builds on an unbalanced panel data set covering 13 countries over the time period 1978-2008. These include Austria, Belgium, Denmark, France, Germany, Italy, Japan, South Korea, the Netherlands, Spain, Sweden, Switzerland and the United Kingdom (UK). This sample represents both the most progressive countries in the solar photovoltaic (PV) field (e.g., Germany, Italy etc.), as well as countries with less developed solar PV sectors (e.g., Austria, Belgium, Sweden etc.). Due to delays in the publishing of patent information, the rate of applications decrease in recent years (2009-2013)which motivates us to limit the panel data set to an earlier year.
8 The models are based on different variance functions. The NB1 model specifies that the variance of the dependent count variable is equal to a multiple of the mean while the NB2 variance is quadratic in the mean. Different standard error estimates are thus generated by the models, and the most common implementation is the NB2 model (e.g., Cameron and Trivedi, 1998).

9
3.1 The Dependent Variable: Solar PV Patent Counts
In order to measure solar PV innovations (the dependent variable), we have extracted data from the OECD Statistics Database (2013) related to patent applications filed under the so-called Patent Cooperation Treaty (PCT). In line with the recommendations of OECD (2009), the total number of PCT applications is sorted by inventor country of residence and priority date, and the data are rounded to the nearest integer (patents specifying multiple inventor countries were partly attributed to each country by the use of fractional counts). In contrast to, for instance, Johnstone et al. (2010), we employ a purer patent category and focus solely on solar PV. In practice, this means that we consider patent categories concerning: (a) PV systems with concentrators; (b) PV material technologies; and (c) power conversion (all of which are contained and provided in a certain ready-for-use PV category in the OECD Statistics Database).9
Patent counts are probably the most suitable innovation proxy compared to other indicators available, e.g., R&D expenditures and counts of scientific personnel. One important reason for this is that patents are an output measure of innovative activity as opposed to, for instance, R&D expenditures that serve as inputs to such activities (Johnstone et al., 2010). In addition, patents have a close link to inventions, and each patent contains information about the applicant, the inventor and the invention which enable detailed statistical analysis (OECD, 2009). However, using patent counts to approximate innovative activity is associated with a number of problems: (a) not all inventions are patented; (b) the value distribution of patents is highly skewed; and (c) there are differences in patent regimes and patent propensity across countries and over time (Schankerman, 1998; Jaumotte and Pain, 2005; OECD, 2009). In line with Schmoch (1997), we argue that patent counts are positively correlated with non-patented inventive activity, and this mitigates the issue outlined in (a). Moreover, measuring innovation with PCT applications mitigates the issue posed in (b) since a significant fee is attached to the examination of a PCT application (which is higher than that of a domestic application).10
Protection is thus sought once the prospects of commercialization are regarded as favorable by the applicant. Using PCT data also limits the issue posed in (c) as applications are not compiled across a number of patent offices with different rules and practices.11 Differences in
9 Specifically, the following patent classes are contained in this category (expressed in European Classification (ECLA) code): Y02E 10/52 (PV systems with concentrators), Y02E 10/541-546, 10/548 (PV material technologies) and Y02E 10/56 (power conversion, electric or electronic aspects).10 Still, the cost of filing a PCT application is lower than parallel application in multiple countries (OECD,2009).11 As pointed out by an anonymous referee, other patent indicators commonly employed are applications filed to the European Patent Office (EPO) and patent family counts (e.g., triadic patent families). We have opted for PCT applications since EPO data: (a) suffer from relatively long publication delays (since the beginning of the 2000’s a large share of the EPO applications are filed at the EPO with PCT pre-application) (e.g., Frietsch and Schmoch, 2010); and (b) are biased towards applications from European inventors (generally referred to as ‘home advantage bias’) (e.g., OECD, 2009). Moreover, while triadic patent families available in the OECD Statistics Database are relatively free from home advantage bias, these data are incomplete after 2004 due to delays in the publication of patent information. Still, to distinguish between the indicators is not straightforward as EPO applications and PCT’s are often members of patent families protecting inventions in different countries or regions around the world. Nor it is straightforward to distinguish between EPO applications and PCT’s as the majority of the EPO applications originate from the PCT procedure since the beginning of the 2000’s (referred to as Euro-PCT’s) (e.g., OECD, 2009).

10
patent propensity across countries and over time can be controlled for by the inclusion of country fixed effects as well as a variable reflecting national patenting across all technical areas.
Figure 1 displays the PCT data for the sample countries in terms of the number of solar PV patent applications, and their share of the total number of PCT applications (filed over all technological areas). The figure indicates that solar PV patenting activity has increased rapidly since the beginning of the 1990s. The same trend can be observed for the share of solar PV patents in relation to all patent applications. However, there are also significant differences between the sample countries. For instance, since the mid-1990s patent applications in Japan and Germany have increased at a relatively high rate, making these countries the most prominent in solar PV patenting activity. The remaining sample countries did not experience a similar take-off, and most of them saw their solar PV patent applications increase only in the beginning of the 2000s. Among these, the UK, South Korea, France and Italy stand out with the highest number of applications while the figures for Sweden, Denmark and Austria display virtually no positive trend at all.
Figure 1: Solar PV Patent Applications (PCT) in the Sample Countries, 1978-2008Source: OECD (2013).
3.2 The Independent Variables
The independent variables in our model specifications can be divided into three main categories: (a) policy variables; (b) policy interaction variables; and (c) control variables. The policy variables include different measures of the level of support to solar PV either through feed-in tariff (FIT) or renewable energy certificate (REC) schemes or public R&D expenditures. In the FIT case, we have collected data on the total remuneration granted to per unit of electricity generated with solar PV. Specifically, the FIT variable measures the annual tariff levels in US cents per kWh (in 2005 prices), and the data used to construct this variable were obtained from IEA (2004, 2012a, 2012b), Cerveny and Resch (1998), Gipe (2013) and
0.00%
0.20%
0.40%
0.60%
0.80%
1.00%
1.20%
0
100
200
300
400
500
600
700
800
900
1978 1981 1984 1987 1990 1993 1996 1999 2002 2005 2008
Solar PV patents as share of total patentsT
otal
num
ber
of so
lar
PV p
aten
ts in
the
sam
ple
coun
trie
s
Total number of solar PVpatentsSolar PV patents as share oftotal patents

11
various country-specific sources.12 For most countries that have implemented this policy, the schemes specify a fixed total tariff over a certain time period while in a few cases, the schemes involve a premium above the (variable) market retail price for electricity. In the latter cases, we include both the market price and the premium. In the case of REC schemes, we follow Johnstone et al. (2010) and measure policy stringency as the percentage of total electricity use that must be generated by renewable energy sources (including solar PV).These data were obtained from IEA (2004, 2012a, 2012b) and various country-specific sources.13
Figure 2 illustrates the introduction of FIT and REC schemes, respectively, in the sample countries. Some of the countries introduced a FIT scheme already during the 1990s, while the REC schemes were introduced after the turn of the century. All in all, FIT schemes are more prevalent in the solar PV field than are REC schemes. Over the years the average FIT support in real US cents per kWh has increased from approximately US 2 cents in 1991 to about 31 cents in 2008.
Figure 2: The Level of FIT Support and the Introduction of FIT and REC Schemes, 1978-2008Sources: IEA (2004, 2012a, 2012b), Cerveny and Resch (1998),
Gipe (2013) and various country-specific sources.
Public support to solar PV R&D is another important policy variable, and, as was noted above, we have introduced two different ways of measuring the role of this policy. Both measures were constructed by employing annual public R&D expenditure data (million US
12 The FIT data were taken as nominal currency for the year of the publication or legislation and were deflated (to 2005 prices) by using a consumer price index. The figures were also converted to US cents by using market exchange rates. 13 The comparison of policy stringency across countries is far from straightforward since the specific policy designs may differ. This concerns, for instance, what PV systems that are eligible for support and for how long the support will be available (IEA, 2004). In most sample countries small, home-based PV systems are eligible for higher tariffs than relatively large, industrial scale PV systems.
0
2
4
6
8
10
12
0
5
10
15
20
25
30
35
1978 1981 1984 1987 1990 1993 1996 1999 2002 2005 2008
# countries with policy
Ave
rage
FIT
leve
l (U
S ce
nts p
er k
Wh
in
2005
pri
ces)
# countries with FIT policy# countries with REC policyAverage FIT level

12
dollars in 2012 prices) from IEA (2013).14 In model specifications S1 and S3, we include a variable measuring public R&D expenditure to solar PV with a two year time lag (e.g., Braun et al., 2010; Klaassen et al., 2005). Thus, the specification implies that public R&D efforts cannot instantaneously result in more patent applications.
Figure 3 shows the development of public support to solar PV R&D for all 13 sample countries over the time period 1978-2008 (without a time lag). Following the oil crises in the 1970s several of the sample countries increased their energy R&D budgets, often with a strong emphasis on renewable energy sources (Rübbelke and Weiss, 2011). In the mid-1980s, though, public R&D support to solar PV decreased, but started to slightly increase again from the late 1980s and onwards. Over the entire time period, public R&D support was highest in Germany and Japan but relatively generous support was also provided in Italy, the Netherlands and Switzerland. Interestingly, when considering the entire time period, public R&D support in the respective sample countries has been relatively stable. Still, the data for France, Germany, Italy, Korea, and the UK display an increasing trend during the 2000s.
Figure 3: Public R&D Expenditures on Solar PV in the Sample Countries, 1978-2008Source: IEA (2013).
Model specifications S2 and S4 take into account the notion that previous R&D expenditures add to an R&D-based knowledge stock (e.g., Klaassen et al., 2005; Ek and Söderholm, 2010).We have:
, = (1 ) , + , [5]
14 The IEA database covers public expenditures on demonstration activities in addition to R&D. However, the contents of the database are heavily biased towards the latter thus making it suitable to consider the data as mainly related to R&D (e.g., Wiesenthal et al., 2009).
0
5
10
15
20
25
30
35
40
1978 1981 1984 1987 1990 1993 1996 1999 2002 2005 2008
Ave
rage
pub
lic R
&D
exp
endi
ture
s on
sola
r PV
(m
illio
n U
SD in
201
2 pr
ices
)

13
where i indexes the sample countries, t indexes time. In this equation RDSTOCK is the R&D-based knowledge stock for solar PV in country i and time period t, RDEXP are the annual public R&D expenditures, x is the number of years it takes before R&D expenditures add to the knowledge stock, and is the annual depreciation rate of the knowledge stock ([0,1]). In other words, this formulation takes into account that: (a) public R&D support to solar PV does not have an instantaneous effect on the generation of new knowledge, but will only lead to tangible results after some years have lapsed; and (b) knowledge depreciates in that the effects of previous public R&D expenses gradually become outdated (Griliches, 1995).
To construct the knowledge stock variable, we assume a time lag of two years ( = 2), and adepreciation rate of 10 percent ( = 0.10). This suggests a fairly high rate of depreciation of knowledge (e.g., Griliches, 1995; Nordhaus, 2002), but this is reflected in the relatively rapid development of renewable energy technology since the oil crises in the 1970s (McVeigh et al., 2000). Given the uncertainties inherent in these parameter assumptions, though, we conduct a sensitivity analysis investigating the consequences of using alternative depreciation rates and time lags, respectively.
The IEA provides public R&D data for solar PV starting in the year 1974. In this year, the respective domestic R&D expenses were close to zero. These low figures represent our initial conditions when constructing the R&D-based knowledge stock. For instance, the knowledge stock reported in 1990 for a specific country is a function of the annual public R&D expenditures on solar PV during the time period 1974-1988, and with the above depreciation rate attached to the stock. Our two policy interaction variables investigating the relationship between public R&D and the FIT and REC schemes, respectively, draw from the same IEA (2013) data.
Finally, all four model specifications (S1-S4) include two control variables. First, we introduce a dummy variable taking the value of one (1) with the enforcement of the so-called TRIPS agreement in 1995. In this way we control for the agreement’s potential effect on the propensity to patent (see section 2.2).15 Second, we also include a variable measuring total patent applications filed under the PCT regardless of technological area, using data sorted by inventor country and priority date reported in OECD (2013). As was noted above, this provides a proxy for the overall propensity to patent, which may differ across countries as well as over time.
Table 1 summarizes the variables employed in the empirical investigation, and provides some descriptive statistics for each of these. In a few cases (e.g., for the R&D expenditure data), a few observations were missing and this was dealt with by replacing the missing observations with adjacent values or with a mean based on these (depending on what was deemed most 15 The number of patent applications rose significantly on a global level between the mid-1990s and the mid-2000s, in part as a result of the signature of the TRIPS agreement in 1994 (OECD, 2009). In addition, according to OECD (2009), the use of the PCT patenting route expanded during the 1990s which also motivates the inclusion of this variable to test and control for a potential structural break.

14
suitable). When a range of observations was missing, the approach was not applied. The S2 model specification is estimated using a total of 352 observations, while the remaining models build on the use of 350 observations (due to a couple of missing observations for the RDEXPvariable). The descriptive statistics in the table are based on the 350 observations used to estimate S1, S3 and S4.
Table 1: Variable Definitions and Descriptive Statistics
Variables Description and units Mean S.D. Min MaxDependent variable
PCT Total number of solar PV patent applications (counts) 9.303 31.231 0 345Independent variables
FIT Feed-in price granted to solar PV electricity producers (US cents per kWh in 2005 prices) 8.557 17.838 0 78.416
REC Annual targets for electricity produced from renewable energy sources (% out of total electricity use)
0.325 1.737 0 16.3
RDEXP Public R&D expenditures to solar PV with a two-year lag (million USD in 2012 prices) 18.802 32.682 0 225.739
RDSTOCK Public R&D-based knowledge stock for solar PV (million USD in 2012 prices, see section 3.2 for detailed definition)
121.307 207.918 0 1237.652
EXPFIT RDEXP multiplied with a dummy variable taking the value one (1) if a FIT scheme is in place, 0 otherwise 5.248 14.102 0 90.17
EXPRECRDEXP multiplied with a dummy variable taking the value one (1) if a REC scheme is in place, 0 otherwise
3.238 22.243 0 225.739
TRIPS Dummy variable taking the value of one (1) for the years succeeding 1994, 0 otherwise 0.454 0.499 0 1
TOT Total PCT patent filings (count in thousands) 2.355 4.344 0 27.236
4. Empirical Results and Discussion
4.1 Estimation Results from the Negative Binomial Model Specifications
Table 2 presents the regression results of the four model specifications using the negative binomial model (NB2) with bootstrapped standard errors stratified by country and country-specific fixed effects.16 In terms of overall model performance it can be noted that the Newton-Raphson algorithm converged to a maximum after relatively few iterations for all model specifications (6-7 iterations were required for fitting each specification). In addition, a concave (marginally declining) convergence path could be observed. This suggests that all four log-likelihood functions are well-behaved (Gould et al., 2006). Moreover, all model specifications are statistically significant according to the p-values associated with the Wald x2-statistics, thus rejecting the null hypothesis that all of the estimated coefficients are equal to zero. Finally, overdispersion tests suggest that a NB distribution and estimator are better suited than a Poisson for the solar patent data (e.g., Cameron and Trivedi, 1998). Likelihood-
16 The accuracy of the bootstrap estimate (i.e., the bootstrap distribution) in part depends on the number of bootstrap replications. For this reason, we ran all four models (S1-S4) using both 200 and 5.000 replications as a robustness check. The results indicated only small differences with respect to the bootstrapped standard errors, and in Table 2 the results are based on the use of 5.000 replications.

15
ratio tests and Wald tests were conducted and both reject the null hypothesis of equidispersion for all specifications (i.e., that the overdispersion parameter is equal to zero).
Overall, the empirical results in Table 2 indicate that public policy has been a major driver of solar photovoltaic (PV) patents among the sample countries. Specifically, increases in the feed-in tariff (FIT) and renewable energy certificate (REC) support levels, respectively, as well as increases in public R&D support have implied more fertile ground for innovation in solar PV. The results also show that some policy interaction is present in that a given increase in public R&D support will (ceteris paribus) have a stronger impact on patenting activity when the policy is accompanied by a FIT scheme for solar PV. The overall propensity to innovate (measured by total patents) as well as the TRIPS agreement are also important determinants of solar PV patenting behavior.17 Finally, some of the coefficients associated with the country dummy variables were found to be statistically significant (see Table A1 in the Appendix), suggesting that country-specific heterogeneity (assumed to be fixed over time) also explains the variation in solar PV patent applications.
Table 2: Estimation Results from the Negative Binomial Models with Fixed Effects
S1 S2 S3 S4Control variables
TOT 0.069*** (0.001) 0.050* (0.086) 0.109*** (0.000) 0.089*** (0.004) TRIPS 1.895*** (0.000) 1.769*** (0.000) 1.809*** (0.000) 1.774*** (0.000)
Public policiesFIT 0.024*** (0.000) 0.023*** (0.000) 0.016*** (0.000) 0.016*** (0.000)REC 0.135*** (0.000) 0.146*** (0.000) 0.138*** (0.000) 0.143*** (0.000)RDEXP 0.015*** (0.002) ----- 0.012*** (0.001) -----RDSTOCK ----- 0.003*** (0.008) ----- 0.002* (0.067)
Policy interactionEXPFIT ----- ----- 0.017** (0.038) 0.019** (0.030)EXPREC ----- ----- -0.005 (0.325) -0.001 (0.745)Log-likelihood (NB) -630.994 -633.122 -624.203 -626.228
Log-likelihood (Poisson) -892.609 -896.592 -823.097 -829.739
(overdispersion parameter)
0.449 0.473 0.395 0.418
s.e. 0.102 s.e. 0.010 s.e. 0.109 s.e. 0.109
x2 1088.92 1188.43 1097.01 1074.98p > x2 0.000 0.000 0.000 0.000N 350 352 350 350
Note: p-values in parentheses (based on bootstrapped standard errors stratified by country); * p < 0.10; ** p <0.05; *** p < 0.01. Stata automatically provides the log-likelihood of fitting a Poisson model. This statistic is necessary when conducting a likelihood-ratio overdispersion test. 17 Johnstone et al. (2010) also include the price of electricity as an explanatory variable, and they report a statistically significant and positive correlation between this price and the patent counts for solar energy. In our model specifications, though, the FIT variable includes the total remuneration to solar PV production (i.e., the retail market price of electricity plus any premium), thus making the inclusion of the electricity variable redundant. Indeed in most cases the FIT scheme involves a minimum guaranteed fixed price. As a robustness check we included the electricity price in all our models (using the same IEA source as Johnstone et al., 2010), but the associated coefficients were highly statistically insignificant, and the inclusion of this variable also had negligible effects on the remaining parameter estimates.

16
However, while the coefficients reported in Table 2 provide useful information about the signs of the relevant impacts, they do not lend themselves to any meaningful interpretation of the economic significance (i.e., size) of these impacts. Specifically, the estimated coefficients can formally be understood as the difference between the natural logarithms of expected counts (e.g., Hilbe, 2011).18 In order to avoid this interpretation in log-counts and to assess the differential innovation effects of the independent variables, we compute elasticities by taking which is a measure of the elasticity of [ | ] with respect to (i.e., the jth
regressor) (Cameron and Trivedi, 1998). The resulting elasticities are presented in Table 3, and they can be interpreted as the percentage change in solar PV patenting activity following a one percentage change in the relevant independent variable. All but two of these elasticities are statistically significant (at the 10-percent significance level or lower). In the S3 and S4 model specifications, the elasticities for the interaction variable that address the relationship between public solar PV R&D expenditures and REC schemes are statistically insignificant.
Table 3: Estimated Elasticities of Solar PV Patent Counts with Respect to Public Policy Support
S1 S2 S3 S4Control variables
TOT 0.16 *** 0.12 * 0.26 *** 0.21 ***TRIPS 0.86 *** 0.80 *** 0.82 *** 0.81 ***
Public PoliciesFIT 0.21 *** 0.20 *** 0.14 *** 0.14 ***REC 0.04 *** 0.05 *** 0.04 *** 0.05 ***RDEXP 0.28 *** ----- 0.23 *** -----RDSTOCK ----- 0.36 *** ----- 0.24 *
Policy interactionEXPFIT ----- ----- 0.09 ** 0.10 **EXPREC ----- ----- -0.02 0.00
Note: p-values based on bootstrapped standard errors stratified by country; * p < 0.10; ** p < 0.05; *** p <0.01.
The estimated elasticities in Table 3 confirm the positive relationship between different public policies, the overall propensity to patent and the TRIPS agreement on the one hand, and solar PV patent applications on the other. However, the economic significance of the different independent variables differs in important respects. For instance, it is worth noting that while an increase in the overall propensity to patent (TOT) appears to have a positive effect on patent applications in solar PV, this impact is not particularly strong. A one percent increase in TOT only induces a 0.12-0.26 percent increase in solar PV patents (depending on the model specification). One plausible reason for this relatively small effect may be that solar PV is still an immature industry, which is strongly dependent on public support.
Table 3 shows that all in all public policy, both in terms of production support schemes and in terms of public R&D expenditures, has profound impacts on solar PV patenting activity. Initially we focus on the results from the S1 and S2 model specifications (with no policy 18 Mathematically this can be expressed as = log log , where corresponds to the estimated coefficient and is the expected count. The subscripts denote the observation at which an independent variable (x) is evaluated.

17
interaction effects). The elasticities suggest that the levels of support provided through both the FIT and REC schemes have a positive impact on patent applications. The estimated elasticities are however relatively low (ranging from 0.04 to 0.21). Comparing the impacts of the respective policy scheme is complicated, despite using elasticities, as they are expressed in different metrics. To introduce a common measure of policy stringency, we compute the effect of percentage increases in REC targets in terms of prices by employing the elasticity of supply of renewable electricity generation. The supply elasticity has been estimated to 2.67(Johnson, 2014), and suggests that a one percent increase in prices corresponds to a 2.67 percent increase in REC targets (i.e., quantity supplied). Hence, we simply multiply the REC elasticities in Table 3 with 2.67 to obtain the percentage change in patenting following a one percent increase in prices (which is what the FIT elasticities reflect).19 The resulting REC elasticities are smaller than the FIT elasticities, suggesting that the FIT schemes have been more innovation-promoting than the REC schemes. Finally, the role of public R&D support for solar PV innovation is also found to be important. The S1 and S2 model specifications differ in the way the R&D impacts are operationalized, but both indicate positive (lagged) impacts of public R&D support on solar PV patent counts.20 Overall, the role of public R&D is found to be more economically significant for solar PV innovation than that of different production support schemes (not the least the REC scheme).
In model specifications S3 and S4, we test the notion that there could exist important interaction effects between the two different policy categories (public R&D expenditures and production support schemes). The results suggest that we can reject the hypothesis of no interaction effects between public R&D and FIT schemes. Specifically, a marginal increase in any of the two public R&D variables implies (ceteris paribus) a greater spur to patenting activity if a FIT scheme for solar PV is present, compared to a situation where no such scheme is in place. The results from the S3 model specification suggest that a ten percent increase in (lagged) public R&D expenditures will induce a 2.3 percent increase in solar PV patenting activity in the absence of a FIT scheme, but 3.2 percent (2.3 + 0.9) if such a scheme is in use. No corresponding interaction effect between public R&D and REC schemes can be found as the associated elasticities are not statistically significant (see Table 3). This result reinforces the conclusion that the FIT schemes tend to be more innovation-promoting than the REC schemes.
19 S1: 2.67 × 0.04 = 0.1068, and S2: 2.67 × 0.05 = 0.1335. In Johnson (2014), a confidence interval (95 % CI of 1.74, 3.6) is reported along with the point estimate of the elasticity of supply (2.67). As a robustness check, we can multiply the REC elasticities with the upper limit in the confidence interval (3.6), but we would still arrive at the same result: FIT schemes are more innovation-promoting than REC schemes.20 The construction of the R&D-based knowledge stock is based on a two year time lag and a depreciation rate of 10 percent. Since these are uncertain parameters it is useful to test how sensitive these results are to the inclusion of varying assumptions. Such a sensitivity analysis is provided in Table A2 in the Appendix, and it shows that the results are overall robust with respect to different time lags (three-year) and discount rates (5 and 15 percent, respectively). The coefficients associated with the knowledge stock are positive and statistically significant in all alternative models except one, and there are only minor changes in the remaining coefficient estimates.

18
4.2 Discussion
In this section we discuss some of the empirical results, and compare them to the findings of other studies. Overall the results are in line with other work, e.g., the result that renewable energy patents are influenced by the general propensity to patent (e.g., Johnstone et al., 2010; Lundmark and Bäckström, 2015), but we also report some new results and insights.
Our results indicate a positive correlation between the FIT levels and solar patenting activity, and this is consistent with the findings of Johnstone et al. (2010). Nevertheless, while we report a statistically significant but markedly lower impact of REC schemes, Johnstone et al. (2010) cannot reject the null hypothesis that this impact is non-existent. They argue that REC schemes are not likely to stimulate innovations in renewable energy technologies that are relatively immature. One plausible explanation for this difference in results is that in the present work we focus explicitly on solar PV technology, while Johnstone et al. (2010) adopt a broader definition of solar energy technology that embraces also solar thermal innovations (i.e., innovations in residential systems applied for heating and cooling). Since the REC schemes specifically target technologies used for electricity generation purposes (including solar PV) other types of solar energy technology will not be directly affected by this policy.21
The heterogeneous impacts of the different support schemes deserve a more in-depth discussion. Both the FIT and the REC schemes can a priori be assumed to have positive innovation impacts, but in practice the two schemes rely on different conceptions of what nurtures technology learning and innovation. In simple terms this boils down to the question of whether innovation is best nurtured by deliberatively making innovation vulnerable to competition from other technologies (e.g., Hommels et al., 2007), or whether it instead requires the targeted support of protected technological ‘niches’ (e.g., Smith and Raven, 2012).22 The REC schemes encourage direct competition among different energy technologies because of the pressures of the bidding process and the embracement of a large number of renewable energy sources, thus building on the notion that ‘selection pressure’ is important for inducing innovation. The FIT schemes instead provide fixed production support for selected technologies such as solar PV, and thus a ‘nursing market’ in which the technology can develop without much direct competition from other energy sources.
Our empirical results suggest that the protecting strategy has been more successful in inducing solar PV patents than the strategy emphasizing the importance of ‘selection pressure’. The stronger FIT impact may result from the fact that even though these schemes do not promote strong competition across technologies, technical progress increases the producers’ surplus and in this way encourages them to innovate. Within a REC scheme, however, the surplus that is attributed to producers may be significantly more limited since the marginal price could decrease as a result of technical advances (e.g., Menanteau et al., 2003). Moreover, in REC schemes, producers will choose to devote most attention to the currently most cost-effective renewable energy technology options accepted under the policy (e.g., Jaffe et al., 2002; 21 Braun et al. (2011) also point to the problem of mixing different types of solar technologies when investigating innovation patterns and policy impacts. 22 In the economics literature it is often stressed that a proper balance between competition and monopoly (e.g., oligopoly markets) provides the most fertile ground for innovation (e.g., Baumol, 2002).

19
Johnstone et al., 2010; Popp, 2003). Given that solar PV has been relatively expensive compared to other technology options over the time period studied (IEA, 2004), it has not been a strong competitor to, for instance, wind power. This implies that REC schemes have only stimulated limited production of solar PV electricity, and therefore also relatively limited learning-by-doing and innovation activities.
Turning to the role of public R&D in the solar PV field, our results are in line with those reported by, for instance, Braun et al. (2010) and Johnstone et al. (2010), although these studies do not consider nor test different ways of measuring the role of R&D support (i.e., direct expenses versus a build-up of knowledge over time). The results in Table 3 suggest that public R&D has been more influential in inducing solar PV patenting activity than policies supporting the diffusion of solar PV (i.e., FIT and REC schemes). These results are also consistent with some previous two-factor learning curve studies showing higher R&D-induced cost reductions for renewable energy technology such as wind power and solar PV, and often a less prominent role for learning-by-doing following the diffusion of the technology (e.g., Nemet, 2006; Söderholm and Klaassen, 2007; Pizer and Popp, 2008).
Still, the role of R&D in the solar PV innovation process needs further scrutiny and not the least the relationship between public and private R&D. It can be difficult to model these impacts in a consistent manner, this since public R&D support may be used to promote private firms to conduct applied research and run pilot and demonstration projects. Moreover, in practice the roles played by private and public R&D, respectively, likely differ as different technologies develop. In most cases private R&D efforts become more pronounced as a technology matures, while public R&D policy normally should encourage more risk-taking and exploratory R&D activities that are characterized by greater uncertainty in the distribution of project payoffs (e.g., Ek and Söderholm, 2010).
Nevertheless, public R&D programs should not necessarily cease entirely as the technology matures. Innovation requires both R&D and learning-by-doing and for this reason R&D programs should typically not be designed in isolation from practical application (e.g., Arrow et al., 2009). In addition, the gradual diffusion of a certain technology can reveal areas where additional R&D would be most productive. Our results support the notion that public R&D support to solar PV is more effective in the presence of FIT schemes, and this provides quantitative support for the argument made by del Río and Bleda (2012) that complementing FITs with public R&D support will promote innovation. Moreover, our results manifest themselves in one of the practical lessons of the failed so-called ‘Million Solar Roofs’ (1997-2005) program in the USA. This program was criticized for lacking the necessary alignment with R&D efforts, and for not permitting R&D to influence the program plans and methods (Strahs and Tombari, 2006). A follow-up demonstration program, the so-called Solar America Initiative, has therefore been designed to evade this mistake by mixing technology and market development, with the latter being accompanied with substantial R&D and venture capital (Hendry et al., 2010).

20
In the light of our result on policy interaction, it is worth noting that following the oil crises in the 1970’s most developed countries introduced substantial public R&D support for various renewable energy technologies (including solar PV). Still, during the 1980’s this support was typically not accompanied by explicit production support schemes. Our empirical results suggest that this implied lower solar PV innovation activity during this decade (relative to the level of innovation that could have been achieved had the policies been in force simultaneously).
As was noted above, the interaction between public R&D and diffusion-promoting policies was not found with respect to the presence of REC schemes. A plausible explanation for this result is that in the REC case, more mature technologies tend to become prioritized, and this policy provides only limited opportunities for continuous technology learning in solar PV in turn augmenting the impact of R&D. The limited innovation impacts of REC schemes have been argued by Bergek and Jacobsson (2010) in their assessment of the Swedish REC policy.
5. Conclusions and Avenues for Future Research This paper investigates the effect on solar photovoltaic (PV) innovation of renewable energy policies and their interaction. Our results appear robust to alternative model specifications, and indicate that: (a) both feed-in tariff (FIT) schemes and renewable energy certificate (REC)schemes induce solar PV patenting activity even though the impact of the former policy is found to be more profound; (b) public R&D support has been more influential than FIT and REC schemes in encouraging solar PV innovation; and (c) policy interaction exists in that the innovation effect of public R&D support is greater at the margin if it is accompanied by the use of FIT schemes for solar PV.
Overall these results confirm the notion that innovation in the renewable energy field is endogenously determined, and induced by more or less targeted policy instruments. The important role of FIT schemes implies in turn that technical innovation (at least in the case of less mature energy technologies) could, in part, be nurtured through some amount of policy protection. The interaction between public R&D and diffusion-promoting policies does not emerge in the case of public R&D and REC schemes. This is likely due to the relatively strong technology selection pressure under REC schemes, mainly favoring currently cost-effective renewable energy technologies.
Still, it should be clear that a number of issues deserve increased attention in future research. First, the presence of international knowledge spillovers may play an important role in fostering domestic innovation, and this requires different sets of model specifications (e.g., Verdolini and Galeotti, 2011). Second, while this paper identifies an important impact of public R&D efforts on solar PV innovation, this effect may be less pronounced in the case of more mature technologies such as wind power as well as over time as less-developed technologies mature. Greater understanding of such differential impacts across various technologies is important information for policy making.

21
Third, the interaction between private and public R&D during the innovation process also deserves more in-depth empirical research. This also addresses the more general notion that the role of public policy changes (and should change) as the technology develops from basic R&D, through the pilot and demonstration phase, to adoption in the market. Our empirical results confirm the importance of acknowledging the interaction and the iterations between R&D and diffusion policy (e.g., FIT schemes), but this also calls for more detailed studies employing more disaggregated data on the design of innovation policy (e.g., the allocation of public funds between basic R&D and pilot plants). Furthermore, Liang and Fiorino (2013) argue that for renewable energy innovation, the level of R&D support loses explanatory power to policy stability in the long run, thus suggesting that the ways in which policies are implemented (e.g., perceived stability over time) may matter just as much as the level of support provided. Fourth, and finally, it should of course be emphasized that the type of empirical research presented in this paper must also be complemented with more normative research on the economic efficiency of different innovation policies as well as policy mixes in the renewable energy sector (e.g., Aalbers et al., 2013).
References
Aalbers, R., V. Shestalova, and V. Kocsis (2013). Innovation Policy for Directed Technical Change in the Power Sector. Energy Policy, vol. 63, pp. 1240-1250.
Acemoglu, D., P. Aghion, L. Bursztyn, and D. Hemous (2012). The Environment and Directed Technical Change. American Economic Review, vol. 102, pp. 131-166.
Allison, P., and R. Waterman (2002). Fixed-Effects Negative Binomial Regression Models. Sociological Methodology, vol. 32, pp. 247-265.
Arrow, K. J., L. Cohen, P. A. David, R. W. Hahn, C. D. Kolstad, L. Lane, W. D. Montgomery, R. R. Nelson, R. G. Noll, and A. E. Smith (2009). A Statement on the Appropriate Role for Research and Development in Climate Policy. Economists’ Voice,vol. 6, www.bepress.com.
Baumol, W. J. (2002). The Free-Market Innovation Machine. Princeton University Press, Princeton.
Bergek, A., and S. Jacobssson (2010). Are Tradable Green Certificates a Cost-efficient Policy Friving Technical Change or a Rent-generating Machine? Lessons from Sweden 2003–2008. Energy Policy, vol. 38, pp. 1255-1271.
Bradford, T. (2006). Solar Revolution: The Economic Transformation of the Global Energy Industry. MIT Press, Cambridge.
Braun, F., J. Schmidt-Ehmcke, and P. Zloczysti (2010). Innovative Activity in Wind and Solar Technology: Empirical Evidence on Knowledge Spillovers Using Patent Data. DIW Berlin Discussion Papers 993, Deutsches Institut für Wirtschaftsforschung, Berlin.
Braun, F., E. Hooper, R. Wand, and P. Zloczysti (2011). Holding a Candle to Innovation in Concentrating Solar Power Technologies: A Study Drawing on Patent Data. Energy Policy, vol. 39, pp. 2441-2456.
Brunnermeier, S., and A. Cohen (2003). Determinants of Environmental Innovation in US Manufacturing Industries. Journal of Environmental Economics and Management, vol. 45, pp. 278-293.

22
Cameron, A., and P. Trivedi (1998). Regression Analysis of Count Data. Cambridge University Press, New York.
Campoccia, A., L. Dusonchet, E. Telaretti, and G. Zizzo (2009). Comparative Analysis of Different Supporting Measures for the Production of Electrical Energy by Solar PV and Wind Systems: Four Representative European Cases. Solar Energy, vol. 83, pp. 287-297.
Carrión-Flores, C., and R. Innes (2010). Environmental innovation and environmental performance. Journal of Environmental Economics and Management, vol. 59, pp. 27-42.
Cerveny, M., and G. Resch (1998). Feed-in Tariffs and Regulations Concerning Renewable Energy Electricity Generation in European Countries. Energieverwertungsagentur (E.V.A.), Vienna.
Couture, T., and Y. Gagnon (2010). An Analysis of Feed-in Tariff Remuneration Models: Implications for Renewable Energy Investment. Energy Policy, vol. 38, pp. 955-965.
De Vries, B., D. van Vuuren, and M. Hoogwijk (2007). Renewable Energy Sources: Their Global Potential for the First-half of the 21st Century at a Global Level: An Integrated approach. Energy Policy, vol. 35, pp. 2590-2610.
Del Río, P., and M. Bleda (2012). Comparing the Innovation Effects of Support Schemes for Renewable Electricity Technologies: A Function of Innovation Approach. Energy Policy,vol. 50, pp. 272-282.
Downing, P., and L. White (1986). Innovation in Pollution Control. Journal of Environmental Economics and Management, vol. 13, pp. 18-29.
Dusonchet, L., and E. Telaretti (2010). Economic Analysis of Different Supporting Policies for the Production of Electrical Energy by Solar Photovoltaics in Western European Union Countries. Energy Policy, vol. 38, pp. 3297-3308.
Ek, K., and P. Söderholm (2010). Technology Learning in the Presence of Public R&D: The Case of European Wind Power. Ecological Economics, vol. 69, pp. 2356-2362.
Fischer, C., and R. Newell (2008). Environmental and Technology Policies for Climate Mitigation. Journal of Environmental Economics and Management, vol. 55, pp. 142-162.
Foray, D. (Ed.) (2009). The New Economics of Technology Policy. Edward Elgar, Cheltenham.
Foxon, T. J., R. Gross, A. Chase, J. Howes, A. Arnall, and D. Anderson (2005). UK Innovation Systems for New and Renewable Energy Technologies: Drivers, Barriers and Systems Failures. Energy Policy, vol. 33, pp. 2123-2137.
Fouquet, D., and T. Johansson (2008). European Renewable Energy Policy at Crossroads: Focus on Electricity Support Mechanisms. Energy Policy, vol. 36, pp. 4079-4092.
Gillingham, K., R. G. Newell, and W. A. Pizer (2008). Modeling Endogenous Technological Change for Climate Policy Analysis. Energy Economics, vol. 30, pp. 2734-2753.
Gipe, P. (2013). Tables of Feed-In Tariffs Worldwide. www.wind-works.org/cms/index.php?id=92.
Gould, W., J. Pitblado, and W. Sribney (2006). Maximum Likelihood Estimation with Stata (3rd edition). Stata Press, College Station.
Griliches, Z. (1995). R&D and Productivity: Econometric Results and Measurement Issues. In P. Stoneman (Ed.), Handbook of Economics on Innovation and Technological Change,Blackwell, Oxford.

23
Grubb, M., J. Köhler, and D. Anderson (2002). Induced Technical Change in Energy and Environmental Modelling: Analytical Approaches and Policy Implications. Annual Review of Energy and the Environment, vol. 27, pp. 271-308.
Guimarães, P. (2008). The Fixed Effects Negative Binomial Model Revisited. Economics Letters, vol. 99, pp. 63-66.
Hausman, J., B. Hall, and Z. Griliches (1984). Economic Models for Count Data with an Application to the Patents-R&D Relationship. Econometrica, vol. 52, pp. 909-938.
Hendry, C., P. Harborne, and J. Brown (2010). So What do Innovating Companies Really Get from Publicly Funded Demonstration Project and Trials? Innovation Lessons from Solar Photovoltaics and Wind. Energy Policy, vol. 38, pp. 4507-4519.
Hicks, J. (1932). The Theory of Wages. Macmillan, London.Hilbe, J. (2011). Negative Binomial Regression. Cambridge University Press, New York.Hommels, A., P. Peters, and W. Bijker (2007). Techno Therapy or Nurtured Niches?
Technology Studies and the Evaluation of Radical Innovations. Research Policy, vol. 36, pp. 1088-1099.
International Energy Agency (IEA) (2004). Renewable Energy – Market and Policy Trends in IEA Countries. OECD, Paris.
International Energy Agency (IEA) (2010). Technology Roadmap – Solar Photovoltaic Energy. OECD, Paris.
International Energy Agency (IEA) (2012a). Global Renewable Energy Policies and Measures Database. OECD, Paris.
International Energy Agency (IEA) (2012b). Policies and Measures Database. OECD, Paris. International Energy Agency (IEA) (2013). Energy Technology RD&D Statistics Database.
OECD, Paris. International Energy Agency (IEA) (2014a). Technology Roadmap – Solar Photovoltaic
Energy. OECD, Paris. International Energy Agency (IEA) (2014b). Trends 2014 in Photovoltaic Applications:
Survey Report of Selected IEA Countries between 1992 and 2013. OECD, Paris. Jaffe, A. (1988). Demand and Supply Influences in R&D Intensity and Productivity Growth.
Review of Economics and Statistics, vol. 70, pp. 431-437.Jaffe, A., R. Newell, and R. Stavins (2002). Environmental Policy and Technological Change.
Environmental and Resource Economics, vol. 22, pp. 41-69.Jaumotte, F., and N. Pain (2005). From Ideas to Development: The Determinants of R&D and
Patenting. Working Paper No. 457, OECD, Paris. Johnson, E. (2014). The cost of carbon dioxide abatement from state renewable portfolio
standards. Resource and Energy Economics, vol. 36, pp. 332-350.
Innovation: Evidence Based on Patent Counts. Environmental and Resource Economics,vol. 45, pp. 133-155.
Karmarkar-Deshmukh, R., and C. Pray (2009). Private Sector Innovation in Biofuels in the United States: Induced by Prices or Policies? AgBioForum, vol. 12, pp. 141-148.
Kirkegaard, J., T. Hanemann, L. Weischer, and M. Miller (2010). Toward a Sunny Future? Global Integration in the Solar PV Industry. Working Paper Series 10-6, World Resources Institute and Peterson Institute for International Economics, Washington DC.

24
Klaassen, G., A. Miketa, K. Larsen, and T. Sundqvist (2005). The Impact of R&D on Innovation for Wind Energy in Denmark, Germany and the United Kingdom. Ecological Economics, vol. 54, pp. 227-240.
Klein, A., A. Held, M. Ragwitz, G. Resch, and T. Faber (2010). Evaluation of Different Feed-in Tariff Design Options: Best Practice Paper for the International Feed-in Cooperation (3rd edition). Energy Economics Group and Fraunhofer Institute for Systems and Innovation Research, Karlsruhe.
Langniss, O., J. Diekmann, and U. Lehr (2009). Advanced Mechanisms for the Promotion of Renewable Energy: Models for the Future Evolution of the German Renewable Energy Act. Energy Policy, vol. 37, pp. 1289–1297.
Lanjouw, J., and A. Mody (1996). Innovation and the International Diffusion of Environmentally Responsive Technology. Research Policy, vol. 25, pp. 549-571.
Lanzi, E., and I. Sue Wing (2011). Directed Technical Change in the Energy Sector: An Empirical Test of Induced Directed Innovation. Paper presented at the WCERE 2010 conference, Montreal, 28 June – 2 July.
Liang, J., and D. Fiorino (2013). The Implications of Policy Stability for Renewable Energy Innovation in the United States, 1974-2009. The Policy Studies Journal, vol. 41, pp. 97-118.
Löschel, A. (2002). Technological Change in Economic Models of Environmental Policy: A Survey. Ecological Economics, vol. 43, pp. 105-126.
Lundmark, R., and K. Bäckström (2015). Bioenergy innovation and energy policy. Economics of Innovation and New Technology, article in press.
Maddala, G. (1983). Limited-Dependent and Qualitative Variables in Econometrics.Cambridge University Press, Cambridge.
McVeigh, J., D. Burtraw, J. Darmstadter, and K. Palmer (2000). Winner, loser or Innocent Victim? Has Renewable Energy Performed as Expected? Solar Energy, vol. 68, pp. 237-255.
Menanteau, P., D. Finon, and M-L. Lamy (2003). Prices versus Quantities: Choosing Policies for Promoting the Development of Renewable Energy. Energy Policy, vol. 31, pp. 799-812.
Mendonça, M. (2007). Feed-in Tariffs: Accelerating the Deployment of Renewable Energy.EarthScan, London.
Nemet, G. F. (2006). Beyond the Learning Curve: Factors Influencing Cost Reductions in Photovoltaics. Energy Policy, vol. 34, pp. 3218–3232.
Nesta, L., F. Vona, and F. Nicolli (2014). Environmental Policies, Competition and Innovation in Renewable Energy. Paper forthcoming in Journal of Environmental Economics and Management.
Newell, R., A. Jaffe, and R. Stavins (1999). The Induced Innovation Hypothesis and Energy-Saving Technological Change. Quarterly Journal of Economics, vol. 114, pp. 941-975.
Noailly, J., and S. Batrakova (2010). Stimulating Energy-efficient Innovations in the Dutch Building Sector: Empirical Evidence from Patent Counts and Policy lessons. Energy Policy, vol. 38, pp. 7803-7817.

25
Noailly, J., and R. Smeets (2012). Directing Technical Change from Fossil-Fuel to Renewable Energy Innovation: An Empirical Application Using Firm-level Patent Data.CPB Discussion Paper No. 237, Netherlands Bureau for Economic Policy Analysis, The Hague.
Nordhaus, W. D. (2002). Modeling Induced Innovation in Climate-Change Policy. In A. Grubler, N. Nakicenovic, and W. D. Nordhaus (Eds.), Technological Change and the Environment, Resources for the Future Press, Washington, DC.
Organisation for Economic Cooperation and Development (OECD) (2009). OECD Patent Statistics Manual. OECD Publishing, Paris.
Organisation for Economic Cooperation and Development (OECD) (2013). Patents by Main Technology and by International Patent Classification (IPC). OECD Patent Database, Paris.
Peters, M., M. Schneider, T. Griesshaber, and V. Hoffmann (2012). The impact of technology-push and demand-pull policies on technical change – Does the locus of policies matter? Research Policy, vol. 41, pp. 1296-1308.
Pizer, W. A., and D. Popp (2008). Endogenizing Technological Change: Matching Empirical Evidence to Modeling Needs. Energy Economics, vol. 30, pp. 2754-2770.
Popp, D. (2002). Induced Innovation and Energy Prices. The American Economic Review,vol. 92, pp. 160-180.
Popp, D. (2003). Pollution Control Innovations and the Clear Air Act of 1990. Journal of Policy Analysis and Management, vol. 22, pp. 641-660.
Renewable Energy Policy Network for the 21st Century (REN21) (2010). Renewables 2010 Global Status Report. REN21 Secretariat, Paris.
Rosenberg, N. (1982). Inside the Black Box. Cambridge University Press, Cambridge. Rübbelke, D., and P. Weiss (2011). Environmental Regulations, Market Structure and
Technological Progress in Renewable Energy Technology – A Panel Data Study on Wind Turbines. FEEM Working Paper No. 581.2011, Fondazione Eni Enrico Mattei, Milan.
Sagar, A. D., and B. Zwaan (2006). Technological Innovation in the Energy Sector: R&D, Deployment and Learning-by-Doing. Energy Policy, vol. 34, pp. 2601-2608.
Schankerman, M. (1998). How Valuable is Patent Protection? Estimates by Technology Field. RAND Journal of Economics, vol. 29, pp. 77-107.
Schmoch, U. (1997). Indicators and the relations between science and technology. Scientometrics, vol. 38, pp. 103-116.
Schmookler, J. (1966). Invention and Economic Growth. Harvard University Press, Cambridge.
Smith, A., and R. Raven (2012). What is Protective Space? Reconsidering Niches in Transitions to Sustainability. Research Policy, vol. 41, pp. 1025-1036.
Strahs, G., and C. Tombari (2006). Laying the Foundation for a Solar America: The Million Solar Roofs Initiative. US Department of Energy, Oak Ridge.
Sue Wing, I. (2006). Representing Induced Technological Change in Models for Climate Policy Analysis. Energy Economics, vol. 28, pp. 539-562.
Söderholm, P., and G. Klaassen (2007). Wind Power in Europe: A Simultaneous Innovation-Diffusion Model. Environmental and Resource Economics, vol. 36, pp. 163-190.

26
Timilsina, G., L. Kurdgelashvili, and P. Narbel (2011). A Review of Solar Energy – Markets,Economics and Policies. Policy Research Working Paper Series 5845, the World Bank, Washington, DC.
Verdolini, E., and M. Galeotti (2011). At Home and Abroad: An Empirical Analysis of Innovation and Diffusion in Energy Technologies. Journal of Environmental Economics and Management, vol. 61, pp. 119-134.
Walz, R., M. Ragwitz, and J. Schleich (2008). Regulation and Innovation: The Case of Renewable Energy Technologies. DIME Working Paper No. 2, Fraunhofer Institute for Systems and Innovation Research, Karlsruhe.
Wiesenthal, T., G. Leduc, H-G. Schwarz and K. Haegeman (2009). R&D Investment in the Priority Technologies of the European Strategic Energy Technology Plan. JRC Reference Reports (EUR 23944 EN), Institute for Prospective Technological Studies, Luxembourg.

27
Appendix
Table A1: Estimated Coefficients for the Country-specific Dummy Variables
Country dummies S1 S2 S3 S4DAUSTRIA -1.267*** (0.000) -0.928** (0.020) -0.198 (0.689) -0.153 (0.781)DBELGIUM -1.274* (0.054) -1.019* (0.090) -0.440 (0.476) -0.419 (0.465)DDENMARK -1.547** (0.013) -1.210* (0.083) -0.750 (0.233) -0.705 (0.292)DFRANCE 0.087 (0.731) 0.538 (0.119) 0.710** (0.037) 0.869** (0.038)DITALY -1.257*** (0.002) -1.209*** (0.002) -0.486 (0.295) -0.565 (0.265)DJAPAN -0.066 (0.871) 0.081 (0.846) 0.808* (0.054) 1.027** (0.035)DKOREA 0.181 (0.697) 0.798 (0.150) 1.033** (0.038) 1.296** (0.020)DNETHERLANDS 0.000 (1.000) 0.280 (0.438) 0.739* (0.080) 0.810* (0.089)DSPAIN -0.934** (0.034) -0.656 (0.149) 0.060 (0.909) 0.076 (0.893)DSWEDEN -1.440*** (0.003) -1.134** (0.043) -0.737 (0.180) -0.691 (0.247)DSWITZERLAND 0.364 (0.291) 0.594 (0.108) 1.027*** (0.008) 1.041** (0.020)DUK 0.359 (0.254) 0.737* (0.075) 1.000** (0.014) 1.109** (0.020)
Note: p-values in parentheses (based on bootstrapped standard errors stratified by country); * p < 0.10; ** p < 0.05; *** p < 0.01.
Table A2: Sensitivity Analysis with Respect to Alternative Time Lags and Depreciation RatesS2 S4
Lag 2 year 3 year 2 year 3 yearDiscount rates 5 % 15 % 10 % 5 % 15 % 10 %
Control variablesTOT 0.038 0.057 ** 0.058 ** 0.080 ** 0.096 *** 0.092 ***
(0.244) (0.029) (0.038) (0.023) (0.001) (0.003)TRIPS 1.762 *** 1.788 *** 1.765 *** 1.791 *** 1.764 *** 1.779 ***
(0.000) (0.000) (0.000) (0.000) (0.000) (0.000)Policy variables
FIT 0.022 *** 0.024 *** 0.023 *** 0.015 *** 0.016 *** 0.015 ***(0.000) (0.000) (0.000) (0.001) (0.000) (0.001)
REC 0.149 *** 0.143 *** 0.150 *** 0.144 *** 0.142 *** 0.142 ***(0.000) (0.000) (0.000) (0.000) (0.000) (0.000)
RDSTOCK 0.002 *** 0.004 *** 0.003 ** 0.001 * 0.002 ** 0.001(0.007) (0.005) (0.015) (0.079) (0.043) (0.111)
Policy interaction EXPFIT ----- ----- ----- 0.020 ** 0.018 ** 0.020 **
(0.023) (0.037) (0.024)EXPREC ----- ----- ----- -0.000 -0.002 -0.000
(0.938) (0.598) (0.952)Log-likelihood (NB) -634.217 -632.433 -638.716 -626.632 -625.749 -622.430
Log-likelihood (Poisson) -887.249 -897.738 -898.132 -814.614 -831.744 -832.418
(overdispersion parameter)
0.480 0.468 0.479 0.420 0.414 0.419
s.e. 0.105 s.e. 0.099 s.e. 0.107 s.e. 0.114 s.e. 0.110 s.e. 0.111
x2 1407.99 1180.88 1409.73 1039.24 983.38 1016.73p > x2 0.00 0.00 0.00 0.00 0.00 0.00N 352 352 350 350 350 346
Note: p-values in parentheses (based on bootstrapped standard errors stratified by country, 5.000replications), where * p < 0.10; ** p < 0.05; *** p < 0.01.


II


Technology Analysis & Strategic Management, 2015Vol. 27, No. 1, 1–18, http://dx.doi.org/10.1080/09537325.2014.943715
The role of pilot and demonstration plants intechnological development: synthesis anddirections for future research
Johan Frishammara∗, Patrik Söderholmb, Kristoffer Bäckströmb, Hans Hellsmarkc andHåkan Ylinenpääa
aEntrepreneurship and Innovation, Luleå University of Technology, Luleå, Sweden; bEconomics Unit, Luleå Universityof Technology, Luleå, Sweden; cDivision of Systems Analysis, SP Technical Research Institute of Sweden, Gothenburg,Sweden
Pilot and demonstration plants (PDPs) play important roles in technological development. Theyrepresent bridges between basic knowledge generation and technological breakthroughs on theone hand, and industrial application and commercial adoption on the other. The objectives of thisarticle are to synthesise and categorise existing research on PDPs, as well as to suggest an agendafor future research. We review the PDP phenomena in three literature streams: engineering andnatural science research, technology and innovation management, and innovation systems.The analysis highlights clear differences in e.g. conceptions of system boundaries and whatthe literature streams seeks to accomplish, but also similarities such as the key ideas of usingPDPs for technology scale-up and uncertainty reduction.
Keywords: pilot plant; demonstration plant; R&D management; innovation policy
1. Introduction
Pilot and demonstration plants (PDPs) occupy a central role in the discovery and developmentof new technologies, and in solving key societal problems. For instance, in 1946, Merck com-missioned the first full-scale plant for streptomycin manufacturing. That plant was put on streambecause of pilot plant tests in the early 1940s, singling out streptomycin as the treatment oftuberculosis (Kingston 2000). PDPs also played a critical role when Corning demonstrated thecommercial potential of fibre optics in the 1970s (Cattani 2006), and were a critical part ofPfizer’s involvement in the development of penicillin. Specifically, the solution to mass produc-tion of penicillin came not from lab researchers and basic R&D but from ‘… chemical engineerswho designed and operated pilot plants…that solved apparently intractable problems of heat andmass transfer’ (Rosenberg and Steinmueller 2013, 21).
These examples underscore the importance of PDPs to society, which are used in the chemicalindustry, drug industry, in steel making, and in solar and wind, among other sectors. However,
∗Corresponding author. Email: [email protected]
© 2014 Taylor & Francis
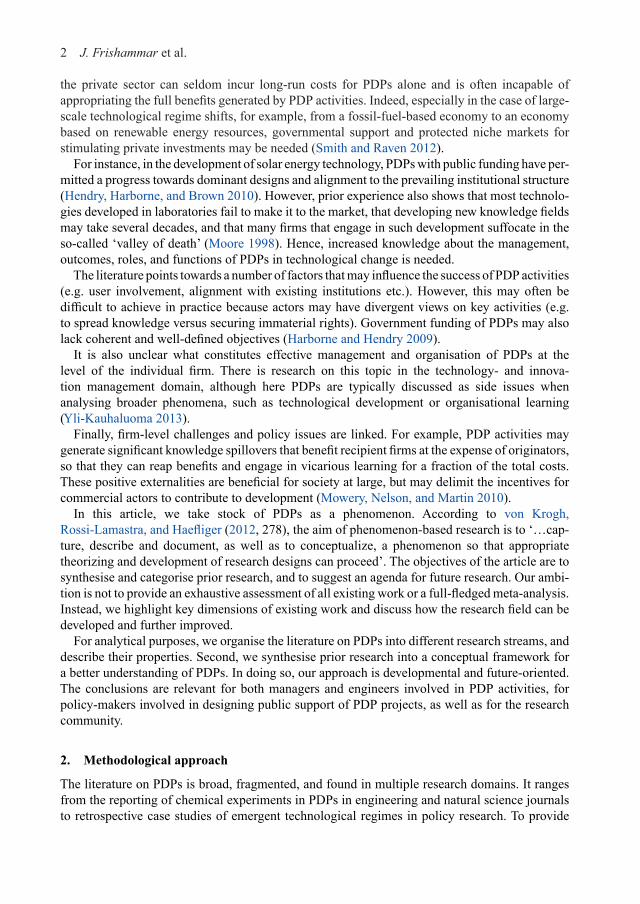
2 J. Frishammar et al.
the private sector can seldom incur long-run costs for PDPs alone and is often incapable ofappropriating the full benefits generated by PDP activities. Indeed, especially in the case of large-scale technological regime shifts, for example, from a fossil-fuel-based economy to an economybased on renewable energy resources, governmental support and protected niche markets forstimulating private investments may be needed (Smith and Raven 2012).
For instance, in the development of solar energy technology, PDPs with public funding have per-mitted a progress towards dominant designs and alignment to the prevailing institutional structure(Hendry, Harborne, and Brown 2010). However, prior experience also shows that most technolo-gies developed in laboratories fail to make it to the market, that developing new knowledge fieldsmay take several decades, and that many firms that engage in such development suffocate in theso-called ‘valley of death’ (Moore 1998). Hence, increased knowledge about the management,outcomes, roles, and functions of PDPs in technological change is needed.
The literature points towards a number of factors that may influence the success of PDP activities(e.g. user involvement, alignment with existing institutions etc.). However, this may often bedifficult to achieve in practice because actors may have divergent views on key activities (e.g.to spread knowledge versus securing immaterial rights). Government funding of PDPs may alsolack coherent and well-defined objectives (Harborne and Hendry 2009).
It is also unclear what constitutes effective management and organisation of PDPs at thelevel of the individual firm. There is research on this topic in the technology- and innova-tion management domain, although here PDPs are typically discussed as side issues whenanalysing broader phenomena, such as technological development or organisational learning(Yli-Kauhaluoma 2013).
Finally, firm-level challenges and policy issues are linked. For example, PDP activities maygenerate significant knowledge spillovers that benefit recipient firms at the expense of originators,so that they can reap benefits and engage in vicarious learning for a fraction of the total costs.These positive externalities are beneficial for society at large, but may delimit the incentives forcommercial actors to contribute to development (Mowery, Nelson, and Martin 2010).
In this article, we take stock of PDPs as a phenomenon. According to von Krogh,Rossi-Lamastra, and Haefliger (2012, 278), the aim of phenomenon-based research is to ‘…cap-ture, describe and document, as well as to conceptualize, a phenomenon so that appropriatetheorizing and development of research designs can proceed’. The objectives of the article are tosynthesise and categorise prior research, and to suggest an agenda for future research. Our ambi-tion is not to provide an exhaustive assessment of all existing work or a full-fledged meta-analysis.Instead, we highlight key dimensions of existing work and discuss how the research field can bedeveloped and further improved.
For analytical purposes, we organise the literature on PDPs into different research streams, anddescribe their properties. Second, we synthesise prior research into a conceptual framework fora better understanding of PDPs. In doing so, our approach is developmental and future-oriented.The conclusions are relevant for both managers and engineers involved in PDP activities, forpolicy-makers involved in designing public support of PDP projects, as well as for the researchcommunity.
2. Methodological approach
The literature on PDPs is broad, fragmented, and found in multiple research domains. It rangesfrom the reporting of chemical experiments in PDPs in engineering and natural science journalsto retrospective case studies of emergent technological regimes in policy research. To provide

The role of pilot and demonstration plants in technological development 3
a template for our literature synthesis, we organise the discussion around three PDP researchstreams: research in engineering and natural sciences, technology and innovation management,and innovation systems. This type of up-front categorisation of prior contributions into researchstreams for analytical purposes has been employed by well-cited review articles in innovationstudies (Brown and Eisenhardt 1995).
When searching for literature on PDPs in the engineering and natural science research stream,we employed a two-stage approach. First, because the numbers of potentially relevant publica-tions were so overwhelming, we made use of combinations of keywords to narrow the searches.Specifically, we carried out searches on two key fields, chemistry and renewable energy, andpaired with terms such as ‘pilot plant’ or ‘demonstration plant’ in key bibliographic databases.The number of articles retrieved was still very high; so a sample of the most cited papers wasreviewed per search. In a second stage, the bibliographic databases were searched again but nowfor recent literature published on these two fields in 2011–2013, which involved PDPs.
The literature on PDPs belonging to the two remaining research streams was less massive, sohere the search strategy was more straightforward. We conducted searches in key bibliographicdatabases using keywords such as ‘pilot plant’, ‘demonstration plant’, ‘pilot runs’, and ‘demonstra-tion experiments’. By conducting searches in databases and reviewing the relevant publicationsfound, we successively developed a better understanding of the literature and the key articles.Some references were located through a snowball technique and in this way we compensated forthe ‘…rigidity of “mechanistic” searches’ (Leseure et al. 2004, 172). We mitigated reviewer biasby avoiding searches in specific journals (Thorpe et al. 2005).
In total, more than 200 publications involving PDPs were reviewed and about 60 were formallyincluded. The bulk of these are peer-reviewed journal articles although some are books, reports,dissertations, or working papers. The literature was chosen on the basis of whether the contents andinsights were interesting and had the potential to advance knowledge about PDPs. This approachis consistent with prior published work (Leseure et al. 2004; Thorpe et al. 2005).
A high-quality literature review should make it easier for the reader to grasp the research bysynthesising prior literature. In line with this we first organise the reviewed literature with respectto certain criteria and in research streams, and then describe the properties of these streams. Wealso highlight important (existing and missing) links among these research streams by synthesisingthe literature into a conceptual framework for a better understanding of PDPs.
A final methodological remark is that some researchers make a conceptual distinction betweenPDPs (Baer, Johnson, and Merrow 1976; Lager 2000; Macey and Brown 1990). Pilot plant tests,some argue, follow lab experiments in the process of scaling up a technology whereas a demon-stration plant is conceptualised as a larger experiment environment situated closer to full-scaleproduction (Lager 2000). However, other scholars distinguish between experimental and exem-plary demonstrations and argue that the former is focused on testing the workability of inventionsin a real-world setting whereas the latter focuses on diffusion (Myers 1978, cited in Magill andRogers 1981). Furthermore, the International Energy Agency (2014) emphasises that the distinc-tion between a pilot plant and a demonstration facility can also be attributed to the extent to whichthe product is marketed, the plant is operating continuously, and the facility is embedded into anexisting material logistic chain.
The conceptions of PDPs are thus heterogeneous. Hence, for the purpose of this exploratoryarticle it is less meaningful to categorise the existing literature based on pre-set distinctions.Instead, we acknowledge and highlight that PDPs may take on different roles during the processof technological development, and define a PDP broadly as a tool used to progress knowledge sothat an effective organisation, design, and management of commercial facilities can be achieved

4 J. Frishammar et al.
at a lower risk for the stakeholders involved. PDPs can be used for bringing new technologicaland organisational inventions to the market, as well as for fine-tuning existing processes.
3. Three PDP literature streams
Table 1 summarises the main findings from our review of the existing research on PDPs, cate-gorised into three literature streams. The remainder of this section is devoted to discuss the mostimportant ideas, concepts, methods, type of results, implications, and performance effects of eachof these streams.
Table 1. A categorisation of existing research on PDPs.
Engineering and natural Technology andscience research innovation management Innovation systems
System boundaries Narrow (‘inside pilotplants’).
Intermediate (e.g. firm level,inter-firm collaborations).
Wide (e.g. embracingpolicy, institutions,other industries, etc.).
Key idea(s) PDPs are (oftenimplicitly) viewedas key tools for up-scaling and verificationof technologies orprocesses.
PDPs are tools for productand/or process designand scale-up; they areconsidered a substitute forthe design office employedby manufacturers ofassembled products.
The role of PDPs in theinnovation processgoes beyond reducingtechnical uncertainty,but also involvesdeveloping the socio-technical system (e.g.clarifying institutionalbarriers, customerawareness, etc.).
Key theoreticalconcepts
Chemical and physicallaws are often notexplicitly discussed;prior experience,expectations,or conceptionscould often guideexperiments and testsconducted in PDPs.
Uncertainty reduction andlearning. Strong focus onthe challenges of individualfirms or actors, and thebroader actor-networkor society is typicallyde-emphasised. Forexample, the institutionaland organisationaluncertainties arising whennew technologies arelaunched are not in focus.
Socio-technical systemframeworks suchas SNM and TISs.Both research strandsemphasise variousmodes of learning indifferent phases of theinnovation process.Key concepts includelearning, uncertaintyreduction, innovationsystems, and strategicniches.
Methods Trial-and-error-basedapproach; laboratories,simulations, and pilotplants are commontools employed tocarry out experimentsand tests.
Mainly case studies, oftenin the context of privatelyowned PDPs.
Case-based assessments ofthe role of (primarily)publicly funded PDPsin the historicaldevelopment of specifictechnological regimes.Mainly qualitativeresearch with a strongreliance on documentstudies and interviews.
(Continued)

The role of pilot and demonstration plants in technological development 5
Table 1. Continued.
Engineering and natural Technology andscience research innovation management Innovation systems
(Type of) results Experimental and testresults of proposedsolutions to technicaland chemical issueshindering up-scaling.Results are often of atechnical and chemicalnature.
Improved understanding ofPDPs: (a) as key tools forlearning about and scalingup technology; and (b) asarenas for collaboration intechnology developmentand transfer.
Improved understandingof the role of PDPs inthe innovation system,such as: (a) the types oflearning taking place;and (b) the nature ofinteraction betweenactors and activities,including sources ofconflicts of interests inthe actor networks.
Implications Technical and/or eco-nomic feasibility ofproposed processsolutions or technolo-gies in up-scalingefforts. Recognition ofimportant challengesthat need to be solvedfor further up-scaling.
PDPs imply both organi-sational and economicchallenges in addition tothe technical ones.
Identification of keysuccess and failurefactors of PDPs, andlessons for policy-making. Typically anemphasis on publicpolicy playing animportant role infacilitating PDPactivities, and providing‘protective space’ fornew technology.
Performance effects Investigations, descrip-tions, and verificationof solutions to issueshindering up-scalingof certain processes ortechnologies.
Firm-level learning, as well asvalidation and verification.
A knowledge-basedinnovation policy thatcan break free fromexisting technologicaltrajectories, and bringnovel and better-performing technologyto the market.
Representativeresearch journals
Organic ProcessResearch & Develop-ment; InternationalJournal of Green-house Gas Control;Biosource Technology,etc.
R&D Management; Industrialand Corporate Change;Journal of Engineering andTechnology Management,etc.
Research Policy; EnergyPolicy; TechnologyAnalysis and StrategicManagement, etc.
3.1. Tools in engineering and natural science research
Basic research in natural science and engineering is sometimes based on trials and re-trials in PDPs,and the key idea in this research stream is that the plants constitute key tools in up-scaling effortsand verification of emerging processes and technologies (Palluzi 1992). The performance effectsinvolve descriptions, investigations, and verification of solutions to chemical and/or technicalissues that hinder up-scaling (Dinca and Badea 2013). Wakami and Yoshida (2005) provide anillustrative example, where pilot plant tests were used to investigate whether the use of microflowsystems could provide a solution to up-scaling problems.

6 J. Frishammar et al.
In this literature stream there exist clear ideas of technical issues hindering up-scaling, whichmotivates experiments in PDPs. The experiments conducted are pictured as distinct and well-defined. Researchers in this stream may not explicitly acknowledge theoretical paradigms, andsometimes few prominent theoretical concepts are displayed. Instead, the focus is on empiricalexperiments. Physical and chemical laws are typically assumed as given although exceptions canbe found in, for instance, Nielsen, Li, and Rochelle (2013) and Notz, Mangalapally, and Hasse(2012).
In terms of method, engineers often employ tools such as simulations, laboratories, and PDPswhen testing if proposed solutions can overcome chemical or technical problems hindering theup-scaling of technologies or processes. These tools are often used in a trial-and-error-basedapproach in the sense that engineers carry out experiments in an iterative research process involvingrules of thumb, expectations, and previous research (Clark et al. 2004; Connolly, McGarry, andSukhtankar 2005). Such experiments in PDPs are often complemented by research at the lab-scalelevel (Connolly, McGarry, and Sukhtankar 2005; Dyer et al. 2002). In sum, although PDPs aretypically designed and constructed for certain specific purposes, extensive experimentation andtrial-and-error research are often crucial to final results.
Typical results found in this literature stream are of a technical and a chemical nature. Connolly,McGarry, and Sukhtankar (2005) is an illustrative example displaying results involved on whatyields and on what mole scale certain chemical compounds are generated from a process. Anotherexample is the study by Wieckert et al. (2007, 195) concerning purity and mean particle size.Key results encompass both chemical and technical parameters in addition to process efficiencymeasures (see also Amutio et al. 2012; Clark et al. 2004; Nielsen, Li, and Rochelle 2013).
Explicitly stated implications of the results may concern the economic and/or technical fea-sibility of proposed solutions in further up-scaling efforts. For example, Wakami and Yoshida(2005) claim that microflow systems may be applied in relatively large-scale production. Otherimplications of the PDP-based research concern the construction of a PDP following analysesof the technical and economic feasibility of such an undertaking (Degiorgis, Santarelli, and Calì2007; Gocht et al. 1998). In some cases, the implications of the results also involve the role ofPDPs in the commercialisation of certain processes or technologies. For instance, Nguyen et al.(1996) analysed the current status of a PDP’s importance in the commercialisation of biomass toethanol technology.
3.2. The technology and innovation management perspective
PDPs are also discussed in the literature on technology and innovation management. Few of thesearticles, though, are devoted solely to understanding PDPs as such. Rather, PDPs are discussed asa side issue when elaborating product and process development (Lager, Blanco, and Frishammar2013). Here, innovation is typically pictured as an evolutionary process (Kingston 2000; Klepperand Simons 1997) where PDPs represent arenas for experimentation, located between the small-scale trials in industrial laboratories and full-scale production.
In this literature, the analysis goes beyond technical trials and focuses also on economic chal-lenges that must be addressed to up-scale and move a technology closer to commercialisation. Theanalysis usually departs from the perspective of a single firm or a number of collaborating firms,but where: (a) the interaction with the institutional setting in which these firms are embeddedtends to be tacit in the analysis and (b) societal problems that require new innovations for whichsignificant economic incentives lack (e.g. environmental technology) are often overlooked.

The role of pilot and demonstration plants in technological development 7
The key idea in this research is that PDPs are tools for product and/or process scale-up. R&D inthe process industries is mainly conducted in PDPs rather than in design offices (Lager, Blanco, andFrishammar 2013). However, the transition from one scale to another is a long and often difficultprocess with many obstacles (Pisano 1994, 1996). Performing this scale-up calls for changes inthe underlying process technologies, because scaling up original equipment from laboratories(e.g. glass containers) is often neither physically possible nor economically feasible.
Scaling up requires recourse to apparatus of an entirely different sort, involving entirely differentmaterials that can sustain extremely high pressures and temperatures, as well as the use of pumps,compressors, piping, and vats of a large scale...the key experimental tool…is therefore the pilotplant, and inferences are drawn from experimental data provided by such plants. (Rosenberg andSteinmueller 2013, 18)
Going from the laboratory to the PDP stage is critical to improve process understanding.However, test series in PDPs are typically much more expensive than the somewhat less reliablelaboratory activities, so weighting costs and benefits among alternative experimental arenas arelikely to be critical to any firm. Eventually, however, most development projects cannot sidestepthe PDP, because it may be the only option to test the full process as a closed system (Lager 2000).
The two key theoretical concepts in this literature are uncertainty reduction and firm-levellearning. Uncertainty is the difference between the information one has and the information oneneeds to complete a task (Galbraith 1977). In this literature, uncertainty typically means technicaluncertainty, and is strongly related to technology up-scaling (Frishammar, Lichtenthaler, andKurkkio 2012). Most articles acknowledge the uncertainties involved in moving from the small-scale laboratories to PDPs, and further to full-scale production. These uncertainties exist becausenew product properties may be added and existing ones lost, when moving along the differentlevels. The end goal is typically to create a robust and replicable process for full-scale production(Lager 2000).
The other key concept, learning, is a precondition for uncertainty reduction because deliberatelearning efforts are needed to bring uncertainty down. However, learning theory is applied morebroadly as well. For example, Yli-Kauhaluoma (2013) used Lave and Wenger’s (1991) theory ofsituated learning in the context of PDPs to emphasise the learning that occurs when engineersinteract with a physical context (see also Tyre and von Hippel 1997). Kale and Little (2007)studied learning processes in the context of PDPs, and Pisano (1996) elaborated different learn-ing strategies applicable to technology scale-up. Learning in this context refers primarily to thelearning processes of firms; the broader impact of learning by society and the actor network isnot addressed.
In terms of method, this literature stream is dominated by in-depth multiple-case studies (Kaleand Little 2007; Stadler 2011; Ren 2009; Yli-Kauhaluoma 2013). There are also single-casestudies by Cattani (2006) and Bröring and Herzog (2008). In addition, there are retrospectivecase studies drawing on secondary data. Significant examples are Rosenberg and Steinmueller’s(2013) study of three industries and Aylen’s (2010) study of the steel industry. Survey studies doexist but appear quite uncommon; one example is Pisano (1996).
The empirical results are fairly consistent. First, PDPs seem to be used mainly in the processindustries (such as in biofuels, chemicals, bulk production of medical drugs, and steelmaking).Here, trial-and-error (rather than formal R&D) appears to be the significant mode of invention,and the PDP is a central tool for achieving desired results (Stadler 2011). PDP is thus a necessarystep in firm-level learning about a new technology (Aylen 2010; Cattani 2006; Rosenberg and

8 J. Frishammar et al.
Steinmueller 2013). PDP facilitates product and process development and allows the enactmentof a well-designed production process. A well-designed production process facilitates processstandardisation, optimisation, and collaboration (Chaudhuri 2012).
However, different branches of process industries seem to vary in their prerequisites of usingPDPs. For example, PDPs seem less applicable in the context of high strength steel where full-scale trials are necessary (Jones, Ball, and Cockerill 1983). Moreover, the effectiveness throughwhich a PDP may be used depends on prior underlying knowledge in the relevant technologicalarea (Pisano 1996).
While a PDP may be critical to a developing firm, it could also be an arena for collaborationamong key actors. For example, industrial firms, academia, and specialised small- and medium-sized enterprises (SMEs) may engage in technology transactions at the PDP (Bröring and Herzog2008). Universities, process plant contractors, suppliers of process equipment, and raw mate-rial suppliers may also be involved. However, few articles explicitly elaborate and discuss theorganisation and management of collaboration in the context of PDPs.
Finally, PDPs are not only tools for developing novel products, technologies, or processes. Theycan also be used for secondary innovation, i.e. when a firm enters an industry late and focuses oncatching up with competitors (Sandén and Hillman 2011). Similarly, it can be used for imitationpurposes (Kale and Little 2007), i.e. to learn and accumulate firm-level technological capabilities.
A key implication is that challenges with PDPs go beyond the pure technical ones. Thereare indeed technological challenges in reaching a safe and reproducible process. This can beparticularly challenging when a product concept moves from the laboratory to a PDP and furtheron. Organisational challenges are rooted in the fact that employees and process equipment indifferent organisations often must come and work together (Hutcheson, Pearson, and Ball 1996;Pisano 1996). Economic challenges are rooted in the fact that the process emerging from a PDPmust allow a high-quality product at a competitive cost (Pisano 1996) if product commercialisationis the goal.
Concerning performance effects of PDPs, this literature envisions two key outcomes: firm-levellearning and validation. Learning at the firm level seeks to improve the knowledge base in thecontext of scale-up. In brief, successful introduction of a new process or product in the marketdepends on engineers getting familiar with that process (Stadler 2011). A PDP is also used forvalidation and verification purposes of new processes (Hutcheson, Pearson, and Ball 1996). Costlevels and quality issues need to be anticipated (Cattani 2006), and the PDP can help to achieveimprovements in development time, cost, and quality (Chaudhuri 2012).
3.3. The innovation system perspective
The third literature stream investigates the role of PDPs from an innovation systems perspective.Most of this research adopts a broad approach and the performance effects target understandingthe dynamics of technological change with a strong focus on sustainability transitions and thedevelopment of new cleaner energy technologies (Klitkou et al. 2013). A common theme is thefocus on PDPs with (partial) public funding, and the role of innovation policy in the commer-cialisation of new technology (Hellsmark and Jacobsson 2012; Hendry, Harborne, and Brown2010).
The key idea in this literature stream is that while PDPs represent a bridge between basicknowledge generation and subsequent industrial application, the challenges involved in developingnew technologies are not only of a technical nature. They also concern the establishment ofmarkets (including new value chains), alignment of institutions (e.g. legal rules, standards, codes of

The role of pilot and demonstration plants in technological development 9
conduct), public attitudes, etc. (Kemp, Schot, and Hoogma 1998; Lefevre 1984; Macey and Brown1990). PDPs thus assist in developing the broader socio-technical system by reducing a number ofuncertainties associated with market potential, organisational challenges, and institutional barriers(Hellsmark and Jacobsson 2012). To this background, PDPs may take on different roles in theinnovation system. Some plants are experimental, thus testing the technical viability of a process,whereas others tend to be ‘exemplary’ in that they primarily aim at demonstrating the value of aprocess to potential adopters (Karlström and Sandén 2004; Magill and Rogers 1981).
Much of the early research in this stream focused on large PDP projects in the USA (Lefevre1984; Magill and Rogers 1981), and was largely empirically driven. However, in more recentyears two theoretical frameworks with high relevance for PDP activities have emerged: the tech-nological innovation system (TIS) approach (Carlsson and Stankiewicz 1991) and strategic nichemanagement (SNM) (Kemp, Schot, and Hoogma 1998). Learning and uncertainty reduction arekey theoretical concepts also in this literature stream, although both these concepts have relativelybroad interpretations.
A TIS is defined as a dynamic network of agents interacting in a specific economic/industrialarea under a particular institutional infrastructure, being involved in the generation, adoption,and use of technology. In employing this approach, researchers focus on a set of innovation anddiffusion-related functions of these systems (Bergek, Hekkert, and Jacobsson 2008). Hellsmark(2010) devotes explicit attention to the role of PDPs within a TIS framework, and notes thatPDPs may support several TIS functions such as the formation of knowledge networks, reductionof technical uncertainties, facilitation of learning for technology selection, and the raising ofawareness about public opinion and institutional barriers.
The aim of SNM, on the other hand, is to facilitate regime shifts within protected techno-logical niches. SNM assumes technological lock-in and path dependence, and emphasises thestrong incentives to develop innovations that fit into existing processes (Raven 2005). Existingtechnological regimes – embracing both the paradigmatic framework of engineers as well as theselection environment of a technology (Geels 2005; Rip and Kemp 1998) – guide firms’ R&Dand tend to encourage primarily incremental innovation (Hoogma et al. 2002; Kemp, Schot, andHoogma 1998). The transition to a new regime requires support of protected technological nichesin which innovations can be nurtured. These niches do not only demonstrate the viability of thenew technology, but they also facilitate interactive learning and institutional embedding such asthe development of complementary technologies and infrastructure and alignment of the networkof producers, users, government agencies, etc. (Smith and Raven 2012). Thus, ‘technologicalniches are the breeding place for radical innovation’ (Hoogma et al. 2002, 9).
The concept of learning is critical to SNM, which makes a distinction betweenfirst- and second-order learning. The former involves learning about how to improve the design of technologywhereas the latter implies that conceptions of users, technology, and regulations are not onlytested but also questioned (Hoogma 2000). Second-order learning is thus critical for radicalregime shifts (Raven 2005).
The methods used are typically qualitative research such as case-based studies on the role of pri-marily publicly funded plants in the historical development of a specific technology or application(e.g. fuel cells, wind power, solar photovoltics, biomass, and coal gasification). These studies areoften retrospective and combine secondary data and official documents with interviews. Hellsmark(2010) is an apt example, studying the development of biomass gasification technology in Sweden,Finland, Austria, and Germany. Harborne and Hendry (2009) rely more heavily on secondary dataand document studies in studying 148 wind power PDPs in the USA, Europe, and Japan. Other ret-rospective case studies include Lefevre (1984) (energy demonstration projects in the USA), Brown

10 J. Frishammar et al.
and Hendry (2009) (solar photovoltics in Japan, Germany, and the USA), Harborne, Hendry, andBrown (2007) (fuel cells in public buses), and Raven (2005) (biomass technology in Denmarkand the Netherlands).
The empirical results confirm that PDPs contribute to different types of learning processes.They reduce uncertainty and permit progressing towards a dominant design, but they also assistin developing the socio-technical system. The latter implies aligning the emerging technology tothe institutional, organisational, and technological structure, including raising public awarenessof the new technology (Brown and Hendry 2009; Harborne, Hendry, and Brown 2007; Hellsmark2010). Many studies also emphasise the important role of involving end-users and other actorswith complementary competences. The negative impacts of absent stakeholders are illustrated byHarborne and Hendry (2009) in their work on wind power PDPs; here turbine manufacturers werenot heavily involved, which prohibited the development of dominant designs.
Another result is that technological development is not a linear process (Hendry, Harborne, andBrown 2010) and it may require parallel developments when a technology is tested in differentgeographical contexts and applications (e.g. see studies on biogas and biomass technology byGeels and Raven (2006) and Raven (2005), respectively). The empirical work also illustratesthe presence of complex relationships among different industrial partners as well as betweenindustry and government. While the SNM literature emphasises the importance of alignmentof actors’ activities in developing technological niches, the practical world clearly implies anarray of conflicts of interest. These concern risks, finance, management control, and informationdispersion. For instance, the development activities at PDPs may generate significant knowledgespillovers, thus benefiting outside firms that can imitate, at a fraction of total costs. While thesepositive externalities are beneficial to society they constitute a mixed blessing since it is importantto maintain strong incentives for commercial actors to contribute to the learning processes in thefirst place (Mowery, Nelson, and Martin 2010). This challenge was addressed already by Lefevre(1984) in his assessment of major energy demonstration projects in the USA. In a same vein,Harborne, Hendry, and Brown (2007) and Hendry, Harborne, and Brown (2010) highlight theproblem of knowledge spillovers in renewable energy technology, and conclude that these issueshave not been properly addressed when designing and managing PDPs.
There are two key implications: one is the identification of important factors influencing thesuccess (or failure) of publically funded PDPs while the second concerns lessons for design andimplementation of public policy. The literature suggests that PDPs will perform well if (a) theyallow for failure by responding to mistakes, e.g. by shifting back to technical verification (Lefevre1984); (b) there is a willingness of the private sector to assume a significant amount of costs andrisks (Macey and Brown 1990); (c) they involve user involvement to facilitate learning (Harborneand Hendry 2009) and an ability to identify who can appropriate benefits of knowledge develop-ment if the project fails (Hellsmark 2010); (d) they rely on clearly defined responsibilities for theinvolved participants and an agreement concerning project objectives; (e) they permit continuousexperimentation (Hellsmark 2010); and (f) they incorporate plans for effective reporting of results(Sagar and Gallagher 2004).
Achieving the above in practice may be difficult, especially as the actor network normallyexpands as the technology moves closer to the market. This creates concerns about the mostimportant project objectives, and the trade-off between ‘discovering suitable market opportunities’on the one hand and ‘targeting a particular application and concentrate resources on this’ on theother. Prior work on PDPs has devoted rather limited space to this important issue (Brown andHendry 2009).

The role of pilot and demonstration plants in technological development 11
A majority of studies also pinpoint specific recommendations for policy-making. There appearsto be a strong consensus that partial public funding of PDPs is needed to reduce technologicaland market-related uncertainties, as these may not be adequately addressed by the private sectoralone. The presence of positive externalities from PDPs also provides a motive for public support.However, in practice, the literature suggests that government funding of PDPs have often not beenshaped by well-defined strategic objectives (Harborne and Hendry 2009). Government supportalso signals political recognition, and indicates to potential adopters the direction of future policiesand priorities (corresponding to ‘guidance of the search’ in the TIS literature) (Klitkou et al.2013). Policy should therefore also ensure an effective reporting of results and that the science andtechnology structure created within PDPs is useful beyond single experiments, e.g. by encouragingthe dissemination of information.
Finally, many scholars assert that policy should support demonstration of different technologicaltrajectories, including complementary knowledge fields along the value chain (Hellsmark 2010),this being perhaps most important for the achievement of radical technology shifts (Harborne,Hendry, and Brown 2007). Besides the technological variation, the different local conditions arealso important to consider (Coenen, Benneworth, and Truffer 2012). This call for variation andprotection, though, must not come at the price of a too weak technology selection pressure (Kemp,Schot, and Hoogma 1998).
4. Conceptual framework and agenda for future research
Although our review of existing research on PDPs makes no claim to be exhaustive, it indicatesthat while plenty of scholarly work has been done on the management and policy of innovationand technological change, surprisingly little explicit attention has been devoted to the critical roleof PDPs (see also Klitkou et al. 2013). It is therefore useful to discuss how such research canbe conducted; e.g. which trajectories need to be developed and which questions deserve moreemphasis?
4.1. PDPs in technology development: a framework
Figure 1 provides a conceptual framework to structure the discussion of future research on PDPs.The mid-part builds on an often-used illustration of the requirements for successful new technologydeployment. The idea originates from Schumpeter (1934) who stressed the existence of threenecessary conditions: invention, innovation, and diffusion. Invention implies the developmentof a new idea/concept, and innovation refers to the subsequent process in which technologyis optimised, verified, and commercialised. Diffusion refers to the gradual adoption of the newtechnology by firms.
However, our review suggests that the Schumpeterian notion of technological change shouldbe developed in a number of ways. First, the PDP phase does not represent an isolated activity. Inpractice, there are loops back to basic R&D as well as from technology diffusion to PDP activities,thus following the logic of the ‘chain-linked’ model of innovation (Kline and Rosenberg 1986).The activities taking place at PDPs are closely linked to and may largely overlap basic R&D,technological diffusion, or both.
Moreover, PDPs is not a homogeneous phenomenon. They typically have different roles, wheresome are closely related to the R&D stage while others focus on discovering and learning aboutmarket opportunities. The three literature streams reviewed are in themselves illustrations of the

12 J. Frishammar et al.
Figure 1. The role of PDPs in technological development : a conceptual framework.
different roles that PDPs may take (illustrated in top of Figure 1). As we move from the R&Dstage towards diffusion the system boundaries become wider, and there is a need to focus notonly on technical but also on institutional and market-related uncertainties. The actor networksconsequently become more complex.
Figure 1 also illustrates how the process of technology development – including the activitiestaking place at PDPs – is embedded in an actor network structure consisting of industrial firms,university researchers, and other private and public stakeholders. The set-up and organisationof these networks are likely to differ depending on the role of PDPs as well as on the specificgeographical and institutional context in which they operate. The actor networks may shape thecontext (e.g. lobbying for public support), but the technology development process will also beinfluenced by a number of exogenous factors, including geopolitical events and different publicpolicies (e.g. patent systems and taxes).
4.2. Important challenges for future research
A number of important questions that deserve more attention emerge from this review. We beginby discussing some key concepts of high relevance. Our review shows that learning and uncer-tainty reduction are central theoretical concepts, but they have not been sufficiently elaborated on(Klitkou et al. 2013). For instance, the perceptions of learning differ a lot across different stud-ies (e.g. in the technology management versus the innovation system literature). Kamp, Smits,and Andriesse (2004) distinguish among four modes of learning, all with direct relevance tothe development activities taking place in PDPs. These are learning-by-searching (e.g. basicR&D resulting in formalised knowledge), learning-by-doing (e.g. tacit knowledge acquired dur-ing manufacturing), learning-by-using (e.g. know-how acquired in the use of technology), andlearning-by-interacting (e.g. know-how acquired in interaction between users and producers).These learning modes signify the PDP activities as new technology is moved closer to the market

The role of pilot and demonstration plants in technological development 13
and the actor networks grow more complex. These learning concepts deserve further attention tobetter understand the effectiveness of different options (see also Hoogma 2000).
Second, a key theoretical concept is uncertainty reduction, which concerns not only a new tech-nology’s technical performance but also uncertainties regarding market demand, public attitudes,and legal rules. However, by emphasising the importance of reducing uncertainty researchersassume that the underlying problem is one of incomplete information. Once information gapshave been closed, the problem of bringing new technology to the market is solved. In the contextof PDPs, however, it seems reasonable to assume that the problems faced often centre on a lackof mutual understanding among the involved actors, i.e. diverging interpretations of informa-tion rather than lack of information as such. This has been manifested in the theoretical conceptof equivocality, and actors frequently misinterpret equivocal situations for uncertain ones (Daftand Weick 1986; Frishammar, Florén, and Wincent 2011). The transition from basic R&D andknowledge generation, through up-scaling, verification, and further on to diffusion may be veryequivocal with multiple alternative trajectories and development paths to follow, as well as actornetworks whose driving forces and interpretations may vary tremendously. Lack of joint under-standing in actor networks may thus complement the ‘lack of information problem’ highlightedin studies of uncertainty and help advance knowledge about PDPs.
Third, there does not appear to be much overlap and cross-fertilisation between studies of PDPsin technology and innovation management and innovation systems, and more multi-disciplinarywork on PDPs would be worthwhile. One reason for this is that these two literature streams havedifferent empirical scopes, where thefirst focus primarily on industry-owned PDPs while the latterhas a strong emphasis on PDPs with partial public funding. We envision that there are lessons tolearn from the industry’s experience with PDPs for policy-making and vice versa.
For example, technology and innovation management studies of PDPs could learn from studyingactor network findings in the innovation systems literature because privately owned PDPs alsohas a number of stakeholders around them, including customers, suppliers of process technology,and universities (Hutcheson, Pearson, and Ball 1995). Private PDPs may also need to increasinglyaddress the importance of alignment with existing institutional structures (or perhaps even engageto challenge such structures). Conversely, while the innovation system literature recognises thedifferent types of actors involved in the PDP activities it devotes little formal attention to theincentives that these actors (e.g. industrial partners) have for joining R&D collaboration. This isoverall better researched in the technology and innovation management literature.
Finally, we have also identified a number of potential conflicts concerning actors’ expectations,strategies, and goals regarding PDP activities. All these deserve attention in future research. Thefirst example is the issue of knowledge spillovers versus the protection of immaterial rights. Thespillovers from knowledge creation represent one motive for (partial) public support to PDPs, oftencombined with requirements for a broad dissemination of new knowledge (Mowery, Nelson, andMartin 2010). Nevertheless, the latter involves difficult trade-offs and it is important that toolenient public policies towards the sharing of publicly funded intellectual property do not removethe incentives for any commercial actors to contribute to these learning processes. Future researchon PDPs should increasingly highlight this ‘mixed blessing’ of knowledge spillovers.
Another issue involving difficult trade-offs concerns the balance between protection of newtechnology in niches on the one hand and selection pressure on the other. This is a strategic issueboth for individual companies and for policy-makers. If protection is too generous, technologydevelopers will not be forced to deal with negative side effects associated with the wider-scaleapplications of a new technology. However, if the selection pressure is too strong, different pathsof development may be precluded or forestalled (Kemp, Schot, and Hoogma 1998). This calls

14 J. Frishammar et al.
for additional research on the role of protection versus selection in technology developmentprocesses. Policy-makers would, for instance, be helped by research investigating under whichcircumstances private investors are more likely to back projects whose returns are uncertain andlie far in the future.
A final example of a potential source of conflicts concerns the objective of PDP activities, andthe fact that participants in the actor networks may have very different views and driving forces.This has been highlighted in previous work, but few studies investigate it in any detail. Onetension is between those actors who wish to develop particular applications of new technologyand those that instead prioritise the task of discovering new market opportunities. There may alsoarise conflicts at the organisational level, e.g. industrial firms considering whether to abandoncurrent production practices for new ones in spite of the expertise built up historically around oneparticular technology.
5. Conclusion
The purpose of this article was to synthesise and categorise existing research on PDPs and to sug-gest an agenda for future research. We reviewed the PDP phenomena in three research streams,and our analysis highlights differences in e.g. conceptions of system boundaries but also similar-ities such as using PDPs for technology scale-up, learning, and uncertainty reduction. An overallconclusion is that the role of PDPs in innovation management and policy is far from sufficientlyunderstood. Given the key role of PDPs as bridges between basic knowledge generation and tech-nological breakthroughs on the one hand, and industrial application and commercial adoptionof new technologies on the other, more research on this phenomenon is needed. This implies amore in-depth understanding of the actor networks surrounding the PDPs as well as the rolesof innovation management and public policy in addressing different conflicts of interest. Thisrequires that stronger links are established between the technology and innovation managementliterature and the innovation system research.
Funding
This work was supported by the Swedish Energy Agency, the Swedish Research Council Formas, and the Bio4Energyresearch environment.
Notes on contributorsJohan Frishammar is a professor at Entrepreneurship and Innovation at Luleå University of Technology, Sweden, and headsthe Centre for Management of Innovation and Technology in Process Industry (http://promote.ltu.se). Prior publicationsby him have appeared in journals such as California Management Review, Journal of Product Innovation Management,IEEE Transactions on Engineering Management, Technovation, and Technology Analysis & Strategic Management.
Patrik Söderholm is a professor at the Economics Unit at Luleå University of Technology, Sweden. Söderholm has been aresearch fellow at the Massachusetts Institute of Technology (MIT) and at the International Institute for Applied Systems

The role of pilot and demonstration plants in technological development 15
Analysis (IIASA). His research is focused on environmental, energy and resource economics, including substantive workon technology learning and policy.
Kristoffer Bäckström is a PhD candidate and part-time teacher at the Economics Unit at Luleå University of Technology,Sweden. He holds an MSc in economics and his research interests are environmental and energy economics with anemphasis on renewable energy policies and their effects on innovation.
Hans Hellsmark is a researcher at SP Technical Institute of Sweden and a visiting scholar at Zhejiang University, China. Hisresearch concerns industrialisation processes related to bioeconomy and focuses on the utilisation of academic knowledge,the role and interaction of universities, institutes, and public/private demonstration projects in the commercialisationprocess, and technology policy for promoting new industries.
Håkan Ylinenpää is a professor at Entrepreneurship and Innovation at Luleå University of Technology, Sweden, andResearch Director for the national excellence centre in innovation system research CiiR (Centre for Inter-organisationalInnovation Research). His research focuses on collaborative innovation and entrepreneurial innovation systems.
References
Amutio, M., G. Lopez, M. Artetxe, G. Elordi, M. Olazar, and J. Bilbao. 2012. Influence of temperature on biomasspyrolysis in a conical spouted bed reactor. Resources, Conservation and Recycling 59: 23–31.
Aylen, J. 2010. Open versus closed innovation: Development of the wide strip mill for steel in the United States duringthe 1920s. R&D Management 40: 67–80.
Baer, W.S., L.L. Johnson, and E.W. Merrow. 1976. Analysis of federally funded demonstration projects: Final report.Santa Santa Monica, CA: Rand Corporation.
Bergek,A., M. Hekkert, and S. Jacobsson. 2008. Functions in innovation systems:A framework for analysing energy systemdynamics and identifying goals for system-building activities by entrepreneurs and policy makers. In Innovationsfor a low carbon economy: Economic, institutional and management approaches, ed. T. Foxon, J. Köhler, andC. Oughton, 79–111. Cheltenham: Edward Elgar.
Bröring, S., and P. Herzog. 2008. Organizing new business development: Open innovation at Degussa. European Journalof Innovation Management 11: 330–48.
Brown, J., and C. Hendry. 2009. Public demonstration projects and field trials: Accelerating commercialisation ofsustainable technology in solar photovoltaics. Energy Policy 37: 2560–73.
Brown, S., and K. Eisenhardt. 1995. Product development: Past research, present findings, and future directions. Academyof Management Review 20: 343–78.
Carlsson, B., and R. Stankiewicz. 1991. On the nature, function and composition of technological systems. Journal ofEvolutionary Economics 1: 93–118.
Cattani, G. 2006. Technological pre-adaptation, speciation, and the emergence of new technologies: How corning inventedand developed fiber optics. Industrial and Corporate Change 15: 285–318.
Chaudhuri, A. 2012. Simultaneous improvement in development time, cost and quality: A practical framework for genericpharmaceuticals industry. R&D Management 15: 227–41.
Clark, J.D., G.A. Weisenburger, D.K. Anderson, P.J. Colson, A.D. Edney, D.J. Gallagher, H.P. Kleine et al. 2004. Pilotplant preparation of an αv β3 integrin antagonist. Part 1. process research and development of a (S)-β-amino acid esterintermediate: Synthesis via a scalable, diastereoselective Imino-Reformatsky reaction. Organic Process Research &Development 8: 51–61.
Coenen, L., P. Benneworth, and B. Truffer. 2012. Toward a spatial perspective on sustainability transitions. ResearchPolicy 41: 968–79.
Connolly, T.J., P. McGarry, and S. Sukhtankar. 2005. An eco-efficient pilot plant scale synthesis of two 5-substituted-6,7-dimethoxy-1-H-quinazoline-2,4-diones. Green Chemistry 7: 586–9.
Daft, R.L., and K. Weick. 1986. Organizational information requirements, media richness, and structural design.Management Science 32: 554–71.
Degiorgis, L., M. Santarelli, and M. Calì. 2007. Hydrogen from renewable energy: A pilot plant for thermal productionand mobility. Journal of Power Sources 171: 237–46.
Dinca, C., andA. Badea. 2013. The parameters optimization for a CFBC pilot plant experimental study of post-combustionCO2 capture by reactive absorption with MEA. International Journal of Greenhouse Gas Control 12: 269–79.

16 J. Frishammar et al.
Dyer, U.C., D.A. Henderson, M.B. Mitchelli, and P.D. Tiffin. 2002. Scale-up of Vilsmeier formylation reaction: Useof HEL Auto-MATE and simulation techniques for rapid and safe transfer to pilot plant from laboratory. OrganicProcess Research & Development 6: 311–16.
Frishammar, J., H. Florén, and J. Wincent. 2011. Beyond managing uncertainty: Insights from studying equivocality inthe fuzzy front end of product and process innovation projects. IEEE Transactions on Engineering Management 29:468–88.
Frishammar, J., U. Lichtenthaler, and M. Kurkkio. 2012. The front end in non-assembled product development: A multiplecase study of mineral- and metal firms. Journal of Engineering and Technology Management 58: 551–63.
Galbraith, J. 1977. Organization design. Reading, MA: Addison-Wesley.Geels, F.W. 2005. Technological transitions and system innovations: A co-evolutionary and socio-technical analysis.
Cheltenham: Edward Elgar.Geels, F.W., and R. Raven. 2006. Non-linearity and expectations in niche-development trajectories: Ups and downs in
Dutch biogas development (1973–2003). Technology Analysis & Strategic Management 18: 375–92.Gocht, W., A. Sommerfeld, R. Rautenbach, T.H. Melin, L. Eilers, A. Neskakis, D. Herold, V. Horstmann, M. Kabariti, and
A. Muhaidat. 1998. Decentralized desalination of brackish water by a directly coupled reverse-osmosis-photovoltaic-system: A pilot plant study in Jordan. Renewable Energy 14: 287–92.
Harborne, P., and C. Hendry. 2009. Pathways to commercial wind power in the US, Europe and Japan: The role ofdemonstration projects and field trials in the innovation process. Energy Policy 37: 3580–95.
Harborne, P., C. Hendry, and J. Brown. 2007. The development and diffusion of radical technological innovation: The roleof bus demonstration projects in commercializing fuel cell technology. Technology Analysis & Strategic Management19: 167–87.
Hellsmark, H. 2010. Unfolding of the formative phase of gasified biomass in the European Union: The role of systembuilders in realising the potential of second-generation transportation fuels from biomass. PhD diss., ChalmersUniversity of Technology, Gothenburg.
Hellsmark, H., and S. Jacobsson. 2012. Realising the potential of gasified biomass in the European Union: Policy challengesin moving from demonstration plants to a larger scale diffusion. Energy Policy 41: 507–18.
Hendry, C., P. Harborne, and J. Brown. 2010. So what do innovating companies really get from publicly fundeddemonstration project and trials? Innovation lessons from solar photovoltaics and wind. Energy Policy 38: 4507–19.
Hoogma, R. 2000. Exploiting technological niches: Strategies for experimental introduction of electric vehicles. Enschede:Twente University Press.
Hoogma, R., R. Kemp, J. Schot, and B. Truffer. 2002. Experimenting for sustainable transport: The approach of strategicniche management. London: Routledge.
Hutcheson, P.,A.W. Pearson, and D.F. Ball. 1995. Innovation in process plant:A case study of ethylene. Journal of ProductInnovation Management 12: 415–30.
Hutcheson, P., A.W. Pearson, and D.F. Ball. 1996. Sources of technical innovation in the network of companies providingchemical process plant and equipment. Research Policy 25: 25–41.
International EnergyAgency. 2014. Status of 2nd generation biofuels demonstration facilities. http://demoplants.bioenergy2020.eu/ (type of facility; accessed January 31, 2014).
Jones, E.G., D.F. Ball, and T.A.J. Cockerill. 1983. The role of the process plant contracting industry in technologicalchange. R&D Management 13: 155–67.
Kale, D., and S. Little. 2007. From imitation to innovation: The evolution of R&D capabilities and learning processes inthe Indian pharmaceutical industry. Technology Analysis & Strategic Management 19: 489–609.
Kamp, L.M., R.E.H.M. Smits, and C.D. Andriesse. 2004. Notions on learning applied to wind turbine development in theNetherlands and Denmark. Energy Policy 32: 1625–37.
Karlström, M., and B.A. Sandén. 2004. Selecting and assessing demonstration projects for technology assessment: Thecase of fuel cells and hydrogen systems in Sweden. Innovation: Management, Policy & Practice 6: 286–93.
Kemp, R., J. Schot, and R. Hoogma. 1998. Regime shifts to sustainability through processes of niche formation: Theapproach of strategic niche management. Technology Analysis & Strategic Management 10: 175–95.
Kingston, W. 2000. Antibiotics, invention and innovation. Research Policy 29: 679–710.Klepper, S., and K.L. Simons. 1997. Technological extinctions of industrial firms: An inquiry into their nature and causes.
Industrial and Corporate Change 6: 379–460.Kline, S.J., and N. Rosenberg. 1986. An overview of innovation. In The positive sum strategy: Harnessing technology for
economic growth, ed. R. Landau and N. Rosenberg, 275–305. Washington, DC: National Academy Press.Klitkou, A., L. Coenen, P. Dannemand Andersen, A. Fevolden, and T. Hansen. 2013. Role of demonstration projects in
innovation: Transition to sustainable energy and transport. Paper presented at the 4th international conference onsustainability transitions, June 18–21, in Zürich, Switzerland.

The role of pilot and demonstration plants in technological development 17
Lager, T. 2000. A new conceptual model for the development of process technology in process industry. InternationalJournal of Innovation Management 4: 319–46.
Lager, T., S. Blanco, and J. Frishammar. 2013. Managing R&D and innovation in the process industries. R&D Management43: 189–95.
Lave, J., and E. Wenger. 1991. Situated learning: Legitimate peripheral participation. New York: Cambridge UniversityPress.
Lefevre, S.R. 1984. Using demonstration projects to advance innovation in energy. Public Administration Review 44:483–90.
Leseure, M.J., J. Bauer, K. Birdi, A. Neely, and D. Denyer. 2004. Adoption of promising practices: A systematic reviewof the evidence. International Journal of Management Reviews 5/6: 169–90.
Macey, S.M., and M.A. Brown. 1990. Demonstrations as a policy instrument with energy technology examples. ScienceCommunication 11: 219–36.
Magill, K., and E. Rogers. 1981. Federally sponsored demonstrations of technological innovations. Knowledge: Creation,Diffusion, Utilization 3: 23–42.
Moore, G.G. 1998. Crossing the chasm: Marketing and selling technology products to mainstream customers. 2nd ed.Chichester: Capstone.
Mowery, D.C., R.R. Nelson, and B.R. Martin. 2010. Technology policy and global warming: Why new policy models areneeded (or why putting new wine in old bottles won’t work). Research Policy 39: 1011–23.
Myers, S. 1978. Demonstration project as a procedure for accelerating the application of new technology. Washington,DC: United States Department for Energy.
Nguyen, Q.A., J.H. Dickow, B.W. Duff, J.D. Farmer, D.A. Glassner, K.N. Ibsen, M.F. Ruth, D.J. Schell, I.B. Thompson,and M.P. Tucker. 1996. NREL/DOE ethanol pilot-plant: Current status and capabilities. Biosource Technology 58:189–96.
Nielsen, P.T., L. Li, and G.T. Rochelle. 2013. Piperazine degradation in pilot plants. Energy Procedia 37: 1912–23.Notz, R., H.P. Mangalapally, and H. Hasse. 2012. Post combustion CO2 capture by reactive absorption: Pilot plant
description and results of systematic studies with MEA. International Journal of Greenhouse Gas Control 6: 84–112.Palluzi, R.P. 1992. Pilot plant design, construction, and operation. New York, NY: McGraw-Hill.Pisano, G.P. 1994. Knowledge, integration, and the locus of learning: An empirical analysis of process development.
Strategic Management Journal 15: 85–100.Pisano, G.P. 1996. Learning-before-doing in the development of new process technology. Research Policy 25: 1097–119.Raven, R. 2005. Strategic niche management for biomass: A comparative study on the experimental introduction of
bioenergy technologies in the Netherlands and Denmark. PhD diss., Technische Universiteit Eindhoven, Eindhoven.Ren,T. 2009. Barriers and drivers for process innovation in the petrochemical industry:A case study. Journal of Engineering
and Technology Management 26: 285–304.Rip, A., and R. Kemp. 1998. Technological change. In Human choice and climate change, ed. S. Rayner and E.L. Malone,
327–99. Columbus, OH: Battelle Press.Rosenberg, N., and W.E. Steinmueller. 2013. Engineering knowledge. Industrial and Corporate Change 22: 1129–58.Sagar,A.D., and S.K. Gallagher. 2004. Energy technology demonstration and deployment. In Ending the energy stalemate:
A bipartisan strategy to meet America’s energy challenges, ed. J.P. Holdren, W.K. Reilly, J.W. Rowe, P. Sharp, andJ. Grumet, 1–120. Cambridge, MA: Belfer Center for Science and International Affairs.
Sandén, B.A., and K.M. Hillman. 2011. A framework for analysis of multi-mode interaction among technologies withexamples from the history of alternative transport fuels in Sweden. Research Policy 40: 403–14.
Schumpeter, J. 1934. The theory of economic development. Cambridge, MA: Harvard University Press.Smith, A., and R. Raven. 2012. What is protective space? Reconsidering niches in transitions to sustainability. Research
Policy 41: 1025–36.Stadler, C. 2011. Process innovation and integration in process-oriented settings: The case of the oil industry. Journal of
Product Innovation Management 28: 44–62.Thorpe, R., R. Holt, A. Macpherson, and L. Pittaway. 2005. Using knowledge within small and medium-sized firms: A
systematic review of the evidence. International Journal of Management Reviews 7: 257–81.Tyre, M.J., and E. von Hippel. 1997. The situated nature of adaptive learning in organizations. Organization Science 8:
71–83.Von Krogh, G., C. Rossi-Lamastra, and S. Haefliger. 2012. Phenomenon-based research in management and organization
science: When is it rigorous and does it matter? Long Range Planning 45: 277–98.Wakami, H., and J. Yoshida. 2005. Grignard exchange reaction using a microflow system: From bench to pilot plant.
Organic Process Research & Development 9: 787–91.

18 J. Frishammar et al.
Wieckert, C., U. Frommherz, S. Kräupl, E. Guillot, G. Olalde, M. Epstein, S. Santén, T. Osinga, and A. Steinfeld. 2007.A 300 kW solar chemical pilot plant for the carbothermic production of zinc. Journal of Solar Energy Engineering129: 190–6.
Yli-Kauhaluoma, S. 2013. You just have to see it: Exploring the forms of expert pattern recognition in the developmentof chemical technology. Organization 13: 393–420.

III


What are the Innovation Effects of Pilot and Demonstration Plants? The Case of Advanced
Biofuels in the Transport Sector*
KRISTOFFER BÄCKSTRÖM
Economics UnitLuleå University of Technology
SE-971 87 Luleå, Sweden
Phone: +46-920-492890E-mail: [email protected]
AbstractPilot and demonstration plants (PDPs) may be important for fostering technologicalinnovation. They constitute a bridge between basic knowledge generation and technological breakthroughs on the one hand, and industrial application and commercial adoption of new technology on the other. The aim of this paper is to examine the innovation impacts of publicly funded PDP activities in the empirical context of production technology for advanced biofuels. The study is conducted by employing patent data for eight European countries over the time period 1980-2011, and it is acknowledged that PDPs have two main objectives: testing and optimization of technology (experimental PDPs), and diffusion and commercialization of technology (exemplary PDPs). The results are overall robust to alternative model specifications, and indicate that: (a) PDP activities are overall positively correlated with biofuel patenting activity; (b) both experimental and exemplary PDPsencourage biofuel innovation although the impact of the former is more profound; and (c) development activities in experimental PDPs encourage innovation also indirectly through knowledge spillovers across countries.
Keywords: innovation; patents; advanced biofuels; pilot and demonstration plants.
JEL classifications: O34; O38; Q55; Q58.
* Accepted for presentation at the 23rd European Biomass Conference and Exhibition, Vienna, June 1-4, 2015. Financial support from the Bio4Energy research environment and the Swedish Research Council Formas is gratefully acknowledged, as are valuable comments by Johan Frishammar, Rikard Gebart, Hans Hellsmark, Robert Lundmark, Johanna Mossberg, Patrik Söderholm and the members of the Luleå Economics International Advisory board: Carol Dahl, Carolyn Fischer and Nicholas Hanley. Any remaining errors reside solely with the author.


1
1. Introduction
1.1 Background and ContributionThe transport sector is currently facing a number of challenges such as its dependence on fossil fuels, local air pollution and its contribution to greenhouse gas emissions. On political agendas and in the media the issue of biofuels for transportation is becoming increasingly prevalent, a fact reflected in, e.g., the passing of the Renewable Energy Directive by the EU Commission in 2009 (Directive 2009/28/EC). The directive lays down a mandatory 10 percent minimum target for the share of biofuels and other renewables in road transport fuels to be achieved by all member states by 2020.
Production and use of biofuels provide several benefits, including de-carbonization of the transport sector and reduced local air pollution, and this is especially the case of so-called advanced biofuels (produced from non-edible feedstocks). However, commercialization and large scale deployment of advanced biofuels are obstructed as the production technologies are not yet mature and still under development. While production processes have been tested and proven in lab scale, tests, re-development and demonstration at larger scale is necessary before the technologies can successfully be implemented commercially. In response to this, a number of companies around the world pursue projects to develop and deploy technologies for production of advanced biofuels by operating pilot and demonstration plants (PDPs) (e.g., Bacovsky et al., 2013). PDP activities are taking place along a number of trajectories which differ with respect to, e.g., the type of biofuel produced and the production process used. For instance, some PDPs produce synthetic natural gas (SNG) based on thermochemical conversion while others employ biochemical conversion processes to produce ethanol.
Using PDPs to test, develop and diffuse technology is not a unique feature of the biofuel sector, nor is it a new phenomenon in the energy sector. For instance, a number of PDPs are currently being operated or planned around the world to enable learning and reduce costs in the case of carbon capture and storage (CCS) technology (Haszeldine et al., 2009). Moreover, several wind power and solar photovoltaic (PV) PDPs have been operated in Europe, Japan and the US since the 1970s (e.g., Hendry et al., 2010a). Still, PDPs have been used earlier than this – pilot experiments were for example conducted in the early 1940s by the pharmaceutical company Merck, which indicated that streptomycin was the answer to tuberculosis (e.g., Kingston, 2000).
PDPs may be important for fostering technological development (i.e., innovation) as they constitute a bridge between basic knowledge generation on the one hand, and exploitation of new technology for commercial use on the other. For instance, so-called experimental PDPsoffer opportunities for technology to be developed, fine-tuned and adjusted for commercial purposes in an industrially relevant scale (e.g., Frishammar et al., 2015). Moreover, so-called exemplary PDPs can be important for the reduction of organizational, institutional and market related uncertainties which could otherwise hamper desirable diffusion and learning-by-doing (e.g., tacit knowledge acquired during manufacturing) (e.g., Lefevre, 1984; Magill and

2
Rogers, 1981). It has also been suggested that development activities at PDPs may generate knowledge spillovers which are beneficial to society (e.g., Hendry et al., 2010b). A lack of understanding of the importance of PDPs for technological innovation makes it difficult to design appropriate public support for such activities and to realize potentially generated social benefits.
The relationship between environmental policy and innovation has received increasingly moreattention in the empirical research, and the overall findings suggest a positive correlation between the two (e.g., Johnstone et al., 2010; Noailly and Batrakova, 2010; Brunnermeier and Cohen, 2003; Popp, 2002). Previous research efforts also indicate that technical innovation in the renewable energy sector can generally be induced by two main policy types: public R&D support, and production support schemes such as feed-in tariffs or renewable energy certificates (e.g., Bäckström et al., 2014; Johnstone et al., 2010). Still, while the role of these policies for technology development has been fairly well investigated, the potential innovation impacts of publicly funded PDP activities have been largely overlooked (Klitkou et al., 2013; Frishammar et al., 2015).
Karlström and Sandén (2004), being one exception, studies the role of PDPs for advancing innovation in energy technology, and it is concluded that PDPs are important not only for technical development but also for market creation and network formation. Other studies explicitly addressing the role of privately or publicly funded PDPs in socio-technical regime shifts and technology development include Baer et al. (1976), Myers (1978), Lefevre (1984), Harborne and Hendry (2009) and Hellsmark (2010). The existing research, however, consists of conceptual studies or retrospective case studies based entirely on qualitative or descriptive approaches (Frishammar et al., 2015; Klitkou et al., 2013). Consequently, while the importance of PDPs for innovation has been confirmed in such studies, their role for technical development remains to be investigated also in a quantitative empirical setting.
1.2 Purpose and Overall ApproachFollowing the above, the specific purpose of this paper is to empirically assess the effects of publicly funded PDP activities on innovation in advanced biofuel production technology. In doing this it is acknowledged that PDPs have two main objectives: testing and optimization of technology in an industrially relevant scale (experimental PDPs), and diffusion and commercialization of technology and products (exemplary PDPs). Technical innovation is measured as counts of patents related to technology for producing advanced biofuels.
The empirical analysis builds on a panel data set of eight European countries over the time period 1980-2011. Regression models are specified in which the dependent variable, biofuel patent counts, is explained by PDP activities along with a selection of control variables (see further section 4.1). Based on the estimation results elasticities are computed reflecting changes in patenting activity with respect to (marginal) changes in the independent variables. Specifically, the paper analyzes: (a) the overall effect of PDPs on innovation in biofuel technology; (b) the innovation impacts of PDPs with different objectives; and (c) whether

3
PDPs induce technical development also indirectly through knowledge spillovers. Sensitivity analyzes are conducted to check the robustness of the results.
1.3 Current Status of Advanced Biofuels for Transportation
In most parts of the world, the fastest growth in biofuel production has taken place since the 2000s and has generally been promoted by blending obligation schemes and tax incentives. Global production increased from 16 to 100 billion liters between 2000 and 2010 (IEA, 2011), and in the IEA member countries in Europe biodiesel production grew from 717 to 9.765 kiloton during the same period (IEA, 2014a). In 2008 about 3 percent of the demand for road transport fuels was met with biofuels in the EU (IEA, 2011), and biodiesel constituted around 80 percent of these while the rest were primarily bioethanol, pure plant oil and biogas (Pelkmans et al., 2008).
Still, the impressive increase in biofuel production has not been free of controversy. Their ability to displace fossil energy has been questioned along with their ability to de-carbonize the transport sector (e.g., Searchinger et al., 2008), and studies have linked their production to rising food prices and analyzed their potential contribution to deforestation (e.g., Timilsina et al., 2010; Mitchell, 2008). These discussions have prompted an increased interest in so-called advanced biofuels, a fact reflected in a recent proposal by the Energy Council of the EU limiting the support for conventional biofuels while encouraging member states to set minimum target levels for advanced biofuels (Proposal for a Directive COM(2012) 595). Advanced biofuels refers to: (a) 2nd generation biofuels (derived from non-food sources, e.g., wheat stalks, corn stover etc.); (b) 3rd generation biofuels (derived from algae); and (c) 4th
generation biofuels (derived from modified micro-organisms).1 Advanced biofuels enable greater reductions in greenhouse gas emissions and are less water and land intensive compared to conventional (1st generation) biofuels derived from edible feedstocks, e.g., sugar or starch (e.g., Carriquiry et al., 2011; UNEP, 2009; Scharlemann and Laurance, 2008).
1.4Outline of PaperThe next section provides key theoretical underpinnings of the empirical analysis conducted in this paper. Section 3 contains a discussion on PDPs in the specific context of advanced biofuels and it also displays relevant PDP data. Section 4 outlines the model specifications and contains a discussion on the econometric issues. In section 5, the data sources and definitions are presented. Section 6 provides the econometric results and their key implications. In section 7, some final concluding remarks are outlined and some suggestions for future research are provided.
1 The distinction between different biofuel generations can be made on the basis of a number of parameters, e.g., technology maturity, feedstock type or GHG emission balance (Bacovsky et al., 2013). Guiding the distinction with respect to feedstock type is in line with, e.g., Carriquiry et al. (2011), UNEP (2009), and OECD/IEA (2008).

4
2. The Role of Pilot and Demonstration Plants in Technological Development
In recent decades the role of endogenous innovation and technological change has received increased attention in the economics literature on environmental policy and innovation (e.g., Lanjouw and Mody, 1996; Brunnermeier and Cohen, 2003; Gillingham et al., 2008).Modeling endogenous innovation implies explicitly addressing the feedback mechanisms by which market signals and policy may change the direction of technological change towards cleaner (e.g., carbon-free) energy technology.2 Generally, policy-induced innovation is modeled as occurring through two main channels: basic knowledge generation, and learning-by-doing (e.g., tacit knowledge acquired during manufacturing). The former is supported by public R&D expenses which add up to a cumulative knowledge stock (e.g., Sue Wing, 2006;Löschel, 2002). The latter is encouraged by production support schemes resulting in capacity and production expansions (e.g., Grubb et al., 2002). Figure 1 provides an illustration of the conceptual framework which draws heavily on Frishammar et al. (2015).
The mid-part in Figure 1 builds on the Schumpeterian notion of three stages in the process of technological development: invention, innovation and diffusion (Schumpeter, 1934). These constitute the conditions necessary for successful large scale deployment of a product or technology. Invention refers to development of a new product or process and innovation to the subsequent process in which technology is up-scaled, optimized and commercialized (these terms are often used synonymously in the literature). Diffusion refers to the gradual adoption of the new technology by firms. Still, this linear view of the technology development process needs to be developed in some important respects.
First, the technology development process is iterative and non-linear in the sense that none of the stages represent isolated activities. In practice there are feedback effects from the pilot and demonstration plant (PDP) phase to basic R&D and from the diffusion stage to PDP activities and basic R&D (e.g., Kline and Rosenberg, 1986; Sagar and van der Zwaan, 2006). For instance, when new technology is introduced future innovations will be affected (the re-development of a technology) through learning and vice versa. Second, innovation may be encouraged not only with R&D expenditures and production support schemes, but also with publicly funded PDP activities (e.g., Karlström and Sandén, 2004; Hendry et al., 2010a;Macey and Brown, 1990). Third, the process of technological progress is embedded in an actor network consisting of industrial firms, research organizations, users etc. (Carlsson and Stankiewicz, 1991). These networks can shape the process by lobbying for political support, and they grow more complex as the system boundaries become wider as we move from the R&D stage towards deployment. Fourth, and finally, the technology development process is also influenced by exogenous factors, e.g., geopolitical events or changes in patent systems.
2 This line of reasoning was first introduced by Hicks (1932), who claimed that a change in the relative prices of two production factors will spur innovations with the aim to economize the use of the factor which has become relatively more expensive.

5
Figure 1: The Role of Pilot and Demonstration Plants in the Process of Technological Development
Source: Adapted from Frishammar et al. (2015).
The innovative activities of firms are generally viewed as being profit-motivated, regardless if firms are perceived as rational agents who optimize their R&D investment activities (e.g., Jaffe et al., 2002).3 The R&D investment decisions are therefore essentially governed by their expected return as well as their costs. There are a number of factors which may determine the profitability of R&D and these include the size of the market, general scientific capacity and appropriability conditions (Schmookler, 1966; Rosenberg, 1982; Jaffe, 1988). Specifically, a larger market implies an increasing potential for firms to recoup their investments, and an increased general scientific capacity (i.e., scientific personnel, resources etc.) makes additional innovation less costly at a fixed level of demand. Moreover, know-how produced from R&D may benefit recipient firms that can imitate at a fraction of total costs incurred by the originator. The profitability of R&D and the propensity to engage in innovative activities and patenting are therefore also affected by legal conditions (i.e., patent rules and intellectual property rights). As legal conditions may differ across countries and over time, the propensity to patent will probably vary across countries and change over time within countries (Jaumotte and Pain, 2005).4
3 The term ‘R&D’ is used here in a broader sense, encompassing both basic R&D as well as applied R&D (i.e., PDP activities). 4 Propensity to patent is probably also affected by changes in strategies adopted by firms to capture the rents from innovation and the strategies may differ across countries and over time as well.
Public R&D expenditures:
Basic knowledge generation
Pilot and demonstration plants: Optimization, up-
scaling, verification, market creation etc.
Production support schemes:
Diffusion
Technological development
Exogenous factors: Geopolitical events, changes in patent systems etc.
Public R&D expenditures:
Basic knowledgegeneration
Pilot and demonstration plants: Optimization, up-
scaling, verification, market creation etc.
Production support schemes:
Diffusion
Technological development

6
In this paper the relationship between publicly funded PDP activities and biofuel patent counts is examined. As suggested in the literature, PDPs can take on a number of important roles in the technology development process as they focus not solely on technical progress but on commercialization as well. This raises the question what is actually measured with patent counts. The indicator is generally taken as a measure of inventive performance in the economics literature on policy-induced innovation, which is also the case in this paper. Still,for an invention to be patented it must not only be novel and involve a non-obvious step – itmust also be commercially viable (OECD, 2009). Furthermore, most economically significant inventions have been patented (Dernis et al., 2001; Dernis and Kahn, 2004), suggesting that the indicator may reflect the creation of new technology as well as its subsequent commercialization. While this question is important for the purpose of this paper, it has bearing for research based on patent counts in general. For a more thorough discussion on patent data, see section 5.1.
3. Pilot and Demonstration Plants for Advanced Biofuels
This section provides an overview of pilot and demonstration plants (PDPs) producing advanced biofuels and/or fine-tuning conversion processes in the sample countries and over the time period 1980-2012 (the data sources are specified in section 5.2).5 No bench or lab scale plants have been considered for this study and only PDPs having received partial public funding are included (although most PDPs have been granted public funds). In addition, PDPsexclusively producing or developing processes for biofuels from edible feedstocks (conventional biofuels) have not been taken into consideration.
Table A1 in the Appendix provides an overview of the plants being, or have been, in operation. A PDP focusing primarily on technology optimization and up-scaling issues is classified as an experimental PDP, and a plant functioning mainly to diffuse a technology or product is categorized as an exemplary PDP. In summary, 15 PDPs have been in operation with the majority focusing on technology development and up-scaling issues and thus viewed as experimental plants. All sample countries have supported advanced biofuels by investing public funds in PDPs, although the number of plants supported varies across the countries. Public funding has been awarded to more than one plant only in Denmark (six PDPs),Germany (two PDPs) and Sweden (two PDPs).
Plant investments and installed output capacities vary considerably across PDPs. The highest investment, €56.18 million, has been made in the PDP in Babilafuente (Spain) and the lowest, €0.85 million, in the Maxifuel facility in Copenhagen (the figures reflect both private and public investment funds). Regarding output capacities, the biorefining plant in Oulu (Finland) can produce 5.000 tons per year of ethanol which is unmatched by the other PDPs with capacities from 4.300 tons per year of ethanol down to as little as 2 tons per year of hydro treated vegetable oil (HVO). Moreover, of the 15 PDPs covered only three produce biofuels
5 For simplicity, only PDPs having been taken into operation have been considered when collecting the data. Nevertheless, PDP projects never reaching the startup phase could possibly result in innovative output as well.

7
based on thermochemical conversion, the remaining plants use biochemical conversion processes. Finally, all PDPs focus on producing or developing conversion processes for 2nd
generation biofuels. In four plants work is also being done concerning 1st generation biofuels and only two PDPs function to develop and produce 3rd generation fuels.
Counts of PDPs in operation are displayed in Figure 2. As shown, there has been a steady increase in the number of operational PDPs. The experimental Pilot 1 facility in Fredericia (Denmark) started its operation in 2003 and was the first PDP on stream. During 2004-2009 a number of additional experimental PDPs came into operation resulting in six facilities on stream by 2009. Work in two exemplary PDPs was started in 2010 and these were the Biorefinery Demo Plant in Örnsköldsvik (Sweden) and the Chempolis Biorefining Plant in Oulu (Finland). The third exemplary PDP, the Bio Base Europe Pilot Plant in Ghent (Belgium), became operational in 2011.6
Figure 2: Total Number of Pilot and Demonstration Plants inOperation in the Sample Countries, 2000-2012
Sources: Bacovsky et al. (2013), Biofuels Digest (2014),BIOMAP (2014) and IEA (2014b).
Another way of depicting PDP activities is to consider the investment made in each plant.Investments can result in the build-up a knowledge stock over time, and in this paper annual PDP investments are assumed to add to this stock with a time lag and knowledge is assumed to depreciate over time at a certain rate (see section 5.2). Figure 3 depicts the development of two knowledge stocks based on investments in experimental and exemplary PDPs, respectively. The first investment in experimental plants was made in 2002 and has been followed by additional investments resulting in an ever larger experimental PDP knowledge
6 Table A1 in the Appendix indicates that all exemplary PDPs came on stream in 2010. However, if startup of normal operation in a given facility occurs on or between 1 July and 31 December in year t, startup has been attributed to year t + 1 in Figure 2 and in the regressions that follow (if startup occurs before 1 July it has beenattributed to year t). The idea is that PDP activities occurring before 1 July in year t are attributed to this year since they can explain more than half of all patent counts in year t (given that patent activities are uniformly distributed over a one year period). If a PDP is taken into operation on or after 1 July it can explain less than (or exactly) half of all patenting activities in the current year. For instance, the approach avoids the situation where patent counts in January-November in year t are to be explained by PDP activities starting in, e.g., December in year t.
0
2
4
6
8
10
12
14
2000 2001 2002 2003 2004 2005 2006 2007 2008 2009 2010 2011 2012
Tot
al n
umbe
r of
PD
Ps in
op
erat
ion
in th
e sa
mpl
e co
untr
ies
Total number of exemplary PDP's
Total number of experimental PDP's

8
stock. The exemplary stock also displays an overall positive trend, with the first investments being made in 2008. Notable is that the experimental stock is greater during 2000-2012.
Figure 3: Pilot and Demonstration Plant Based Knowledge Stocks Constructed of Total Plant Investments across the Sample Countries
(1 year lag and 20 % depreciation rate), 2000-2012** One experimental PDP has not been considered due to missing data.
Sources: Bacovsky et al. (2013), BIOMAP (2014), IEA (2014b)and various plant specific sources.
In Figure 4 an alternative measure of PDP activities is presented based on cumulative output capacities. According to the figure there was virtually no biofuel production capacity before 2009. However, the cumulative output capacity increased significantly the year after. Over the time period 2009-2012 cumulative output capacity increased faster in exemplary plants than in experimental facilities.
Figure 4: Total Cumulative Pilot and Demonstration PlantOutput Capacity in the Sample Countries, 2000-2012*
*A number of plants have not been considered due to missing data. Sources: Bacovsky et al. (2013), Biofuels Digest (2014), BIOMAP (2014),
IEA (2014b) and various plant specific sources.
0
20
40
60
80
100
120
140
2000 2001 2002 2003 2004 2005 2006 2007 2008 2009 2010 2011 2012
PDP
know
ledg
e st
ocks
(bas
ed o
n to
tal p
lant
inve
stm
ents
acr
oss t
he
sam
ple
coun
trie
s, M
€, 2
010
pric
es) Experimental PDP knowledge stock
(based on plant investments)Exemplary PDP knowledge stock(based on plant investments)
0
10 000
20 000
30 000
40 000
50 000
60 000
2000 2001 2002 2003 2004 2005 2006 2007 2008 2009 2010 2011 2012
Tot
al c
umul
ativ
e PD
P ou
tput
ca
paci
ty in
the
sam
ple
coun
trie
s (t
ons/
year
)
Cumulative output capacity of exemplary PDP's
Cumulative output capacity of experimental PDP's

9
4. Methodological Approach and Model Estimations Issues
4.1 Model Specifications
In this paper it is hypothesized that biofuel innovation is explained by policy support, market factors and legal conditions. The innovation effects of pilot and demonstration plants (PDPs) are empirically investigated by using patent counts, and this approach necessitates the use of count data modeling techniques which have been developed for estimating the number of occurrences of an event, or event counts (e.g., Maddala, 1983; Cameron and Trivedi, 1998).An event count is formally defined as the realization of a non-negative integer-valued random variable. For this study, an event count corresponds to the number of biofuel patents in a given country and time period.
Five models, hereafter denoted S1-S5, are specified which differ with respect to the way in which PDP activities are operationalized. In all specifications the dependent variable, biofuel patent counts (BIOPAT), is assumed to be explained by PDP activities (PDP) along with a selection of control variables: biofuel blending obligations (BLEND), fossil diesel prices (PRICE) and total counts of patent applications for all technology areas (TOTPAT). The following reduced-form model can thus be specified:
, = + , + , + , + [1]
, + + ,where i indexes the cross-sectional unit (i.e., country) and t indexes time. Country-specific dummy variables (D) have been included to control for fixed effects attributed to unobserved factors such as regulatory and institutional framework etc. Finally, all residual variation is captured by the additive error term ( , ).
Biofuel blending obligation schemes (BLEND) are basically requirements on fuel distributors to supply certain amounts of biofuels in relation to total sales of fossil fuels. Blending schemes are included since demand-pull production support should incentivize biofuel patenting activity by establishing a larger market and thus an increased potential for firms to recoup their investments. Furthermore, the commercial viability of biofuels is largely dependent on their price relative to the price of substitutes such as automotive diesel fuel. Increases in fossil diesel prices (PRICE) should imply increasing commercial viability of biofuels and thus increasing incentives to innovate in their production technology. Finally, total counts of patent applications related to all sorts of technologies (TOTPAT) are included to control for variations in scientific capacity and the overall propensity to patent over time and across countries.
In the first and second specification (S1 and S2), it is assumed that biofuel patent counts are explained by the build-up of a PDP based knowledge stock over time. Specifically, annual investments in PDPs are assumed to add to this stock with a time lag, and it is also assumed

10
that knowledge depreciates over time at a certain rate (e.g., Bäckström et al., 2014; Söderholm and Klaassen, 2007; Klaassen et al., 2005). In S1, the knowledge stock (ALLSTOCK) is based on total investments in experimental and exemplary PDPs. In S2, these investments are disaggregated by experimental PDPs (EXPSTOCK) and exemplary PDPs (EXEMSTOCK). Section 5.2 covers the details of these variable specifications.
Since this is the first explicit attempt to quantitatively examine the innovation effects of PDPs, an alternative way of measuring PDP activities is considered in the third specification (S3). Here the PDP investment based knowledge stocks have been replaced with a measure of installed output capacity in exemplary PDPs accumulated over time in a given country(EXEMOUTCAP). Increases in cumulative output capacity reflect intensive PDP activities and should thus be positively correlated with biofuel patenting. A similar measure forexperimental PDPs is not tested since these plants are operated mainly for technology optimization and development and seldom for continuous production.
The fourth and fifth specifications (S4 and S5) are based on the measure of PDP activities as investment based knowledge stocks. In S4, it is tested whether marginal increases in theexperimental PDP knowledge stock have a higher innovation effect when there are more than one experimental PDP in operation in a given country and year (see further section 5.2).Specifically, a slope dummy variable (INTEREXPSTOCK) is included to test this notion. In S5, it is tested whether biofuel innovation activities in a given country are influenced by domestic as well as foreign PDP knowledge stocks (FEXPSTOCK and FEXEMSTOCK). In other words, biofuel patenting in, e.g., Sweden could be affected not only by domestic PDP knowledge stocks but also by PDP investments in other European countries adding up to foreign knowledge stocks. With this modeling approach the innovation effects of country-level knowledge spillovers are thus tested (e.g., Grafström, 2014; Peters et al., 2012; Verdolini and Galeotti, 2011).
In summary, the empirical analysis is based on five model specifications which differ concerning how PDP activities are operationalized: (S1) PDP activities measured as a knowledge stock based on total PDP investments; (S2) knowledge stocks based on investments in experimental and exemplary PDPs, respectively; (S3) exemplary PDP activities measured as cumulative output capacity; (S4) PDP knowledge stocks and a slope dummy variable for increases in the knowledge stock and when there are more than one PDP in operation; and (S5) domestic and foreign PDP investment based knowledge stocks.
4.2 Econometric IssuesThe count nature of the dependent variable studied necessitates the use of some count data modeling technique, and Poisson or negative binomial (NB) estimators are generally used to this end (e.g., Cameron and Trivedi, 1998; Maddala, 1983). A NB estimator is used for this study as Poisson estimators are often too restrictive due to them being derived from an equidispersed distribution (where the variance equals the mean) (Hilbe, 2011). Patent data and other count data are in many cases overdispersed, meaning that the variance exceeds the mean, and when Poisson estimators are applied to such data the standard errors can be

11
underestimated. A NB estimator, on the other hand, can accommodate overdispersion and is also used in other related work (e.g., Johnstone et al., 2010; Rübbelke and Weiss, 2011).
Two common fixed effects NB models are the so-called conditional NB1 model and the unconditional NB2 model (e.g., Cameron and Trivedi, 1998; Greene, 2008).7 The latter is employed for this study as the conditional NB1 model does not control for country-specific fixed effects unless a very specific set of suppositions are met (e.g., Allison and Waterman, 2002; Guimarães, 2008). The unconditional NB2 model (i.e., a conventional NB2 model with dummy variables to address the fixed effects) has been found to perform well although the standard errors are biased downwards (Allison and Waterman, 2002). To adjust for any potential bias in the standard error estimates, bootstrapped standard errors are computed.
All model specifications are estimated using Stata 12 and a modified Newton-Raphson algorithm (i.e., the default setting when employing maximum likelihood estimation). To avoid perfect collinearity, the country-specific dummy variable for Germany is omitted from the estimations. Hence, Germany is the reference country in all regressions that follow.
5. Data Sources and Definitions
The econometric analysis in this paper is based on an unbalanced panel data set comprising eight European countries over the time period 1980-2011. Specifically this includes Austria, Belgium, Denmark, Finland, France, Germany, Spain and Sweden. Among these, prominent biofuel producers are included (e.g., Germany and France) as well as relatively small producers (e.g., Denmark, Finland and Austria). Due to delays in the publishing of patent information, the rate of applications decrease in recent years (2012-2015) and the panel data set is thus limited to 2011.
5.1 The Dependent Variable: Biofuel Patent CountsTo measure biofuel innovations (the dependent variable), counts of patent families have been used related to technologies for pre-treatment and conversion of biomass to advanced liquid and gaseous biofuels for transportation. This includes conversion by thermochemical (e.g., gasification), chemical (e.g., hydro treatment) and biochemical methods (e.g., enzymatic hydrolysis).8 A patent family is a set of patents or applications recorded at various patent offices around the world usually protecting the same invention (OECD, 2009). In this paper, counts of Derwent World Patents Index (DWPI) families are used as a proxy for innovation activity, and due to their strict family definition they are generally deemed representative of single inventions (Martinez, 2010; Thomson Reuters, 2014a). Specifically, the only DWPI families considered are those containing (at least) an application filed through the Patent
7 The NB1 model specifies that the variance of the dependent count variable is equal to a multiple of the mean while the NB2 variance is quadratic in the mean. Hence, different standard error estimates are generated by the models, and the most common implementation is the NB2 model (e.g., Cameron and Trivedi, 1998).8 The data set excludes patents and applications related to the collection of feedstock and composition of biofuels. In addition, patents covering technologies for 1st generation biofuels have been excluded, except when they also describe non-food feedstock processing.

12
Cooperation Treaty (PCT) and/or to the European Patent Office (EPO). These families,referred to as ‘transnational patents’, are especially suitable to employ for up-to-date policy studies (Frietsch and Schmoch, 2010). Furthermore, by imposing the condition above, only families protecting inventions with high economic value are covered (only patents with high expected value are filed through the relatively costly supranational procedures).9 Because of the same condition, all families considered must comply with PCT and/or EPO formality requirements and the data are thus largely free from patent comparability issues caused by differences in patent rules and practices across countries. In line with recommendations in OECD (2009), the data are sorted by inventor country of residence and earliest priority date, and the data are rounded to the nearest integer (patents specifying multiple inventor countries were partly attributed to each country by the use of fractional counts).
The data were compiled and provided by Thomson Reuters based on their Derwent World Patents Index (DWPI) database (Thomson Reuters, 2014b). The database covers 48 major patent issuing authorities and contains about 20 million inventions corresponding to tens of millions of patents in various technologies (Thomson Reuters, 2014a). To avoid inclusion of irrelevant patents and exclusion of relevant patents, the data collection was based on combinations of key terms, International Patent Classification (IPC) codes and Derwent Manual codes (patent collection based solely on IPC codes is associated with relatively poor validity, e.g., Costantini et al., 2012). To identify candidate indexing codes and key terms and phrases in the technical area, initial searches were conducted to acquire a small sample of high relevance. The sample was reviewed by using text mining, and indexing codes weretested for appropriateness. The search strategies developed were eventually applied to the database in an iterative procedure – relevant patents not previously found were checked for new classification codes and key terms and these were eventually used in new searches. In this way, a well-balanced and substantive overview of the technical area was assembled while avoiding high noise levels (Thomson Reuters, 2014a).10
Patent counts are one of the most frequently used indicators of technological innovation (e.g., Bäckström et al., 2014; Lundmark and Bäckström, 2015; Johnstone et al., 2010). Moreover, since patents are outputs of innovation activities as opposed to other potential indicators such as R&D expenditures, they are generally viewed as a more suitable proxy. Patents also have a close link to inventions and they can be disaggregated to specific technologies due to detailed information content. Still, using patent counts to measure innovation is associated with a number of problems: (a) not all inventions are patented; (b) the value distribution of patents is highly skewed; and (c) there are differences in patent regimes and patent propensity across countries and over time (Schankerman, 1998; Jaumotte and Pain, 2005; OECD, 2009). It is reasonable to assume that patent counts are positively correlated with non-patented inventive activity (Schmoch, 1997), and this mitigates the issue outlined in (a). Moreover, measuring
9 It should be noted that the costs of filing through supranational procedures are still lower than parallel application in multiple countries. 10 In total, 8.629 patent families were identified covering biofuel technology, of which 5.574 are transnational patents. Of these, 39 patents did not specify the address of the inventor(s) and these had to be dropped from the analysis because of the difficulties in attributing them to any of the sample countries.

13
innovations with counts of transnational patents limits the issues outlined in (b) and (c), and differences in patent propensity across countries and over time can be controlled for by the inclusion of country fixed effects and a variable reflecting national patenting activity acrossall technical areas.
Figure 5 illustrates the patent data for the sample countries in terms of counts of transnational patents related to advanced biofuels, and their share of the total number of applications filed under the Patent Cooperation Treaty (PCT) (across all technological areas). Biofuel patenting activity remained stable on a relatively low level during the first half of the time period studied, and after 1997 it increased rapidly but tailed off after 2009.11 Biofuel patents as share of total patents exhibit a U-shape pattern. Between 1980 and around 1995 there were relatively small differences with respect to biofuel patenting across the sample countries. Still, in the end of the 1990s Germany saw its biofuel patent applications increase significantly, andFrance saw its applications increase rapidly since 2004. These developments have made Germany and France the most prominent in biofuel patenting among the sample countries in recent years. The remaining sample countries saw their applications increase in the beginning of the 2000s, although they did not experience a take-off of the same magnitude. Among these, Denmark, Finland and Sweden stand out with the highest number of applications while the figures for Austria, Belgium and Spain display more modest trends.
Figure 5: Biofuel Patent Families (transnational patents) in the Sample Countries, 1980-2011Source: Thomson Reuters (2014b) and OECD (2014).
Corporate actors are the most influential patent applicants as roughly 80 percent of the biofuel patents in the sample have been filed by firms over time period studied.Academic/government applicants and individuals have filed 10 percent, respectively. The most important corporate applicants include Novozymes (Denmark), Neste Oil (Finland), UPM (Finland), BASF (Germany) and Arkema (France). Leading academic/government
11 The decline in biofuel patenting activity after 2009 appears to coincide with a general downturn in patenting reflected by total PCT applications filed across all technical categories (OECD, 2014).
0.00%
0.20%
0.40%
0.60%
0.80%
1.00%
1.20%
1.40%
1.60%
1.80%
0
20
40
60
80
100
120
140
160
180
1980 1983 1986 1989 1992 1995 1998 2001 2004 2007 2010
Biofuel patents as share of total patentsT
otal
num
ber
of b
iofu
el p
aten
ts in
the
sam
ple
coun
trie
s
Total number of biofuel patents
Biofuel patents as share of total patents

14
applicants include the French Institute of Petroleum, the Technical University of Denmark and the University of Cádiz (Spain).
5.2 The Independent VariablesThe independent variables in the model specifications tested can be divided into two main categories: pilot and demonstration plant (PDP) variables, and control variables. To measure PDP activities, two principal approaches are tested where the first is based on total (public and private) plant investments and the second on cumulative output capacity. In this paper it is assumed that PDP investments (in total or categorized for each PDP type) add up to an investment based knowledge stock:
, = (1 ) , + , [2]
where i indexes the sample countries and t indexes time. In equation [2] ALLSTOCK is the (aggregate) PDP investment based knowledge stock for biofuels in country i and time period t, PDPINVEST are the annual investments in both PDP types, x is the number of years it takes before investments add to the knowledge stock, and is the annual depreciation rate of the knowledge stock ( [0,1]). Hence, the formulation suggests that: (a) PDP investments do not have an instantaneous effect on the generation of new knowledge, but will only lead to tangible results after some time has lapsed; and (b) knowledge depreciates in that the effects of previous investments gradually become outdated (Griliches, 1995). The same formulation is applied to the PDP type specific knowledge stocks (EXPSTOCK and EXEMSTOCK), which are based on plant investments disaggregated by experimental and exemplary plants, respectively.
To construct the knowledge stock variables a time lag of one year ( = 1) and a depreciation rate of 20 percent ( = 0.20) is assumed. This suggests a relatively high rate of knowledge depreciation (e.g., Griliches, 1995; Nordhaus, 2002; Klaassen et al., 2005), but this is reflected in the relatively intensive development of production technology for advanced biofuels during the recent decades (e.g., the number of PDPs recently taken into operation).Though, given the uncertainties inherent in these parameter assumptions, the consequences of using alternative depreciation rates and times lags are examined in a sensitivity analysis.
The knowledge stock variables have been constructed based on PDP investment data inBacovsky et al. (2013), BIOMAP (2014), IEA (2014b) and various plant specific sources. The investment figures were taken as nominal currency for the year of the publication or legislation and were deflated to 2010 prices by using a consumer price index. The figures were also converted to EUR when necessary by using market exchange rates. All PDPscovered in this study have been erected during the 2000s and PDP investment figures were thus equal to zero in 1980 (the starting year of the time period covered in this study). These figures represent the initial conditions when constructing the PDP investment based knowledge stocks. For example, the knowledge stock reported in 2005 for a given country is a function of the annual investments in biofuel PDPs during the time period 1980-2004, and with the above depreciation rate attached to the stock. The data sources mentioned above were

15
also used to construct: (a) the second and alternative measure of PDP activities(EXEMOUTCAP) based on cumulative output capacity (tons/year), and to this end, data onPDP specific output capacities were also extracted from Biofuels Digest (2014); (b) the interaction variable (INTEREXPSTOCK) investigating whether increases in the knowledge stock based on experimental PDP investments is more innovation-promoting when there are more than one experimental PDP in operation; and (c) the foreign knowledge stocks(FEXPSTOCK and FEXEMSTOCK) based on PDP investments in sample countries(constructed by adding national knowledge stocks across the sample countries in each year).The focus on experimental PDPs in the case of the interaction variable depends on the lack of observations in the data set where there is more than one exemplary plant in operation (or where both types are in operation simultaneously).
All model specifications (S1-S5) include three control variables: biofuel blending obligation schemes (BLEND), fossil diesel prices (PRICE) and total patent applications (TOTPAT). In the case of BLEND, policy stringency is measured as the required biofuel share of total fossil fuel sales of individual fuel distributors in terms of energy content, and the data were taken from IEA (2004, 2014c) and various country-specific sources. PRICE is based on an industry end-user price index obtained from IEA (2014d), and the index reflects automotive diesel fuel prices including taxes. Prices of petrol were not considered in the empirical analysis since the data suffered from missing observations in several official databases. Still, petrol and diesel prices are likely to be highly correlated, and the European market for automotive fuels is generally considered to be heavily ‘dieselized’ (e.g., Kojima et al., 2007; IEA, 2008). Finally, TOTPAT reflects total patent applications filed under the Patent Cooperation Treaty (PCT)regardless of technological area. The data were obtained from OECD (2014) and are sorted by inventor country of residence and priority date as reported in the database.
The variables employed in the empirical analysis are summarized in Table 1. Due to some missing observations in BLEND, the S3 model is fitted using 251 observations. S1, S2 and S4 use 240 observations because of some additional missing observations in EXPSTOCK. S5 use219 observations due to the missing observations mentioned above and since Austria is excluded from the regression (see further section 6.1). The descriptive statistics presented in Table 1 are based on the 240 observations used to estimate S1, S2 and S4.

16
Table 1: Variable Definitions and Descriptive StatisticsVariables Description and units Mean S.D. Min MaxDependent variable
BIOPAT Total number of biofuel patent families(counts) 4.346 8.783 0 59
Independent variables
BLENDAnnual blending obligation targets for biofuels (% of total sales of fossil fuels in terms of energy content)
0.292 1.193 0 7
PRICE Price index for automotive diesel fuel (2010 = base year) 75.227 16.813 34.461 111.953
TOTPAT Total PCT patent filings (count in thousands) 1.95 3.501 0 18.492
ALLSTOCK
PDP investment based knowledge stock (million EUR in 2010 prices, see section 5.2 for detailed definitions of the stock variables)
3.087 9.895 0 68.246
EXPSTOCKKnowledge stock based on investments in experimental PDPs (million EUR in 2010 prices)
2.881 9.71 0 68.246
EXEMSTOCKKnowledge stock based on investments in exemplary PDPs (million EUR in 2010 prices)
0.207 1.72 0 20.243
EXEMOUTCAP Cumulative output capacity of exemplary PDPs (tons/year) 22.333 323.114 0 5000
INTEREXPSTOCK
ALLSTOCK multiplied with a dummy variable taking the value one (1) if there are more than one PDP in operation, 0 otherwise
1.041 6.816 0 68.246
FEXPSTOCK
Foreign knowledge stock based on investments in experimental PDPs in
sample countries (million EUR in 2010 prices)
16.766 33.504 0 129.439
FEXEMSTOCK
Foreign knowledge stock based on investments in exemplary PDPs in sample countries (million EUR in 2010 prices)
2.016 7.576 0 39.813
6. Empirical Results and Discussion
6.1 Estimation Results from the Negative Binomial Model SpecificationsTable 2 presents the regression results of the five model specifications using a negative binomial model (NB2) with bootstrapped standard errors stratified by country and country-specific fixed effects.12 For all model specifications, the Newton-Raphson algorithm converged to a maximum after relatively few iterations and a concave (i.e., marginally declining) convergence path could be observed (6-9 iterations were required for fitting each specification). In other words, all five log-likelihood functions seem to be well-behaved (Gould et al., 2006). All models are statistically significant according to the p-values associated with the Wald x2-statistics, thus rejecting the null hypothesis that all of the estimated coefficients are equal to zero. Finally, overdispersion tests suggest that a NB distribution and estimator are better suited than a Poisson for the biofuel patent data (e.g.,
12 According to Cameron and Trivedi (1998), 200 bootstrap replications are generally sufficient for estimates of standard errors. Hence, all models (S1-S5) were fitted using 200 replications.

17
Cameron and Trivedi, 1998). Likelihood-ratio tests and Wald tests were conducted and both reject the null hypothesis of equidispersion (i.e., that the overdispersion parameter is equal to zero), except for S4 and S5 where the Wald test could not reject the null hypothesis. Althoughthe tests yield conflicting results for S4 and S5, a NB estimator is still regarded as preferable over a Poisson since it can accommodate overdispersion parameters close to zero as well as overdispersion. Nevertheless, the flexibility of a NB estimator comes at the price of larger standard errors than those produced by a Poisson (e.g., Hilbe, 2011).
According to Table 2, biofuel technology innovations are (partly) driven by increasing pilot and demonstration plant (PDP) investments.13 Specifically, increasing PDP investment based knowledge stocks explains some of the variations in biofuel innovation – regardless if the investments are broken down by PDP type (EXPSTOCK and EXEMSTOCK) or not(ALLSTOCK). The alternative measure of PDP activities, cumulative output capacity of exemplary plants (EXEMOUTCAP), is statistically insignificant – possibly due to few non-zero observations and thus low variation in the variable.14 S4 tests whether marginal increases in the experimental PDP knowledge stock (INTEREXPSTOCK) are more innovation-promoting when there is more than one such PDP in operation in a given country and year(ceteris paribus). The econometric results, however, do not support such a notion. Moreover, the foreign knowledge stock based on investments in experimental PDPs (FEXPSTOCK) is found to be important for biofuel patenting in a country. Concerning the coefficients for the control variables, all are statistically significant and positive across the specifications.Increasing biofuel blending targets (BLEND) seem to induce biofuel patents, which is also the case of higher diesel prices (PRICE).15 The overall propensity to patent (TOTPAT) also explains some of the variations in biofuel innovation.16 Finally, country-specific heterogeneity represented by country-specific dummy variables seems to explain patenting variations (see Table A2 in the Appendix).
13 PDP investments can possibly be endogenously determined meaning that biofuel patenting explains variations in PDP investment based knowledge stocks. The knowledge stocks are, however, lagged which limits this issue (biofuel patents in year t would have to explain changes in knowledge stocks in year t-1). 14 A third measure of PDP activities, counts of PDPs in operation in a given country and year, is tested in Table A3 in the Appendix. Although it can be questioned whether it is reasonable to assign the same weight to the different plants in the regressions, this approach is appealing due to its simplicity. The results in Table A3 suggest that an increasing number of PDPs in operation is positively correlated with biofuel innovation, regardless of whether counts of plants are disaggregated by plant type or not (in line with the results in Table 2). 15 By including BLEND in the specifications, an important demand-side determinant of biofuel innovation is controlled for. However, biofuel patenting is possibly responsive to growing markets in terms of increases inoverall motor fuel consumption as well. As a robustness check, S1 and S2 were expanded by including consumption of motor fuels, and two alternative measures were tested in each specification: annual consumption in kilotons, and percentage growth in fuel consumption. The associated coefficient was, however, statistically insignificant in all cases and the inclusion of the variable had negligible effects on the remaining parameter estimates. 16 Biofuel innovation is supposedly also affected by public R&D support. However, R&D expenditure data provided in official databases covered biofuels on an aggregate level by including not only transportation fuels but also solid biofuels for instance (used for heat or electricity production). Inclusion of this variable in the regressions is thus questionable. As a robustness check R&D expenditures were included in S1 and S3, but the associated coefficient was statistically insignificant and the inclusion of this variable had negligible effects on the remaining parameter estimates.

18
Table 2: Estimation Results from the Negative Binomial Models with Fixed Effects
S1 S2 S3 S4 S5a
Control variables
BLEND0.140**(0.015)E: 0.041
0.127**(0.022)E: 0.037
0.164***(0.001)E: 0.063
0.123**(0.034)E: 0.036
0.101*(0.065)E: 0.032
PRICE0.047***(0.000)E: 3.536
0.046***(0.000)E: 3.460
0.053***(0.000)E: 4.020
0.046***(0.000)E: 3.460
0.036***(0.000)E: 2.686
TOTPAT0.050**(0.011)E: 0.098
0.054***(0.002)E: 0.105
0.041**(0.040)E: 0.079
0.054***(0.002)E: 0.105
0.034**(0.038)E: 0.072
PDP variables
ALLSTOCK0.022***(0.000)E: 0.068
------ ------ ------ ------
EXPSTOCK ------0.020***(0.000)E: 0.058
------0.026***(0.001)E: 0.075
0.023***(0.000)E: 0.073
EXEMSTOCK ------0.063***(0.000)E: 0.013
------0.063***(0.000)E: 0.013
0.046(0.161)E: 0.010
EXEMOUTCAP ------ ------0.000(0.853)E: 0.004
------ ------
INTEREXPSTOCK ------ ------ -------0.010(0.311)E: -0.010
------
FEXPSTOCK ------ ------ ------ ------0.011***(0.000)E: 0.184
FEXEMSTOCK ------ ------ ------ -------0.024***(0.003)E: -0.048
Log-likelihood (NB) -421.761 -419.772 -456.926 -419.153 -387.928Log-likelihood (Poisson)
-484.956 -471.621 -519.230 -471.140 -399.235
(overdispersion parameter)
0.226(s.e. 0.082)
0.206(s.e. 0.073)
0.253(s.e. 0.075)
0.203(s.e. 0.236)
0.098(s.e. 0.189)
Wald x2 489.00 555.67 577.89 507.40 653.68p > x2 0.000 0.000 0.000 0.000 0.000N 240 240 251 240 219
Note: p-values in parentheses (based on bootstrapped standard errors stratified by country); * p < 0.10; ** p <0.05; *** p < 0.01. Stata automatically provides the log-likelihood of fitting a Poisson model (the statistic is necessary for the likelihood-ratio overdispersion test.a Due to missing information concerning the level of PDP investments in Austria, the country was dropped before estimation. The foreign knowledge stocks were constructed by adding national stocks across the sample countries and the inclusion of Austria in the analysis would thus underestimate the size of the foreign knowledge stocks (since Austria’s investment levels would implicitly be treated as equal to zero).

19
Although the coefficients provide useful information about the sign of the innovation impacts of the explanatory variables, the economic significance (i.e., size) of these impacts is difficult to interpret. Formally, the coefficients are expressed as the difference between the natural logarithms of expected counts (e.g., Hilbe, 2011).17 To examine the size of the impacts of the independent variables, elasticities are computed as = which is a measure of the elasticity of [ | ] with respect to (i.e., the jth regressor) (Cameron and Trivedi, 1998).The elasticities are presented in Table 2 (as ‘E: …’) and are interpreted as the percentage change in biofuel patenting following a one percentage change in a given explanatory variable.
The estimated elasticities suggest that all control variables are positively correlated with biofuel innovation activity, but also that their economic significance differs considerably. A one percent increase in biofuel blending targets or total patent applications (ceteris paribus) induces a 0.032-0.063 or 0.072-0.105 percent increase in biofuel patents (depending on the model specification), respectively. These impacts are not particularly strong compared to the innovation effect of increasing diesel prices. If the prices increase by one percent (ceteris paribus), patent counts increase by 2.686-4.020 percent.
The elasticities confirm an overall positive (lagged) innovation effect of PDP investmentsadding up to investment based knowledge stocks.18 The elasticity is positive and equal to0.068 in the S1 model where the knowledge stock is based on investments in both PDP types.When categorizing the investments as related to experimental or exemplary plants, as done in S2, the estimated elasticities are positive and equal to 0.058 and 0.013, respectively. Thus, the results suggest that experimental PDPs have been more innovation-promoting than exemplary plants. This finding is confirmed by S4 where the corresponding elasticities are equal to 0.075 for experimental PDPs and 0.013 for exemplary PDPs.
In S5 one of the foreign knowledge stocks is found to be positively correlated with biofuel innovation. The elasticity for the experimental PDP investment based knowledge stock is equal to 0.184, suggesting a 0.184 percent increase in biofuel patent applications in a given country following a one percent increase in the foreign experimental PDP based knowledge stock. Hence, development activities in experimental plants appear to induce technical
17 The coefficients are mathematically expressed as = log log , where corresponds to the estimated coefficient and to the expected count. The subscripts denote the observation at which an independent variable (x) is evaluated.18 The PDP investment based knowledge stocks are based on a one year time lag and a depreciation rate of 20 percent. Since these are uncertain parameters it is motivated to test how sensitive the results are with respect to different assumptions. Such a sensitivity analysis is provided for S1 and S2 in Table A4 in the Appendix, and the results seem to be overall robust with respect to different depreciation rates (15 and 30 percent) and time lags (two years). The knowledge stock coefficients are positive and significantly different from zero in all cases except when a two year lag is assumed. The changes concerning the remaining coefficients are overall minor. Finally, a sensitivity analysis was also conducted for S4 and S5, with minor changes in the results (this is not included in the Appendix). In S4 the coefficients for the PDP type specific knowledge stocks remain positive and statistically significant, while the effect of INTEREXPSTOCK remains statistically insignificant. In S5 the impacts of the knowledge stock variables keep the same sign and level of statistical significance, with one main exception being the positive coefficient for EXEMSTOCK which becomes statistically significant in one of the regressions.

20
innovation also indirectly through country-level knowledge spillovers. The results indicate a negative and statistically significant innovation effect of the other foreign knowledge stockbased on investments in exemplary plants. On the one hand this finding is unexpected given the focus of exemplary plants on commercialization and technology diffusion, activities which can be assumed to be positively correlated with knowledge spillovers and which can encourage innovation in turn. On the other hand, the spillovers may concern primarily how to create customer awareness instead of spreading technology learning as such. Still, this reasoning does not explain the negative innovation impact of the knowledge stock.
Finally, as an overall robustness check all models (S1-S5) were estimated when the scope of the dependent variable had been limited to counts of patent families covering production technology for 2nd generation biofuels (i.e., families exclusively covering technology for other biofuel generations were omitted). There were only minor changes in the size of the estimated coefficients and their signs were the same. Moreover, only small differences could be noted inthe statistical significance of the coefficients, and none of the coefficients for the PDP variables changed in this respect.
6.2 DiscussionThis section provides a discussion of the empirical results, and contrasts these to the findings of other studies. Overall the results suggest that renewable energy patents are influenced by general propensity to patent as well as variations in fossil fuel prices. These findings are in line with other work (e.g., Johnstone et al., 2010; Brolund and Lundmark, 2014; Jang and Du, 2013). Nevertheless, while this paper reports a statistically significant and positive innovation impact of demand-pull production support measured as biofuel blending targets, Karmarkar-Deshmukh and Pray (2009) along with Jang and Du (2013) cannot reject the null hypothesis that this impact is non-existent. A possible explanation for the different results is that policy stringency is measured as annual targets in this paper while Karmarkar-Deshmukh and Pray (2009) include a dummy variable set to unity for the years when biofuel blending obligations are in force. Jang and Du (2013), on the other hand, considers patents not only for biofuel conversion processes but also for technology used for feedstock production as well as for ethanol combustion in automotive engines. Finally, de Freitas and Kaneko (2012) examines the relation between ethanol innovation and market characteristics in Brazil, and their findings reveal the presence of a demand-pull effect between ethanol consumption and innovation, thus providing some support for the above finding in this paper.
The results indicate a positive biofuel innovation impact of total PDP investments as well as investments in experimental and exemplary PDPs, respectively. This finding is consistent with qualitative research suggesting that PDPs facilitate technology learning and that they hold an important role in the process of technological development (e.g., Karlström and Sandén, 2004; Kemp et al., 1998; Frishammar et al., 2015). Moreover, a positive correlation between innovation and exemplary PDP investments confirms that such plants focus not only on market creation and diffusion, but on technology development as well (as suggested in Hendry et al., 2010b). Still, the results suggest that experimental PDPs are more innovation-promoting than exemplary plants. Experimental PDPs focus primarily on technology testing

21
and optimization and have low visibility since creating customer awareness is of low priority. Exemplary PDPs, on the other hand, have high visibility and functions mainly to create markets by spreading information about an innovation to potential adopters. This indicatesthat technology development efforts have been more effective when conducted away from pressure of customers and provides quantitative support for this argument made by Hendry et al. (2010b). They argue that avoiding such pressure makes it easier to pursue enduring and iterative development efforts.
Nevertheless, it is important that protection of innovation does not come at the price of too weak competition from other technologies (Kemp et al., 1998). If protection is too generous, technology developers are not forced to handle negative side effects associated with applications of a new technology on a large scale. This also calls for policy makers to support PDP activities focusing on multiple technological trajectories (Hellsmark, 2010), and this is perhaps most important for achieving radical technology shifts (Harborne et al., 2007).Moreover, publicly funded PDP activities need to be complemented and followed up with market creation activities through market-pull support. Hellsmark and Jacobsson (2012) stress this issue when analyzing policy challenges in moving gasified biomass from the demonstration phase to large scale diffusion. Creating initial markets is critical for the evolution of new industries since they provide an income stream for investors and thus have a strong effect on further technology development.
Turning to the role of knowledge spillovers resulting from PDP activities, the findings presented in this paper indicate that innovation in a country is driven not only by domestic investments in experimental PDPs but also by similar investments in other countries. This is consistent with the argument made in Hendry et al. (2010b) and Lefevre (1984) that PDPsmay generate significant knowledge spillovers. However, Peters et al. (2012) find no empirical evidence suggesting that domestic R&D funding spur foreign innovation when examining how the innovation impacts of domestic and foreign policies differ in the case of solar PV. This is surprising as the literature on R&D spillovers supports the notion of a positive effect (e.g., Griliches, 1992).
While the results indicate the existence and importance of PDP induced country-level knowledge spillovers in Europe, there could be significant spillovers on a national and regional level as well (e.g., Jaffe et al., 1993). Still, while these positive externalities are beneficial to society, they constitute a mixed blessing since their existence is in conflict with the interests of commercial actors involved in PDP development efforts (e.g., Frishammar et al., 2015; Hendry et al., 2010a). The externalities benefit outside competitors who can imitate technology development efforts at a fraction of total costs, and this reduces the incentives for commercial actors to contribute to the learning processes in the first place (Mowery et al., 2010). This issue must be properly addressed when designing public support to PDP activities.

22
7. Conclusions and Avenues for Future Research
This paper examines the impacts of publicly funded pilot and demonstration plant (PDP)activities on innovation in biofuel production technology. The results seem robust to alternative model specifications and indicate that: (a) PDP activities are overall positively correlated with biofuel patenting activity; (b) both experimental and exemplary PDPsencourage biofuel innovation even though the impact of the former is more profound; and (c) development activities in experimental PDPs encourage innovation also indirectly through knowledge spillovers across countries.
Overall these results suggest that innovations are endogenously determined in the renewable energy technology field, and they provide quantitative support of the notion that PDPsfacilitate technology learning and hold an important role in the process of technology development. While the economics literature on policy-induced innovation stresses the importance of public R&D support and production support schemes, we must also acknowledge the role of PDPs in technical progress and address how public support to these activities can and should be properly designed.
There are a number of issues that deserve attention in future research. First, while this paper identifies important innovation impacts of publicly funded PDPs, greater understanding of how to properly design public support to these activities would be beneficial for policy making. Second, the kind of learning taking place in PDPs is dependent on the constellation of stakeholders involved (e.g., Harborne and Hendry, 2009), and this suggests that the magnitude of the innovation impacts of PDPs can be explained by the involvement of certain key actors, e.g., end users. This issue deserves more in-depth empirical research. Third, and finally, while the findings in this paper indicate the importance of PDPs for biofuel innovation, their innovation impacts may be less pronounced in the case of more mature technologies such as solar PV as well as over time as less-developed technologies mature. A greater understanding of such differential impacts across various technologies is important information for policy making.
References
Allison, P., and R. Waterman (2002). Fixed-Effects Negative Binomial Regression Models. Sociological Methodology, vol. 32, pp. 247-265.
Bacovsky, D., L. Ludwiczek, M. Ognissanto, and M. Wörgetter (2013). Status of Advanced Biofuels Demonstration Facilities in 2012. A Report to IEA Bioenergy Task 39, No. T39-P1b, Bioenergy2020+, Graz.
Baer, W., L. Johnson, and E. Merrow (1976). Analysis of federally funded demonstration projects: Final report. Rand Corporation, Santa Monica.
Biofuels Digest (2014). SuperData Global Biofuels Plant list. Ascension Publishing, Miami.BIOMAP (2014). Time-enabled Mapping and Dissemination Tool for Biofuel Projects.
European Commission, Brussels.

23
Brolund, J., and R. Lundmark (2014). Bioenergy Innovations and Their Determinants: A Negative Binominal Count Data Analysis. Drewno, vol. 57, pp. 41-61.
Brunnermeier, S. and A. Cohen. (2003). Determinants of environmental innovation in US manufacturing industries. Journal of Environmental Economics and Management, vol. 45, issue 2, pp. 278-293.
Bäckström, K., R. Lundmark, and P. Söderholm (2014). Public Policies and Solar PV Innovation: An Empirical Study Based on Patent Data. Paper presented at the IAEE International Conference: Energy & the Economy, New York, June 15-18.
Cameron, A., and P. Trivedi (1998). Regression Analysis of Count Data. Cambridge University Press, New York.
Carlsson, B., and R. Stankiewicz (1991). On the nature, function and composition of technological systems. Journal of Evolutionary Economics, vol. 1, pp. 93-118.
Carriquiry, M., X. Du, and G. Timilsina (2011). Second generation biofuels: Economics and policies. Energy Policy, vol. 39, pp. 4222-4234.
Costantini, V., F. Crespi, and Y. Curci (2012). Exploring technology in the biofuels sector through patent data: the BioPat database. Working Paper no. 154, 2012, Roma Tre University, Rome.
De Freitas, L., and S. Kaneko (2012). Is there a causal relation between ethanol innovation and the market characteristics of fuels in Brazil? Ecological Economics, vol. 74, pp. 161-168.
Dernis H., D. Guellec, and B. van Pottelsberghe (2001). Using Patent Counts for Cross-country Comparisons of Technology Output. STI Review No. 27, OECD, Paris.
Dernis H., and M. Kahn (2004). Triadic Patent Families Methodology. STI Working Paper 2004/2, OECD, Paris.
Frietsch, R., and U. Schmoch (2010). Transnational patents and international markets. Scientometrics, vol. 82, pp. 185-200.
Frishammar, J., P. Söderholm, K. Bäckström, H. Hellsmark, and H. Ylinenpää (2015). The role of pilot and demonstration plants in technological development: synthesis and directions for future research. Technology Analysis & Strategic Management, vol. 27, pp. 1-18.
Gillingham, K., R. Newell, and W. Pizer (2008). Modeling Endogenous Technological Change for Climate Policy Analysis. Energy Economics, vol. 30, pp. 2734-2753.
Gould, W., J. Pitblado, and W. Sribney (2006). Maximum Likelihood Estimation with Stata (3rd edition). Stata Press, College Station.
Grafström, J. (2014). International knowledge spillovers in the wind power industry –Evidence from Europe. Paper presented at the IAEE International Conference: Energy & the Economy, New York, June 15-18.
Greene, W. (2008). Functional forms for the negative binomial model for count data. Economic Letters, vol. 99, pp. 585-590.
Griliches, Z. (1992). The Search for R&D Spillovers. NBER Working Paper Series No. 3768, National Bureau of Economic Research, Cambridge.
Griliches, Z. (1995). R&D and Productivity: Econometric Results and Measurement Issues. In P. Stoneman (Ed.), Handbook of Economics on Innovation and Technological Change,Blackwell, Oxford.

24
Grubb, M., J. Köhler, and D. Anderson (2002). Induced Technical Change in Energy and Environmental Modelling: Analytical Approaches and Policy Implications. Annual Review of Energy and the Environment, vol. 27, pp. 271-308.
Guimarães, P. (2008). The Fixed Effects Negative Binomial Model Revisited. Economics Letters, vol. 99, pp. 63-66.
Harborne, P., C. Hendry, and J. Brown (2007). The development and diffusion of radical technological innovation: The role of bus demonstration projects in commercializing fuel cell technology. Technology Analysis & Strategic Management, vol. 19, pp. 167-187.
Harborne, P., and C. Hendry (2009). Pathways to commercial wind power in the US, Europe and Japan: The role of demonstration projects and field trials in the innovation process. Energy Policy, vol. 37, pp. 3580-3595.
Haszeldine, R. (2009). Carbon Capture and Storage: How Green Can Black Be? Science, vol. 325, pp. 1647-1652.
Hellsmark, H. (2010). Unfolding of the formative phase of gasified biomass in the European Union: The role of system builders in realising the potential of second-generation transportation fuels from biomass. PhD diss., Chalmers University of Technology, Gothenburg.
Hellsmark, H., and S. Jacobsson (2012). Realising the potential of gasified biomass in the European Union – Policy challenges in moving from demonstration plants to a larger scale diffusion. Energy Policy, vol. 41, pp. 507-518.
Hendry, C., P. Harborne, and J. Brown (2010a). So what do innovating companies really get from publicly funded demonstration projects and trials? Innovation lessons from solar photovoltaics and wind. Energy Policy, vol. 38, pp. 4507-4519.
Hendry, C., P. Harborne, and J. Brown (2010b). The Uncertain Middle: Innovation lessons for low carbon energy technology from demonstration projects and trials. Advanced Institute of Management Research (AIM), London.
Hilbe, J. (2011). Negative Binomial Regression. Cambridge University Press, New York.International Energy Agency (IEA) (2004). Renewable Energy – Market and Policy Trends in
IEA Countries. OECD, Paris.International Energy Agency (IEA) (2008). IEA Energy Policy Review – The European
Union. OECD, Paris. International Energy Agency (IEA) (2011). Technology Roadmap – Biofuels for Transport.
OECD, Paris. International Energy Agency (IEA) (2014a). OECD - Renewables supply and consumption.
OECD, Paris. International Energy Agency (IEA) (2014b). Status of 2nd Generation Biofuels Demonstration
Facilities. IEA Bioenergy Task 39, Paris. International Energy Agency (IEA) (2014c). Policies and Measures Databases. OECD, Paris.International Energy Agency (IEA) (2014d). Energy Prices and Taxes Statistics. OECD,
Paris. Jang, H., and X. Du (2013). Price- and Policy-Induced Innovations: The Case of U.S. Biofuel.
Journal of Agricultural and Resource Economics, vol. 38, pp. 299-311.Jaffe, A. (1988). Demand and Supply Influences in R&D Intensity and Productivity Growth.
Review of Economics and Statistics, vol. 70, pp. 431-437.

25
Jaffe, A., R. Newell, and R. Stavins (2002). Environmental Policy and Technological Change. Environmental and Resource Economics, vol. 22, pp. 41-69.
Jaffe, A., M. Trajtenberg, and R. Henderson (1993). Geographic Localization of KnowledgeSpillovers as Evidenced by Patent Citations. Quarterly Journal of Economics, vol. 108, pp. 577-598.
Jaumotte, F., and N. Pain (2005). From Ideas to Development: The Determinants of R&D and Patenting. OECD Economics Department Working Paper No. 457, OECD, Paris.
Innovation: Evidence Based on Patent Counts. Environmental and Resource Economics,vol. 45, pp. 133-155.
Karlström, M., and B. Sandén (2004). Selecting and assessing demonstration projects for technology assessment: The case of fuel cells and hydrogen systems in Sweden. Innovation: Management, Policy & Practice, vol. 6, pp. 286-93.
Karmarkar-Deshmukh, R., and C. Pray (2009). Private Sector Innovation in Biofuels in the United States: Induced by Prices or Policies? AgBioForum, vol. 12, pp. 141-148.
Kemp, R., J. Schot, and R. Hoogma (1998). Regime shifts to sustainability through processes of niche formation: The approach of strategic niche management. Technology Analysis & Strategic Management, vol. 10, pp. 175-195.
Kingston, W. (2000). Antibiotics, invention and innovation. Research Policy, vol. 29, pp. 679-710.
Klaassen, G., A. Miketa, K. Larsen, and T. Sundqvist (2005). The Impact of R&D on Innovation for Wind Energy in Denmark, Germany and the United Kingdom. Ecological Economics, vol. 54, pp. 227-240.
Kline, S., and N. Rosenberg (1986). An overview of innovation. In The positive sum strategy: Harnessing technology for economic growth, ed. R. Landau and N. Rosenberg, pp. 275-305.Washington, DC: National Academy Press.
Klitkou, A., L. Coenen, P. Dannemand Andersen, A. Fevolden, and T. Hansen (2013). Role of demonstration projects in innovation: Transition to sustainable energy and transport.Paper presented at the 4th International Conference on Sustainability Transitions, Zürich, June 18-21.
Kojima, M., D. Mitchell, and W. Ward (2007). Considering Trade Policies for Liquid Biofuels. The World Bank, Washington DC.
Lanjouw, J. and A. Mody. (1996). Innovation and the international diffusion of environmentally responsive technology. Research Policy, vol. 25, issue 4, pp. 549-571.
Lefevre, S. (1984). Using Demonstration Projects to Advance Innovation in Energy. Public Administration Review, vol. 44, pp. 483-490.
Lundmark, R., and K. Bäckström (2015). Bioenergy innovation and energy policy. Economics of Innovation and New Technology, article in press.
Löschel, A. (2002). Technological Change in Economic Models of Environmental Policy: A Survey. Ecological Economics, vol. 43, pp. 105-126.
Macey, S., and M. Brown (1990). Demonstrations as a Policy Instrument With Energy Technology Examples. Science Communication, vol. 11, pp. 219-36.
Maddala, G. (1983). Limited-Dependent and Qualitative Variables in Econometrics.Cambridge University Press, Cambridge.

26
Magill, K., and E. Rogers (1981). Federally Sponsored Demonstrations of Technological Innovations. Knowledge: Creation, Diffusion, Utilization, vol. pp. 23-42.
Martinez, C. (2010). Insight Into Different Types of Patent Families. STI Working Paper 2010/2, CSIC – Institute of Public Goods and Policies, Madrid.
Mitchell, D. (2008). A Note on Rising Food Prices. Policy Research Working Paper No. 4682, The World Bank, Washington, DC.
Mowery, D., R. Nelson, and B. Martin (2010). Technology policy and global warming: Why new policy models are needed (or why putting new wine in old bottles won’t work). Research Policy, vol. 39, pp. 1011-1023
Myers, S. (1978). The Demonstration project as a procedure for accelerating the application of new technology. United States Department of Energy, Washington, DC.
Noailly, J., and S. Batrakova (2010). Stimulating Energy-efficient Innovations in the Dutch Building Sector: Empirical Evidence from Patent Counts and Policy lessons. Energy Policy, vol. 38, pp. 7803-7817.
Organization for Economic Cooperation and Development (OECD) (2009). OECD Patent Statistics Manual. OECD Publishing, Paris.
Organization for Economic Cooperation and Development (OECD) (2014). Patents by Main Technology and by International Patent Classification (IPC). OECD Patent Database, Paris.
Organization for Economic Cooperation and Development (OECD)/International Energy Agency (IEA) (2008). Energy Technology Perspectives: Scenarios and Strategies to 2050.OECD, Paris.
Pelkmans, L., L. Govaerts, and K. Kessels (2008). Inventory of biofuel policy measures and their impact on the market. Report D2.1 of ELOBIO subtasks 2.1-2.2, Intelligent Energy Europe, Brussels.
Peters, M., M. Schneider, T. Griesshaber, and V. Hoffmann (2012). The impact of technology-push and demand-pull policies on technical change – Does the locus of policies matter? Research Policy, vol. 41, pp. 1296-1308.
Popp, D. (2002). Induced Innovation and Energy Prices. The American Economic Review,vol. 92, pp. 160-180.
Rosenberg, N. (1982). Inside the Black Box. Cambridge University Press, Cambridge. Rübbelke, D., and P. Weiss (2011). Environmental Regulations, Market Structure and
Technological Progress in Renewable Energy Technology – A Panel Data Study on Wind Turbines. FEEM Working Paper No. 581.2011, Fondazione Eni Enrico Mattei (FEEM),Milan.
Sagar, A., and B. van der Zwaan (2006). Technological innovation in the energy sector: R&D, deployment, and learning-by-doing. Energy Policy, vol. 34, pp. 2601-2608.
Schankerman, M. (1998). How Valuable is Patent Protection? Estimates by Technology Field. RAND Journal of Economics, vol. 29, pp. 77-107.
Scharlemann, J., and W. Laurance (2008). How Green Are Biofuels? Science, vol. 319, pp. 43-44.
Schmoch, U. (1997). Indicators and the relations between science and technology. Scientometrics, vol. 38, pp. 103-116.

27
Schmookler, J. (1966). Invention and Economic Growth. Harvard University Press, Cambridge.
Schumpeter, J. 1934. The theory of economic development. Cambridge, MA: Harvard University Press.
Searchinger, T., R. Heimlich, R. Houghton, F. Dong, A. Elobeid, J. Fabiosa, S. Tokgoz, D. Hayes, and T. Yu (2008). Use of U.S. croplands for biofuels increases greenhouse gases through emissions from land use change. Science, vol. 319, pp. 1157-1268.
Sue Wing, I. (2006). Representing Induced Technological Change in Models for Climate Policy Analysis. Energy Economics, vol. 28, pp. 539-562.
Söderholm, P., and G. Klaassen (2007). Wind Power in Europe: A Simultaneous Innovation-Diffusion Model. Environmental and Resource Economics, vol. 36, pp. 163-190.
Thomson Reuters (2014a). Phone and e-mail communication with personnel working with IP Consulting and Services.
Thomson Reuters (2014b). Derwent World Patents Index (DWPI) database. IP Consulting and Services, New York.
Timilsina, G., J. Beghin, S. Mevel, and D. van der Mensbrugghe (2010). The Impacts of Biofuel Targets on Land-Use Change and Food Supply: A Global CGE Assessment. Policy Research Working Paper No. 5513, the World Bank, Washington, DC.
United Nations Environment Program (UNEP) (2009). Towards sustainable production and use of resources: Assessing biofuels. UNEP Division of Technology, Industry and Economics (DTIE), Paris.
Verdolini, E., and M. Galeotti (2011). At Home and Abroad: An Empirical Analysis of Innovation and Diffusion in Energy Technologies. Journal of Environmental Economics and Management, vol. 61, pp. 119-134.

28
App
endi
x
Tab
le A
1:Pu
blic
ly F
unde
d Pi
lot a
nd D
emon
stra
tion
Plan
tsPr
oduc
ing
Adv
ance
d B
iofu
els (
1980
-201
2)
Plan
tL
ocat
ion
Ope
rato
rO
pera
ting
peri
oda
Typ
eb
Plan
t in
vest
men
tc
(EU
R, 2
010
pric
es)
Con
vers
ion
proc
ess
Prod
uct
Feed
stoc
kG
ener
atio
nO
utpu
t ca
paci
ty
(t/y
)
Expe
rim
enta
lPD
Ps
SNG
de
mo
Güs
sing
, A
ustri
a
Con
zept
e Te
chni
k U
mw
elt A
G (2
009)
; B
iom
asse
kraf
twer
k G
üssi
ng (2
010-
2012
)
2009
-D
emo
N/A
Ther
moc
hem
ical
Synt
hetic
na
tura
l gas
(S
NG
)
Lign
ocel
lulo
-sic
s; sy
ngas
fr
om g
asifi
er2G
576
(SN
G)
Bor
nBio
Fuel
1B
alle
rup,
D
enm
ark
Bio
Gas
ol20
09-2
010
Pilo
t8
430
000
Bio
chem
ical
Etha
nol
Cor
n fib
er;
corn
stov
er;
gras
ses;
ga
rden
w
aste
; stra
w
1G; 2
G28
(eth
anol
)
Bor
nBio
Fuel
sO
ptim
iz-
atio
n
Bor
nhol
m,
Den
mar
kB
ioG
asol
2009
-Pi
lot
162
0 00
0B
ioch
emic
alEt
hano
l; bi
ogas
Whe
at
stra
w;
cock
sfoo
t gr
ass
2G11
(eth
anol
)
Max
ifuel
Cop
enha
gen,
D
enm
ark
Bio
Gas
ol20
07-2
008
Pilo
t85
0 00
0B
ioch
emic
alEt
hano
l; bi
ogas
; lig
nin
Lign
ocel
lulo
-sic
s; w
heat
st
raw
; cor
n fib
er
1G; 2
G28
(eth
anol
)
Pilo
t 1Fr
eder
icia
, D
enm
ark
Elsa
m (2
003-
2005
); In
bico
n (D
ON
G
Ener
gy) (
2006
-20
12)
2003
-Pi
lot
5 72
0 00
0B
ioch
emic
al
Etha
nol;
c5
mol
asse
s;
ligni
n bi
o-pe
llets
Lign
ocel
lulo
-sic
s; st
raw
2GN
/A
aW
hen
no e
nd y
ear i
s pr
ovid
ed, a
giv
en p
lant
has
bee
n in
ope
ratio
n up
to (a
nd in
) 201
2. W
heth
er a
plan
t has
bee
n in
ope
ratio
n af
ter 2
012
is u
nkno
wn
give
n th
e tim
e pe
riod
cons
ider
ed w
hen
colle
ctin
g th
e da
ta(1
980-
2012
). bC
lass
ifica
tion
is g
uide
d by
def
initi
ons p
rovi
ded
in IE
A (2
014b
). c Fi
gure
s ref
lect
bot
h pu
blic
and
priv
ate
inve
stm
ents
.

29
Tab
le A
1:Pu
blic
ly F
unde
d Pi
lot a
nd D
emon
stra
tion
Plan
tsPr
oduc
ing
Adv
ance
d B
iofu
els (
1980
-201
2) (c
ontin
ued)
Plan
tL
ocat
ion
Ope
rato
rO
pera
ting
peri
odT
ype
Plan
t in
vest
men
t (E
UR
, 201
0 pr
ices
)
Con
vers
ion
proc
ess
Prod
uct
Feed
stoc
kG
ener
atio
nO
utpu
t ca
paci
ty
(t/y
)
Expe
rim
enta
l PD
Ps
Pilo
t 2Fr
eder
icia
, D
enm
ark
Elsa
m (2
005)
; In
bico
n (D
ON
G
Ener
gy) (
2006
-20
12)
2005
-Pi
lot
1697
0 00
0B
ioch
emic
al
Etha
nol;
c5
mol
asse
s;
ligni
n bi
o-pe
llets
Mai
ze
sila
ge; s
ugar
ca
ne
baga
sse;
w
heat
stra
w;
woo
d ya
rd
was
te;
mun
icip
al
solid
was
te
2GSe
vera
l ton
s pe
r hou
r
Dem
oK
alun
dbor
g,
Den
mar
kIn
bico
n (D
ON
G
Ener
gy)
2009
-D
emo
5104
0 00
0B
ioch
emic
al
Etha
nol;
c5
mol
asse
s;
ligni
n bi
o-pe
llets
Lign
ocel
lulo
-sic
s; w
heat
st
raw
2G4
300
(eth
anol
)
Futu
rol
Proj
ect
Pom
acle
, Fr
ance
Proc
etho
l 2G
2011
-Pi
lot
2947
0 00
0B
ioch
emic
alEt
hano
l
Woo
d w
aste
s;ag
ricul
tura
l an
d fo
rest
re
sidu
es;
ener
gy c
rops
2G2
700
(eth
anol
)
STS-
plan
tO
berh
ause
n,
Ger
man
y
Frau
nhof
er
UM
SIC
HT
(201
1);
Gre
asol
ine
(201
2)20
11-
Pilo
t3
030
000
Ther
moc
hem
ical
Die
sel-t
ype
hydr
ocar
bon
(i.e.
, hy
drot
reat
ed
vege
tabl
e oi
l (H
VO
))
Was
te fa
ts;
ener
gy c
rop
oil;
alga
e oi
l; fa
tty a
cids
; gr
ease
trap
cont
ents
; re
sidu
es o
f pl
ant o
il pr
oces
sing
2G; 3
G
2 (d
iese
l-ty
pe
hydr
ocar
bo-
n)
Hoh
enhe
-im P
ilot
Stut
tgar
t, G
erm
any
Uni
vers
ity o
f H
ohen
heim
; B
utal
co20
10-
Pilo
t1
220
000
Bio
chem
ical
Etha
nol
Gra
ss; c
orn
stov
er;
star
ch1G
; 2G
N/A

30
Tab
le A
1:Pu
blic
ly F
unde
d Pi
lot a
nd D
emon
stra
tion
Plan
tsPr
oduc
ing
Adv
ance
d B
iofu
els (
1980
-201
2) (c
ontin
ued)
Plan
tL
ocat
ion
Ope
rato
rO
pera
ting
peri
odT
ype
Plan
tin
vest
men
t (E
UR
, 201
0 pr
ices
)
Con
vers
ion
proc
ess
Prod
uct
Feed
stoc
kG
ener
atio
nO
utpu
t ca
paci
ty
(t/y
)
Expe
rim
enta
lPD
Ps
Dem
oB
abila
fuen
te, S
pain
Abe
ngoa
Bio
ener
gy20
09-
Dem
o56
180
000
Bio
chem
ical
Etha
nol
Cer
eal s
traw
(m
ostly
ba
rley
and
whe
at)
2G4
000
(eth
anol
)
Bio
DM
EPi
teå,
Sw
eden
Che
mre
c20
11-
Pilo
t23
920
000
Ther
moc
hem
ical
Di-M
ethy
l-Et
her (
DM
E)
Fore
st
resi
dues
th
roug
h bl
ack
liquo
r ga
sific
atio
n
2G1
800
(DM
E)
Bio
refin
-er
y D
emo
Plan
t*
Örn
sköl
dsvi
-k,
Sw
eden
SEK
AB
E-
tech
nolo
gy20
04-
Pilo
t28
860
000
Bio
chem
ical
Etha
nol
Woo
d ch
ips;
su
garc
ane
baga
sse;
w
heat
; cor
n st
over
; en
ergy
gra
ss
1G; 2
G12
0(e
than
ol)
Exem
plar
yPD
Ps
Bio
Bas
e Eu
rope
Pi
lot
Plan
t
Ghe
nt,
Bel
gium
Bio
Bas
e Eu
rope
2010
-C
om-
mer
ci-
al13
280
000
Bio
chem
ical
Etha
nol;
fine
chem
ical
s;
neut
race
utic
als
; foo
d in
gred
ient
s;
biop
last
ics;
in
dust
rial
enzy
mes
Whe
at
stra
w;
corn
cobs
; w
ood
chip
s;Ja
troph
a;al
gae
2G; 3
GK
g to
mul
ti-to
n sc
ale
Che
mpo
l-is
B
iore
fini
-ng
Plan
t
Oul
u,
Finl
and
Che
mpo
lis20
10-
Dem
o20
240
000
Bio
chem
ical
Etha
nol;
bioc
hem
ical
s;
pulp
and
pap
er
fiber
s
Stra
w; r
eed;
ba
gass
e;
corn
stal
ks;
woo
d re
sidu
es;
pape
r was
te
2G5
000
(eth
anol
)
*C
ateg
oriz
ed a
s an
expe
rimen
tal P
DP
in 2
004-
2009
, afte
r thi
s per
iod
itis
vie
wed
as a
n ex
empl
ary
PDP.

31
Table A2: Estimated Coefficients for the Country-specific Dummy Variables
Country dummies S1 S2 S3 S4 S5
DAUSTRIA-2.843***(0.000)
-2.805***(0.000)
-2.147***(0.000)
-2.802*(0.052)
------
DBELGIUM-1.885***(0.000)
-1.890***(0.000)
-2.017***(0.000)
-1.887***(0.000)
-2.157***(0.000)
DDENMARK-0.967***(0.002)
-0.893***(0.001)
-0.742**(0.014)
-0.811***(0.003)
-0.952***(0.000)
DFINLAND-1.027***(0.003)
-1.058***(0.001)
-1.253***(0.000)
-1.052***(0.001)
-1.226***(0.000)
DFRANCE-0.407*(0.075)
-0.360(0.134)
-0.498**(0.032)
-0.362(0.114)
-0.452**(0.019)
DSPAIN-1.796***(0.000)
-1.697***(0.000)
-1.557***(0.000)
-1.799***(0.000)
-1.753***(0.000)
DSWEDEN-0.864***(0.001)
-0.870***(0.001)
-0.701**(0.020)
-0.933***(0.001)
-1.036***(0.000)
Note: p-values in parentheses (based on bootstrapped standard errors stratified by country); * p < 0.10; ** p <0.05; *** p < 0.01.
Table A3: Estimation Results Based on Counts of Pilot and Demonstration Plants in OperationS6 S7
Control variables
BLEND 0.173***(0.000)
0.166***(0.000)
PRICE 0.050***(0.000)
0.048***(0.000)
TOTPAT 0.044**(0.031)
0.048**(0.025)
PDP variables
CTALL 0.201**(0.030)
------
CTEXP ------ 0.185**(0.049)
CTEXEM ------ 0.770***(0.002)
Log-likelihood (NB) -456.589 -455.113Log-likelihood (Poisson) -532.670 -518.739
(overdispersion parameter) 0.266(s.e. 0.068)
0.246(s.e. 0.065)
Wald x2 490.73 481.55p > x2 0.000 0.000N 251 251
Note: p-values in parentheses (based on bootstrapped standard errors stratified by country, 200 replications); * p< 0.10; ** p < 0.05; *** p < 0.01.
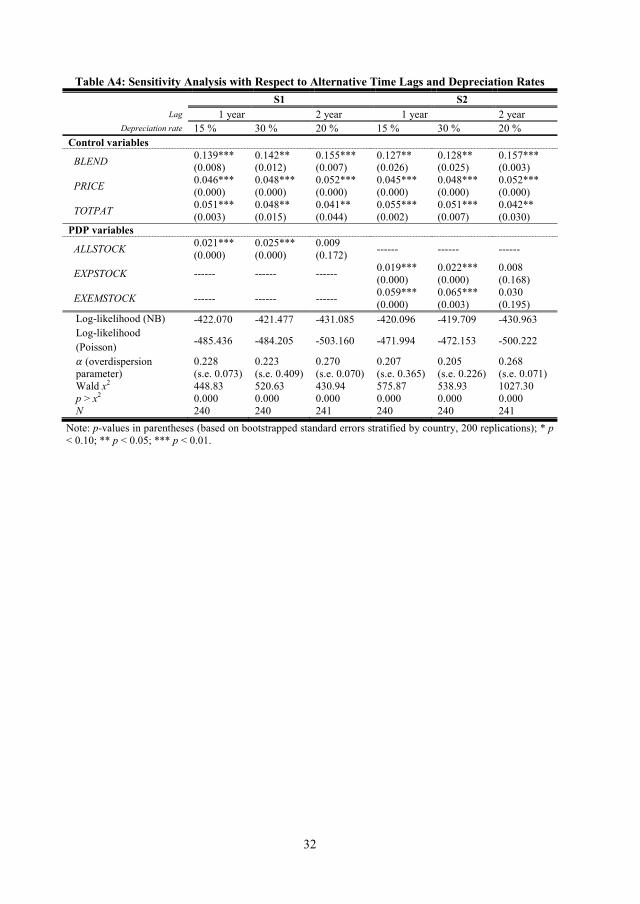
32
Table A4: Sensitivity Analysis with Respect to Alternative Time Lags and Depreciation RatesS1 S2
Lag 1 year 2 year 1 year 2 yearDepreciation rate 15 % 30 % 20 % 15 % 30 % 20 %
Control variables
BLEND 0.139***(0.008)
0.142**(0.012)
0.155***(0.007)
0.127**(0.026)
0.128**(0.025)
0.157***(0.003)
PRICE 0.046***(0.000)
0.048***(0.000)
0.052***(0.000)
0.045***(0.000)
0.048***(0.000)
0.052***(0.000)
TOTPAT 0.051***(0.003)
0.048**(0.015)
0.041**(0.044)
0.055***(0.002)
0.051***(0.007)
0.042**(0.030)
PDP variables
ALLSTOCK 0.021***(0.000)
0.025***(0.000)
0.009(0.172) ------ ------ ------
EXPSTOCK ------ ------ ------ 0.019***(0.000)
0.022***(0.000)
0.008(0.168)
EXEMSTOCK ------ ------ ------ 0.059***(0.000)
0.065***(0.003)
0.030(0.195)
Log-likelihood (NB) -422.070 -421.477 -431.085 -420.096 -419.709 -430.963Log-likelihood (Poisson) -485.436 -484.205 -503.160 -471.994 -472.153 -500.222
(overdispersion parameter)
0.228(s.e. 0.073)
0.223(s.e. 0.409)
0.270(s.e. 0.070)
0.207(s.e. 0.365)
0.205(s.e. 0.226)
0.268(s.e. 0.071)
Wald x2 448.83 520.63 430.94 575.87 538.93 1027.30p > x2 0.000 0.000 0.000 0.000 0.000 0.000N 240 240 241 240 240 241
Note: p-values in parentheses (based on bootstrapped standard errors stratified by country, 200 replications); * p< 0.10; ** p < 0.05; *** p < 0.01.

