the role of public investment in poverty reduction: theories
TRANSCRIPT

Working Paper 263
The Role of Public Investment in Poverty Reduction:
Theories, Evidence and Methods
Edward Anderson, Paolo de Renzio and Stephanie Levy
March 2006
Overseas Development Institute 111 Westminster Bridge Road
London SE1 7JD UK

ISBN 0 85003 796 4 © Overseas Development Institute 2006 All rights reserved. No part of this publication may be reproduced, stored in a retrieval system, or transmitted in any form or by any means, electronic, mechanical, photocopying, recording or otherwise, without the prior written permission of the publishers.

iii
Table of Contents Acronyms iv Acknowledgements iv Summary v 1 Introduction 1
1.1 Background 1 1.2 Objective 2 1.3 Definitions 2 1.4 Summary of paper 4
2 The poverty impact of public investment: theory 5
2.1 Macro-economic effects 5 2.2 Micro-economic effects 10
3 The poverty impact of public investment: evidence 14
3.1 Effects of public investment on economic growth 14 3.2 Effects of public capital on productivity 15 3.3 Effects of public investment on poverty and inequality 16 3.4 Effects of public capital on poverty and inequality 16 3.5 Summary 17
4 The poverty impact of public investment: methods 18
4.1 Project appraisal 18 4.2 Inter-sectoral allocation 21
5 Lessons and challenges for policy making 26
5.1 Lessons from the review of the literature 26 5.2 Applicability in real-world policy processes 27 5.3 Directions for future research 29
References 31
iv
Acronyms CBA Cost-benefit analysis CGE Computable General Equilibrium CV Compensating variation EV Equivalent variation FGT Foster-Greer-Thorbecke equation GDP Gross Domestic Product HIPC Heavily Indebted Poor Countries ICP UN International Comparison Project IMF International Monetary Fund MDG Millennium Development Goal MTEF Medium Term Expenditure Framework PEM Public Expenditure Management PER Public Expenditure Review PIP Public Investment Programme PPA Participatory Poverty Assessment PRGF Poverty Reduction Growth Facility PRSC Poverty Reduction Support Credit PRSP Poverty Reduction Strategy Paper PSIA Poverty and Social Impact Assessment R&D Research & Development UNDP United Nations Development Programme
Acknowledgements The authors would like to gratefully acknowledge the Public Resource Management Team in the Bureau for Development Policy at UNDP for their financial support for this research. Comments received from peer reviewers, John Roberts and the participants of two workshops held in London on 13 March and New York on 24 May 2005, were of great value. The responsibility for the content and conclusions of this paper remain with the authors. This paper is dedicated to the memory of John Roberts.

v
Summary This paper explores the linkages between public investment, growth and poverty reduction, with the aim of providing an overall view of existing theories, evidence and methods, and of examining ways to provide better guidance to policy-makers in the use of available techniques and information to set priorities for public investment. This is particularly important at present, as we are once again witnessing pressure for substantial increases in public investment in developing countries, because of the slow rates of progress toward the targets contained in the Millennium Development Goals, especially in sub-Saharan African countries. There are several channels through which public investment might affect the economy. We review the theory behind these channels, distinguishing the macro from the micro effects. At a macro level, we discuss the potential impact of public investment on growth, investment and aggregate productivity. We then explore the possible micro-economic effects of public investment, which include a more sectoral approach, at the level of the firm, but also an analysis of household income, poverty and income distribution. We explain the need for a general equilibrium framework to capture the extent to which all these effects might appear and combine. Existing evidence on the poverty impact of public investment is hardly conclusive, but points to a number of interesting issues. The link between public investment and growth is not proven. Although there is more evidence that public capital is productive, in the sense that it complements private capital and other factors of production, there is a clear need to be careful with the choice of the optimal investment level and allocation across sectors. The case for a rise in public investment needs to be assessed on a country-by-country basis, according to the structure of its economy and its initial physical public capital stock. There is also abundant evidence, although sometimes controversial, on the poverty impact of public investments in areas such as transport and communications, irrigation and agricultural research and development (R&D). Methods for assessing ex-ante the impact of public investment on poverty reduction, and therefore guiding policy decisions, also need to be divided in two categories: those aimed at appraising a specific investment project, and those guiding inter-sectoral allocation decisions. From a technical viewpoint, cost-benefit analysis remains the ideal method of determining the desirability of most types of public investment in any given country. However, resource and informational constraints mean that full cost-benefit analysis cannot always be carried out. Researchers need to continue developing, refining and disseminating less information-intensive alternatives. Such approaches should come with an assessment of the likely magnitudes of error to which they may be subject. For some types of investment cost-benefit analysis is not appropriate. This includes all those investments that provide outputs deemed by society to be basic human needs or rights. In such cases, the benefits of investment are self-evident and do not need to be measured in financial terms. The only relevant consideration in this case is choosing the least-cost method of meeting a given need or right. When inter-sectoral comparisons are necessary, as in the case of assessing alternative investment portfolios, computable general equilibrium (CGE) models can be particularly helpful. These allow for quantitative macroeconomic analysis of a large variety of public investment policies. Government spending can also be decomposed in a way that allows comparisons of different policy choices. The abundance of existing theories, evidence and methods on the poverty impact of public investment, however, clashes with the reality of policy-making processes in poor countries, which are often characterised by limited technical capacity, unavailability of detailed and reliable data, heavy reliance on external assistance, and political interference which undermines a rational approach to assessing policy alternatives.

vi
There are four main messages that can be drawn from the overview contained in this paper. Firstly, there is a need to expand current efforts at developing alternative methodologies which are less information-intensive and which require lower technical capacity but can still generate useful insights and inputs for policy-making processes. Secondly, access to existing data and information at country level should be improved, by supporting the creation of repositories of policy-relevant datasets, such as cost-benefit analyses (CBAs) carried out for past investment projects. This should include the design and production of easy-to-access notes and documents to be utilised by policy-makers to inform decisions regarding public investment options, highlighting the existing state of knowledge within the country and selected findings from comparable country situations. Thirdly, the use of CGE models should be widened to cover issues such as (a) trade-offs and complementarities (inter-sectoral, inter-temporal, inter-regional, etc.) among different investment portfolios; (b) ‘threshold effects’ that could affect the effectiveness of different investment choices; and (c) cross-country implications of public investment at the regional level. Finally, there needs to be a better understanding of the dynamics of policy-making processes in poor countries, to make sure that information and methodologies are better suited to providing relevant inputs to policy-makers, and enhancing the poverty orientation of public investment choices.

1
1 Introduction
1.1 Background The UN Millennium Project (2005) has re-emphasised the need for a ‘big push’ strategy in public investment to help poor countries break out of their poverty trap and meet the MDG challenge. The report argues that, to enable all countries to achieve the MDGs, there should be identification of priority public investments to empower poor people, and these should be built into MDG-based strategies that anchor the scaling-up of public investments, capacity-building, resource mobilisation, and official development assistance. Seven main investment-and-policy clusters are identified in the areas of rural development; urban development; health systems; education; gender equality; environment; and science, technology and innovation. Dramatic increases in external aid flows, to the tune of 0.54% of rich countries’ gross domestic product (GDP) by 2015, are seen as the inevitable source of the necessary finance, given the lack of domestic resources in many countries. This ‘big push’ strategy is designed to set low-income economies on a growth path that will become self-sustainable, as core investments in infrastructure and human capital will enable poor people to join the global economy and establish the basis for private-sector-led diversified exports and economic growth. However, the contribution of public investment to growth and poverty reduction has not always been as positive or as significant as one might expect. Despite the development of increasingly sophisticated methods for assessing the desirability of public expenditure during the 1960s and 1970s, large increases in public investment in many developing countries between 1974 and 1982 often yielded few returns (Little and Mirrless, 1990; Easterly, 2001). There are, of course, many possible reasons for this, including some unconnected with public investments (e.g. declining terms of trade for developing country exports). Nevertheless, there is a possibility that at least one of the reasons was that the methods available to assess the desirability of public investment alternatives were flawed, badly implemented, or ignored. Looking at methodologies for assisting policy-makers in deciding an optimal investment portfolio is, therefore, fundamental in furthering our understanding of the linkages between public investment, growth and poverty reduction, and of the ways in which economic policy-making can become a better tool for promoting positive development outcomes and reaching the MDGs. In recent years, there has been an increasing interest in Public Expenditure Management (PEM) systems, and the ways these can deliver on a government’s poverty reduction objectives. In the 1980s and 1990s the focus was largely on macroeconomic stability and aggregate fiscal discipline whereas more recently, criteria for resource allocation and issues of efficiency and effectiveness of public spending have come to the fore, highlighting the importance of the role of government in determining the ‘pro-poorness’ of growth paths and public investment policies (Wilhelm and Fiestas, 2005). However, figuring out the likely aggregate effects of alternative policies, and their impact on the well-being of various social groups, remains a difficult task (Paternostro et al., 2005). The difficulties related to the definition of appropriate resource-allocation criteria may also derive from what has been termed the ‘basic budgeting problem’, or the stated impossibility of ‘defining a comprehensive utility function or decision-making mechanism that can satisfactorily reconcile the competing claims of different interests for resources across the whole public sector’ (Fozzard, 2001: 44). These findings, although not very encouraging, point to a contradiction which needs to be urgently addressed. On one hand, there exist a number of techniques and methodologies for assessing the impact of public investment on growth and poverty reduction. Information on these methods and

2
evidence is contained in a diverse range of sources, not all of which are easily accessible. Moreover, much of the material is highly technical and not adequate for use by non-specialists. On the other hand, the reality of the policy process and of political cycles in many poor countries is not often conducive to a rational approach to policy-making and resource allocation. Investment choices are made without an appropriate assessment of available alternatives, and follow political rather than technical priorities. Donor advice is not always followed, and is often deemed inadequate to local context or ideologically biased. The kinds of evaluations that would benefit the policy process too often remain in academic and donor circles, and fail to have adequate influence on key policy decision-making processes. A solution to this contradiction is doubly important at present, as we are once again witnessing pressure for very large increases in public investment in developing countries, because of the slow rates of progress toward the targets contained in the MDGs, especially in sub-Saharan African countries. 1.2 Objective This paper will explore the linkages between public investment, growth and poverty reduction, with the aim of providing an overall view of existing theories, evidence and methods, and of looking at possible ways to provide better guidance to policy-makers in the use of available techniques and information to set priorities for public investment. It is addressed to key decision-makers in low-income country governments (e.g. in finance and sector ministries and central banks), and to donor agencies which support public investment projects in developing countries. The paper is not meant as an exhaustive review of all existing material, but simply as a summary of the main contributions and findings. The added value of this paper is in it bringing together much of this diverse material into a single publication, and presenting the information in such a way that it will be accessible to non-specialists. 1.3 Definitions We define (net) public investment as public expenditure that adds to the public physical capital stock. This would include the building of roads, ports, schools, hospitals etc. This corresponds to the definition of public investment in national accounts data, namely, capital expenditure. It is not within the scope of this paper to include public expenditure on health and education, despite the fact that many regard such expenditure as investment. Methods for assessing the poverty impact of public expenditure on social sectors such as health and education have been well covered elsewhere in recent years (see for example, van de Walle and Nead, 1995; Sahn and Younger, 2000; and World Bank, 2002). It can be argued that the distinction between public investment and public spending in general is not particularly useful. Firstly, public investment projects may (and often do) include large current expenditure components. Secondly, in terms of poverty impact, it may make more sense to look at the total of public spending rather than just its capital component. However, for the purpose of this paper, the focus on public investment is justified by the renewed emphasis on reaching the MDGs through ‘big push’ strategies based on increased levels of investment, and by the need to provide more specific guidance for policy-makers on how to make public investment choices.

3
As is well known, poverty is multi-dimensional. There are several different indicators of well-being (e.g. education, health, nutrition, security), and a minimum level deemed acceptable by society associated with each. A general formula for the amount of poverty in any one dimension of well-being is:
α
α ∑=
=⎟⎟⎠
⎞⎜⎜⎝
⎛ −=
qi
i j
ijjj z
yzn
P1
1 (1)
where ijy is the level of welfare indicator j achieved by individual i, and jz is the minimum level of indicator j deemed acceptable (i.e. the poverty line for indicator j). The parameter α determines the precise measure of poverty to be used. If a = 0, Pa is the poverty headcount (the proportion of people below the poverty line). If a = 1, Pa is the ‘poverty gap’ (defined as the average amount by which levels of the welfare indicator j fall below the poverty line).1 One might argue that it is most informative, and most honest, to keep separate the information on the amount of poverty in each different indicator (e.g. Deaton, 1997). However, it is often useful to combine information on the amount of poverty in the different dimensions into a single aggregate measure of poverty. There are two main ways of doing this. The first involves estimating the amount of income required to attain each of the k poverty lines. Two well known examples of income poverty lines are the US$1-a-day and US$2-a-day measures proposed for international poverty calculations and comparisons by the World Bank.2 The second approach involves constructing a weighting system that reflects the relative importance that society places on each different welfare dimension. However, such a system could be criticised as being arbitrary. A more elaborated definition of poverty will also consider the ‘capability’ of the poor, as the Sen approach to development defines it. Improving access to education and health services for the rural population in remote areas can be seen as part of this enabling process. Public investment in roads, transport, telecommunication infrastructures and sanitation could be considered as capability-improving factors, which will reduce the vulnerability of the poor, especially in the context of an unequal geographical distribution of public and private services. There are different definitions of the term pro-poor growth. On the one hand, some define it as economic growth that benefits the poor proportionally more than the non-poor, in the sense that it increases their income levels more than those of the non-poor (e.g. Pernia, 2003). Others define it as economic growth that is associated with reductions in absolute poverty (e.g. Ravallion and Chen, 2003; DFID, 2004). Recent debates around these different definitions of pro-poor growth are summarised in a series of short pieces by the UNDP International Poverty Centre (Zepeda, 2004; Ravallion, 2004; Osmani, 2005). For the purposes of this paper, it is unnecessary to give an objective statement as to which of these definitions is to be preferred. The most important point, about which there is little disagreement, is that rates of poverty reduction depend both on the rate of economic growth and on changes in distribution. To analyse the impact of public investment on poverty, therefore, both channels need to be considered. 1 Equation 1 is referred to as the Foster-Greer-Thorbecke (FGT) equation. It defines a family of measures of absolute poverty in
any one welfare dimension, which vary according to the choice of poverty line and the choice of the parameterα . 2 The most common way of calculating such lines is the ‘Engel curve’ method. This involves first estimating the relationship
between household calorie consumption per capita and total household expenditure per capita, and then selecting the level of household expenditure at which the minimum specified calorie intake is just attained, on average. There is an important debate about whether the resulting poverty line should be kept fixed, or whether it should instead be allowed to vary in response to changes in average incomes, relative prices, and the supply of public goods and services. For further discussion of the Engel method for estimating poverty lines, and its limitations, see Deaton (1997: 141–4). For discussions on the pros and cons of the World Bank US$1-a-day and US$2-a-day income poverty lines, see Deaton (2001; 2003), Ravallion (2001), and the collection of articles in the September 2004 edition of In Focus (UNDP International Poverty Centre, 2004).

4
1.4 Structure of the paper The remainder of this paper is divided into four main sections. Section 2 summarises different theories showing how public investment can affect poverty, via its effects on macro-economic variables (e.g. economic growth) and individual firms and households. Both direct effects (e.g. increased productivity) and indirect effects (e.g. relative price changes) are reviewed. Section 3 summarises recent empirical estimates of the size of these various effects in practice, and Section 4 explains how such evidence can be used by policy-makers to assess and make informed decisions, ex-ante, about public investment policy. Section 5 concludes and provides some recommendations for future research.

5
2 The poverty impact of public investment: theory In this section, we consider theories behind the channels through which public investment can affect poverty. We divide the discussion into two parts. The first (Section 2.1) discusses the effects of public investment on economy-wide variables, and in particular on the rate of economic growth. In the second part (Section 2.2), we consider the effects of public investment on individual households and firms. Both are relevant in terms of analysing the impact on public investment on poverty. 2.1 Macro-economic effects This section discusses the effects of public investment on economy-wide variables, and in particular on the rate of economic growth. It is based predominantly on theoretical economic models in which there is just one sector and one representative individual. In most cases these are market-clearing models, in the sense that prices are assumed to adjust so that all factors of production are fully employed. In Sections 2.1.1 to 2.1.5 we examine five channels through which public investment can affect economic growth, namely: complementing private capital, crowding-in private investment, increased market integration, increased aggregate demand, and increased national savings. In Section 2.1.6 we discuss the effects of public investment on other key macro-economic variables, namely employment and the real exchange rate. Section 2.1.7 summarises, and discusses some of the limitations of one-sector, single-individual models of the economy to analyse the effects of public investment. This forms the starting point from which we go on to analyse, in Section 2.2, the impacts of public investment at a more disaggregated level. 2.1.1 Complementarity between public and private capital Most discussions on the effect of public investment on economic growth begin with the assumption that public and private capital are complements. This is justified on the grounds that public and private capital are made up of quite different things, with public capital consisting mainly of public goods (e.g. roads, electricity supply) and private capital consisting of private goods (e.g. buildings, machinery). In this case, the aggregate production function for an economy is of the form:
( )LNGKfAY ,,,⋅= , (2) where Y is aggregate output, K is private capital (human and/or physical), G is public capital, N is natural resources, L is the labour force, and A is the level of technology, or total-factor productivity. When modelled in this way, an increase in the public capital stock raises aggregate output (see Figure 1). It also raises the productivity of all other factors of production, including labour. If labour markets are competitive, and labour supply is inelastic, an increase in the productivity of labour leads to an increase in real wages.

6
Figure 1
Out
put
Public capital
When public and private capital are complements in this way, an increase in public investment will raise a country’s rate of growth, at least up to a point. To illustrate, assume that Equation (2) can be approximated by a Cobb Douglas function of the form:
βα gkAy ⋅= (3) where LYy = is output per worker, LKk = is private capital per worker, and LGg = is public capital per worker, and the parameters α and β represent the elasticities of aggregate output with respect to private and public capital respectively. Assume also that the rate of private saving is unaffected by the return to private investment (the case of elastic private saving is considered in Section 2.1.2). The long-run or ‘steady-state’ level of output per worker (y*) is then given by:
γβγαγ
δδ ⎟⎟⎠
⎞⎜⎜⎝
⎛⎟⎟⎠
⎞⎜⎜⎝
⎛=
g
g
k
p ssAy 1* (4)
where ps is the share of private investment in national income, gs is the share of public investment in national income, kδ and gδ are the rates of depreciation of private and public capital respectively, and βαγ −−= 1 .3 The prediction is that, in the long run, countries with higher rates of public investment will have higher levels of output per worker (ceteris paribus). In the short- to medium-run, as they approach their long-run steady-state level of output per worker, countries with higher rates of public investment will have higher rates of economic growth (again, ceteris paribus). Evidence on these predictions is described in Section 3.1. Equations (2) to (4) could be extended to include several different types of public capital and investment, each with a potentially different effect on long-run output per worker and economic growth. Equation (3) could also be extended to a more general functional form. In this case, the impact of public investment on economic growth will be more varied, and will depend on at least four things, namely:
• the kind of public investment; • the amount of investment; • the initial stock of public capital; and • the economic context in which investment occurs.
3 Equation (4) is derived by solving the conditions for the steady-state level of output per worker to obtain expressions for the
steady-state levels of private and public capital per worker, and then inserting these formulae into Equation (3).

7
For example, public investment in roads could have either a marginal or a dramatic impact on productivity and growth, according to whether the initial road network was substantial or, on the opposite so underdeveloped that it was a major impediment to the functioning of the economy. Equation (2) could also be extended to allow public investment to affect the level of technology or total-factor productivity, although separating out this effect in practice would be difficult, and for this reason the existing specifications are most common. 2.1.2 Crowding-in private investment Additional considerations arise when the rate of private saving is flexible, and adjusts in response to changes in the returns to private investment. When public and private capital are complements, public investment raises the marginal productivity of private capital. This raises the returns to private investment and, if private savings are flexible, the amount of private investment. This ‘crowding-in’ of private investment in turn increases the rate of economic growth. However, although public investment is almost certain to crowd in private investment when starting from a low level, it is unlikely to do so at all levels. This is because increases in public investment have a successively smaller positive impact on the returns to private investment, while the taxes required to finance them have a constant negative impact. At some stage, therefore, it is inevitable that increased public investment will ‘crowd-out’ private investment. Nevertheless, many developing countries are in all likelihood a long way from this point, given their low levels of tax revenues relative to GDP. In the model of Barro (1990), three stages can in fact be distinguished, as shown in Figure 2. For levels of public investment up to point A, public investment increases the returns to private investment, the rate of private savings and the growth rate. This is the ‘crowding-in’ phase. After point A, the (negative) effects of higher taxes offset the (positive) effects of more public capital on the returns to private investment, and further increases in public investment lower the private savings rate. Nevertheless, between points A and B, increases in public investment still raise the growth rate, because public investment remains highly productive. This can therefore be described as the ‘efficient crowding-out’ phase. Past point B, however, public investment is less productive, and further increases lower both the savings rate and the growth rate. This is the ‘inefficient crowding-out’ phase. The optimal level of public investment, as a share of GDP, is point B.

8 Figure 2
Share of public investment in GDPA B
Gro
wth
rate
Share of public investment in GDPA B
Priv
ate
savi
ngs
rate
Source: Barro (1990).
The Barro (1990) model assumes that public investment is financed through taxation. When financed through borrowing, the effects of public investment on growth are complicated, and depend on the assumptions made about time horizons and inter-generational altruism. This is, therefore, more of a matter that can only be analysed empirically. For investment financed through aid, several models predict the same inverse-U shaped pattern shown in Figure 2 (e.g. Lensink and White, 2001), although for different reasons to the Barro (1990) model. 2.1.3 Market integration In ‘new economic geography’ models (e.g. Fujita et al., 2001), improvements in domestic transport and communications infrastructure can have significant effects on growth. There are two reasons for this. The first is that, by lowering transport costs, firms’ profits are raised, as are (depending on the characteristics of the labour market) the wages paid to labour. This generates a one-off boost to average income. The second is that, by driving a cumulative process by which labour and other resources move to a small number of core regions and/or cities in which (because of increasing returns) levels of labour productivity are higher, an acceleration in a country’s rate of growth is caused, which may well persist over several years if not decades. As we will see in Section 3, some empirical studies (e.g. Easterly and Rebelo, 1993; Milbourne et al., 2003) have found evidence that public expenditure on transport and communications has particularly large effects on economic growth, providing some support for this hypothesis. 2.1.4 Increased aggregate demand In Keynesian models of the economy, public investment affects the level of national income through its effect on aggregate demand. Such models assume that, because of inflexible wages and/or prices, economies sometimes operate at less than full employment. In such cases, an increase in public investment would have an immediate positive impact on the level of national income, followed by a successively smaller positive impact in a limited number of subsequent years. Alternatively, for economies with some positive underlying rate of growth, a rise in public

9
investment would initially cause growth to accelerate, followed by a gradual deceleration back to the underlying rate. There are, in fact, many examples of such growth accelerations in developing countries in recent decades, as shown by Hausmann et al. (2004), although it is not known what proportion can be attributed to increases in public investment. 2.1.5 Increased national savings It is also possible that public investment will increase economic growth simply by raising the rate of national savings. Put simply, a government can, in some circumstances, increase the share of national income that is saved by taxing consumption and investing the revenues this generates. For this particular effect to occur, the rate of private saving must not fall significantly if public investment reduces the returns to private investment. However, whether a government can raise national savings in this way is, of course, contested. Most notable is the argument, referred to as Ricardian equivalence and associated most usually with Barro (1974), that current generations will, in response to a tax rise (fall), adjust their own savings downwards (upwards) by an amount that leaves the national savings rate unchanged. 2.1.6 Other effects Public investment is likely to affect not only the rate of economic growth, but also a range of other key macro-economic variables. We do not have sufficient space to provide a full treatment of these other effects here, and instead offer only a brief summary. First, in countries operating at less than full employment, public investment will tend to increase the level of employment, at least in the short-term, by stimulating aggregate demand. Second, to the extent that public investment is financed from domestic borrowing, it will tend to increase domestic interest rates which, like tax-financed public investment, may ‘crowd-out’ private investment. This need not be the case, however, since public investment can also raise the returns to private investment, as shown in Section 2.1.1. Furthermore, a certain amount of crowding-out of private investment can still be efficient, from the point of view of maximising economic growth, as was shown in Section 2.1.2. Finally, to the extent that public investment is financed from external borrowing, or aid, it will tend to appreciate the real exchange rate, and reduce the competitiveness of tradeable sectors of the economy (the ‘Dutch disease’ phenomenon). It is often argued that this has an adverse effect on growth, since (it is argued) tradeable sectors are typically the engine of productivity growth and ‘learning-by-doing’ effects. We do not have space to provide a detailed examination of this hypothesis here. Nevertheless, Adam and Bevan (2004) show that the tendency for externally-financed public investment to appreciate the real exchange rate is reduced, and may even be reversed, when taking into account the ‘supply-side’ effects of public investment on productivity in the tradeable and non-tradeable sectors. 2.1.7 Summary The single-sector, single-individual models examined in this section have an important advantage, being that they provide simple but consistent theoretical frameworks from which hypotheses about the average impact of public investment can be derived and subjected to empirical testing. Nevertheless, they possess important drawbacks. First, they say relatively little about the impact of public investment on the distribution of income and welfare. Second, by aggregating across sectors, they say nothing about the impact of public investment on the relative prices of goods and services, which typically has significant distributional implications, and may also impact on economic growth itself.
10
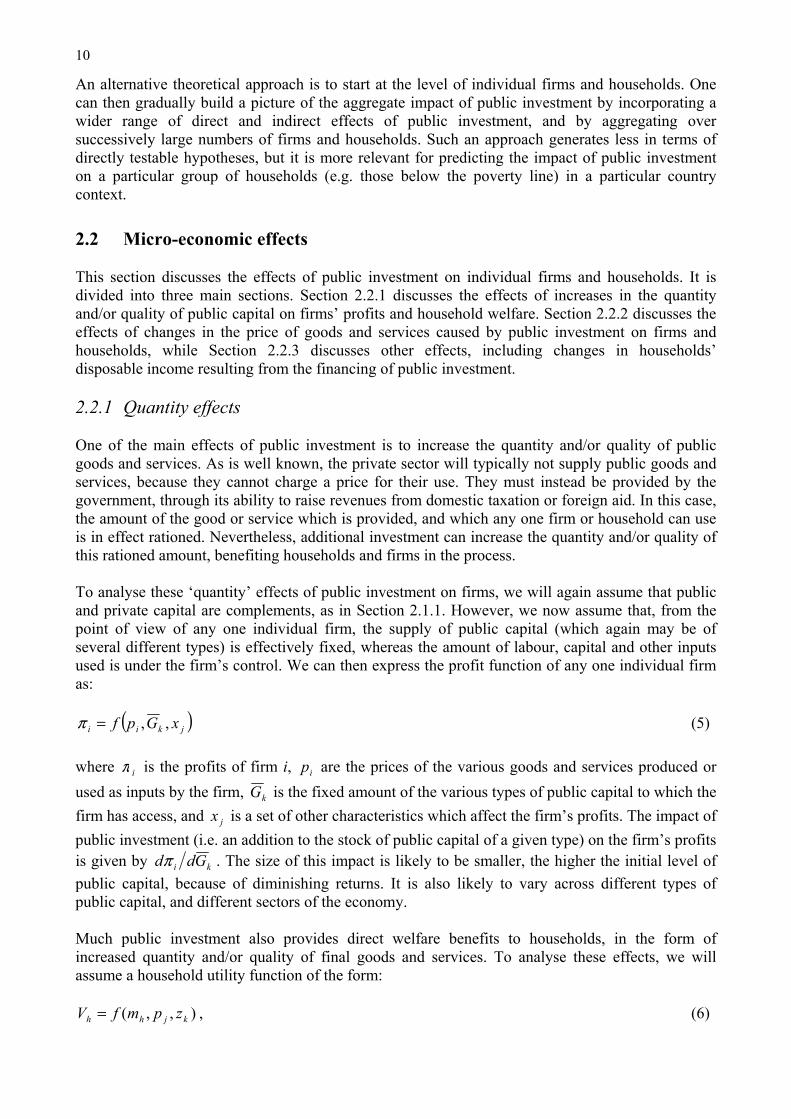
An alternative theoretical approach is to start at the level of individual firms and households. One can then gradually build a picture of the aggregate impact of public investment by incorporating a wider range of direct and indirect effects of public investment, and by aggregating over successively large numbers of firms and households. Such an approach generates less in terms of directly testable hypotheses, but it is more relevant for predicting the impact of public investment on a particular group of households (e.g. those below the poverty line) in a particular country context. 2.2 Micro-economic effects This section discusses the effects of public investment on individual firms and households. It is divided into three main sections. Section 2.2.1 discusses the effects of increases in the quantity and/or quality of public capital on firms’ profits and household welfare. Section 2.2.2 discusses the effects of changes in the price of goods and services caused by public investment on firms and households, while Section 2.2.3 discusses other effects, including changes in households’ disposable income resulting from the financing of public investment. 2.2.1 Quantity effects One of the main effects of public investment is to increase the quantity and/or quality of public goods and services. As is well known, the private sector will typically not supply public goods and services, because they cannot charge a price for their use. They must instead be provided by the government, through its ability to raise revenues from domestic taxation or foreign aid. In this case, the amount of the good or service which is provided, and which any one firm or household can use is in effect rationed. Nevertheless, additional investment can increase the quantity and/or quality of this rationed amount, benefiting households and firms in the process. To analyse these ‘quantity’ effects of public investment on firms, we will again assume that public and private capital are complements, as in Section 2.1.1. However, we now assume that, from the point of view of any one individual firm, the supply of public capital (which again may be of several different types) is effectively fixed, whereas the amount of labour, capital and other inputs used is under the firm’s control. We can then express the profit function of any one individual firm as:
( )jkii xGpf ,,=π (5) where iπ is the profits of firm i, ip are the prices of the various goods and services produced or used as inputs by the firm, kG is the fixed amount of the various types of public capital to which the firm has access, and jx is a set of other characteristics which affect the firm’s profits. The impact of public investment (i.e. an addition to the stock of public capital of a given type) on the firm’s profits is given by ki Gddπ . The size of this impact is likely to be smaller, the higher the initial level of public capital, because of diminishing returns. It is also likely to vary across different types of public capital, and different sectors of the economy. Much public investment also provides direct welfare benefits to households, in the form of increased quantity and/or quality of final goods and services. To analyse these effects, we will assume a household utility function of the form:
),,( kjhh zpmfV = , (6)
11
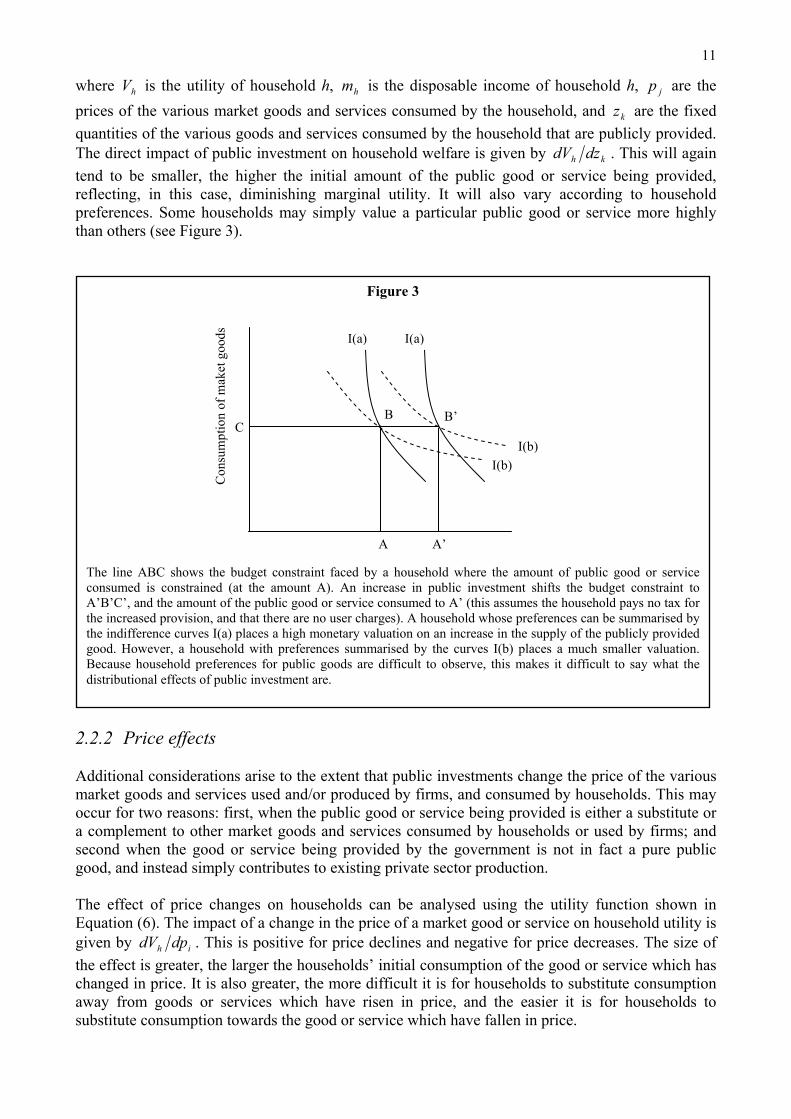
where hV is the utility of household h, hm is the disposable income of household h, jp are the prices of the various market goods and services consumed by the household, and kz are the fixed quantities of the various goods and services consumed by the household that are publicly provided. The direct impact of public investment on household welfare is given by kh dzdV . This will again tend to be smaller, the higher the initial amount of the public good or service being provided, reflecting, in this case, diminishing marginal utility. It will also vary according to household preferences. Some households may simply value a particular public good or service more highly than others (see Figure 3).
2.2.2 Price effects Additional considerations arise to the extent that public investments change the price of the various market goods and services used and/or produced by firms, and consumed by households. This may occur for two reasons: first, when the public good or service being provided is either a substitute or a complement to other market goods and services consumed by households or used by firms; and second when the good or service being provided by the government is not in fact a pure public good, and instead simply contributes to existing private sector production. The effect of price changes on households can be analysed using the utility function shown in Equation (6). The impact of a change in the price of a market good or service on household utility is given by ih dpdV . This is positive for price declines and negative for price decreases. The size of the effect is greater, the larger the households’ initial consumption of the good or service which has changed in price. It is also greater, the more difficult it is for households to substitute consumption away from goods or services which have risen in price, and the easier it is for households to substitute consumption towards the good or service which have fallen in price.
Figure 3
Con
sum
ptio
n of
mak
et g
oods
A A’
B B’
I(a) I(a)
I(b)I(b)
C
The line ABC shows the budget constraint faced by a household where the amount of public good or service consumed is constrained (at the amount A). An increase in public investment shifts the budget constraint to A’B’C’, and the amount of the public good or service consumed to A’ (this assumes the household pays no tax for the increased provision, and that there are no user charges). A household whose preferences can be summarised by the indifference curves I(a) places a high monetary valuation on an increase in the supply of the publicly provided good. However, a household with preferences summarised by the curves I(b) places a much smaller valuation. Because household preferences for public goods are difficult to observe, this makes it difficult to say what the distributional effects of public investment are.

12
Similarly, the effect of price changes on firms can be analysed using the profit function shown in Equation (5). In this case, the impact is given by ii dpdπ . For goods produced by the firm, this is positive for price increases and negative for price decreases; for goods used as inputs it is negative for price increases and positive for price decreases. In each case, the size of the effect is greater (in absolute terms), the larger the firms’ initial production (or use) of the good or service which has changed in price. It is also greater, the easier it is for firms to expand production of goods (or reduce use of inputs) which have risen in price, and to reduce production of goods (or increase use of inputs) which have fallen in price. For small price changes, one can reasonably assume that firms’ and households’ consumption and production decisions are left unchanged. In this case, the impact of a change in the price of a good or service on any one individual firm or household can be expressed as:
( )h
hihii
h
h
i
h
xqyp
xddV
pddV −
⋅=lnln
(7)
where hiy is the production of the commodity, ihq is the consumption of the commodity, hx is the total money income of the firm or household, and hh xddV ln is the household or firm’s marginal utility of income (Deaton 1997: 184-5). This equation is used often in empirical applications to estimate the differential impact of price changes on households, particularly farm-households (for a recent review see McCulloch, 2003). Estimating the likely changes in the prices of market goods and services caused by public investment requires the use of modelling techniques, which span from simple partial equilibrium approaches to more detailed general equilibrium approaches. The advantage of the latter is that they take into account the effect that increased investment in one sector has on levels of prices and output in others. 2.2.3 Other effects Public investment will have further implications for a household’s disposable income to the extent that it is financed by direct taxes. The incidence of direct taxes will typically differ across households, depending on the government’s tax policy, and on the amount by which households adjust their behaviour in response to a given tax policy. (The impact of indirect taxes can be analysed through their effects on prices.) Some public investment also imposes implicit non-income taxes on households. An example would be a resettlement programme, which can impose substantial non-income (psychological) costs on households that have to move, particularly when they are not subject to negotiation. Such implicit taxes might be offset in some way by compensatory payments by government, but also might not. When resettlement is not compensated, it can be a highly regressive form of taxation (i.e. uncompensated resettlement is more often imposed on poorer households than on richer households). The fact that much public investment is financed by direct taxation means that policy-makers need to weigh up the benefits for households subject to the quantity and price effects described above, as against the costs of direct taxation. It also means that the net impact of public investment on household welfare may be positive or negative, depending on the (difficult to observe) household’s preferences (see Figure 4). For more information on this, see Aaron and McGuire (1970), Brennan (1976), and Cornes (1992; 1995).

13
2.2.4 Summary The discussion in this section shows that the impacts of public investment can be analysed at a highly disaggregated level. Such an approach allows for the differential impact of public investment across firms and households, and the ‘indirect’ effects of public investment which arise through changes in the relative price of goods and services. These effects are likely to be significant in practice, therefore the issues raised in this section are important. The main drawback to following a highly disaggregated approach is that predictions of the effects of public investment on aggregate variables, such as growth and employment, quickly become highly complex. This means that in practice, both aggregated and disaggregated theoretical approaches are of relevance, both in terms of assessing ex-post the performance of past investments and judging ex-ante the desirability of future investments.
Figure 4
Con
sum
ptio
n of
mak
et g
oods
A A’
B
B’
I(a)I(a)
I(b)
I(b)
C
C’
Consumption of public goods
Figure 4 shows the case of an increase in the amount of a publicly provided good or service, financed through a direct income tax. The initial budget constraint is shown by the line ABC; the budget constraint following the increased provision is shown by A’B’C’. As shown, the change increases the welfare of households with preferences I(a), but reduces the welfare of households with preferences I(b).

14
3 The poverty impact of public investment: evidence In this section we summarise the most recent empirical evidence regarding the various channels through which public investment affects poverty. Such evidence is important for two reasons. First, it provides empirical tests of the hypotheses derived from the theories outlined in Section 2. Second, it allows policy-makers to make more informed choices, ex-ante, about the optimal level and inter-sectoral allocation of public investment, as we show in Section 4. 3.1 Effects of public investment on economic growth Several studies have looked at the impact of public investment on economic growth. One of the earliest examples was Barro (1991). He found that the average share of public investment in GDP had a positive, but statistically insignificant, impact on economic growth over the period 1960–85.4 This was followed by a study by Easterly and Rebelo (1993), which extended the analysis in two directions. First, they included investment by public enterprises as well as that by central government; and secondly, they distinguished between public investments in different sectors. In contrast with Barro (1991), they found that public investment by central government had a positive and statistically significant effect on economic growth. They also found that, of the different sectors, investment in transport and communications had a particularly large, and statistically significant, effect on economic growth. Devarajan et al. (1996) challenged this finding. They distinguished between different types of public expenditure, both by economic classification and by sector. The expenditure data were taken from the IMF Government Financial Statistics, which disaggregates expenditure according to: a) economic classification (capital, current); and b) functional classification (e.g. defence, administration, transport, health, education). Devarajan et al. also expressed each expenditure category as a proportion of the total budget, rather than the absolute amount, thus taking into account the public budget constraint (each expenditure category can be increased only at the expense of others). In contrast with Easterly and Rebelo (1993), they found that public capital expenditure had a negative, and statistically significant, effect on growth, as did public expenditure on transport and communication.5 More recent studies of the effects of public expenditure on growth have included Aschauer (2000) and Milbourne et al. (2003). Both test the predictions of a neo-classical growth model in which public capital is a complement to private capital, and find that public investment has a positive and statistically significant impact on economic growth.6 Of the different sectors, investments in transport and communication and in education have the largest impacts on growth (the effects of investments in agriculture, health, housing and industry are not statistically significant). Despite the more optimistic results of these more recent studies, it is difficult to draw any firm conclusions from this evidence. Two careful studies examining the robustness of results from cross-country growth regressions (Levine and Renelt, 1992; Sala-i-Martin, 1997) report that no measure of public expenditure, including public investment, can be said to have a robust effect on economic
4 Barro (1991) also found that the ratio of public consumption to GDP (not including spending on education and defence) had a
negative effect on economic growth, which is consistent with the model outlined in Section 2.1.2 (although note that public consumption spending may well still be desirable, even if it lowers the rate of growth of output per capita, if it provides direct welfare benefits to households).
5 They also found that current expenditure had a statistically significant positive impact on economic growth, in contrast with Barro (1991).
6 Each study uses version (5.6) of the Penn World Table for the ratios of public and private investment to GDP. This is an updated version of the same dataset used by Barro (1991). Milbourne et al. (2003) also use the data on public investment by sector collected by Easterly and Rebelo (1993).

15
growth.7 Milbourne et al. (2003) note that, when allowing for possible reverse causation, uncertainty about the size of their estimates increases substantially, especially those that relate to the effects of investment in different sectors on economic growth. Part of the difficulty is that, in all likelihood, the efficiency of public investment – in other words, the impact of investment spending on the size and quality of the public capital stock – varies substantially across countries (Pritchett, 2000). This obscures the underlying relationship between public capital and private sector productivity under observation. For this reason, some researchers have looked at the effect of direct measures of public capital and infrastructure on economic growth. We discuss these studies in Section 3.2 below. 3.2 Effects of public capital on productivity As described in Section 2.1, the starting point for many analyses of the impact of public investment is that public capital is complementary to private capital and other factors of production, and is therefore ‘productive’. One of the first direct tests of this hypothesis was provided by Aschauer (1989), in a paper entitled ‘Is Public Investment Productive?’. This showed that public capital in the United States was indeed productive, and that much of the decline in private sector productivity in the country between 1970 and 1985 could be attributed to insufficient public investment and a decline in the public capital stock. A substantial number of papers have followed on from the work of Aschauer (1989). Here we summarise some notable examples, although for an exhaustive review of empirical studies assessing the productivity of public capital the reader is referred to Gramlich (1994) or, more recently, Hurlin (1999). One interesting piece of work comes from Dessus and Herrera (1996), who respond to criticisms of the original Aschauer (1989) paper regarding bias in the results due to common trends and long-term stationarity. They focus on 28 developing countries between 1981 and 1991, and confirm Aschauer’s finding. They find that the elasticity of national product with regard to public capital is in fact higher than that for private capital. This was among the first studies to include developing countries into the empirical literature on this issue. A further example of this approach is Canning and Bennathan (2000). They estimate the marginal products of two types of infrastructure – electricity-generating capacity (measured in kilowatts), and the length of paved roads – using cross-country data for the period 1960–2000.8 Their results suggest that the marginal productivity of public capital varies considerably across countries, but that on the whole, much higher levels of infrastructure provision are warranted. More recently, Calderon and Serven (2004) construct country-level indices of the quantity and the quality of public infrastructure. Their index of infrastructure quantity is based on the number of telephone mainlines, electricity-generating capacity, and total road length per km2, while their index of infrastructure quality is based on the waiting time for a telephone connection, the share of paved roads in total roads, and the efficiency of electricity generation. They find that the quantity of infrastructure, although not the quality, has a large and statistically significant impact on GDP.
7 Robustness means that a variable retains a statistically significant impact on economic growth under a variety of alternative
econometric specifications. Both studies tested the robustness of approximately 60 variables found to have a statistically significant effect on growth in at least one specification.
8 The authors use panel-data co-integration methods to avoid the econometric problems of reverse causation and omitted variable bias. They estimate both Cobb-Douglas and more general trans-log production functions. They recognise that their measures of the infrastructure quantity are subject to various biases. Earlier examples of their underlying approach include Sanchez-Robles (1998), Canning (1999) and Canning and Pedroni (1999).

16
A number of other studies have examined the impact of different types of public capital on productivity at the sectoral level. One interesting contribution is Binswanger et al. (1993), who estimate the impact of irrigation and roads on agricultural productivity in India. They find that public investment in irrigation has a direct effect on food production and the productivity of the agricultural sector, while the development of road infrastructure reduces the transaction costs and improves the functioning of markets significantly, by allowing producers access to markets. In another study of India, Mitra et al. (1998) find that public infrastructure has a positive, large and statistically significant impact on productivity and technical efficiency (as measured by total factor productivity) in the manufacturing sector. 3.3 Effects of public investment on poverty and inequality Some recent studies have estimated the effect of public expenditure, including public investment expenditure, on poverty. Using cross-country data, Gomanee et al. (2003) and Mosley et al. (2004) have estimated the effects of government expenditure in different sectors on the US$1-a-day poverty headcount, holding the level of GDP per capita constant. They find that higher government expenditure on education, agriculture, and housing and amenities (water, sanitation and social security) all have a negative and statistically significant impact on poverty, presumably by shifting the distribution of income in a pro-poor direction, since the level of aggregate income is held constant in their regressions. Other studies have used cross-state data, particularly in India where state-level data are high-quality and stretch far back in time. Fan et al. (1999), for example, estimate the effect of public expenditure on levels of rural poverty across Indian states, distinguishing between expenditure on rural education, targeted rural development, public health, irrigation, power generation, agricultural R&D, and rural roads. They find that agricultural R&D, rural roads, rural education and targeted rural development expenditure all have negative and statistically significant effects on rural poverty. Of these, spending on agricultural R&D and rural roads has by far the largest impacts on both growth and poverty reduction.9 Fan et al. (2002) conduct a similar analysis of the effects of public expenditure on rural poverty across Chinese provinces, distinguishing between expenditure on rural education, targeted poverty alleviation, telecommunications, irrigation, power generation, agricultural R&D, and rural roads. They find that spending on rural education has the largest impact on poverty, followed by spending on agricultural R&D and then by spending on rural roads. More recent studies on India, China, Uganda and Thailand include Fan et al. (2004a) and Fan et al. (2004b). In a similar fashion, Datt and Ravallion (2002) estimate the determinants of differences in the rate of reduction of the poverty headcount across Indian states over the period 1960–94. They find that state government development spending has a large and statistically significant effect on poverty reduction, even when controlling for changes in agricultural and non-agricultural productivity and a time trend. 3.4 Effects of public capital on poverty and inequality We end this section by summarising the results of some recent studies which have looked more directly at the effect of different types of public capital, as opposed to public expenditure on public capital, on poverty or inequality. Calderon and Serven (2004) estimate the effect of their indices of infrastructure quantity and quality on inequality, as measured by the Gini coefficient. They find that
9 For each category of expenditure they calculate the marginal impact of public expenditure (in units of Rs 100 billion). This is
obtained by multiplying the elasticity of poverty with respect to public expenditure by the ratio of poverty to government expenditure.

17
both indices have a negative and statistically significant effect on the level of inequality. We have been unable to locate any similar studies, although this work is likely to stimulate further work on this issue. Some studies, however, have estimated the effect of infrastructure on poverty using micro-econometric evidence. Deininger and Okidi (2003), for example, show that households in Uganda that were connected to an electricity network in 1992 experienced much higher rates of income growth over the period 1992–99 than households that were not. 3.5 Summary This section shows that there is a large and increasing body of evidence on the impact of public capital and public investment on productivity, economic growth, inequality and poverty. This represents an important resource from which policy-makers can draw in order to make better public investment decisions. This evidence shows that public capital is generally productive, in the sense that it boosts output at the sectoral or national level, in addition to any direct welfare benefits provided to households. Often, the boost to productivity from an increase in public capital is significantly larger than that arising from an equivalent increase in private capital. The evidence also shows that public investment expenditure is associated with greater poverty reduction, at least in those countries with sufficiently detailed and reliable data on government expenditure and poverty across states or regions to allow conclusions to be drawn. The main limitation with the existing evidence, however, is that there are still relatively few studies of the impact of public capital or investment in specific individual countries. This could be addressed in further work, as we discuss in Section 5.

18
4 The poverty impact of public investment: methods In this section we ask a different question, namely: what methods can policy-makers use to assess, ex-ante, the impact of public investment? There are two sets of questions which we address. In Section 4.1, we look at methods used to assess whether a specific public investment project can be justified: in other words, techniques of project appraisal. However, when discussing useful ways to assist policy-makers, the importance of being able to make comparisons among investment opportunities in different sectors in order to identify an optimal portfolio of public investment for reducing poverty and achieving other social goals cannot be overstated. In Section 4.2 therefore, we look at methods used to assess how a given amount (or additional amount) of investment expenditure should be allocated across competing sectors or expenditure categories.10 4.1 Project appraisal The standard technique for assessing ex-ante the merits of a proposed public investment project is cost-benefit analysis (CBA). The basic principle of CBA is simple and well known. It involves identifying all the people likely to be affected by a public project, and then measuring the net impact of the project on each person – the benefits minus the costs – in terms of current money income. A project is said to be justified if the weighted sum of all the net benefits is greater than zero. The weights reflect the government’s judgement regarding the relative importance to be attached to the project’s measured net benefits going to different members of society, including those who have not yet been born. Two fundamental questions in CBA are: a) how can all the different costs and benefits of a project be converted into current money terms; and b) what weights should be used when adding up the net gains or losses of different members of society. We consider briefly each of these issues in turn. 4.1.1 Measuring net benefits in money terms The monetary impact of changes in the quantity or quality of additional public capital used by firms is given by the marginal impact of public capital on firm profits, i.e. ki Gddπ in Equation (5) in Section 2.2.1. Given time-series or cross-sectional information on farm profits and levels of public capital, as well as the various other factors likely to affect farm profits, this can be estimated econometrically. For recent estimates for irrigation investments in Vietnam, see van de Walle and Gunewardena (2001). The monetary impact of changes in the quantity or quality of final goods and services consumed by households is given by households’ marginal monetary valuations of the goods being provided. There are three main ways of calculating these valuations: the contingent valuation approach, the travel cost method, and the hedonic pricing method.11 All have been used extensively in measuring the benefits of ‘environmental’ public goods and services (e.g. national parks, air pollution, and
10 There is an additional issue, namely how policy-makers can decide on the optimal level of public investment, as well as its
allocation across sectors. Although the methods outlined in Section 4.2 shed some light on this question, they would need to be combined with a fully-specified model of the macro-economy to provide a full treatment. For an exhaustive review of macro-economic techniques more suited to the analysis of increases in aggregate public investment, the reader is referred instead to Part II of Bourguignon and da Silva (2003).
11 Contingent valuation is a survey/questionnaire-based method that asks individuals how much they would be willing to pay for some change in the provision of a public good. The travel cost method uses the amount that individuals spend travelling to and from a public good (e.g. a park, a school, or a health clinic) to estimate their valuation of it. The hedonic pricing method uses variations in the price of market goods to estimate the value of public goods (e.g. variations in property values between areas with different levels of air or noise pollution). For more information about these approaches, see Mitchell and Carson (1989) or Johansson (1987).

19
noise pollution); for examples, see Mitchell and Carson (1989) or Johansson (1987). Their application to measuring the benefits of other types of public goods (e.g. water and sanitation) has been less extensive. However, Alberini and Cooper (2000) discuss applications of the contingent valuation approach to the appraisal of anti-pollution measures in Taiwan and Thailand, to control of tsetse flies in Ethiopia, and to public water and sanitation services in Burkina Faso, Brazil, Ghana, Haiti, India, Nigeria, Pakistan, the Philippines, and Tunisia. Participatory Poverty Assessments (PPAs), which typically ask respondents which public goods and services they need most, also come close to the spirit of the contingent valuation approach; for a review see Norton (2001). The equivalent monetary impact of small price changes is given by the right-hand term in Equation (7) in Section 2.2.2. This can be calculated, given information on the shares of different commodities in households’ and firms’ income and expenditure. This can be obtained from household and/or firm surveys, the number of which has increased dramatically in developing countries in recent decades, for example through the World Bank Living Standards Measurement Surveys.12 For large price changes, information is also required on the elasticities of demand and supply for those goods and services which have changed in price. 4.1.2 Weighting costs and benefits When public investment raises the rate of growth, it increases the levels of income and consumption that can be attained in the future. Converting these benefits into current value terms requires a decision as to the level of discount rate to use. One argument is that, because of technological progress, incomes tend to grow over time anyway. Combined with the assumption of diminishing marginal returns to income, this implies that net benefits accruing to future generations should be given less weight than those accruing to current generations. In the absence of any technological progress, however, there are no strong normative or ethical grounds for weighting net benefits accruing to future generations any differently to current generations. When public investments also have distributional effects, CBA requires a decision as to whether to weight differently the net benefits accruing to different households and, if so, how. There has been a long and important literature on this issue. On one hand, it is argued that the most efficient way for governments to achieve their distributional objectives is through the use of taxes and transfers. The implication is that the net benefits of public investment projects going to different people need not be weighted differently. This view was originally associated with the assumption that ‘lump-sum’ taxes and transfers – defined as those which have no effect on the behaviour of donors or recipients – were possible. On the other hand, it is argued that governments cannot achieve all of their distributional objectives through the tax and transfer system, and that opportunities for ‘lump-sum’ taxes and transfers are limited (e.g. Sen, 1972; Weisbrod, 1972; and van de Walle, 2000). Combined with the assumption of diminishing marginal returns to income, the implication is that net benefits of public investment projects should be weighted according to the level of income of the person to whom they accrue, with greater weight being placed on net benefits going to individuals with lower incomes. This was advocated, for example, in the study for the World Bank by Squire and van der Tak (1975). However, there is no clear guidance as to what these weights should be, except in terms of it being a normative matter that should be decided by a government in consultation with citizens.
12 One needs to be careful to include the opportunity costs of final goods and services when calculating these shares. For example,
one might underestimate the true cost of energy to poor households, to the extent that they spend significant amounts of time collecting alternative sources of energy (e.g. firewood).

20
4.1.3 Using CBA to assess poverty impacts A special weighting system would be one which places zero weight on net benefits going to households above an income poverty line, and a weight of one on net benefits going to households below that line. In this case, the CBA would show the impact of the project on the welfare of the poor, measured in money terms, which would correspond quite closely with the change in the poverty gap measure of income poverty (assuming the CBA was carried out well). However, many would question whether such a weighting system can be justified and/or is ever likely to be used in practice. There are two reasons for this. First, governments are accountable to all of their citizens, and generally cannot afford to implement policies that impose unlimited costs on the non-poor. Secondly, even if society were to agree that such a weighting system was appropriate in theory, the difficulty and controversy surrounding the estimation of poverty lines in practice means that a ‘sliding-scale’ weighting system would be preferable to a 0–1 system. For these reasons, proponents of CBA generally argue that the overall yardstick by which any public project should be evaluated is social welfare, not poverty (although the two are closely related). The point is expressed by Deaton (1997: 141):
Poverty measures are designed to count the poor and to diagnose the extent and distribution of poverty, while social welfare functions are guides to policy. Just as the measurement of social welfare can be an inadequate guide to poverty, so are poverty measures likely to be an inadequate guide to policy.
The same applies to assessing the impact of changes in policy (e.g. trade liberalisation, tax reform). 4.1.4 Modelling price, wage and income changes As discussed in Section 2.2.2, public investment often alters the relative prices of different goods and services in an economy, the sectoral level of factor productivity and therefore wages and household income. Anticipating the extent of these changes requires the use of modelling techniques, which span from simple partial equilibrium approaches to more detailed analyses using computable general equilibrium (CGE) models. Computable General Equilibrium (CGE) models belong to the category of general equilibrium tools which are particularly helpful in understanding the complex economic mechanisms that occur in a given economy when the government undertakes public investment policies. CGE models represent a country’s economy through all the flows that occur in a given year between its different agents or entities. Broadly used and applied to developing countries by research institutions and development agencies, they are a simulation tool, and are therefore especially helpful in understanding the consequences of policy choices, as they allow feedback effects to be considered.13 Among other advantages, CGEs only require data for a given year, unlike econometric models which require long time series. However, they have to be tailored to reflect the economy of a country, taking into account enough of its specificities, which implies a large informational requirement. CGEs allow for quantitative macroeconomic analysis of a large variety of public investment policies. Government spending can be decomposed in a way that allows comparisons of different policy choices; Chen and Ravallion (2003), for example, use a CGE model to estimate the effects of WTO accession on goods and factor prices in China. Each of the effects described in Section 2 can
13 Adelman and Robinson constructed the first model for Korea in 1978 which became a reference for various models simulating
the impact of economic policy on income distribution. For a recent review of the use of CGE modelling in policy impact analysis, see Lofgren et al. (2003).

21
be analysed and assessed using a model that takes into account country specificities. Price effects, for example, result from a sequence of economic mechanisms, which could hardly be predicted or analysed without a general equilibrium framework. One advantage of CGE models is that they take into consideration the effects that increased investment in one sector have on levels of prices and output in others. CGE models are more commonly used to analyse the impact of changes in economic policies, as opposed to the effects of particular investment projects. Nevertheless, CGE modelling can be developed in such a way that allows for such a study, the prerequisite being to be able to formulate assumptions on the returns to public investment and the way they should be captured, at the sectoral or aggregate level, to best embody the country situation. 4.1.5 Alternatives to CBA Resource and informational constraints mean that full cost-benefit analyses cannot always be carried out. This means that there is a need for researchers to continue developing, refining and disseminating less information-intensive alternatives. Such approaches should come with an assessment of the likely magnitudes of error to which they may be subject. A good example of this practice is van de Walle and Gunewardena (2001), who compare the net benefits from irrigation investments in Vietnam calculated by ‘quick and dirty’ methods with those calculated by ‘slow and clean’ methods. The ‘slow and clean’ method involves estimating, using household survey data and econometric techniques, the effect of the amount of irrigated and non-irrigated land on households’ net crop incomes. The method controls for various other influences on crop income, and allows the marginal benefits of irrigated land to differ according to district, type of household, and initial level of irrigated relative to non-irrigated land. The ‘quick and dirty’ method, by contrast, involves simply calculating the difference between the average crop income of farmers using irrigated land and those using non-irrigated land, and interpreting the difference as the marginal benefit of irrigated land. The authors’ calculations show that, if the cost of irrigation investments is low, both methods imply that benefits exceed costs. If, however, the cost of irrigation investments is high, the use of the ‘quick and dirty’ method can impose substantial costs, in that non-beneficial projects are accepted, and beneficial projects are not accepted. The authors conclude that, at least in this case, the additional costs of data collection and analysis required for the ‘slow and clean method’ are justified. However, in their review of actual World Bank appraisal reports for irrigation investments, they found few evaluations that used anything corresponding to such a method. 4.2 Inter-sectoral allocation 4.2.1 Benefit incidence analysis Benefit incidence analysis has been used extensively in the analysis of public expenditure on health and expenditure (for recent reviews, see van de Walle, 1998; Demery, 2000; Schwartz and Ter-Minassian, 2000). The approach involves measuring the amount of some category of public expenditure which is received by a certain household or group of households, typically deciles of the population ranked by household income or expenditure. It is often argued that the results of these studies should be used to guide inter-sectoral expenditure and/or investment allocations, and in particular that relatively more public expenditure and/or investment should be allocated to those expenditure categories in which a higher proportion of total expenditure is received by groups with lower measured welfare. Such sectors are typically referred to as being more ‘pro-poor’.
22
There are, however, two main drawbacks with this approach. First, benefit incidence analyses are difficult to carry out for public investment expenditure, or public spending on infrastructure more generally. Demery (2000) cites three reasons for this: it is difficult to assign consumption of infrastructure services (e.g. water and sanitation) to individuals and/or households; government subsidies are often channelled through public enterprises, which makes them harder to measure, and public providers of infrastructure services often charge cost-based tariffs, which means that overall subsidies from the government (at least for current expenditures) are small. Second, benefit incidence analyses only indicate the distributional impacts of public expenditure, and say nothing about its absolute impacts, on poverty or on economic growth.14 This suggests that one should be cautious about using the results of benefit incidence analyses to inform expenditure allocation decisions. The main exception is when use of, or access to, a public good or service is considered a basic need or citizen’s right. In this case it identifies households that are currently not achieving the given need or right, and in so doing provides an unambiguous case for increased expenditure or investment allocation, assuming the need or right can be met through additional expenditure. 4.2.2 Target based approaches An alternative approach to making inter-sectoral investment decisions is that suggested by Ferroni and Kanbur (1990). In this case, the choice of the optimal inter-sectoral allocation of public expenditure is a problem of seeking to maximise welfare given a fixed fiscal budget constraint. This can be expressed algebraically as: Maximise ( )jkij
jj XzYGXw ≠∑ ,,, , (8)
subject to ∑ =
kk GG and
0≥kG , where kG is government expenditure in sector k, jX is the achieved level of each welfare indicator j, jw are the normative weights attached to each welfare indicator, z is a vector of other variables
that may affect each target indicator, and G is the total amount of resources available to the government. The basic ‘rule’ in solving this problem is that an increase in expenditure in some sector k is justified if it increases welfare, taking into account both direct and indirect effects, and if no greater increase in welfare can be achieved by spending the same amount in another sector. In implementing this approach, two main sorts of information are required. The first is the direct impact of public investment on each welfare indicator; and the second is the indirect impact of public investment on each indicator, via its effect on other welfare indicators. In the previous section, for example, we summarised recent evidence regarding the impacts of public investment on income and poverty. Given such information, the optimal values of kG can be calculated. The calculations themselves are complicated, but can be made using specialist computer software.
14 Furthermore, they indicate the distributional impacts of accurately only under the strong assumption that all users of a public
project benefit by the same amount from a given amount of expenditure. Where different households benefit to a different extent from a given amount of expenditure, they may not give an accurate indication even of distributional impacts.

23
One problem with the Ferroni and Kanbur (1990) approach is that it assumes that the total amount of public resources available is fixed. By contrast, we often want to calculate the amount of public resources (or additional public resources) which are required to meet a given set of welfare targets. In this case however, one can simply re-express the problem as one of allocating public expenditure across sectors, so as to minimise the amount of resources required to meet a given set of targets. In algebraic terms, Equation (8) becomes: Minimise ∑
kkG (9)
subject to
( ) jjkij TXzGX ≥≠,, 0≥kG ,
where jT is the targeted level of each target indicator j, and z is a vector of other variables that may affect any target indicator j. In this case, the basic ‘rule’ for expenditure allocation is that an increase in government expenditure in some sector k is justified if it reduces a country’s distance from one or more of the targets, taking into account its direct and indirect effects, and if a greater reduction in that distance could not be achieved by spending the same amount in another sector. Note that, unlike Equation (8), there is in Equation (9) no need to attach normative weights to each welfare indicator. The weights are instead reflected implicitly in the relative size of the targets; the higher the target for a given indicator, the higher the implicit weight placed on that indicator. The best known set of targets is gathered under the Millennium Development Goals (MDGs), which have been interpreted by many (e.g. UN Millennium Project 2005) as applying to each individual country, as well as to all countries as a whole. However, they could be any set of development objectives that a government sets for itself, following consultation with citizens. Once such targets have been set, they provide clear guidelines for determining the allocation of public expenditure across sectors. There is however a more serious problem with this approach to inter-sectoral allocation issues. Firstly, it is often difficult to estimate accurately what the effect of a given category of public expenditure or investment on any given measure of welfare is. If, for instance, different investment projects tend to be introduced simultaneously, it is almost impossible to isolate their individual impacts on any subsequent change in welfare. One can often address this problem by comparing levels of welfare between regions, states or countries with different levels of public investment (a ‘with and without’ approach). However, in this case, one cannot always ‘net out’ the effects of other differences that may affect welfare (e.g. private sector productivity, which may crowd in public investment for the reasons set out in Section 2.2.2). Despite their promise therefore, the Ferroni and Kanbur (1990) approach, and variants of it, are ‘data-heavy’, especially when considering the reciprocal and complex interaction among the different dimensions of standards of living. There is a further problem in that, because of the need to estimate the effect of public expenditure on welfare using statistical methods, the choice of welfare indicators to be targeted may be determined more by data availability, rather than what is considered to really matter. Estimates of the effects of public expenditure tend also to be confined to a small number of countries with the greatest data availability, and such results cannot necessarily be assumed to apply in all other country contexts.

24
4.2.3 CGE-based approaches An interesting attempt to design something similar to a target-based approach related to the achievement of the MDGs is being developed by the World Bank, and goes under the name of MAMS (or ‘Maquette for MDG Simulation’). The MAMS model combines micro- and macro- elements, with the goal of developing an economy-wide, dynamic CGE model that is able to capture the combined effects of many of the key MDG-related policies and required foreign aid flows that a low-income country can utilise to reach the MDGs. It is designed to describe alternative scenarios involving different investment choices and financing modalities. The model has several components: (a) a macro-model providing baseline scenarios for growth, aid and public expenditure; (b) a sectoral supply-demand model, modelling MDG outcomes through production functions; (c) budgetary and technological constraints to explain changes in production factors and their cost; and (d) human capital constraints related to the availability over time of a sufficiently skilled labour force (Bourguignon, 2004). The World Bank is piloting the MAMS model in Ethiopia, constructing different scenarios to assess the financing required to achieve a sub-set of the MDGs and absorptive capacity constraints (Sundberg et al. 2005). However, rather than providing an assessment of the relative impact on poverty levels of alternative investment portfolios in different sectors, the model is constructed to show the potential positive and negative complementarities of investing in different sectors for achieving all or some of the targets. The figure below depicts the general framework that forms the basis of the MAMS model.
Figure 5
Source: Bourguignon (2004)

25
As Figure 5 illustrates, computable general equilibrium models are a useful tool to design a public investment strategy, both in terms of how to finance it and what effects to expect. As for their relevance to studying poverty and income distribution impacts, there are two papers that have used CGE models explicitly to assess the impact of public investment policies on growth and poverty for an African country. The first is Levy (2006), which uses a CGE model to show that public investment in irrigation and roads are complementary in Chad. Both investments have very large impacts on growth, and the impact of public investment in irrigation has a greater impact on poverty and inequality than any other public policy. The second study of this type is Adam and Bevan (2004), which assumes that public infrastructure capital generates productivity spillovers for both tradeable and non-tradeable sectors. Using a CGE model designed for Uganda, they discuss the possible effect of different public investment policies on growth, trade, income and income distribution for different types of households in the country, and give evidence of how the poorest part of the population can end up worse off as a consequence of increased aid flows.

26
5 Lessons and challenges for research and policy-making As the preceding sections have shown, there is no lack of existing theories, evidence and methods that can inform policy-making and public investment choices. In this section we first outline some of the general lessons drawn from the review of the literature on both the macro- and micro-economic impacts of public investment (Section 5.1). We then discuss the relevance of the material contained in previous sections in the context of developing country policy processes, often characterised by low levels of capacity and high degrees of political interference (Section 5.2). Finally, we identify some priorities for future research (Section 5.3). 5.1 Lessons from the review of the literature There is a strong case in economic theory for governments in developing countries to implement sizeable public investment programmes to raise the rate of economic growth. Nevertheless, empirical evidence on the links between public investment and economic growth is somewhat inconclusive. Although there is more evidence that public capital is productive, in the sense that it complements private capital and other factors of production, there is a clear need for caution with the choice of the optimal investment level and allocation across sectors. The case for a rise in public investment needs to be assessed on a country-by-country basis, according to the structure of its economy and its initial physical public capital stock. There is no presumption that every single country is below its optimal level of public investment. From a technical viewpoint, cost-benefit analysis (CBA) remains the ideal method of determining the desirability of most types of public investment in any given country. For large investment programmes, this should incorporate the various possible indirect effects of investment, via a computable general equilibrium (CGE) model. This should be based on specific features of the country concerned and, as far as possible, on survey data. When implementing the approach, there are strong arguments that the overall yardstick by which public investments should be assessed is social welfare, not poverty (although the two are closely related). There are also good reasons for not using a distributional weighting system, although this decision needs to be made on a country-by-country basis. Above all, however, any weighting system used should be transparent and based on consultation between governments and their citizens. For some types of investment, however, CBA is not appropriate. This includes all those investments that provide outputs deemed by society to be basic human needs or rights. In such cases, the benefits of investment are self-evident and do not need to be measured in financial terms. The only relevant consideration in this case is choosing the least-cost method of meeting a given need or right. Deciding what levels of public services are to be deemed basic human needs or rights therefore has a critical bearing on investment appraisal. Cost-benefit analysis requires a significant amount of information to be carried out. Calculating the effects of price changes stemming from public investments requires information on household budget shares, firms’ costs shares, and econometric estimates of relevant demand and supply-side elasticities. Calculating the effects of a change in the provision of a public good or service typically requires additional survey-based information (e.g. contingent valuation studies), and further econometric analysis of the contribution of that good or service to firms’ or countries’ productivity. Therefore, there is a need for researchers to collect, estimate and disseminate such information in an accessible form, allowing policy-makers to implement, where possible, full cost-benefit and cost-effectiveness analyses. One suggestion would be to synthesise and bring together this material (on a country-by-country basis), with links to relevant studies and sets of notes to guide policy-makers as to how each particular piece of evidence would be used in a cost-benefit analysis.

27
However, resource and informational constraints mean that full cost-benefit analysis cannot always be carried out. What this means is that there is also a need for researchers to continue developing, refining and disseminating less information-intensive alternatives to full cost-benefit and cost-effectiveness analysis. Such approaches should come with an assessment of the likely magnitudes of error to which they may be subject; a good example of this practice is van de Walle and Gunewardena (2001). 5.2 Applicability in real-world policy processes One of the logical consequences of the highlighted theoretical and practical difficulties in applying existing methodologies for appraising alternative public investment choices is the existence of a ‘policy vacuum’, but one which does not prevent decisions from being taken. Decisions are left to be taken in the political realm, where competing interests and power struggles are often more important than rational approaches in influencing policy choices regarding public investment. The various ways in which political processes and realities can influence policy-making and investment decisions, however, reinforce rather than weaken the need to overcome the ‘basic budgeting problem’, by providing policy-makers with useful tools to design an optimal portfolio of investment. A recent survey of five African countries attempted to assess the extent to which Public Expenditure Management has been linked to poverty reduction policy goals (Foster et al., 2003). The study finds that, despite a great deal of political rhetoric, the commitment to poverty reduction in the case study countries is still quite fragile, as is the one to increased inclusiveness and participation in the policy process. This has led to uneven buy-in by governments in the design of Poverty Reduction Strategy Papers (PRSPs) to comply with HIPC requirements, and to limited use of research-based evidence and poverty analysis in the formulation of adopted policies. Moreover, the study highlighted that ‘fundamental improvements in budget preparation and implementation…are a fundamental precondition for ensuring that Governments can budget for poverty reduction’ (2003: xii). This includes improvements in policy analysis and evaluation, which provide the informational basis for sound decision-making around public investment alternatives. In a review of the non-economistic literature on policy-making institutions and budget processes, Fozzard (2001) distinguishes between ‘rationalist’ and ‘incrementalist’ approaches to policy-making. The rationalist approach is linked to traditions of development planning in developing countries, and to the existence of Public Investment Programmes (PIPs) and long-term development plans. In order to finance projects included in the PIPs, governments established development budgets, separate from recurrent budgets aimed at financing ongoing operations. Development plans and budgets fall under the overall responsibility of planning agencies separate from ministries of finance, in charge of screening and approving investment proposals. In more recent years, partly given the lack of effectiveness of PIP financing and implementation, and partly given the focus on stabilisation, the linkages between the planning and finance functions have been strengthened. This has often occurred in the form of Medium Term Expenditure Frameworks (MTEFs), aimed at reconciling a ‘top-down’ resource envelope with ‘bottom-up’ estimates of financing needs prepared by spending agencies. MTEFs are seen as the main policy link between PRSPs, which have often replaced development plans as the main government strategy documents, and yearly budgets. PRSPs provide the overall policy framework identifying investment priorities, whereas MTEFs are the instrument allowing for more careful planning of existing resources over a three to five year horizon, to be then transformed into budget allocations for implementation. In the rationalist approach, public investment choices are made within this broader framework, with proposals submitted by line agencies according to their sectoral plans, and central agencies in charge of verifying their overall consistency with general policy goals. Although large projects may undergo technical analysis, most are appraised solely on the basis of their policy relevance.

28
The incrementalist approach recognises the limited rationality of the actors involved in policy-making, and the intrinsically political nature of the budget process (Wildavsky, 1992). Allocation decisions are ultimately reached through a process of political bargaining, which may involve at any one time central agencies, line ministries, lobby groups, international agencies, political parties, civil society, etc. This process often promotes ‘incremental’ budgets, where bargaining is restricted to the distribution of additional resources, rather than allowing for the proper assessment of trade-offs between alternative proposals and claims for investment resources. According to such a view, information generated by policy analysis and evaluation is less likely to influence policy decisions. In many low-income country settings, a combination of rationalism and incrementalism would probably provide a good description of the budget process and of policy-making (Caiden and Wildavsky, 1990). Although it is difficult to generalise, anecdotal evidence suggests that characteristics of decision-making processes about public investment in poor, aid-dependent countries include:
a) There is very limited technical capacity within government to carry out detailed technical analysis, such as CBA or other methodologies for providing rational inputs into policy-making.
b) There exists an overall development plan in the form of a PRSP or similar strategy, which states broad policy objectives and investment priorities. However, the strategy has been formulated with heavy technical assistance inputs and donor support, and does not always have a strong link with medium-term and annual planning and budgeting cycles, making it difficult to implement public investment initiatives and to monitor and evaluate their impact.15
c) Detailed and reliable data necessary for technical analysis of investment alternatives are generally not available or are difficult to access, although donor-financed surveys and analyses are increasingly filling the gap.
d) Many public investment decisions are actually dictated by the discrete availability of donor financing for specific projects, rather than a part of a more complete resource allocation exercise carried out on the basis of an over-arching policy framework and within overall resource envelopes. Part of the reason for this is that internally mobilised resources only cover recurrent expenditure.
e) Most actual technical analysis taking place related to public investment is carried out by donors for donor-financed projects and marred by lack of data.
f) Policy-making is mostly characterised by incremental budgeting, by bidding for scarce budget resources by line agencies, and by using overall consistency with the general policy framework as the only appraisal criteria, with major investment decisions taken at cabinet level through political bargaining and not rational assessment of alternatives.
In such a situation, it is quite difficult to see how to put the theories, evidence and methods provided in this paper to good use. Current efforts in a number of countries are focusing on addressing these problems, through increased country ownership, strengthening more rational approaches to policy-making, and capacity-building both within and outside government. In the short-term, however, there are two main things that can be done to address the limitations of the current state of affairs and to promote improved guidance to policy-makers on making public investment choices. Firstly, current efforts at developing alternative methodologies which are less information intensive and which require lower technical capacity but can still generate useful insights and inputs for policy-making processes should be expanded. These could rely on different typologies of existing data, both quantitative and qualitative, and focus on building the capacity of government officials to gather and utilise necessary data. 15 For a review of issues related to PRSPs and planning and budgeting cycles, see Booth (2003), and Holmes and Evans (2003).

29
Secondly, the accessibility of existing data and information at country level should be improved, by supporting the creation of repositories of policy-relevant datasets, of existing studies and analyses of past expenditure trends and their impact on growth and poverty, and of realised CBAs for past investment projects, etc. This should include the design and production of easy-to-access notes and documents to be utilised by policy-makers to inform decisions regarding public investment options, highlighting the existing state of knowledge within the country and selected findings from comparable country situations. Moreover, these easy-to-access notes should highlight existing and potential trade-offs, both within and across sectors, and in terms of inter-temporal choices to which the existing evidence points. 5.3 Directions for future research The discussions in this paper further point to a set of issues that could be addressed by additional research, to complement existing findings and to increase knowledge on policy choices around public investment for poverty reduction. The main directions for future research can be grouped into two categories. The first category relates to the methods used to assess public investment choices, including their financing. The second concerns understanding the dynamics of policy-making processes, to ascertain that information and methodologies are better suited at providing relevant inputs for ensuring the poverty orientation of public investment choices. 5.3.1 Improving methods for assessing public investment Concerning policy design tools, it appears that the use of general equilibrium models is not sufficiently recognised in the literature. These models, as explained in Section 3.3, are potentially very valuable to understand the economic mechanisms that occur as a result of public investments, especially to understand their impact on poverty and income distribution. However, a proper use of such models requires a prior empirical assessment of public investment returns or of its impact on the production process. The extent to which the literature actually offers such an empirical assessment is however relatively limited (due essentially to data availability) and it would be extremely valuable to develop more work in that field. More efforts should be undertaken to link the impact of public investment to:
• the kind of investment that is engaged; • the country, if not the region, in which the investment is implemented; and • the initial stock and initial context.
Road network development, for example, would probably not have the same effect in South Africa and Mali, and it does not only mean that the total-factor productivity change would be different, but also that the impact on the production systems would differ. The initial provision of public infrastructure or capital stock is then a determinant of the economic impact of investment. The lack of roads could be a major impediment to the functioning of markets, or it could simply generate higher transport costs. Similarly, while both capital and labour productivity would be affected in most sectors in Mali, it is less likely to be the case in the South African context. Therefore, the impact should be modelled and assessed in the specific case of each country, taking into account the initial provision of public capital, its regional distribution and the particular economic context. Similarly, estimating the returns to investment in agriculture is generally problematic due to the lack of data. However, it would be extremely valuable to analyse the various impacts of different investment strategies in this sector. Firstly, because it is the sector that the poorest part of the population are generally most dependent on to survive, and secondly, because rural policies have

30
been identified as sources of pro-poor growth by many studies on developing countries. The benefit of such research would complement the debate on public investment, and generate evidence for strategies whose aims include a reduction in food dependency, economic development, the reduction of inequality and identification of pro-poor growth policies. CGE models are also potentially extremely useful to assess how to finance public investment policies, and to analyse which fiscal policies induce less economic distortions. They also help in understanding the economic impact of policies, with a specific focus on poverty, as they take into account feed-back effects and the different economic links between agents. It is also crucial, to design a proper investment strategy, that the initial country context is understood and integrated properly into the general equilibrium framework, in order to take into account country specificities. As previously discussed, except for Adam and Bevan (2004), and Levy (2006), there are, to the best of our knowledge, no studies that integrate such considerations, especially not into a general equilibrium framework. The use of general equilibrium frameworks would also enable examination of some research topics which, up until today, have received little attention. These include:
a) The trade-offs and complementarities (inter-sectoral, inter-temporal, inter-regional, etc.) among different investment portfolios, in order to assess what investment portfolios generate the greatest impact in terms of poverty reduction and growth. The synergy between different investments deserves particular attention.
b) Developing regional models, i.e. to test the impact of transport networks or more generally the cross-country implications of other public investment opportunities at regional level.
c) Using CGEs to test different assumptions concerning public investment impact on the production process. The same public investment could therefore be analysed adopting different theoretical assumptions; one being that public capital is a production factor (which will then be included in the relevant production function together with other production factors); the other being that the level of technology, or total factor productivity in a given sector depend on public capital. In the case of CES production functions (which are the more generic ones) both assumptions might generate quite different effects.
d) It would also be particularly relevant to test ‘threshold effects’ that could affect the effectiveness of different investment choices, determining some initial conditions that may need to be reached before public investment can have its intended impact.
5.3.2 Improving understanding of policy-making processes Much of the theoretical and methodological discussions included in this paper have been promoted without taking proper account of some of the issues raised in Section 5.2. It is important to keep in mind that the assessment of pro-poor public investment and the design of adequate policies will not be of much use if the information and research results are not integrated within decision-making processes. For this reason, it is essential to understand how low-income country governments actually use such information. How much actual use is made of the different methodologies and sources of evidence described in this paper? Do governments follow a more ‘rationalist’ or a more ‘incrementalist’ approach to policy-making and investment decisions? How does research contribute to a more rational approach to policy-making – in other words, one in which decisions are taken on the basis of evidence, analysis and appraisal? This set of questions still needs to be answered and should certainly be part of further research, to complement the other priorities suggested above.

31
References Aaron, H. and McGuire, M. (1970) ‘Public Goods and Income Distribution’, Econometrica 38 (6):
907–20. Adam, C. and Bevan, D. (2004) Uganda : Aid, Public Expenditure and Dutch Disease, Development
and Comp System, Economic Working Paper. Alberini, A. and Cooper, J. (2000) Applications of the Contingent Valuation Method in Developing
Countries: A Survey, FAO Economic and Social Development Paper 146[FAO]. Rome. Aschauer, D. (1989) ‘Is Public Expenditure Productive?’, Journal of Monetary Economics 23: 177–
200. Aschauer, D. (2000) ‘Public Capital and Economic Growth: Issues of Quantity, Finance and
Efficiency’, Economic Development and Cultural Change 48 (2): 391–406. Barro, R. (1974) ‘Are Government Bonds Net Wealth?’, Journal of Political Economy 81: 1095–
117. Barro, R. (1990) ‘Government Spending in a Simple Model of Endogenous Growth’, Journal of
Political Economy 98 (5): S103–S125. Barro, R. (1991) ‘Economic Growth in a Cross-section of Countries’, Quarterly Journal of
Economics 106 (2): 407–43. Binswanger, H. P., Khandler, S. R. and Rosenzweig, M. R. (1993) How Infrastructure and Financial
Institutions Affect Agricultural Output and Investment in India, Journal of Development Economics 41: 337-66.
Booth, D. (ed.) (2003) Fighting Poverty in Africa: Are PRSPs Making a Difference? London: Overseas Development Institute.
Bourguignon, F. (2004) An Economy-Wide Framework for Monitoring the MDGs. Presentation to Africa PREM Day. Washington, DC: World Bank, 29 April.
Bourguignon, F. and da Silva, P. (2003) The Impact of Economic Policies on Poverty and Income Distribution: Evaluation Techniques and Tools. Washington, DC: World Bank.
Brennan, G. (1976) ‘The Distributional Implications of Public Goods’, Econometrica 44 (2): 391–9. Caiden, N. and Wildavsky, A. (1990) Planning and Budgeting in Poor Countries. London:
Transaction Publishers. Calderon, C. and Serven, L. (2004) The Effects of Infrastructure Development on Growth and
Income Distribution. Policy Research Working Paper 3400. Washington, DC: World Bank. Canning, D. (1999) The Contribution of Infrastructure to Aggregate Output. Policy Research
Working Paper 2246. Washington, DC: World Bank. Canning, D. and Pedroni, P. (1999) Infrastructure and Long-run Economic Growth. Discussion
Paper 57. Boston: Harvard Institute for International Development, Consulting Assistance on Economic Reform.
Canning, D. and Bennathan, E. (2000) The Social Rate of Return on Infrastructure Investments. Policy Research Working Paper 2390. Washington, DC: World Bank.
Chen S. and Ravallion, M. (2003) Household Welfare Impacts of China’s Accession to the World Trade Organisation. Policy Research Working Paper 3040. Washington, DC: World Bank.
Cornes, R. (1992) Duality and Modern Economics. Cambridge: Cambridge University Press. Cornes, R. (1995) ‘Measuring the Distributional Impact of Public Goods’, Chapter 4 in D. van de
Walle and K. Nead (eds) Public Spending and the Poor: Theory and Evidence. London: Johns Hopkins University Press.
Datt, G. and Ravallion, M. (2002) ‘Is India’s Economic Growth Leaving the Poor Behind?’, Journal of Economic Perspectives 16 (3): 89–108.
Deaton, A. (1997) The Analysis of Household Surveys: A Microeconometric Approach to Development Policy. London: Johns Hopkins University Press.
Deaton, A. (2001) ‘Counting the World’s Poor: Problems and Possible Solutions’, The World Bank Research Observer 16 (2): 125–47.

32
Deaton, A. (2003) ‘How to Monitor Poverty for the Millennium Development Goals’, Journal of Human Development 4 (3): 353–78.
Deininger, K. and Okidi, J. (2003) ‘Growth and Poverty Reduction in Uganda, 1992–2000: Panel Data Evidence’, Development Policy Review 21 (4): 481–509.
Demery, L. (2000) Benefit Incidence: A Practitioner’s Guide. Washington, DC: World Bank. Dessus, S. and Herrera, R. (1996) Le Rôle du Capital Public dans la Croissance des pays en
Développement au cours des Années 80, Documents Techniques de l'OCDE 115. Devarajan, S., Swaroop, V. and Zou, H. (1996) ‘The Composition of Public Expenditure and
Economic Growth’, Journal of Monetary Economics 37: 313–44. DFID (2004) What is Pro-poor Growth and Why do we Need to Know? Pro-poor Growth Briefing
Note 1. London: DFID. Easterly, W. (2001) The Elusive Quest for Growth: Economists’ Adventures and Misadventures in
the Tropics. London: MIT Press. Easterly, W. and Rebelo, S. (1993) ‘Fiscal Policy and Economic Growth: An Empirical
Investigation’, Journal of Monetary Economics 32: 417–58. Fan, S., Hazell, P. and Thorat, S. (1999) Linkages Between Government Spending, Growth and
Poverty in Rural India. Research Report 110. Washington, DC: IFPRI. Fan, S., Zhang, L. and Zhang, X. (2002) Growth, Inequality and Poverty in Rural China: The Role
of Public Investments. Research Report 125. Washington, DC: IFPRI. Fan, S., Jitsuchon, S. and Methakunnavut, N. (2004a) The Importance of Public Investment for
Reducing Rural Poverty in Middle-Income Countries: The Case of Thailand. DSGD Discussion Paper 7. Washington, DC: IFPRI.
Fan, S., Zhang, X. and Rao, N. (2004b) Public Expenditure, Growth and Poverty Reduction in Rural Uganda. DSGD Discussion Paper 4. Washington, DC: IFPRI.
Ferroni, M. and Kanbur, R. (1990) Poverty-conscious Restructuring of Public Expenditure. Social Dimensions of Adjustment in Sub-Saharan Africa Working Paper No.9. Washington, DC: World Bank.
Foster, M.; Fozzard, A.; Naschold, F. and Conway, T. (2003) How, When and Why does Poverty get Budget Priority: Poverty Reduction Strategy and Public Expenditure in Five African Countries. Working Paper 168. London: ODI.
Fozzard, A. (2001) The Basic Budgeting Problem: Approaches to Resource Allocation in the Public Sector and their Implications for Pro-poor Budgeting. Working Paper 147. London: ODI.
Fujita, M., Krugman, P. and Venables, A. (2001) The Spatial Economy: Cities, Regions and International Trade. London: MIT Press.
Gomanee, K.; Morrissey, O.; Mosley, P. and Verschoor, A. (2003) Aid, Pro-poor Government Spending and Welfare. CREDIT Research Paper 3. Nottingham: University of Nottingham, CREDIT.
Gramlich, E. (1994) ‘Infrastructure Investment: A Review Essay’, Journal of Economic Literature 32: 1176–96.
Hausmann, R., Pritchett, L. and Rodrik, D. (2004) Growth Accelerations. Working Paper 10566. Cambridge, MA: NBER.
Holmes, M. and Evans, A. (2003) A Review of Experience in Implementing Medium Term Expenditure Frameworks in a PRSP Context: A Synthesis of Eight Country Studies. London: ODI.
Hurlin, C. (1999) ‘La Contribution Productive du Capital Public à la Croissance: Estimation sur un Panel Sectoriel de dix pays de l‘OCDE’, Economie et Prévision 137: 49-66.
Johansson, P. (1987) The Economic Theory and Measurement of Environmental Benefits. Cambridge: Cambridge University Press.
Lensink, R. and White, H. (2001) ‘Are there Negative Returns to Aid?’, Journal of Development Studies 37 (6): 42–65.
Levine, R. and Renelt, D. (1992) ‘A Sensitivity Analysis of Cross-country Growth Regressions’, American Economic Review 82 (4): 942–63.

33
Levy, S., (2006) ‘Public Investment to Reverse Dutch Disease: The Case of Chad’, Journal of African Economies (forthcoming).
Little, I. and Mirrless, J. (1994) ‘The Costs and Benefits of Analysis: Project Appraisal and Planning Twenty Years on’, Chapter 6 in R. Layard and S. Glaister, Cost Benefit Analysis. Cambridge: Cambridge University Press.
Lofgren, H., Robinson, S. and El-Said, M. (2003) ‘Poverty and Inequality Analysis in a General Equilibrium Framework: The Representative Household Approach’, Chapter 15 in F. Bourguignon and L. da Silva (eds), The Impact of Economic Policies on Poverty and Income Distribution: Evaluation Techniques and Tools. New York: Oxford University Press.
McCulloch, N. (2003) The Impact of Structural Reforms on Poverty: A Simple Methodology with Extensions. Policy Research Working Paper 3124. Washington, DC: World Bank.
Milbourne, R., Otto, G. and Voss, G. (2003) ‘Public Investment and Economic Growth’, Applied Economics 35: 527–40.
Mitchell, R. and Carson, R. (1989) Using Surveys to Value Public Goods: The Contingent Valuation Method. Washington, DC: Resources for the Future.
Mitra, A., Varoudakis, A. and Veganzones, M.-A. (1998) ‘Croissance de la Productivité et Efficacité Technique dans L'industrie Manufacturière des Etats de l'Inde. Le Rôle des Infrastructures’, Revue Economique, 49 (3): 845–55.
Mosley, P., Hudson, J. and Verschoor, A. (2004) ‘Aid, Poverty Reduction and the “New Conditionality”’, Economic Journal 114, June: F217–F243.
Norton, A. (2001) A Rough Guide to PPAs. London: ODI. Osmani, S. (2005) Defining Pro-poor Growth. One-pager 9. New York: UNDP, International
Poverty Centre. Paternostro, S., Rajaram, A. and Tiongson, E. R. (2005) How Does the Composition of Public
Spending Matter? Policy Research Working Paper 3555. Washington, DC: World Bank. Pernia, E. (2003) Pro-poor Growth: What is it and how is it Important? ERD Policy Brief 17.
Manila: Asian Development Bank. Pritchett, L. (2000) ‘The Tyranny of Concepts: CUDIE (cumulated, depreciated, investment effort)
is not Capital’, Journal of Economic Growth 5: 361–84. Ravallion, M. (2001) ‘Comment on Counting the World’s Poor: Problems and Possible Solutions
by Angus Deaton’, The World Bank Research Observer 16 (2): 149–56. Ravallion, M. (2004) Defining Pro-poor Growth: A Response to Kakwani. One-pager No.4.
Brasilia: International Poverty Centre. Ravallion, M. and Chen, S. (2003) ‘Measuring Pro-poor Growth’, Economics Letters 78: 93–9. Sahn, D. and Younger, S. (2000) ‘Expenditure Incidence in Africa: Microeconomic Evidence’,
Fiscal Studies 21 (3): 329–47. Sala-i-Martin, X. (1997) ‘I Just Ran Two Million Regressions’, American Economic Review 87 (2):
178–83. Sanchez-Robles, B. (1998) ‘Infrastructure Investment and Growth: Some Empirical Evidence’,
Contemporary Economic Policy 16: 98–108. Schwartz, G. and Ter-Minassian, T. (2000) ‘The Distributional Effects of Public Expenditure’,
Journal of Economic Surveys 14 (3): 337–58. Sen, A. (1972) ‘Feasibility Constraints: Foreign Exchange and Shadow Wages’, Economic Journal
82: 486–501. Squire, L. and van der Tak, H. (1975) Economic Analysis of Projects. Baltimore: Johns Hopkins
University Press. Sundberg, M., Lofgren, H. and Bourguignon, F. (2005) Absorptive Capacity and Reaching the
MDGs: The Case of Ethiopia. Paper presented at IMF Seminar on Foreign Aid and Macroeconomic Management, Maputo, Mozambique, 14-15 March.
UNDP International Poverty Centre (2004) ‘Dollar a Day: How Much Does it Say?’, In Focus September. Brasilia: International Poverty Centre.

34
UN Millennium Project (2005) Investing in Development: A Practical Plan to Achieve the Millennium Development Goals. London: Earthscan.
van de Walle, D. (1998) ‘Assessing the Welfare Impacts of Public Spending’, World Development 26 (3): 365–79.
van de Walle, D. (2000) Choosing Rural Road Investments to Help Reduce Poverty. Policy Research Working Paper 2458. Washington, DC: World Bank.
van de Walle, D. and Nead, K. (1995) Public Spending and the Poor: Theory and Evidence. London: Johns Hopkins University Press.
van de Walle, D. and Gunewardena, D. (2001) ‘Does Ignoring Heterogeneity in Impacts Distort Project Appraisals? An Experiment for Irrigation in Vietnam’, World Bank Economic Review 15 (1): 141–64.
Weisbrod, B. (1972) ‘Deriving an Implicit Set of Governmental Weights for Income Classes’, in R. Layard (ed.), Cost-Benefit Analysis. London: Penguin.
Wildavsky, A. (1992) The New Politics of the Budgetary Process, 2nd ed. New York: Harper Collins.
Wilhelm, V. and Fiestas I. (2005) ‘Exploring the Link Between Public Spending and Poverty Reduction: Lessons from the 90s’, mimeo. Washington, DC: World Bank Institute.
World Bank (2002) A Sourcebook for Poverty Reduction Strategies, Vol. I: Core Techniques and Cross-Cutting Issues. Washington, DC: World Bank.
Zepeda, E. (2004) Pro-poor Growth: What is it? One-pager 1. New York: UNDP, International Poverty Centre.