the role of phase changes on the thermodynamics...
TRANSCRIPT

The Role of Phase Changes on the Thermodynamics and Mechanics
of Impact Cratering in H2O IceSarah T. Stewart
Department of Earth and Planetary ScienceHarvard University
Hypervelocity Impact Symposium Plenary Lecture, April 14, 2010
Acknowledgments Laurel E. Senft, Richard G. KrausAndrew W. Obst, Achim Seifter
Thomas J. AhrensHarvard 40 mm gun
Herschel crater(130 km), Mimas
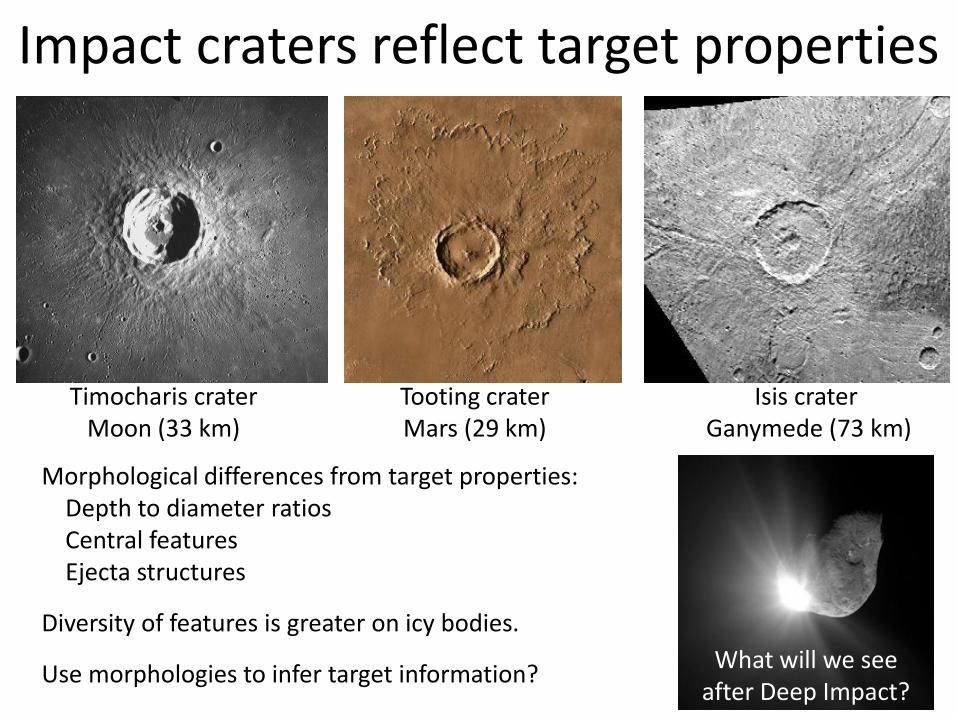
Impact craters reflect target properties
Isis craterGanymede (73 km)
Tooting craterMars (29 km)
Timocharis craterMoon (33 km)
Morphological differences from target properties:Depth to diameter ratiosCentral featuresEjecta structures
Diversity of features is greater on icy bodies.
Use morphologies to infer target information?What will we see
after Deep Impact?

Need to understand the many pieces of the messy cratering process
Assuming we know the impact conditions and target composition……
Shock thermodynamicsEquation of state
temperature field; phase changes
Mixtures/heterogeneity
Cratering mechanicsConstitutive relations; fracturing
Phases; mixtures Gula and Achelous, Ganymede (40 km)

H2O Phase Diagram
Why is ice so complicated?So many polymorphs!
Phase changes on shock loading and unloading.
At least 12 stable phases known.
At least 9 metastablephases known (Ic, IV, IX, LDA, HDA, V-HDA, VII’, XII, XIV).
Figure modified from Petrenko & Whitworth
Ice
XV
Triple point 612 Pa, 273 K
Critical point22 MPa, 647 K

Shock Hugoniot measurements in ice
Time (μs)
Part
icle
Vel
oci
ty (
m/s
)
HEL (0.6 GPa)
Ice Ih (1.2 GPa)
Ice VI(1.5 GPa)
Faraday’s Law: induced voltage V = B L up
voltage particle velocity stress
3-wave structure in 100 K H2O Ice
Stewart & Ahrens 2003, 2005
L

5 regions on the ice Hugoniot
T0=263 K dashed line; T0=100 K solid line Stewart & Ahrens 2003, 2005
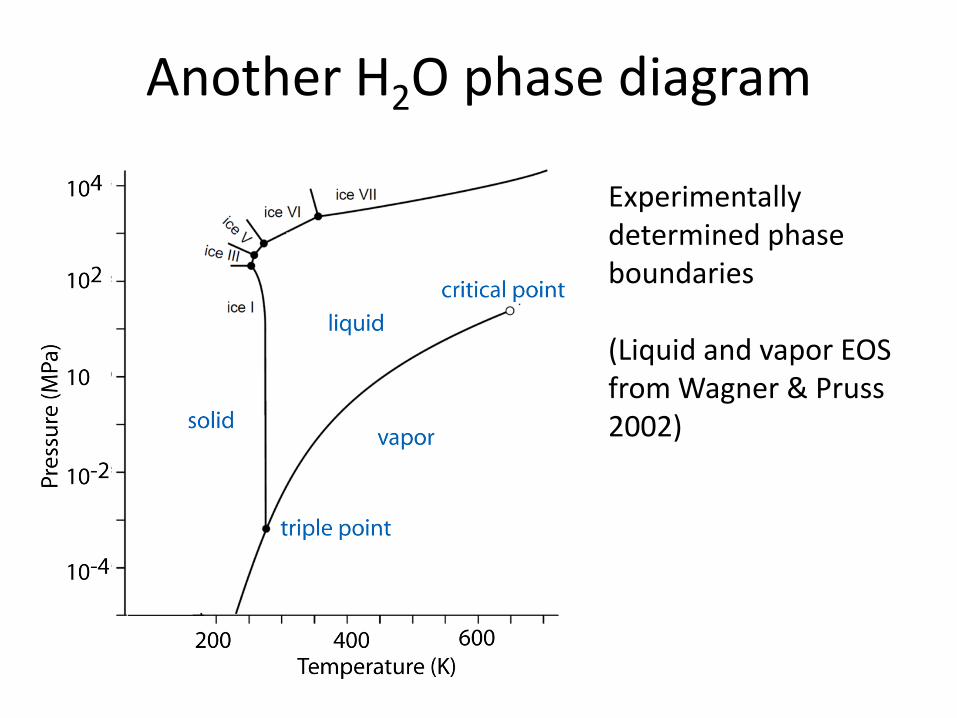
Another H2O phase diagram
Experimentally determined phase boundaries
(Liquid and vapor EOS from Wagner & Pruss2002)

H2O Ice Hugoniots
5 regions on the Hugoniot
Low and high temperature (100 & 263 K) ice Hugoniots are different
Some low temperature, low pressure phases (ices II, III, V) excluded by strength

H2O Ice Hugoniots
What happens on release?
Shock-induced melting & vaporization
Want to model impact cratering in ice
Need a full model EOS

The 5-Phase H2O EOSTabular EOS
P, E, S on a ρ-T gridSenft & Stewart 2008
Liquid & Vapor
Wagner & Pruss 2002 (NIST)
Ice Ih
Feistel & Wagner 2006
Ice VI and VII
Stewart & Ahrens 2005
Good match to P-V Hugoniotsfor liquid, ice, porous ice

Shock Temperature ExperimentsPyrometry on polycrystalline H2O iceand an ice-quartz mixture
Shock pressure calculated from impedance match solution.~1 millitorr in sample chamber.Driver cooled to ~165 K.
Harvard 40-mm gas & powder gun
Stewart, Seifter, & Obst2008Kraus, Stewart, Seifter, & Obst 2010

Shock front emissivity and radiance fitted using method of Boslough 1985 and Luo et al. 2004.
Radiance Data on Shocked Ice

Shock Temperatures and 5-Phase EOS
Excellent agreement between model and data.
Fluid region
Ices VI and VII
1-sigma error bars

Shock Temperatures and 5-Phase EOS
Release temperatures much higher than expected……

Full release time scale depends on volume expansion rate.
Post-shock temperatures lie on saturation vapor curve
Stewart, Seifter, & Obst 2008

Phase changes during uniaxial decompression
targetflyer plate
driver Uniaxial release of shocked H2O
Maximum decompression determined by inertia in the flow (stuck at vapor curve)
Only leading edge fully decompresses (optically thin and colder)
Decompression depends on the expansion rate (and geometry)

Uniaxial release of shocked H2O
Maximum decompression determined by inertia in the flow (stuck at vapor curve)
Only leading edge fully decompresses (optically thin and colder)
Decompression depends on the expansion rate (and geometry)
targetflyer plate
driver
(ignoring edge effects)
Phase changes during uniaxial decompression

Derived criteria for shock-induced melting and vaporization for any initial P & T using the entropy method.
Temperatures validate entropy in the EOS
Stewart, Seifter, & Obst 2008

Back to impact cratering……
From the lab work:
- improved understanding of shock-induced phase changes
- improved model EOS
Need modeling for:
- volumes of melt & vapor
- crater formation
- final temperature fieldSteinheim crater, Mars (10 km)

Volume of melt and vapor depends on impact conditions and pressure decay profile
90o 45o 30o
12 km/s
25 km/s
65 km/s
Kraus & Stewart, in prep.
CTH code calculations of shock pressure at each initial position using 5-Phase EOS.

Scaling laws for melt and vaporizationMmelt
Mprojectile
= F (impact velocity, angle, porosity, temperature)
Good news:
Mmelt is within a factor of 2 for full range of angle, porosity, and temperature
Close to energy scaling (Bjorkman and Holsapple, 1987)
Bad (interesting?) news:
Up to a factor of 10 difference depending on the thermodynamics in a mixture
Kraus & Stewart, in prep.
Pressure decay profile sensitive to phase changes
Ice on ice impact at 25 km/s
(Turtle & Pierazzo 2001)
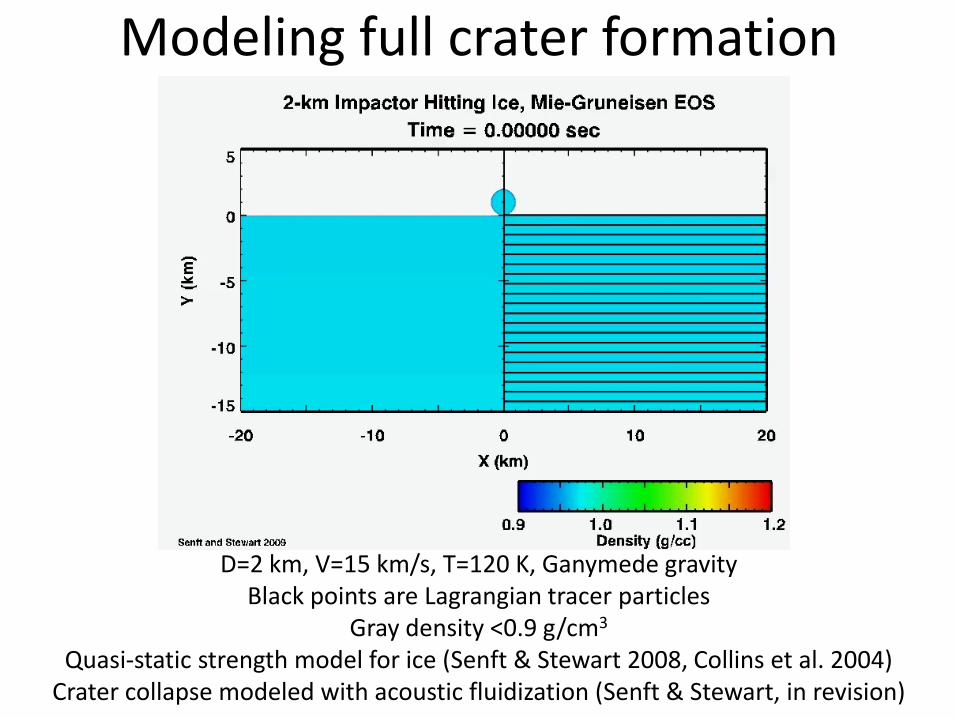
Modeling full crater formation
D=2 km, V=15 km/s, T=120 K, Ganymede gravityBlack points are Lagrangian tracer particles
Gray density <0.9 g/cm3
Quasi-static strength model for ice (Senft & Stewart 2008, Collins et al. 2004)Crater collapse modeled with acoustic fluidization (Senft & Stewart, in revision)

Crater formation using 5-Phase EOS
D=2 km, V=15 km/s, T=120 K, Ganymede gravity40 km diameter final crater

5-Phase EOS
2.5 s
20 s
65 s
400 s
40 km
Simple single phase EOS

Crater formation using 5-Phase EOS
D=2 km, V=15 km/s, T=120 K, Ganymede gravity40 km diameter final crater
(Senft & Stewart, in revision)

Phase changes in ice leads to discontinuous excavation
Ice is shocked to different phases with distance from impact
Different unloading paths leads to a discontinuity in material velocities
Most highly shocked material is slower –it is concentrated within the collapsing crater
Shock-induced phase changes modify the dynamics of excavation flow
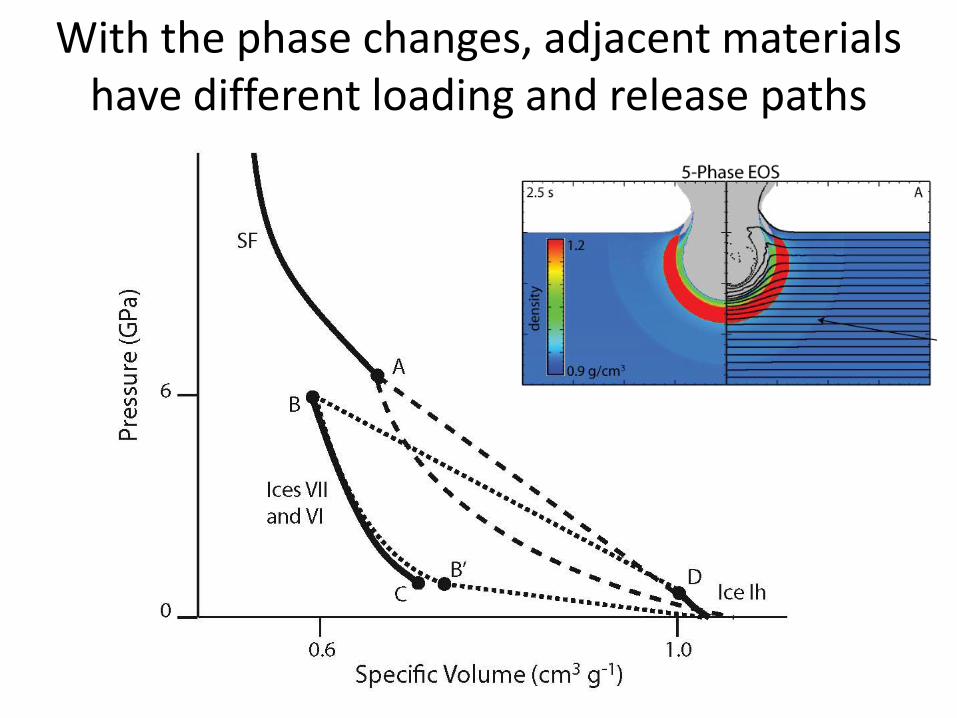
With the phase changes, adjacent materials have different loading and release paths

Central feature is a product of phase changesIce at the melting point is concentrated in crater floor

Example thermodynamic pathsShocked to ice VI Shocked to supercritical fluid
Material is in the ‘hot plug’
Material is in the ‘central plug’
Color indicates time

Is there observational support for discontinuous excavation?
D=73 km D=64 km D=62 km
Central pit craters on Ganymede and Callisto

Hot plug diameter and size range agree with central pit crater observations
Discontinuous excavation not significant in small craters (small volume shocked to high pressure solid phases); larger craters influenced by subsurface ocean.
(Alz
ate
& B
arlo
w 2
00
9, s
ub
mit
ted
)
Observed size range
Rat
io o
f h
ot
plu
g w
idth
to c
rate
r d
iam
eter
Crater diameter (km)

Discontinuous excavation and the origin of central pit/dome craters?
Width of hot plug is same as central pits
Size range of craters with hot plugs same as central pits (about 25-150 km diameter)
Pits observed on Callisto & Ganymede but not other icy satellites (resurfacing or not enough melted material)
Expect variations with impact velocityLess melt at very low and very high impact velocities
(Do not expect central pits on Pluto)
Hot plug evolution into a pit/dome is TBD (e.g., hydrologic model presented at LPSC 2010 by Elder et al.)
Want lab verification (in progress)

Conclusions• H2O is full of surprises!• Importance of phase changes on loading
and release• Laboratory data + modeling led to discovery of a new phenomena:
discontinuous excavation– Phase transitions change the dynamics of impact cratering
• Discontinuous excavation leads to hot plug in crater floor– Hot plug characteristics similar
to central pit craters– Most of the melt is concentrated
in the plug
• Starting to be able to infer gross target properties from impact craters
What else are we missing by an incomplete understanding of phase changes?Need more exploration in the lab.
This work was supported by NASA.
Europa Ganymede Callisto