the role of oxidative stress in the pathogenesis of ... · the role of oxidative stress in the...
TRANSCRIPT

Wayne State University
Wayne State University Dissertations
1-2-2013
The Role Of Oxidative Stress In The PathogenesisOf Epithelial Ovarian CancerNicole Marie KingWayne State University,
Follow this and additional works at: http://digitalcommons.wayne.edu/oa_dissertations
Part of the Biology Commons, and the Physiology Commons
This Open Access Dissertation is brought to you for free and open access by DigitalCommons@WayneState. It has been accepted for inclusion inWayne State University Dissertations by an authorized administrator of DigitalCommons@WayneState.
Recommended CitationKing, Nicole Marie, "The Role Of Oxidative Stress In The Pathogenesis Of Epithelial Ovarian Cancer" (2013). Wayne State UniversityDissertations. Paper 776.

THE ROLE OF OXIDATIVE STRESS IN THE PATHOGENESIS OF EPITHELIAL OVARIAN CANCER
by
NICOLE MARIE FLETCHER-KING
DISSERTATION
Submitted to the Graduate School
of Wayne State University,
Detroit, Michigan
in partial fulfillment of the requirements
for the degree of
DOCTOR OF PHILOSOPHY
2013
MAJOR: PHYSIOLOGY
Approved by:
_________________________________________ Advisor Date
_________________________________________
_________________________________________
_________________________________________
_________________________________________

© COPYRIGHT BY
NICOLE MARIE FLETCHER-KING
2013
All Rights Reserved

ii
DEDICATION
This dissertation is dedicated to my loving husband Michael, and our son Ethan who light
up my life and inspire me to do my best every single day. I would also like to dedicate this work
to my parents who supported my passion for science from an early age and pushed me to pursue
my dreams, to my sister and best friend, Erika, and to my brother Stephen, for their love and
unequivocal support throughout. Also, to my mother, father, and brother-in-law who are
overwhelmingly supportive and loving.

iii
ACKNOWLEDGEMENTS
Many people have been there to support me and make this dissertation possible. I am
most grateful to my advisor, Dr. Ghassan Saed, for his guidance and support and for providing
me with an excellent environment for doing research over the past several years. He has
provided me the opportunity to become a well-rounded individual and set me on a path of
success as an independent scientific investigator. He pushed me to do my best and work hard
and I am forever grateful.
I would never have been able to finish my dissertation without the direction of my
committee members, Dr. Maik Hütteman, Dr. James Rillema, Dr. Aissa Shisheva, and Dr. Debra
Skafar. You have provided valuable insight and constructive criticism. Additionally, I would
like to thank all of you for the knowledge I have gained from you as instructors during my
coursework.
In addition to my advisor and committed members, I am extremely grateful for the
guidance and support from Dr. Michael Diamond and Dr. Husam Abu-Soud. Both have been
there for me and helped me develop my skills and knowledge as a researcher. I also appreciate
the training I received from Dr. Zhongliang Jiang. He provided me with the basic laboratory
skills as well as continued advice and support in the laboratory.
I would also like to thank Christine Cupps for being there for me when I needed to talk as
well as assisting me throughout my career as a graduate student. She is an invaluable asset to the
physiology graduate students and I am grateful for everything she has done. Lastly, over the
course of my time as a graduate student, I have made many friends in the program that I would
like to acknowledge for their continuous support throughout this endeavor.

iv
TABLE OF CONTENTS
Dedication ii
Acknowledgements iii
List of Tables vi
List of Figures vii
List of Abbreviations ix
CHAPTER I. Introduction and Background 1
CHAPTER II. General Methods 8
CHAPTER III. Characterization of the Oxidative Stress Profile in Epithelial Ovarian Cancer 13
Approach 13
Introduction 13
Methods 15
Results 17
Discussion 24
CHAPTER IV. Modulation of Redox Signaling Promotes Apoptosis in Eepithelial Ovarian Cancer Cells 29
Approach 29
Introduction 30
Methods 32
Results 35
Discussion 44
CHAPTER V. Myeloperoxidase and Free Iron Levels: potential biomarkers for early detection and prognosis of ovarian cancer 50
Approach 50
Introduction 50

v
Methods 53
Results 57
Discussion 60
CHAPTER VI. A NAD(P)H Oxidase Single Nucleotide Polymorphism is Associated with an Increased Risk of Ovarian Cancer 64
Approach 64
Introduction 65
Methods 66
Results 67
Discussion 69
CHAPTER VII. Summary, Conclusions and Future Directions 73
Appendix 74
References 76
Abstract 105
Autobiographical Statement 109

vi
LIST OF TABLES
Table 1. Sequences of the oligonucleotides and PCR cycle information used for real-time RT-PCR 9
Table 2. Descriptive statistics for age including Mean, Median, and Standard deviation, n=30 53
Table 3. Comparative study of the cases and control based on cancer status 54

vii
LIST OF FIGURES
Figure 1. Summary of oxidants and antioxidants examined in this study 3
Figure 2. Immnunohistochemical staining of iNOS and MPO in normal and EOC tissue sections 18
Figure 3. Co-localization of MPO and iNOS to the same cells in EOC cells 18
Figure 4. Immunohistochemical staining of NAD(P)H oxidase in normal and EOC tissue sections 19
Figure 5. Nitrate/nitrite levels in EOC as compared to HOSEpiC cells 20
Figure 6. CAT mRNA and activity levels in EOC as compared to HOSEpiC cells 21
Figure 7. SOD activity levels in EOC as compared to HOSEpiC cells 21
Figure 8. GSR mRNA and activity levels in EOC as compared to HOSEpiC cells 22
Figure 9. GPX mRNA and activity levels in EOC as compared to HOSEpiC cells 23
Figure 10. GSTp1 mRNA levels in EOC as compared to HOSEpiC cells 24
Figure 11. Summary of oxidant and antioxidant markers in epithelial ovarian cancer as compared to normal ovarian tissues and normal ovarian surface epithelial cells 24
Figure 12. Real-time RT-PCR for MPO and iNOS in EOC cells following siRNA knockdown of either iNOS or MPO 36
Figure 13. Nitrate/nitrite levels in EOC cells following siRNA knockdown of either iNOS or MPO 37
Figure 14. Caspase-3 S-Nitrosylation in EOC Cells following siRNA knockdown of either iNOS or MPO 38
Figure 15. Caspase-3 activity and TUNEL staining for apoptosis in EOC cells following siRNA knockdown of either iNOS or MPO 39
Figure 16. Real-time RT-PCR for NAD(P)H oxidase in EOC cells following inhibition of NAD(P)H oxidase 40
Figure 17. (A) Caspase-3 activity and (B) apoptosis in EOC cells following inhibition of NAD(P)H oxidase 41
Figure 18. HIF-1α levels in EOC cells following inhibition of NAD(P)H oxidase 42
Figure 19. SOD3 levels in EOC cells following inhibition of NAD(P)H oxidase 44

viii
Figure 20. Summary of the effect of modulating oxidative stress in EOC cell lines, SKOV-3 and MDAH-2774 45
Figure 21. Tissue MPO 57
Figure 22. Serum MPO 58
Figure 23. Tissue free iron 59
Figure 24. Serum free iron 60
Figure 25. Frequency of NAD(P)H oxidase SNP in EOC 68
ix
LIST OF ABBREVIATIONS
ATCC: American Type Culture Collection
AGTC: Applied Genomics Technology Center
Ac-DEVD-pNA: Acetyl-DEVD-р-nitroaniline
CA-125: Cancer antigen-125
CHTN: Cooperative Human Tissue Network
DPI: Diphenyleneiodonium
EOC: Epithelial ovarian cancer
FBS: Fetal bovine serum
γ-GCS γ-glutamylcysteine synthetase
GSH: Glutathione
GSSG: Glutathione disulfide
GSR: Glutathione reductase
GST: Glutathione s-transferase
GWAS: Genome-wide association studies
HE4: Human epididymis protein
H2O2: Hydrogen peroxide
HOCl: Hypochlorous acid
HIF-1α: Hypoxia inducible factor
HGSOC: High grade serous ovarian carcinoma
HOSEpiC: Human ovarian surface epithelial cells
iNOS: Inducible nitric oxide synthase
KCIGR: Karmanos Cancer Institute’s Genetic Registry
MPO: Myeloperoxidase

x
NAD(P)H: Nicotinamide adenine dinucleotide phosphate
NO3-: Nitrate
NO2-: Nitrite
NO: Nitric oxide
NOS: Nitric oxide synthase
N2O3: Dinitrogen trioxide
NOX: NAD(P)H oxidase
ONOO-: Peroxynitrite
pNA: p-nitroaniline
PPV: Positive predictive value
RNS: Reactive nitrogen species
ROC: Receiver operating characteristic
ROS: Reactive oxygen species
SNP: Single nucleotide polymorphism
SNO: S-nitrosothiol
O2●–: Superoxide
SOD: Superoxide dismutase
TVU: Transvaginal ultrasound
XO: Xanthine oxidase

1
CHAPTER I: INTRODUCTION AND BACKGROUND
Ovarian cancer
Ovarian cancer is the fifth leading cause of cancer death in women, the leading cause of
death from gynecologic malignancies, and the second most commonly diagnosed gynecologic
malignancy [1]. It is projected that in 2013, approximately 22,240 women will receive a new
diagnosis of ovarian cancer and 14,230 will die from ovarian cancer [2]. Ovarian cancer can be
divided into three broad subgroups, epithelial, stromal, and germ cell tumors, each with different
etiologies and clinical behavior, with epithelial ovarian cancer (EOC) amounting to more than
85% of all cases [3]. Sex cord stromal tumors of the ovary account for about 5% to 8% while
neoplasms of germ cell origin account for about 3% of ovarian malignancies [4]. In general,
ovarian cancers originate in the epithelium of inclusion cysts, which are derived from the surface
epithelium [5]. While most epithelial tumors, including a subset of low grade adenocarcinomas
of the ovary (endometrioid and mucinous) follow the adenoma-carcinoma sequence, high grade
serous ovarian carcinoma (HGSOC) often exhibits a unique pattern of progression in which no
tumor can be found on the surface of the ovary during the early stages [5]. In contrast, in most
HGSOCs, as the tumor grows, the intact ovarian outer surface is disrupted and the cancer
extends to the pelvic region [6]. Early stage ovarian cancer is typically asymptomatic which
results in most cases presenting with late stage (III or IV) disease [7]. Unfortunately, the five-
year survival rate of patients with advanced disease is approximately 30%, with even lower
survival among African-American women [7,8]. Risk factors include family history, BRCA1/2
mutations, nulliparity, obesity, advanced age, race, and pregnancy after the age of 35 [7]. On the
other hand, a decreased risk of ovarian cancer occurs with the use of oral contraceptives,
pregnancy and childbirth, hysterectomy and oophorectomy [7]. Currently used screening and
diagnostic methods for ovarian cancer include pelvic examination and CA-125 antigen as a

2
tumor marker and transvaginal ultrasound (TVU), although the sensitivity and specificity of
these methods are insufficient for screening the general population [9].
The deficiency in diagnostic tools, including the lack of serum markers for the detection
of early neoplastic changes in epithelial cells has led to this disease being diagnosed most often
in later stages resulting in poor prognosis. Recommended treatment of ovarian cancer includes a
combination of surgery and a chemotherapeutics, platinums and taxanes, yet relapse is common
due to the acquisition of chemotherapy resistance resulting in disease recurrence in 70% of
patients who underwent treatment within 18 months [8,10]. While large-scale gene expression
analyses have been done to identify differentially expressed genes in ovarian carcinoma for
diagnosis of early-stage ovarian cancer, as well as the use of such markers as targets for
improved therapy and treatment, to date these have not yielded reproducible prognostic
indicators for identification and clinical outcomes [11-19].
Sources of oxidative stress
Oxidative stress has been implicated in the pathogenesis of several malignancies
including bladder, brain, breast, cervical, gastric, liver, lung, melanoma, multiple myeloma,
leukemia, lymphoma, oral, ovarian, pancreatic, prostate, and sarcoma cancers [20,21]. Moreover,
there is evidence that ovarian cancer patients also have decreased levels of circulating
antioxidants [21]. The imbalance between the production and elimination of free radicals and
reactive metabolites leads to a state of oxidative stress and subsequent damage of important
biomolecules and cells, with potential impact on the whole organism [22]. Reactive oxygen
species (ROS) include superoxide (O2●−), hydroxyl radical (˙OH●), hydrogen peroxide (H2O2),
peroxynitrite (ONOO−) and hypohalous acids, and are free radical molecules that are highly
destructive to cellular functions [23,24]. Various enzyme systems produce ROS, including the
mitochondrial electron transport chain, cytochrome P450, lipoxygenase, cyclooxygenase, the

3
nicotinamide adenine dinucleotide phosphate (NAD(P)H) oxidase complex, xanthine oxidase
(XO), and peroxisomes (Figure 1) [25,26].
Mitochondrial O2 metabolism is the dominant source of O2●− that results from incomplete
coupling of electrons and H+ with O2 in the electron transport chain. Under normal conditions,
ROS are maintained within narrow parameters by scavenging systems, as would be expected
where those enzymes are involved in cell signaling, while ROS formed after exposure to
oxidative stress can activate signaling molecules [25-33]. The redox balance is maintained by
various enzyme systems that neutralize toxic reactive oxygen and nitrogen species. Superoxide
dismutases (SOD) catalyze the conversion of O2●– to hydrogen peroxide (H2O2), which then can
be converted to water by catalase (CAT) or glutathione peroxidase (GPX) coupled with
Figure 1: Summary of the mechanisms that will be examined in this study.

4
glutathione reductase (GSR) (Figure 1) [34]. Other important scavengers include thioredoxin
coupled with thioredoxin reductase, and glutaredoxin, which utilizes glutathione (GSH) as a
substrate (Figure 1). Additionally, glutathione S-transferases (GST) are involved in
detoxification of varieties of environmental carcinogens and xenobiotics by catalyzing their
conjugation to GSH, and subsequent removal from the cell [35]. Glutathione plays a central role
in maintaining redox homeostasis, and the GSH-to-oxidized-GSH ratio provides an estimate of
cellular redox buffering capacity [25,36].
Cancer cells are known to be under intrinsic oxidative stress resulting in increased DNA
mutations or DNA damage, genome instability, and cellular proliferation [22,34,37-39]. The
persistent generation of cellular ROS is a consequence of many factors including exposure to
carcinogens, infection, inflammation, environmental toxicants, nutrients, and mitochondrial
respiration [40-43]. Nitration of tyrosine residues to 3-nitrotyrosine, a hallmark of inflammation
as well as a footprint of many types of oxidative injury, may play a role in the pathogenesis of
human ovarian cancers [44]. Specifically, an increased expression of pro-oxidant enzymes such
as inducible nitric oxide synthase (iNOS), myeloperoxidase (MPO), NAD(P)H oxidase, as well
as an increase in NO as indicated by increased nitrate/nitrite has been shown in epithelial ovarian
cancer (EOC) tissues and cells [45-47]. Epithelial ovarian cancer (EOC) cells have been shown
to have significantly increased levels of nitric oxide (NO), which correlated with increased
expression in ]iNOS [46]. Also, EOC cells manifested lower apoptosis, which was markedly
induced by inhibiting iNOS by L-NAME, indicating a strong link between apoptosis and
NO/iNOS pathways in these cells [46]. Myeloperoxidase utilizes NO, produced by iNOS, as a
one-electron substrate generating NO+, a labile nitrosating species that is rapidly hydrolyzed
forming nitrite (NO2-) as an end product [48-51]. The ability of MPO to generate NO+, from NO,
led us to believe that not only does MPO play a role in S-nitrosylation of caspase-3, thus
5
inhibiting caspases-3 activity, which is indicative of lower apoptosis in EOC cells, but also
highlights a possible cross-talk between iNOS and MPO [45]. Myeloperoxidase, an abundant
hemoprotein previously believed to be present solely in neutrophils and monocytes, plays an
essential role in immune surveillance and host defense mechanisms, can contribute to 3-
nitrotyrosine formations in vivo and directly modulate inflammatory responses via regulation of
NO bioavailability during inflammation [44,52].
Several pro-oxidants have been demonstrated to be increased in cancer. Specifically,
increased iNOS expression is elevated in breast, colorectal, brain, esophagus, lung, prostate,
bladder, ovarian and pancreatic cancers [53,54]. NAD(P)H oxidase family members have also
been shown to increase in association with ROS production and tumorigenicity in several
cancers including colon, prostate, melanoma, breast and ovarian [55]. Myeloperoxidase has been
reported to be elevated in gynecologic malignancies but has been suggested to be a result of
infiltrating neutrophils and macrophages [56]. High levels of HIF-1 expression are also observed
in many human cancers, and are correlated with tumorigenesis [55]. On the other hand, elevated
serum GST-pi levels were observed in patients with various gastrointestinal malignancies as well
as in breast, esophageal, pancreatic, hepatocellular, and biliary tract cancers [57,58]. Several
other antioxidant enzymes have been indicated to be differentially expressed in cancer.
Glutathione peroxidase expression is reduced in prostate, bladder and in estrogen-negative breast
cancer cell lines, activity is reduced in cancerous kidney tissues but increased in breast cancer
tissues [57,59,60]. Glutathione reductase levels have also been reported to be elevated in lung
cancer although differentially expressed in breast and kidney cancerous tissues [61-63].
Additionally, CAT was decreased in breast, bladder, and lung cancer while increased in brain
cancer [64-67]. Superoxide dismutase is highly expressed in lung, colorectal, gastric and breast
cancer, while decreased SOD activity and expression have also been reported in colorectal

6
carcinomas and pancreatic cancer cells [28,66-70]. Collectively, this differential expression of
antioxidants demonstrates the unique and complex microenvironment of cancer.
Another major source of O2●− in several cell types is NAD(P)H oxidase, which has been
reported to be elevated in ovarian cancer [47,71-76]. NAD(P)H oxidase consists of seven
isoforms: five NAD(P)H oxidases (NOX), NOXs1–5, and two NOX homologues, DUOX1 and
DUOX2. NAD(P)H oxidases are differentially activated by different binding molecules,
including p22phox, p40phox, p47phox/NOXO1, p67phox/NOXA1 and Rac [77]. Activation
mechanisms and tissue distribution of the different members of the family are markedly different.
Activation of NAD(P)H oxidase involves the translocation of regulatory elements from the
cytoplasm to combine with catalytic subunits in the membrane [78]. Increased NAD(P)H
oxidase activity contributes to a large number or pathologies, such as cardiovascular diseases and
neurodegeneration [71]. It has been reported that mutations in specific regions of NAD(P)H
oxidase subunits contribute to the enhancement of the enzyme activity with subsequent increase
in O2●− production, contributing to enhanced levels of oxidative stress [79,80]. Specifically, an
increase in NAD(P)H oxidase activity has been associated with a specific single nucleotide
polymorphism (SNP) in the CYBA gene (rs4673), encoding the p22phox subunit of NAD(P)H
oxidase, resulting in a CAC/TAC replacement at position 242 located on chromosome 16q24,
leading to a nonconservative substitution of histidine-72 with a tyrosine [81]. This SNP is also
associated with an increased risk for other diseases where oxidative stress plays a critical role in
their pathophysiology, including cardiovascular disease, asthma, and diabetic nephropathy [81-
83].
There is compelling evidence to support the role of oxidative stress in the pathogenesis of
ovarian cancer, yet the mechanisms responsible for the dissemination of EOC are not fully
understood. The objective of this work is to identify mechanisms of oxidative stress and their

7
role in the pathogenesis of ovarian cancer. The central hypothesis of this study is that ovarian
cancer is controlled by mechanisms that emanate from an altered redox balance.

8
CHAPTER II: GENERAL METHODS
(This chapter contains previously published material. See Appendix [45,47])
Cell Lines, Media, and Cell Culture Conditions
Human epithelial ovarian cancer (EOC) cell lines, MDAH-2774 (CRL-10303™) and
SKOV-3 (HTB-77™), were obtained from American Type Culture Collection (ATCC, Manassas,
VA). The MDAH-2774 cell line was developed from cells in the ascitic fluid from a patient with
adenocarcenoma in 1972 and forms tumors in nude mice [84]. SKOV-3 cells were developed
from ascitic fluid of a 64-year-old Caucasian female. Cell lines were cultured in 75cm2 cell
culture flasks (Corning Incorporated, Corning, NY) with McCoy’s 5A medium (Invitrogen,
Carlsbad, CA) supplemented with 100 U/mL penicillin and 100 µg/mL streptomycin and 10%
heat-inactivated fetal bovine serum (FBS) at 37 °C in 5% CO2. Culture medium was replaced
every two days.
The human primary ovarian surface epithelial (HOSEpiC) cells were obtained from
ScienCell Research Laboratories (Carlsbad, CA). Cells were isolated from human ovarian tissue
and were cultured with Ovarian Epithelial Cell Medium (OEpiCM, ScienCell), consisting of 500
ml of basal medium, 5 ml of Ovarian Epithelial Cell Growth Supplement (OEpiCGS, SicenCell)
and 5 ml of penicillin/streptomycin solution (P/S, ScienCell). These cells were cryopreserved at
either primary or passage one and have been utilized in other studies [85-87]. Cells were
cultured according to the manufacturer’s instructions.
RNA Isolation
Total RNA was extracted from cells using an RNeasy Mini Kit (QIAGEN, Valencia, CA)
according to the protocol provided by the manufacturer.
Reverse Transcription
A 20 μL cDNA reaction volume utilizing 1 μg RNA was prepared using the QuantiTect

9
Reverse Transcription Kit (Qiagen), as described by the manufacturer's protocol.
Real-time Reverse Transcription Polymerase Chain Reaction (RT-PCR)
Real-time RT-PCR was performed with a QuantiTect SYBR Green RT-PCR kit
(QIAGEN) and a Cepheid 1.2f Detection System (Cepheid, Sunnyvale, CA). Each 25-µL
reaction included 12.5 μL of 2 x QuantiTect SYBR Green RT-PCR master mix, cDNA template,
and 0.2 μM each of target-specific primer were selected with the aid of the software program,
Beacon Designer (Premier Biosoft, Palo Alto, CA). Human oligonucleotide primers that amplify
variable portions of the protein coding regions are listed in Table 1. MPO and iNOS were
normalized utilizing the housekeeping gene, β-actin while all other genes listed in Table 1 were
quantified using a specific standard for each gene which allows for absolute quantification of that
gene in number of copies, which can then be expressed per μg of RNA. These standards have
known concentrations and lengths that allowed for construction of a standard curve using a
tenfold dilution series. To evaluate the validity of using β-actin as an internal standard and
changes in the amounts of β-actin, mRNA was tested as an external standard. Subsequently, the
normalized values of the mRNA were divided by those in controls.
Table 1. Real-time RT-PCR primer sequences and cycling conditions.

10
The conditions for the three-step polymerase chain reaction protocol were as follows: an
initial cycle at as described in Table 1, followed by 35 cycles of denaturation at 95°C for 15s,
annealing as described in Table 1, and extension at 72°C for 30s. Finally, a melting curve
analysis was performed to demonstrate the specificity of the PCR product as a single peak. A
control, which contained all the reaction components except for the template, was included in all
experiments.
Immunofluorescent Staining for iNOS and MPO
Cells in Culture: EOC cells were grown on a Lab-Tek Chamber slide (Sigma Chemicals,
St. Louis, MO) overnight at 37 °C. The cells were washed briefly with phosphate buffer saline
solution (PBS) and fixed with 3% paraformaldehyde for 30 minutes followed by washing with
PBS three times. Cells were blocked with 1% bovine serum albumin (BSA).
Tissue sections: Normal ovarian and ovarian cancer tissue sections were heated to 65 C
for 2 hours followed by deparaffinization in 2 changes of xylenes (Sigma, St. Louis, MO), 5
minutes each. Tissues were rehydrated in 2 changes of 100% ethanol for 3 minutes each
followed by 2 changes of 95% ethanol for 1 minute each and 2 changes of 80% ethanol for 1
minute each. Slides were rinsed in distilled water and incubated in 3% H2O2 for 20 minutes at
room temperature to block endogenous peroxidase activity followed by washing with 0.05%
Tween 20-PBS 3 times, 5 minutes each. Slides underwent antigen retrieval by being incubated
in sodium citrate buffer at 95 C for 20 minutes and then were allowed to come to room
temperature followed by washing with 0.05% Tween 20-PBS 3 times, 5 minutes each. Tissues
sections were blocked with 10% BSA.
Slides and chambers were incubated with the FITC-conjugated iNOS and Texas Red-
conjugated MPO antibodies (mouse anti-iNOS monoclonal antibody; BD Bioscience, rabbit anti-
myeloperoxidase polyclonal antibody; Abcam, Cambridge, MA) diluted at 1:100 ratio for 1 hour

11
at room temperature. The cover slips were mounted on the slide with a drop of mounting
medium containing DAPI (Invitrogen), sealed with nail polish and stored in dark at 4 °C. Slides
were examined with the Axiovert 25 inverted microscope (Zeiss, Thornwood, NY) using DAPI
(blue), Texas red (red) and FITC (green), fluorescent filters with excitation and emission
wavelengths of 365 and 445, 470 and 525, and 596 and 613 nm respectively. Images were taken
using the Axiovision software (Zeiss) and a microscope-mounted camera.
Immunohistochemical Staining for iNOS, MPO and NAD(P)H Oxidase
Tissue sections: For iNOS and MPO, benign ovarian tissues specimens (n=20), obtained
from cases who underwent salpingo-oophorectomy for benign uterine pathology, and invasive
epithelial ovarian cancer cases (n=20) retrieved from archival materials from the Detroit Medical
Center/ Karmanos Cancer Center pathology department were utilized in this study. Case
distribution by FIGO stage was as follows: 10 were stage I, and 10 were advanced stage disease
(II-IV) at diagnosis. Dr. Rouba Ali-Fehmi in the Wayne State University Pathology Department,
Detroit, MI, reviewed H&E stained slides from each case for validation/confirmation of
diagnosis and histology. The histological diagnoses were as follows: 10 high grade serous
carcinomas; 5 low grade serous carcinomas, 4 grade 1 endometrioid and one grade 1 mucinous
carcinomas. The mean age of the 20 patients was 68 (range 38 to 89 years).
For NAD(P)H oxidase, twenty benign ovarian tissues specimens, obtained from patients
who underwent total abdominal hysterectomy-bilateral salpingo-oophorectomy for leiomyomas,
and 20 invasive EOC cases (two sections per case) were retrieved from archival materials from
the Detroit Medical Center/Karmanos Cancer Center pathology department (Institutional review
board number 072206MP2E). Histological diagnoses were as follows: 10 high grade and five
low grade serous carcinomas, four grade 1 endometrioid and one grade 1 mucinous carcinomas.
The mean age of the 20 patients was 56 (range 35-70).

12
After deparaffinizing and hydrating with phosphate-buffered saline (PBS, pH 7.4),
sections were pretreated with 3% H2O2 for 10 minutes to remove endogenous peroxidases
followed by incubation with goat serum for 10 minutes. Primary antibodies for MPO (Dako,
Denmark, A0398) and iNOS (Santa Cruz, Santa Cruz, CA, sc7271) dilution (1:100) or a primary
antibody for NAD(P)H oxidase (HPA015475, Sigma Aldrich) dilution (1:20) was applied to
each section followed by washing and incubation with the biotinylated secondary antibody for 10
minutes at room temperature. Detection was performed with AEC and counterstaining was done
with Mayer’s hematoxylin followed by mounting.
The expression of MPO, iNOS, or NAD(P)H oxidase was assessed based on the presence
of cytoplasmic staining. A gynecologic pathologist reviewed all slides, benign (2-5 slides) and
malignant (5-15 slides). The most positive area in every tumor or benign cases was evaluated
and only the percentage was evaluated because most of the cases had the same intensity. The
scoring was assigned based on the percentage of positive epithelial cells: a zero score assigned
for cases with no cytoplasmic staining in any cells; score 1 with <5% of cell staining positive;
score 2 with 6-30% and score 3 with >30% of cells staining positive. For statistical analysis,
cases with score 0 or 1 were considered as being negative and cases with score 2 or 3 as positive.
Measurement of Protein Concentration
Total protein concentration of cell lysates was measured with the Pierce BCA Protein
Assay Kit (Thermo Scientific, Rockford, Illinois) per the manufacturer’s protocol. Cell lysates
were prepared utilizing cell lysis buffer (Cell Signaling Technology, Danvers, MA)
supplemented with Protease Arrest (G-Biosciences, St. Louis, MO).

13
CHAPTER III: CHARACTERIZATION OF THE OXIDATIVE STRESS PROFILE IN
EPITHELIAL OVARIAN CANCER
(This chapter contains previously published material. See Appendix [45,47])
Approach
The objective of this chapter is to characterize the oxidative stress profile in EOC.
Expression of iNOS, MPO and NAD(P)H oxidase, was determined using immunohistochemistry
in EOC cell lines, SKOV-3 and MDAH-2774, normal human ovarian surface epithelial cell line,
HOSEpiC, as well as in EOC tissues and their normal counterparts.
The activity levels for CAT, SOD, GPX and GSR were measured in, MDAH-2774,
SKOV-3, and HOSEpiC cells utilizing ELISA assays. Cells were seeded (2.5 x 10⁶) in 150 mm
dishes and allowed to rest for 24 hrs followed by media replacement and cell collection 24 hrs
later. Cells were collected for RNA and protein extraction as well as media collected for
measurement of nitrate/nitrite and total GSH levels. Following RNA extraction, reverse
transcription of cDNA was performed which was then utilized in real-time RT-PCR for
determination of CAT, GSR, GPX1, and GST-p1 mRNA levels.
Data were analyzed with unpaired Student’s t-tests comparing EOC to HOSEpiC cells. A
of p<0.05 was considered statistically significant for all analyses.
Introduction
The imbalance between the production and elimination of free radicals and reactive
metabolites leads to a state of oxidative stress and subsequent damage of important biomolecules
and cells, with potential impact on the whole organism [22]. Oxidative stress has been
implicated in the pathogenesis of several malignancies, including ovarian cancer [20,21].
Moreover, there is evidence that ovarian cancer patients also have decreased levels of circulating
antioxidants such as vitamins C and E, in comparison to healthy controls [21]. Although there

14
are many players involved in the maintenance of the redox balance, we will focus on the
following for this study.
Epithelial ovarian cancer cells have been reported to have significantly increased levels
of NO, which correlated with increased expression of iNOS [46]. Additionally, MPO can utilize
NO, produced by iNOS, as a one-electron substrate generating NO+, a labile nitrosating species
that is rapidly hydrolyzed forming nitrite (NO2-) as an end product [48-51]. The ability of MPO
to generate NO+ led us to believe that MPO may play a role in S-nitrosylation of caspase-3,
subsequently lowering the activity of caspase-3, ultimately reducing apoptosis in EOC cells.
In addition to the ROS produced by the mitochondria, nicotinamide adenine dinucleotide
phosphate (NAD(P)H)-oxidase, a flavoenzyme family member, generates a significant amount of
endogenous ROS through the reduction of O2 to O2●–, H2O2, and other ROS [71,75,88,89]. It has
been reported that the NAD(P)H oxidase NOX1 subunit was positively expressed in several
cancers, including ovarian cancer tissues [90].
Superoxide dismutase is a major O2●– scavenger that converts O2
●– to H2O2, which is
further eliminated by both CAT and peroxidases [91,92]. Human extracellular Cu/Zn SOD
(SOD3), is a unique SOD family member found in the extracellular matrix of tissues and is
ideally situated to prevent cell and tissue damage, initiated by extracellularily produced ROS
[93]. The loss of endogenous SOD3 activity can exacerbate oxidative stress and pathologic
damage as it is a critical endogenous antioxidant enzyme involved in carcinogenesis, cancer
proliferation and metastasis [94]. Catalase as well as GPX is involved in elimination of H2O2.
Glutathione peroxidases detoxify peroxides with GSH acting as an electron donor in the
reduction reaction, producing the oxidized form, GSSG, which then can be reduced by GSR,
reforming GSH [95]. Reduced GSH is considered to be one of the most important scavengers of
ROS, and its ratio with GSSG may be used as a marker of oxidative stress [95]. Moreover, GSR

15
is constitutively active and can be induced by oxidative stress and thus free GSH typically exists
in the reduced form [95].
Therefore, the goal of this chapter is to examine select pro-oxidants and antioxidants in
order to establish an oxidative stress profile of EOC, which will contribute to delineating the
underlying mechanisms of ovarian cancer.
Methods
Cell culture of EOC cell lines, MDAH-2774 and SKOV-3, and normal ovarian surface
epithelial cells, HOSEpiC, are described in General Methods. For SOD, CAT, GSR, GSH, and
GPX assays, cells (2.5 x 10⁶) were seeded in a 150 mm dish and allowed to rest for 24 hrs
followed by media replacement and cell collection 24 hrs later. Media was collected for
nitrate/nitrite and total GSH measurements. Immunohistochemistry for MPO, iNOS, and
NAD(P)H oxidase is also described in General Methods.
Measurement of Nitrate/Nitrite
The nitrate/nitrite colorimetric assay (Cayman Chemical, Ann Arbor, MI) was used to
measure the levels of stable NO by-products, nitrate (NO2−) and nitrite (NO3
−), as an indication
of NO production. Due to the fact that the proportion of NO2− and NO3
− is variable and cannot
be predicted with certainty, the sum of both NO by-products is a more accurate indicator of NO
production. The assay was performed utilizing cell culture media (60 μl) according to the
manufacturer’s protocol. Absorbance was detected at 540 nm and a standard curve for nitrite
was utilized to determine total NO2− and NO3
−.
Measurement of CAT Activity
The Catalase Assay Kit (Cayman Chemical) utilizes the peroxidatic function of CAT for
determination of enzyme activity and is based on the reaction of the enzyme with methanol in the
presence of an optimal concentration of H2O2. The assay was performed according to the

16
manufacturer’s protocol using 2 μg total protein. A description of protein extraction and
concentration determination is in General Methods. Formaldehyde produced is measured
spectrophotometrically with Purpald as the chromogen, which is detected at 540 nm.
Measurement of SOD Activity
The Superoxide Dismutase Assay Kit (Cayman Chemical) detects SOD activity by
measuring the dismutation of O2●− generated by xanthine oxidase (XO) and hypoxanthine. The
standard curve generated using this enzyme provides a means to accurately quantify the activity
of all three types of SOD (Cu/Zn-, Mn-, and Fe-SOD). The assay was performed according to
the manufacturer’s protocol using 0.25 μg total protein. A description of protein extraction and
concentration determination is in General Methods. Total SOD was detected at 460 nm. One
unit of SOD is defined as the amount of enzyme needed to exhibit 50% dismutation of O2●−.
Measurement of GSR Activity
The Glutathione Reductase Assay Kit (Cayman Chemical) measures GSR activity by
determining the rate of NAD(P)H oxidation which s accompanied by a decrease in absorbance at
340 nm. The assay was performed according to the manufacturer’s protocol using 7 μg total
protein. A description of protein extraction and concentration determination is in General
Methods. Absorbance was read once a minute for 8 minutes and slope was utilized to calculate
GPX activity. Since GSR is present at rate limiting concentrations, the rate of decrease in the
absorbance at 340 nm is directly proportional to the GSR activity in the sample.
Measurement of GPX Activity
The Glutathione Peroxidase Assay Kit (Cayman Chemical) measures GPX activity
indirectly by a coupled reaction with GSR [96]. Oxidized glutathione (GSSG), produced from
the reduction of an organic hydroperoxide by GPX, is recycled to its reduced state by GSR and
NADPH. The oxidation of NADPH to NADP+ is accompanied by a decrease in absorbance at

17
340 nm. The assay was performed according to the manufacturer’s protocol using 10-15 μg total
protein, and was normalized per μg protein. A description of protein extraction and
concentration determination is in General Methods. Absorbance was read once a minute for 8
minutes and slope was utilized to calculate GPX activity. The rate of decrease in the absorbance
340 is directly proportional to the GPX activity in the sample [97].
Statistical Analysis
An unpaired Student’s t-test was utilized to analyze real-time RT-PCR data comparing
EOC to HOSEpiC cells. A of p<0.05 was considered statistically significant for all analyses.
Results
MPO expression in EOC cells and tissues
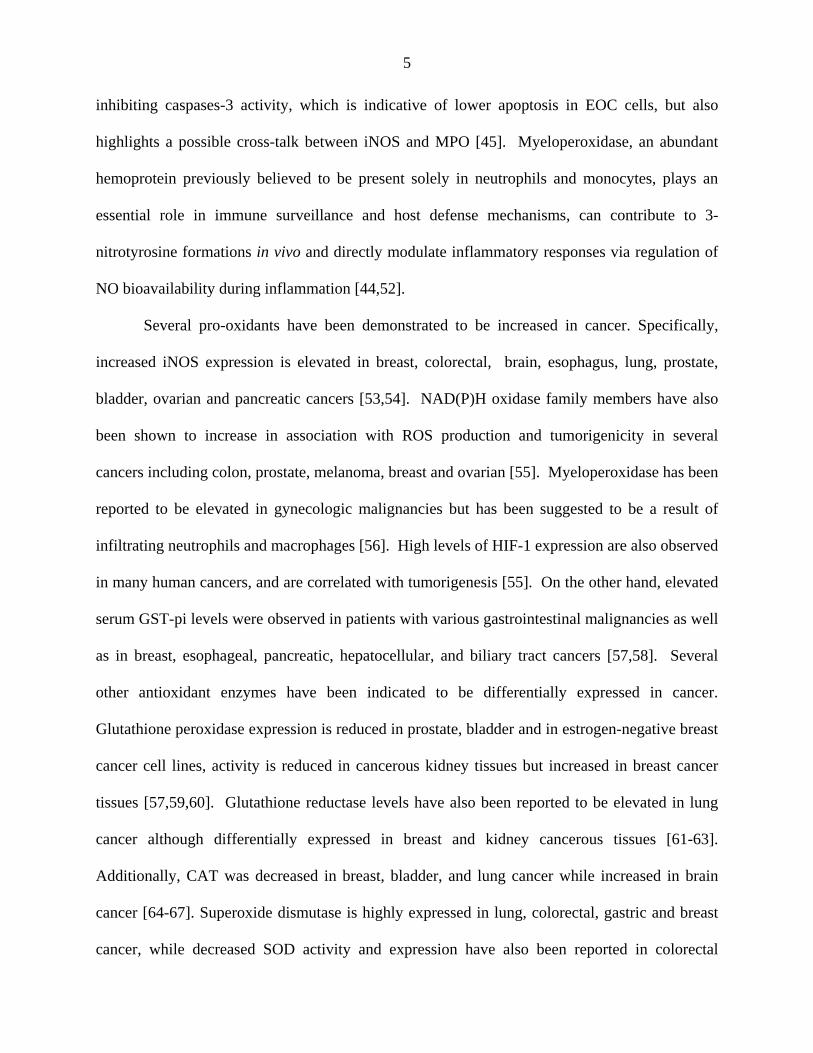
Normal ovarian and EOC tissues were dually stained with antibodies targeting iNOS
(green) and MPO (red). There is an increase in both iNOS and MPO fluorescence staining in
ovarian cancer tissues as compared to normal ovarian tissues (Figure 2A). Co-localization of
iNOS and MPO is indicated by yellow fluorescence (Figure 2A). Additionally, iNOS and MPO
expression was upregulated in 70% and 65% of ovarian cancer tissue sections tested by
immunohistochemistry, respectively (Figure 2B). There was no detectable expression for either
MPO or iNOS in any of the normal ovarian epithelial tissue. The immunoreactivity that was
observed in normal ovarian tissue sections was localized to blood vessels.
18
Co-localization of MPO and iNOS to the same cells in EOC cells.
The EOC cell lines, SKOV-3 and MDAH2774, were dually stained with antibodies
targeting iNOS (green) and MPO (red). Immunoreactivity showed co-localization of iNOS and
MPO (yellow) in both ovarian cancer cell lines (Figure 3).
Figure 3 Co-localization of MPO and iNOS to the same cells in EOC cells. MPO and iNOS staining in MDAH-2774 and SKOV-3 EOC cells. Cells were dually stained with antibody against MPO (red), iNOS (green), and nuclei (blue) (100 x). Co-localization of MPO and iNOS is shown in yellow. Experiments were performed in triplicate.
Figure 2 Immnunohistochemical staining of iNOS and MPO in normal and EOC tissues. A and B) Normal ovarian epithelium showed no staining for either iNOS or MPO. B) Strong cytoplasmic staining for iNOS and MPO is shown in a case of high grade serous carcinoma. A) Co-localization of iNOS and MPO was observed in ovarian cancer. Representative images of experiment performed in triplicate.

19
EOC tissues expressed higher levels of NAD(P)H oxidase
NAD(P)H oxidase expression was upregulated in 65% of EOC tissue sections, tested by
immunohistochemistry as compared to 20% detectable expression for NAD(P)H oxidase in
normal ovarian epithelial tissue (surface epithelial inclusion cysts) (Figure 4).
EOC cells have an increase in nitrate/nitrite levels as compared to normal ovarian surface
epithelial cells
Nitrate/nitrite levels significantly increased in MDAH-2774 (13.2 + 0.5 μM, p<0.002)
and in SKOV-3 (8.2 + 0.0 μM, p<0.002) EOC cells as compared to HOSEpiC (3.9 + 0.2 μM)
cells (Figure 5).
Figure 4: Immunohistochemical staining of NAD(P)H oxidase in normal ovarian and EOC tissue sections. Normal ovarian and EOC tissue sections were stained with a primary antibody for NAD(P)H oxidase, followed by biotinylated secondary antibody. Detection was performed with AEC and counterstaining was done with Mayer’s hematoxylin followed by mounting and imaging (20x). The expression of NAD(P)H oxidase was assessed based on the presence of cytoplasmic staining.

20
EOC cells have an increase in CAT levels as compared to normal ovarian surface epithelial cells
There was a significant increase in CAT mRNA levels in MDAH-2774 (17.4 + 0.1 pg/μg
RNA, p<0.007) and SKOV-3 (20.6 + 3.8 pg/μg RNA, p<0.02) EOC cells as compared to
HOSEpiC (9.45 + 1.6 pg/μg RNA), (Figure 6A). Similarly, there was an increase in CAT
activity in MDAH-2774 (10.3 + 0.06 nmol/min/ml, p<0.04) and SKOV-3 (10.1 + 0.01
nmol/min/ml, p<0.04) EOC cells as compared to HOSEpiC (7.5 + 0.73 nmol/min/ml) cells
(Figure 6B).
Figure 5: Nitrate/nitrite levels in EOC as compared to HOSEpiC cells. The Griess assay was performed in 24-hour media collected from normal ovarian surface epithelial (HOSEpiC) and EOC cells. *p<0.002 as compared to HOSEpiC cells. Error bars represent standard deviation of the mean.

21
EOC cells have an increase in SOD activity levels as compared to normal ovarian surface
epithelial cells
There was an increase in SOD activity levels in MDAH-2774 (to 11.1 + 0.1 U/ml,
p<0.0005) and in SKOV-3 (to 10.4 + 0.9 U/ml, p<0.04), respectively, as compared to HOSEpiC
Figure 6: CAT mRNA and activity levels in EOC as compared to HOSEpiC cells. A) Real-time RT-PCR was utilized to measure CAT mRNA levels in RNA isolated from EOC cell lines MDAH-2774 and SKOV-3 as well as HOSEpiC cells. B) Catalase activity was detected in protein obtained from EOC cell lines MDAH-2774 and SKOV-3 as well as HOSEpiC cells. *p<0.007, **p<0.02, and ***p<0.04 as compared to HOSEpiC cells. Error bars represent standard deviation of the mean.
Figure 7: SOD activity levels in EOC as compared to HOSEpiC cells. SOD activity was detected in protein obtained from EOC cell lines MDAH-2774 and SKOV-3 as well as HOSEpiC cells. *p<0.005 and **p<0.04 as compared to HOSEpiC cells. Error bars represent standard deviation of the mean.

22
(8.6 + 0.2 U/ml) cells (Figure 7).
EOC cells have an increase in GSR mRNA levels and activity as compared to normal ovarian
surface epithelial cells
There was an increase in GSR mRNA levels in MDAH-2774 (to 27.7 + 1.2 pg/μg RNA,
p<0.008) and SKOV-3 (to 30.1 + 0.6 pg/μg RNA, p<0.008), as compared to HOSEpiC (16.0 +
0.8 pg/μg RNA (Figure 8A). Similarly, there was an increase in GSR activity in MDAH-2774
(to 8.5 + 0.07 nmol/min/ml, p<0.001) and SKOV-3 (to 10.6 + 0.1 nmol/min/ml, p<0.001) as
compared to HOSEpiC (2.8 + 0.04 nmol/min/ml) (Figure 8B).
EOC cells have a decrease in GPX1 levels and activity as compared to normal ovarian surface
epithelial cells
There was a decrease in GPX1 mRNA levels in MDAH-2774 (to 0.75 + 0.2 pg/μg RNA,
p<0.002) and SKOV-3 (to 0.63 + 0.08 pg/μg RNA, p<0.001), respectively, as compared to
Figure 8: GSR mRNA and activity levels in EOC as compared to HOSEpiC cells. A) Real-time RT-PCR was utilized to measure GSR mRNA levels in RNA isolated from EOC cell lines MDAH-2774 and SKOV-3 as well as HOSEpiC cells. B) GSR activity was detected in protein obtained from EOC cell lines MDAH-2774 and SKOV-3 as well as HOSEpiC cells. *p<0.008 and **p<0.001 as compared to HOSEpiC cells. Error bars represent standard deviation of the mean.

23
HOSEpiC (5.50 + 0.7 pg/μg RNA) (Figure 9A). Likewise, there was a decrease in GPX1
activity in MDAH-2774 (to 180.8 + 4.5 nmol/min/ml/μg protein, p<0.002) and SKOV-3 (to
203.5 + 32.1 nmol/min/ml/μg protein, p<0.002), respectively, as compared to HOSEpiC (3378.5
+ 241.3 nmol/min/ml/μg protein) (Figure 9B).
EOC cells have an increase in GSTp1 mRNA levels as compared to normal ovarian surface
epithelial cells
There was an increase in GSTp1 mRNA levels in MDAH-2774 (to 61.9 + 2.3 pg/μg
RNA, p<0.004) and in SKOV-3 (to 73.0 + 1.1 pg/μg RNA, p<0.002), respectively, as compared
to HOSEpiC (21.1 + 2.3 pg/μg RNA) (Figure 10).
Figure 9: GPX mRNA and activity levels in EOC as compared to HOSEpiC cells. A) Real-time RT-PCR was utilized to measure GPX1 mRNA levels in RNA isolated from EOC cell lines MDAH-2774 and SKOV-3 as well as HOSEpiC cells. B) GPX activity was detected in protein obtained from EOC cell lines MDAH-2774 and SKOV-3 as well as HOSEpiC cells. *p<0.002 and **p<0.001 as compared to HOSEpiC cells. Error bars represent standard deviation of the mean.

24
Discussion
Our results clearly indicate that EOC manifests a severe pro-oxidant state, which
ultimately may be responsible for the persistence and maintenance of the oncogenic phenotype.
Indeed we have shown that there is an increase in key pro-oxidant enzymes iNOS, MPO, and
NAD(P)H oxidase, an increase in nitrate/nitrite, as well as an increase in key antioxidant
enzymes CAT, SOD, GSR, and GST-p1 in ovarian cancer (Figure 11). We also found the
antioxidant enzyme GPX to be decreased in ovarian cancer (Figure 11).
Figure 10: GSTp1 mRNA levels in EOC as compared to HOSEpiC cells. Real-time RT-PCR was utilized to measure GST-p1 mRNA levels in RNA isolated from EOC cell lines MDAH-2774 and SKOV-3 as well as HOSEpiC cells. *p<0.004 and **p<0.002 as compared to HOSEpiC cells. Error bars represent standard deviation of the mean.
Figure 11: Summary of oxidant and antioxidant markers in epithelial ovarian cancer as compared to normal ovarian tissues and normal ovarian surface epithelial cells. MPO, iNOS, and NAD(P)H oxidase were found to be elevated in ovarian cancer tissues as compared to normal ovarian tissues. GSR, GST-p1, SOD, and CAT were elevated, while GPX1 was lower, in normal ovarian surface epithelial cells as compared to epithelial ovarian cancer cells.

25
Inducible nitric oxide synthase was previously found to be elevated in ovarian cancer
tissues and cells [46,98]. Here, we observed an increase in NO2−/NO3
− levels in MDAH-2774
and SKOV-3 EOC cells as compared to HOSEpiC cells, which is representative of increased NO
production from iNOS. Nitric oxide plays an important role in cellular regulatory mechanisms,
such as vasodilatation, inhibition of platelet aggregation, and modification of proteins [99-101].
Nitric oxide exists in different redox states: NO•, NO+, and NO- [48]. Furthermore, O2•- reacts
with NO to produce ONOO− [102]. It is well known that high concentrations of NO are
proapoptotic and cytotoxic for different cells [103,104]. In contrast, low concentrations of NO
have been shown to be protective against apoptosis [105-107]. In addition to the known cGMP-
dependent effects, NO modifies proteins containing a cysteine residue via S-nitrosylation [101].
S-nitrosylation is a post-translational modification involving the attachment of NO to cysteine
residues or transition metals [108]. Important S-nitrosylation targets are the caspase proteins and
have been linked to a decrease in apoptosis.
Myeloperoxidase was expressed in ovarian cancer tissues with little or no expression in
normal ovarian tissues. In addition, we observed MPO not only to be present but also to be co-
localized with iNOS expression in both SKOV-3 and MDAH-2774 EOC cell lines. The
presence of MPO in ovarian cancer cells is significant as MPO is believed to be present only in
azurophilic granules of polymorphonuclear neutrophils and macrophages, and is released into the
extracellular fluid in response to inflammation. Therefore, the presence of MPO in EOC cells
supports the fact that MPO is indeed present in the actual tissues of EOC and not a result of
infiltrating immune cells. The role of MPO in carcinogenesis has been implicated in both the
activation of procarcinogens to genotoxic intermediates and the potentiation of xenobiotic
carcinogenicity [109,110]. The co-localization of MPO and iNOS has also been demonstrated
by immunohistochemical studies in cytokine-treated human neutrophils and primary granules of

26
activated leukocytes [111]. Furthermore, plasma levels and tissue expression of MPO in
gynecologic malignancies, including ovarian cancer, were previously evaluated and it was found
that gynecologic cancer patients had higher MPO as compared to control subjects [56].
Our immunohistochemical results also showed that NAD(P)H oxidase is over-expressed
in EOC tissues as compared to normal ovarian tissues. Further support for this increase in ROS
is demonstrated by a cross-talk between mitochondria and the O2●– generating NAD(P)H oxidase
in ovarian tumors [90]. The mitochondria controls NAD(P)H oxidase redox signaling, therefore
loss of this control contributes to tumorigenesis [90]. Another study found not only an increase
in the NOX4 subunit of NAD(P)H oxidase, but that high levels of ROS production was a result
of upregulated NOX4 in ovarian cancer cells as compared to immortalized ovarian surface
epithelial cells [112].
Glutathione reductase is part of the GSH antioxidant system and catalyzes the reduction
of GSSG to GSH in the presence of NADPH, maintaining the high GSH/GSSG ratio in the cell
[61]. Glutathione, an important antioxidant, is involved in regulating mutagenic mechanisms,
DNA synthesis, growth, and multidrug and radiation resistance, especially in cancer [113,114].
Due to it’s antioxidant capacity, elevated GSH levels increase resistance to oxidative stress and
has been observed in many types of cancer [115]. Another study examined GSH levels in tissues
and found an increase in GSH in ovarian cancer as compared to benign and normal ovarian
tissues [116]. Glutathione is synthesized from its constituent amino acids, glycine, cysteine and
glutamic acid by the sequential action of γ-glutamylcysteine synthetase (γ-GCS) and GSH
synthetase, with γ-GCS being rate limiting and can also be regenerated from it’s oxidized from,
GSSG, by GSR [117]. Synthesis of GSH occurs in the cytoplasm and GSH is imported into the
mitochondria where it is involved in the elimination of oxidants including H2O2, HO, the
cytotoxic Fenton reaction product, and the cytotoxic dinitrogen dioxide (N2O3) and ONOO−,

27
both which are products formed by the reaction of NO with O2 and O2−, respectively [117]. In
this study, GSR mRNA and activity levels were found to be elevated in EOC cells as compared
to HOSEpiC cells. Inhibition of GSR has been shown to cause both reduction of intracellular
GSH and accumulation of GSSG resulting in increased cellular oxidative stress [118]. GSH
depletion in mitochondria has also been associated with dysfunction and loss of cell viability in
response to oxidative events [113].
Another important protection against oxidative stress are the glutathione S-transferases
(GST) which are involved in detoxification of varieties of environmental carcinogens by
catalyzing their conjugation to GSH, and subsequent removal from the cell [35]. There are three
main classes, alpha, mu and pi, which are ubiquitous throughout the tissues in the body with the
pi class being most predominant in human tumors [119]. The expression of GST-pi has even
been shown to be elevated in ovarian cancer as compared to normal ovarian tissue as well as
being associated with resistance to chemotherapeutic drugs in ovarian cancer [119-121]. It was
found that indeed, pi class (GST-p1) mRNA expression was elevated in EOC cells as compared
to normal human epithelial ovarian cells. This is significant, as GST-p1 is believed to play an
important protective role in tumor cell pathogenesis and survival and may play a role in the
development of ovarian cancer.
One of the principal antioxidant enzymes for the elimination of H2O2 is GPX, which has a
great affinity for H2O2 than CAT and thus competes with CAT for H2O2 as a substrate, resulting
in the production of GSSG [122]. The distribution of GPX in the body and within the cells
depends on the isoform, with the most prevalent form being GPX1, a cytosolic enzyme located
in most tissues [123]. In this study, we found a significant decrease in both GPX1 mRNA and
GPX activity levels in EOC as compared to HOSEpiC cells. The GSH redox cycle is a major
source of protection against mild oxidative stress, whereas CAT becomes increasingly important

28
in protection against severe oxidative stress [122].
Interestingly, CAT mRNA and activity levels were elevated in EOC cells as compared to
HOSEpiC cells. The conversion of O2●– to H2O2 is catalyzed by SOD, and is then converted to
H2O by CAT [34]. A recent study has demonstrated that inhibition of SOD, and subsequent
accumulation of O2−, resulted in an increase in CAT protein levels in EOC cells as compared to
normal ovarian epithelial cells [34]. We also found an increase in SOD activity in EOC cells as
compared to HOSEpiC cells. An increase in SOD activity suggests an increase in production of
H2O2, which would in turn upregulate enzymes that eliminate excess H2O2, such as CAT.
Additionally, elevated rates of H2O2 generation have been detected in several human cancer cell
lines, including the ovarian cancer cell line SKOV-3, again supporting the idea that SOD would
be upregulated to eliminate excessive H2O2 [73].
Collectively, this study has demonstrated that there are elevated pro-oxidants iNOS,
MPO, and NAD(P)H oxidase as well as elevated levels of antioxidants CAT, GSR, and GST-p1,
and decreased levels of GPX, all which suggests ovarian cancer favors a pro-oxidant state.
These key enzymes represent potential targets for future therapeutic interventions for ovarian
cancer.
29
CHAPTER IV: MODULATION OF REDOX SIGNALING PROMOTES APOPTOSIS IN
EPITHELIAL OVARIAN CANCER CELLS
(This chapter contains previously published material. See Appendix [45,47])
Approach
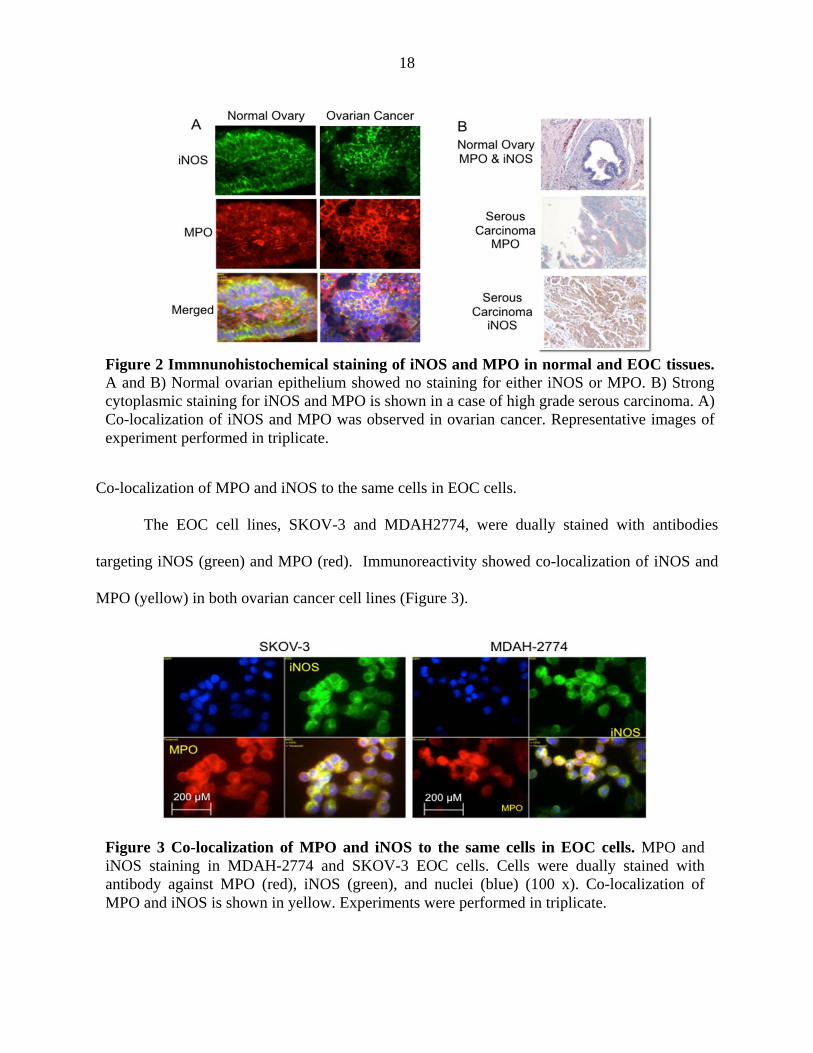
A distinct oxidative stress profile was described in Chapter III. In this Chapter, we
sought to modulate key pro-oxidant enzymes that were upregulated in ovarian cancer, iNOS,
MPO, and NAD(P)H oxidase, as compared to normal ovarian tissues and determine the effects
on other key markers of oxidative stress and apoptosis.
We also observed iNOS and MPO to be co-localized in the same EOC cell, thus, to
investigate this relationship we silenced iNOS or MPO utilizing specific siRNA for iNOS or
MPO in EOC cell lines, MDAH-2774 and SKOV-3. Cells (2 X 10⁶) seeded in 60 mm x 15mm
cell culture dishes and incubated with siRNA to silence either iNOS or MPO for 24 hours.
Media was collected for measurement of nitrate/nitrite, and indicator of NO production from
iNOS, levels following siRNA silencing of iNOS or MPO. Cells were collected for RNA and
protein extraction. Following RNA extraction, reverse transcription of cDNA was performed
which was then utilized in real-time RT-PCR for determination of iNOS and MPO mRNA levels
following silencing of iNOS or MPO. Moreover, S-nitrosylation of caspase-3, a key control of
caspase-3 activity, was determined utilizing immunoprecipitation/western blot following
silencing of iNOS or MPO.
Since NAD(P)H oxidase was found to be elevated in ovarian cancer tissues, we sought to
modulated NAD(P)H oxidase through its inhibition with diphenyleneiodonium in cells (5 × 10⁶)
seeded in 100 cm2 culture dishes and treated for 24 hours. Cells were collected for RNA and
protein extraction. Following RNA extraction, reverse transcription of cDNA was performed
which was then utilized in real-time RT-PCR for determination of the NAD(P)H oxidase subunit

30
p22phox, HIF-1α, and SOD3 mRNA levels. Expression of the p22phox subunit of NAD(P)H
oxidase was evaluated to confirm inhibition NAD(P)H oxidase. Both HIF-1α and SOD3 protein
levels were determined utilizing ELISA and immunoprecipitation/western blot, respectively.
Additionally, caspase-3 activity and TUNEL staining, indicators of apoptosis, were determined
for each experiment.
For the siRNA study, data were analyzed using SPSS 15.0 for Windows. A mixed model
repeated measures ANOVA was used with treatment as the within factor and cell type as the
between factor. Paired comparisons with a Bonferroni correction were used to compare pairs of
treatments. Significant interactions between treatment and cell type were analyzed with
independent sample t-tests by cell type on each treatment.
For the inhibition of NAD(P)H oxidase study, data were analyzed using SPSS 19.0 for
Windows. Additionally, data were analyzed using one-way ANOVA (analysis of variance) with
Student Neuman-Kuels post-hoc comparisons. P<0.05 was considered statistically significant
for all analyses.
Introduction
In Chapter III we determined that indeed ovarian cancer exhibit a distinct oxidative stress
profile favoring a pro-oxidant state. We observed an overexpression of iNOS, MPO, and
NAD(P)H oxidase in ovarian cancer tissues as compared to controls. Additionally, iNOS and
MPO were found to be co-localized in the same EOC cell, suggesting the existence of a cross-
talk relationship. Therefore, we sought to further investigate the role of these key pro-oxidant
enzymes following their modulation and the subsequent effect on additional key markers of
oxidative stress as well as apoptosis.
Malignant cells are resistant to apoptosis through a mechanism that may involve
alterations in their redox balance. Epithelial ovarian cancer cells have been shown to have

31
significantly increased levels of NO, which correlated with increased expression in iNOS [46].
Also, EOC cells manifested lower apoptosis, which was markedly induced by inhibiting iNOS
by L-NAME, indicating a strong link between apoptosis and NO/iNOS pathways in these cells
[46]. Myeloperoxidase utilizes NO, produced by iNOS, as a one-electron substrate generating
NO+, a labile nitrosating species that is rapidly hydrolyzed forming nitrite NO2− as an end
product [48-51]. The ability of MPO to generate NO+, from NO, led us to believe that not only
does MPO play a role in S-nitrosylation of caspase-3 in EOC cells, but also highlights a possible
cross-talk between iNOS and MPO.
Caspase-3 is known to play a critical role in controlling apoptosis, by participating in a
cascade that is triggered in response to proapoptotic signals and culminates in cleavage of a set
of proteins, resulting in disassembly of the cell [107,124-126]. Caspase-3 was found to be S-
nitrosylated on the catalytic-site cysteine in unstimulated human lymphocyte cell lines and
denitrosylated upon activation of the Fas apoptotic pathway [127]. Decreased caspase-3 S-
nitrosylation was associated with an increase in intracellular caspase activity. Caspase-3 S-
nitrosylation/denitrosylation is known to serve as an on/off switch regulating caspase activity
during apoptosis in endothelial cells, lymphocytes and trophoblasts [128-131]. The mechanisms
underlying S-nitrosothiol (SNO) formation in vivo are not well understood.
Cancer cells are also known to be under intrinsic oxidative stress and manifest
significantly increased levels of ROS, and thus express higher levels of SOD, which has been
reported to stabilize the HIF-1α protein, enabling HIF-1α to dimerize, forming an active
transcription factor [73,132-134]. Since rapidly growing tumors become hypoxic, questions are
raised as to what promotes an increase in SOD, and why HIF-1α is stabilized and not degraded,
with the increase in ROS under the hypoxic environment in cancer cells [135,136]. Restoration
of the ROS balance in cancer cells may provide a potential therapeutic intervention to selectively

32
eliminate cancer cells via apoptosis. Inhibition of NAD(P)H oxidase and other pro-oxidant
enzymes has been reported to significantly induce apoptosis of cancer cells [137,138]. Several
agents have been utilized to test this hypothesis, however, few have been tested in ovarian cancer
[139-141].
In this study, we sought to further investigate the role of oxidative stress in the
pathogenesis of ovarian cancer through the modulation of several key pro-oxidants, iNOS, MPO,
or NAD(P)H oxidase utilizing siRNA technology and direct inhibition of these enzymes.
Identification of targets to specifically reduce pro-oxidants and/or induce apoptosis in EOC cells
may provide a potential therapeutic target for selective elimination of cancer cells.
Methods
Cell culture of EOC cell lines, MDAH-2774 and SKOV-3 is described in General
Methods. For siRNA experiments, cells (2 X 10⁶) were plated in 60 mm x 15mm cell culture
dishes. For inhibition of NAD(P)H oxidase experiments, cells were plated (5 × 10⁶) in 100 cm2
culture dishes and incubated for 24 hours following treatment with 10 μM DPI (Sigma-Aldrich,
Saint Louis, MO) for 0, 0.5, 1, 3, 6, 12, and 24 hours. The dose of DPI was selected based on
previous studies [139-141]. Cells were harvested at each time point. All experiments were
performed in triplicate. Real-time RT-PCR methods are described in General Methods.
siRNA Design, Synthesis, and Transfection for iNOS and MPO
SiRNAs were designed after determination of target sequences by aligning iNOS and
MPO sequences to an Ambion web-based algorithm. The 21-nucleotide duplex siRNA
molecules with 3-dTdT overhangs were re-suspended in nuclease-free water according to the
instructions of the manufacturer (Ambion, Austin, TX). To ensure stringent controls, both a 2A-
based mutated control siRNA with 2 nucleotide mismatches (siRNA-2Amut) and a scrambled
control sequence (siRNA-SCR) obtained from Ambion (Silencer Negative Control No. 1 siRNA,

33
Ambion) were used.
Cells were grown to a confluence of 30% to 40% in 12-well plates (BD Bioscience,
Franklin Lakes, NJ) and transfected with the use of 3 µL NeoFX reagent (Ambion), 2 μl of 20
µmol siRNA, and OptiMEM medium (Invitrogen) up to a final volume of 100 μl. Neo FX
reagent and siRNA were incubated at room temperature for 10 minutes and then applied onto 1.0
X 105 cells per well. Transfection mixtures were incubated with cells for 24 hours before
washing cells with medium and incubated for an additional 24 hours. Experiments were
performed in triplicate for each of the two cell lines.
Detection of S-nitrosylation of Caspase-3 Following siRNA Knockdown of iNOS or MPO
Ovarian cancer cell lysates from the different treatments were immunoprecipitated with
anti-caspase-3 polyclonal antibody conjugated with protein A/G plus agarose beads.
Immunoprecipitated caspase-3 zymogen was released by boiling the beads at 95 °C for 5 minutes.
Biotinylated proteins were separated by SDS-PAGE and detected using nitrosylation detection
reagent I (HRP), according to the manufacturer’s protocol.
Measurement of Caspase-3 Activity
Chemicon's Caspase-3 Colorimetric Activity Assay Kit (Chemicon, Temecula, CA) was
used. The assay is based on spectrophotometric detection of the chromophore p-nitroaniline
(pNA) after cleavage from the labeled substrate DEVD-pNA. The free pNA can be quantified
using a spectrophotometer or a microtiter plate reader at 405 nm. Comparison of the absorbance
of pNA from an apoptotic sample with an uninduced control allows determination of the fold
increase in caspase-3 activity. Cells (2 x 10⁶) were harvested and lysed in 300 µl of cell lysis
buffer included with the kit, and concentrations were equalized for each sample set.
Subsequently, 150 µg of cell lysate was combined with substrate reaction buffer containing 30
µg of caspase-3 substrate, acetyl-DEVD-р-nitroaniline (Ac-DEVD-pNA). This mixture was

34
incubated for 1h at 37°C, and then absorbance was measured with a plate reader (Ultramark,
BIO-RAD, Hercules, CA). Background reading from cell buffers and substrate were subtracted
from the readings of samples before calculating increase in caspase-3 activity.
Measurement of Apoptosis by TUNEL Assay
DNA fragmentation was assessed by the in situ Terminal Deoxynucleotidyl Transferase-
mediated dUTP-biotin nick end labeling (TUNEL) technique per the DeadEnd Fluorometric
TUNEL System (Promega, Madison, WI) manufacturer’s protocol and as we have previously
described [142,143]. Positive controls were performed by treating cells with DNase I (1 mg/ml)
in TdT buffer for 10 minutes at room temperature before incubation with a biotinylated
nucleotide. Briefly, the cells were fixed with 4% paraformaldehyde in PBS for 20 min at 4 °C,
and subjected to permeabilization for 5 min at room temperature with 0.2% Triton X-100. Next,
cells were labeled with the TUNEL reaction mixture for 60 min at 37 °C. The nuclei of these
cells were also stained with 4′,6′-diamino-2-phenylindole (DAPI). Fluorescein-labeled DNA, an
indication of DNA fragmentation, was analyzed by using an Axiovert immunofluorescent
microscope (Carl Zeiss Microimaging, Thornwood, NY) and recorded with a microscope-
mounted camera (Carl Zeiss) using DAPI (blue) and FITC (green), fluorescent filters with
excitation and emission wavelengths of 365 and 445, 470 and 525 nm respectively.
Measurement of SOD3 Protein Levels in EOC Cells Following Inhibition of NA(P)DH Oxidase
Immunoprecipitation (IP)/Western blot was utilized as previously described with the
following changes [144]. Cells were lysed with lysis buffer and cleared by centrifugation (10
minutes at 1,000g, 4 °C). Protein concentration of cell lysates was measured with the Pierce
BCA Protein Assay Kit (Thermo Fisher Scientific, Rockford, IL) per the manufacturer’s protocol.
The same concentration of protein was utilized for each sample. Precleared cell lysates were
incubated with anti-SOD3 antibody (Santa Cruz Biotechnology, Santa Cruz, CA) for 1 hour at

35
4 °C, followed by precipitation with 20 μl of Protein A/G PLUS-Agarose (Santa Cruz
Biotechnology) and incubated at 4 °C overnight. Adherent proteins were eluted with 1 x protein
loading buffer for 5 minutes at 80 °C and analyzed by a Western blot detection kit (Visualizer,
Millipore, Temecula, CA). SOD3 bands were scanned and analyzed by NIH Image J 3.0 (.U. S.
National Institutes of Health, Bethesda, Maryland).
Measurement of HIF-1α Levels in EOC Cells Following Inhibition of NA(P)DH Oxidase
Protein concentration of cell lysates was measured as described in General Methods.
Cell lysates were prepared from the various treatments of the EOC cell lines, SKOV-3 and
MDAH-2774. HIF-1α was measured with an enzyme-linked immunosorbent assay kit (HIF-1α
ELISA, R&D Systems, Minneapolis, MN), per the manufacturer's protocol.
Statistical Analysis
For siRNA studies, data were analyzed using SPSS 15.0 for Windows. A mixed model
repeated measures ANOVA was used with treatment as the within factor and cell type as the
between factor. Paired comparisons with a Bonferroni correction were used to compare pairs of
treatments. Significant interactions between treatment and cell type were analyzed with
independent sample t-tests by cell type on each treatment.
For inhibition of NAD(P)H oxidase studies, data were analyzed using SPSS 19.0 for
Windows. Additionally, data were analyzed using one-way ANOVA (analysis of variance) with
Student Neuman-Kuels post-hoc comparisons.
Results
Cross-talk between MPO and iNOS gene expression in EOC cells
To determine the relationship between iNOS and MPO gene expression in EOC cells, we
utilized the siRNA technology to silence iNOS gene expression and examined MPO expression,
and vice-versa. Our results clearly indicate that silencing iNOS gene expression resulted in a 47

36
and 36% reduction in MPO gene expression in MDAH-2774 and SKOV-3, respectively (Figure
12A). Similarly, silencing MPO gene expression also resulted in a 43 and 42% reduction in
iNOS gene expression in MDAH-2774 and SKOV-3, respectively (Figure 12B). There was no
difference in MPO and iNOS mRNA levels between control and scrambled nonspecific siRNA
(data not shown). *p<0.05 as compared to control. Error bars represent standard deviation of
the mean.
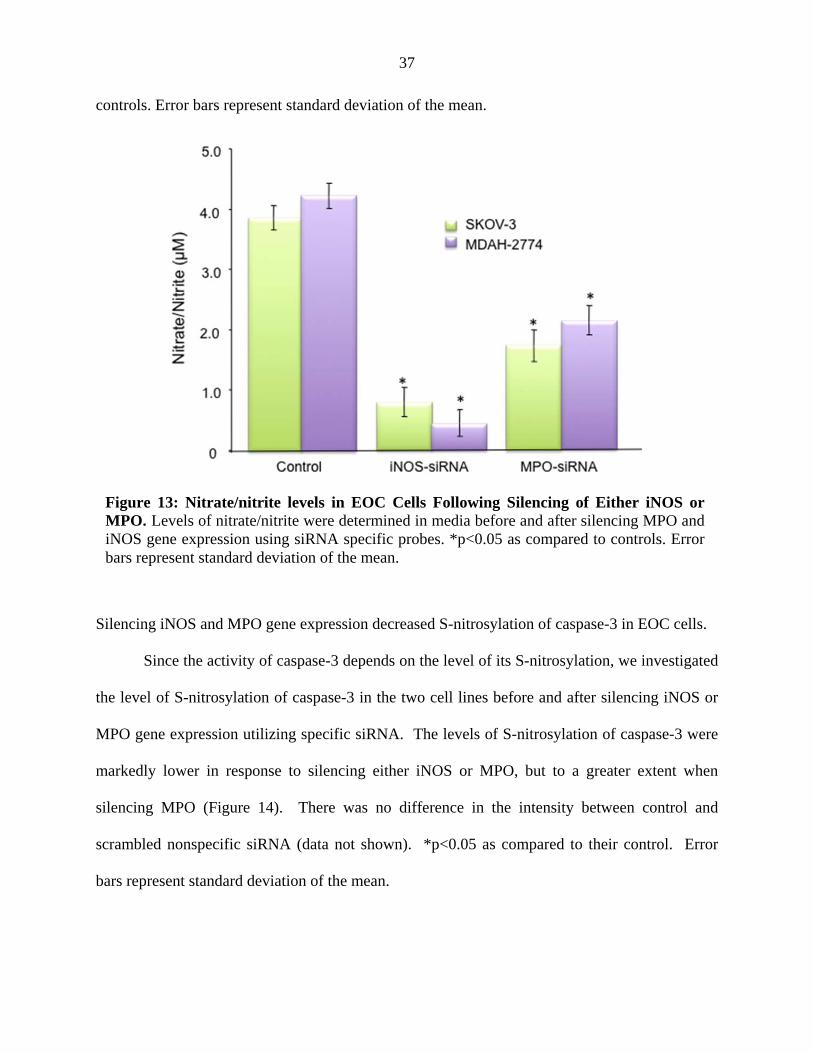
Silencing iNOS and MPO gene expression decreased nitrate/nitrite levels.
The Griess assay was performed in 24-hour media collected from after silencing iNOS or
MPO gene expression utilizing specific siRNA (Figure 13). *p<0.05 as compared to their
Figure 12: Real-time RT-PCR for MPO and iNOS in EOC Cells Following Silencing of Either iNOS or MPO. Total RNA isolated from EOC cells, MDAH-2774 and SKOV-3, before and after silencing MPO and iNOS gene expression using siRNA specific probes were analyzed utilizing real-time RT-PCR. There was no significant difference between controls and nonspecific scrambled siRNA (Data not shown). *p<0.05 as compared to control. Experiments were performed in triplicate.
37
controls. Error bars represent standard deviation of the mean.
Silencing iNOS and MPO gene expression decreased S-nitrosylation of caspase-3 in EOC cells.
Since the activity of caspase-3 depends on the level of its S-nitrosylation, we investigated
the level of S-nitrosylation of caspase-3 in the two cell lines before and after silencing iNOS or
MPO gene expression utilizing specific siRNA. The levels of S-nitrosylation of caspase-3 were
markedly lower in response to silencing either iNOS or MPO, but to a greater extent when
silencing MPO (Figure 14). There was no difference in the intensity between control and
scrambled nonspecific siRNA (data not shown). *p<0.05 as compared to their control. Error
bars represent standard deviation of the mean.
Figure 13: Nitrate/nitrite levels in EOC Cells Following Silencing of Either iNOS or MPO. Levels of nitrate/nitrite were determined in media before and after silencing MPO and iNOS gene expression using siRNA specific probes. *p<0.05 as compared to controls. Error bars represent standard deviation of the mean.

38
Silencing iNOS or MPO gene expression increased caspase-3 activity and apoptosis in EOC cells.
We have previously reported that EOC cell lines SKOV-3 and MDAH-2774 manifested a
marked decrease in their rate of apoptosis and significantly higher rate of proliferation [46,145].
The cause for lower apoptosis is not yet known. Caspase-3 activity increased by 161 and 418%
in SKOV-3 and 156 and 446% in MDAH-2774 when silencing iNOS or MPO gene expression
utilizing specific siRNA for iNOS or MPO, respectively (Figure 15A). TUNEL assay showed
that these treatments were associated with increased apoptosis in both cell lines (Figure 15B).
*p<0.05 as compared to control. Error bars represent standard deviation of the mean.
Figure 14. S-Nitrosylation of Caspase-3 in EOC Cells Following Silencing of Either iNOS or MPO. S-nitrosylation of caspase-3 in EOC cells, SKOV-3 before (1) and after silencing MPO gene expression with specific siRNA (2) and MDAH-2774 before (3) and after silencing iNOS gene expression with specific siRNA probes (4). There was no significant difference between controls and nonspecific scrambled siRNA (Data not shown). Experiments were performed in triplicate. *p<0.05 as compared to control.

39
DPI treated EOC cells had reduced levels of NAD(P)H oxidase mRNA.
Real-time RT-PCR was utilized to determine the mRNA level of the NAD(P)H oxidase
p22phox subunit, a representative O2 sensing subunit of NAD(P)H oxidase, in EOC cells treated
with and without DPI for 0.5 hours. NAD(P)H oxidase was significantly decreased by 51.6% in
SKOV-3 cells, and by 40.1% in MDAH-2774 cells (*p<0.05 as compared to control, Figure 16).
Figure 15: Measurement of Apoptosis Following Silencing of Either iNOS or MPO. A) Caspase-3 Activity was measured in EOC cells, MDAH-2774 and SKOV-3, before and after silencing iNOS or MPO gene expression utilizing siRNA specific probes. A caspase-3 colorimetric activity assay kit was utilized as described in methods. There was no significant difference between controls and nonspecific scrambled siRNA (Data not shown). As can been seen from this figure, caspase-3 activity was significantly increased when silencing MPO or iNOS. Experiments were performed in triplicate. *p<0.05 as compared to control. B) The amount of DNA fragmentation (apoptosis) was assessed by TUNEL assay for EOC cells, MDAH-2774 and SKOV-3, before and after silencing iNOS or MPO gene expression utilizing siRNA specific probes. Nuclei were stained with DAPI (blue) and apoptotic cells were visualized with fluorescein-12-dUTP (green). There was no significant difference between controls and nonspecific scrambled siRNA (Data not shown). Experiments were performed in triplicate.

40
DPI treated EOC cells exhibited increased caspase-3 activity and apoptosis.
Caspase-3 activity significantly increased, in a time dependent fashion, in SKOV-3 cells,
from 7.62 to 20.9, 20.3, 22.0, 24.5, 39.4, and 54.3 μM and in MDAH-2774 cells from 6.61 to
19.0, 20.4, 23.1, 25.6, 39.3, and 53.1 μM at the 0.5, 1, 3, 6, 12, and 24 hour time points,
respectively (*p<0.05 as compared to control, Figure 17A).
These results were confirmed by TUNEL staining, an indicator of the degree of DNA
fragmentation, which is representative of apoptosis. Nuclei were stained with DAPI (blue) and
apoptotic cells were visualized (60x) with fluorescein-12-dUTP (green). There was a significant
increase in TUNEL staining (green) as compared to controls, in both EOC cell lines (Figure 17B).
Figure 16: Real-time RT-PCR for NAD(P)H oxidase in EOC Cells Following Inhibition of NAD(P)H Oxidase. Expression of the NAD(P)H oxidase subunit p22phox mRNA levels in SKOV-3 and MDAH-2774 before and after DPI treatment (10 μM, 0.5 hrs) was measured using real-time RT-PCR. Results are representative of the mean of three independent experiments. (*p<0.05 as compared to their control).

41
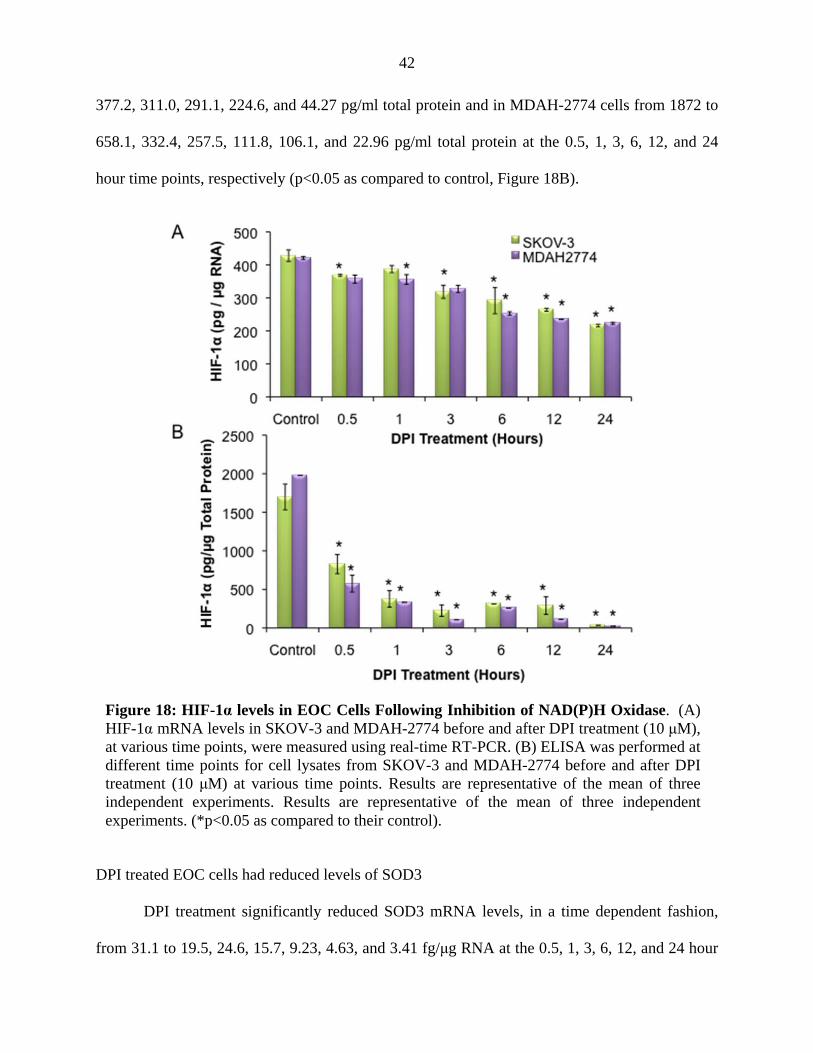
DPI treated EOC cells had reduced levels of HIF-1α.
DPI treatment significantly reduced HIF-1α mRNA levels, in SKOV-3 cells, from 428.2
to 368.2, 318.6, 268.8, 261.3, and 206.8 pg/μg RNA at the 0.5, 3, 6, 12, and 24 hour time points,
and in MDAH-2774 cells from 421.3 to 356.9, 356.1, 327.4, 260.3, 240.0 and 223.1 pg/μg RNA,
at the 0.5, 1, 3, 6, 12, and 24 hour time points, respectively (*p<0.05 as compared to control,
Figure 18A). There was no statistically significant change in HIF-1α mRNA levels at the 1 hour
time point in SKOV-3 cells.
HIF-1α protein levels, in SKOV-3 cells, were significantly reduced from 1699 to 828.0,
Figure 17: (A) Caspase-3 Activity and (B) Apoptosis in EOC Cells Following Inhibition of NAD(P)H Oxidase. (A) Caspase-3 activity was measured in cell lysates from SKOV-3 and MDAH-2774 before and after DPI treatment (10 μM) at various time points. (B) The amount of DNA fragmentation (apoptosis) was assessed by TUNEL assay in MDAH-2774 and SKOV-3, before and after DPI treatment (10 μM, 12 and 24 hrs) as compared to control cells. Nuclei were stained with DAPI (blue) and apoptotic cells were visualized (60x) with fluorescein-12-dUTP (green). Results are representative of the mean of three independent experiments. (*p<0.05 as compared to their control).
42
377.2, 311.0, 291.1, 224.6, and 44.27 pg/ml total protein and in MDAH-2774 cells from 1872 to
658.1, 332.4, 257.5, 111.8, 106.1, and 22.96 pg/ml total protein at the 0.5, 1, 3, 6, 12, and 24
hour time points, respectively (p<0.05 as compared to control, Figure 18B).
DPI treated EOC cells had reduced levels of SOD3
DPI treatment significantly reduced SOD3 mRNA levels, in a time dependent fashion,
from 31.1 to 19.5, 24.6, 15.7, 9.23, 4.63, and 3.41 fg/μg RNA at the 0.5, 1, 3, 6, 12, and 24 hour
Figure 18: HIF-1α levels in EOC Cells Following Inhibition of NAD(P)H Oxidase. (A) HIF-1α mRNA levels in SKOV-3 and MDAH-2774 before and after DPI treatment (10 μM), at various time points, were measured using real-time RT-PCR. (B) ELISA was performed at different time points for cell lysates from SKOV-3 and MDAH-2774 before and after DPI treatment (10 μM) at various time points. Results are representative of the mean of three independent experiments. Results are representative of the mean of three independent experiments. (*p<0.05 as compared to their control).

43
time points, respectively, in SOKV-3 cells (*p<0.05 as compared to control, Figure 19A).
Similarly, SOD3 mRNA levels were significantly reduced from 26.1 to 19.69, 16.0, 11.7, 8.63,
and 6.68 fg/μg RNA at the 0.5, 3, 6, 12, and 24 hour time points, respectively, in MDAH-2774
cells (p<0.05 as compared to control, Figure 19A). There was no significant change in SOD3
mRNA levels at the 1 hour time point in MDAH-2774 cells.
Cell lysates from SKOV-3 and MDAH2774 before and after DPI treatment were
precipitated with anti-SOD3 antibody and fractionated with SDS-PAGE. Membrane was probed
with anti-SOD3 antibody. B: Immunoprecipitation of SOD3 from SKOV-3 (Lane 1-7), and
MDAH2774 (Lane 8-14), exposed to SOD3. C: IP/Western blot results were scanned and
analyzed by NIH image J 3.0. SOD3 protein levels, in SOKV-3 cells, were reduced from 251.6
to 223.2, 215.7, 181.6, and 149.0 at the 3, 6, 12, and 24 hour time points, respectively (*p<0.05
as compared to control, Figure 19C) and in MDAH-2774 cells from 254.4 to 237.9, 230.4, 208.5,
188.4, and 170.1 at the 1, 3, 6, 12, and 24 hour time points, respectively (*p<0.05 as compared to
control, Figure 19C). There was no significant change in SOD3 protein levels at the 0.5 hour
time point in both SKOV-3 and MDAH-2774 cells and at the 1 hour time point in SKOV-3 cells.
Results were expressed as relative levels as compared to their control.

44
Discussion
Our results clearly show that modulation of pro-oxidant enzymes iNOS, MPO, or
NAD(P)H oxidase resulted in increased apoptosis as evident by an increase in caspase-3 activity
and TUNEL staining in EOC cells. Furthermore, silencing of iNOS or MPO resulted in a
decrease in nitrate/nitrite, and decrease in S-nitrosylation of caspase-3, suggesting a positive
regulation of apoptosis through S-nitrosylation of caspase-3. On the other hand, inhibition of
NAD(P)H oxidase decreased both SOD and HIF-1α expression in EOC cells, which is indicative
of a decrease in O2− production. Collectively, these findings further support a role for these key
enzymes in the pathogenesis of ovarian cancer through regulation of apoptosis and are
summarized in Figure 20.
Figure 19: SOD3 levels in EOC Cells Following Inhibition of NAD(P)H Oxidase. (A) SOD3 mRNA levels in SKOV-3 and MDAH-2774 before and after DPI treatment (10 μM), at various time points, were measured using real-time RT-PCR. (B) IP/Western blot was utilized to detect SOD3 protein levels in EOC cell lines, SKOV-3 and MDAH-2774 before and after DPI treatment. Lysates were precipitated with anti-SOD3 antibody and fractionated with SDS-PAGE. Membrane was probed with anti-SOD3 antibody. Immunoprecipitation of SOD3 exposed to SOD3 antibody are as follows: Lanes 1 & 8; control, Lanes 2 & 9; 0.5 hr, Lanes 3 & 10; 1 hr, Lanes 4 & 11; 3 hr, Lanes 5 & 12; 6 hr, Lanes 6 & 13; 12 hr, and Lanes 7 & 14; 24 hr. (C): IP/Western blot results were scanned and analyzed by NIH image J 3.0. Results are representative of the mean of three independent experiments. (*p<0.05 as compared to their control).

45
Molecular alterations that lead to apoptosis can be inhibited by S-nitrosylation of
apoptotic proteins such as caspases. Thus, S-nitrosylation conveys a key influence of NO on
apoptosis signaling and may act as a key regulator for apoptosis in cancer cells. It is known that
the effects of NO on apoptosis are not only stimulatory but also inhibitory as shown in this study.
These paradoxical effects of NO on apoptosis seem to be influenced by a number of factors. It
has been suggested that biological conditions, such as the redox state, concentration, exposure
time and the combination with O2, O2− and other molecules, determine the net effects of NO on
apoptosis [146]. Also, NO is implicated in both apoptotic and necrotic cell death depending on
the NO chemistry and the cellular biological redox state [146]. We have previously
demonstrated that the EOC cell lines, SKOV-3 and MDAH-2774, manifest lower apoptosis and
have significantly higher levels of NO due to the presence of high levels of iNOS [46,145].
Additionally, it has been shown that MPO can consume NO in the presence of the co-substrate
H2O2 [49]. Based on these reports we hypothesized that MPO uses the existing cellular NO to
produce NO+, which is the main source of protein S-nitrosylation, specifically caspase-3 in EOC
cell lines.
Since resistance to apoptosis is a hallmark of tumor growth, identifying mechanisms of
this resistance such as S-nitrosylation may be a key in cancer progression. S-nitrosylation is
Figure 20: Summary of the effect of modulating oxidative stress in EOC cell lines, SKOV-3 and MDAH-2774. Silencing MPO or iNOS, and inhibition of NAD(P)H oxidase led to an overall increase in apoptosis in EOC cells.

46
reversible and seemingly specific post-translational modification that regulates the activity of
several signaling proteins [147]. S-nitrosylation of the catalytic site cysteine in caspases serves
as an on/off switch regulating caspase activity during apoptosis in endothelial cells, lymphocytes,
and trophoblasts [129-131]. Several mechanism of denitrosylation have now been demonstrated
and include activation of the Fas apoptotic pathway or through the thioredoxin or S-
nitrosoglutathione pathways [127,148]. Thus, targeting MPO may be a potential therapeutic
intervention to reverse the resistance to apoptosis in epithelial ovarian cancer cells.
In this study we also sought to determine the effects of inhibiting the generation of ROS
by DPI, a well-characterized, potent inhibitor of flavoenzymes including NAD(P)H oxidase, on
apoptosis of EOC cells, and whether these effects are associated with SOD3 and HIF-1α
expression [149,150]. Diphenyleneiodonium has been used to inhibit ROS production mediated
by NAD(P)H oxidase in various cell types [134,150,151]. We have demonstrated EOC cells to
have elevated NAD(P)H oxidase, which was subsequently reduced by DPI, a NAD(P)H oxidase
inhibitor, as indicated by a decrease in the NAD(P)H oxidase p22phox subunit. These findings are
supported by the fact that increased NAD(P)H oxidase levels promote the tumorigenic potential
of NIH3T3 mouse fibroblasts as well as the DU-145 prostate epithelial cells [149].
Inhibition of NAD(P)H oxidase has been reported to significantly limit the conversion of
molecular O2 to O2●–, H2O2 and other ROS [137,138]. Growing evidence suggests that cancer
cells exhibit increased intrinsic ROS stress, due in part to oncogenic stimulation, increased
metabolic activity, and mitochondrial malfunction [152,153]. Further support for this increase in
ROS is demonstrated by a cross-talk between mitochondria and the O2●– generating NAD(P)H
oxidase in ovarian tumors [90]. The mitochondria controls NAD(P)H oxidase redox signaling,
therefore loss of this control contributes to tumorigenesis [90]. In agreement with a previous
study, we have shown that inhibition of NAD(P)H oxidase-dependent ROS generation with DPI

47
induced apoptosis in EOC cells, suggesting that the ROS produced by NAD(P)H oxidase, at least
in part, exert an anti-apoptotic function [154]. This anti-apoptotic mechanism involves induced
inhibition of phosphorylation of AKT and subsequent suppression of AKT-mediated
phosphorylation of ASK1 on Ser-83 [154-156]. Furthermore, the anticancer drug paclitaxel-
induced apoptosis of ovarian cancer cells is mediated by negative regulation of AKT–ASK1
phosphorylation signaling whereas AKT activation by H2O2 confers protection against apoptosis
[154-156].
In addition, we have shown that DPI treatment significantly reduced SOD3 and HIF-1α
mRNA levels as early as 30 minutes after treatment, with significant further reduction over the
following 24 hours in EOC cells. A parallel reduction in protein levels, although not with
equivalent magnitude, was also observed for both SOD3 and HIF-1α as determined by
IP/Western blot and ELISA. This may be a consequence of post-translation modifications, which
may result in increased stability and/or lower degradation of the proteins. These findings
demonstrated that inhibition of NAD(P)H oxidase attenuates the expression of both SOD3 and
HIF-1α, at the mRNA and protein levels. Moreover, our results showed that the inhibition of
NAD(P)H oxidase significantly induced apoptosis of EOC cells, as assessed by both caspase-3
activity and TUNEL assays. Therefore, there appears to be a strong association between the
inhibition of NAD(P)H oxidase and the subsequent reduction in SOD3 and HIF-1α levels and
increase in apoptosis of EOC cells.
The correlation between HIF-1α and cellular apoptosis has previously been demonstrated
in lung and hepatoma cancer cells [138,157]. Apoptosis can regulate HIF-1α through the
modulation of the ratio of pro-apoptotic Bcl-2 and anti-apoptotic Bcl-2 family proteins [158].
Anti-apoptotic Bcl-2 and Bcl-xL levels have been shown to increased and pro-apoptotic BAX
and BAK levels were decreased with the over-expression of HIF-1α [158]. Also, it has been

48
reported that inhibition of HIF-1α by rapamycin resulted in an increase in apoptosis of cancer
cells, and decrease in the expression of apoptosis inhibitor Bcl-2 in ovarian cancer xenografts
and that rapamycin enhanced cell death through the inhibition of cell survival signals in a
number of cell lines [159]. Rapamycin has been demonstrated to decrease HIF-1α through
interference with the mechanism that promotes the stabilization of this protein under hypoxic
conditions [160].
Most of the generated O2●– undergoes a nonenzymatic or SOD-catalyzed reaction,
generating H2O2 as an end product [161-163]. Hydrogen peroxide is freely diffusible through
biological membranes, and its overproduction is extremely destructive to cells and tissues, yet it
is physiologically important among ROS given its relative long half-life in the intracellular space,
and that it is the precursor of the more toxic hydroxyl radicals [162-164]. It has been reported
that increased SOD3 expression in ovarian cancer is a cellular response to intrinsic ROS stress
[70]. However, the role of SOD3 in tumorigenesis is somewhat controversial. It has been
recently demonstrated, in mice, that subcutaneous inoculation of the SOD3 gene significantly
suppressed lung cancer metastasis and that over-expression of SOD3 resulted in in vivo
inhibition of growth of B16-F1 melanoma tumors [165,166]. In contrast, inhibition of SOD has
been shown to selectively induce apoptosis of leukemia and ovarian cancer cells, confirming our
findings from the present study [34].
Under hypoxic conditions, high expression levels of SOD3 are reported to significantly
induce the expression of HIF-1α in tumors, and thus demonstrate a relationship between the
SOD3 and HIF-1α pathways [159]. The mechanism by which SOD3 upregulates HIF-1α is not
well understood, but there is substantial evidence to suggest that this mechanism is modulated, in
part, by the steady-state level of O2●– and the stabilization of HIF-1α [167]. Therefore, reduction
of O2●– levels via inhibition of NAD(P)H oxidase may result in lowering SOD3 levels, leading to

49
the destabilization of HIF-1α, subsequently increasing apoptosis.
Collectively, based on previously discussed published reports and the results from this
study, we conclude that lowering oxidative stress, either through inhibition of iNOS, MPO or
NAD(P)H oxidase induces apoptosis in ovarian cancer cells and may serve as potential targets
for future ovarian cancer therapy.

50
CHAPTER V: MYELOPEROXIDASE AND FREE IRON LEVELS: POTENTIAL
BIOMARKERS FOR EARLY DETECTION AND PROGNOSIS OF OVARIAN
CANCER
(This chapter contains previously published material. See Appendix [168])
Approach
Routine screening for ovarian cancer in the general population is not recommended
because traditional screening methods lack sensitivity and specificity. We are the first to report
an increase in MPO expression in epithelial ovarian cancer as compared to normal ovarian
tissues and cells. This expression of MPO was surprising, as it is believed to be expressed solely
in cells of hemopoietic origin. The elucidation of the function of MPO in EOC is the basis for
the chapter. Recently it has been shown in vitro that HOCl, produced from H2O2 by MPO in the
presence of chloride, can destroy MPO and serve as a source of free iron [169]. This study
sought to identify whether a relationship exists between serum MPO and free iron with stage of
ovarian cancer and their potential roles as biomarkers for the early detection of ovarian cancer.
Both serum and tissue samples were collected from women with stages I through IV ovarian
cancer, benign gynecologic conditions, inflammation (endometriosis), and healthy controls.
Myeloperoxidase ELISA and VITROS Fe Slide assays were used to measure serum and tissue
MPO and free iron levels, respectively. The VITROS Fe Slide Assay was performed in
collaboration with the Chemistry Department at Wayne State University, Detroit, MI.
Data were analyzed using SPSS 19.0 for windows (SPSS for Windows, Chicago, IL).
Data were analyzed using one-way ANOVA (analysis of variance) with Student Neuman-Kuels
post-hoc comparisons. P < 0.05 were considered statistically significant for all analyses.
Introduction
The underlying pathophysiology of epithelial ovarian cancer is not clearly understood [1].

51
Because early-stage ovarian cancer presents with nonspecific symptoms, diagnosis is often not
made until after the malignancy has spread beyond the ovaries [170]. The development of
sensitive and specific methods for early detection has been a priority as a means for improving
the diagnosis and treatment of this disease.
The role of MPO, an enzyme stored in the azurophilic granules of polymorphonuclear
neutrophils and macrophages, and is released into the extracellular fluid in response to
inflammation in carcinogenesis, has been implicated in both the activation of procarcinogens to
genotoxic intermediates and the potentiation of xenobiotic carcinogenicity [109,110]. Clinical
studies have documented the association between inflammation and certain cancers for decades
[171]. There is convincing evidence that inflammation is a contributing factor in ovarian cancer
development, but the role of complement-induced inflammation in tumor initiation or
progression remains poorly investigated [172,173]. Stimulated inflammatory cells are capable of
inducing genotoxic effects, such as DNA strand breaks, sister chromatid exchanges and
mutations, and promotion of neoplastic transformation in nearby cells [174]. Myeloperoxidase
utilizes H2O2, the dismutation product O2●–, to generate HOCl, a cytotoxic and antimicrobicidal
oxidant.
We have recently reported that MPO is expressed in EOC cells and tissues with limited
or no expression in normal ovarian tissues [45]. Studies from our laboratory clearly indicated
that MPO is responsible for the S-nitrosylation of caspase-3, which inhibited its activity [45].
Silencing MPO gene expression by the utilization of MPO specific siRNA induced apoptosis in
EOC cells through a mechanism that decreases MPO-induced S-nitrosylation of caspase-3 [147].
Additionally, we have compelling evidence that leads us to believe that MPO may serve as a
source of free iron under oxidative stress, where both NO and O2●– are elevated [175]. Recently
we have shown that, hypochlorous acid (HOCl), the final product of MPO, displays the potential

52
capacity to mediate hemoprotein heme destruction and subsequent iron release, providing a
potential link between elevated MPO and free iron [176-178].
The free iron generated by hemeoprotein destruction not only contributes to elevation of
serum iron levels, but may also induce oxidative stress, which can promote lipid peroxidation,
DNA strand breaks, and modification or degradation of biomolecules [179-181]. Iron reacts
with H2O2 and catalyzes the generation of highly reactive hydroxyl radicals, which in turn
further increases free iron concentrations by the Fenton and Haber–Weiss reaction [182].
Several studies from our laboratories have provided a mechanistic link between oxidative stress,
MPO, higher levels of HOCl and higher free iron that could explain the observed accumulation
of free iron in epithelial ovarian cancers tissues [45,175-178].
The search for non-invasive, cost-effective ovarian cancer biomarker tests has been
ongoing for many years. Immunizations of mice with ovarian cancer cells has led to hybridoma
validation by ELISA, while flow cytometry analysis permitted the discovery of cancer antigen
(CA)-125 and mesothelin [5]. Furthermore, the screening of an array of 21,500 unknown
ovarian cDNAs hybridized with labeled first-strand cDNA from ten ovarian tumors and six
normal tissues led to the discovery of human epididymis protein 4 (HE4) [16]. Most
interestingly, HE4 is overexpressed in 93% of serous and 100% of endometrioid EOCs, and in
50% of clear cell carcinomas, but not in mucinous ovarian carcinomas [183]. Although it is not
tissue-specific, a number of independent microarray studies identified HE4 as one of the most
useful biomarkers for ovarian cancer [13,16,184,185]. In addition to expression on the cellular
level, secreted HE4 was detected in high levels in the serum of ovarian cancer patients [186].
Additionally, combining CA-125 and HE4 is a more accurate predictor of malignancy than either
alone [187-189].
In this study, we sought to identify a positive correlation between serum MPO and free

53
iron with stage of ovarian cancer as well as tissue MPO and free iron with stage of ovarian
cancer and assess their potential roles as biomarkers for the early detection of ovarian cancer.
Methods
Patient Population
A description of the demographics of the study groups are listed in Tables 2 and 3.
Table 2. Descriptive statistics for age including Mean, Median, and Standard deviation, n=30.

54
Ovarian Cancer Cases
Serum (N=15) and tissues (N=27) were collected from patients presenting to the
gynecologic oncology division of Karmanos Cancer Institute with suspected EOC were invited
to participate in a prior study. They underwent informed consent (Wayne State University
Human Subject Committee protocol number 027201MP2E) and agreed to provide a blood
sample prior to treatment (chemotherapy or surgery). Cases include early through late-stage
diagnoses as well as a variety of histologies. Stage I is designated as early-stage, as compared to
remaining stages II through IV (II-IV).
Table 3. Comparative study of the cases and control based on cancer status.
Pearson Chi-Square was used for statistical test, p<0.05 was considered statistically significant. There was no statistically difference between the two groups based on age and race. However, the region or source where the specimen was obtained demonstrated a statistically significant difference that can be attributed to the regional and centers characteristics.

55
Benign Controls
Serum (N=14) and tissues (N=14) from patients with benign gynecologic conditions was
procured through the Cooperative Human Tissue Network (CHTN). These include women
diagnosed with ovarian cysts, endometriosis (inflammation), or uterine fibroids.
Healthy Controls
Healthy control sera (n=8) were procured from women recruited through a local
community organization. These women presented as healthy, with no history of cancer. Basic
information such as age, race, and evidence of benign gynecologic conditions, if any, was
obtained at the time of informed consent. The age and racial makeup of this group overlaps with
patients with ovarian cancer and benign conditions but is not explicitly matched.
Additionally, we utilized matched tissue samples from the same patient derived serum
samples to assess the correlation between MPO and iron in these tissues. In this way we
assessed if there was an expected discrimination in the tissues and to what extent that
discrimination diluted in the serum.
Sample Collection and Processing
A single 7 cc vial of blood was obtained during normal phlebotomy and the serum was
isolated after clotting. Serum was collected into a red top or SST blood tube. The serum clot was
allowed to form over 1-2 hours and was pelleted in a desktop centrifuge at 2400 rpm for 10 min.
The serum was removed by pipetting and ~1 ml aliquots were stored at –80 °C. Samples were
labeled with a coded identifier.
Detection of Myeloperoxidase
Myeloperoxidase was detected with the Myeloperoxidase Enzyme Immunometric Assay
Kit (Enzo Life Sciences, Farmingdale, NY). This is a well-established assay in our laboratory
and was performed according to the manufacturer’s protocol. This kit is for the quantitative

56
determination of MPO in biological fluids or tissues. The kit uses a monoclonal antibody to
MPO immobilized on a microtiter plate to bind the MPO in the standards or sample. A native
MPO Standard was provided in the kit. Rabbit polyclonal antibody to MPO was added and
binds to the MPO captured on the plate followed by the addition of goat anti-rabbit IgG
conjugated to horseradish peroxidase, which binds to the polyclonal MPO antibody. The
enzyme reaction is stopped generating a red color detected at 450 nm. The measured optical
density is directly proportional to the concentration of MPO in either standards or samples. The
sensitivity of the assay, defined as the concentration of human MPO was determined to be 0.019
ng/mL. All experiments were performed in triplicate.
Detection of Free Iron
The VITROS Fe Slide method (VITROS 750, Johnson & Johnson, Rochester, USA) was
used for detecting serum and tissue iron levels as described by the manufacturer’s protocol.
Briefly, 10 L of sample is applied to a VITROS Fe DT Slide, which then is loaded into a
VITROS 950 chemistry system (Ortho Clinical Diagnostics, Inc) located at the University Health
Building. The iron in the sample was removed from transferrin at acidic pH and migrates to a
reducing layer where ascorbic acid reduces it to the ferrous form. The ferrous iron then is bound
to a dye, producing color that is detected (600 nm) as a rate of change in reflection density.
While most females have serum iron levels between 37 and 170 g/dL, this assay has a
reportable range of 10 to 500 g/dL, and is therefore is suitable for detection in both tissues and
sera. All experiments were performed in triplicate.
Statistical Analysis
Data were analyzed using SPSS 19.0 for windows (SPSS for Windows, Chicago, IL).
Data were analyzed using one-way ANOVA (analysis of variance) with Student Neuman-Kuels
post-hoc comparisons. P < 0.05 was considered statistically significant for all analyses.

57
Results
Ovarian cancer stages II-IV manifested higher levels of tissue MPO.
All stages of ovarian cancer had significantly higher levels of MPO as compared to
benign and inflammatory groups (Figure 19, p< 0.05). Also, ovarian cancer stages II-IV had a
significantly higher level of MPO as compared to early-stage ovarian cancer (Figure 21, p<0.05).
The benign group is not significantly different from the inflammatory group. At the time of
running this experiment, no healthy control tissue samples were available.
Ovarian cancer stages II-IV manifested higher levels of serum MPO.
Ovarian cancer stages II-IV had significantly higher levels of MPO as compared to early-
Figure 21: Tissue MPO: Tissue MPO was detected with the Myeloperoxidase Enzyme Immunometric Assay Kit, as described in methods. Early-stage ovarian cancer and ovarian cancer stages II-IV are significantly different than all other groups and each other (p< 0.05). The benign group is not significantly different from the inflammatory group. At the time of running this experiment, no healthy control tissue samples were available. In benign gynecologic conditions, the outlier represents a value more than three interquartile ranges above the 75th percentile value.

58
stage ovarian cancer, control, benign, and inflammatory groups (p<0.05, Figure 22). Early-stage
ovarian cancer and inflammatory gynecologic conditions are significantly different from the
control and benign groups, while not significantly different from one another (p<0.05, Figure 22).
Also, control and benign groups were not significantly different.
Ovarian cancer stages II-IV manifested higher levels of tissue iron.
All stages of ovarian cancer had significantly higher levels of tissue iron than benign and
inflammatory groups (p<0.05, Figure 23). In addition, ovarian cancer stages II-IV had higher
levels of iron as compared to early-stage ovarian cancer (p<0.05, Figure 23). The benign group
is not significantly different from the inflammatory group. At the time of running this experiment,
Figure 22: Serum MPO: Serum and tissue MPO was detected with the Myeloperoxidase Enzyme Immunometric Assay Kit, as described in methods. Ovarian cancer stages II-IV are significantly different than all other groups (p<0.05). Early-stage ovarian cancer and inflammatory gynecologic conditions are different from control and benign groups, while not one another (p<0.05). Control and benign groups are not statistically different. In stages II-IV, the outlier represents a value more than three interquartile ranges above the 75th percentile value.
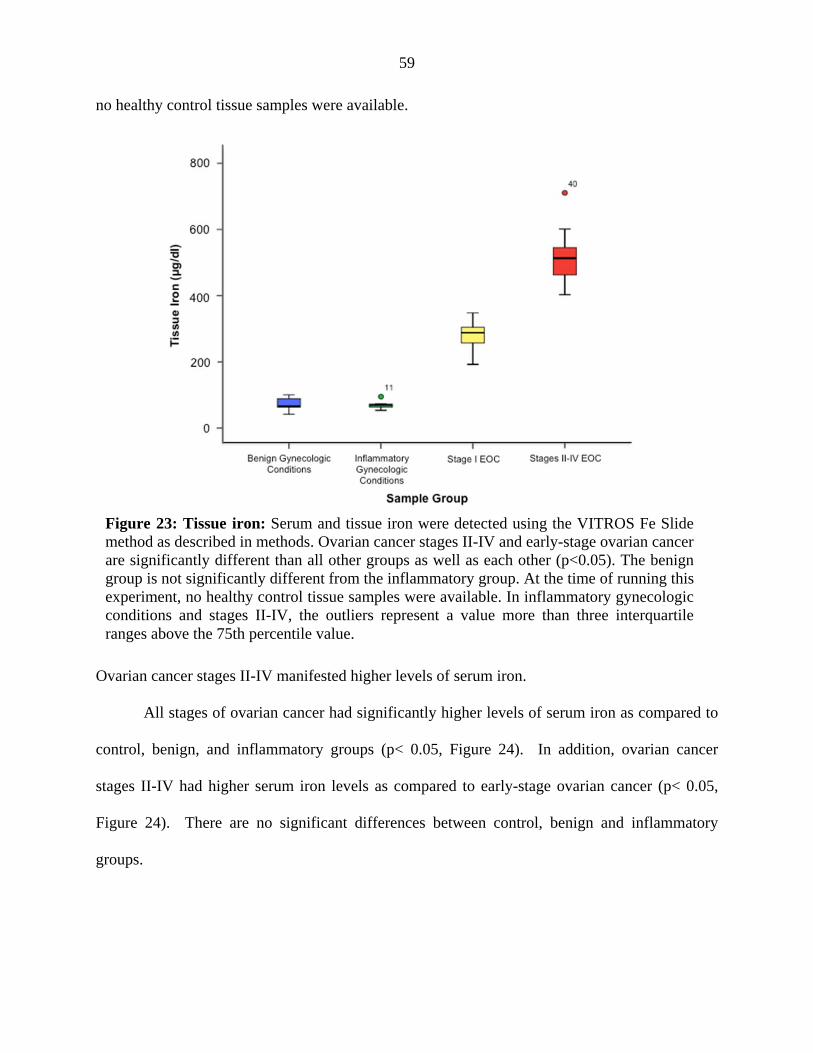
59
no healthy control tissue samples were available.
Ovarian cancer stages II-IV manifested higher levels of serum iron.
All stages of ovarian cancer had significantly higher levels of serum iron as compared to
control, benign, and inflammatory groups (p< 0.05, Figure 24). In addition, ovarian cancer
stages II-IV had higher serum iron levels as compared to early-stage ovarian cancer (p< 0.05,
Figure 24). There are no significant differences between control, benign and inflammatory
groups.
Figure 23: Tissue iron: Serum and tissue iron were detected using the VITROS Fe Slide method as described in methods. Ovarian cancer stages II-IV and early-stage ovarian cancer are significantly different than all other groups as well as each other (p<0.05). The benign group is not significantly different from the inflammatory group. At the time of running this experiment, no healthy control tissue samples were available. In inflammatory gynecologic conditions and stages II-IV, the outliers represent a value more than three interquartile ranges above the 75th percentile value.
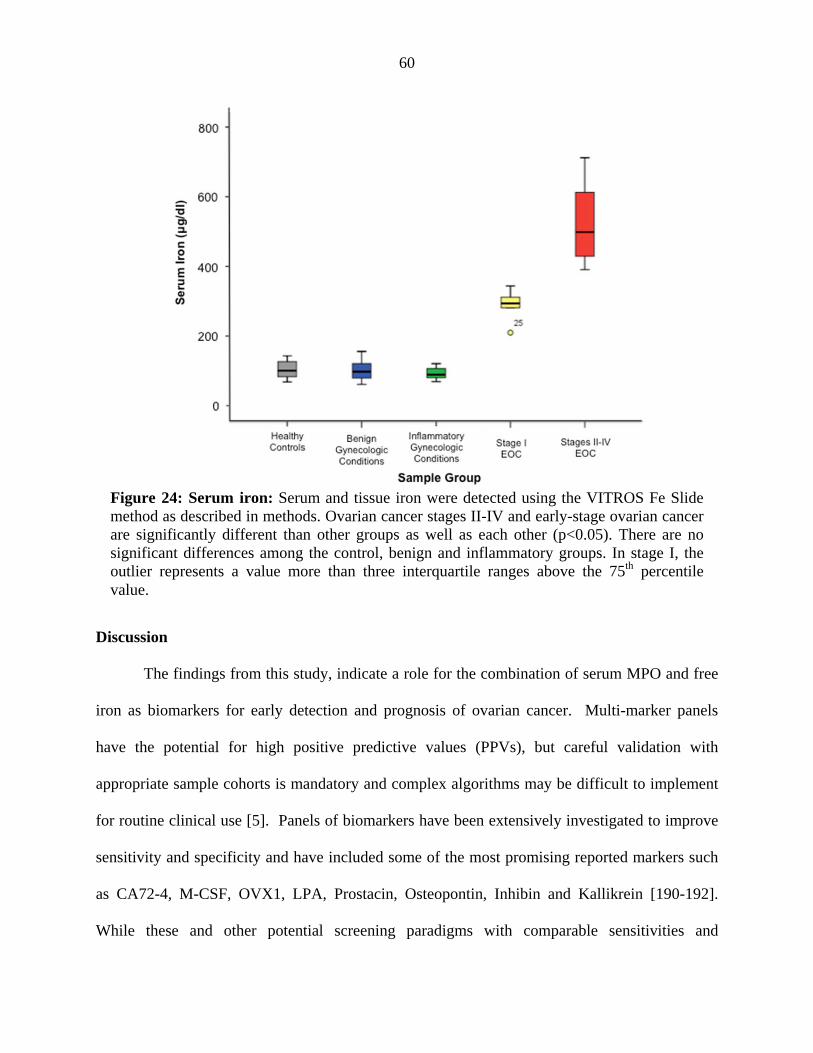
60
Discussion
The findings from this study, indicate a role for the combination of serum MPO and free
iron as biomarkers for early detection and prognosis of ovarian cancer. Multi-marker panels
have the potential for high positive predictive values (PPVs), but careful validation with
appropriate sample cohorts is mandatory and complex algorithms may be difficult to implement
for routine clinical use [5]. Panels of biomarkers have been extensively investigated to improve
sensitivity and specificity and have included some of the most promising reported markers such
as CA72-4, M-CSF, OVX1, LPA, Prostacin, Osteopontin, Inhibin and Kallikrein [190-192].
While these and other potential screening paradigms with comparable sensitivities and
Figure 24: Serum iron: Serum and tissue iron were detected using the VITROS Fe Slide method as described in methods. Ovarian cancer stages II-IV and early-stage ovarian cancer are significantly different than other groups as well as each other (p<0.05). There are no significant differences among the control, benign and inflammatory groups. In stage I, the outlier represents a value more than three interquartile ranges above the 75th percentile value.

61
specificities have been previously reported, these assays often require specialized equipment not
routinely utilized in the clinical immunoassay laboratory, or rely on complex computational
algorithms to generate adequate assay performance [193]. With an ovarian cancer prevalence of
only 1 in 2500 among postmenopausal women in the U.S., an effective screening strategy for the
general population needs to attain a sensitivity of 75% and specificity about 99.6% to attain a
minimally acceptable potential PPV of 10% for the detection of all stages of ovarian cancer
[193]. No single biomarker reported to date has met these thresholds.
The observation of the involvement of MPO in oxidative stress and inflammation has
been a leading factor in the study of MPO as a possible marker of plaque instability and a useful
clinical tool in the evaluation of patients with coronary heart disease [194]. Recent genetic
studies implicated MPO in the development of lung cancer by demonstrating a striking
correlation between the relative risk for development of the disease and the incidence of
functionally distinct MPO polymorphisms [195].
We now have substantial evidence to believe that the presence of MPO may play a role in
maintaining the oncogenic phenotype of EOC cells [45]. In support of this notion,
polymorphisms at position –463 (G to A) in the promoter region of the MPO gene have been
identified, with the A variant allele related to decreased transcriptional activity and decreased
MPO expression, which may be associated with reduced risk of human cancers [196].
Myeloperoxidase requires heme as a cofactor, which consists of an iron atom contained in the
center of a large heterocyclic organic ring [197]. Thus, the MPO G allele might produce more
ROS when iron intake is high. Previous studies have investigated the combined roles of MPO
and iron levels on cancer development, as well as assessed the impact of MPO genetic
polymorphisms on the development of cirrhosis with hereditary hemochromatosis [41,198].
They found that the MPO GG genotype was more common in patients with cirrhosis than in

62
those without, modifying the clinical penetrance of hepatic iron overload with respect to hepatic
fibrosis in hereditary hemochromatosis.
Myeloperoxidase levels reported for various inflammatory disorders are coincidentally
lower than those levels found in all stages of ovarian cancer. A previous study reported normal
serum MPO and iron levels as 62 ± 11 ng/ml and 96 ± 9 g/dl, respectively [199]. However,
there was a significant increase in serum MPO and iron levels to 95 ± 20 ng/ml, and 159 ± 20
g/dl, respectively, in asthmatic individuals [199]. Although there was an increase in this
reported serum iron, these levels still fell within the normal range (50 to 170 μg/dl) [200,201].
Other studies have showed that an elevated MPO level, reaching up to 350 ng/ml, in serum
plasma, was indicative of a higher risk for cardiovascular events in patients hospitalized for chest
pain [202,203]. Our data showed an overlap between serum MPO levels in early-stage ovarian
cancer with inflammation. However, serum iron levels were significantly higher in early-stage
ovarian cancer as compared to inflammation. Thus, there is a potential for a false positive with
MPO alone in patients with cardiovascular, inflammation, and/or asthmatic disorders.
Utilizing serum iron levels alone as a biomarker is also not sufficient for early detection
of ovarian cancer due to many uncontrolled variables, i.e. dietary intake, supplements, effects of
other iron-generating enzymes or factors, and more importantly they are not as specific as MPO
levels. Specifically, in iron deficiency anemic patients, their free iron levels may become a
confounding factor in its utilization for early detection of ovarian cancer. Thus, anemia should
be ruled out to eliminate any overlap that would lead to misdiagnosis. The incorporation of iron
deficiency anemic patients in a logistic regression model will help determine its overlap with
early-stage ovarian cancer. Additionally, currently available clinical studies focused on either
biochemical or more recently, genetic markers of iron overload have reported conflicting results
regarding the use of iron levels alone for diagnosis [204-207]. For these reasons, we expect that
63
the combination of serum MPO and iron levels to yield a higher power of specificity and
sensitivity that should distinguish women with early-stage ovarian cancer from other disorders,
specifically inflammation. Additionally, combining serum MPO and iron levels with the best
currently existing biomarkers through the creation of a logistic regression model may increase
the overall predictive values. Collectively, our data strongly supports a role for serum MPO and
free iron in the pathophysiology of ovarian cancer, which thereby qualifies them to serve as
biomarkers for early detection and prognosis of ovarian cancer.
To validate MPO and free iron as biomarkers for early detection of ovarian cancer, we
are currently planning a follow up study on a larger population with the principal endpoint of
establishing the best cutoff point using the receiver operating characteristic (ROC) method [208-
210]. Also, we will generate sensitivity, specificity, and positive and negative predictive values
for serum MPO and free iron alone and in combination. These results will be compared to the
existing CA-125 biomarker. As a secondary endpoint, we plan to performed survival analysis
using the Kaplan-Meier method with MPO and free serum levels as factors.

64
CHAPTER VI: A NAD(P)H OXIDASE SINGLE NUCLEOTIDE POLYMORPHISM IS
ASSOCIATED WITH AN INCREASED RISK OF OVARIAN CANCER
Approach
In Chapter III, we observed an increase in NAD(P)H oxidase expression in ovarian
cancer as compared to normal ovarian tissues, which serves as the rationale for this chapter.
Additionally, in Chapter IV, we observed that inhibition of NAD(P)H oxidase lead to an increase
in apoptosis in EOC cells, thus indicating a role for this enzyme in the pathogenesis of ovarian
cancer, and serves as the rationale for this chapter. Single nucleotide polymorphisms are
associated with increased risk of several cancers. We evaluated the association of a SNP
(rs4673) in the CYBA gene, encoding the p22phox subunit of NAD(P)H oxidase, substituting
allele C with T at position 242 located on chromosome 16q24, in high-risk individuals with or
without ovarian cancer, with or without a deleterious BRCA1/2 mutation. This NAD(P)H
oxidase subunit serves as an oxygen detector and confers the activity of the enzyme.
To achieve this study, 139 individuals were recruited, in collaboration with the Karmanos
Cancer Institute, Detroit, MI, based on personal and family history of cancer. Blood samples
were collected and underwent DNA extraction followed by TaqMan® SNP Genotype analysis
for rs4673 utilizing the QuantStudio 12K Flex Real-Time PCR System in collaboration with the
Applied Genomics Technology Center (AGTC, Wayne State University, Detroit, MI). Data
were analyzed using SPSS (IBM, Armonk, New York) for Mac V.21. Pearson Chi-square
analyses were performed 1) to compare the SNP mutation frequencies in the present sample to
that in the general population; 2) to examine the associations among BRCA1/2 status, SNP status,
and cancer status. Binary logistic regression analyses were performed to study the response of
SNP status to the changes in age at enrollment, race, BRCA1/2 status, and cancer status; using
the likelihood ratio forward stepwise methods.

65
Introduction
While the chances of long-term patient survival are significantly increased when ovarian
cancer is detected at its early stage, to date, there is no reliable method available for early
detection of ovarian cancer [2]. In fact, the absence of definitive symptoms causes the survival
following diagnosis and treatment of ovarian cancer to fall from a 90% 5-year survival rate in
cases when detected at its early stage, to less the than 30% chance when the disease is detected at
a late stage [2,211,212].
Epidemiologic studies have clearly established the role of family history as an important
risk factor for both breast and ovarian cancers [213]. It is well established that germline
mutations in BRCA1 or BRCA2 result in a predisposition to ovarian cancer, however at a rate of
only 20-40%, suggesting the presence of other, unidentified mutations in other predisposition
genes [214-217]. Additional genetic variations including SNPs, many of which have been
identified in recent genome-wide association studies (GWAS), have been hypothesized to act as
low to moderate penetrant alleles which contribute to breast and ovarian cancer risk, as well as
other diseases, [216,218,219]. Single-nucleotide polymorphisms arise because of point
mutations that are selectively maintained in populations that are distributed throughout the
human genome at an estimated overall frequency of at least one in every 1000 base pair [220].
Non-synonymous SNPs substitute encoded amino acids in proteins, and are more likely to alter
the structure, function, and interaction of the protein [216,221]. Therefore SNPs are good
candidates as disease-modifiers and have been associated with an altered cancer risk.
It has been reported that mutations in specific regions of NAD(P)H oxidase subunits
contribute to the enhancement of the enzyme activity with subsequent increase in O2●−
production, contributing to enhanced levels of oxidative stress [79,80]. Specifically, an increase
in NAD(P)H oxidase activity has been associated with a specific SNP in the CYBA gene (rs4673),

66
encoding the p22phox subunit of NAPDH oxidase, resulting in a CAC/TAC replacement at
position 242 located on chromosome 16q24, leading to a nonconservative substitution of
histidine-72 with a tyrosine [81]. This SNP is also associated with an increased risk for other
diseases where oxidative stress plays a critical role in their pathophysiology, including
cardiovascular disease, asthma, and diabetic nephropathy [81-83].
Oxidative stress has been implicated in the pathogenesis of several malignancies,
including ovarian cancer [20,47]. Specifically, we have recently demonstrated an increased
expression of pro-oxidant enzymes such as iNOS, MPO, NAD(P)H oxidase, as well as an
increase in NO as indicated by increased nitrate/nitrite in EOC tissues and cells [46,47]. In this
study, we report that the NAD(P)H oxidase 242C>T SNP is significantly associated with not
only ovarian cancer patients, but also with high-risk individuals. A combination analysis of this
SNP with the currently used BRCA1/2 mutation risk factor resulted in an even stronger
association. These findings suggest a possible future role of this SNP as a biomarker to identify
those at an increased risk for development of ovarian cancer.
Methods
Patient Population
A total of 139 individuals were recruited through the Karmanos Cancer Institute’s
Genetic Registry (KCIGR), Detroit, MI. Participants in the genetics registry were recruited
through the Karmanos Cancer Institute’s cancer genetic counseling service and included
individuals determined to be eligible for BRCA1 and BRCA2 germline testing based on their
personal and family history of cancer and were identified as having ovarian cancer or were
“high-risk” based on this family history [211]. Research activities were conducted with the
approval of Wayne State University Institutional Review Board. DNA samples were utilized to
determine the frequency of the polymorphism in the CYBA gene that results in a CAC/TAC

67
replacement (rs4673). High-risk non-cancer and ovarian cancer samples used for this study were
collected from participants recruited between 1999 and 2012. At the time of enrollment in the
genetics registry, individual and family cancer history was obtained including history of ovarian
cancer and other cancers [211]. Genetic testing for BRCA1/2 was conducted by Myriad Genetics
Laboratories (Salt Lake City, Utah) [211]. Individuals with unknown BRCA1/2 mutation status
were excluded from of BRCA1/2 analysis. A description of the patient demographics is in Table 2.
Purification of DNA for SNP Sequencing
DNA, from blood samples, was isolated by the Applied Genomics Technology Center
(AGTC, Detroit, MI). DNA was extracted with QIAamp DNA mini kit (Qiagen) [211].
TaqMan SNP Genotyping Assay for p22phox 242 C>T
The TaqMan® SNP Genotyping Assay Set (Applied Biosystems, Carlsbad, CA) for
rs4673 (NCBI dbSNP genome build 37, MAF source 1000 genomes) was used to genotype the
242C>T SNP in the CYBA gene, which encodes the p22phox subunit of NAD(P)H oxidase,
located on chromosome 16q24. The AGTC also performed this assay. Analysis was done
utilizing the QuantStudio™ 12K Flex Real-Time PCR System (Applied Biosystems).
Statistical Analysis
Data were analyzed using SPSS (IBM, Armonk, New York) for Mac V.21. Pearson Chi-
square analyses were performed 1) to compare the SNP mutation frequencies in the present
sample to that in the general population; 2) to examine the associations among BRCA1/2 status,
SNP status, and cancer status. Binary logistic regression analyses were performed to study the
response of SNP status to the changes in age at enrollment, race, BRCA1/2 status, and cancer
status; using the likelihood ratio forward stepwise methods.
Results
The study population included 139 women with an age range of 18-90, and a median age

68
of 50 years. The racial distribution of the population included 92.8% White, 5.0% Black, and
2.2% other/unknown. Of the participants in the study, 35.3% had a diagnosis of ovarian cancer.
The genotype frequency for the NAD(P)H oxidase SNP in individuals with ovarian cancer was
as follows: CC= 30.6%, CT= 49.0%, and TT=20.4% (Figure 23). The frequency for the SNP
(CT + TT) was 69.4% as compared to a minor allele frequency (MAF) of 30.3% reported for the
general population (NCBI) (Figure 23, Chi Squared= 74.8, p<0.0001). Genotype frequency for
the NAD(P)H oxidase SNP in individuals who were high-risk non-cancer was as follows: CC=
38.9%, CT= 42.2%, and TT=18.9% (Figure 25). The frequency for the SNP (CT + TT) was
61.1% as compared to 30.3% in the general population, although not quite significant (NCBI)
(Figure 25, Chi Squared=3.1, p<0.08). There was a slight increase in the frequency of the minor
allele in individuals with ovarian cancer (69.4%) as compared to high-risk non-cancer and
control individuals (61.0%) (Figure 25, p>0.05 with d=21%).
Figure 25: Frequency of NAD(P)H oxidase SNP in EOC. Frequency of the alleles at position 242 of the CYBA gene located on chromosome 16q24 present in the general population, controls, high-risk non-cancerous individuals and individuals with ovarian cancer. This SNP (rs4673, NCBI dbSNP genome build 37, MAF source 1000 genomes) in the CYBA gene, encoding the p22phox subunit of NAD(P)H oxidase, results in a CAC/TAC replacement.

69
BRCA1/2 status was available for 92.1% of the individuals (n=116) of which 11.2% with
ovarian cancer were BRCA1/2 positive as compared to 17.2% of the high-risk non-cancer
individuals. For individuals with BRCA1/2 mutations, there was an increase in the minor allele
frequency in individuals with ovarian cancer as compared to high-risk non-cancer individuals
(69.2 vs. 45.0%; p>0.05 with d=26%); for individuals without BRCA1/2 mutations, there was
also a small increase (71.0 vs. 65.4%; p>0.05 with d=7%).
Logistic regression analyses revealed that age at enrollment was a significant predictor of
SNP status (p=0.027). With a one year increase in age at enrollment, the odds of an individual
developing a mutated SNP increase by 3.4% after controlling for race, BRCA1/2 status, and
cancer status.
Discussion
In this study we have shown that the NAD(P)H oxidase 242C<T SNP was not only
significantly associated with patients with ovarian cancer, but also with those individuals who
are considered high-risk. Patients utilized for this study were at an elevated risk of harboring a
BRCA1/2 mutation based on personal and family history of cancer [211]. During the study
period, 31.2% patients presented with or developed the disease. Our results clearly show 69.4%
of those with ovarian cancer have the CT or TT alleles as compared to a MAF of 30.3% in the
general population, indicating a strong association of this SNP with ovarian cancer. Yet, 61.1%
of high-risk non-cancer individuals also have the CT or TT alleles, further suggesting the
association of this SNP with an increased risk of development of ovarian cancer, which is again
significantly higher than the reported 30.3% MAF in the general population (NCBI).
Although there are several SNPs reported for the NAD(P)H oxidase enzyme, the current
study focused on the 242C>T SNP in the CYBA gene (which encodes the p22phox subunit of
NAD(P)H oxidase) located on chromosome 16q24 because of the previously reported
70
association between this SNP and several other diseases such as hypertension, cerebrovascular
disease, diabetes and nephropathy as well as being associated with reduced respiratory burst in
isolated human neutrophils [81,222-224]. This SNP has been evaluated in a limited number of
cancers including lung cancer and leukemia and was found not to be associated with an increased
risk [225,226]. The A-930G polymorphism (rs9932581) located in the promoter region is
associated with higher promoter activity, hypertension, as well as an increase in exposure to
oxidative stress [81,227,228]. The A640G polymorphism (rs1049255) is a silent variant located
in the 3' untranslated region of CYBA and has been suggested to be associated with
cardiovascular arterial disease [81,228-230]. Future studies examining the prevalence of the
above mentioned SNPs is worthwhile conducting as the results of this study suggest a role for
NAD(P)H oxidase in the pathogenesis of ovarian cancer.
It is well understood that the breast cancer susceptibility genes, BRCA1 and BRCA2, are
also strongly associated with an increased risk of ovarian cancer [231]. Of the individuals in our
study who have ovarian cancer and the BRCA1/2 mutation (10%), 69.2% had the CT or TT
alleles as compared to 48.0% of high-risk non-cancer individuals, which was not statistically
significant. Low statistical power due to small sample size in the present study may have limited
the significance of some of the statistical comparisons. While the total sample size (n=139
overall and n=130 for BRCA1/2 status) might appear sufficient, the cell size for individual Chi-
square tests were small. For example, for individuals with BRCA1/2 mutations, the sample size
for normal and mutated SNP groups were 17 and 21, respectively, resulting in a low power of
26%. A sample size of 62 and 75, respectively, would be needed to achieve statistical power at
the recommended 80% level [232].
It is known that NAD(P)H oxidase regulates several redox intracellular signaling
pathways through the generation of ROS molecules. NAD(P)H oxidase utilizes NAD(P)H as an

71
electron donor to generate O2●– from molecular oxygen. NAD(P)H oxidase consists of seven
isoforms: five NOXs, NOXs1–5, and two NOX homologues, DUOX1 and DUOX2 [233]. NOX
enzymes are differentially activated by different binding molecules, including p22phox, p40phox,
p47phox /NOXO1, p67phox /NOXA1 and Rac [77]. NOX enzymes are essential for the control of
many cell functions including, differentiation, proliferation, and cell death, as well as signal
transduction [234]. The generation of ROS molecules, specifically O2●–, is achieved by
activation of certain redox-sensitive transcription factors, inhibition of protein tyrosine
phosphatases, and modulation of the functions of some ion channels [71,235]. NAD(P)H
oxidase/ROS-mediated signaling might therefore serve as an alert signal, which stimulates the
cells either to adapt to the stress or to undergo apoptosis [235]. Indeed we have previously
shown that inhibition of NAD(P)H oxidase significantly induced apoptosis in EOC cells [47].
Additionally, inhibition of NAD(P)H oxidase not only resulted in a reduction of its own
expression, but also a significantly decreased SOD3 and HIF-1α levels in EOC cells [47]. Thus,
a polymorphism favoring a pro-oxidant intercellular milieu may prove beneficial to the
persistence of the cancer cell, and targeting NAD(P)H oxidase may serve as a strategy for
increasing apoptosis.
Growing bodies of evidence from clinical studies support the concept that increases in
NAD(P)H oxidase activity plays a central role in the etiology of various diseases [79,90,236].
Recent studies have demonstrated that NOX4 is expressed in several tumor types, including
ovarian cancer [237]. NAD(P)H oxidases can be activated by mechanical forces, hormones, and
cytokines [79,238]. More importantly, NAD(P)H gene polymorphisms have the ability to
stimulate the activity of NAD(P)H oxidases, as well as increase the expression of its subunits
[79,238,239]. Specifically, NOX2 is considered to be directly involved in the generation of O2●–,
as well as p22phox, p47phox and p67phox [71]. Other studies have shown that polymorphisms in the

72
promoter region of the p22phox gene contribute to the upregulation of p22phox in spontaneously
hypertensive animals [79,80]. Indeed, treatment of animals with antioxidants or inhibitors of
NAD(P)H oxidase results in significantly lower ROS levels, and is associated with decreased
blood pressure [239,240].
Recent GWAS have successfully identified and confirmed six SNPs that appear to
influence the risk of EOC [212]. The confirmed susceptibility SNPs are rs3814113 (located at
9p22, near BNC2), rs2072590 (located at 2q31, which contains a family of HOX genes),
rs2665390 (located at 3q25, intronic to TIPARP), rs10088218 (located at 8q24, 700 kb
downstream of MYC), rs8170 (located at 19p13, near MERIT40), and rs9303542 (located at
17q21, intronic to SKAP1) [212]. In this study we report another SNP that is strongly associated
with ovarian cancer, rs4673. This SNP is particularly important because the resulting pro-oxidant
milieu is significant in the pathophysiology of several diseases, including ovarian cancer.
The findings of this study are of great importance because they can be utilized as a
stepping-stone towards the development of an early screening test for identifying individuals
who are at high-risk for the development of ovarian cancer.

73
CHAPTER VII: SUMMARY, CONCLUSIONS AND FUTURE DIRECTIONS
The overall goal of these studies was to investigate the role of oxidative stress in EOC
and understand the underlying mechanisms of oxidative stress in this disease. To achieve this
goal, we have successfully shown that EOC favors a pro-oxidant state, which is responsible for
the maintenance of the oncogenotype. We have identified key players in the redox pathway in
EOC whose modulation results in increased apoptosis in EOC cells. Additionally, we have
identified MPO and free iron as biomarkers for the early detection of ovarian cancer.
Furthermore, we have shown that a SNP in NAD(P)H oxidase serves as a screening tool for the
identification of individuals at high risk for ovarian cancer.
Collectively, this work provides the molecular basis for future clinical trials testing the
potential for MPO and free iron as biomarkers for early detection of ovarian cancer. Similar
studies are needed for the evaluation of NAD(P)H oxidase as a screening tool for the general
population. Due to the low prevalence of ovarian cancer in U.S. women, an ovarian cancer
diagnostic or screening test must have a minimum specificity of 99.6% before it can be used
routinely in the general population of postmenopausal women [170,241]. Such a test may offset
potential morbidity and mortality, which can be associated with complications of surgery for
patients who have false-positive ovarian cancer screening tests [170,241]. An ovarian cancer
screening test should also have high sensitivity and a suitable PPV [170,242]. Routine screening
for ovarian cancer in the general population is not recommended because traditional screening
methods are not sensitive or specific enough [170,243]. Therefore, the development of sensitive
and specific methods for early detection has been a priority as a means for improving the
diagnosis and treatment of this disease. Additional studies focusing on modulation of the key
enzymes identified in this study are needed to assess their potential as therapeutic targets.

74
APPENDIX

75

76
REFERENCES
1. Jemal, A., R. Siegel, E. Ward, T. Murray, J. Xu, C. Smigal, and M.J. Thun, Cancer
statistics, 2006. CA Cancer J Clin, 2006. 56(2):106-30.
2. What are the risk factors for ovarian cancer? Cancer.org 2013 3/21/2013 [cited 2013
June 28, 2013]; Available from:
http://www.cancer.org/cancer/ovariancancer/detailedguide/ovarian-cancer-key-statistics.
3. Agarwal, R. and S.B. Kaye, Ovarian cancer: strategies for overcoming resistance to
chemotherapy. Nat Rev Cancer, 2003. 3(7):502-16.
4. Berek, J. and R. Bast, Nonepithelial Ovarian Cancer, in Holland-Frei Cancer Medicine,
W. RR, Editor. 2003, BC Decker: Hamilton.
5. Sasaroli, D., G. Coukos, and N. Scholler, Beyond CA125: the coming of age of ovarian
cancer biomarkers. Are we there yet? Biomark Med, 2009. 3(3):275-288.
6. Auersperg, N., A.S. Wong, K.C. Choi, S.K. Kang, and P.C. Leung, Ovarian surface
epithelium: biology, endocrinology, and pathology. Endocr Rev, 2001. 22(2):255-88.
7. Ferrini, R., Screening asymptomatic women for ovarian cancer: American College of
Preventive Medicine practice policy. Am J Prev Med, 1997. 13(6):444-6.
8. Zhan, Q., C. Wang, and S. Ngai, Ovarian cancer stem cells: a new target for cancer
therapy. Biomed Res Int, 2013. 2013:916819.
9. Smith, R.A., D. Brooks, V. Cokkinides, D. Saslow, and O.W. Brawley, Cancer screening
in the United States, 2013: a review of current American Cancer Society guidelines,
current issues in cancer screening, and new guidance on cervical cancer screening and
lung cancer screening. CA Cancer J Clin, 2013. 63(2):88-105.
10. McGuire, W.P., W.J. Hoskins, M.F. Brady, P.R. Kucera, E.E. Partridge, K.Y. Look, D.L.
Clarke-Pearson, and M. Davidson, Cyclophosphamide and cisplatin compared with

77
paclitaxel and cisplatin in patients with stage III and stage IV ovarian cancer. N Engl J
Med, 1996. 334(1):1-6.
11. Hibbs, K., K.M. Skubitz, S.E. Pambuccian, R.C. Casey, K.M. Burleson, T.R. Oegema, Jr.,
J.J. Thiele, S.M. Grindle, R.L. Bliss, and A.P. Skubitz, Differential gene expression in
ovarian carcinoma: identification of potential biomarkers. Am J Pathol, 2004.
165(2):397-414.
12. Hough, C.D., K.R. Cho, A.B. Zonderman, D.R. Schwartz, and P.J. Morin, Coordinately
up-regulated genes in ovarian cancer. Cancer Res, 2001. 61(10):3869-76.
13. Hough, C.D., C.A. Sherman-Baust, E.S. Pizer, F.J. Montz, D.D. Im, N.B. Rosenshein, K.R.
Cho, G.J. Riggins, and P.J. Morin, Large-scale serial analysis of gene expression reveals genes
differentially expressed in ovarian cancer. Cancer Res, 2000. 60(22):6281-7.
14. Ismail, R.S., R.L. Baldwin, J. Fang, D. Browning, B.Y. Karlan, J.C. Gasson, and D.D.
Chang, Differential gene expression between normal and tumor-derived ovarian
epithelial cells. Cancer Res, 2000. 60(23): 6744-9.
15. Mok, S.C., J. Chao, S. Skates, K. Wong, G.K. Yiu, M.G. Muto, R.S. Berkowitz, and D.W.
Cramer, Prostasin, a potential serum marker for ovarian cancer: identification through
microarray technology. J Natl Cancer Inst, 2001. 93(19):1458-64.
16. Schummer, M., W.V. Ng, R.E. Bumgarner, P.S. Nelson, B. Schummer, D.W. Bednarski,
L. Hassell, R.L. Baldwin, B.Y. Karlan, and L. Hood, Comparative hybridization of an
array of 21,500 ovarian cDNAs for the discovery of genes overexpressed in ovarian
carcinomas. Gene, 1999. 238(2):375-85.
17. Tapper, J., E. Kettunen, W. El-Rifai, M. Seppala, L.C. Andersson, and S. Knuutila,
Changes in gene expression during progression of ovarian carcinoma. Cancer Genet
Cytogenet, 2001. 128(1): 1-6.

78
18. Wang, K., L. Gan, E. Jeffery, M. Gayle, A.M. Gown, M. Skelly, P.S. Nelson, W.V. Ng,
M. Schummer, L. Hood, and J. Mulligan, Monitoring gene expression profile changes in
ovarian carcinomas using cDNA microarray. Gene, 1999. 229(1-2):101-8.
19. Welsh, J.B., P.P. Zarrinkar, L.M. Sapinoso, S.G. Kern, C.A. Behling, B.J. Monk, D.J.
Lockhart, R.A. Burger, and G.M. Hampton, Analysis of gene expression profiles in
normal and neoplastic ovarian tissue samples identifies candidate molecular markers of
epithelial ovarian cancer. Proc Natl Acad Sci U S A, 2001. 98(3):1176-81.
20. Saed, G.M., N.M. Fletcher, Z.L. Jiang, H.M. Abu-Soud, and M.P. Diamond,
Dichloroacetate induces apoptosis of epithelial ovarian cancer cells through a
mechanism involving modulation of oxidative stress. Reprod Sci, 2011. 18(12):1253-61.
21. Senthil, K., S. Aranganathan, and N. Nalini, Evidence of oxidative stress in the
circulation of ovarian cancer patients. Clin Chim Acta, 2004. 339(1-2):27-32.
22. Reuter, S., S.C. Gupta, M.M. Chaturvedi, and B.B. Aggarwal, Oxidative stress,
inflammation, and cancer: how are they linked? Free Radic Biol Med, 2010.
49(11):1603-16.
23. Agarwal, A. and S.S. Allamaneni, Role of free radicals in female reproductive diseases
and assisted reproduction. Reprod Biomed Online, 2004. 9(3):338-47.
24. Halliwell, B.G., J. M. C., Free radicals in biology and medicine. In: Halliwell, B.,
Gutteridge, J.M.C. (Eds.), 1989.(Clarendon, Oxford,):1-20.
25. Fruehauf, J.P. and F.L. Meyskens, Jr., Reactive oxygen species: a breath of life or death?
Clin Cancer Res, 2007. 13(3):789-94.
26. Inoue, M., E.F. Sato, M. Nishikawa, A.M. Park, Y. Kira, I. Imada, and K. Utsumi,
Mitochondrial generation of reactive oxygen species and its role in aerobic life. Curr
Med Chem, 2003. 10(23):2495-505.
79
27. Linnane, A.W. and H. Eastwood, Cellular redox regulation and prooxidant signaling
systems: a new perspective on the free radical theory of aging. Ann N Y Acad Sci, 2006.
1067:47-55.
28. Kinnula, V.L. and J.D. Crapo, Superoxide dismutases in malignant cells and human
tumors. Free Radic Biol Med, 2004. 36(6):718-44.
29. Kamata, H. and H. Hirata, Redox regulation of cellular signalling. Cell Signal, 1999.
11(1):1-14.
30. Ueda, S., H. Masutani, H. Nakamura, T. Tanaka, M. Ueno, and J. Yodoi, Redox control
of cell death. Antioxid Redox Signal, 2002. 4(3):405-14.
31. Halliwell, B., Reactive oxygen species in living systems: source, biochemistry, and role in
human disease. Am J Med, 1991. 91(3C):14S-22S.
32. Kieran, M.W., J. Folkman, and J. Heymach, Angiogenesis inhibitors and hypoxia. Nat
Med, 2003. 9(9):1104; author reply 1104-5.
33. Harris, A.L., Hypoxia--a key regulatory factor in tumour growth. Nat Rev Cancer, 2002.
2(1):38-47.
34. Hileman, E.O., J. Liu, M. Albitar, M.J. Keating, and P. Huang, Intrinsic oxidative stress
in cancer cells: a biochemical basis for therapeutic selectivity. Cancer Chemother
Pharmacol, 2004. 53(3):209-19.
35. Townsend, D.M. and K.D. Tew, The role of glutathione-S-transferase in anti-cancer
drug resistance. Oncogene, 2003. 22(47):7369-75.
36. Schafer, F.Q. and G.R. Buettner, Redox environment of the cell as viewed through the
redox state of the glutathione disulfide/glutathione couple. Free Radic Biol Med, 2001.
30(11):1191-212.
37. Taddei, M.L., E. Giannoni, G. Raugei, S. Scacco, A.M. Sardanelli, S. Papa, and P.

80
Chiarugi, Mitochondrial Oxidative Stress due to Complex I Dysfunction Promotes
Fibroblast Activation and Melanoma Cell Invasiveness. J Signal Transduct, 2012.
2012:684592.
38. Toyokuni, S., Oxidative stress and cancer: the role of redox regulation. Biotherapy, 1998.
11(2-3):147-54.
39. Toyokuni, S., K. Okamoto, J. Yodoi, and H. Hiai, Persistent oxidative stress in cancer.
FEBS Lett, 1995. 358(1):1-3.
40. Beckman, K.B. and B.N. Ames, The free radical theory of aging matures. Physiol Rev,
1998. 78(2):547-81.
41. Choi, J.Y., M.L. Neuhouser, M.J. Barnett, C.C. Hong, A.R. Kristal, M.D. Thornquist, I.B.
King, G.E. Goodman, and C.B. Ambrosone, Iron intake, oxidative stress-related genes
(MnSOD and MPO) and prostate cancer risk in CARET cohort. Carcinogenesis, 2008.
29(5):964-70.
42. Coussens, L.M. and Z. Werb, Inflammation and cancer. Nature, 2002. 420(6917):860-7.
43. Finkel, T. and N.J. Holbrook, Oxidants, oxidative stress and the biology of ageing.
Nature, 2000. 408(6809):239-47.
44. Haegens, A., A. van der Vliet, K.J. Butnor, N. Heintz, D. Taatjes, D. Hemenway, P.
Vacek, B.A. Freeman, S.L. Hazen, M.L. Brennan, and B.T. Mossman, Asbestos-induced
lung inflammation and epithelial cell proliferation are altered in myeloperoxidase-null
mice. Cancer Res, 2005. 65(21):9670-7.
45. Saed, G.M., R. Ali-Fehmi, Z.L. Jiang, N.M. Fletcher, M.P. Diamond, H.M. Abu-Soud,
and A.R. Munkarah, Myeloperoxidase serves as a redox switch that regulates apoptosis
in epithelial ovarian cancer. Gynecol Oncol, 2010. 116(2):276-81.
46. Malone, J.M., G.M. Saed, M.P. Diamond, R.J. Sokol, and A.R. Munkarah, The effects of

81
the inhibition of inducible nitric oxide synthase on angiogenesis of epithelial ovarian
cancer. Am J Obstet Gynecol, 2006. 194(4):1110-6; discussion 1116-8.
47. Jiang, Z., N.M. Fletcher, R. Ali-Fehmi, M.P. Diamond, H.M. Abu-Soud, A.R. Munkarah,
and G.M. Saed, Modulation of redox signaling promotes apoptosis in epithelial ovarian
cancer cells. Gynecol Oncol, 2011. 122(2):418-23.
48. Stamler, J.S., D.J. Singel, and J. Loscalzo, Biochemistry of nitric oxide and its redox-
activated forms. Science, 1992. 258(5090):1898-902.
49. Abu-Soud, H.M. and S.L. Hazen, Nitric oxide is a physiological substrate for mammalian
peroxidases. J Biol Chem, 2000. 275(48):37524-32.
50. Abu-Soud, H.M. and S.L. Hazen, Nitric oxide modulates the catalytic activity of
myeloperoxidase. J Biol Chem, 2000. 275(8):5425-30.
51. Abu-Soud, H.M., M.Y. Khassawneh, J.T. Sohn, P. Murray, M.A. Haxhiu, and S.L. Hazen,
Peroxidases inhibit nitric oxide (NO) dependent bronchodilation: development of a
model describing NO-peroxidase interactions. Biochemistry, 2001. 40(39):11866-75.
52. Galijasevic, S., G.M. Saed, S.L. Hazen, and H.M. Abu-Soud, Myeloperoxidase
metabolizes thiocyanate in a reaction driven by nitric oxide. Biochemistry, 2006.
45(4):1255-62.
53. Lechner, M., P. Lirk, and J. Rieder, Inducible nitric oxide synthase (iNOS) in tumor
biology: the two sides of the same coin. Semin Cancer Biol, 2005. 15(4):277-89.
54. Xu, W., L.Z. Liu, M. Loizidou, M. Ahmed, and I.G. Charles, The role of nitric oxide in
cancer. Cell Res, 2002. 12(5-6):311-20.
55. Ushio-Fukai, M. and Y. Nakamura, Reactive oxygen species and angiogenesis: NADPH
oxidase as target for cancer therapy. Cancer Lett, 2008. 266(1):37-52.
56. Song, M. and N. Santanam, Increased myeloperoxidase and lipid peroxide-modified
82
protein in gynecological malignancies. Antioxid Redox Signal, 2001. 3(6):1139-46.
57. Buser, K., F. Joncourt, H.J. Altermatt, M. Bacchi, A. Oberli, and T. Cerny, Breast
cancer: pretreatment drug resistance parameters (GSH-system, ATase, P-glycoprotein)
in tumor tissue and their correlation with clinical and prognostic characteristics. Ann
Oncol, 1997. 8(4):335-41.
58. Niitsu, Y., Y. Takahashi, T. Saito, Y. Hirata, N. Arisato, H. Maruyama, Y. Kohgo, and I.
Listowsky, Serum glutathione-S-transferase-pi as a tumor marker for gastrointestinal
malignancies. Cancer, 1989. 63(2):317-23.
59. Brigelius-Flohe, R. and A. Kipp, Glutathione peroxidases in different stages of
carcinogenesis. Biochim Biophys Acta, 2009. 1790(11):1555-68.
60. Sun, Y., Free radicals, antioxidant enzymes, and carcinogenesis. Free Radic Biol Med,
1990. 8(6):583-99.
61. Saydam, N., A. Kirb, O. Demir, E. Hazan, O. Oto, O. Saydam, and G. Guner,
Determination of glutathione, glutathione reductase, glutathione peroxidase and
glutathione S-transferase levels in human lung cancer tissues. Cancer Lett, 1997.
119(1):13-9.
62. Singh, S.V., S.R. Brunnert, B. Roberts, and A. Krishan, Differential expression of
glutathione S-transferase, glutathione peroxidase and glutathione reductase in normal
and malignant human breast tissues. Cancer Lett, 1990. 51(1):43-8.
63. Di Ilio, C., P. Sacchetta, S. Angelucci, A. Zezza, R. Tenaglia, and A. Aceto, Glutathione
peroxidase and glutathione reductase activities in cancerous and non-cancerous human
kidney tissues. Cancer Lett, 1995. 91(1):19-23.
64. Popov, B., V. Gadjeva, P. Valkanov, S. Popova, and A. Tolekova, Lipid peroxidation,
superoxide dismutase and catalase activities in brain tumor tissues. Arch Physiol

83
Biochem, 2003. 111(5):455-9.
65. Ray, G., S. Batra, N.K. Shukla, S. Deo, V. Raina, S. Ashok, and S.A. Husain, Lipid
peroxidation, free radical production and antioxidant status in breast cancer. Breast
Cancer Res Treat, 2000. 59(2):163-70.
66. Chung-man Ho, J., S. Zheng, S.A. Comhair, C. Farver, and S.C. Erzurum, Differential
expression of manganese superoxide dismutase and catalase in lung cancer. Cancer Res,
2001. 61(23):8578-85.
67. Radenkovic, S., Z. Milosevic, G. Konjevic, K. Karadzic, B. Rovcanin, M. Buta, K.
Gopcevic, and V. Jurisic, Lactate dehydrogenase, catalase, and superoxide dismutase in
tumor tissue of breast cancer patients in respect to mammographic findings. Cell
Biochem Biophys, 2013. 66(2):287-95.
68. Svensk, A.M., Y. Soini, P. Paakko, P. Hiravikoski, and V.L. Kinnula, Differential
expression of superoxide dismutases in lung cancer. Am J Clin Pathol, 2004. 122(3):395-
404.
69. Janssen, A.M., C.B. Bosman, W. van Duijn, M.M. Oostendorp-van de Ruit, F.J. Kubben,
G. Griffioen, C.B. Lamers, J.H. van Krieken, C.J. van de Velde, and H.W. Verspaget,
Superoxide dismutases in gastric and esophageal cancer and the prognostic impact in
gastric cancer. Clin Cancer Res, 2000. 6(8):3183-92.
70. Hu, Y., D.G. Rosen, Y. Zhou, L. Feng, G. Yang, J. Liu, and P. Huang, Mitochondrial
manganese-superoxide dismutase expression in ovarian cancer: role in cell proliferation
and response to oxidative stress. J Biol Chem, 2005. 280(47):39485-92.
71. Bedard, K. and K.H. Krause, The NOX family of ROS-generating NADPH oxidases:
physiology and pathophysiology. Physiol Rev, 2007. 87(1):245-313.
72. Meier, B., A.R. Cross, J.T. Hancock, F.J. Kaup, and O.T. Jones, Identification of a

84
superoxide-generating NADPH oxidase system in human fibroblasts. Biochem J, 1991.
275 ( Pt 1):241-5.
73. Szatrowski, T.P. and C.F. Nathan, Production of large amounts of hydrogen peroxide by
human tumor cells. Cancer Res, 1991. 51(3):794-8.
74. Griendling, K.K., C.A. Minieri, J.D. Ollerenshaw, and R.W. Alexander, Angiotensin II
stimulates NADH and NADPH oxidase activity in cultured vascular smooth muscle cells.
Circ Res, 1994. 74(6):1141-8.
75. Dong, J., K.K. Sulik, and S.Y. Chen, The role of NOX enzymes in ethanol-induced
oxidative stress and apoptosis in mouse embryos. Toxicol Lett, 2010. 193(1):94-100.
76. Lambeth, J.D., NOX enzymes and the biology of reactive oxygen. Nat Rev Immunol,
2004. 4(3): p. 181-9.
77. Lassegue, B., A. San Martin, and K.K. Griendling, Biochemistry, physiology, and
pathophysiology of NADPH oxidases in the cardiovascular system. Circ Res, 2012.
110(10):1364-90.
78. Clark, R.A., T.K. Epperson, and A.J. Valente, Mechanisms of activation of NADPH
oxidases. Jpn J Infect Dis, 2004. 57(5):S22-3.
79. Miller, A.A., G.R. Drummond, and C.G. Sobey, Selective inhibition of NADPH-oxidase
isoforms as a therapeutic strategy in hypertension. Drug Discovery Today: Therapeutic
Strategies, 2005. 2(3):187-192.
80. Zalba, G., G. San Jose, F.J. Beaumont, M.A. Fortuno, A. Fortuno, and J. Diez,
Polymorphisms and promoter overactivity of the p22(phox) gene in vascular smooth
muscle cells from spontaneously hypertensive rats. Circ Res, 2001. 88(2):217-22.
81. Izakovicova Holla, L., K. Kankova, and V. Znojil, Haplotype analysis of the NADPH
oxidase p22 phox gene in patients with bronchial asthma. Int Arch Allergy Immunol,

85
2009. 148(1):73-80.
82. Hodgkinson, A.D., B.A. Millward, and A.G. Demaine, Association of the p22phox
component of NAD(P)H oxidase with susceptibility to diabetic nephropathy in patients
with type 1 diabetes. Diabetes Care, 2003. 26(11):3111-5.
83. Macias-Reyes, A., F. Rodriguez-Esparragon, A. Caballero-Hidalgo, Y. Hernandez-
Trujillo, A. Medina, and J.C. Rodriguez-Perez, Insight into the role of CYBA A640G and
C242T gene variants and coronary heart disease risk. A case-control study. Free Radic
Res, 2008. 42(1):82-92.
84. Freedman, R.S., E. Pihl, C. Kusyk, H.S. Gallager, and F. Rutledge, Characterization of
an ovarian carcinoma cell line. Cancer, 1978. 42(5):2352-9.
85. Selvendiran, K., S. Ahmed, A. Dayton, M.L. Kuppusamy, M. Tazi, A. Bratasz, L. Tong,
B.K. Rivera, T. Kalai, K. Hideg, and P. Kuppusamy, Safe and targeted anticancer
efficacy of a novel class of antioxidant-conjugated difluorodiarylidenyl piperidones:
differential cytotoxicity in healthy and cancer cells. Free Radic Biol Med, 2010.
48(9):1228-35.
86. Selvendiran, K., L. Tong, A. Bratasz, M.L. Kuppusamy, S. Ahmed, Y. Ravi, N.J. Trigg,
B.K. Rivera, T. Kalai, K. Hideg, and P. Kuppusamy, Anticancer efficacy of a
difluorodiarylidenyl piperidone (HO-3867) in human ovarian cancer cells and tumor
xenografts. Mol Cancer Ther, 2010. 9(5):1169-79.
87. Kim, M., L. Rooper, J. Xie, A.A. Kajdacsy-Balla, and M.V. Barbolina, Fractalkine
receptor CX(3)CR1 is expressed in epithelial ovarian carcinoma cells and required for
motility and adhesion to peritoneal mesothelial cells. Mol Cancer Res, 2012. 10(1):11-24.
88. Cheng, G., Z. Cao, X. Xu, E.G. van Meir, and J.D. Lambeth, Homologs of gp91phox:
cloning and tissue expression of Nox3, Nox4, and Nox5. Gene, 2001. 269(1-2):131-40.

86
89. Ushio-Fukai, M. and R.W. Alexander, Reactive oxygen species as mediators of
angiogenesis signaling: role of NAD(P)H oxidase. Mol Cell Biochem, 2004. 264(1-
2):85-97.
90. Desouki, M.M., M. Kulawiec, S. Bansal, G.M. Das, and K.K. Singh, Cross talk between
mitochondria and superoxide generating NADPH oxidase in breast and ovarian tumors.
Cancer Biol Ther, 2005. 4(12):1367-73.
91. Carlsson, L.M., J. Jonsson, T. Edlund, and S.L. Marklund, Mice lacking extracellular
superoxide dismutase are more sensitive to hyperoxia. Proc Natl Acad Sci U S A, 1995.
92(14):6264-8.
92. Fridovich, I., The biology of oxygen radicals. Science, 1978. 201(4359):875-80.
93. Chaiswing, L., W. Zhong, J.J. Cullen, L.W. Oberley, and T.D. Oberley, Extracellular
redox state regulates features associated with prostate cancer cell invasion. Cancer Res,
2008. 68(14):5820-6.
94. Semenza, G.L., Hypoxia-inducible factor 1: control of oxygen homeostasis in health and
disease. Pediatr Res, 2001. 49(5):614-7.
95. Zitka, O., S. Skalickova, J. Gumulec, M. Masarik, V. Adam, J. Hubalek, L. Trnkova, J.
Kruseova, T. Eckschlager, and R. Kizek, Redox status expressed as GSH:GSSG ratio as
a marker for oxidative stress in paediatric tumour patients. Oncol Lett, 2012. 4(6):1247-
1253.
96. Ismail, N.A., S.H. Okasha, A. Dhawan, A.O. Abdel-Rahman, O.G. Shaker, and N.A.
Sadik, Antioxidant enzyme activities in hepatic tissue from children with chronic
cholestatic liver disease. Saudi J Gastroenterol, 2010. 16(2):90-4.
97. Roxborough, H.E., C. Mercer, D. McMaster, A.P. Maxwell, and I.S. Young, Plasma
glutathione peroxidase activity is reduced in haemodialysis patients. Nephron, 1999.
87
81(3):278-83.
98. Nomelini, R.S., L.C. de Abreu Ribeiro, B.M. Tavares-Murta, S.J. Adad, and E.F. Murta,
Production of nitric oxide and expression of inducible nitric oxide synthase in ovarian
cystic tumors. Mediators Inflamm, 2008. 2008:186584.
99. Moncada, S. and A. Higgs, The L-arginine-nitric oxide pathway. N Engl J Med, 1993.
329(27):2002-12.
100. Nathan, C., Nitric oxide as a secretory product of mammalian cells. Faseb J, 1992.
6(12):3051-64.
101. Stamler, J.S., D.I. Simon, J.A. Osborne, M.E. Mullins, O. Jaraki, T. Michel, D.J. Singel,
and J. Loscalzo, S-nitrosylation of proteins with nitric oxide: synthesis and
characterization of biologically active compounds. Proc Natl Acad Sci U S A, 1992.
89(1):444-8.
102. Pryor, W.A. and G.L. Squadrito, The chemistry of peroxynitrite: a product from the
reaction of nitric oxide with superoxide. Am J Physiol, 1995. 268(5 Pt 1):L699-722.
103. Brune, B., S. Mohr, and U.K. Messmer, Protein thiol modification and apoptotic cell
death as cGMP-independent nitric oxide (NO) signaling pathways. Rev Physiol Biochem
Pharmacol, 1996. 127:1-30.
104. Sarih, M., V. Souvannavong, and A. Adam, Nitric oxide synthase induces macrophage
death by apoptosis. Biochem Biophys Res Commun, 1993. 191(2):503-8.
105. Mannick, J.B., K. Asano, K. Izumi, E. Kieff, and J.S. Stamler, Nitric oxide produced by
human B lymphocytes inhibits apoptosis and Epstein-Barr virus reactivation. Cell, 1994.
79(7):1137-46.
106. Genaro, A.M., S. Hortelano, A. Alvarez, C. Martinez, and L. Bosca, Splenic B
lymphocyte programmed cell death is prevented by nitric oxide release through

88
mechanisms involving sustained Bcl-2 levels. J Clin Invest, 1995. 95(4):1884-90.
107. Dimmeler, S., J. Haendeler, M. Nehls, and A.M. Zeiher, Suppression of apoptosis by
nitric oxide via inhibition of interleukin-1beta-converting enzyme (ICE)-like and cysteine
protease protein (CPP)-32-like proteases. J Exp Med, 1997. 185(4):601-7.
108. Stamler, J.S., S. Lamas, and F.C. Fang, Nitrosylation. the prototypic redox-based
signaling mechanism. Cell, 2001. 106(6):675-83.
109. Podrez, E.A., D. Schmitt, H.F. Hoff, and S.L. Hazen, Myeloperoxidase-generated
reactive nitrogen species convert LDL into an atherogenic form in vitro. J Clin Invest,
1999. 103(11):1547-60.
110. Kensler, T.W., P.A. Egner, K.G. Moore, B.G. Taffe, L.E. Twerdok, and M.A. Trush,
Role of inflammatory cells in the metabolic activation of polycyclic aromatic
hydrocarbons in mouse skin. Toxicol Appl Pharmacol, 1987. 90(2):337-46.
111. Evans, T.J., L.D. Buttery, A. Carpenter, D.R. Springall, J.M. Polak, and J. Cohen,
Cytokine-treated human neutrophils contain inducible nitric oxide synthase that produces
nitration of ingested bacteria. Proc Natl Acad Sci U S A, 1996. 93(18):9553-8.
112. Xia, C., Q. Meng, L.Z. Liu, Y. Rojanasakul, X.R. Wang, and B.H. Jiang, Reactive oxygen
species regulate angiogenesis and tumor growth through vascular endothelial growth
factor. Cancer Res, 2007. 67(22):10823-30.
113. Landriscina, M., F. Maddalena, G. Laudiero, and F. Esposito, Adaptation to oxidative
stress, chemoresistance, and cell survival. Antioxid Redox Signal, 2009. 11(11):2701-16.
114. Meister, A., Mitochondrial changes associated with glutathione deficiency. Biochim
Biophys Acta, 1995. 1271(1):35-42.
115. Balendiran, G.K., R. Dabur, and D. Fraser, The role of glutathione in cancer. Cell
Biochem Funct, 2004. 22(6):343-52.

89
116. Sprem, M., D. Babic, M. Abramic, I. Vrhovec, J. Skrk, D. Milicic, A. Ambriovic Ristov,
D. Kalafatic, and M. Osmak, Glutathione and glutathione S-transferases as early
markers for ovarian carcinomas: case series. Croat Med J, 2001. 42(6):624-9.
117. Griffith, O.W., Biologic and pharmacologic regulation of mammalian glutathione
synthesis. Free Radic Biol Med, 1999. 27(9-10):922-35.
118. Zhao, Y., T. Seefeldt, W. Chen, X. Wang, D. Matthees, Y. Hu, and X. Guan, Effects of
glutathione reductase inhibition on cellular thiol redox state and related systems. Arch
Biochem Biophys, 2009. 485(1):56-62.
119. Green, J.A., L.J. Robertson, and A.H. Clark, Glutathione S-transferase expression in
benign and malignant ovarian tumours. Br J Cancer, 1993. 68(2):235-9.
120. Kase, H., S. Kodama, E. Nagai, and K. Tanaka, Glutathione S-transferase pi
immunostaining of cisplatin-resistant ovarian cancer cells in ascites. Acta Cytol, 1998.
42(6):1397-402.
121. Zhang, F., L. Qi, and H. Chen, [Value of P-glycoprotein and glutathione S-transferase-pi
as chemo-resistant indicators in ovarian cancers]. Zhonghua Zhong Liu Za Zhi, 2001.
23(4):313-6.
122. Jurkovic, S., J. Osredkar, and J. Marc, Molecular impact of glutathione peroxidase in
antioxidant processes. The Journal of Croatian Socieity of Medical Biochemistry and
Laboratory Medicine, 2008. 18(2):162-74.
123. Schulz, R., T. Emmrich, H. Lemmerhirt, U. Leffler, K. Sydow, C. Hirt, T. Kiefer, A.
Link, and P.J. Bednarski, Identification of a glutathione peroxidase inhibitor that
reverses resistance to anticancer drugs in human B-cell lymphoma cell lines. Bioorg Med
Chem Lett, 2012. 22(21):6712-5.
124. Porter, A.G. and R.U. Janicke, Emerging roles of caspase-3 in apoptosis. Cell Death

90
Differ, 1999. 6(2):99-104.
125. Liu, L. and J.S. Stamler, NO: an inhibitor of cell death. Cell Death Differ, 1999.
6(10):937-42.
126. Thornberry, N.A. and Y. Lazebnik, Caspases: enemies within. Science, 1998.
281(5381):1312-6.
127. Mannick, J.B., A. Hausladen, L. Liu, D.T. Hess, M. Zeng, Q.X. Miao, L.S. Kane, A.J.
Gow, and J.S. Stamler, Fas-induced caspase denitrosylation. Science, 1999.
284(5414):651-4.
128. Maejima, Y., S. Adachi, K. Morikawa, H. Ito, and M. Isobe, Nitric oxide inhibits
myocardial apoptosis by preventing caspase-3 activity via S-nitrosylation. J Mol Cell
Cardiol, 2005. 38(1):163-74.
129. Rossig, L., B. Fichtlscherer, K. Breitschopf, J. Haendeler, A.M. Zeiher, A. Mulsch, and S.
Dimmeler, Nitric oxide inhibits caspase-3 by S-nitrosation in vivo. J Biol Chem, 1999.
274(11):6823-6.
130. Dash, P.R., J.E. Cartwright, P.N. Baker, A.P. Johnstone, and G.S. Whitley, Nitric oxide
protects human extravillous trophoblast cells from apoptosis by a cyclic GMP-dependent
mechanism and independently of caspase 3 nitrosylation. Exp Cell Res, 2003.
287(2):314-24.
131. Mannick, J.B., C. Schonhoff, N. Papeta, P. Ghafourifar, M. Szibor, K. Fang, and B.
Gaston, S-Nitrosylation of mitochondrial caspases. J Cell Biol, 2001. 154(6):1111-6.
132. Takeya, R. and H. Sumimoto, Molecular mechanism for activation of superoxide-
producing NADPH oxidases. Mol Cells, 2003. 16(3):271-7.
133. Chandel, N.S., E. Maltepe, E. Goldwasser, C.E. Mathieu, M.C. Simon, and P.T.
Schumacker, Mitochondrial reactive oxygen species trigger hypoxia-induced

91
transcription. Proc Natl Acad Sci U S A, 1998. 95(20):11715-20.
134. Suliman, H.B., M. Ali, and C.A. Piantadosi, Superoxide dismutase-3 promotes full
expression of the EPO response to hypoxia. Blood, 2004. 104(1):43-50.
135. Cross, A.R. and O.T. Jones, The effect of the inhibitor diphenylene iodonium on the
superoxide-generating system of neutrophils. Specific labelling of a component
polypeptide of the oxidase. Biochem J, 1986. 237(1):111-6.
136. Saed, G.M., M. Zhao, M.P. Diamond, and H.M. Abu-Soud, Regulation of inducible nitric
oxide synthase in post-operative adhesions. Hum Reprod, 2006. 21(6):1605-11.
137. Boveris, A. and B. Chance, The mitochondrial generation of hydrogen peroxide. General
properties and effect of hyperbaric oxygen. Biochem J, 1973. 134(3):707-16.
138. Volm, M. and R. Koomagi, Hypoxia-inducible factor (HIF-1) and its relationship to
apoptosis and proliferation in lung cancer. Anticancer Res, 2000. 20(3A):1527-33.
139. Brault, S., F. Gobeil, Jr., A. Fortier, J.C. Honore, J.S. Joyal, P.S. Sapieha, A. Kooli, E.
Martin, P. Hardy, A. Ribeiro-da-Silva, K. Peri, P. Lachapelle, D. Varma, and S. Chemtob,
Lysophosphatidic acid induces endothelial cell death by modulating the redox
environment. Am J Physiol Regul Integr Comp Physiol, 2007. 292(3):R1174-83.
140. O'Donnell, B.V., D.G. Tew, O.T. Jones, and P.J. England, Studies on the inhibitory
mechanism of iodonium compounds with special reference to neutrophil NADPH oxidase.
Biochem J, 1993. 290 ( Pt 1):41-9.
141. Park, S.E., J.D. Song, K.M. Kim, Y.M. Park, N.D. Kim, Y.H. Yoo, and Y.C. Park,
Diphenyleneiodonium induces ROS-independent p53 expression and apoptosis in human
RPE cells. FEBS Lett, 2007. 581(2):180-6.
142. Saed, G.M. and M.P. Diamond, Apoptosis and proliferation of human peritoneal
fibroblasts in response to hypoxia. Fertil Steril, 2002. 78(1):137-43.

92
143. Saed, G.M., H.M. Abu-Soud, and M.P. Diamond, Role of nitric oxide in apoptosis of
human peritoneal and adhesion fibroblasts after hypoxia. Fertil Steril, 2004. 82 Suppl
3:1198-205.
144. Suh, Y.A., R.S. Arnold, B. Lassegue, J. Shi, X. Xu, D. Sorescu, A.B. Chung, K.K.
Griendling, and J.D. Lambeth, Cell transformation by the superoxide-generating oxidase
Mox1. Nature, 1999. 401(6748):79-82.
145. Munkarah, A.R., R. Morris, P. Baumann, G. Deppe, J. Malone, M.P. Diamond, and G.M.
Saed, Effects of prostaglandin E(2) on proliferation and apoptosis of epithelial ovarian
cancer cells. J Soc Gynecol Investig, 2002. 9(3):168-73.
146. Nicotera, P. and G. Melino, Regulation of the apoptosis-necrosis switch. Oncogene, 2004.
23(16):2757-65.
147. Jiang, Z.L., N.M. Fletcher, M.P. Diamond, H.M. Abu-Soud, and G.M. Saed, S-
nitrosylation of caspase-3 is the mechanism by which adhesion fibroblasts manifest lower
apoptosis. Wound Repair Regen, 2009. 17(2):224-9.
148. Benhar, M., M.T. Forrester, and J.S. Stamler, Protein denitrosylation: enzymatic
mechanisms and cellular functions. Nat Rev Mol Cell Biol, 2009. 10(10):721-32.
149. Arbiser, J.L., J. Petros, R. Klafter, B. Govindajaran, E.R. McLaughlin, L.F. Brown, C.
Cohen, M. Moses, S. Kilroy, R.S. Arnold, and J.D. Lambeth, Reactive oxygen generated
by Nox1 triggers the angiogenic switch. Proc Natl Acad Sci U S A, 2002. 99(2):715-20.
150. Tanaka, M., K. Kogawa, K. Nakamura, Y. Nishihori, K. Kuribayashi, S. Hagiwara, H.
Muramatsu, S. Sakamaki, and Y. Niitsu, Anti-metastatic gene therapy utilizing
subcutaneous inoculation of EC-SOD gene transduced autologous fibroblast suppressed
lung metastasis of Meth-A cells and 3LL cells in mice. Gene Ther, 2001. 8(2):149-56.
151. Wheeler, M.D., O.M. Smutney, and R.J. Samulski, Secretion of extracellular superoxide

93
dismutase from muscle transduced with recombinant adenovirus inhibits the growth of
B16 melanomas in mice. Mol Cancer Res, 2003. 1(12):871-81.
152. Pelicano, H., D. Carney, and P. Huang, ROS stress in cancer cells and therapeutic
implications. Drug Resist Updat, 2004. 7(2):97-110.
153. Trachootham, D., J. Alexandre, and P. Huang, Targeting cancer cells by ROS-mediated
mechanisms: a radical therapeutic approach? Nat Rev Drug Discov, 2009. 8(7):579-91.
154. Mochizuki, T., S. Furuta, J. Mitsushita, W.H. Shang, M. Ito, Y. Yokoo, M. Yamaura, S.
Ishizone, J. Nakayama, A. Konagai, K. Hirose, K. Kiyosawa, and T. Kamata, Inhibition
of NADPH oxidase 4 activates apoptosis via the AKT/apoptosis signal-regulating kinase
1 pathway in pancreatic cancer PANC-1 cells. Oncogene, 2006. 25(26):3699-707.
155. Mabuchi, S., M. Ohmichi, A. Kimura, Y. Nishio, E. Arimoto-Ishida, N. Yada-Hashimoto,
K. Tasaka, and Y. Murata, Estrogen inhibits paclitaxel-induced apoptosis via the
phosphorylation of apoptosis signal-regulating kinase 1 in human ovarian cancer cell
lines. Endocrinology, 2004. 145(1):49-58.
156. Wang, X., K.D. McCullough, T.F. Franke, and N.J. Holbrook, Epidermal growth factor
receptor-dependent Akt activation by oxidative stress enhances cell survival. J Biol Chem,
2000. 275(19):14624-31.
157. Piret, J.P., D. Mottet, M. Raes, and C. Michiels, CoCl2, a chemical inducer of hypoxia-
inducible factor-1, and hypoxia reduce apoptotic cell death in hepatoma cell line HepG2.
Ann N Y Acad Sci, 2002. 973: p. 443-7.
158. Li, Y. and M.A. Trush, Diphenyleneiodonium, an NAD(P)H oxidase inhibitor, also
potently inhibits mitochondrial reactive oxygen species production. Biochem Biophys
Res Commun, 1998. 253(2):295-9.
159. Shi, Y., A. Frankel, L.G. Radvanyi, L.Z. Penn, R.G. Miller, and G.B. Mills, Rapamycin
94
enhances apoptosis and increases sensitivity to cisplatin in vitro. Cancer Res, 1995.
55(9):1982-8.
160. Hudson, C.C., M. Liu, G.G. Chiang, D.M. Otterness, D.C. Loomis, F. Kaper, A.J. Giaccia,
and R.T. Abraham, Regulation of hypoxia-inducible factor 1alpha expression and function by
the mammalian target of rapamycin. Mol Cell Biol, 2002. 22(20):7004-14.
161. Scaife, R.M., Selective and irreversible cell cycle inhibition by diphenyleneiodonium.
Mol Cancer Ther, 2005. 4(6):876-84.
162. Goud, A.P., P.T. Goud, M.P. Diamond, B. Gonik, and H.M. Abu-Soud, Reactive oxygen
species and oocyte aging: role of superoxide, hydrogen peroxide, and hypochlorous acid.
Free Radic Biol Med, 2008. 44(7):1295-304.
163. McCord, J.M. and I. Fridovich, Superoxide dismutase. An enzymic function for
erythrocuprein (hemocuprein). J Biol Chem, 1969. 244(22):6049-55.
164. Schallreuter, K.U., J. Moore, J.M. Wood, W.D. Beazley, D.C. Gaze, D.J. Tobin, H.S.
Marshall, A. Panske, E. Panzig, and N.A. Hibberts, In vivo and in vitro evidence for
hydrogen peroxide (H2O2) accumulation in the epidermis of patients with vitiligo and its
successful removal by a UVB-activated pseudocatalase. J Investig Dermatol Symp Proc,
1999. 4(1):91-6.
165. Calastretti, A., A. Bevilacqua, C. Ceriani, S. Vigano, P. Zancai, S. Capaccioli, and A.
Nicolin, Damaged microtubules can inactivate BCL-2 by means of the mTOR kinase.
Oncogene, 2001. 20(43):6172-80.
166. Jiang, H. and Y. Feng, Hypoxia-inducible factor 1alpha (HIF-1alpha) correlated with
tumor growth and apoptosis in ovarian cancer. Int J Gynecol Cancer, 2006. 16 Suppl
1:405-12.
167. Kaewpila, S., S. Venkataraman, G.R. Buettner, and L.W. Oberley, Manganese

95
superoxide dismutase modulates hypoxia-inducible factor-1 alpha induction via
superoxide. Cancer Res, 2008. 68(8):2781-8.
168. Fletcher, N.M., Z. Jiang, R. Ali-Fehmi, N.K. Levin, J. Belotte, M.A. Tainsky, M.P.
Diamond, H.M. Abu-Soud, and G.M. Saed, Myeloperoxidase and free iron levels:
potential biomarkers for early detection and prognosis of ovarian cancer. Cancer
Biomark, 2011. 10(6):267-75.
169. Maitra, D., F. Shaeib, I. Abdulhamid, R.M. Abdulridha, G.M. Saed, M.P. Diamond, S.
Pennathur, and H.M. Abu-Soud, Myeloperoxidase acts as a source of free iron during
steady-state catalysis by a feedback inhibitory pathway. Free Radic Biol Med, 2013.
63C:90-98.
170. Leahy, Y., Are serum protein biomarkers effective in detecting ovarian cancer in its early
stages? Clin J Oncol Nurs, 2009. 13(4):443-5.
171. Balkwill, F. and A. Mantovani, Inflammation and cancer: back to Virchow? Lancet, 2001.
357(9255):539-45.
172. Ness, R.B. and C. Cottreau, Possible role of ovarian epithelial inflammation in ovarian
cancer. J Natl Cancer Inst, 1999. 91(17):1459-67.
173. Markiewski, M.M., R.A. DeAngelis, F. Benencia, S.K. Ricklin-Lichtsteiner, A.
Koutoulaki, C. Gerard, G. Coukos, and J.D. Lambris, Modulation of the antitumor
immune response by complement. Nat Immunol, 2008. 9(11):1225-35.
174. Rosin, M.P., W.A. Anwar, and A.J. Ward, Inflammation, chromosomal instability, and
cancer: the schistosomiasis model. Cancer Res, 1994. 54(7 Suppl):1929s-1933s.
175. Galijasevic, S., D. Maitra, T. Lu, I. Sliskovic, I. Abdulhamid, and H.M. Abu-Soud,
Myeloperoxidase interaction with peroxynitrite: chloride deficiency and heme depletion.
Free Radic Biol Med, 2009. 47(4):431-9.

96
176. Maitra, D., J. Banerjee, F. Shaeib, C.E. Souza, and H.M. Abu-Soud, Melatonin can
mediate its vascular protective effect by modulating free iron level by inhibiting
hypochlorous acid-mediated hemoprotein heme destruction. Hypertension, 2011.
57(5):e22; author reply e23.
177. Maitra, D., J. Byun, P.R. Andreana, I. Abdulhamid, M.P. Diamond, G.M. Saed, S.
Pennathur, and H.M. Abu-Soud, Reaction of hemoglobin with HOCl: mechanism of heme
destruction and free iron release. Free Radic Biol Med, 2011. 51(2):374-86.
178. Maitra, D., J. Byun, P.R. Andreana, I. Abdulhamid, G.M. Saed, M.P. Diamond, S.
Pennathur, and H.M. Abu-Soud, Mechanism of hypochlorous acid-mediated heme
destruction and free iron release. Free Radic Biol Med, 2011. 51(2):364-73.
179. Muscara, M.N., W. McKnight, S. Asfaha, and J.L. Wallace, Wound collagen deposition
in rats: effects of an NO-NSAID and a selective COX-2 inhibitor. Br J Pharmacol, 2000.
129(4):681-6.
180. Shi, H.P., D. Most, D.T. Efron, U. Tantry, M.H. Fischel, and A. Barbul, The role of iNOS
in wound healing. Surgery, 2001. 130(2):225-9.
181. Witte, M.B. and A. Barbul, Role of nitric oxide in wound repair. Am J Surg, 2002.
183(4):406-12.
182. Sadrzadeh, S.M., E. Graf, S.S. Panter, P.E. Hallaway, and J.W. Eaton, Hemoglobin. A
biologic fenton reagent. J Biol Chem, 1984. 259(23):14354-6.
183. Drapkin, R., H.H. von Horsten, Y. Lin, S.C. Mok, C.P. Crum, W.R. Welch, and J.L.
Hecht, Human epididymis protein 4 (HE4) is a secreted glycoprotein that is
overexpressed by serous and endometrioid ovarian carcinomas. Cancer Res, 2005.
65(6):2162-9.
184. Gilks, C.B., B.C. Vanderhyden, S. Zhu, M. van de Rijn, and T.A. Longacre, Distinction

97
between serous tumors of low malignant potential and serous carcinomas based on
global mRNA expression profiling. Gynecol Oncol, 2005. 96(3):684-94.
185. Galgano, M.T., G.M. Hampton, and H.F. Frierson, Jr., Comprehensive analysis of HE4
expression in normal and malignant human tissues. Mod Pathol, 2006. 19(6):847-53.
186. Bouchard, D., D. Morisset, Y. Bourbonnais, and G.M. Tremblay, Proteins with whey-
acidic-protein motifs and cancer. Lancet Oncol, 2006. 7(2):167-74.
187. Rosen, D.G., L. Wang, J.N. Atkinson, Y. Yu, K.H. Lu, E.P. Diamandis, I. Hellstrom, S.C.
Mok, J. Liu, and R.C. Bast, Jr., Potential markers that complement expression of CA125
in epithelial ovarian cancer. Gynecol Oncol, 2005. 99(2):267-77.
188. Scholler, N., M. Crawford, A. Sato, C.W. Drescher, K.C. O'Briant, N. Kiviat, G.L.
Anderson, and N. Urban, Bead-based ELISA for validation of ovarian cancer early
detection markers. Clin Cancer Res, 2006. 12(7 Pt 1):2117-24.
189. Moore, R.G., A.K. Brown, M.C. Miller, S. Skates, W.J. Allard, T. Verch, M. Steinhoff, G.
Messerlian, P. DiSilvestro, C.O. Granai, and R.C. Bast, Jr., The use of multiple novel
tumor biomarkers for the detection of ovarian carcinoma in patients with a pelvic mass.
Gynecol Oncol, 2008. 108(2):402-8.
190. Kim, J.H., S.J. Skates, T. Uede, K.K. Wong, J.O. Schorge, C.M. Feltmate, R.S.
Berkowitz, D.W. Cramer, and S.C. Mok, Osteopontin as a potential diagnostic
biomarker for ovarian cancer. JAMA, 2002. 287(13):1671-9.
191. Menon, U., S.J. Skates, S. Lewis, A.N. Rosenthal, B. Rufford, K. Sibley, N. Macdonald,
A. Dawnay, A. Jeyarajah, R.C. Bast, Jr., D. Oram, and I.J. Jacobs, Prospective study
using the risk of ovarian cancer algorithm to screen for ovarian cancer. J Clin Oncol,
2005. 23(31):7919-26.
192. Xu, F., Y. Yu, L. Daly, L. Anselmino, G. Hass, A. Berchuch, G. Rodriguez, J. Soper, D.

98
Clarke-Pearson, and D. Hollis, OVX1 as a marker for early stage endometrial carcinoma.
Cancer, 1994. 73(1):1855-8.
193. Havrilesky, L.J., C.M. Whitehead, J.M. Rubatt, R.L. Cheek, J. Groelke, Q. He, D.P.
Malinowski, T.J. Fischer, and A. Berchuck, Evaluation of biomarker panels for early
stage ovarian cancer detection and monitoring for disease recurrence. Gynecol Oncol,
2008. 110(3):374-82.
194. Loria, V., I. Dato, F. Graziani, and L.M. Biasucci, Myeloperoxidase: a new biomarker of
inflammation in ischemic heart disease and acute coronary syndromes. Mediators
Inflamm, 2008. 2008:135625.
195. Dally, H., K. Gassner, B. Jager, P. Schmezer, B. Spiegelhalder, L. Edler, P. Drings, H.
Dienemann, V. Schulz, K. Kayser, H. Bartsch, and A. Risch, Myeloperoxidase (MPO)
genotype and lung cancer histologic types: the MPO -463 A allele is associated with
reduced risk for small cell lung cancer in smokers. Int J Cancer, 2002. 102(5):530-5.
196. Piedrafita, F.J., R.B. Molander, G. Vansant, E.A. Orlova, M. Pfahl, and W.F. Reynolds,
An Alu element in the myeloperoxidase promoter contains a composite SP1-thyroid
hormone-retinoic acid response element. J Biol Chem, 1996. 271(24):14412-20.
197. Heinecke, J.W., W. Li, G.A. Francis, and J.A. Goldstein, Tyrosyl radical generated by
myeloperoxidase catalyzes the oxidative cross-linking of proteins. J Clin Invest, 1993.
91(6):2866-72.
198. Osterreicher, C.H., C. Datz, F. Stickel, C. Hellerbrand, M. Penz, H. Hofer, F. Wrba, E.
Penner, D. Schuppan, and P. Ferenci, Association of myeloperoxidase promotor
polymorphism with cirrhosis in patients with hereditary hemochromatosis. J Hepatol,
2005. 42(6):914-9.
199. Ekmekci, O.B., O. Donma, E. Sardogan, N. Yildirim, O. Uysal, H. Demirel, and T.

99
Demir, Iron, nitric oxide, and myeloperoxidase in asthmatic patients. Biochemistry
(Mosc), 2004. 69(4):462-7.
200. Serum Iron. Serum Iron 2006; Available from:
http://uimc.discoveryhospital.com/main.php?id=1456.
201. Medline. Serum Iron. Serum Iron 2010; Available from:
http://www.nlm.nih.gov/medlineplus/ency/article/003488.htm.
202. Brennan, M.L., M.S. Penn, F. Van Lente, V. Nambi, M.H. Shishehbor, R.J. Aviles, M.
Goormastic, M.L. Pepoy, E.S. McErlean, E.J. Topol, S.E. Nissen, and S.L. Hazen,
Prognostic value of myeloperoxidase in patients with chest pain. N Engl J Med, 2003.
349(17):1595-604.
203. Baldus, S., C. Heeschen, T. Meinertz, A.M. Zeiher, J.P. Eiserich, T. Munzel, M.L.
Simoons, and C.W. Hamm, Myeloperoxidase serum levels predict risk in patients with
acute coronary syndromes. Circulation, 2003. 108(12):1440-5.
204. Bozzini, C., D. Girelli, E. Tinazzi, O. Olivieri, C. Stranieri, A. Bassi, E. Trabetti, G.
Faccini, P.F. Pignatti, and R. Corrocher, Biochemical and genetic markers of iron status
and the risk of coronary artery disease: an angiography-based study. Clin Chem, 2002.
48(4):622-8.
205. de Valk, B. and J.J. Marx, Iron, atherosclerosis, and ischemic heart disease. Arch Intern
Med, 1999. 159(14):1542-8.
206. Sullivan, J.L., Iron and the genetics of cardiovascular disease. Circulation, 1999.
100(12):1260-3.
207. Niederau, C., Iron overload and atherosclerosis. Hepatology, 2000. 32(3):672-4.
208. Zhu, C.S., P.F. Pinsky, D.W. Cramer, D.F. Ransohoff, P. Hartge, R.M. Pfeiffer, N. Urban,
G. Mor, R.C. Bast, Jr., L.E. Moore, A.E. Lokshin, M.W. McIntosh, S.J. Skates, A.

100
Vitonis, Z. Zhang, D.C. Ward, J.T. Symanowski, A. Lomakin, E.T. Fung, P.M. Sluss, N.
Scholler, K.H. Lu, A.M. Marrangoni, C. Patriotis, S. Srivastava, S.S. Buys, and C.D.
Berg, A framework for evaluating biomarkers for early detection: validation of
biomarker panels for ovarian cancer. Cancer Prev Res (Phila), 2011. 4(3):375-83.
209. Baker, S.G., B.S. Kramer, M. McIntosh, B.H. Patterson, Y. Shyr, and S. Skates,
Evaluating markers for the early detection of cancer: overview of study designs and
methods. Clin Trials, 2006. 3(1):43-56.
210. Skates, S.J., F.J. Xu, Y.H. Yu, K. Sjovall, N. Einhorn, Y. Chang, R.C. Bast, Jr., and R.C.
Knapp, Toward an optimal algorithm for ovarian cancer screening with longitudinal
tumor markers. Cancer, 1995. 76(10 Suppl):2004-10.
211. Kaplun, L., A.L. Fridman, W. Chen, N.K. Levin, S. Ahsan, N. Petrucelli, J.L. Barrick, R.
Gold, S. Land, M.S. Simon, R.T. Morris, A.R. Munkarah, and M.A. Tainsky, Variants in
the Signaling Protein TSAd are Associated with Susceptibility to Ovarian Cancer in
BRCA1/2 Negative High Risk Families. Biomark Insights, 2012. 7:151-7.
212. Pearce, C.L., M.A. Rossing, A.W. Lee, R.B. Ness, P.M. Webb, G. Chenevix-Trench, S.J.
Jordan, D.A. Stram, J. Chang-Claude, R. Hein, S. Nickels, G. Lurie, P.J. Thompson, M.E.
Carney, M.T. Goodman, K.B. Moysich, E.V. Hogdall, A. Jensen, E.L. Goode, B.L. Fridley,
J.M. Cunningham, R.A. Vierkant, R.P. Weber, A. Ziogas, H. Anton-Culver, S.A. Gayther, A.
Gentry-Maharaj, U. Menon, S.J. Ramus, L.A. Brinton, N. Wentzensen, J. Lissowska, M.
Garcia-Closas, L. Massuger, L.A. Kiemeney, A.M. van Altena, K.K. Aben, A. Berchuck, J.A.
Doherty, E. Iversen, V. McGuire, P.G. Moorman, P.D. Pharoah, M.C. Pike, H.A. Risch, W.
Sieh, D.O. Stram, K.L. Terry, A.S. Whittemore, A. Wu, J.M. Schildkraut, and S.K. Kjaer,
Combined and interactive effects of environmental and GWAS-identified risk factors in
ovarian cancer. Cancer Epidemiol Biomarkers Prev, 2013.

101
213. NCI, National Cancer Institute: PDQ® Genetics of Breast and Ovarian Cancer.
Available from http://www.cancer.gov/cancertopics/pdq/genetics/breast-and-
ovarian/HealthProfessional/page2, 2012.
214. White, K.L., J.M. Schildkraut, R.T. Palmieri, E.S. Iversen, Jr., A. Berchuck, R.A.
Vierkant, D.N. Rider, B. Charbonneau, M.S. Cicek, R. Sutphen, M.J. Birrer, P.P. Pharoah,
H. Song, J. Tyrer, S.A. Gayther, S.J. Ramus, N. Wentzensen, H.P. Yang, M. Garcia-
Closas, C.M. Phelan, J.M. Cunningham, B.L. Fridley, T.A. Sellers, and E.L. Goode,
Ovarian cancer risk associated with inherited inflammation-related variants. Cancer Res,
2012. 72(5):1064-9.
215. Prat, J., A. Ribe, and A. Gallardo, Hereditary ovarian cancer. Hum Pathol, 2005.
36(8):861-70.
216. Savas, S., S. Schmidt, H. Jarjanazi, and H. Ozcelik, Functional nsSNPs from carcinogenesis-
related genes expressed in breast tissue: potential breast cancer risk alleles and their
distribution across human populations. Hum Genomics, 2006. 2(5):287-96.
217. Petrucelli, N., M.B. Daly, and G.L. Feldman, Hereditary breast and ovarian cancer due
to mutations in BRCA1 and BRCA2. Genet Med, 2010. 12(5):245-59.
218. Ramus, S.J., R.A. Vierkant, S.E. Johnatty, M.C. Pike, D.J. Van Den Berg, A.H. Wu, C.L.
Pearce, U. Menon, A. Gentry-Maharaj, S.A. Gayther, R.A. Dicioccio, V. McGuire, A.S.
Whittemore, H. Song, D.F. Easton, P.D. Pharoah, M. Garcia-Closas, S. Chanock, J.
Lissowska, L. Brinton, K.L. Terry, D.W. Cramer, S.S. Tworoger, S.E. Hankinson, A.
Berchuck, P.G. Moorman, J.M. Schildkraut, J.M. Cunningham, M. Liebow, S.K. Kjaer, E.
Hogdall, C. Hogdall, J. Blaakaer, R.B. Ness, K.B. Moysich, R.P. Edwards, M.E. Carney,
G. Lurie, M.T. Goodman, S. Wang-Gohrke, S. Kropp, J. Chang-Claude, P.M. Webb, X.
Chen, J. Beesley, G. Chenevix-Trench, and E.L. Goode, Consortium analysis of 7

102
candidate SNPs for ovarian cancer. Int J Cancer, 2008. 123(2):380-8.
219. Teraoka, S.N., J.L. Bernstein, A.S. Reiner, R.W. Haile, L. Bernstein, C.F. Lynch, K.E.
Malone, M. Stovall, M. Capanu, X. Liang, S.A. Smith, J. Mychaleckyj, X. Hou, L.
Mellemkjaer, J.D. Boice, Jr., A. Siniard, D. Duggan, D.C. Thomas, and P. Concannon,
Single nucleotide polymorphisms associated with risk for contralateral breast cancer in
the Women's Environment, Cancer, and Radiation Epidemiology (WECARE) Study.
Breast Cancer Res, 2011. 13(6):R114.
220. Erichsen, H.C. and S.J. Chanock, SNPs in cancer research and treatment. Br J Cancer,
2004. 90(4):747-51.
221. Savas, S. and H. Ozcelik, Phosphorylation states of cell cycle and DNA repair proteins
can be altered by the nsSNPs. BMC Cancer, 2005. 5:107.
222. Wyche, K.E., S.S. Wang, K.K. Griendling, S.I. Dikalov, H. Austin, S. Rao, B. Fink, D.G.
Harrison, and A.M. Zafari, C242T CYBA polymorphism of the NADPH oxidase is
associated with reduced respiratory burst in human neutrophils. Hypertension, 2004.
43(6):1246-51.
223. Najafi, M., B. Alipoor, M. Shabani, A. Amirfarhangi, and H. Ghasemi, Association
between rs4673 (C/T) and rs13306294 (A/G) haplotypes of NAD(P)H oxidase p22phox
gene and severity of stenosis in coronary arteries. Gene, 2012. 499(1):213-7.
224. Dinauer, M.C., E.A. Pierce, G.A. Bruns, J.T. Curnutte, and S.H. Orkin, Human
neutrophil cytochrome b light chain (p22-phox). Gene structure, chromosomal location,
and mutations in cytochrome-negative autosomal recessive chronic granulomatous
disease. J Clin Invest, 1990. 86(5):1729-37.
225. Lee, P.L., C. West, K. Crain, and L. Wang, Genetic polymorphisms and susceptibility to
lung disease. J Negat Results Biomed, 2006. 5:5.

103
226. Davies, S.M., M.J. Borowitz, G.L. Rosner, K. Ritz, M. Devidas, N. Winick, P.L. Martin,
P. Bowman, J. Elliott, C. Willman, S. Das, E.H. Cook, and M.V. Relling,
Pharmacogenetics of minimal residual disease response in children with B-precursor
acute lymphoblastic leukemia: a report from the Children's Oncology Group. Blood,
2008. 111(6):2984-90.
227. San Jose, G., M.U. Moreno, S. Olivan, O. Beloqui, A. Fortuno, J. Diez, and G. Zalba,
Functional effect of the p22phox -930A/G polymorphism on p22phox expression and
NADPH oxidase activity in hypertension. Hypertension, 2004. 44(2):163-9.
228. Schirmer, M., M. Hoffmann, E. Kaya, M. Tzvetkov, and J. Brockmoller, Genetic
polymorphisms of NAD(P)H oxidase: variation in subunit expression and enzyme activity.
Pharmacogenomics J, 2008. 8(4):297-304.
229. Rae, J., D. Noack, P.G. Heyworth, B.A. Ellis, J.T. Curnutte, and A.R. Cross, Molecular
analysis of 9 new families with chronic granulomatous disease caused by mutations in
CYBA, the gene encoding p22(phox). Blood, 2000. 96(3):1106-12.
230. Gardemann, A., P. Mages, N. Katz, H. Tillmanns, and W. Haberbosch, The p22 phox
A640G gene polymorphism but not the C242T gene variation is associated with coronary
heart disease in younger individuals. Atherosclerosis, 1999. 145(2):315-23.
231. Welcsh, P.L. and M.C. King, BRCA1 and BRCA2 and the genetics of breast and ovarian
cancer. Hum Mol Genet, 2001. 10(7): p. 705-13.
232. Cohen, J., Statistical power analysis for the behavioral sciences (2nd edition). 2 ed.
1988:Erlbaum.
233. Chen, K., S.E. Craige, and J.F. Keaney, Jr., Downstream targets and intracellular
compartmentalization in Nox signaling. Antioxid Redox Signal, 2009. 11(10):2467-80.
234. Graham, K.A., M. Kulawiec, K.M. Owens, X. Li, M.M. Desouki, D. Chandra, and K.K.

104
Singh, NADPH oxidase 4 is an oncoprotein localized to mitochondria. Cancer Biol Ther,
2010. 10(3):223-31.
235. Jiang, F., Y. Zhang, and G.J. Dusting, NADPH oxidase-mediated redox signaling: roles
in cellular stress response, stress tolerance, and tissue repair. Pharmacol Rev, 2011.
63(1):218-42.
236. Reckelhoff, J.F. and J.C. Romero, Role of oxidative stress in angiotensin-induced
hypertension. Am J Physiol Regul Integr Comp Physiol, 2003. 284(4):R893-912.
237. Hsieh, C.H., W.C. Shyu, C.Y. Chiang, J.W. Kuo, W.C. Shen, and R.S. Liu, NADPH
oxidase subunit 4-mediated reactive oxygen species contribute to cycling hypoxia-
promoted tumor progression in glioblastoma multiforme. PLoS One, 2011. 6(9):e23945.
238. Cai, H., K.K. Griendling, and D.G. Harrison, The vascular NAD(P)H oxidases as
therapeutic targets in cardiovascular diseases. Trends in Pharmacological Sciences,
2003. 24(9):471-478.
239. Touyz, R.M., Reactive oxygen species, vascular oxidative stress, and redox signaling in
hypertension: what is the clinical significance? Hypertension, 2004. 44(3):248-52.
240. Wu, T.C., C.Y. Chao, S.J. Lin, and J.W. Chen, Low-dose dextromethorphan, a NADPH
oxidase inhibitor, reduces blood pressure and enhances vascular protection in
experimental hypertension. PLoS One, 2012. 7(9):e46067.
241. Clarke-Pearson, D.L., Clinical practice. Screening for ovarian cancer. N Engl J Med,
2009. 361(2):170-7.
242. MacDonald, N.D., A.N. Rosenthal, and I.J. Jacobs, Screening for ovarian cancer. Ann
Acad Med Singapore, 1998. 27(5):676-82.
243. Screening for ovarian cancer: recommendation statement. U.S. Preventive Services Task
Force. Am Fam Physician, 2005. 71(4):759-62.

105
ABSTRACT
THE ROLE OF OXIDATIVE STRESS IN THE PATHOGENESIS OF EPITHELIAL OVARIAN CANCER
by
NICOLE MARIE FLETCHER-KING
August 2013
Advisor: Dr. Ghassan Saed
Major: Physiology
Degree: Doctor of Philosophy
Ovarian cancer is the leading cause of death from gynecologic malignancies yet the
underlying pathophysiology is not clearly established. The disease is usually diagnosed in the
advanced stage and carries a poor prognosis. The 5-year survival rate is greater than 75% if
diagnosis of the cancer occurs at an early stage; however, this rate drops to 20% when the tumor
has spread beyond its origin. Thus, a method for early detection is critically needed, which can
help prolong, or even save lives. Currently, an effective screening test for ovarian cancer is
lacking. Many tests have been evaluated but have been found to be lacking in sensitivity,
specificity, or both. This becomes even more difficult as ovarian cancer is so rare in the general
population, with an estimated prevalence of 0.04%. To date, 96% is the highest sensitivity
recorded for the early detection of ovarian cancer. However, because of the low prevalence of
ovarian cancer, a sensitivity and specificity of 96% would only detect 1 case of cancer per 100
oophorectomies done for positive screens due to the high false positive rate.
Clinical and epidemiological investigations have provided evidence supporting the role of
reactive oxygen species (ROS) in the prognosis and metastasis of cancer due to exogenous
factors that lead to chronic inflammation. In addition, cancer cells are frequently under

106
persistent oxidative stress, which participates in cancer progression as well as in the selection of
resistant cells that are unable to be eliminated by apoptosis. A recent novel finding from our
laboratory has shown that myeloperoxidase (MPO) is expressed in ovarian cancer cell lines and
tissues, with minimal or no expression detected in normal ovarian tissues. Myeloperoxidase is
an abundant heme protein, which plays a central role in the formation of reactive oxidant and
free radical species. Additionally, under conditions of oxidative stress, MPO serves as a source
of free iron.
Another source of ROS is the superoxide producing nicotinamide adenine dinucleotide
phosphate (NAD(P)H) oxidase, which we observed to be upregulated in ovarian cancer as
compared to normal ovarian tissues. It has been reported that mutations in specific regions of
NAD(P)H oxidase subunits contribute to the enhancement of the enzyme activity with
subsequent increase in superoxide (O2●−) production, contributing to enhanced levels of
oxidative stress.
Therefore, there is compelling evidence to support the role of oxidative stress in the
pathogenesis of ovarian cancer, yet the mechanisms responsible for the dissemination of EOC
are not fully understood. The objective of this work is to identify mechanisms of oxidative stress
in the pathogenesis of ovarian cancer. The central hypothesis of this study is that ovarian cancer
is controlled by mechanisms that emanate from an altered redox balance. To test this hypothesis,
the following specific aims have been investigated:
Specific Aim I: Determine the oxidative stress profile in epithelial ovarian cancer and
determine the effect of the modulation of specific key players of oxidative stress on the
persistence of the oncogenic phenotype. To determine the oxidative stress profile, the
expression of the following markers will be evaluated: NAD(P)H oxidase, nitrate/nitrite,
glutathione, glutathione reductase, glutathione peroxidase, glutathione s-transferase, inducible

107
nitric oxide synthase, myeloperoxidase, catalase, and superoxide dismutase in epithelial ovarian
cancer cells and tissues as compared to their normal counterparts. These markers were selected
based on extensive preliminary and published results, utilizing a cell culture model and ovarian
cancer tissues. Modulation of key players of oxidative stress will contribute to delineation of the
mechanisms of development of ovarian cancer. To achieve this, a combination of knockdown or
inhibition of specific pro-oxidants utilizing siRNA or direct inhibition will be performed
followed by the assessment of the expression other pro-oxidants as well as the effect on
apoptosis.
Specific Aim II: To assess the effectiveness of MPO and free iron levels in detection of early
stage ovarian cancer. The mechanism by which MPO functions under oxidative stress is not
well defined. MPO has been indicated to serve as a source of free iron under oxidative stress.
The hypothesis of this aim is that serum MPO and free iron levels can be utilized to distinguish
patients with stage I ovarian cancer from those with normal ovaries or benign gynecologic
conditions as well as from late state ovarian cancer. MPO and free iron levels will be measured
in the sera and tissues of women at the time of ovarian cancer diagnosis as compared to healthy
women or those with benign gynecologic disorders respectively. The biological significance of
the relationship between serum MPO and free iron, in conjunction with the poor prognosis of
ovarian cancer has the potential for future clinical applications. .
Specific Aim III: To assess whether a SNP in NAD(P)H oxidase is associated with increased
risk of development of ovarian cancer. Single nucleotide polymorphisms (SNPs) are
associated with increased risk of several cancers. We evaluated the association of a SNP
(rs4673) in the CYBA gene, encoding the p22phox subunit of NAD(P)H oxidase, substituting
allele C with T at position 242 located on chromosome 16q24, in high-risk individuals with or
without ovarian cancer, with or without a deleterious BRCA1/2 mutation. This SNP is known to

108
be associated an increased activity of the enzyme, resulting in an increase in superoxide
production. TaqMan® SNP Genotype analysis and the QuantStudio 12K Flex Real-Time PCR
System were utilized to determine the frequency of this SNP in individuals with ovarian cancer
as compared to noncancerous individuals.

109
AUTOBIOGRAPHICAL STATEMENT
NICOLE MARIE FLETCHER-KING
EDUCATION 2008-2013 Ph.D. in Physiology (RPS Conc.), Wayne State University, Detroit, MI 2001-2006 Bachelors of Science in Biology, Wayne State University, Detroit, M AWARDS 2008-2013 Interdisciplinary Biological Science Fellowship, Wayne State Univ., Detroit, MI 2003 Blue Cross Blue Shield Superior Academic Performance Scholarship Fall 2002 Blue Cross Blue Shield Superior Academic Performance Scholarship Winter 2002 Dean’s list, Wayne State University, Detroit, MI 2000 Blue Cross Blue Shield Superior Academic Performance Scholarship 2000 Academic Honors, Oakland University, Rochester Hills, MI 1999 Academic Commendation, Oakland University, Rochester Hills, MI PUBLICTIONS (on select related original work over the last 4 years) 1. †Belotte J, †Fletcher NM, Awonuga AO, Mitchell A, Abu-Soud HM, Saed MG, Diamond
MP, Saed GM. The role of oxidative stress in the development of cisplatin resistance in epithelial ovarian cancer. In Press, Reproductive Sciences, July 12, 2013. †Denotes coauthorship.
2. Detti L, Uhlmann RA, Fletcher NM, Diamond MP, Saed GM. Endometrial signaling pathways during ovarian stimulation for assisted reproductive technology. In Press Fertility & Sterility, May 2013.
3. Fletcher NM, Jiang Z, Ali-Fehmi R, Levin NK, Belotte J, Tainsky MA, Diamond MP, Abu-Soud HM, Saed GM. Myeloperoxidase and free iron levels: potential biomarkers for early detection and prognosis of ovarian cancer. Cancer Biomark. 2011-2012;10(6):267-75. PMID: 22820082.
4. Saed GM, Fletcher NM, Jiang ZL, Abu-Soud HM, Diamond MP. Dichloroacetate induces apoptosis of epithelial ovarian cancer cells through a mechanism involving modulation of oxidative stress. Reprod Sci. 2011 Dec;18(12):1253-61. PMID: 21701041.
5. Jiang ZL, Fletcher NM, Ali-Fehmi R, Diamond MP, Abu-Soud HM, Munkarah AR. Modulation of redox signaling promotes apoptosis in epithelial ovarian cancer cells. Gynecol Oncol. 2011 Aug;122(2):418-23. PMID: 21620448.
6. Meng Q, Sun W, Jiang ZL, Fletcher NM, Diamond MP, and Saed GM. Identification of common mechanisms between endometriosis and ovarian cancer. J Assist Reprod Genet. 2011 Sep;28(10):917-23. PMID: 21614520.
7. Saed GM, Ali-Fehmi R, Jiang ZL, Fletcher NM, Diamond MP, Abu-Soud HM, Munkarah AR. Myeloperoxidase serves as a redox switch that regulates apoptosis in epithelial ovarian cancer. Gynecol Oncol. 2010 Feb;116(2):276-81. Epub 2009 Dec 3. PMID:19962178.
8. Jiang ZL, Fletcher NM, Diamond MP, Abu-Soud HM, Saed GM. S-nitrosylation of caspase-3 is the mechanism by which adhesion fibroblasts manifest lower apoptosis. Wound Repair Regen. 2009 Mar-Apr;17(2):224-9. PMID: 19320891.