the role of nanoparticle suspensions in thermo/fluid and biomedical...
TRANSCRIPT
25
The Role of Nanoparticle Suspensions in Thermo/Fluid and Biomedical Applications
Khalil M. Khanafer and Kambiz Vafai
2.1 INTRODUCTION
Recent advances in nanomaterials and nanotechnology have led to the development of new class of heat-transfer fluids containing nanometer-sized particles called nanoparticles typically made of carbon nanotubes, metals, or oxides. Nanofluids are engineered by suspending nanoparticles with average sizes below 100 nm in
2
CONTENTS
2.1 Introduction .....................................................................................................252.2 Analytical Models for Physical Properties of Nanofluids ...............................28
2.2.1 Density ................................................................................................282.2.2 Heat Capacity of Nanofluids ...............................................................282.2.3 Thermal Expansion Coefficient of Nanofluids ...................................302.2.4 Effective Viscosity of Nanofluids ....................................................... 32
2.2.4.1 Analytical Studies ................................................................ 322.2.4.2 Experimental Studies ........................................................... 32
2.3 Effect of Temperature on the Dynamic Viscosity of Nanofluids ....................362.4 Thermal Conductivity of Nanofluids .............................................................. 41
2.4.1 Experimental Investigations ................................................................ 492.5 Nucleate Pool Boiling and Critical Heat Flux of Nanofluids ......................... 52
2.5.1 Nucleate Pool Boiling Heat Transfer and CHF Enhancement Mechanisms of Nanofluids .................................................................54
2.5.2 Nucleate Pool Boiling Heat Transfer and CHF Correlations .............. 562.6 Medical Applications of Nanoparticles ........................................................... 572.7 Conclusions ..................................................................................................... 59Nomenclature ........................................................................................................... 59
Greek Symbols ................................................................................................60Subscripts ........................................................................................................60
References ................................................................................................................60
26 Nanoparticle Heat Transfer and Fluid Flow
a base fluid such as water, ethylene glycol, and oil [1]. Compared with the base fluid, nanofluids have distinctive properties that make them attractive in many applications such as pharmaceutical processes, transportation industry, thermal management of electronics, fuel cells, boiler flue gas temperature reduction, heat exchangers, etc. [2]. Extensive research studies on heat-transfer enhancement using nanofluids were conducted both experimentally and theoretically in the literature [1–15]. Conflicting results on the heat transfer enhancement using nanofluids in forced and natural convection are reported in the literature. Pak and Cho [16] illustrated that the Nusselt number for Al2O3–water and TiO2–water nanofluids increased with increasing Reynolds number and volume fraction of nanoparticles. Nevertheless, the convective heat-transfer coefficient for nanofluids at a volume fraction of 3% was found to be 12% smaller than that of the base fluid when assum-ing a constant average velocity [16]. Yang et al. [17] studied experimentally the convective heat-transfer coefficients of graphite–water nanofluids under laminar flow in a horizontal tube heat exchanger. Their experimental heat-transfer coef-ficients showed that the nanoparticles increased the heat-transfer coefficient of the fluid system in laminar flow, but the increase was much less than that predicted by the existing correlation based on static thermal conductivity measurements. However, many other researchers have reported forced convective heat-transfer enhancement using nanofluids [18–22].
Not many studies are found in the literature on the application of nanofluids in natural convective heat transfer. Khanafer et al. [6] analyzed numerically natural convection heat transfer of nanofluids in an enclosure under various physical parameters. Their results showed that the average Nusselt number increases with an increase in the nanoparticles volume fraction for different Grashof numbers. Kim et al. [23] introduced a factor to explain the effect of nanoparticle addition on the convective instability and heat-transfer characteristics of a base fluid. The new factor included the effect of the ratio of the thermal conductivity of nanoparticles to that of the base fluid, the shape factor of the nanoparticles, the volume fraction of nanoparticles, and the heat capacity ratio. Their results indi-cate that the heat-transfer coefficient in the presence of nanofluids increases with an increase in the volume fraction of nanoparticles. Ghasemi and Aminossadati [24] numerically studied natural convection heat transfer in an inclined enclo-sure filled with a CuO–water nanofluid for various pertinent parameters such as Rayleigh number, inclination angle, and solid volume fraction. Their results indicated that the addition of nanoparticles improves heat-transfer performance. In addition, they showed that there is an optimum solid volume fraction that maximizes heat-transfer rate. Natural convective heat-transfer enhancement using nanofluids was also demonstrated experimentally by Nnanna et al. [25] and Nnanna and Routhu [26].
Conversely, Putra et al. [13] illustrated experimentally that the presence of nanoparticles (Al2O3 and CuO) in water-based nanofluids inside a horizontal cyl-inder decreased natural convective heat-transfer coefficient with an increase in the volume fraction of nanoparticles, particle density as well as the aspect ratio of the cylinder. Ding et al. [27] have also reported experimentally that the natural
27The Role of Nanoparticle Suspensions
convective heat-transfer coefficient decreases systematically with an increase in nanoparticle concentration, and the deterioration was partially related to the higher viscosity of nanofluids. Chang et al. [28] considered natural convection experiments with Al2O3 micro-particle (approximately 250 nm) aqueous suspensions in thin enclosures. Their results illustrated that nanoparticles have insignificant effect on the Nusselt number values for a vertical enclosure. Nevertheless, for horizontal enclo-sure, there was a decrease in Nusselt number compared with pure water at lower Rayleigh numbers and higher particle concentrations. The researchers attributed this anomalous behavior to sedimentation.
Presently, there are no robust theoretical models to determine the anomalous thermal conductivity enhancement of nanofluids. Many researchers have attrib-uted the thermal conductivity enhancement of nanofluids to thermal conductivi-ties of fluid and nanoparticles, shape and surface area of nanoparticles, volume fraction, and temperature [29]. Keblinski et al. [29] and Eastman et al. [30] pro-posed four main mechanisms for thermal conductivity enhancement of nanofluids. These consist of Brownian motion of nanoparticles, molecular-level layering of the liquid at the liquid/particle interface, heat transport within the nanoparticles, and the effects of nanoparticle clustering. On the basis of molecular dynamics simulations and the simple kinetic theory, Evans et al. [31] demonstrated that the hydrodynamics effects associated with Brownian motion have a small effect on the thermal conductivity of the nanofluid. Conflicting results were reported in the lit-erature associated with the effect of solid/liquid interfacial layer (i.e., the interface between the nanoparticle and the fluid) on the thermal conductivity enhancement of nanofluids [32–37].
Yu and Choi [32,33] and Xue and Xu [34] suggested a theoretical model for the effect of a solid/liquid interface based on the Hamilton–Crosser model for suspensions of nano-spherical particles. Their results showed that the solid/liquid interfacial layers play an important role in enhancing the thermal conductivity of nanofluids. Considering the interface effect between the solid particles and the base fluid in nanofluids, Xue [35] developed a model for the effective ther-mal conductivity of nanofluids based on Maxwell theory and average polarization theory. Xue [35] suggested that the developed model can interpret the anoma-lous enhancement of the effective thermal conductivity of the nanofluid. On the basis of molecular dynamic simulations and simple liquid–solid interfaces, Xue et al. [37] illustrated that the layering of the liquid atoms at the liquid–solid inter-face does not have any significant effect on the thermal-transport properties of nanofluids.
Although many possible mechanisms were proposed in the literature, there are no robust theoretical and experimental studies that explain the basis for possible heat-transfer enhancement when using nanofluids. As such, it is still unclear as to what are the best models to use for the thermal conductivity and viscosity of nanofluids. Therefore, the aim of this study is to analyze the variants within the thermophysical characteristics of nanofluids especially with respect to the thermal conductivity and viscosity models and propose possible physical reasons for the deviations between experimental and analytical studies.
28 Nanoparticle Heat Transfer and Fluid Flow
2.2 ANALYTICAL MODELS FOR PHYSICAL PROPERTIES OF NANOFLUIDS
2.2.1 Density
The density of nanofluid can be determined analytically based on the physical principle of the mixture rule as
ρ
ρ ρφ ρ φ ρeff
eff
f p
f p
f f p p
f pp f p p=
=++ =
++ = − +m
Vm mV V
V VV V
( )1
(2.1)
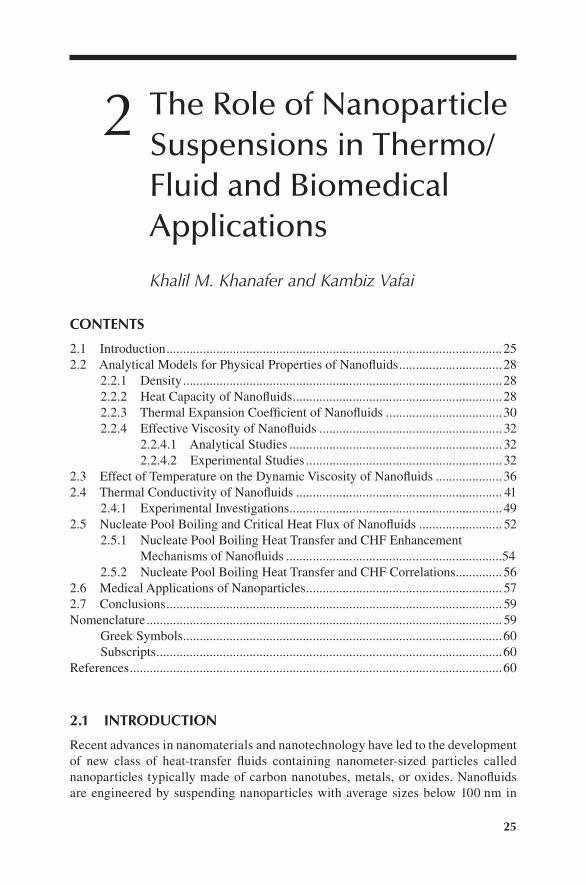
where f and p refer to the fluid and nanoparticle, respectively, and ϕp = (Vp/Vf + Vp) is the volume fraction of the nanoparticles. To test the validity of Equation 2.1, Pak and Cho [16] and Ho et al. [38] conducted experimental studies to measure the density of Al2O3–water nanofluids at room temperature as depicted in Figure 2.1a. Excellent agreement was found between the experimental results and the predictions using Equation 2.1 as shown in Figure 2.1a. Ho et al. [38] also measured the density of Al2O3–water nanofluid at different temperatures and nanoparticle volume fractions. Khanafer and Vafai [39] developed a correlation for the density of Al2O3–water nanofluid using the experimental data of Ho et al.’s study [38] as a function of tem-perature and volume fraction of nanoparticles as follows:
ρ φ φeff p po= + − ≤ ≤ ≤ ≤1001 064 2738 6191 0 2095 0 0 04 5 40. . . ; . , ( )T T C
(2.2)
The R2 of the regression is 99.97% and the maximum relative error is 0.22%. It is clear from Figure 2.1b that the present regression (Equation 2.2) is in excellent agreement with the density measurements of Ho et al. [38].
2.2.2 Heat CapaCity of nanofluiDs
The vast majority of studies on nanofluids have used an analytical model for the specific heat by assuming thermal equilibrium between the nanoparticles and the base fluid phase as follows:
( )( )
( ) (ρ ρ ρ ρc
Qm T
Q Q
m m T
mc Teff eff
effeff
f p
f peff
f=
=+
+ =+
∆ ∆∆ mmc T
m m T
cc V c V
V V
c
)
( )
( )( ) ( )
p
f p
eff efff f p p
f f p p
eff
∆∆+
→ =++
⇒
ρ ρρ ρ
ρ ρ
==− +( )1 φ ρ φ ρ
ρp f f p p p
eff
c c
(2.3)
where ρp is the density of the nanoparticle, ρf is the density of the base fluid, ρeff is the density of the nanofluid, and cp and cf are the heat capacities of the nanoparticle

29The Role of Nanoparticle Suspensions
and the base fluid, respectively. In contrast, some researchers [16,40–42] suggest a simpler expression given by
c c ceff p f p p= − +( )1 φ φ (2.4)
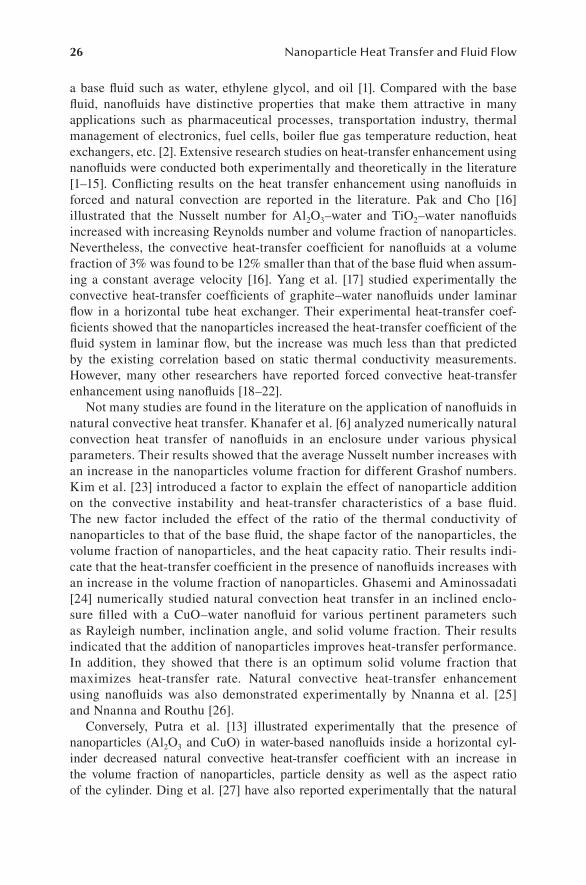
The experimental data of Zhou and Ni [43] were used to evaluate the validity of Equations 2.3 and 2.4, Figure 2.2 shows a comparison of the specific heat of Al2O3–water nanofluid at room temperature using both equations with the experimental data of Zhou and Ni [43] for various volume fractions (ϕp = 0−21.7%). Figure 2.2 shows that model I given in Equation 2.3 compares very well with the experimental data of Zhou and Ni [43].
1200
1100
1000
900
1150Ho et al. [38]-4%
Ho et al. [38]-2%
Ho et al. [38]-0%
Equation 2.2
Equation 2.2
Equation 2.21100
1050
1000
9500 10 20 30
T (° C)
ρ eff
ρ eff
ϕp
40 50 60
0.00 0.01
Pak and Cho [16]
(a)
(b)
Ho et al. [38]Theoretical
0.02 0.03 0.04 0.05
FIGURE 2.1 Effect of the volume fraction on the density of the Al2O3–water nanofluid: (a) room temperature; (b) various temperatures. (Reprinted from K. Khanafer and K. Vafai. 2011, A critical synthesis of thermophysical characteristics of nanofluids, International Journal of Heat and Mass Transfer 54, 4410–4428, Copyright 2011, with permission from Elsevier.)

30 Nanoparticle Heat Transfer and Fluid Flow
2.2.3 tHermal expansion CoeffiCient of nanofluiDs
The thermal expansion coefficient of nanofluids can be approximated by utilizing the volume fraction of the nanoparticles on a weight basis as follows [6]:
β
φ ρβ φ ρβρeff
p f p p
eff
=− +( )( ) ( )1
(2.5)
where βf and βp are the thermal expansion coefficients of the base fluid and the nanoparticle, respectively. However, some investigators give a simpler model for the thermal expansion coefficient of the nanofluid as [44,45]:
β φ β φ βeff p f p p= − +( )1 (2.6)
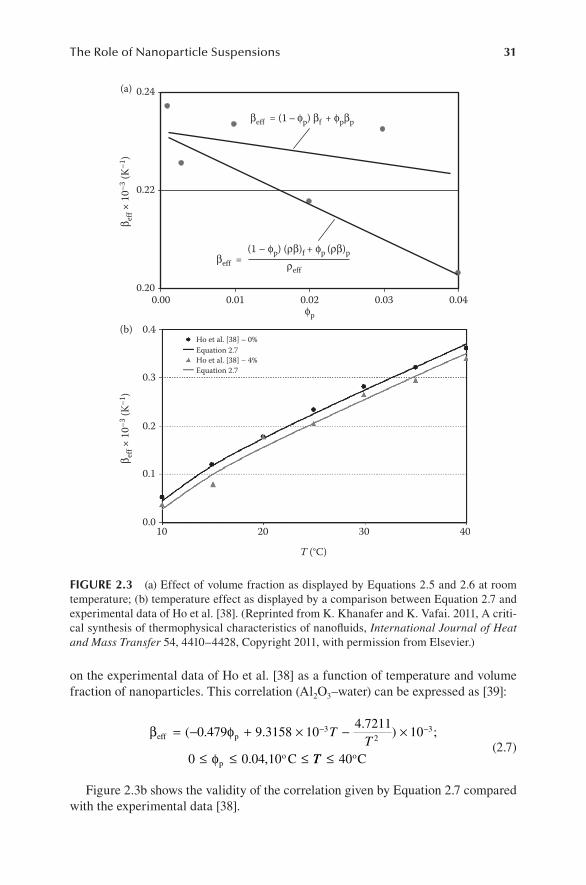
Ho et al. [38] conducted an experimental study to estimate the thermal expansion of Al2O3–water nanofluid at various volume fractions of nanoparticles. The values of the thermal expansion of Al2O3–water nanofluid predicted by Equations 2.5 and 2.6 were compared with the experimental data of Ho et al. [38] at a temperature of 26°C. Figure 2.3a shows that neither Equation 2.5 nor Equation 2.6 can be utilized to correctly determine the thermal expansion of nanofluid as compared with the experi-mental data of Ho et al. [38]. The effect of varying the temperature and volume frac-tion of nanoparticles on the thermal expansion coefficient of Al2O3–water nanofluid was investigated by Ho et al. [38]. Khanafer and Vafai [39] developed a correlation for the thermal expansion coefficient of Al2O3–water nanofluid was developed based
4.25
Model II: ceff = (1 – ϕp)cf + ϕpcp
= (1 – ϕp)ρf cf + ϕpρpcpc ef
f (KJ
/kg ·
K)
Zhou and Ni [43]
3.75
3.25
2.75
2.250 0.05 0.1
ϕp
0.15 0.2 0.25
ρeffModel I: ceff
FIGURE 2.2 Comparison of the heat capacity of Al2O3–water nanofluid obtained by models I and II given in Equations 2.3 and 2.4 and the experimental data of Zhou and Ni [43]. (Reprinted from K. Khanafer and K. Vafai. 2011, A critical synthesis of thermophysical char-acteristics of nanofluids, International Journal of Heat and Mass Transfer 54, 4410–4428, Copyright 2011, with permission from Elsevier.)
31The Role of Nanoparticle Suspensions
on the experimental data of Ho et al. [38] as a function of temperature and volume fraction of nanoparticles. This correlation (Al2O3–water) can be expressed as [39]:
β φ
φ
eff p
p
= − + × − ×
≤ ≤ ≤
− −( . ..
) ;
. ,
0 479 9 3158 104 7211
10
0 0 04 10
32
3TT
o C TT ≤ 40oC (2.7)
Figure 2.3b shows the validity of the correlation given by Equation 2.7 compared with the experimental data [38].
0.24(a)
(b)
β eff ×
10–3
(K–1
)βeff = (1 – ϕp) βf + ϕpβp
(1 – ϕp) (ρβ)f + ϕp (ρβ)p
ϕp
ρeff
0.22
0.20
0.4Ho et al. [38] – 0%
Ho et al. [38] – 4%Equation 2.7
Equation 2.70.3
0.2
0.1
0.010 20
T (°C)
30 40
0.00 0.01 0.02 0.03 0.04
β eff ×
10–3
(K–1
)
βeff =
FIGURE 2.3 (a) Effect of volume fraction as displayed by Equations 2.5 and 2.6 at room temperature; (b) temperature effect as displayed by a comparison between Equation 2.7 and experimental data of Ho et al. [38]. (Reprinted from K. Khanafer and K. Vafai. 2011, A criti-cal synthesis of thermophysical characteristics of nanofluids, International Journal of Heat and Mass Transfer 54, 4410–4428, Copyright 2011, with permission from Elsevier.)

32 Nanoparticle Heat Transfer and Fluid Flow
2.2.4 effeCtive visCosity of nanofluiDs
2.2.4.1 Analytical StudiesDifferent analytical models of viscosity have been developed in the literature to model the effective viscosity of nanofluid as a function of volume fraction. Einstein [46] determined the effective viscosity of a suspension of spherical solids as a func-tion of volume fraction (volume concentration <5%) using the phenomenological hydrodynamic equations. This equation was presented as
µ φ µeff p f= +( . )1 2 5
(2.8)
Since Einstein’s model, several equations have been developed in an effort to extend Einstein’s formula to suspensions of higher concentrations, including the effect of non-spherical particle concentrations [47–51]. For example, Brinkman [47] presented a viscosity model that extended Einstein’s equation to concentrated suspensions:
µφ
φ φ µeffp
p p f=−
= + + +11
1 2 5 4 3752 5
2
( )( . . )
.�
(2.9)
The effect of Brownian motion on the effective viscosity in a suspension of rigid spherical particles was studied by Batchelor [48]. For isotropic structure of suspen-sion and based on reciprocal theorem in Stokes flow to obtain an expression for the bulk stress, the effective viscosity was given by
µ φ φ µeff p p f= + +( . . )1 2 5 6 2 2
(2.10)
Lundgren [49] proposed the following equation under the form of a Taylor series in ϕp:
µ φ µ φ φ φ µeff
pf p p p f= − = + + +1
1 2 51 2 5 6 25 2 3
.( . . ( ))O
(2.11)
It is noticeable that if the terms O( )φp2 and higher are neglected, the above
correlation reduces to that of Einstein’s model. Table 2.1 summarizes the most com-mon analytical expressions for the viscosity of nanofluids as a function of the volume fraction of the nanoparticles [39].
2.2.4.2 Experimental StudiesA number of experimental studies have been carried out in the literature to determine the dynamic viscosity of nanofluids [16,56–65]. Masuda et al. [57] were the first to measure the dynamic viscosity of several water-based nanofluids for temperatures ranging from room condition to 67°C. Wang et al. [56] obtained some data for the dynamic viscosity of Al2O3–water and Al2O3–ethylene glycol mixtures at various temperatures.

33Th
e Ro
le of N
ano
particle Su
spen
sion
s
TABLE 2.1Summary of Significant Number of Models Found in the Literature
Models Effective Viscosity Physical Model Remarks
Einstein [46] µ φ µeff 1= +( . )2 5 p fBased on the phenomenological hydrodynamic equations
Considered a suspension containing n solute particles in a total volume V
Infinitely dilute suspension of spheres (no interaction between the spheres)
Valid for relatively low particle volume fraction (ϕp ≤ 2%)
Brinkman [47]µ
φ
φ φ µ
effp
p p f
=−
= + + +
11
1 2 5 4 375
2 5
2
( )
( . . ...)
.
Based on Einstein modelDerived by considering the effect of the addition of one solute molecule to an existing solution
Spherical particlesValid for high-moderate particle concentrations
Used Einstein’s factor: (1 + 2.5ϕp)
Batchelor [48] µ ηφ φ µ
φ φ µeff p p f
p p f
= + +
= + +
( )
( . . )
1
1 2 5 6 2
2
2
kHBased on reciprocal theorem in Stokes flow problem to obtain an expression for the bulk stress due to the thermodynamic forces
Incorporated both effects: hydrodynamic effects and Brownian motion
Rigid and spherical particlesBrownian motionIsotropic structureHuggins coefficient: kH = 6.2 (5.2 from hydrodynamic effects and 1.0 from Brownian motion)
Lundgren [49]µ φ µ
φ φ µ
effp
f
p p f
= −
= + + +
11 2 5
1 2 5 6 25 2
.
( . . ...)
Based on a Taylor series expansion in terms of ϕp
Dilute concentration of spheresRandom bed of spheres
Graham [50] µ φ µ
µ
eff p f
p p pf/ / /
= +
++ +
( . )
.( )( )( )
1 2 5
4 52 1 2h r h r h r
A cell theory was used to derive the dependence of the zero-shear-rate viscosity on volume concentration for a suspension of uniform, solid, neutrally buoyant spheres
Agrees well with Einstein’s for small ϕp
rp is the particle radius and h is the inter-particle spacing
continued

34N
ano
particle H
eat Transfer an
d Flu
id Flo
w
TABLE 2.1 (continued)Summary of Significant Number of Models Found in the Literature
Models Effective Viscosity Physical Model Remarks
Simha [51]µ φ φ φ µeff p
pf= + +
+
1 2 5125
642. ...
maxp
Based on Cage model of liquids and solutions Spherical particles
Mooney [52]µ
φφ µ
φ φ
effp
pf
p p
= −
= + + + +
exp.
. . ( . ) ...
2 51
1 2 5 3 125 2 5 2
k
k{{ }< <
µf
1 35 1 91. .k
Einstein’s viscosity equation for an infinitely dilute suspension of spheres was extended to apply to a suspension of finite concentration
Based on first-order interaction between particles (crowding effect)
Rigid spherical spheresMonodisperse suspension of finite concentration
Not valid at high concentrations.Considered the volume fraction of a suspension to be divided into two portions
Eilers [53]µ µ
φφ
φ φ µ
eff fp
p
p p f
/= + −
= + + +
11 25
1 0 78
1 2 5 4 75 2
..
( . . ...)
Based on experimental data Suspensions of bitumen spheresCurve fitting of the experimental data
Saito [55]µ φ φ µ
φ φ µ
effp
p f
p p f
= + −
= + + +
12 5
1
1 2 5 2 5 2
.
( . . ...)
Developed based on a theory for spherical solute-molecules in which a single solute-molecule is placed in the field of flow, obtained by averaging over all the possible positions of a second solute-molecule
Spherical rigid particlesBrownian motionVery small particles
Frankel and Acrivos [55]µ
φ φφ φ
µeffp p
p pf
/
/=
−
98 1
1 3
1 3
( )
( )max
/
max/
An asymptotic technique was used to derive the functional dependence of effective viscosity on concentration for a suspension of uniform solid spheres, in the limit as concentration approaches its maximum value
Uniform solid particles
Source: Reprinted from K. Khanafer and K. Vafai. 2011, A critical synthesis of thermophysical characteristics of nanofluids, International Journal of Heat and Mass Transfer 54, 4410–4428, Copyright 2011, with permission from Elsevier.

35The Role of Nanoparticle Suspensions
Because the formulas such as the one proposed by Einstein [46] and later improved by Brinkman [47] and Batchelor [48] underestimate the viscosity of the nanofluids when compared with the measured data, Maiga et al. [58,59] performed a least-square curve fitting of some experimental data of Wang et al. [56] including Al2O3 in water and Al2O3 in ethylene glycol. Table 2.2 demonstrates a summary of various dynamic viscosity models at room temperature based on the experimental data.
TABLE 2.2Summary of Viscosity Models at Room Temperature Based on Experimental Data
Models Effective Viscosity (Regression) Remarks
Maiga et al. [58]µ φ φ µeff p p f= + +( )1 7 3 123 2.
Least-square curve fitting of Wang et al. [56] data
Al2O3–water, dp = 28 nm
Maiga et al. [58] µ φ φ µeff p p f
p nm
= − +( )=
1 0 19 306
28
2.
d
Least-square curve fitting of experimental data [56,57]
Al2O3–ethylene glycol
Khanafer and Vafai [39]
µ φ φ µeff p p f
p nm
= + +( )=
1 0 164 302 34
28
2. .
d
Least-square curve fitting of experimental data [55,57]
Al2O3–ethylene glycol
Buongiorno [66]µ φ φ µeff p p f= + +( )1 39 11 533 9 2. .
Curve fitting of Pak and Cho [16] data
Al2O3–water, dp = 13 nm
Buongiorno [66]µ φ φ µeff p p f= + +( )1 5 45 108 2 2. .
Curve fitting of Pak and Cho [16] data
TiO2–water, dp = 27 nm
Khanafer and Vafai [39]
µ φ φ µ
φeff p p f
p
= + +( )≤ ≤
1 23 09 1525 3
0 0 04
2. .
.
Curve fitting of Pak and Cho [16] data
Al2O3–water, dp = 13 nm
Khanafer and Vafai [39]
µ φ φ µ
φeff p p f
p
= + +( )≤ ≤
1 3 544 169 46
0 0 1
2. .
.
Curve fitting of Pak and Cho [16] data
TiO2–water, dp = 27 nm
Nguyen et al. [61] µ µ φ
µ φ φ µ
eff f p p
eff p p f
nm= × =
= + +( )0 904 0 148 47
1 0 025 0 015 2
. . ;
. . ;
e d
dpp nm= 36
Curve fitting of the experimental data
Al2O3–water
Nguyen et al. [61]µ φ φ φ µeff p p p f= − + +( )1 475 0 319 0 051 0 0092 3. . . .
Curve fitting of the experimental data
CuO–water, dp = 29 nm
Tseng and Lin [62] μeff = 13.47 exp (35.98ϕp) μf; 0.05 ≤ ϕp ≤ 0.12 TiO2–waterShear rate = 100 s−1
Source: Reprinted from K. Khanafer and K. Vafai. 2011, A critical synthesis of thermophysical charac-teristics of nanofluids, International Journal of Heat and Mass Transfer 54, 4410–4428, Copyright 2011, with permission from Elsevier.

36 Nanoparticle Heat Transfer and Fluid Flow
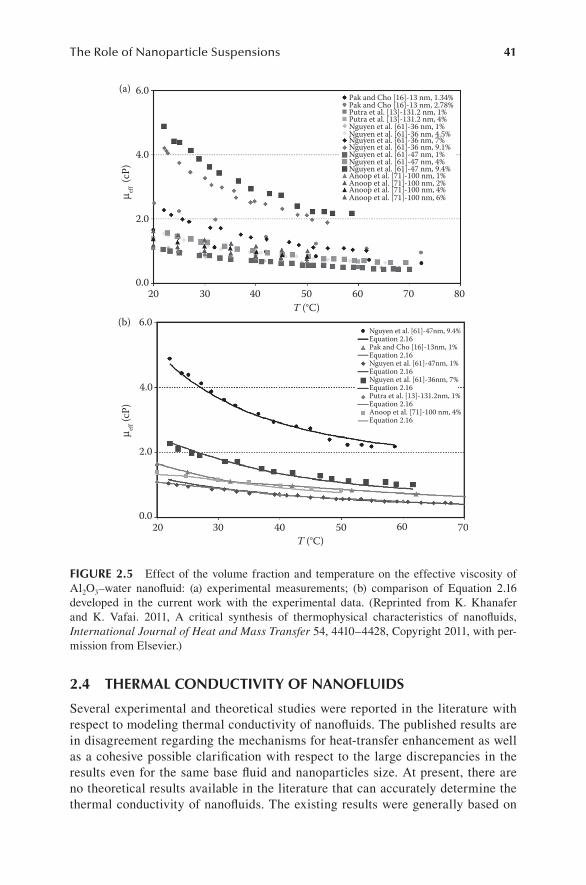
Moreover, Figure 2.4 shows a comparison of the relative dynamic viscosity of Al2O3–water nanofluid from various research studies in the literature at room tem-perature. Figure 2.4 shows that Brinkman model [47], which was derived for two-phase mixture, is to some extent sufficient to estimate the viscosity for relatively low-volume fraction of particles (i.e., ϕp ≤ 2%). Although it noticeably underesti-mates the nanofluid viscosity when compared with experimental data at high par-ticle concentrations. The differences in the relative viscosity among the experimental data as shown in Figure 2.4 may be due to the difference in the size of the particle clusters, dispersion techniques, and the methods of measurements. This clearly illus-trates the discrepancy between the researchers in measuring the dynamic viscosity of nanofluids.
2.3 EFFECT OF TEMPERATURE ON THE DYNAMIC VISCOSITY OF NANOFLUIDS
It should be noted that all the above-mentioned correlations (Tables 2.1 and 2.2) were developed to relate the dynamic viscosity as a function of volume frac-tion only, without temperature-dependence considerations. Few studies were con-ducted in the literature on the effect of temperature on the dynamic viscosity of nanofluids [60,61,66–70]. Nguyen et al. [61] analyzed experimentally the effect of temperature on the dynamic viscosities of two water-based nanofluids, namely
6Brinkman [48]13 nm, Pak and Cho [16]47 nm, Nguyen et al. [62]36 nm, Nguyen et al. [62]28 nm, Wang et al. [57]29 nm, Kulkarni et al. [64]80 nm, Murshed et al. [66]95 nm, Anoop et al. [67]100 nm, Anoop et al. [67]28 nm, Chen et al. [67]36 nm, Chen et al. [67]
4
2
00 0.02 0.04 0.06 0.08
ϕp
μ eff
μ f
0.1 0.12 0.14
FIGURE 2.4 Relative viscosity measurement as a function of the volume fraction, ϕp, at ambient temperature (Al2O3–water nanofluid). (Reprinted from K. Khanafer and K. Vafai. 2011, A critical synthesis of thermophysical characteristics of nanofluids, International Journal of Heat and Mass Transfer 54, 4410–4428, Copyright 2011, with permission from Elsevier.)

37The Role of Nanoparticle Suspensions
Al2O3–water (dp = 47 nm, 36 nm) and CuO–water (dp = 29 nm) mixtures. The following correlations were developed by Nguyen et al. [61] for estimating the dynamic viscosity for all nanofluids tested at particle concentrations of 1% and 4%, respectively:
µ µ φeff f p( ) ( . . ) ; %cP T= − × =1 125 0 0007 1
(2.12)
µ µ φeff f p( ) ( . . . ) ; %cP T T= − × + × =2 1275 0 0215 0 0002 42
(2.13)
where T is the temperature in °C. It can be noticed from Equations 2.12 and 2.13 that Nguyen et al. [61] did not explicitly express the dynamic viscosity as a func-tion of temperature and volume fraction. Palm et al. [67] proposed equations for the dynamic viscosity (Pa. s) by means of the polynomial curve fitting based on the data reported by Putra et al. [13]. The resulting equations as a function of temperature, expressed in Kelvin, for Al2O3–water are:
µ φeff p= − × + × =− −0 034 2 10 2 9 10 14 7 2. . , %T T
(2.14)
µ φeff p= − × + × =− −0 039 2 3 10 3 4 10 44 7 2. . . , %T T
(2.15)
Tables 2.3 and 2.4 present a summary of different models of the dynamic vis-cosity of nanofluids as a function of temperature and volume fraction of nanopar-ticles. Khanafer and Vafai [39] developed a general correlation (Equation 2.16) for the effective viscosity of Al2O3–water using various experimental data found in the literature (Figure 2.5a) as a function of volume fraction, nanoparticles diameter, and temperature as follows:
µ φ φφ
eff p pp( ) .
.. . .
.
cPT T
= − + + − +
+
0 449128 837
0 574 0 1634 23 053
0 0
22
2
1132 2354 735 23 498 3 0185
1 9 20
33
2
2
3
2φ
φ φ φ
φ
pp p
p
p
p
p
d− + −
≤ ≤
. . . ;
% %,
T d
≤≤ ≤ ≤ ≤T ( ) ,�C 70 13 131nm nmpd
(2.16)
The validity of the above correlation (Equation 2.16) is shown in Figure 2.5b. As can be noticed in Figure 2.5a, the viscosity of the nanofluid decreases with an increase in the temperature. Moreover, there is no agreement between researchers about the experimentally measured values of the nanofluid’s viscosity. Published results indicate a surprising range of variation of the results.
38N
ano
particle H
eat Transfer an
d Flu
id Flo
wTABLE 2.3Effect of Temperature and Volume Fraction on the Dynamic Viscosity of Nanofluids (Al2O3–Water)Reference Model (Regression) RemarksKhanafer and Vafai [39]
µ φ φφ φ
eff p pp p
C
= − + + −
≤
0 444 0 254 0 0368 26 333 59 311
20
22
2. . . . .
( )T T
T ° ≤≤ =70 1 34 2 78; . %, . %φp
Curve fitting of Pak and Cho [16] datadp = 13 nmUnits: mPa.s
Palm et al. [67] µ φ
µeff p
eff
= − × + × =
= − ×
− −0 034 2 10 2 9 10 1
0 039 2 3 10
4 7 2. ( ) . ( ), %
. .
T TK K−− −+ × =4 7 23 4 10 4T T( ) . ( ), %K K φp
Curve fitting of the experimental data, Putra et al. [13]
dp = 131.2 nmUnits: Pa.s
Nguyen et al. [61] µ µ φ
µeff f p
eff
C
C
= − × =
= − ×
( . . ( )) ; %
( . . (
1 125 0 0007 1
2 1275 0 0215
T
T
°
° )) . ( )) ; %+ × =0 0002 42T °C f pµ φ
Units: mPa.s
Khanafer and Vafai [39]µ φ φ
φeff p p= − + + + − +0 4892
26 90360 6837
24 11410 1785 0 18182
2..
..
. .T T
pp p
pp
p
T T
TT
+
+ − ≤ ≤ ≤
27 015
0 0132 2940 1775 1 9 4 20
2
2
33
.
. . ; % . %, (
φ
φφ
φ °C)) ≤ 70
Curve fitting of Nguyen et al. [61] datadp = 47 nmUnits: mPa.s
Khanafer and Vafai [39]µ ϕ ϕeff p p= − + + + − +0 1011
18 01620 3619
164 08370 0966 0 16092
2..
..
. .T T
φφ φ
ϕφ
φ
p p
pp
p
T T
T
+
+ − ≤ ≤
22 4901
0 0078089 2316 3754 1 9 1 20
2
2
33
.
. . ; % . %, ≤≤ ≤T ( )°C 70
Curve fitting of Nguyen et al. [61] datadp = 36 nmUnits: mPa.s
Khanafer and Vafai [39]µ φ φ
φφeff p p
p= − + + − + +0 449128 837
0 574 0 1634 23 053 0 013222
2..
. . . .T T pp
p
p
p
p
pp
33
2
2
3
2
2354 735
23 498 3 0185 1 9 20
−
+ − ≤ ≤ ≤
.
. . ; % %, (
φ
φ φφ
T
Td d
°CC nm nmp) ,≤ ≤ ≤70 13 131d
Curve fitting of various experimental data available in the literature [13,16,61,71]
Units: mPa.s
Namburu et al. [69,60] Log in mmPa.seffBT
p p p
( ) ,
. . .
µφ φ φ
== − + − +
−Ae
A 0 29956 6 7388 55 444 23 2 336 11
6 4745 140 03 1478 5 20341 103 2 6
.
( . . . ) /B = − + − +φ φ φp p p
ExperimentalAl2O3–ethylene glycol and water mixture1% ≤ ϕp ≤ 10%, dp = 53 nm 238 < T < 323 K
Source: Reprinted from K. Khanafer and K. Vafai. 2011, A critical synthesis of thermophysical characteristics of nanofluids, International Journal of Heat and Mass Transfer 54, 4410–4428, Copyright 2011, with permission from Elsevier.

39Th
e Ro
le of N
ano
particle Su
spen
sion
s
TABLE 2.4Effect of Temperature and Volume Fraction on the Dynamic Viscosity of Nanofluids (TiO2–Water, CuO–Water)
Models Effective Viscosity (Regression) Remarks
Duangthongsuk and Wongwises [68]
µµ φ φ
µµ
eff
fp p
2
eff
f
1.0226 0.0477 0.0112 ; 15 C
1.013 0.092
= + =
= +
− °T
φφ φ
µµ φ φ
p p2
eff
fp p
2
0.015 ; 25 C
1.018 0.112 0.0177 ; 35 C
− °
°
T
T
=
= + − =
Experimental dataTiO2–Water, 0.2 ≤ ϕp ≤ 2%dp = 21 nm
Khanafer and Vafai [39] µµ φ φeff
fp
3p
5 2=1.0538 + 0.1448 3.363 10 0.0147 6.735 10− × − + ×− −T T −−
° °
1.337
15 C 35 C,0.2% 2%
p
p
φ
φT
T≤ ≤ ≤ ≤
Curve fitting of the experimental data [68]TiO2–waterdp = 21 nm
Khanafer and Vafai [39]µ φ φ
φ φeff p p
p p= − + + − +0 6002 0 569 0 0823 28 8763 204 2202 56122
2. . . . .T T
..
( ) ; . %, . %, . %
3175
20 70 0 99 2 04 3 16
3
3
φ
φ
p
pC T
T≤ ≤ =°
Curve fitting of Pak and Cho [16] dataTiO2–waterdp = 27 nmUnits: mmPa.s
Khanafer and Vafai [39]µ φ φ
φeff p p
p= − + + + − −0 42628 4312
0 898524 7147
0 2217 4 732922.
..
.. .
T T TT T
TT
+
+ − ≤ ≤ ≤
70 3105
0 0176 5559 4641 1 9 20
2
2
33
.
. . ; % %, ( )
φ
φφ
φ
p
pp
p C° ≤≤ 70
Curve fitting of Nguyen et al. [59] dataCuO–waterdp = 29 nmUnits: mmPs.s
Namburu et al. [60] Log effBT
p p
( ) , .
. . .
µφ φ
== − +
= ×
−
−
Ae
A
B
inmm Pa s
1 8375 29 643 165 56
4 10
2
66 2 0 001 0 0186φ φp p− +. .
CuO–ethylene glycol and water mixture1 ≤ ϕp ≤ 6%, dp = 29 nm238 < T < 323 K
continued
40N
ano
particle H
eat Transfer an
d Flu
id Flo
w
TABLE 2.4 (continued)Effect of Temperature and Volume Fraction on the Dynamic Viscosity of Nanofluids (TiO2–Water, CuO–Water)
Models Effective Viscosity (Regression) Remarks
Kulkarni et al. [63,64]ln µeff =
−AT
B1
, in mm Pa.s
A
B
= + +
= − + +
20587 15857 1078 3
107 12 53 54 2 8715
2
2
φ φ
φ φp p
p p
.
. . .
CuO–water.0.05 ≤ ϕp ≤ 0.15dp = 29 nm.278 ≤ T ≤ 323 KShear rate = 100 1/s
Koo and Kleinstreuer [70] µ µ µ
µ βρ φ κρ ϕ
φ
eff static Brownian
Brownian f pp p
p
= +
= ×5 104 Td
f T
f
( , )
( pp p
p
, ) ( . . ) ( . . )
. ( ) .
T T= − + + −
=−
6 04 0 4705 1722 3 134 63
0 0137 100 0
φ φ
βφ 88229
0 7272
0 01
0 0011 100 0 01
1 4 30
, .
. ( ) , .
% %,
.
φ
φ φ
φ
p
p p
p
<
>
< <
−
00 325< <T K
CuO–water
Source: Reprinted from K. Khanafer and K. Vafai. 2011, A critical synthesis of thermophysical characteristics of nanofluids, International Journal of Heat and Mass Transfer 54, 4410–4428, Copyright 2011, with permission from Elsevier.
41The Role of Nanoparticle Suspensions
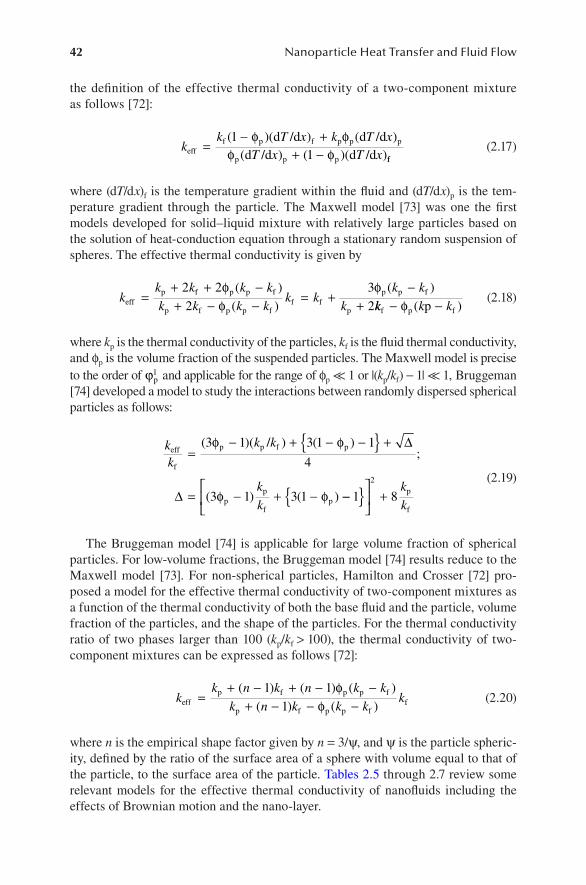
2.4 THERMAL CONDUCTIVITY OF NANOFLUIDS
Several experimental and theoretical studies were reported in the literature with respect to modeling thermal conductivity of nanofluids. The published results are in disagreement regarding the mechanisms for heat-transfer enhancement as well as a cohesive possible clarification with respect to the large discrepancies in the results even for the same base fluid and nanoparticles size. At present, there are no theoretical results available in the literature that can accurately determine the thermal conductivity of nanofluids. The existing results were generally based on
6.0(a)
(b)
Pak and Cho [16]-13 nm, 1.34%Pak and Cho [16]-13 nm, 2.78%Putra et al. [13]-131.2 nm, 1%Putra et al. [13]-131.2 nm, 4%Nguyen et al. [61]-36 nm, 1%Nguyen et al. [61]-36 nm, 4.5%Nguyen et al. [61]-36 nm, 7%Nguyen et al. [61]-36 nm, 9.1%Nguyen et al. [61]-47 nm, 1%Nguyen et al. [61]-47 nm, 4%Nguyen et al. [61]-47 nm, 9.4%Anoop et al. [71]-100 nm, 1%Anoop et al. [71]-100 nm, 2%Anoop et al. [71]-100 nm, 4%Anoop et al. [71]-100 nm, 6%
Nguyen et al. [61]-47nm, 9.4%
Nguyen et al. [61]-47nm, 1%
Nguyen et al. [61]-36nm, 7%
Equation 2.16
Equation 2.16
Equation 2.16
Equation 2.16
Equation 2.16Anoop et al. [71]-100 nm, 4%
Putra et al. [13]-131.2nm, 1%
Equation 2.16Pak and Cho [16]-13nm, 1%
4.0
μ eff (c
P)μ ef
f (cP)
2.0
0.0
6.0
4.0
2.0
0.0
20 30 40 50T (°C)
60 70 80
20 30 40 50T (°C)
60 70
FIGURE 2.5 Effect of the volume fraction and temperature on the effective viscosity of Al2O3–water nanofluid: (a) experimental measurements; (b) comparison of Equation 2.16 developed in the current work with the experimental data. (Reprinted from K. Khanafer and K. Vafai. 2011, A critical synthesis of thermophysical characteristics of nanofluids, International Journal of Heat and Mass Transfer 54, 4410–4428, Copyright 2011, with per-mission from Elsevier.)
42 Nanoparticle Heat Transfer and Fluid Flow
the definition of the effective thermal conductivity of a two-component mixture as follows [72]:
k
k T x k T xT x T xeff
f p f p p p
p p p
d /d d /dd /d d /d
=− +
+ −( )( ) ( )
( ) ( )( )1
1φ φ
φ φ ff (2.17)
where (dT/dx)f is the temperature gradient within the fluid and (dT/dx)p is the tem-perature gradient through the particle. The Maxwell model [73] was one the first models developed for solid–liquid mixture with relatively large particles based on the solution of heat-conduction equation through a stationary random suspension of spheres. The effective thermal conductivity is given by
k
k k k k
k k k kk k
k k
keffp f p p f
p f p p ff f
p p f
p
=+ + −+ − − = +
−+
2 2
2
3
2
φφ
φ( )
( )
( )
kk k kf p fp− −φ ( ) (2.18)
where kp is the thermal conductivity of the particles, kf is the fluid thermal conductivity, and ϕp is the volume fraction of the suspended particles. The Maxwell model is precise to the order of ϕp
1 and applicable for the range of ϕp ≪ 1 or |(kp/kf) − 1| ≪ 1, Bruggeman [74] developed a model to study the interactions between randomly dispersed spherical particles as follows:
kk
k k
k
k
eff
f
p p f p
pp
fp
/=
− + − −{ } +
= − + −
( )( ) ( );
( ) ( )
3 1 3 1 1
4
3 1 3 1
φ φ
φ φ
∆
∆ −−{ }
+1 8
2k
kp
f
(2.19)
The Bruggeman model [74] is applicable for large volume fraction of spherical particles. For low-volume fractions, the Bruggeman model [74] results reduce to the Maxwell model [73]. For non-spherical particles, Hamilton and Crosser [72] pro-posed a model for the effective thermal conductivity of two-component mixtures as a function of the thermal conductivity of both the base fluid and the particle, volume fraction of the particles, and the shape of the particles. For the thermal conductivity ratio of two phases larger than 100 (kp/kf > 100), the thermal conductivity of two-component mixtures can be expressed as follows [72]:
k
k n k n k k
k n k k kkeff
p f p p f
p f p p ff=
+ − + − −+ − − −
( ) ( ) ( )
( ) ( )
1 1
1
φφ
(2.20)
where n is the empirical shape factor given by n = 3/ψ, and ψ is the particle spheric-ity, defined by the ratio of the surface area of a sphere with volume equal to that of the particle, to the surface area of the particle. Tables 2.5 through 2.7 review some relevant models for the effective thermal conductivity of nanofluids including the effects of Brownian motion and the nano-layer.
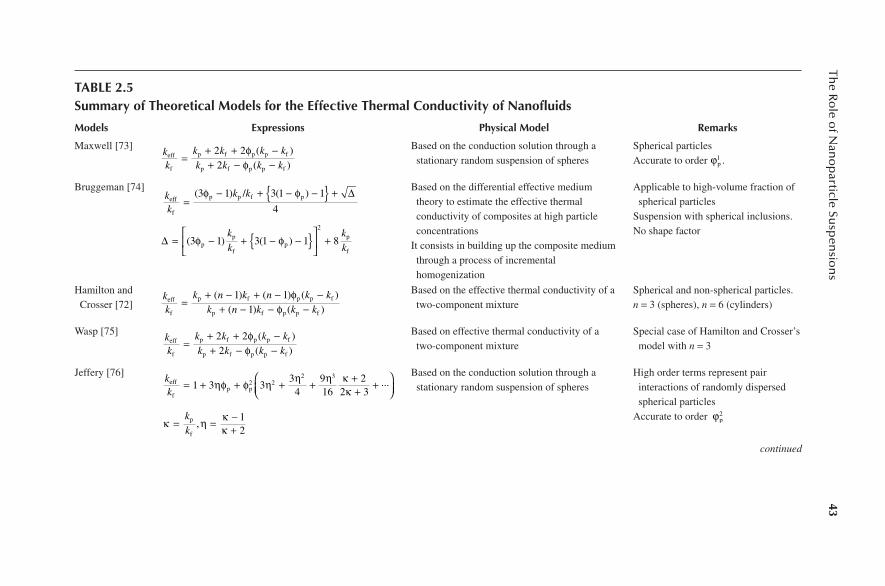
43Th
e Ro
le of N
ano
particle Su
spen
sion
s
TABLE 2.5Summary of Theoretical Models for the Effective Thermal Conductivity of Nanofluids
Models Expressions Physical Model Remarks
Maxwell [73]kk
k k k kk k k k
eff
f
p f p p f
p f p p f=
+ + −+ − −
2 22
φφ
( )( )
Based on the conduction solution through a stationary random suspension of spheres
Spherical particlesAccurate to order ϕp
1 .
Bruggeman [74]kk
k keff
f
p p f p/=
− + − −{ } +( ) ( )3 1 3 1 1
4
φ φ ∆
∆ = − + − −{ }
+( ) ( )3 1 3 1 1 8
2
φ φpp
fp
p
f
kk
kk
Based on the differential effective medium theory to estimate the effective thermal conductivity of composites at high particle concentrations
It consists in building up the composite medium through a process of incremental homogenization
Applicable to high-volume fraction of spherical particles
Suspension with spherical inclusions.No shape factor
Hamilton and Crosser [72]
kk
k n k n k kk n k k k
eff
f
p f p p f
p f p p f=
+ − + − −+ − − −
( ) ( ) ( )( ) ( )
1 11
φφ
Based on the effective thermal conductivity of a two-component mixture
Spherical and non-spherical particles.n = 3 (spheres), n = 6 (cylinders)
Wasp [75]kk
k k k kk k k k
eff
f
p f p p f
p f p p f=
+ + −+ − −
2 22
φφ
( )( )
Based on effective thermal conductivity of a two-component mixture
Special case of Hamilton and Crosser’s model with n = 3
Jeffery [76]kkeff
fp p= + + + + +
+ +
1 3 33
4916
22 3
2 22 3
ηφ φ η η η κκ
...
κ η κκ= = −
+kk
p
f,
12
Based on the conduction solution through a stationary random suspension of spheres
High order terms represent pair interactions of randomly dispersed spherical particles
Accurate to order ϕp2
continued
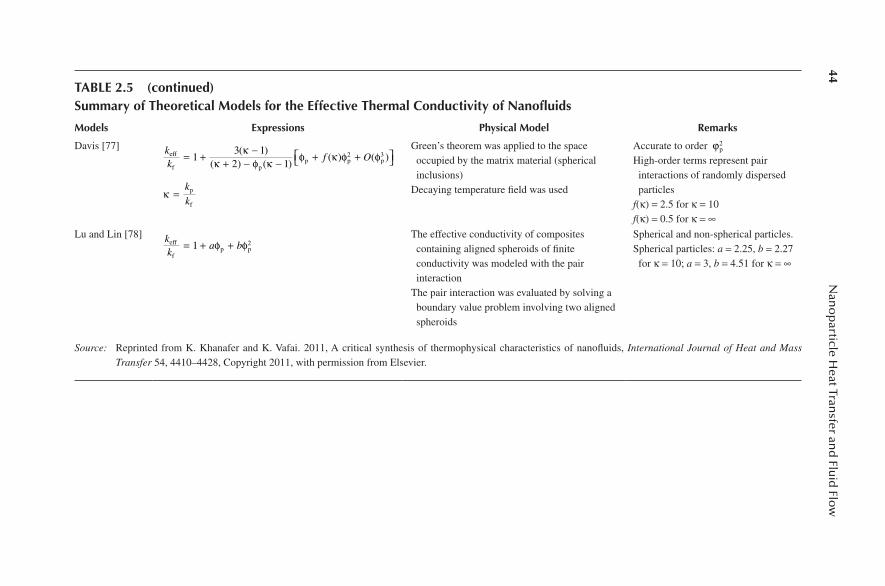
44N
ano
particle H
eat Transfer an
d Flu
id Flo
w
TABLE 2.5 (continued)Summary of Theoretical Models for the Effective Thermal Conductivity of Nanofluids
Models Expressions Physical Model Remarks
Davis [77] kk
f Oeff
f pp p p= + −
+ − − + + 13 12 1
2 3( )( ) ( )
( ) ( )κ
κ φ κ φ κ φ φ
κ =kk
p
f
Green’s theorem was applied to the space occupied by the matrix material (spherical inclusions)
Decaying temperature field was used
Accurate to order ϕp2
High-order terms represent pair interactions of randomly dispersed particles
f(κ) = 2.5 for κ = 10 f(κ) = 0.5 for κ = ∞
Lu and Lin [78] kk
a beff
fp p= + +1 2φ φ
The effective conductivity of composites containing aligned spheroids of finite conductivity was modeled with the pair interaction
The pair interaction was evaluated by solving a boundary value problem involving two aligned spheroids
Spherical and non-spherical particles.Spherical particles: a = 2.25, b = 2.27 for κ = 10; a = 3, b = 4.51 for κ = ∞
Source: Reprinted from K. Khanafer and K. Vafai. 2011, A critical synthesis of thermophysical characteristics of nanofluids, International Journal of Heat and Mass Transfer 54, 4410–4428, Copyright 2011, with permission from Elsevier.

45Th
e Ro
le of N
ano
particle Su
spen
sion
s
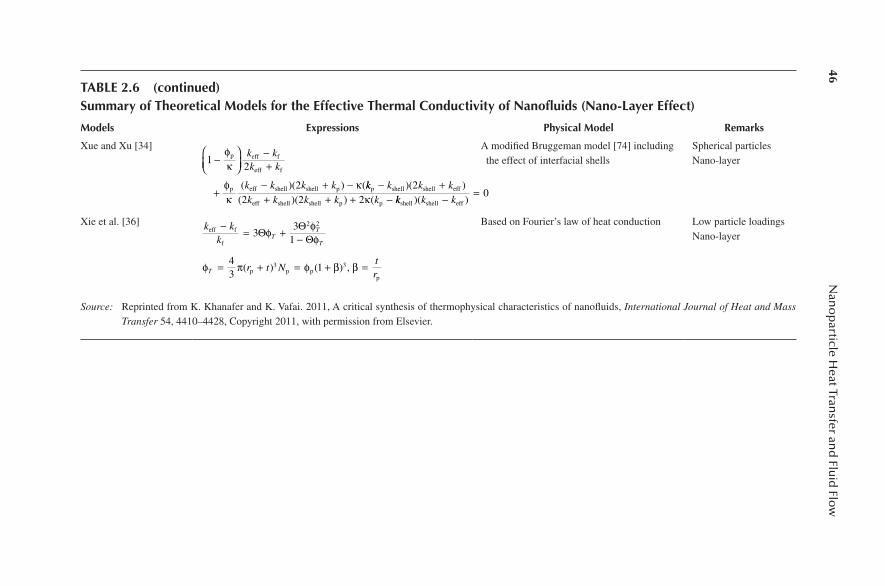
TABLE 2.6Summary of Theoretical Models for the Effective Thermal Conductivity of Nanofluids (Nano-Layer Effect)
Models Expressions Physical Model Remarks
Yu and Choi [32]k
k k k k
k k k kkeff
f p f
f p ff=
+ + − ++ − − +
pe pe
pe pe
2 2 1
2 1
3
3
φ βφ β
( )( )
( )( )
k kpe = − + + +− − + + +
2 1 1 1 21 1 1 2
3
3
( ) ( ) ( )( ) ( ) ( )
γ β γ γγ β γ p
β = t/rp and γ = klayer/kp
Modified Maxwell model [73] Spherical particlesNano-layer
Yu and Choi [33]k
nf Af A
ke
eeff f= + −
11
Ak k
k n kj
jj a b c
=−
+ −=∑1
3 1( )
( ), ,
p f
p f
ff a t b t c t
e =+ + +( )( )( )2 2 2
abc
Modified Hamilton–Crosser model [72] Nonspherical particles.Nano-layer
Xue [35]9 1
2 2−
−+ +
−+ −
φλ
φλ
p eff f
eff f
p eff
eff ef
k kk k
k kk B k k
c x
x c x
,
, ,( ff
p eff
eff eff
)
( )( ),
, ,+
−+ − − =
φλ 4
2 10
2
k kk B k k
c y
x c y
Based on the Maxwell model and the average polarization theory and on the assumption that there is an interfacial shell between the nanoparticles and the base fluid
Spherical particlesNano-layer
continued
46N
ano
particle H
eat Transfer an
d Flu
id Flo
w
TABLE 2.6 (continued)Summary of Theoretical Models for the Effective Thermal Conductivity of Nanofluids (Nano-Layer Effect)
Models Expressions Physical Model Remarks
Xue and Xu [34]1
2
2
−
−+
+− + −
φκ
φκ
κ
p eff f
eff f
p eff shell shell p
k kk k
k k k k( )( ) (kk k k kk k k k k
p shell shell eff
eff shell shell p p
− ++ + + −
)( )( )( ) (
22 2 2κ kk k kshell shell eff)( )− = 0
A modified Bruggeman model [74] including the effect of interfacial shells
Spherical particlesNano-layer
Xie et al. [36] k kk T
T
T
eff f
f
− = + −3Θ ΘΘφ φ
φ3
1
2 2
φ π φ β βT r t Ntr
= + = + =43
13 3( ) ( )p p pp
,
Based on Fourier’s law of heat conduction Low particle loadingsNano-layer
Source: Reprinted from K. Khanafer and K. Vafai. 2011, A critical synthesis of thermophysical characteristics of nanofluids, International Journal of Heat and Mass Transfer 54, 4410–4428, Copyright 2011, with permission from Elsevier.

47Th
e Ro
le of N
ano
particle Su
spen
sion
s
TABLE 2.7Summary of Theoretical Models for the Effective Thermal Conductivity of Nanofluids (Brownian Effect)
Models Expressions Physical Model Remarks
Wang et al. [19]
kk
k r n r k r k r
k
cl cleff
f
p p f
p p f
/ d=
− + +
− +
∞
∫( ) ( ( ) ( ) ( ) )
( ) (
1 3 2
1 3
0
φ φ
φ φ (( ) ( ) ( ) )r n r k r k rcl/ df+∞
∫ 20
Based on the effective medium approximation and the fractal theory for predicting the thermal conductivity of nanofluids
Accounts for the size effect and the surface adsorption of nanoparticles
Xuan et al. [79] kk
k k k kk k k k
ck
k Tr
B
c
eff
f
p f p f p
p f p f p
p p p
f
=+ − −+ + −
+
2 22
2 3
φφ
ρ φπ µ
( )( )
Based on Maxwell modelThe theory of Brownian motion and the diffusion-limited aggregation model are applied to simulate random motion and the aggregation process of the nanoparticles
Includes the effect of random motion, particle size, concentration, and temperature
Jang and Choi [10]k k k C
dd
keff f p p pf
pf pp
= − + +( ) Re Pr1 3 2φ φ φd
A theoretical model was developed based on kinetics, Kapitza resistance, and convection
A general expression for the thermal conductivity of nanofluids involving four modes of energy transport in nanofluids was derived
Considered four modes of energy transport: collision between fluid molecules, thermal diffusion of nanoparticles, collision between nanoparticles due to Brownian motion, and thermal interactions of dynamic nanoparticles with fluid molecules
Collision of nanoparticles due to Brownian motion is neglected
Prasher et al. [80] k A
k k k kk k k k
meff p
p f p p f
p f p p f
= +
×+ + −+ − −
( Re Pr )
( )( )
.1
2 22
0 333 φ
φφ
kf
Based on Maxwell model and heat transfer in fluidized beds
Accounts for convection caused by the Brownian motion from multiple nanoparticles
continued

48N
ano
particle H
eat Transfer an
d Flu
id Flo
w
TABLE 2.7 (continued)Summary of Theoretical Models for the Effective Thermal Conductivity of Nanofluids (Brownian Effect)
Models Expressions Physical Model Remarks
Koo and Kleinstreuer [70,81]
k k k
k k k kk k k k
k
eff static Brownian
p f p p f
p f p p ff
= +
=+ + −+ − −
2 22
φφ
( )( )
++ ×5 104βφ ρ ρ φp p pp
pck T
Df TB ( , )
Based on Maxwell modelCurve fitting of the available experimental data to determine the effective conductivity due to Brownian motion
Considered surrounding liquid traveling with randomly moving nanoparticles
Chon et al. [82]kk
dd
kk
eff
fp
f
p
p
f= +
×
1 64 7 0 74
0 369 0 747
0 9955
.
Pr
.
. .
.
φ
RRe .1 2321
Pr ,
Re
=
= =
µρ αρ
µρπµ
f
f f
f p
f
f
f f
V d k Tl
Br B
3 2
Based on the curve fitting of the experimental data
Reynolds number is based on the Brownian motion velocity
Source: Reprinted from K. Khanafer and K. Vafai. 2011, A critical synthesis of thermophysical characteristics of nanofluids, International Journal of Heat and Mass Transfer 54, 4410–4428, Copyright 2011, with permission from Elsevier.
49The Role of Nanoparticle Suspensions
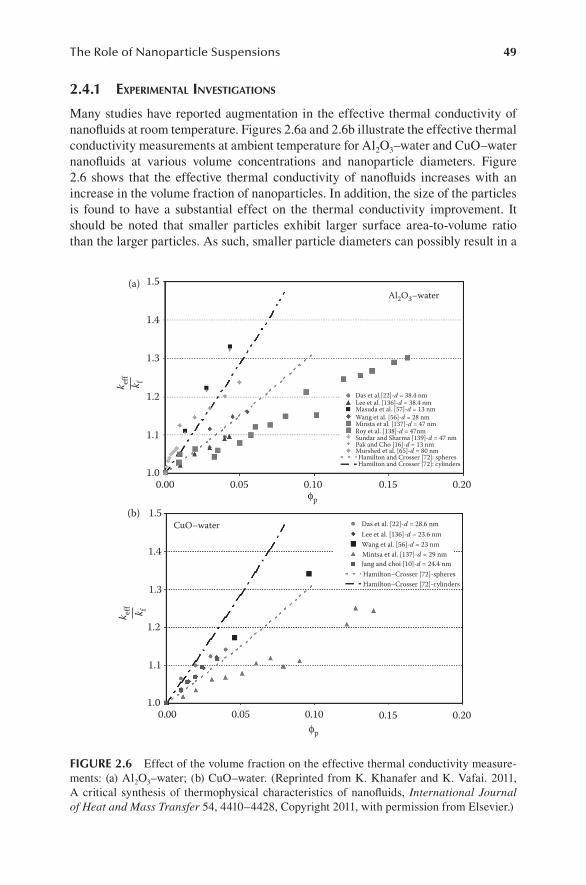
2.4.1 experimental investigations
Many studies have reported augmentation in the effective thermal conductivity of nanofluids at room temperature. Figures 2.6a and 2.6b illustrate the effective thermal conductivity measurements at ambient temperature for Al2O3–water and CuO–water nanofluids at various volume concentrations and nanoparticle diameters. Figure 2.6 shows that the effective thermal conductivity of nanofluids increases with an increase in the volume fraction of nanoparticles. In addition, the size of the particles is found to have a substantial effect on the thermal conductivity improvement. It should be noted that smaller particles exhibit larger surface area-to-volume ratio than the larger particles. As such, smaller particle diameters can possibly result in a
1.5(a)
(b)
1.4
1.3
1.2
1.1
1.0
1.5
1.4
1.3
1.2
1.1
1.00.00 0.05 0.10 0.15 0.20
0.00 0.05 0.10 0.15
Das et al.[22]-d = 38.4 nm
Al2O3–water
CuO–water
Lee et al. [136]-d = 38.4 nmMasuda et al. [57]-d = 13 nmWang et al. [56]-d = 28 nmMinsta et al. [137]-d = 47 nmRoy et al. [138]-d = 47nmSundar and Sharma [139]-d = 47 nmPak and Cho [16]-d = 13 nmMurshed et al. [65]-d = 80 nmHamilton and Crosser [72]: spheresHamilton and Crosser [72]: cylinders
Das et al. [22]-d = 28.6 nmLee et al. [136]-d = 23.6 nmWang et al. [56]-d = 23 nmMintsa et al. [137]-d = 29 nmJang and choi [10]-d = 24.4 nmHamilton–Crosser [72]-spheresHamilton–Crosser [72]-cylinders
0.20
k eff
ϕp
ϕp
k f
k eff k f
FIGURE 2.6 Effect of the volume fraction on the effective thermal conductivity measure-ments: (a) Al2O3–water; (b) CuO–water. (Reprinted from K. Khanafer and K. Vafai. 2011, A critical synthesis of thermophysical characteristics of nanofluids, International Journal of Heat and Mass Transfer 54, 4410–4428, Copyright 2011, with permission from Elsevier.)

50 Nanoparticle Heat Transfer and Fluid Flow
larger augmentation in the effective thermal conductivity of nanofluids. It is interest-ing to note from Figures 2.6a and 2.6b that the Hamilton and Crosser model [72] may represent a good approximation for the effective thermal conductivity value for smaller volume fractions (ϕp ≤ 4%).
A general correlation for the effective thermal conductivity of Al2O3–water and CuO–water nanofluids at ambient temperature accounting for various volume frac-tions and nanoparticles diameters was developed by Khanafer and Vafai [39] using various experimental data. This model was expressed as
kk d
keff
fp p
pp
p
nm= + +
−1 0 1 0112 2 437547
0 02480 613
. . .( )
..
φ φ φ
=
;
. %R2 96 5
(2.21)
where kf is the thermal conductivity of water. Figure 2.7 demonstrates that the gen-eral correlation, represented by Equation 2.21, is in good agreement with the experi-mental measurements of Al2O3–water and CuO–water nanofluids.
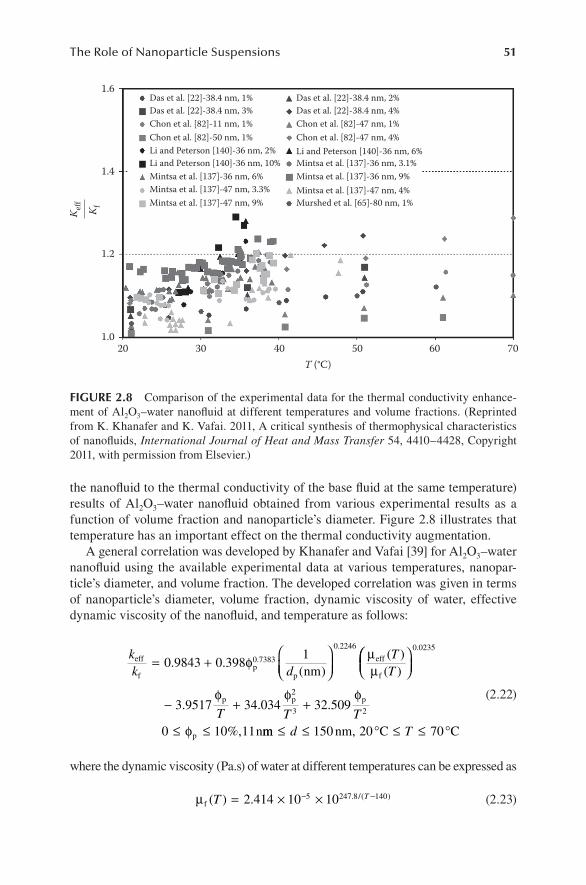
Thermal conductivity measurements at different temperatures are important because the measurements at ambient temperature are not sufficient for estimating the heat transfer characteristics of nanofluids. Figure 2.8 shows a comparison of the relative effective thermal conductivity (ratio of the effective thermal conductivity of
1.4
Eq. 2.21
Mintsa et al. [137]-CuOEquation 2.21Lee et al. [136]-Al2O3Equation 2.21
Equation 2.21Hamilton–Crosser [72]-spheres
Masuda et al. [57]-Al2O3
1.3
1.2
ϕp
k eff
k f
1.1
1.00 0.05 0.1 0.15 0.2
FIGURE 2.7 Comparison of the general correlation, Equation 2.21 developed by Khanafer and Vafai [39] with the experimental data (Al2O3–water, CuO–water) at room temperature . (Reprinted from K. Khanafer and K. Vafai. 2011, A critical synthesis of thermophysical char-acteristics of nanofluids, International Journal of Heat and Mass Transfer 54, 4410–4428, Copyright 2011, with permission from Elsevier.)
51The Role of Nanoparticle Suspensions
the nanofluid to the thermal conductivity of the base fluid at the same temperature) results of Al2O3–water nanofluid obtained from various experimental results as a function of volume fraction and nanoparticle’s diameter. Figure 2.8 illustrates that temperature has an important effect on the thermal conductivity augmentation.
A general correlation was developed by Khanafer and Vafai [39] for Al2O3–water nanofluid using the available experimental data at various temperatures, nanopar-ticle’s diameter, and volume fraction. The developed correlation was given in terms of nanoparticle’s diameter, volume fraction, dynamic viscosity of water, effective dynamic viscosity of the nanofluid, and temperature as follows:
kk d
TT
eff
fp
p
eff
fnm= +
0 9843 0 39810 7383
0 2246
. .( )
( )( )
.
.
φ µµ
− + +
≤ ≤
0 0235
2
3 23 9517 34 034 32 509
0 10 11
.
. . .
%,
φ φ φ
φ
p p p
p nT T T
mm nm, C C≤ ≤ ≤ ≤d 150 20 70° °T
(2.22)
where the dynamic viscosity (Pa.s) of water at different temperatures can be expressed as
µf ( ) . . /( )T T= × ×− −2 414 10 105 247 8 140 (2.23)
1.6Das et al. [22]-38.4 nm, 1%Das et al. [22]-38.4 nm, 3%Chon et al. [82]-11 nm, 1%Chon et al. [82]-50 nm, 1%Li and Peterson [140]-36 nm, 2%Li and Peterson [140]-36 nm, 10%Mintsa et al. [137]-36 nm, 6%Mintsa et al. [137]-47 nm, 3.3%Mintsa et al. [137]-47 nm, 9%
Das et al. [22]-38.4 nm, 2%Das et al. [22]-38.4 nm, 4%Chon et al. [82]-47 nm, 1%Chon et al. [82]-47 nm, 4%Li and Peterson [140]-36 nm, 6%Mintsa et al. [137]-36 nm, 3.1%Mintsa et al. [137]-36 nm, 9%Mintsa et al. [137]-47 nm, 4%Murshed et al. [65]-80 nm, 1%
1.4
K eff
K f
1.2
1.020 30 40 50
T (°C)60 70
FIGURE 2.8 Comparison of the experimental data for the thermal conductivity enhance-ment of Al2O3–water nanofluid at different temperatures and volume fractions. (Reprinted from K. Khanafer and K. Vafai. 2011, A critical synthesis of thermophysical characteristics of nanofluids, International Journal of Heat and Mass Transfer 54, 4410–4428, Copyright 2011, with permission from Elsevier.)

52 Nanoparticle Heat Transfer and Fluid Flow
where T in Kelvin. Figure 2.9 shows a very good agreement between the predicted relative effective thermal conductivity by Khanafer and Vafai [39] model and the experimental data.
Different models were developed in the literature for the effective thermal con-ductivity of a two-component mixture such as the Hamilton and Crosser model [72]. Although this model gave a good approximation for the effective thermal conduc-tivity of the Al2O3–water and CuO–water nanofluids for small volume fractions at room temperature, it does not exhibit a good approximation of the effective thermal conductivity at various temperatures as depicted in Figure 2.9 because this model [72] as well as a number of other models in this area do not properly account for the variations of the effective thermal conductivity with temperature. Therefore, these analytical models cannot be used to estimate the effective thermal conductivity of nanofluids at various temperatures. Instead, Equation 2.22 developed by Khanafer and Vafai [39] may be used to give a better estimation of the effective thermal conductivity of Al2O3–water nanofluids at various temperatures.
2.5 NUCLEATE POOL BOILING AND CRITICAL HEAT FLUX OF NANOFLUIDS
Boiling heat transfer plays a significant role in a variety of technological and industrial applications such as heat exchangers, microchannel-cooling applications, cooling of high-power electronics and nuclear reactors. The use of nanofluids in enhancing boil-ing heat-transfer characteristics is of great interest [83,84,42]. Several experimental
1.4Das et al. [22]-38.4 mm, 1% Equation 2.22
Equation 2.22Equation 2.22Equation 2.22Equation 2.22Equation 2.22Equation 2.22Hamilton–Crosser [72]-4%
Das et al. [22]-38.4 mm, 2%Das et al. [22]-38.4 mm, 3%Das et al. [22]-38.4 mm, 4%Chon et al. [82]-47 nm, 1%Chon et al. [82]-150 nm, 1%Chon et al. [82]-47 nm, 4%Hamilton–Crosser [72]-1%
1.2
1.020 30 40 50
T (°C)
k eff
k f
60 70
FIGURE 2.9 Comparison of the general correlation, Equation 2.22 developed by Khanafer and Vafai [39] with the experimental data (Al2O3–water) at various temperatures and volume fractions. (Reprinted from K. Khanafer and K. Vafai. 2011, A critical synthesis of thermo-physical characteristics of nanofluids, International Journal of Heat and Mass Transfer 54, 4410–4428, Copyright 2011, with permission from Elsevier.)

53The Role of Nanoparticle Suspensions
studies on the nucleate pool boiling and critical heat flux (CHF) characteristics of nanofluids have been conducted in the literature [18,85–96]. Conflicting results on the effect of nanoparticles on the nucleate boiling heat-transfer rate and CHF were reported. For example, Das et al. [21,22] conducted an experimental study on pool boiling characteristics of Al2O3–water nanofluids on smoother and roughened heat-ing surfaces for various particle concentrations. Their results show that nanopar-ticles degraded the boiling performance with increasing particle concentration. You et al. [86] found that nucleate boiling heat-transfer coefficient remained unchanged with the addition of Al2O3 nanoparticles compared with water. Bang and Chang [87] experimentally studied boiling heat transfer characteristics of nanofluids on a smooth horizontal flat surface with nanoparticles suspended in water using different volume concentrations of Al2O3 nanoparticles. Their experimental results showed that nanofluids have poor heat-transfer performance compared with pure water in natural convection and nucleate boiling. Contrary to the above results, an experi-mental investigation into the pool boiling heat transfer of aqueous based γ-alumina nanofluids (primary particle size 10–50 nm) was carried out by Wen and Ding [18]. The results showed that alumina nanofluids can significantly enhance boiling heat transfer. The enhancement was shown to increase with increasing particle concentra-tion up to approximatley 40% at a particle loading of 1.25% by weight. Ding et al. [27] showed that the boiling heat transfer was enhanced in the nucleate regime for both alumina and titania (TiO2) nanofluids, and the enhancement is more sensitive to the concentration change for TiO2 nanofluids.
Most CHF experimental studies using nanofluids have shown CHF enhancement under pool boiling conditions [86,87,91,92]. You et al. [86] investigated experimen-tally the effect of Al2O3 nanoparticles (tested concentrations of nanoparticles range from 0 to 0.05 g/L) on CHF of water in pool boiling. The measured pool boiling curves of nanofluids saturated at 60°C have demonstrated that the CHF increases dramatically (approximately 200%) compared with that of pure water. Kim et al. [91] conducted an experimental study on the CHF characteristics of nanofluids in pool boiling. Their results illustrated that the CHF of nanofluids containing TiO2 or Al2O3 were enhanced up to 100% over that of pure water. Vassallo et al. [93] experimentally demonstrated a marked increase in the CHF (up to 60%) for both nano- and micro-solutions (silica–water) at the same concentration (0.5% volume fraction) compared with the base water. Bang and Chang [87] show that CHF performance using Al2O3–water nanofluids was enhanced to 32% and 13%, respectively, for both horizontal and vertical flat surfaces in the pool. They related the enhancement in CHF to the change of surface characteristics by the deposition of nanoparticles. Milanova and Kumar [97] conducted an experimental study to measure heat transfer characteristics of silica nanofluids at different acidity and base for various ionic concentrations in a pool boiling condition. They showed that nano-silioca suspensions increased the CHF by 200% times compared to when only pure water is utilized. In addition, they reported that nanofluids in a strong electrolyte exhibit a higher CHF than in buffer solutions because of the difference in surface areas. Figure 2.10 demonstrates a comparison of CHF enhancements between experimental results for various volume concentra-tions and nanoparticle material and diameter. Table 2.8 gives a summary of research studies on nucleate pool boiling heat transfer coefficient and CHF of nanofluids.

54 Nanoparticle Heat Transfer and Fluid Flow
2.5.1 nuCleate pool Boiling Heat transfer anD CHf enHanCement meCHanisms of nanofluiDs
A number of investigations have been carried out to explore the augmentation mechanisms or deterioration of nucleate pool boiling heat-transfer coefficient using nanofluids. These mechanisms include development of nanoparticles coatings on the surface during pool boiling of nanofluids [87], decrease in active nucleation sites due to nanoparticle sedimentation on the boiling surface [103], and the wettabil-ity change of the surface [21,22]. The presented experimental results on nucleate pool boiling heat-transfer coefficient of nanofluids are in disagreement. Although the CHF enhancement results by nanofluids are consistent in the literature, the respon-sible mechanisms are not well established. For example, Golubovic et al. [101] con-cluded that the main reason behind the increase of CHF in pool boiling of nanofluids is a decrease in the static surface contact angle.
Many other studies consider the major reason for CHF augmentation is due to the surface coating effect [87,88,93,95,96,104,105]. For example, Bang and Chang [87] carried out an experimental study on boiling heat transfer characteristics of nanoflu-ids with nanoparticles suspended in water using different concentrations of alumina nanoparticles (Al2O3). The CHF performance was improved for both horizontal (32%) and vertical (13%) flat surfaces and the authors associated this augmentation to a change of surface characteristics by the deposition of nanoparticles. If this reason-ing is accepted, it might be easier to alter the boiling surface in pursuit of a greater number of nucleation sites per area rather than using nanofluids [106,107]. Anderson and Mudawar [106] demonstrated that the surfaces with microgrooves and square microstuds are highly effective in improving the nucleate boiling heat-transfer coef-ficient in Fluorinert electronic liquid (FC-72) resulting and increase in CHF values
Kim et al. [99]-TiO2-water (d = 85 nm)Bang and Change [87]-Al2O3-water (d = 47 nm)-horizontal surfaceBang and Change [87]-Al2O3-water (d = 47 nm)-vertical surfaceVassallo et al. [93]-SiO2-water (d = 3 μm)Vassallo et al. [93]-SiO2-water (d = 15 nm)Vassallo et al. [93]-SiO2-water (d = 50 nm)Dinh et al. [141]-Al2O3-waterHedge et al. [104]-Al2O3-water (d = 20 nm)
1.E-05 1.E-04 1.E-03 1.E-02Volume concentration (%)
1.E-01 1.E+00 1.E+011.0
1.5
2.0 CH
F/C
HF_
wat
er
2.5
3.0
3.5
4.0
FIGURE 2.10 Comparison of CHF enhancements between experimental results for various volume concentrations, nanoparticles materials, and nanoparticles diameter.

55The Role of Nanoparticle Suspensions
by up to 2.5 times compared with a smooth surface. Honda et al. [108] and Wei et al. [109] illustrated that CHF values for the nano-roughened surface and micro-pin-finned surfaces were, respectively, 1.8 to 2.2 and 2.3 times those for a smooth silicon surface. Ujereh et al. [110] conducted experiments to evaluate the impact of coating silicon and copper substrates with nanotubes on pool boiling characteristics. Fully coating the substrate surface with carbon nanotubes was found to be highly effective at reducing the incipience superheat and significantly enhancing both the nucleate boiling heat-transfer coefficient and CHF.
More robust physical models are necessary to elucidate the influence of nanofluids on nucleate pool boiling and CHF. Detailed understanding of the thermophysical properties of nanofluids, coating of nanoparticles, and structure of the boiling
TABLE 2.8Summary of Research Studies on Nucleate Pool Boiling Heat Transfer Coefficient (BHT) and CHF of Nanofluids
Reference Nanofluids Remarks
Das et al. [21,22] Al2O3–water BHT degradation
Chopkar et al. [98] ZrO2–water BHT enhancement at low-volume fraction of nanoparticles (<0.07%)
BHT degradation (>0.07%)
You et al. [86] Al2O3–water No change in BHT coefficientCHF enhancement up to 200%
Bang and Chang [87] Al2O3–water BHT degradationCHF enhancement up to 32%
Wen and Ding [89] γ-Al2O3–water BHT enhancement up to 40%
Liu et al. [90] Carbon nanotube, deionized water
Both BHT and CHF enhancementDecrease in pressure, increase in BHT and CHF enhancement
Ding et al. [27] Al2O3–waterTiO2–water
BHT enhancement for both TiO2 and Al2O3
Kim et al. [91] TiO2–waterAl2O3–water
CHF enhancement up to 100%
Kim et al. [99] TiO2–water CHF enhancement up to 200%
Vassallo et al. [93] SiO2–water No change in BHT coefficientCHF enhancement up to 60%
Milanova and Kumar [97] SiO2–water (also in salt and strong electrolyte solution)
CHF enhancement: three times greater than pure water
Milanova and Kumar [100] SiO2–water CHF enhancement: 50% with no nanoparticle deposition on wire
Golubovic et al. [101] Al2O3–water, Bismuth oxide (Bi2O3)–water
CHF enhancement: up to 50% for Al2O3 and 33% for Bi2O3
Kwark et al. [102] Al2O3–water, CuO–water, and diamond–water
BHT degradationCHF enhancement: increases with nanoparticles concentration until reaches an asymptotic value
56 Nanoparticle Heat Transfer and Fluid Flow
surface can be helpful in resolving the controversies in the pool boiling heat-transfer coefficient of nanofluids as well as in illustrating the mechanisms that results in a substantial increase in CHF.
2.5.2 nuCleate pool Boiling Heat transfer anD CHf Correlations
A number of studies in the literature have presented correlations in the absence of nanoparticles to explain the causes of CHF increase. Zuber’s correlation [111], which was largely utilized to predict CHF for an infinite flat plate in the absence of nanoparticles is given by
′′ = −( )
q h gg g gCHF Zuber f f,
//
.0 131 1 21 4
ρ σ ρ ρ
(2.24)
where σ is the surface tension, ρf and ρg are the liquid and vapor densities respec-tively, and hfg is the latent heat. According to the above correlation, densities of liquid and vapor, surface tension, and heat of vaporization may affect CHF values. Later Lienhard and Dhir [112] modified Zuber’s correlation to account for both size and geometrical effects. They provided hydrodynamic predictions of CHF from different finite bodies
′′ = −( )
q h gg g gCHF f f0 149 1 2
1 4. /
/ρ σ ρ ρ
(2.25)
This correlation shows that CHF is proportional to surface tension σ1/4. This effect is rather weak. Kandlikar [113] extended Zuber’s correlation to include the effect of contact angle (β ) as follows:
′′
−( )
= +
+( ) +q
h gg g g
CHF
f fρ σ ρ ρ
β π β π1 21 4
116 4
12
//
coscos
1 2/
(2.26)
There are many studies reported in the literature associated with the effects of heating surface conditions on the pool boiling CHF. Ramilison et al. [114] studied the influence of surface conditions such as roughness and contact angle on CHF. Ramilison et al. [114] suggested the following correlation:
′′′′
A rB C DCHF
CHF Zuber
r
,
π β βr
(2.27)
where βr is the receding contact angle and r is the rms value of surface roughness. The above correlation shows that CHF is directly proportional to the surface roughness. Following a dimensional analysis, Kutateladze [115,116] proposed a correlation based on assumption that the critical condition is reached when
57The Role of Nanoparticle Suspensions
the velocity in the vapor phase reaches a critical value. This correlation can be expressed as
′′
−( )
=q
h gK
g g g
CHF
f fρ σ ρ ρ1 21 4
//
(2.28)
The value of K was found to be 0.16 from the experimental data.Borishanskii [117] obtained an analytical expression for the constant K in
Kutateladze correlation as
Kg g
= +−( )
−
0 13 43 2
21 2
0 4
./
/
.
ρ σ
µ ρ ρf
f
(2.29)
Bubble crowding at heated surface was proposed by Rosenhow and Griffith [118]. They assumed that increased packing of the heating surface with bubbles at higher heat fluxes is responsible for stopping the flow of liquid to the heating surface leading to CHF. They proposed the following equation for CHF
′′ =
−
qh
Cggg g
g
g
CHF
f
f
ρρ ρ
ρ1
1 4 0 6
s
/ .
(2.30)
where C1 = 0.012 m/s, g is the local gravitational acceleration, and gs corresponds to the standard g value. Chang [119] considered the forces acting on the bubble and assumed that the CHF condition was achieved when the Weber number reached a critical value. The following correlation was developed by Chang [119] for vertical surfaces
′′ = −( )
q h gg g gCHF f f0 098 1 2
1 4. /
/ρ σ ρ ρ
(2.31)
One can note from above correlations that the CHF depends on the physical properties such as surface tension, liquid and vapor densities, and viscosity as well as bubble dynamics and nucleation density site. Furthermore, structure of boiling surface and thermophysical properties of nanofluids may also affect nucleate boiling heat transfer and CHF.
2.6 MEDICAL APPLICATIONS OF NANOPARTICLES
The applications of nanoscience and nanotechnology in medicine, especially in diagnosis and treatment of diseases, have received considerable attention by many researchers and pharmaceutical companies [120]. One of the applications includes

58 Nanoparticle Heat Transfer and Fluid Flow
the use of nanoparticles (1–100 nm) in drug and gene delivery [121,122], detection of proteins [123], probing of DNA structure [124], tissue engineering [125], magnetic resonance imaging contrast enhancement [126], and tumor destruction via hyper-thermia [127]. Nanoparticles have distinctive physicochemical properties such as ultra small size, large surface to mass ratio, high reactivity, and unique interactions with biological systems [128]. In drug-delivery applications, controlled-released drugs delivered to the site of action at a designed rate have numerous advantages over the conventional dosage forms. This interest stems from its importance in reduc-ing dosing frequency, adverse side effects, and in achieving improved pharmaco-logical activity as well as in maintaining constant and prolonged therapeutic effects [129,130]. Nanoparticles are engineered to bind to target cells and deliver high doses of therapeutic compounds which results in reducing damage to healthy cells in the body [122] (Figure 2.11). Nanoparticles used as drug delivery systems are made using a variety of materials such as polymers (polymeric nanoparticles, micelles, or dendrimers), lipids, viruses, and organometallic compound (nanotubes) [131]. Figure 2.12 shows a schematic diagram showing the composition of liposomes, dendrimers,
Drug
Micelle Liposome Dendrimer
Drugs
FIGURE 2.12 Schematic diagram of nanoparticles used as drug delivery systems. (Reprinted with kind permission from Springer: ElHazzat Jallal and E.H. El-Sayed Mohamed. 2010, Advances in targeted breast cancer, Current Breast Cancer Reports 2, 146–151.)
Solidtumormass
Drug
Tumor cell
Leaky blood vessel
“Leaky” endothelium
Tumor vasculature
Normal vasculature
Normal endothelium
FIGURE 2.11 Diffusion of dendrimes-based drug-delivery systems across the tumor’s leaky vasculature into the tumor tissue. (Reprinted with permission from S.H. Madina and M.E. El-Sayed. 2009, Dendrimers as carriers for delivery of chemotherapeutic agents, Chem Rev. 109, 3141–3157, Copyright 2009, with permission from ACS Publications.)

59The Role of Nanoparticle Suspensions
and polymeric micelles used for delivery of chemotherapeutic agents for treatment of breast cancer [132].
Another application of nanoparticles can be found in imaging. Recent advances in nanoparticle technology have led to the implementation of nanoparticles such as TiO2, quantum dots, and gold nanoparticles in cellular imaging due to their distinc-tive properties compared with traditional fluorescent dyes and proteins. For instance, the smaller size and improved photostability of quantum dots allow for prolonged and enhanced visualization of biological components in fixed cells [133].
2.7 CONCLUSIONS
Thermophysical properties of nanofluids and their importance in biomedical applications and heat-transfer enhancement are discussed in this study. General correlations for the effective thermal conductivity and viscosity of nanofluids are developed in this study based on the experimental data in terms of various perti-nent parameters. The experimental data reported by many authors for the effective thermal conductivity and dynamic viscosity of nanofluids are in disagreement. This study has illustrated that the results of the effective thermal conductivity and viscos-ity of nanofluids can be determined at room temperature using the classical equa-tions at low-volume fractions. However, these models cannot predict the thermal conductivity at other temperatures. Moreover, for high heat-flux applications, the experimental results reported in the literature showed contradictory results in pool boiling heat-transfer characteristics while the CHF of nanofluids demonstrates a sig-nificant increase with the addition of nanoparticles. This review summarizes some of the potential applications of nanoparticles in biomedical applications related to cancer treatment, medical imaging, and drug-delivery systems.
NOMENCLATURE
ceff heat capacity of nanofluidscf heat capacity of the base fluidcp heat capacity of nanoparticlesC proportional constantdf diameter of the fluid moleculedp nanoparticles diameterh inter-particle spacinghfg latent heatk thermal conductivitykB Stefan–Boltzmann constantkeff thermal conductivity of nanofluidskH Huggins Coefficientklayer thermal conductivity of the nano-layerm massn empirical shape factorPr Prandtl numberRe Reynolds number
60 Nanoparticle Heat Transfer and Fluid Flow
r rms value of surface roughnesst thickness of the nano-layerT temperatureV volume
greek symBols
β ratio of nano-layer thickness to radius of nanoparticleβeff thermal expansion coefficient of nanofluidsβf thermal expansion coefficient of the base fluidβp thermal expansion coefficient of nanoparticleβr receding contact angleρ densityρeff density of nanofluidsγ ratio of nano-layer thermal conductivity to nanoparticle thermal conductivityκ ratio of nanoparticle thermal conductivity to fluid thermal conductivityψ particle sphericityϕp volume fraction of nanoparticlesϕp,max maximum volume fraction of nanoparticlesμeff dynamic viscosity of nanofluidsμf dynamic viscosity of the base fluidμBrownian dynamic viscosity due to Brownian motionσ surface tension
suBsCripts
f fluidp nanoparticle
REFERENCES
1. S.U.S. Choi. Nanofluids: From vision to reality through research, Journal of Heat Transfer 131, 2009, 1–9.
2. K.V. Wong and O. Leon. Applications of nanofluids: Current and future, Advances in Mechanical Engineering. 2010, 1–11.
3. V. Bianco, F. Chiacchio, O. Manca, and S. Nardini. Numerical investigation of nanofluids forced convection in circular tubes, Applied Thermal Engineering 29, 2009, 3632–3642.
4. M. Shafahi, V. Bianco, K. Vafai, and O. Manca. Thermal performance of flat-shaped heat pipes using nanofluids, International Journal of Heat and Mass Transfer 53, 2010, 1438–1445.
5. M. Shafahi, V. Bianco, K. Vafai, and O. Manca. An investigation of the thermal performance of cylindrical heat pipes using nanofluids, International Journal of Heat and Mass Transfer 53, 2010, 376–383.
6. K. Khanafer, K., Vafai, and M. Lightstone. Buoyancy-driven heat transfer enhancement in a two-dimensional enclosure utilizing nanofluids, International Journal of Heat and Mass Transfer 46, 2003, 3639–3653.
7. A.R.A. Khaled and K. Vafai, Heat transfer enhancement through control of thermal dispersion effects, International Journal of Heat and Mass Transfer 48, 2005, 2172.

61The Role of Nanoparticle Suspensions
8. J.A. Eastman, S.U.S. Choi, S. Li, L.J. Thompson, and S. Lee. Enhanced thermal conductivity through the development of nanofluids. In: 1996 Fall meeting of the Materials Research Society (MRS), Boston, USA.
9. J.A. Eastman, S.U.S. Choi, S. Li, W. Yu, and L.J. Thompson. Anomalously increased effective thermal conductivities of ethylene glycol-based nanofluids containing copper nanoparticles, Applied Physics Letters 78, 2001, 718–720.
10. S.P. Jang and S.U.S. Choi. Role of Brownian motion in the enhanced thermal conductiv-ity of nanofluids, Applied Physics Letters 84, 2004, 4316–4318.
11. S. Lee and S.U.S. Choi. Application of metallic nanoparticle suspensions in advanced cooling systems. In: 1996 International Mechanical Engineering Congress and Exhibition, Atlanta, USA.
12. A. Ali, K. Vafai, and A.-R.A. Khaled. Comparative study between parallel and counter flow configurations between air and falling film desiccant in the presence of nanopar-ticle suspensions, International Journal of Energy Research 27, 2003, 725–745.
13. N. Putra, W. Roetzel, and S.K. Das. Natural convection of nanofluids. Heat and Mass Transfer 39, 2003, 775–784.
14. Y.M. Xuan and Q. Li. Heat transfer enhancement of nanofluids, International Journal of Heat and Fluid Flow 21, 2000, 58–64.
15. Y.M. Xuan and Q. Li. Investigation on convective heat transfer and flow features of nanofluids, ASME Journal of Heat Transfer 125, 2003, 151–155.
16. B.C. Pak and Y.I. Cho. Hydrodynamic and heat transfer study of dispersed fluids with submicron metallic oxide particles, Experimental Heat Transfer 11, 1999, 151–170.
17. Y. Yang, Z. Zhang, E. Grulke, W. Anderson, and G. Wu, G. Heat transfer properties of nanoparticle-in-fluid dispersions (nanofluids) in laminar flow, International Journal of Heat and Mass Transfer 48, 2005, 1107–1116.
18. D.S. Wen and Y.L. Ding. Experimental investigation into the pool boiling heat trans-fer of aqueous based alumina nanofluids, Journal of Nanoparticle Research 7, 2005, 265–274.
19. B.X. Wang, L.P. Zhou, and X.F. Peng. A fractal model for predicting the effective ther-mal conductivity of liquid with suspension of nanoparticles, International Journal of Heat and Mass Transfer 46, 2003, 2665–2672.
20. S.K. Das, N. Putra, and W. Roetzel. Pool boiling characteristics of nanofluids, International Journal of Heat and Mass Transfer 46, 2003a, 851–862.
21. S.K. Das, N. Putra, and W. Roetzel. Pool boiling of nanofluids on horizontal narrow tubes, International Journal of Multiphase Flow 29, 2003b, 1237–1247.
22. S.K. Das, N. Putra, P. Thiesen, and W. Roetzel, Temperature dependence of thermal conductivity enhancement for nanofluids, Journal Heat Transfer 125, 2003, 567–574.
23. J. Kim, Y.T. Kang, and C.K. Choi. Analysis of convective instability and heat transfer characteristics of nanofluids, Physics of Fluids 16, 2004, 2395–2401.
24. B. Ghasemi and S.M. Aminossadati. Natural convection heat transfer in an inclined enclosure filled with a water-CuO nanofluid, Numerical Heat Transfer, Part A 55, 2009, 807–823.
25. A.G.A. Nnanna, T. Fistrovich, K. Malinski, and S.U.S. Choi. Thermal transport phenomena in buoyancy-driven nanofluids, in Proceedings of 2005 ASME International Mechanical Engineering Congress and RD&D Exposition, November 15–17, 2004, Anaheim, CA, USA.
26. A.G.A. Nnanna and M. Routhu. Transport phenomena in buoyancy-driven nanofluids—Part II, in Proceedings of 2005 ASME Summer Heat Transfer Conference, July 17–22, 2005, San Francisco, California, USA.
27. Y. Ding, H. Chen, L. Wang et al., Heat transfer intensification using nanofluids, Journal of Particle and Powder 25, 2007, 23−36.

62 Nanoparticle Heat Transfer and Fluid Flow
28. B.H. Chang, A.F. Mills, and E. Hernandez. Natural convection of micro-particle suspen-sions in thin enclosures, International Journal of Heat and Mass Transfer 51, 2008, 1332–1341.
29. P. Keblinski, S.R. Phillpot, S.U.S. Choi, and J.A. Eastman. Mechanisms of heat flow in suspensions of nano-sized particles (nanofluids), International Journal of Heat and Mass Transfer 45, 2002, 855–863.
30. J.A. Eastman, S.R. Phillpot, S.U.S. Choi, and P. Keblinski. Thermal transport in nano-fluids, Annual Review Of Materials Research 34, 2004, 219–246.
31. W. Evans, J. Fish, and P. Keblinski. Role of Brownian motion hydrodynamics on nano-fluid thermal conductivity, Applied Physics Letters 88(9), 2006, 93116.
32. W. Yu and S.U.S. Choi. The role of interfacial layers in the enhanced thermal of nano-fluids: a renovated Maxwell model, Journal of Nanoparticle Research 5 (1–2), 2003, 167–171.
33. W. Yu and S.U.S. Choi, The role of interfacial layers in the enhanced thermal conduc-tivity of nanofluids: A renovated Hamilton–Crosser model, Journal of Nanoparticle Research 6(4), 2004, 355–361.
34. Q. Xue and W.M. Xu. A model of thermal conductivity of nanofluids with interfacial shells, Materials Chemistry and Physics 90, 2005, 298–301.
35. Q. Xue. Model for effective thermal conductivity of nanofluids, Physics Letters A 307, 2003, 313–317.
36. H. Xie, M. Fujii, and X. Zhang. Effect of interfacial nanolayer on the effective ther-mal conductivity of nanoparticle-fluid mixture, International Journal of Heat and Mass Transfer 48, 2005, 2926–2932.
37. L. Xue, P. Keblinski, S.R. Phillpot, S.U.S. Choi, and J.A. Eastman. Effect of liquid layering at the liquid–solid interface on thermal transport, Int. J. Heat Mass Transfer 47(19–20), 2004, 4277–4284.
38. C.J. Ho, W.K. Liu, Y.S. Chang, and C.C. Lin. Natural convection heat transfer of alumina- water nanofluid in vertical square enclosures: An experimental study, International Journal of Thermal Sciences 49, 2010, 1345–1353.
39. K. Khanafer and K. Vafai. A critical synthesis of thermophysical characteristics of nano-fluids, International Journal of Heat and Mass Transfer 54, 2011, 4410–4428.
40. S.P. Jang and S.U. Choi. Free convection in a rectangular cavity (Benard Convection) with nanofluids, Proceedings of the 2004 ASME International Mechanical Engineering Congress and Exposition, Anaheim, California, November 13–20.
41. L. Gosselin and A.K. da Silva. Combined heat transfer and power dissipation optimiza-tion of nanofluid flows, Applied Physics Letters 85, 2004, 4160.
42. J. Lee and I. Mudawar. Assessment of the effectiveness of nanofluids for single-phase and two-phase heat transfer in micro-channels, International Journal of Heat and Mass Transfer 50, 2007, 452–463.
43. S.Q. Zhou and R. Ni. Measurement of the specific heat capacity of water-based Al2O3 nanofluid, Applied Physics Letters 92, 2008, 093123.
44. K.S. Hwang, J.H. Lee, and S.P. Jang, Buoyancy-driven heat transfer of water-based Al2O3 nanofluids in a rectangular cavity, International Journal of Heat and Mass Transfer 50, 2007, 4003–4010.
45. C.J. Ho, M.W. Chen, and Z.W. Li. Numerical simulation of natural convection of nano-fluid in a square enclosure: Effects due to uncertainties of viscosity and thermal conduc-tivity, International Journal of Heat and Mass Transfer 51, 2008, 4506–4516.
46. A. Einstein. Eine neue bestimmung der molekuldimensionen, Annalen der Physik, Leipzig, 19, 1906, 289–306.
47. H.C. Brinkman. The viscosity of concentrated suspensions and solutions. J. Chem Phys 20, 1952, 571.

63The Role of Nanoparticle Suspensions
48. G. Batchelor. The effect of Brownian motion on the bulk stress in a suspension of spheri-cal particles, J. Fluid Mechanics 83, 1977, 97–117.
49. T. Lundgren. Slow flow through stationary random beds and suspensions of spheres, J. Fluid Mechanics 51, 1972, 273–299.
50. A.L. Graham. On the viscosity of suspensions of solid spheres, Appl. Sci. Res. 37, 1981, 275–286.
51. R.A. Simha. Treatment of the viscosity of concentrated suspensions, Journal of Applied Physics 23, 1952, 1020–1024.
52. M. Mooney. The viscosity of a concentrated suspension of spherical particles, Journal of Colloid Science 6, 1951, 162–170.
53. V.H. Eilers. Die viskocitat von emulsionen hochviskoser stoffe als funktion der konzen-tration, Kolloid-Zeitschrift 97, 1941, 313–321.
54. N. Saito. Concentration dependence of the viscosity of high polymer solutions, Journal of Physical Society of Japan 5, 1950, 4–8.
55. N.A. Frankel and A. Acrivos. On the viscosity of a concentrate suspension of solid spheres, Chemical Engineering Science 22, 1967, 847–853.
56. X. Wang, X. Xu, and S.U.S. Choi. Thermal conductivity of nanoparticles–fluid mixture, Journal of Thermophysics Heat Transfer 13, 1999, 474–480.
57. H. Masuda, A. Ebata, K. Teramae, and N. Hishinuma. Alteration of thermal conductivity and viscosity of liquid by dispersing ultra-fine particles (dispersion of c-Al2O3, SiO2 and TiO2 ultra-fine particles), Netsu Bussei 4, 1993, 227–233.
58. S. Maiga, S.J. Palm, C.T. Nguyen, G. Roy, and N. Galanis. Heat transfer enhancement by using nanofluids in forced convection flows, International Journal of Heat and Fluid Flow 26, 2005, 530–546.
59. S. Maiga, C.T. Nguyen, N. Galanis, G. Roy, T. Mar’e, and M. Coqueux. Heat transfer enhancement in turbulent tube flow using Al2O3 nanoparticle suspension. In: Lewis, R.W. (Eds.), International Journal of Numerical Methods Heat and Fluid Flow 16, 2006, 275–292.
60. P.K. Namburua, D.P. Kulkarni, D. Misra, and D.K. Das. Viscosity of copper oxide nanoparticles dispersed in ethylene glycol and water mixture, Experimental Thermal Fluid Science 32, 2007, 397–402.
61. C.T. Nguyen, F. Desgranges, G. Roy, N. Galanis, T. Mare, S. Boucher, and H.A. Mintsa. Temperature and particle-size dependent viscosity data for water-based nano-fluids–hysteresis phenomenon, International Journal of Heat and Fluid Flow 28, 2007, 1492–1506.
62. W.J. Tseng and K.C. Lin, Rheology and colloidal structure of aqueous TiO2 nanopar-ticle suspensions, Materials Science and Engineering A355, 2003, 186–192.
63. D.P. Kulkarni, D.K. Das, and S.L. Patil. Effect of temperature on rheological properties of copper oxide nanoparticles dispersed in propylene glycol and water mixture, Journal of Nanosciense and Nanotechnology 7, 2007, 2318–2322.
64. D.P. Kulkarni, D.K. Das, and G. Chukwa. Temperature dependent rheological of copper oxide nanoparticles suspension (nanofluid), Journal of Nanosciense and Nanotechnology 6, 2006, 1150–1154.
65. S.M.S. Murshed, K.C. Leong, and C. Yang. Investigations of thermal conductivity and viscosity of nanofluids, International Journal of Thermal Sciences 47, 2008, 560–568.
66. J. Buongiorno. Convective transport in nanofluids ASME, Journal of Heat Transfer 128, 2006, 240–250.
67. S.J. Palm, G. Roy, and C.T. Nguyen, Heat transfer enhancement with the use of nano-fluids in radial flow cooling systems considering temperature-dependent properties, Applied Thermal Engineering 26, 2006, 2209–2218.

64 Nanoparticle Heat Transfer and Fluid Flow
68. W. Duangthongsuk and S. Wongwises. Measurement of temperature-dependent thermal conductivity and viscosity of TiO2-water nanofluids, Experimental Thermal and Fluid Science 33, 2009, 706–714.
69. P. K. Namburu, D.K. Das, K.M. Tanguturi, and R.S. Vajjha. Numerical study of turbu-lent flow and heat transfer characteristics of nanofluids considering variable properties, International Journal of Thermal Sciences 48, 2009, 290–302.
70. J. Koo and C. Kleinstreuer, Laminar nanofluid flow in microheat-sinks, International Journal of Heat and Mass Transfer 48, 2005, 2652–2661.
71. K.B. Anoop, S. Kabelac, T. Sundararajan, and S.K. Das. Rheological and flow charac-teristics of nanofluids: Influence of electroviscous effects and particle agglomeration, Journal of Applied Physics 106, 2009, 034909.
72. R.L. Hamilton and O.K. Crosser. Thermal conductivity of heterogeneous two-compo-nent systems, I&EC Fundam 1, 1962, 182–191.
73. J.C.A. Maxwell Treatise on Electricity and Magnetism. Clarendon Press, Oxford, UK, 2nd edition, 1881.
74. D.A.G. Bruggeman. Berechnung verschiedener physikalischer konstanten von hetero-genen substanzen, I. Dielektrizitatskonstanten und leitfahigkeiten der mischkorper aus isotropen substanzen, Annalen der Physik, Leipzig, 24, 1935, 636–679.
75. F.J. Wasp. Solid-Liquid Slurry Pipeline Transportation, 1977, Trans. Tech., Berlin, Germany. 76. D.J. Jeffrey. Conduction through a random suspension of spheres, Proceedings of Royal
Society (London) A335, 1973, 355–367. 77. R.H. Davis. The effective thermal conductivity of a composite material with spherical
inclusions, International Journal of Thermophysics 7, 1986, 609–620. 78. S. Lu and H. Lin. Effective conductivity of composites containing aligned spherical
inclusions of finite conductivity, Journal of Applied Physics 79, 1996, 6761–6769. 79. Y. Xuan, Q. Li, and W. Hu. Aggregation structure and thermal conductivity of nanoflu-
ids, AIChE Journal 49(4). 2003, 1038–1043. 80. R. Prasher, P. Bhattacharya, and P.E. Phelan. Thermal conductivity of nanoscale col-
loidal solutions (nanofluids), Physical Review Letters 94(2), 2005, 025901. 81. J. Koo, and C. Kleinstreuer. A new thermal conductivity model for nanofluids, Journal
of Nanoparticle Research 6(6). 2004, 577–588. 82. C.H. Chon, K.D. Kihm, S.P. Lee, and S.U.S. Choi, Empirical correlation finding the role
of temperature and particle size for nanofluid (Al2O3) thermal conductivity enhance-ment, Applied Physics Letters 87, 2005, 153107.
83. R.A. Taylor. Phelan PE: Pool boiling of nanofluids. Comprehensive review of existing data and limited new data, International Journal of Heat and Mass Transfer 52, 2009, 5339–5347.
84. H.S. Ahn, H. Kim, H. Jo, S. Kang, W. Chang, and M.H. Kim. Experimental study of critical heat flux enhancement during forced convective flow boiling of nanofluid on a short heated surface, International Journal of Multiphase Flow 36(5), 2010, 375–384.
85. G. Prakash Narayan, K.B. Anoop, and Sarit K. Das. Mechanism of enhancement/deteri-oration of boiling heat transfer using stable nanoparticle suspensions over vertical tubes, Journal of Applied Physics 102, 2007, 074317.
86. S.M. You, J.H. Kim, and K.H. Kim. Effect of nanoparticles on critical heat flux of water in pool boiling heat transfer, Applied Physics Letters 83, 2003, 3374–3376.
87. I.C. Bang and S.H. Chang. Boiling heat transfer performance and phenomena of Al2O3-water nanofluids from a plain surface in a pool, International Journal Heat and Mass Transfer 48, (2005) 2407–2419.
88. J.P. Tu, N. Dinh, and T. Theofanous. An experimental study of nanofluid boiling heat trans-fer, in Proceedings of 6th International Symposium on Heat Transfer, Beijing, China, 2004.
89. D.S. Wen, Y.L. Ding, and R.A. Williams. Pool boiling heat transfer of aqueous based TiO2 nanofluids, Journal of Enhanced Heat Transfer 13, 2006, 231–244.

65The Role of Nanoparticle Suspensions
90. Z.H. Liu, J.G. Xiong, and R. Bao. Boiling heat transfer characteristics of nanofluids in a flat heat pipe evaporator with micro-grooved heating surface, Int. J. Multiphase Flow 33, 2007, 1284–1295.
91. M.H. Kim, J.B. Kim, and H.D. Kim, Experimental studies on CHF characteristics of nano-fluids at pool boiling, International Journal of Multiphase Flow 33, 2007, 691–706.
92. S.J. Kim, T. McKrell, J. Buongiorno, and L.W. Hu, Experimental study of flow critical heat flux in alumina–water, zinc-oxide–water and diamond-water nanofluids, Journal of Heat Transfer 131(4), 2009, 043204-1-7.
93. P. Vassallo, R. Kumar, and S.D. Amico. Pool boiling heat transfer experiments in silica–water nanofluids, International Journal of Heat and Mass Transfer 47, 2004, 407–411.
94. C.H. Li, B.X. Wang, and X.F. Peng. Experimental investigations on boiling of nano-particle suspensions, in: 2003 Boiling Heat Transfer Conference, 1993, Jamica, USA.
95. S.J. Kim, I.C. Bang, J. Buongiorno, and L.W. Hu. Effects of nanoparticle deposition on surface wettability influencing boiling heat transfer in nanofluids, Applied Physics Letters 89, 2006, 153107.
96. S.J. Kim, I.C. Bang, J. Buongiorno, and L. W. Hu. Surface wettability change during pool boiling of nanofluids and its effect on critical heat flux, International Journal of Heat and Mass Transfer 50, 2007, 4105–4116.
97. Milanova D, Kumar R. Role of ions in pool boiling heat transfer of pure and silica nano-fluids, Applied Physics Letters 87(23), 2005, 233107-1-3.
98. M. Chopkar, A.K. Das, I. Manna, and P.K. Das. Pool boiling heat transfer characteristics of ZrO2-water nanofluids from a flat surface in a pool, Heat and Mass Transfer 44(8), 2007, 999–1004.
99. H.D. Kim, J.H. Kim, and M.H. Kim. Experimental study on CHF characteristics of water-TiO2 nanofluids, Nuclear Engineering Technology 38(1), 2006, 61.
100. D. Milanova and R. Kumar. Heat transfer behaviour of silica nanoparticles in pool boil-ing experiment, J Heat Transf 130(4), 2008, 1–6.
101. M. Golubovic, H.D.M. Hettiarachchi, W.M. Worek, and W.J. Minkowycz. Nanofluids and critical heat flux, experimental and analytical study, Applied Thermal Engineering 29, 2009, 1281–1288.
102. S.M. Kwark, R. Kumar, G. Moreno, J. Yoo, and S.M. You. Pool boiling characteristics of low concentration nanofluids, International Journal of Heat and Mass Transf 53, 2010, 972–981.
103. Z-H. Liu, X-F. Yang, and J-G. Xiong. Boiling characteristics of carbon nanotube suspen-sions under sub-atmospheric pressures, International Journal of Thermal Science 49(7), 2010, 1156–1164.
104. R. Hegde, S.S. Rao, and R.P. Reddy. Critical heat flux enhancement in pool boiling using Alumina nanofluids, Heat Transfer, Heat Transfer—Asian Research 39, 2010, 323–331.
105. K. Sefiane. On the role of structural disjoining pressure and contact line pinning in critical heat flux enhancement during boiling of nanofluids, Applied Physics Letters 89, 2006, 044106.
106. T.M. Anderson and I. Mudawar. Microelectronic cooling by enhanced pool boiling of a dielectric fluorocarbon liquid, ASME Journal of Heat Transfer 111, 1989, 752–759.
107. I. Mudawar and T.M. Anderson, Optimization of enhanced surfaces for high flux chip cooling by pool boiling, ASME Journal of Electronic Package 115, 1993, 89–99.
108. H. Honda, H. Takamastu, and J.J. Wei. Enhanced boiling of FC-72 on silicon chips with micro-pin-fins and submicron-scale roughness, ASME Journal of Heat Transfer 124, 2002, 383–389.
109. J.J. Wei, H. Honda, and L.J. Guo. Experimental study of boiling phenomena and heat transfer performances of FC-72 over micro-pin-finned silicon chips, Heat and Mass Transfer 41, 2005, 744–755.
66 Nanoparticle Heat Transfer and Fluid Flow
110. S. Ujereh, T. Fisher, and I. Mudawar. Effects of carbon nanotube arrays on nucleate pool boiling, International Journal of Heat and Mass Transfer 50, 2007, 4023–4038.
111. N. Zuber. On the stability of boiling heat transfer, ASME Journal of Heat Transfer 80, 1958, 711–720.
112. J.H. Lienhard and V.K. Dhir. Hydrodynamic prediction of peak pool boiling heat fluxes from finite bodies, ASME Journal of Heat Transfer 95, 1973, 477–482.
113. S.J. Kandlikar. A theoretical model to predict pool boiling CHF incorporating effects of contact angle and orientation, Journal of Heat Transfer 123, 2001, 1071–1079.
114. J.M. Ramilison, P. Sadasivan, and J. H. Lienhard. Surface factors influencing burnout on flat heaters, Jouranl of Heat Transfer 114, 1992, 287.
115. S.S. Kutateladze. On the transition to film boiling under natural convection, Kotloturbostroenie 3, 1948, 10–12.
116. S.S. Kutateladze. A hydrodynamic theory of changes in a boiling process under free convection,’ Izvestia Akademia Nauk, S.S.S.R., Otdelenie Tekhnicheski Nauk 4, 1951, 529.
117. V.M. Borishanskii. On the Problem of Generalizing Experimental Data on the Cessation of Bubble Boiling in Large Volume of Liquids, 1955, Ts. K.I.T., 28, Moscow.
118. W. Rosenhow and P. Griffith. Correlation ofmaximum heat flux data for boiling of satu-rated liquids, Chemical Engineering Progress Symposium Series 52, 1956, 47–49.
119. Y.P. Chang. An Analysis of the Critical Conditions and Burnout in Boiling Heat Transfer, USAEC Rep. TID-14004, 1961, Washington, DC.
120. W.H. De Jong and P. Borm. Drug delivery and nanoparticles: Applications and hazards, International Journal of Nanomedicine 3, 2008, 133–149.
121. D.J. Irvine. Drug delivery: One nanoparticle, on kill, Nature Materials 10, 2011, 342–343.
122. D. Panatarotto, C.D. Prtidos, J. Hoebeke, F. Brown, E. Kramer, J.P. Briand, S. Muller, M. Prato, and A. Bianco. Immunization with peptide-functionalized carbon nanotubes enhances virus-specific neutralizing antibody responses, Chemistry & Biology 10, 2003, 961–966.
123. J.M. Nam, C.C. Thaxton, and C.A. Mirkin. Nanoparticles-based bio-bar codes for the ultrasensitive detection of proteins, Science 301, 2003, 1884–1886.
124. R. Mahtab, J.P. Rogers, and C.J. Murphy. Protein-sized quantum dot luminescence can distinguish between “straight”, “bent”, and “kinked” oligonucleotides, Journal of American Chemical Society 117, 1995, 9099–9100.
125. J. Ma, H. Wong, L.B. Kong, and K.W. Peng. Biomimetic processing of nanocrystallite bioactive apatite coating on titanium, Nanotechnology 14, 2003, 619–623.
126. R. Weissleder, G. Elizondo, J. Wittenburg, C.A. Rabito, H.H. Bengele, and L. Josephson. Ultrasmall superparamagnetic iron oxide: Characterization of a new class of contrast agents for MR imaging, Radiology 175, 1990, 489–493.
127. J. Yoshida and T. Kobayashi. Intracellular hyperthermia for cancer using magnetite cat-ionic liposomes, Journal of Magnetism and Magnetic Materials 194, 1999, 176–184.
128. L. Zhang, F.X. Gu, J.M. Chan, A.Z. Wang, R.S. Langer, and O.C. Farokhzad. Nanoparticles in medicine: Therapeutic applications and developments, Clinical Pharmacology and Therapeutics 83, 2008, 761–9.
129. Y.W. Chien. Novel Drug Delivery Systems, 2nd edn. Marcel Dekker, New York, 1992. 130. K. Khanafer and K. Vafai. The role of porous media in biomedical engineering as related
to magnetic resonance imaging and drug delivery, Heat and Mass Transfer 42, 2006, 939–953.
131. K. Cho, X. Wang, S. Nie, Z. Chen, and D.M. Shin. Therapeutic nanoparticles for drug delivery in cancer, Clinical Cancer Research 14, 2008, 1310–1316.
132. ElHazzat Jallal and E.H. El-Sayed Mohamed. Advances in targeted breast cancer, Current Breast Cancer Reports 2, 2010, 146–151.

67The Role of Nanoparticle Suspensions
133. K. Thurn, E. Brown, A. Wu, S. Vogt, B. Lai, J. Maser, T. Paunesku, and G. Woloschak. Nanoparticles for applications in cellular imaging, Nanoscale Research Letters 2, 2007, 430–441.
134. S.H. Madina and M.E. El-Sayed. Dendrimers as carriers for delivery of chemotherapeu-tic agents, Chem Rev. 109, 2009, 3141–3157.
