the role of mesogenin1 in the dynamics of movement and...
TRANSCRIPT
Universidade de Lisboa
Faculdade de Ciências
Departamento de Biologia Animal
The role of Mesogenin1 in the dynamics of
movement and differentiation of mesoderm
progenitor cells
Ana Margarida da Silva Figueira
Dissertação de
Mestrado em Biologia Evolutiva e do Desenvolvimento
2012/2013


Universidade de Lisboa
Faculdade de Ciências
Departamento de Biologia Animal
The role of Mesogenin1 in the dynamics of
movement and differentiation of mesoderm
progenitor cells
Ana Margarida da Silva Figueira
Dissertação de
Mestrado em Biologia Evolutiva e do Desenvolvimento
Orientada por:
Professora Doutora Leonor Saúde
Professora Doutora Sólveig Thorsteinsdóttir
2012/2013


I
ACKNOWLEDGEMENTS/AGRADECIMENTOS
Em primeiro lugar, agradeço à Leonor por me ter acolhido no seu grupo, pela
oportunidade que me deu em trabalhar neste projecto e por ter acreditado em mim.
Em segundo lugar, quero agradecer toda a orientação que me deu ao longo deste ano,
e a disponibilidade para esclarecer todas as questões que iam surgindo. Agradeço
ainda toda a ajuda na escrita da tese.
Em segundo lugar, quero agradecer à minha orientadora interna, a professora
Sólveig, pela disponibilidade, simpatia e encorajamento, e também pelos conselhos e
sugestões que me ajudaram a apresentar um trabalho ainda melhor. Ao professor
Pedro Rodrigues agradeço a disponibilidade e os conselhos sobre estatística.
Quero também agradecer aos UDEVianos pela boa disposição, por me terem
acolhido tão bem este ano que passou e por todas as dicas. À Margarida agradeço
ainda os ensinamentos e disponibilidade em ajudar a resolver muitos dos problemas
técnicos. À Rita Serrano e ao Zé gostava de agradecer os bons momentos e o
companheirismo. Ter pessoas do nosso lado a passar pelas mesmas experiências que
nós dá-nos sempre algum conforto, e eles foram óptimos colegas. Ao João agradeço
todo o incentivo que me deu desde o início e por tudo o que me ensinou, desde o
planeamento das experiências até à aquisição de independência no laboratório. À
Sara, que foi como uma terceira orientadora para mim. Teve sempre uma sugestão a
dar quando surgia um problema, e teve sempre uma palavra amiga nos momentos
mais desesperantes. Agradeço-lhe imenso o tempo que dispensou para me ensinar
um monte de coisas, desde o simples descorionar até à saga das sondas, ou mesmo a
tirar fotos bonitas. Agradeço-lhe ainda as sugestões de todas as formas de terapia
possíveis para superar este desafio com níveis aceitáveis de sanidade mental.
Agradeço ainda às meninas da Fish Facility por me terem ensinado tudo sobre
manipulação e manutenção do peixe-zebra, pelo excelente ambiente de trabalho que
proporcionaram e, sobretudo, por terem também acreditado em mim. À Lara, que é
uma super mulher, agradeço a inspiração, o apoio e por ter partilhado comigo este
ano tão especial para ela! À Aida agradeço imenso a amizade, as conversas, o apoio e
II
as risadas, que foram tão importantes para mim! À Sara Matos, que apesar de ter
vindo mais no fim, agradeço a boa disposição e os momentos divertidos!
Aos meus amigos, agradeço o apoio e a compreensão que demonstraram ao
longo do ano. À Susana, ao André, às Saras e à Claudia, que por mais longe que
estejam, sei que estão sempre comigo. Aos Supianos, pelo incentivo e amizade, e
principalmente ao Pumba pela revisão! Aos Barbacena pelo apoio que foi ao longo
deste ano e por tornar as viagens diárias menos entediantes!
Por fim, faço um especial agradecimento à minha mãe e à minha avó. Foi o
esforço delas que me trouxe até aqui e que me tornaram na pessoa que sou hoje. Ao
meu avô que, apesar de não poder presenciar este momento, também muito
contribuiu para que eu chegasse até aqui. À minha mãe agradeço ainda todo o apoio
incondicional, todas as refeições e boleias tardias que foram ajudas preciosas este ano
que passou! Ao Luís por acreditar sempre em mim, por estar do meu lado em todos os
momentos, por me puxar para cima quando sinto que posso cair. Sem ele, tudo teria
sido mais complicado.
Um grande obrigada a todos!

III
IV
ABSTRACT
Gastrulation in zebrafish involves four cell movements: epiboly, involution,
convergence and extension. These cell movements are required to move the
mesoderm progenitor cells (MPCs) located at the lateral region of the germ ring to the
anterior segmental plate so that they can give rise to trunk somites. The tailbud, which
is formed at the end of gastrulation, contains the MPCs that will give rise to tail
somites and therefore, at this location, their movements into the posterior presomitic
mesoderm (PSM) also need to be tightly controlled.
Work from our lab has shown that the transcription factor Mesogenin1 (Msgn1)
regulates cell movements in the tailbud. Since msgn1 is expressed not only in the
tailbud during somitogenesis, but also in the germ ring, it could also control cell
movements during gastrulation.
To analyze the role of Msgn1 on cell movements, a cell co-transplantation
technique was performed using wild-type cells and mutant or transgenic cells from a
msgn1-/- line or a hsp70:HA-msgn1 line that allows time-specific over-expression of
msgn1, respectively. The results suggest that Msgn1 is involved in the regulation of
convergence and extension movements during gastrulation and confirm that it is also
involved in governing the flux of cells from the tailbud into the PSM.
Finally, to determine if msgn1 induces differentiation of MPCs, and based on a
microarray experiment previously performed in our lab, the expression patterns of
two target genes that are important for paraxial mesoderm production were analyzed:
crabp2b and ripply1. The results indicate that Msgn1 induces their expression,
suggesting that it also contributes to switch-on the PSM character.
Thus, Mesogenin1 plays a key role during development, coupling MPCs
movements during gastrulation and tail extension with the acquisition of a PSM fate.
Keywords: gastrulation, Mesogenin1, paraxial mesoderm, cell movement,
differentiation.

V
RESUMO
A gastrulação é um processo morfogenético onde migrações e rearranjos
celulares estabelecem os três folhetos germinativos: endoderme, mesoderme e
ectoderme [1-3]. Apesar dos padrões de gastrulação variarem no reino animal,
existem quatro tipos de movimentos celulares evolutivamente conservados: epibolia,
involução, convergência e extensão. No peixe-zebra, a epibolia termina quando o
vitelo fica completamente coberto pela blastoderme. A involução começa aos 50% de
epibolia e, nesta fase, as células ao longo da margem da blastoderme começam a
internalizar, formando o anel germinativo. As células desta região começam depois a
convergir para a zona dorsal, formando um espessamento local designado por escudo
embrionário. Por fim, os movimentos de convergência e extensão (CE) contribuem
conjuntamente para o encurtamento medio-lateral dos folhetos germinativos e para a
extensão do embrião ao longo do eixo antero-posterior [3-5].
Ao longo do eixo dorso-ventral do anel germinativo são observados diferentes
graus de extensão e convergência. No domínio lateral do anel germinativo, os
movimentos de CE são inicialmente lentos e aceleram à medida que as células se
aproximam da linha dorsal, sendo que estas irão contribuir mais tarde para os sómitos
do tronco (1 a 15) [6-8]. Na região mais ventral do anel germinativo, as células não
participam nos movimentos de CE, apenas migram na direcção do polo vegetal onde
contribuem para a formação do botão caudal, e mais tarde para os sómitos caudais
(16 a 30) [7-9].
No final da gastrulação, o plano corporal básico do organismo está estabelecido
e inicia-se o período de segmentação, durante o qual se formam os sómitos [10]. À
medida que os sómitos se vão formando a partir da região anterior da mesoderme
pré-somítica (MPS), as células progenitoras da mesoderme (CPM) que se encontram
no botão caudal vão fornecendo novas células para a zona posterior da MPS [8]. O
número de CPM e a taxa a que se diferenciam e se movem para a MPS têm de ser
controlados de modo a que se forme o número correcto de sómitos.
Para que as CPM possam progredir para a MPS é necessário reduzir os níveis de
expressão de marcadores de células progenitoras, como ntl e wnt8. Alguns estudos

VI
sugerem que o factor de transcrição Mesogenin1 (Msgn1) pode estar envolvido na
terminação do loop auto-regulatório de ntl e wnt [11, 12]. No peixe-zebra a msgn1 é
expressa no botão caudal durante a segmentação e Fior et al. verificaram que nos
mutantes nulos de msgn1 ocorre uma acumulação de CPM no botão caudal e que os
movimentos celulares na transição para a MPS ficam comprometidos [12-14].
Alguns dos comportamentos e movimentos celulares que ocorrem durante a
extensão do botão caudal são semelhantes a movimentos observados durante a
gastrulação e, portanto, tem sido sugerido que os movimentos no botão caudal
podem ser uma continuação da gastrulação [15-17]. No peixe-zebra, a Mesogenin1
também é expressa na zona marginal da blastoderme durante a gastrulação, excluindo
a região do escudo embrionário [13, 14], no entanto a sua função durante este estádio
é ainda desconhecida.
Este trabalho pretende avaliar o papel da Mesogenin1 na produção da
mesoderme paraxial, nomeadamente o seu envolvimento nos movimentos celulares
que decorrem nos períodos de gastrulação e de segmentação, mas também na
diferenciação das CPM.
Na primeira parte deste estudo, recorreu-se à técnica de co-transplante de
células com níveis normais de msgn1 (controlo) e de células mutantes ou que sobre-
expressam msgn1, com recurso a uma linha mutante (msgn1-/-) e uma linha
transgénica (hsp70:HA-msgn1) que permite sobre-expressar a msgn1 num tempo
específico, através de um choque térmico.
A primeira experiência de transplantes teve como objectivo verificar o efeito da
Msgn1 na contribuição das CPM para os sómitos do tronco. Quando células controlo e
células mutantes, marcadas com diferentes corantes celulares, foram transplantadas
para a região lateral da margem de um embrião receptor, as células mutantes
contribuíram em maior frequência para sómitos mais posteriores do tronco. Na
mesma experiência mas comparando células controlo e células transgénicas (com um
choque-térmico aos 30% epibolia), as células transgénicas contribuíram apenas para
os sómitos mais anteriores do tronco e em maior frequência. Isto sugere que a Msgn1
afecta os movimentos de CE durante a gastrulação. A hibridação in situ dupla com
recurso a marcadores vastamente usados em estudos de CE (hgg1, dlx3 e ntl)

VII
confirmou que na ausência de Msgn1 estes movimentos ficam comprometidos, e que
o excesso de Msgn1 os promove.
Numa segunda experiência avaliou-se os efeitos da Msgn1 na contribuição das
CPM para os sómitos caudais. Quando células controlo e células mutantes, marcadas
com diferentes corantes celulares, foram co-transplantadas para a região ventral da
margem de um embrião receptor, as células mutantes contribuíram em maior
frequência para sómitos mais posteriores que as controlo, e não contribuíram para os
primeiros sómitos que as células controlo contribuíram. Por outro lado, na mesma
experiência comparando células controlo e células transgénicas, as células
transgénicas contribuíram em maior frequência para os sómitos mais anteriores da
cauda e nunca para últimos sómitos do embrião. Estes resultados vão de encontro ao
descrito no trabalho de Fior et al., onde observaram que as células mutantes
demoram mais tempo a sair do botão caudal, o que explica o facto de elas
contribuírem em maior frequência para sómitos mais posteriores e de não
contribuirem para os primeiros que as células controlo contribuem [12]. Do mesmo
modo, células que sobre-expressam msgn1 saem do botão caudal mais rápido,
esgotando-se precocemente, explicando o facto destas células se encontrarem em
maior frequência em sómitos mais anteriores e de não contribuírem para os sómitos
mais posteriores da cauda.
Na segunda parte deste trabalho, pretendeu-se perceber se a Msgn1 também
estaria envolvida na indução da diferenciação da mesoderme paraxial. Fior et al.
mostraram que a Msgn1 desliga genes importantes para a manutenção do estado
progenitor, como ntl, wnt3a, wnt8 e fgf8 [12]. Um estudo de microarrays realizado no
nosso laboratório revelou que a Msgn1 também regula genes importantes para a
produção de mesoderme paraxial, como o crabp2b e o ripply1. O Crabp2b regula o
acesso do ácido retinóico aos seus receptores nucleares, ajudando a modular o seu
gradiente que por sua vez é muito importante na somitogénese [18-20]. O Ripply1 é
importante na terminação do programa de segmentação na PSM e para manter a
polaridade rostro-caudal dos sómitos [21]. Através de hibridações in situ verificou-se
que de facto a Msgn1 induz a expressão de ambos os genes, sugerindo que também
está envolvida na regulação da diferenciação das CPM.
VIII
Outro dado que aponta para a importância da Msgn1 na produção de
mesoderme paraxial é o facto dos embriões hsp70:HA-msgn1 apresentarem falhas na
notocorda quando a msgn1 é sobre-expressa [12]. É possível que a expressão de
msgn1 em células destinadas a formar notocorda faça com que se inicie o programa
de diferenciação da MPS e que essas células se tornem somíticas. Para testar esta
ideia, células transgénicas da região da notocorda podem ser transplantadas para a
mesma região de um embrião receptor, e mais tarde avaliada a sua capacidade de se
diferenciarem em sómitos. Neste trabalho testou-se três abordagens para responder a
esta questão: transplante heterocrónico de células no estadio de blástula, transplante
isocrónico/homotópico de células do escudo embrionário (região que originará
posteriormente a notocorda) e transplante homotópico do escudo embrionário
inteiro, no entanto os resultados não foram conclusivos.
Em suma, este trabalho contribui para uma melhor compreensão do papel da
Msgn1 no desenvolvimento do peixe-zebra, revelando a sua importância para a
produção da mesoderme paraxial, através da sua intervenção no controlo dos
movimentos das CPM, tanto na gastrulação como na segmentação, e na sua
diferenciação.

IX
ABBREVIATIONS
AP
BMP
BSA
CE
Crabp2b
DIG
Dlx3
Dpf
DV
EMT
EVL
FGF
Flh
FLUO
Hgg-1
Hpf
HpHS
HS
Hsp
MET
MPC
Antero-Posterior
Bone Morphogenetic Protein
Bovine Serum Albumine
Convergence and Extension
Cellular retinoic acid binding
protein 2b
Digoxigenin
Distal-less homeobox 3
Days post-fertilization
Dorso-Ventral
Epithelial-Mesenchymal
transition
Enveloping Layer
Fibroblast Growth Factor
Floating head
Fluorescein
Hatching gland gene-1
Hour(s) post-fertilization
Hour(s) post-Heat-Shock
Heat-Shock
Heat-shock protein
Mesenchymal-Epithelial
transition
Mesoderm Progenitor Cell
Msgn1
MZ
Ntl
PCR
PSM
PZ
RA
Rpm
RT
Sox
Spt
Tbx
TGFβ3
Wnt
Wt
YSL
Mesogenin1
Maturation Zone
No tail
Polymerase Chain Reaction
Presomitic Mesoderm
Progenitor Zone
Retinoic Acid
Rotations per minute
Room Temperature
SRY-box containing gene
Spadetail
T-box
Transforming Growth Factor-β
Wingless-type MMTV
integration site family
Wild-type
Yolk Syncytial Layer

X
TABLE OF CONTENTS
Acknowledgements/Agradecimentos ............................................................................... I
Abstract .......................................................................................................................... IV
Resumo ............................................................................................................................ V
Abbreviations ...................................................................................................................IX
Chapter I - Introduction .................................................................................................... 2
I.1. Gastrulation in zebrafish ............................................................................................ 2
I.1.1. Epiboly movements ............................................................................................. 3
I.1.2. Involution ............................................................................................................. 4
I.1.3. Convergence and extension movements ............................................................ 4
I.2. Specification of trunk and tail somites in zebrafish ................................................... 5
I.3. Somitogenesis ............................................................................................................. 6
I.3.1. Tailbud formation ................................................................................................ 7
I.3.2. Cell movements in the tailbud ............................................................................. 8
I.3.3. From the tailbud to the PSM: time-line markers ................................................. 9
I.4. Mesogenin1 is required for paraxial mesoderm production ................................... 10
I.4.1. The role of Mesogenin1 during zebrafish gastrulation ..................................... 11
I.5. Aims .......................................................................................................................... 12
Chapter II - Materials and Methods ............................................................................... 14
II.1. Zebrafish lines .......................................................................................................... 14
II.1.1. Identification of mesogenin1 mutants ............................................................. 14
II.1.2. Transgenic fish identification ............................................................................ 14
II.2. Embryo manipulations............................................................................................. 15
II.2.1. Embryo collection ............................................................................................. 15
II.2.2. Embryo labeling ................................................................................................ 15
II.2.3. Double cell transplantation .............................................................................. 15
II.2.4. Single cell type transplantation ........................................................................ 16
II.2.5. Shield transplantation ....................................................................................... 17
II.2.6. Fluorescence Imaging ....................................................................................... 17
II.2.7. Analysis of transplanted embryos .................................................................... 18
II.3. In situ hybridization ................................................................................................. 18
XI
II.3.1. Double in situ hybridization .............................................................................. 19
II.4.2. Imaging .............................................................................................................. 19
Chapter III - Results ......................................................................................................... 21
III.1. Optimization of cell transplantation technique ..................................................... 21
III.2. Gastrulation movements ........................................................................................ 22
III.2.1. Mesogenin1 impacts on convergence and extension movements in a
gastrulating zebrafish embryo .................................................................................... 22
III.2.2. Mesogenin1 impacts on zebrafish posterior body formation ......................... 28
III.3. Mesogenin1 involvement on the shift from axial to paraxial mesodermal fates .. 31
III.3.1. Heterochronic/Heterotopic cell transplantation at blastula stage ................. 31
III.3.2. Isochronic/Homotopic transplantation of shield cells .................................... 33
III.3.3. Isochronic/Homotopic shield grafts ................................................................ 35
III.4. Mesogenin1 regulates crabp2b and ripply1 expression ........................................ 37
III.5. Mesogenin1 overexpression affects eye development ......................................... 38
Chapter IV - Discussion ................................................................................................... 42
IV.1. Mesogenin1 regulates both trunk and tail somite formation ............................... 42
IV.1.1. Mesogenin1 controls convergence and extension movements ..................... 42
IV.1.2. Mesogenin1 is required for tail formation in zebrafish .................................. 43
IV.1.3. Gastrulation versus Tailbud movements ......................................................... 44
IV.1.4. Reviewing the zebrafish fate map ................................................................... 45
IV.2. Mesogenin1 induces paraxial mesoderm production ........................................... 46
IV.3. Mesogenin1 overexpression inhibits eye development ........................................ 47
IV.4. Concluding remarks and future directions ............................................................. 49
Chapter V - References ................................................................................................... 51
Appendix I .................................................................................................................... AI-II
Appendix II .................................................................................................................. AII-II
Appendix III ................................................................................................................ AIII-II
Appendix IV ................................................................................................................ AIV-II

1
CHAPTER I
Introduction

2
CHAPTER I - INTRODUCTION
I.1. Gastrulation in zebrafish
Gastrulation is an early developmental stage that takes place after cleavage and
blastula periods, i.e. after rapid cell divisions occur, and where three germ layers are
established: ectoderm, which will give rise to the epidermis and neural tissues;
mesoderm, which will form muscles, cardiovascular, urogenital and skeletal elements
of the body; and endoderm, which will generate the digestive tube and its accessory
organs [1-3].
Despite the diverse morphologies of early vertebrate embryos, there are four
evolutionarily conserved gastrulation movements: involution (also known as
internalization), epiboly, convergence and extension. Involution brings cells of the
prospective mesoderm and endoderm beneath the future ectoderm via the
blastopore, an opening in the blastula, known as blastoderm margin in fish, thus
forming the germ ring. Epiboly leads to an expansion of tissue, often accompanied by
its thinning. Finally, convergence and extension movements simultaneously narrow the
germ layers medio-laterally and elongate the embryo from head to tail (Figure 1) [4, 5].
Figure 1. Zebrafish gastrulation movements. Convergence and extension movements are represented by orange arrows, involution by blue arrows and epiboly by black arrows; V is ventral and D is dorsal (adapted from [10]).

3
I.1.1. Epiboly movements
Epiboly starts before the germ layers arise, and at this point three distinct cell
populations can be distinguished. The yolk syncytial layer (YSL) is formed when the
cells at the vegetal edge of the blastoderm fuse with the underlying yolk cell,
producing a ring of nuclei. The second cell population is the enveloping layer (EVL),
which is the most superficial cell layer of the blastoderm. Finally, the deep cells are
those between the EVL and YSL, and will give rise to the embryo proper (Figure 2) [22].
In the initial phase of epiboly, the deep cells of the blastoderm move to occupy
more superficial positions, intercalating with the external blastomeres, a process
known as radial intercalation [22, 23]. Later, this concatenation of cells moves
vegetally over the surface of the yolk cell and envelops it completely. During this
process, the EVL is tightly joined to the YSL and is dragged along with it [22]. The
expansion of the YSL is in turn dependent on animal-vegetal microtubules, which
become shorter as epiboly continues [23, 24]. E-cadherin plays also a major role in
these morphogenetic movements, contributing for the adhesion of the EVL to the deep
cells [25].
Figure 2. Fish blastula. Prior to gastrulation, the deep cells are surrounded by the enveloping layer (EVL). The animal surface of the yolk cell contains the yolk syncytial layer (YSL). Microtubules extend through the yolk surface and cytoplasm (Adapted from [22]).

4
I.1.2. Involution
After epiboly covers 50% of the yolk cell, internalization movements begin.
Mesodermal and endodermal precursors accumulate at the marginal zone and move
inside via the blastoderm margin, creating the germ ring [23].
In the zebrafish gastrula, involution begins at the future dorsal region of the
embryo, where the organizer will form, and then rapidly spread around the entire
blastoderm margin. Once internalized, mesendodermal cells undergo an epithelial to
mesenchymal transition (EMT) but still move in a coordinated manner toward the
animal pole, forming an internal layer, the hypoblast, and an outer layer, the epiblast,
which continues to undergo epiboly [3, 23].
Once the hypoblast has formed, cells of the epiblast and hypoblast intercalate on
the future dorsal side of the embryo to form a localized thickening, the embryonic
shield. The embryonic shield is the fish organizer, since it can organize a secondary
embryonic axis when transplanted to a host embryo [3, 22, 23].
I.1.3. Convergence and extension movements
Convergence and extension (CE) movements begin simultaneously with those of
involution, at 50% epiboly. Convergence movements narrow the medio-lateral axis
while extension movements elongate the rostro-caudal axis of the vertebrate body [3,
5].
Along the dorso-ventral (DV) axis of the germ ring, different mesoderm
compartments exist, and different degrees of convergence and extension behaviors
can be observed (Figure 3). At the most ventral region, the mesodermal cells do not
participate in CE movements, but rather migrate toward the vegetal pole where they
contribute to the tailbud [9]. In the lateral domain of the germ ring, cells show directed
migration, and CE movements are initially slow, but then accelerate as cells move
closer to the dorsal midline [6]. The axio-lateral domains of the germ ring exhibit
modest CE rates, and different driving forces are responsible for CE movements, such
as directed cell migration, medial intercalation, polarized radial intercalation and
oriented cell division. Finally, in the most dorsal domain, the prospective axial
5
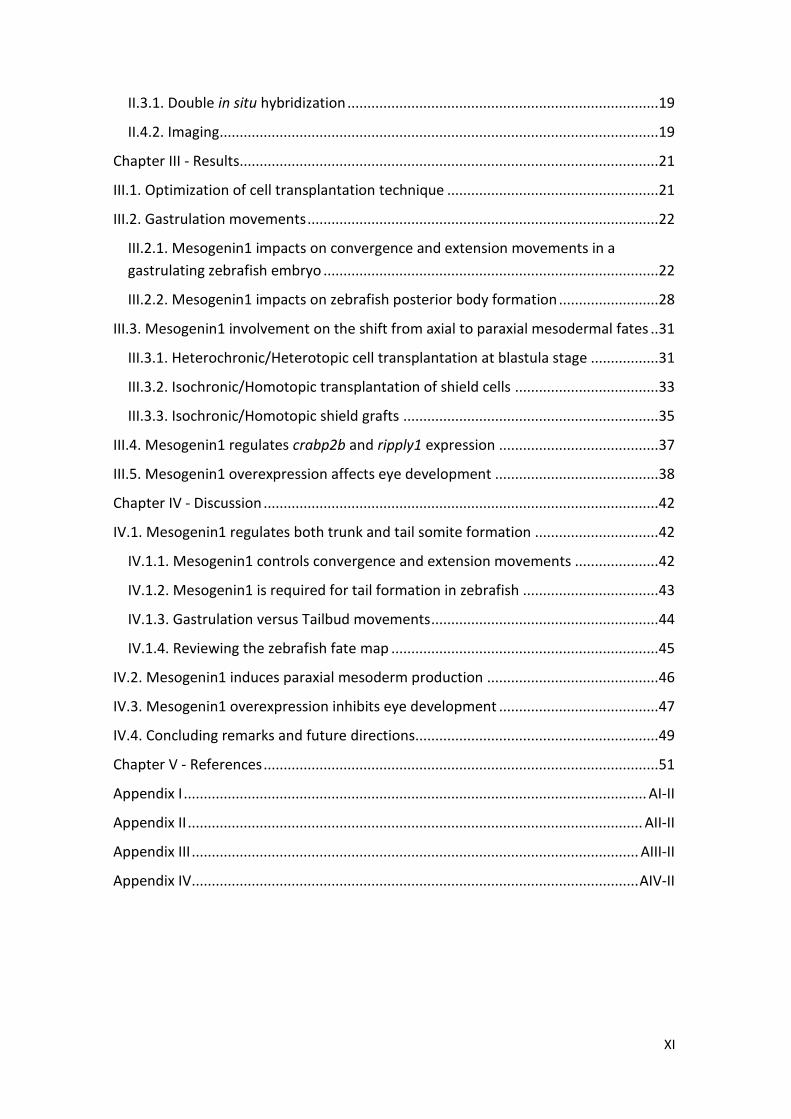
mesoderm shows modest convergence and fast extension movements. Here, the main
driving forces are directed cell migration and medio-lateral intercalation [5]. These
intercalation movements are crucial for body axis elongation, and CE movements are
responsible for bringing the mesoderm progenitor cells (MPCs) to the segmental plate,
where they will contribute to trunk somites [26].
Figure 3. Domains of convergent extension (CE) movements in the mesoderm of zebrafish gastrulae. I–Ventral domain: cells migrate toward the vegetal pole without contributing to CE; II/III–Lateral domain: CE at increasing rates, slow (II) and fast (III); IV–Axio-lateral domain: modest CE movements; V–Axial domain: Fast E and modest C movements; A, anterior; P, posterior; D, dorsal; V, ventral (Adapted from [5]).
I.2. Specification of trunk and tail somites in zebrafish
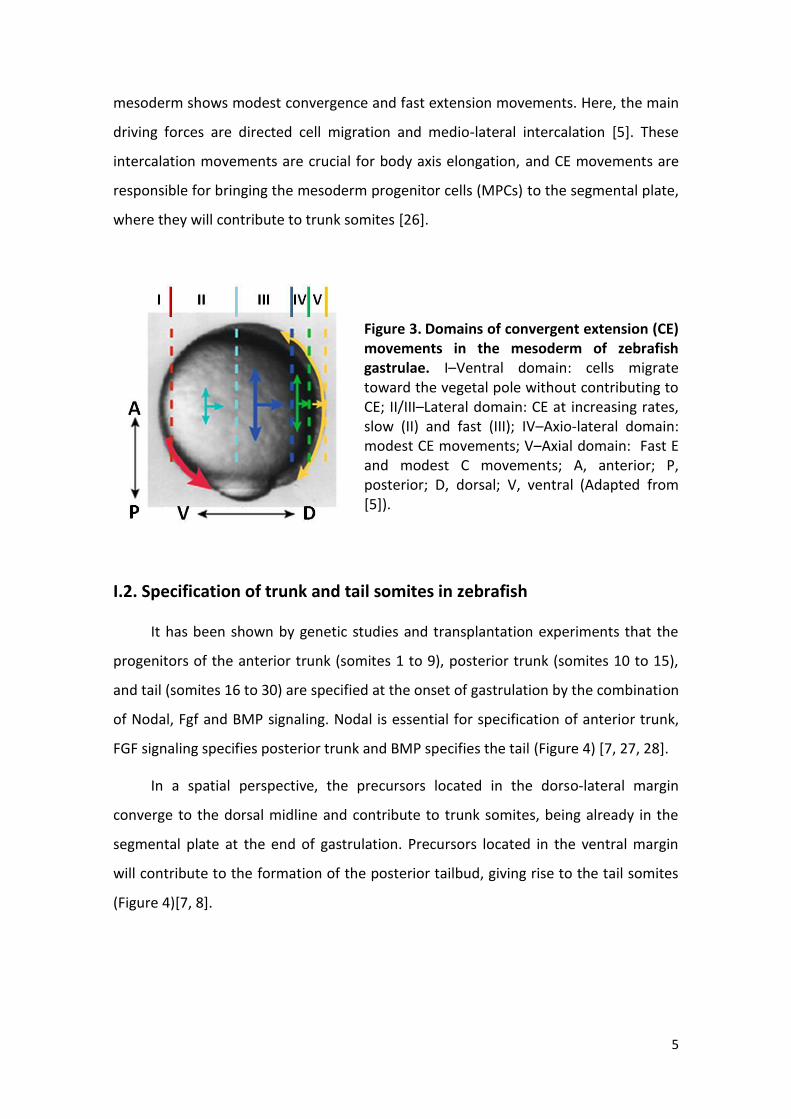
It has been shown by genetic studies and transplantation experiments that the
progenitors of the anterior trunk (somites 1 to 9), posterior trunk (somites 10 to 15),
and tail (somites 16 to 30) are specified at the onset of gastrulation by the combination
of Nodal, Fgf and BMP signaling. Nodal is essential for specification of anterior trunk,
FGF signaling specifies posterior trunk and BMP specifies the tail (Figure 4) [7, 27, 28].
In a spatial perspective, the precursors located in the dorso-lateral margin
converge to the dorsal midline and contribute to trunk somites, being already in the
segmental plate at the end of gastrulation. Precursors located in the ventral margin
will contribute to the formation of the posterior tailbud, giving rise to the tail somites
(Figure 4)[7, 8].
6
Figure 4. Specification of trunk and tail mesoderm in the zebrafish. (A) By 5 hpf, the precursors for the anterior trunk, posterior trunk, and tail somites have been specified in response to Nodal, Nodal/Fgf, and Bmp ligands, respectively. (B) At 8 hpf, the anterior trunk and some of the posterior trunk MPCs converge toward the dorsal midline. The tail MPCs and some of the posterior trunk MPCs remain in a ventral-lateral position. (C) A 25 hpf embryo showing the anterior trunk somites in blue, posterior trunk somites in green and tail somites in yellow. In A and B, dorsal is right and ventral is Left. In C, anterior is left and posterior is right (Adapted from [7]).
I.3. Somitogenesis
At the end of gastrulation, about 10 hours post-fertilization (hpf), the basic body
plan of the organism is established and the segmentation period begins. In
vertebrates, it is at this stage that somites are formed, by a process called
somitogenesis [10]. Somites are bilaterally paired blocks of mesoderm that form in a
sequential and rhythmic manner from the presomitic mesoderm (PSM) in an anterior
to posterior direction, and they give rise to the skeletal muscles, the axial skeleton and
the dermis of the back [22].
The formation of somites is tightly controlled in time and space, such that its
periodicity and the final number of somites formed is species-specific. In the case of
zebrafish, every 30 minutes a new pair of somites will form from the anterior-most end
of the PSM (at 28°C), reaching a total number of 30-32 pairs [29].
Cells from the anterior PSM undergo a MET to originate a somite at the same
time that MPCs in the tailbud feed new cells to the posterior PSM [8]. The

7
maintenance of MPCs is essential for the normal and complete development of the
vertebrate body, since a premature exhaustion of these progenitors results in
premature extinction of the PSM, a deficit of posterior somites, and therefore a
truncated body [12]. Also, the rate at which cells differentiate and move from the
tailbud into the PSM must be controlled to ensure that the correct somite number is
reached [12, 30, 31].
I.3.1. Tailbud formation
At the end of gastrulation, aggregation of marginal cells establishes the tailbud,
which comprises cells deriving from the dorsal organizer as well as ventral marginal
cells. Later in development, cells originating from the dorsal organizer will contribute
to the prechordal plate, notochord, hypochord and floor plate (the ventral neural
tube), whereas the gastrula ventral margin will give rise to non-axial tissues, including
the tail somites [31, 32].
The tailbud can be divided into two regions: the progenitor zone (PZ), in the
dorsal tailbud region and the maturation zone (MZ), in the ventral tailbud region
(Figure 5) [8].
Figure 5. Presomitic mesoderm and tailbud regions. MPCs in the progenitor zone (PZ) initially move to the maturation zone (MZ), which feed the posterior PSM with new cells. As cells go through the differentiation cascade, they move to the anterior PSM which segments into somites as the embryo develops. Lateral view; posterior to the right; dorsal to the top (Figure kindly provided by Rita Fior).

8
I.3.2. Cell movements in the tailbud
Cells originating from the ventral side of the embryo make up the posterior half
of the tailbud, while the dorsal-derived cells constitute the anterior half. The posterior
tailbud domain is composed of ventral-derived cells, and it is restricted to paraxial
mesodermal fates. Furthermore, the spinal cord and notochord are exclusively derived
from the anterior half of the tailbud [15].
When ventral and dorsal-derived cells meet at the tailbud, the ventral-derived
cells undergo a “subduction” movement that places those cells beneath the epiblast
layer of the dorsal-derived cells. Thus, these cells assume positions in the hypoblast
layers of the extending tail, into domains destined for paraxial mesoderm
development (Figure 6A) [15].
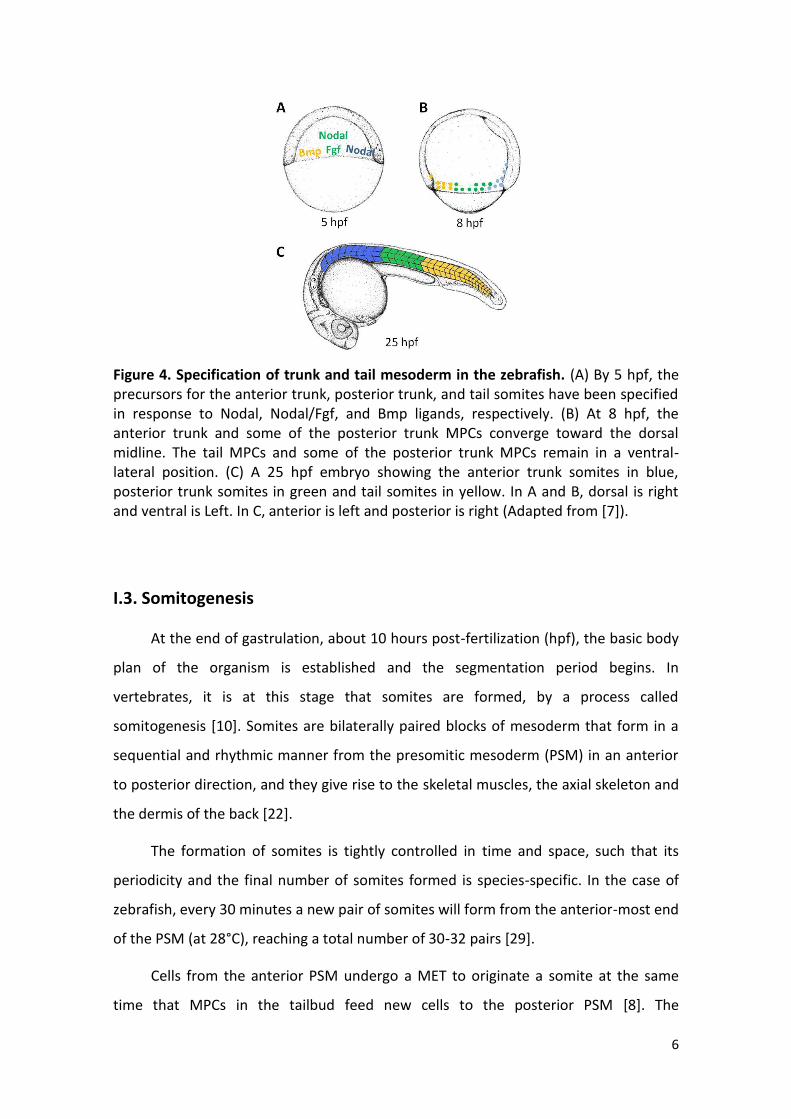
Once the tailbud is formed and tail extension begins, the majority of cells in the
posterior tailbud move laterally and ventrally around the extending cells of the
anterior tailbud, demonstrating divergent cell movements away from the midline,
where notochord will form. Cells in dorso-medial positions of the posterior tailbud
continue to move posteriorly, contributing to tail extension (Figure 6B) [15].
On the other hand, the anterior tailbud cells move posteriorly, and some
superficial cells move ventro-laterally into the deeper hypoblast throughout tail
extension. These cells join the posterior tailbud cells and together contribute to
paraxial mesoderm along the entire extent of the developed tail. Thus any given
somite within the tail could contain cells originating from both anterior and posterior
halves of the tailbud (Figure 6B) [15].
Finally, convergence movements into dorso-medial regions are also observed in
some cells in lateral positions, causing cells to potentially travel further caudal, also
contributing to tail extension (Figure 6B) [15].
9
Figure 6 Summary of tailbud cell movements. (A) The fusion of the blastoderm margin over the yolk plug during tailbud formation. The top drawing shows a lateral view of the late gastrula embryo with the vegetal pole downwards. The middle drawing shows the tailbud after blastopore closure. The blue color indicates cells from the dorsal side of the embryo, while the pink color indicates the ventral-derived cells. The lower drawing shows cell movements within the newly formed tailbud. (B) The general movements of cells in dorsal view of the tailbud during its extension. Posterior is downwards (Adapted from [15]).
I.3.3. From the tailbud to the PSM: time-line markers
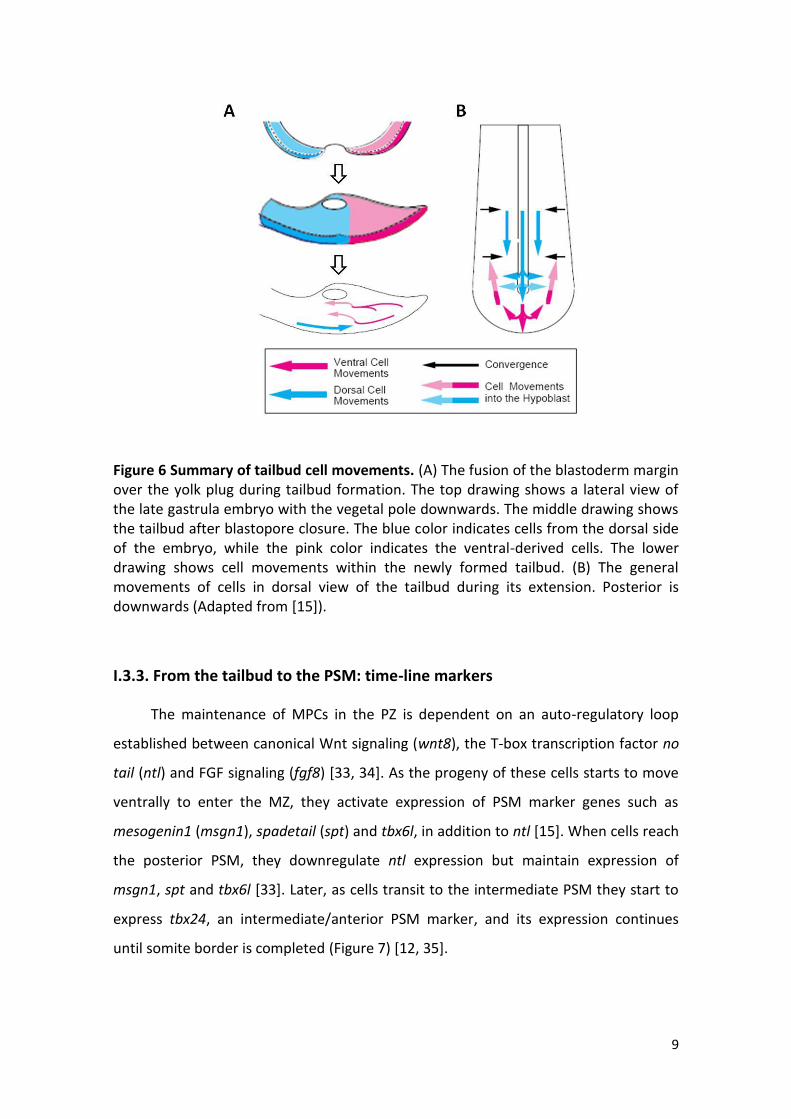
The maintenance of MPCs in the PZ is dependent on an auto-regulatory loop
established between canonical Wnt signaling (wnt8), the T-box transcription factor no
tail (ntl) and FGF signaling (fgf8) [33, 34]. As the progeny of these cells starts to move
ventrally to enter the MZ, they activate expression of PSM marker genes such as
mesogenin1 (msgn1), spadetail (spt) and tbx6l, in addition to ntl [15]. When cells reach
the posterior PSM, they downregulate ntl expression but maintain expression of
msgn1, spt and tbx6l [33]. Later, as cells transit to the intermediate PSM they start to
express tbx24, an intermediate/anterior PSM marker, and its expression continues
until somite border is completed (Figure 7) [12, 35].

10
Figure 7. PSM time-line markers. (A) Schematic representation of a 16hpf embryo in a lateral (left) and dorsal (right) view. PSM domains and correspondent gene expression are indicated. Somites are represented in blue, PSM in yellow and tailbud in orange/red. (B) Signals and pathways involved in MPCs maintenance and differentiation. Progenitor cells in the tailbud are maintained by a positive-feedback loop between wnt, ntl and fgf. These genes activate the expression of msgn1 and spt which switches off wnt/ntl/fgf expression, allowing cells to progress along the PSM differentiation pathway and activate tbx24 (Adapted from Lara Carvalho’s master thesis).
I.4. Mesogenin1 is required for paraxial mesoderm production
To progress into the PSM, progenitor cells must downregulate progenitor
markers like ntl and wnt8. Some studies have shown that Msgn1, and probably Spt as
well, are involved in the termination of ntl/wnt auto-regulatory loop [11, 12].
In mouse, it has been shown that Msgn1, a basic helix-loop-helix transcription
factor, is essential for proper maturation and segmentation of posterior paraxial
mesoderm. Mouse embryos lacking Msgn1 have impaired development of their
posterior somites, showing at the same time an enlarged tailbud with an abnormal
accumulation of MPCs [36, 37].
In zebrafish, msgn1 is expressed in the tailbud, in a similar domain to that in
mouse, but it shows a milder phenotype [13, 14, 36]. In the absence of Msgn1,
ntl/wnt-positive progenitor cells are retained in the tailbud, although somites continue

11
to be formed. Actually, msgn1 mutants form on average an extra pair of somites and
somites are on average 15% smaller than in wild-types, which corroborates the
hypothesis that cells are being recruited from the tailbud into the PSM at a reduced
rate during formation of tail somites. The mildness of msgn1-/- phenotype is not due to
a maternal contribution, and although it could be due to a second msgn gene, there is
no evidence for such gene duplication [12].
However, combined loss of msgn1 and spt leads to complete failure of trunk and
tail somite formation accompanied by an accumulation of ntl-expressing cells in the
tailbud. These results reveal that spt and msgn1 act redundantly in tail somite
formation in zebrafish, since either gene alone is sufficient to support the tail process
[11, 12, 33].
Furthermore, using an inducible msgn1 transgenic line, it was shown that Msgn1
promotes PSM differentiation by negatively regulating the wnt/ntl/fgf loop, allowing
activation of tbx24, required to convert cells from a tailbud progenitor state into a PSM
state [11, 12]. Moreover, overexpressing msgn1 by mRNA injection at one-cell stage
causes a severe truncation of tail structure, loss of tailbud and disrupts notochord
structure [11, 12].
Additionally, Msgn1 drives not only the differentiation but also the migration of
cells out of the tailbud into the PSM region, since in the absence of Msgn1 the ventral
diving movement of tailbud cells is largely suppressed [12]. Therefore, Msgn1 helps
controlling both the size of somites and the persistence of the progenitor cell
population [12].
I.4.1. The role of Mesogenin1 during zebrafish gastrulation
The transcription factor msgn1 is not only expressed in the tailbud during
somitogenesis, but it is also expressed during gastrulation in the marginal zone of the
blastoderm, excluding the prospective shield [13, 14]. Studies in the mouse embryo
suggested that the first effect of Msgn1 could be on cell migration during gastrulation,
leading to all subsequent defects. Since migration of mesodermal cells is not globally
defective, this migratory defect could be specific and autonomous to presumptive
12
paraxial mesoderm [36]. Work from our lab has shown that Msgn1 acts with Spt in
zebrafish. Since it is known that spt controls cell movement during gastrulation [38-
40], it becomes very plausible that Msgn1 is also controlling cell movements during
this developmental stage.
I.5. Aims
Since msgn1 is expressed in the margin region of the gastrula and later in the
tailbud, i.e. in domains of paraxial MPCs, and since it is thought to control their
movement in the tailbud, the main goal of this work is to understand how msgn1 levels
modulate the movement of MPCs during gastrulation and tail extension in zebrafish, in
order to form trunk and tail somites respectively.
Another goal is to test the best approach to investigate if cells that are destined
to become notochord change their fate to paraxial mesoderm when they overexpress
msgn1, since an overall overexpression of this gene disrupt the structure of the
notochord.
Finally, the last goal of this work is to determine the molecular mechanisms that
operate under the action of msgn1, validating some target genes that could be
involved in paraxial mesoderm production.

13
CHAPTER II
Materials and Methods
14
CHAPTER II - MATERIALS AND METHODS
II.1. Zebrafish lines
In this work four distinct lines were used, two wild-type lines, AB and Tübingen, a
msgn1 mutant line and a transgenic line expressing msgn1 under the heat-shock hsp70
promoter.
The msgn1 mutant line (msgn1fh273), found by screening ENU mutagenised F1
fish [41], has a Q92 point mutation coding for a stop codon instead of a glutamine,
causing a non-functional truncated protein [12].
The transgenic line hsp70:HA-msgn1 allows time-specific over-expression of
msgn1 upon heat-shock. This line also has an enhanced cyan fluorescent protein
associated with γ-crystalin promoter from Xenopus, allowing easy identification of
transgenic individuals [12].
II.1.1. Identification of mesogenin1 mutants
Previously identified heterozygous mutants had been crossed to generate
homozygous mutants and wild-type siblings. To identify the progeny, all individuals
were genotyped (see Appendix I).
II.1.2. Transgenic fish identification
Previously identified transgenic fish had been crossed to generate individuals
with two copies of the transgene. Thus it would be possible to cross those individuals
with wild-types to make sure all progeny has one copy of the transgene. To select
transgenic fish from the progeny, individuals with cyan fluorescent eyes were
identified and then crossed with wild-types. If its progeny had about 50% cyan
fluorescent eyes after 3 days post-fertilization (dpf), the transgenic would only have
one copy of the transgene. On the other hand, if the progeny had about 100%
fluorescent eyes, the progenitor would have two copies of the transgene. Those
individuals were separated and raised in independent tanks at 28°C.
15
II.2. Embryo manipulations
II.2.1. Embryo collection
Zebrafish embryos were raised in embryo water until the transplantation
moment, when they were transferred to 1X Transplant medium supplemented with
1% penicillin/streptomycin. Embryos were always raised at 28°C except when heat-
shock treatment was needed. To overexpress msgn1 in the hsp70:HA-msgn1 line,
embryos were heat-shocked at 30% epiboly for 40 minutes at 39ºC, as well as wild-
type control embryos. In those experiments, heat-shocked donor embryos were raised
at 25°C in order to increase the temperature range, improving the heat-shock
effectiveness.
Embryos were staged according to morphological criteria provided in Kimmel et
al., 1995 [1].
II.2.2. Embryo labeling
Donor embryos were labeled at 1-4 cell stage by micro-injection into the yolk cell
with 5% fluorescein-dextran or 2% rhodamine-dextran (Molecular Probes). Hosts were
not labeled. Injected embryos were kept in the dark as much as possible and cultured
at 25°C or 28°C in 2% agarose-coated petri dishes.
II.2.3. Double cell transplantation
Transplantation pipettes were pulled from 1 mm borosilicate glass capillaries
(World Precision Instruments) with an internal filament using the following program:
Heat =750; Pull =95; Velocity =60; Time =150; Pressure = 100 (Sutter Instrument P-87).
Pipettes were broken off to an inner diameter of 30-60 µm and loaded into a pipette
holder attached to CellTram vario (eppendorf), which was filled with mineral oil. The
pipettes were loaded avoiding any bubbles in the system. The pipette holder, carried
by a 3-axis micro-manipulator, was connected via a continuous column of mineral oil.
The oil was pushed until the pipette tip and then it was filled with some medium and
allowed to stabilize for a few minutes. Transplantation procedures were monitored
using a Leica MZ16F equipped with ultraviolet epillumination.

16
Cell transplantation was performed at room temperature in 1X Transplant
medium containing 1% penicillin/streptomycin. Chorions were removed shortly before
transplantation. Donor and host embryos were loaded into transplantation wells that
had been pre-formed with an acrylic mould in 2% agarose 1X Transplant medium
solution.
Six different experiments were performed using the double cell transplantation
technique. In the control experiment, cells from two different labeled wild-type donors
were transplanted into a wild-type host. In the second experiment, cells from a mutant
donor and a wild-type donor, with different labeling, were transplanted into a wild-
type host. Finally, cells from a transgenic donor and a wild-type donor, both heat-
shocked at 30% epiboly, were transplanted into a wild-type host. These experiments
were performed for two different regions, the ventral marginal zone and the lateral
marginal zone.
To transplant cells, shield stage embryos were oriented so that the
transplantation site faced the pipette tip and the transplantation pipette was placed
over the target site. Approaching the first labeled donor with the pipette tip, and
making some pressure, a small group of 5-10 cells was gently drawn up into the
transplantation pipette followed by another group of cells taken from a second,
different labeled donor embryo. With donor cells in the pipette, a small group of cells
at the same site was removed from host embryos. Host cells were discarded and donor
cells were pushed to the tip of the pipette, which was then placed over the little hole
in the host embryo, and cells were gently transferred into it.
Transplanted embryos were left in the transplantation well for several minutes
to recover and then transferred to 1X Transplant medium with 1%
penicillin/streptomycin on individual wells coated with 2% agarose 1X Transplant
medium for overnight culture at 28°C.
II.2.4. Single cell type transplantation
Additionally, two different experiments were performed using the single cell
type transplantation technique, which is similar to the former described except only
one donor was used for each transplant experiment.
17
In the first experiment, heterochronic transplants were performed at blastula
stage. Here, a group of 10-15 cells were taken from the animal pole of labeled wild-
type donor embryos at sphere stage (4 hpf) and transplanted to the marginal region of
wild-type host embryos at 1k-cell stage (3 hpf).
The second experiment was performed at shield stage embryos (donors and
hosts), and cells were transplanted into the shield region. In a first approach, cells from
a labeled wild-type donor, heat-shocked at 30% epiboly, were transplanted into a wild-
type host. In a second approach, cells from a labeled transgenic donor, heat-shocked
at 30% epiboly, were transplanted into a wild-type host.
II.2.5. Shield transplantation
Protocol for the whole shield transplantation follows the same steps as in cell
transplantation with some modifications. The transplantation pipettes used had an
inner diameter of 200 µm and a blunt tip (Biomedical instruments). To remove the
shield tissue, donor embryos were oriented such that the shield faced the pipette tip
and the transplantation pipette was placed over the shield. Shield tissue was gently
drawn in an out of the pipette a few times until the yolk cell and shield became
separated. Host’s shield was also removed and discarded, and the donor shield was
pushed to the pipette tip, which was placed over the hole in the host embryo. The
donor shield was gently expelled into the host.
II.2.6. Fluorescence Imaging
At shield stage, embryos were analyzed using the fluorescence
stereomicroscope Olympus MVX10, equipped with a Zeiss AxioCam ICc3 digital
camera. Images were processed using the Zen 2011 and Image J software.
At 1 dpf (24-37 hpf), transplanted embryos were anesthetized in 1X Tricaine
and analyzed using the widefield fluorescence microscope Leica DM5000B, equipped
with a Leica DFC350F digital camera. Images were processed using the Adobe
Photoshop and Image J software.
18
II.2.7. Analysis of transplanted embryos
For each double cell transplanted embryo, the distribution of the two cell types
throughout the somites was evaluated. Subsequently, the frequency of each cell type
in each somite was generated based on all analyzed embryos, in Excel 2007. Finally,
both distributions were analyzed with the Mann–Whitney U test on IBM SPSS Statistics
20. This is a non-parametric test of the null hypothesis that two populations are the
same against an alternative hypothesis, and it has greater efficiency than the t-test on
non-normal distributions.
In single cell and whole shield transplantation experiments, only the fate of
donor cells was analyzed.
II.3. In situ hybridization
Whole-mount in situ hybridizations were performed essentially as described by
Thisse and Thisse [42], using crabp2b and ripply1 RNA probes (see RNA probe synthesis
in Appendix II). Embryos fixed with 4% paraformaldehyde/PBS at 4°C were dehydrated
with methanol at -20°C and rehydrated by successive incubations for 5 minutes each in
75% methanol/PBT; 50% methanol/PBT; 25% methanol/PBT and then 4 times 5
minutes in 100% PBT. Embryos at 12 somite stage were digested with proteinase K (10
µg/ml) for 3 minutes (embryos at bud stage pass this step). Embryos were refixed in
4% paraformaldehyde for 20 minutes at RT and then washed in PBT 5 times 5 minutes.
They were then transferred to hybridization buffer for 2-5 hours at 70°C. The
hybridization buffer (Hyb) was then replaced with the mixture containing the
Digoxigenin (DIG) or Fluorescein (Fluo)-labelled RNA probe in 200 µl of preheated Hyb
solution with 500 µg/ml type VI torula yeast RNA and 50 µg/ml heparin added (probe
concentrations on Appendix II, Table 2), and embryos were incubated at 70°C
overnight. Washes were done at 70°C with preheated solutions for 15 minutes each
with 75% Hyb/2X SSC; 50% Hyb/2X SSC; 25% Hyb/2X SSC; 100% 2X SSC and finally 2
times 30 minutes in 0,2X SSC. A series of 10 minutes washes were performed at RT in
75% 0,2X SSC/PBT; 50% 0,2X SSC/PBT; 25% 0,2X SSC/PBT and 100% PBT. Embryos were
blocked in 2 mg/ml BSA, 2% sheep serum in PBT for at least 2 hours. Then they were
incubated with alkaline-phosphatase-conjugated anti-DIG Fab fragments (Roche)

19
diluted 1:5000 in 2mg/ml BSA, 2% sheep serum in PBT at 4°C overnight. After washing
at least 8 times for 15 minutes with PBT, embryos were rinsed 3 times 5 minutes in
NTMT reaction buffer. Detection was performed using BM Purple (Roche). After
stopping the reaction with 100% PBT, embryos were refixed in 4%
paraformaldehyde/PBS. Embryos were cleared with 20% glycerol/80% PBT, 50%
glycerol/50% PBT and stored at 4°C in 80% glycerol/20% PBT.
II.3.1. Double in situ hybridization
In situ hybridization for hgg-1, ntl and dlx3 probes mix is performed as described
in II.3 until antibody incubation (see RNA probe synthesis in Appendix II). Instead of
incubate with alkaline-phosphatase-conjugated anti-DIG, embryos were first incubated
with anti-Fluorescein Fab fragments (Roche) diluted 1:10000 in 2mg/ml BSA, 2% sheep
serum in PBT at 4°C overnight. After washing at least 8 times for 15 minutes with PBT,
the embryos were rinsed 3 times 5 minutes in 0,1M Tris-HCl pH8. Detection was
performed using Fast Red (one Fast Red tablet is dissolved in 2 ml 0.1 M Tris pH8 and
0,4M NaCl). After stopping the reaction with 100% PBT, embryos were refixed 20
minutes in 4% paraformaldehyde/PBS and washed again on PBT. Then they were
placed in 0,1M Glycine pH2,2 and 0,1% Tween 20 (pH adjusted with HCl) for 15
minutes with agitation and then washed in TBST 2 times 5 minutes at RT, and in TBST
at 70°C for 30 minutes. After washing with PBT 2 times, embryos were blocked and
incubated overnight at 4°C with alkaline-phosphatase-conjugated anti-DIG Fab
fragments as described in II.3 section. After washing in PBT 6 times 15 minutes,
embryos were washed in NTMT reaction buffer 3 times for 5 minutes. Detection was
performed using BM Purple and reaction was stopped as described in section II.3.
II.4.2. Imaging
Embryos were analyzed using the stereomicroscope Leica Z6APO, equipped with
a digital camera Leica DFC490. Images were processed using the Adobe Photoshop and
Image J software.

20
CHAPTER III
Results

21
CHAPTER III - RESULTS
III.1. Optimization of cell transplantation technique
In order to compare the movement behaviors of cells expressing different levels
of mesogenin1 in the same embryo we had to design and optimize a cell
transplantation technique. This technique involves some initial inherent difficulties. For
instance, it requires both operational ability to manipulate the embryos without
damaging them, and knowledge of the embryo morphology in order to take and place
cells in the same location consistently.
Other challenges related to the protocol optimization were harder to solve. First,
the chosen inner diameter of the glass pipette had to be a compromise between the
oil column stability, which decreases as the inner diameter decreases, the accuracy of
the location where cells are being transplanted, which increases as the inner diameter
decreases, and the number of cells we want to transplant, since with a small pipette it
is possible to transplant a few cells and with a larger one more cells are pulled out.
In isochronic experiments, it is important that donor and host embryos are at the
same developmental stage. Thus, another challenge was to synchronize the
development of wild-type hosts and the heat-shocked donors, since a long heat-shock
delays the development of the embryos. Furthermore, embryos injected with
rhodamine-dextran showed some delay as well in relation to fluorescein-dextran
injected embryos. To overcome these problems, host embryos were collected later
and then maintained at 25°C, while rhodamine-dextran injected embryos were
injected and incubated first than fluorescein-dextran injected embryos.
In short, this technique requires training time and experience before being
executed to its full potential.

22
III.2. Gastrulation movements
Data from our lab has shown that Mesogenin1 controls the movement of cells
leaving the tailbud [12]. Mesogenin1 is also expressed at earlier stages in the germ ring
of a zebrafish gastrula, raising the possibility that it could also control gastrulation
movements. In order to test this hypothesis, double cell transplantation experiments
were performed on shield stage embryos, since at this stage the DV axis is easily
recognized, allowing cells to be removed and placed consistently in the same region.
This experimental approach allowed us to describe the impact that different levels of
msgn1 expression have on the dynamics of gastrulation movements.
For each experiment, separate groups of cells from two distinctively labeled
donor embryos were co-transplanted into an unlabelled wild-type host. This design
permitted the direct and simultaneous comparisons of the movements and fates of
wild-type and msgn1 mutant cells or wild-type cells and cells overexpressing msgn1,
beginning their movements at exactly the same position. Combinations in which both
donors were wild-types served as controls. Only embryos where both cell types ended
in somites were considered.
III.2.1. Mesogenin1 impacts on convergence and extension movements in a
gastrulating zebrafish embryo
To ascertain if Mesogenin1 plays a role on CE movements during gastrulation,
cells were co-transplanted to the lateral margin region (Figure 8). Cells in this position
contribute essentially to trunk somites [7, 27].
When wild-type cells differently labeled were co-transplanted into the lateral
margin of wild-type host embryos, both cell types populated approximately the same
somites along the antero-posterior (AP) axis, from somite 1 to somite 20. In both
cases, cells contributed to somites 3 to 6 more than 40% of the time (n=21 embryos)
(Figure 9A-A’). According to the Mann-Whitney U test, both distributions are similar
(p=0.94).
When labeled wild-type and msgn1-/- cells were co-transplanted into the lateral
margin of wild-type host embryos, both cell types contributed approximately to the

23
same range of somites along the AP axis, from somite 1 to 21, although msgn1-/- cells
also contributed to an additional somite 22. Although both distributions are not
statistically different (p=0.47), the frequency of each cell type contribution varied
across AP somites. Wild-type cells contributed at least 30% of the cases to somites 2 to
5, while msgn1-/- cells contributed about 25% of the time to somites 4 to 11 (n=18
embryos) (Figure 9B-B’).
In contrast, labeled wild-type and hsp70:HA-msgn1 cells co-transplanted into the
lateral marginal zone of wild-type host embryos contributed to different ranges of
somites. At 1 dpf, wild-type cells were in somites 1 to 21, being at least 25% of the
cases on somites 4 to 7. On the other hand, hsp70:HA-msgn1 cells only contributed to
somites 1 to 12, being in more than 30% of the time on somites 3 to 5 (n=18 embryos)
(Figure 9C-C’). Even so, both distributions are not statistically different (p=0.36).
According to what has been described, cells transplanted into the lateral margin
of a shield stage embryo essentially contributed to trunk somites. However, depending
on msgn1 expression levels, the contribution frequency of each cell type varied along
the AP axis, suggesting that Mesogenin1 may be influencing the dynamics of cell
movements in the germ ring, thus affecting the trunk somites formation.
24
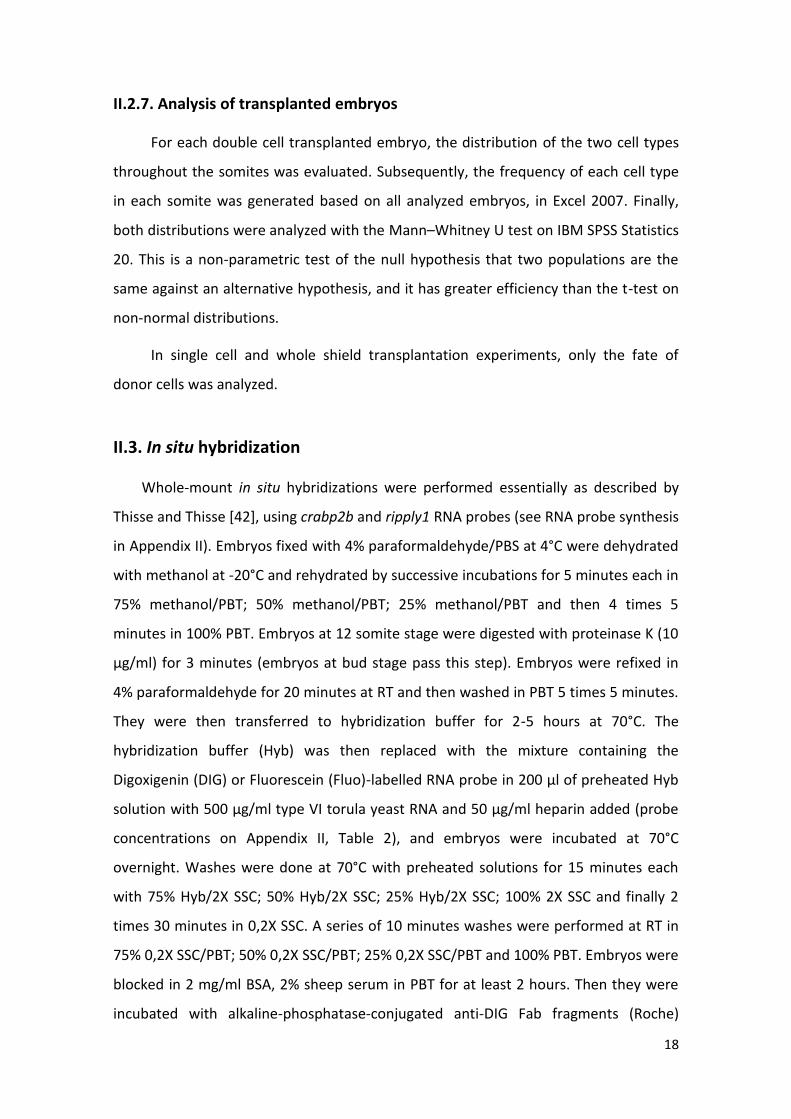
Figure 8. Methodology used to investigate the role of Mesogenin1 on convergence and extension movements during gastrulation. (A) Wild-type embryos or wild-type and msgn1-/- embryos were injected with fluorescein-dextran or rhodamine-dextran at one-cell stage and raised at 28°C. At shield stage, cells from the lateral margin of a wild-type and a wild-type or msgn1-/- embryos differently labeled were co-transplanted to the lateral margin of an unlabeled wild-type host embryo. Transplanted embryos were raised at 28°C, and images were recorded at bud stage and at 1 dpf. (B) Co-transplants of wild-type and hsp70:HA-msgn1 cells were performed as described above, except that donor embryos were heat-shocked at 30% epiboly for 40 minutes at 39°C and raised at 25°C.

25
Figure 9. Mesogenin1 controls the AP displacement of somite progenitor cells during gastrulation. (A) Graph showing the frequency at which different wild-type cells transplanted to the lateral margin at shield stage populate somites along the AP axis (n=21 embryos). (B) Graph showing the frequency at which wild-type cells (green bars) and msgn1-/- cells (red bars) transplanted to the lateral margin at shield stage populate somites along the AP axis (n=18 embryos). (C) Graph showing the frequency at which wild-type cells (green bars) and hsp70:HA-msgn1 cells (red bars) transplanted to the lateral margin at shield stage populate somites along the AP axis (n=18 embryos). (A’-C’) Representative embryos 1 dpf of A, B and C type of experiments, respectively. Green cells are wild-type (A’-C’) and red cells are either wild-type (A’), msgn1-/- (B’) or hsp70:HA-msgn1 (C’). Anterior to the left, dorsal to the top. Scale bars = 200 µm.
26
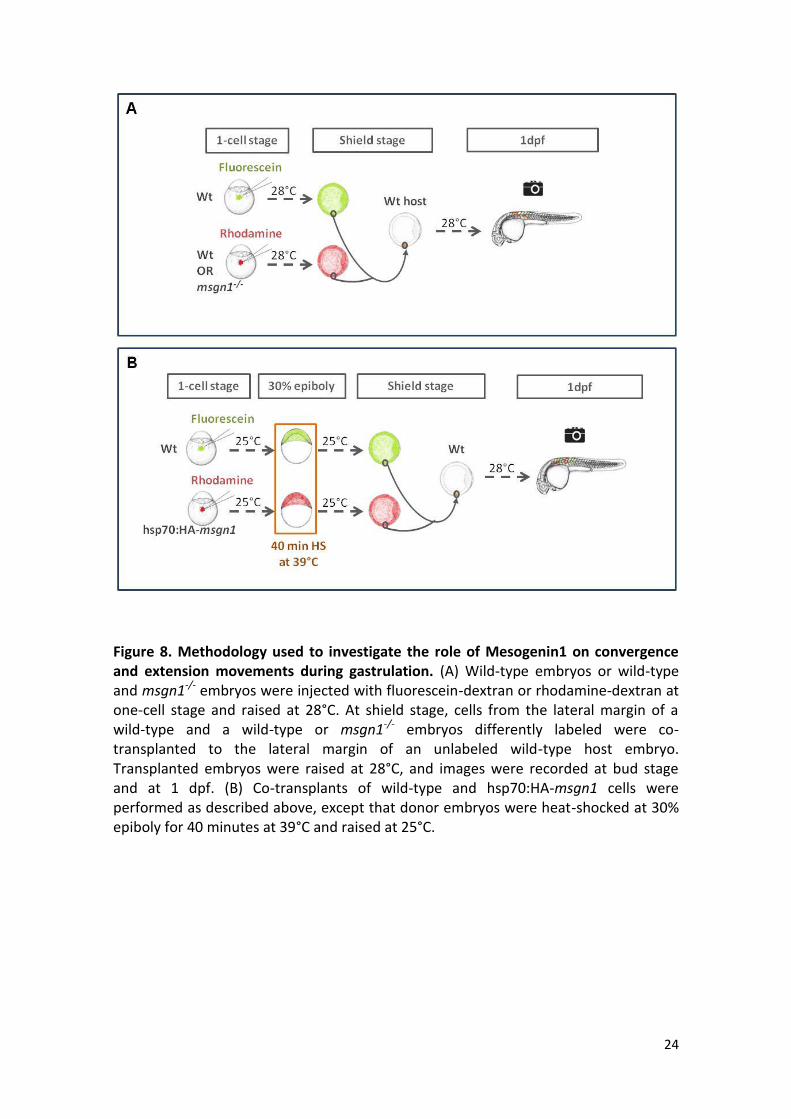
CE movements can also be evaluated by the position that axial mesoderm
occupies in relation to neural tissues. To perform this, double in situ hybridization
experiments were carried out with a series of well-characterized markers widely used
to study CE movements in wild-types, msgn1-/- and hsp70:HA-msgn1 embryos at bud
stage. These markers include dlx3 (distal-less homeobox gene 3), which labels the
borders of neural ectoderm, hgg1 (hatching gland gene-1) which marks the hatching
gland (the anterior-most end of the axial mesoderm), and ntl (no tail), which marks the
presumptive notochord [2]. In this approach, the shift of the hgg1 staining in relation
to the arc formed by dlx3 expression was analyzed, as well as the width of the neural
plate and the notochord.
In msgn1-/-embryos, hgg1 expression overlapped with dlx3 expression in the
anterior edges of the neural plate in 61% of the embryos as in wild-types (n=17
embryos) (Figure 3A). However, in 39% of msgn1-/- embryos, hgg1 expression was
positioned posteriorly with respect to dlx3 expression, suggesting that the anterior
displacement of the most anterior axial mesendodermal tissues was affected (n=18
embryos) (Figure 10B). In addition, expression of dlx3 showed that the neural plate
width was increased in msgn1-/- embryos (Figure 10B) and ntl expression was wider in
100% of the embryos compared to wild-types, again suggesting that the convergence
movements to the midline were indeed affected in the absence of msgn1 (Figure 10F
and G).
At the end of gastrulation, 75% of wild-type embryos that had been heat-
shocked at 39°C for 40 minutes at shield stage showed hgg1 expression overlapping
with dlx3 expression in the anterior edges of the neural plate, and in 25% it was
positioned anteriorly (n=16 embryos). Also, in 75% of the embryos, the neural plate
width was similar to non-heat-shocked wild-type embryos (Figure 10C) and in 25% it
was narrower. On the other hand, 81% of hsp70:HA-msgn1 embryos, heat-shocked
under the same conditions, showed a slight advance of hgg1 expression in relation to
dlx3 expression, and only 19% showed an overlapping expression of both genes (n=19
embryos). Besides, when msgn1 was overexpressed, 69% of the embryos showed a
narrower neural plate (Figure 10D), whereas in 31% it was similar to wild-type
27
embryos. Finally, 42% had a slightly narrower notochord, compared to heat-shocked
wild-type embryos (Figure 10H and I).
Taking together, these results suggest that Mesogenin1 regulates CE movements
during gastrulation, controlling the progression of the MPCs along the AP axis.
Figure 10. Mesogenin1 regulates convergence and extension movements during gastrulation. (A-D) Position and shape of the hatching gland, marked by the expression of hgg1, relative to the anterior edge of the neural plate, outlined by the expression of dlx3 in msgn1-/- (B) and wild-type (A) embryos, and in hsp70:HA-msgn1 (D) and wild-type (C) embryos heat-shocked at shield stage. (F–I) Width of the notochord, marked by ntl expression in msgn1-/- (G) and wild-type (F) embryos, and in hsp70:HA-msgn1 (I) and wild-type (H) embryos heat-shocked at shield stage. (E, J) Drawings of a normal embryo indicating the relative patterns of hgg1 (red), dlx3 (blue) and ntl (red). (A-E) Animal views, anterior to the left. (F-J) Dorsal views, anterior to the top.

28
III.2.2. Mesogenin1 impacts on zebrafish posterior body formation
To determine if Mesogenin1 is also involved in tail somite formation, cells were
co-transplanted to the ventral margin region (Figure 11). Cells in this position
essentially contribute to the tailbud, and later will make the posterior trunk and tail
somites.
When differently labeled wild-type cells were co-transplanted into the lateral
margin region of wild-type host embryos, both cell types populated approximately the
same somites, from 11 to 28, and to the PSM, contributing to somites 16-21 at least in
35% of the embryos (n=19 embryos) (Figure 12A-A’). According to the Mann-Whitney
U test, both distributions are similar (p=0.91).
When labeled wild-type and msgn1-/- cells were co-transplanted into the ventral
margin of wild-type host embryos, wild-type cells contributed to somites 12 to 30, and
at least in 50% of analyzed embryos they contributed to somites 17 to 21. Although
both distributions are not statistically different (p=0.97), msgn1-/- cells only
contributed to somites 15 to 30, and at least in 35% of cases to somites 17 to 29 (n=18
embryos) (Figure 12B-B’).
Labeled wild-type and hsp70:HA-msgn1 cells co-transplanted into the lateral
margin of wild-type host embryos also contributed to different ranges of somites, and
still both distributions were not considered statistically different (p=0.18). At 1 dpf,
wild-type cells were in somites 12 to 30, being at least in 50% of the embryos on
somites 19 to 21. In contrast, cells overexpressing msgn1 only contributed to somites
12 to 24, being at least in 40% of cases on somites 16 to 20 (n=22 embryos) (Figure
12C-C’).
According to what has been described, cells transplanted into the ventral margin
of a shield stage embryo contributed essentially to tail somites. However, modulation
of msgn1 expression levels changed the contribution frequency of each cell type across
the AP axis, suggesting that Mesogenin1 may be influencing the dynamics of cell
movements in the tailbud, thus affecting the tail somites formation.

29
Figure 11. Methodology used to investigate the role of Mesogenin1 on posterior body development. (A) Wild-type embryos or wild-type and msgn1-/- embryos were injected with fluorescein-dextran or rhodamine-dextran at one-cell stage and raised at 28°C. At shield stage, cells from the ventral margin of a wild-type and a wild-type or msgn1-/- embryos differently labeled were co-transplanted to the ventral margin of an unlabeled wild-type host embryo. Transplanted embryos were raised at 28°C, and images were recorded at bud stage and at 1 dpf. (B) Co-transplants of wild-type and hsp70:HA-msgn1 cells were performed as described above, except that donor embryos were heat-shocked at 30% epiboly for 40 minutes at 39°C. In this case embryos were raised at 25°C.

30
Figure 12. Mesogenin1 regulates posterior body development. (A) Graph showing the frequency at which differently labeled wild-type cells transplanted to the ventral margin at shield stage populate somites along the AP axis (n=19 embryos). (B) Graph showing the frequency at which wild-type cells (green bars) and msgn1-/- cells (red bars) transplanted to the ventral margin at shield stage populate somites along the AP axis (n=18 embryos). (C) Graph showing the frequency at which wild-type cells (green bars) and hsp70:HA-msgn1 cells (red bars) transplanted to the ventral margin at shield stage populate somites along the AP axis (n=22 embryos). (A’-C’) Representative embryos 1 dpf of A, B and C type of experiments, respectively. Green cells are wild-type (A’-C’) and red cells are either wild-type (A’), msgn1-/- (B’) or hsp70:HA-msgn1 (C’). Posterior to the right, dorsal to the top. Scale bars = 200 µm.

31
III.3. Mesogenin1 involvement on the shift from axial to paraxial
mesodermal fates
Previous work from our lab has shown that overexpressing msgn1 in zebrafish at
different developmental stages during gastrulation and somitogenesis disrupts
notochord formation [12]. Taking this into account, it is possible that by
overexpressing msgn1 in notochord progenitor cells they could change their fate and
become somitic cells. In order to test this hypothesis, labeled hsp70:HA-msgn1 cells
from the notochord domain could be transplanted to the same region of an wild-type
host, and their fate determined. In this study, three different approaches were tested.
III.3.1. Heterochronic/Heterotopic cell transplantation at blastula stage
It was previously described that heterochronic transplants, from donor blastulas
that were approximately 2-3 cell divisions older than host embryos, increased by four-
fold the incidence of donor cells contributing to axial structures (floor plate, notochord
and hypochord in wild-types) [39, 43, 44]. Thus, a group of 10-15 cells were taken from
the animal pole of labeled wild-type donor embryos at sphere stage and transplanted
to the marginal region of wild-type host embryos at 1k-cell stage. The position of
labeled cells in host embryos were analyzed 1 dpf (Figure 13A).
In this experiment, wild-type cells transplanted from the animal pole of a sphere
stage donor to the marginal region of a 1k-cell stage wild-type host embryo,
contributed 20% to the floor plate, notochord and/or hypochord (Figure 13B-B’’), 47%
to muscle fibers (Figure 13C-C’’) and 33% contributed for both structures (n=15
embryos) (Figure 13D-D’’).
Since wild-type cells became muscle fibers with a high frequency and the goal
was to see if overexpressing msgn1 would change the axial fate (notochord) to a
paraxial fate (muscle cells), another approach was tested.

32
Figure 13. Heterochronic/Heterotopic transplants to the marginal region at blastula stage. (A) Wild-type embryos were injected with fluorescein-dextran at one-cell stage and raised at 28°C. At sphere stage, cells from the animal pole were transplanted to the marginal region of an unlabeled 1k-cell stage wild-type embryo. Transplanted embryos were raised at 28°C, and images were recorded at 1 dpf. Transplanted cells gave rise to the prechordal plate, notochord, hypochord and floor plate (B-B’’), to muscle fibers (C-C’’) or both (D-D’’). Scale bars = 200 µm.
33
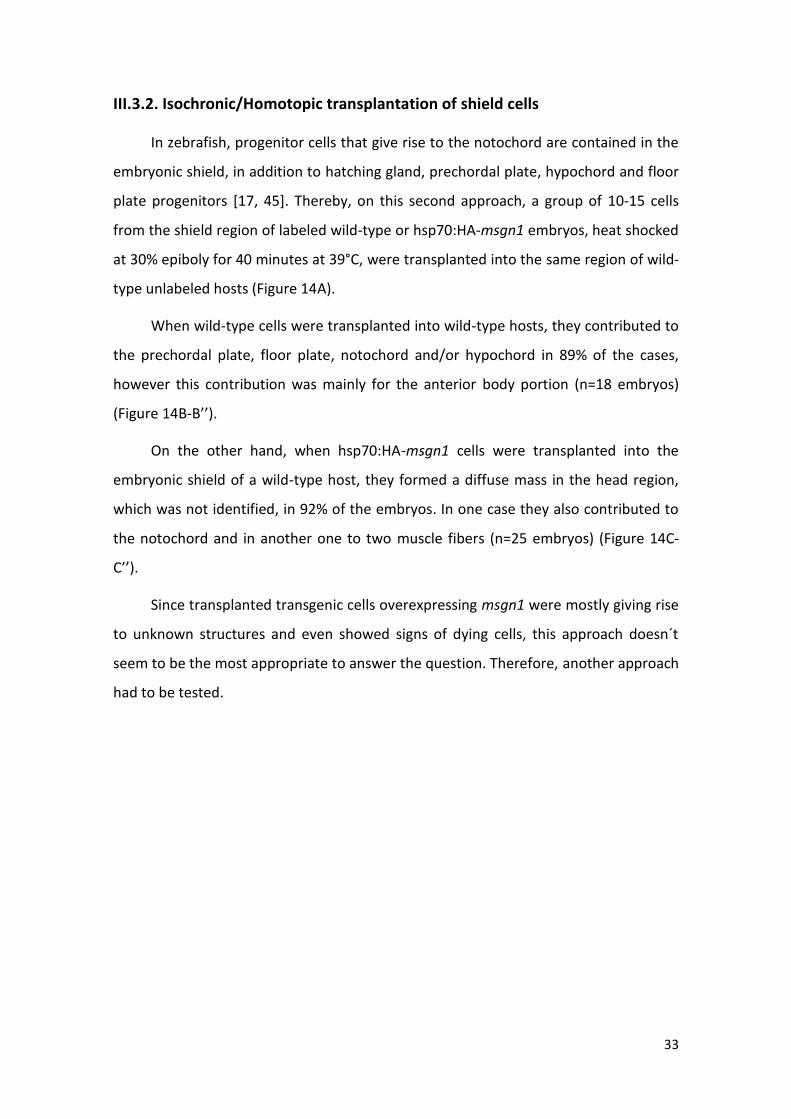
III.3.2. Isochronic/Homotopic transplantation of shield cells
In zebrafish, progenitor cells that give rise to the notochord are contained in the
embryonic shield, in addition to hatching gland, prechordal plate, hypochord and floor
plate progenitors [17, 45]. Thereby, on this second approach, a group of 10-15 cells
from the shield region of labeled wild-type or hsp70:HA-msgn1 embryos, heat shocked
at 30% epiboly for 40 minutes at 39°C, were transplanted into the same region of wild-
type unlabeled hosts (Figure 14A).
When wild-type cells were transplanted into wild-type hosts, they contributed to
the prechordal plate, floor plate, notochord and/or hypochord in 89% of the cases,
however this contribution was mainly for the anterior body portion (n=18 embryos)
(Figure 14B-B’’).
On the other hand, when hsp70:HA-msgn1 cells were transplanted into the
embryonic shield of a wild-type host, they formed a diffuse mass in the head region,
which was not identified, in 92% of the embryos. In one case they also contributed to
the notochord and in another one to two muscle fibers (n=25 embryos) (Figure 14C-
C’’).
Since transplanted transgenic cells overexpressing msgn1 were mostly giving rise
to unknown structures and even showed signs of dying cells, this approach doesn´t
seem to be the most appropriate to answer the question. Therefore, another approach
had to be tested.
34
Figure 14. Isochronic/homotopic transplants of shield cells. (A) Wild-type or hsp70:HA-msgn1 embryos were injected with fluorescein-dextran at one-cell stage and raised at 25°C. Donor embryos were heat-shocked at 30% epiboly for 40 minutes at 39°C. At shield stage, cells from the shield region were transplanted to the same region of an unlabeled wild-type host. Transplanted embryos were raised at 28°C, and images were recorded at 1 dpf. Wild-type transplanted cells contributed to the prechordal plate, notochord, hypochord and floor plate (B-B’’), while hsp70:HA-msgn1 transplanted cells were in the head region (C-C’’). Scale bars = 200 µm.
35
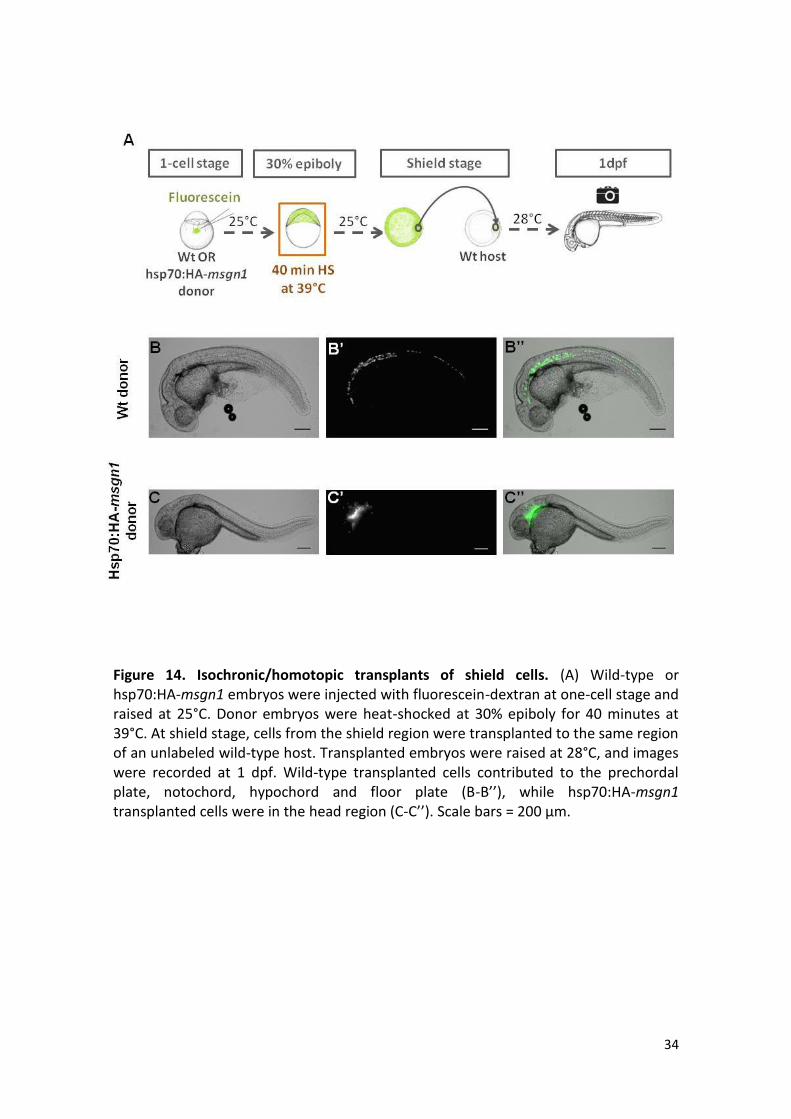
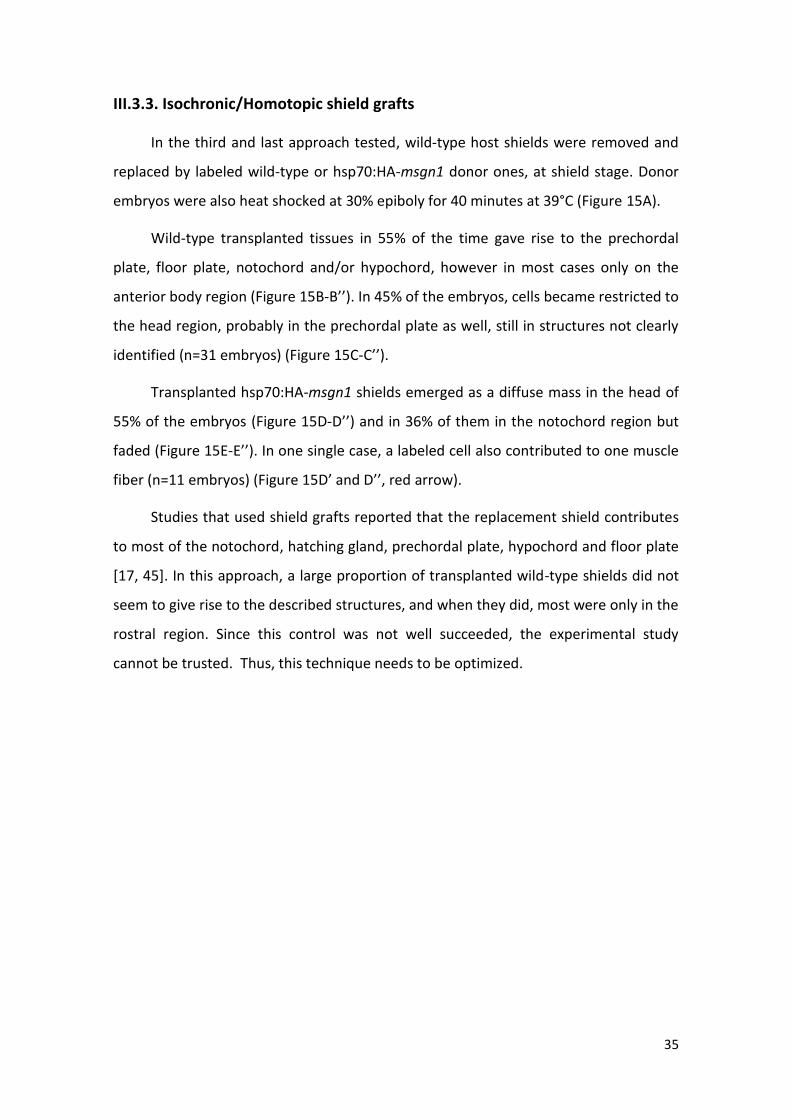
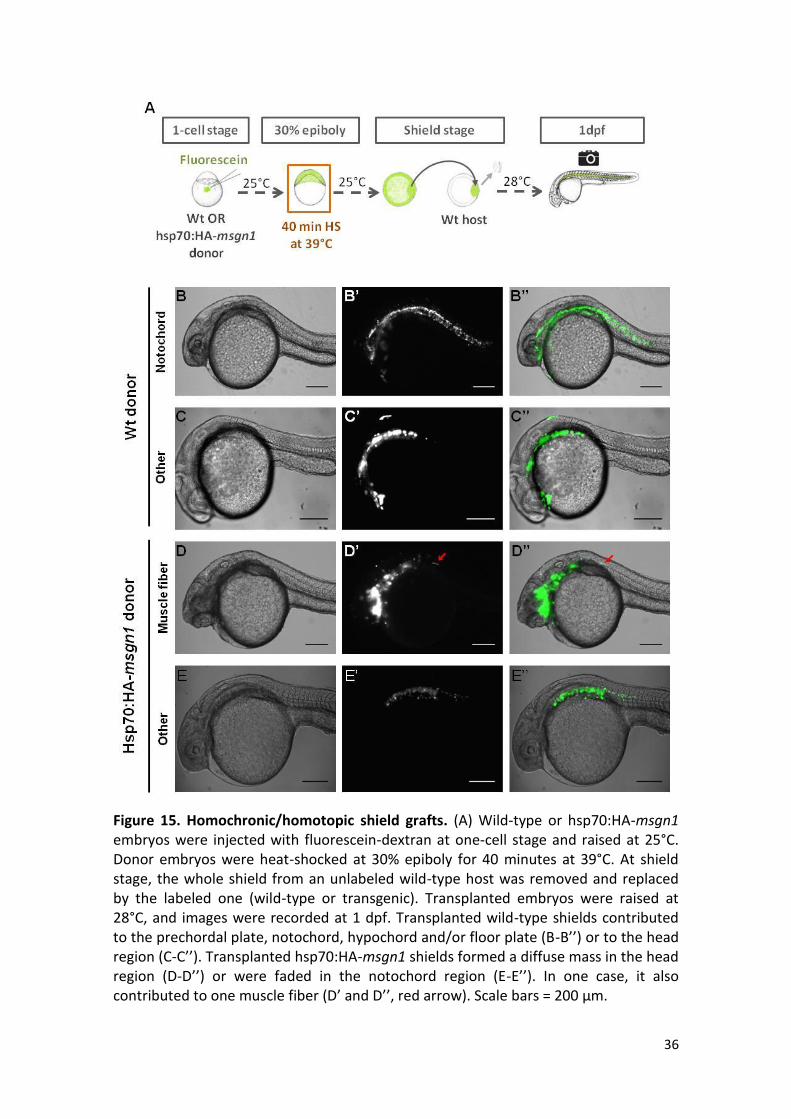
III.3.3. Isochronic/Homotopic shield grafts
In the third and last approach tested, wild-type host shields were removed and
replaced by labeled wild-type or hsp70:HA-msgn1 donor ones, at shield stage. Donor
embryos were also heat shocked at 30% epiboly for 40 minutes at 39°C (Figure 15A).
Wild-type transplanted tissues in 55% of the time gave rise to the prechordal
plate, floor plate, notochord and/or hypochord, however in most cases only on the
anterior body region (Figure 15B-B’’). In 45% of the embryos, cells became restricted to
the head region, probably in the prechordal plate as well, still in structures not clearly
identified (n=31 embryos) (Figure 15C-C’’).
Transplanted hsp70:HA-msgn1 shields emerged as a diffuse mass in the head of
55% of the embryos (Figure 15D-D’’) and in 36% of them in the notochord region but
faded (Figure 15E-E’’). In one single case, a labeled cell also contributed to one muscle
fiber (n=11 embryos) (Figure 15D’ and D’’, red arrow).
Studies that used shield grafts reported that the replacement shield contributes
to most of the notochord, hatching gland, prechordal plate, hypochord and floor plate
[17, 45]. In this approach, a large proportion of transplanted wild-type shields did not
seem to give rise to the described structures, and when they did, most were only in the
rostral region. Since this control was not well succeeded, the experimental study
cannot be trusted. Thus, this technique needs to be optimized.
36
Figure 15. Homochronic/homotopic shield grafts. (A) Wild-type or hsp70:HA-msgn1 embryos were injected with fluorescein-dextran at one-cell stage and raised at 25°C. Donor embryos were heat-shocked at 30% epiboly for 40 minutes at 39°C. At shield stage, the whole shield from an unlabeled wild-type host was removed and replaced by the labeled one (wild-type or transgenic). Transplanted embryos were raised at 28°C, and images were recorded at 1 dpf. Transplanted wild-type shields contributed to the prechordal plate, notochord, hypochord and/or floor plate (B-B’’) or to the head region (C-C’’). Transplanted hsp70:HA-msgn1 shields formed a diffuse mass in the head region (D-D’’) or were faded in the notochord region (E-E’’). In one case, it also contributed to one muscle fiber (D’ and D’’, red arrow). Scale bars = 200 µm.
37
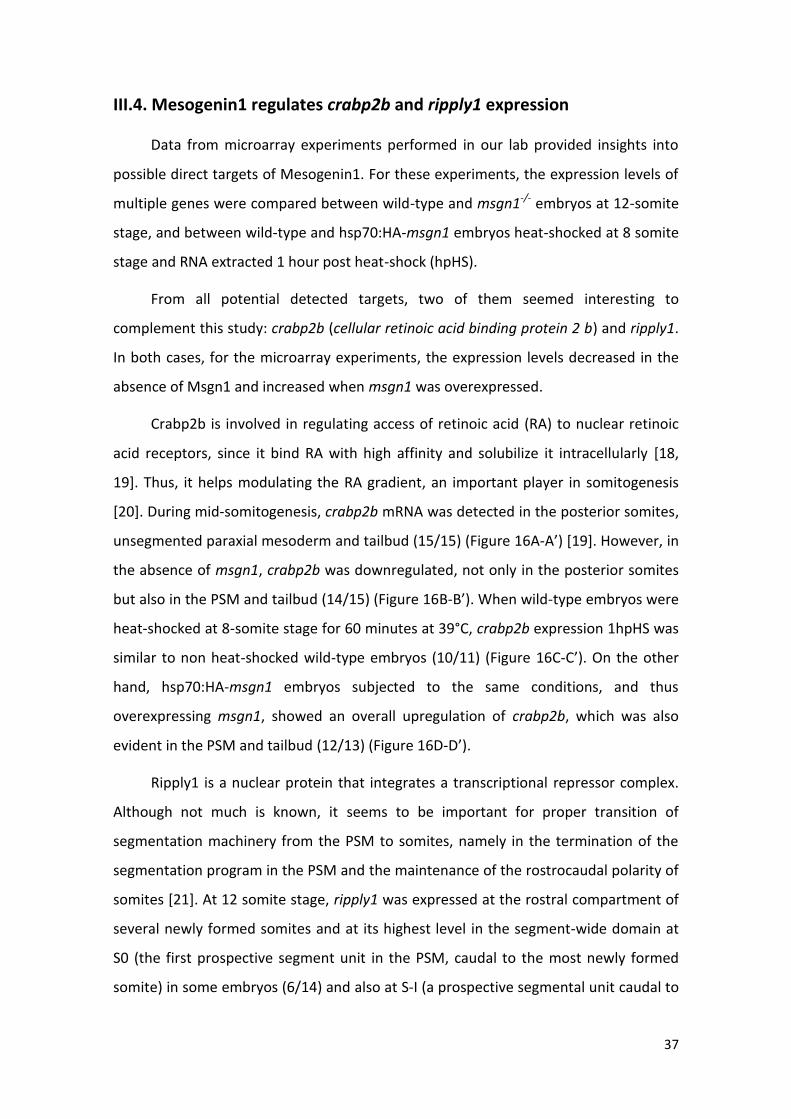
III.4. Mesogenin1 regulates crabp2b and ripply1 expression
Data from microarray experiments performed in our lab provided insights into
possible direct targets of Mesogenin1. For these experiments, the expression levels of
multiple genes were compared between wild-type and msgn1-/- embryos at 12-somite
stage, and between wild-type and hsp70:HA-msgn1 embryos heat-shocked at 8 somite
stage and RNA extracted 1 hour post heat-shock (hpHS).
From all potential detected targets, two of them seemed interesting to
complement this study: crabp2b (cellular retinoic acid binding protein 2 b) and ripply1.
In both cases, for the microarray experiments, the expression levels decreased in the
absence of Msgn1 and increased when msgn1 was overexpressed.
Crabp2b is involved in regulating access of retinoic acid (RA) to nuclear retinoic
acid receptors, since it bind RA with high affinity and solubilize it intracellularly [18,
19]. Thus, it helps modulating the RA gradient, an important player in somitogenesis
[20]. During mid-somitogenesis, crabp2b mRNA was detected in the posterior somites,
unsegmented paraxial mesoderm and tailbud (15/15) (Figure 16A-A’) [19]. However, in
the absence of msgn1, crabp2b was downregulated, not only in the posterior somites
but also in the PSM and tailbud (14/15) (Figure 16B-B’). When wild-type embryos were
heat-shocked at 8-somite stage for 60 minutes at 39°C, crabp2b expression 1hpHS was
similar to non heat-shocked wild-type embryos (10/11) (Figure 16C-C’). On the other
hand, hsp70:HA-msgn1 embryos subjected to the same conditions, and thus
overexpressing msgn1, showed an overall upregulation of crabp2b, which was also
evident in the PSM and tailbud (12/13) (Figure 16D-D’).
Ripply1 is a nuclear protein that integrates a transcriptional repressor complex.
Although not much is known, it seems to be important for proper transition of
segmentation machinery from the PSM to somites, namely in the termination of the
segmentation program in the PSM and the maintenance of the rostrocaudal polarity of
somites [21]. At 12 somite stage, ripply1 was expressed at the rostral compartment of
several newly formed somites and at its highest level in the segment-wide domain at
S0 (the first prospective segment unit in the PSM, caudal to the most newly formed
somite) in some embryos (6/14) and also at S-I (a prospective segmental unit caudal to

38
S0) in other embryos (8/14) (Figure 16E-E’’) [21, 46]. In msgn1-/- embryos, the level of
ripply1 mRNA was significantly reduced but still present at the rostral side of the first
newly formed somites, at S0 at its highest level and at S-I (10/16) (Figure 16F-F’).
Complementarily, when msgn1 was overexpressed in hsp70:HA-msgn1 embryos (heat-
shocked at 8-somite stage for 60 minutes at 39°C), ripply1 expression became strongly
expressed in the anterior end of the unsegmented PSM (S0) and in several posterior
somites 1hpHS (10/12) (Figure 16H-H’). Wild-type embryos subjected to the same
conditions as hsp70:HA-msgn1 embryos show a similar pattern as non heat-shocked
embryos (Figure 16G-G’).
These results suggest that both Crabp2b and Ripply1 act downstream of
Mesogenin1 and they are positively regulated by Mesogenin1, since their expression
levels decreased in its absence and increased when it was overexpressed.
III.5. Mesogenin1 overexpression affects eye development
In the course of this work, we detected another phenotype resulting from msgn1
overexpression that had not been described before. At 3 dpf, hsp70:HA-msgn1 larvae
that were heat-shocked at 30% epiboly showed eye defects. Unlike wild-type embryos
subjected to the same conditions, of which 100% had normal eye development (n=79
embryos) (Figure 17A), only 15.1% hsp70:HA-msgn1 larvae developed normal eyes
(5/33) (Figure 17B). Most transgenic larvae showed eye development defects: in 3% of
the cases both eyes were smaller (1/33) (Figure 17C), in 54.6% eyes were asymmetric
(18/33) (Figure 17D), in 21.2% only one eye developed (7/33) (Figure 17E), and even in
6.1% no developed eyes were detected (2/33) (Figure 17F).
Interestingly, hsp70:HA-msgn1 larvae that apparently did not developed eyes,
showed a rudimentary structure similar to an eye of a 24 hpf embryo (Figure 17G-I). In
fact, at 24 hpf, hsp70:HA-msgn1 embryos seemed to have normal eye development,
appropriate for its stage (data not shown).
These data suggest that Mesogenin1 interferes with normal eye development in
zebrafish.
39
Figure 16. Mesogenin1 controls the expression of crabp2b and ripply1. crabp2b (A-D’) and ripply1 (E-H’) expression in wild-type (A-A’, E-E’’) and msgn1-/- (B-B’, F-F’) embryos fixed at 12 somite stage, and in wild-type (C-C’,G-G’) and hsp70:HA-msgn1 (D-D’, H-H’) embryos heat-shocked at 8-somite stage and fixed 1 hpHS. (E,E’,G) The newly formed somite boundary is marked by an arrowhead. (A-D, E,E’-H) Flat-mounted embryos. Dorsal view, anterior to the top; (A’-D’, E’-H’) Lateral views.

40
Figure 17. Overexpression of mesogenin1 impacts on eye development. Wild-type embryos heat-shocked at 30% epiboly for 40 minutes at 39°C showed normal eyes at 3 dpf (A and H). Although some hsp70:HA-msgn1 embryos developed normal eyes (B), most showed eye formation defects, including smaller eyes (C), asymmetric eyes (D), one eye absent (E) or both absent (F). However, transgenic larvae with no apparent eyes at 3 dpf (I), showed similar structures to those observed in wild-type larvae at 24 hpf (G) instead of a 3 dpf larvae (H).

41
CHAPTER IV
Discussion
42
CHAPTER IV - DISCUSSION
IV.1. Mesogenin1 regulates both trunk and tail somite formation
A major goal of this work was to investigate if Mesogenin1 is regulating cell
movements during zebrafish development. Data from mice have suggested that the
first effect of Msgn1 is on migration of presumptive paraxial mesoderm cells during
gastrulation, and later on PSM maturation and segmentation [36]. In zebrafish, Msgn1
is first expressed in the marginal zone of the blastoderm and later in the tailbud,
territories where trunk and tail MPCs reside [13, 14]. In order to understand if Msgn1
is regulating both trunk and tail somites formation, wild-type cells and cells with no
msgn1 expression or overexpressing msgn1 were co-transplanted to the lateral margin
or to the ventral margin of shield stage gastrulas, respectively. A double cell
transplantation technique allowed the direct and simultaneous comparisons of cells
with different levels of Msgn1 and enabled the scrutiny of a phenotype that was mild
in the mutant embryo.
IV.1.1. Mesogenin1 controls convergence and extension movements
In double cell transplantation experiments, cells lacking msgn1 expression
showed a lower rate in convergence movements during gastrulation, since they
contributed in a higher frequency to posterior trunk somites, while wild-type cells
contribute more to anterior ones. Double in situ hybridization with markers widely
used to study CE movements also suggest that convergence movements are indeed
defective, since msgn1-/- embryos showed a wider neural plate and notochord when
compared to wild-type controls. In contrast, cells overexpressing msgn1 seem to
converge at a higher rate than wild-type cells, since they were found at a higher
frequency in the most anterior somites than wild-type cells. hsp70:HA-msgn1 embryos
also showed a narrower neural plate and notochord when compared to wild-type
controls, suggesting that convergence movements are indeed increased. Thus,
Mesogenin1 seems to promote convergence movements of MPCs during gastrulation.
43
Concerning the extension movements, in the absence of msgn1 cells seem to
behave similarly to wild-type cells, as they occupied the same range of somites when
transplanted into the lateral margin of a wild-type host. However, the posterior
displacement of the hatching gland relatively to the anterior edge of the neural plate in
some msgn1-/- bud stage embryos suggests problems in extension movements. In fact,
in the absence of msgn1 cells may have some difficulty performing extension
movements, but since they converge slowly as well, compared to wild-type cells, they
take longer to reach the segmental plate and could have time to extend in a wild-type
environment, ending up contributing to the same range of somites as wild-types. In
contrast, cells overexpressing msgn1 seem to have some difficulty in extension
movements, since they contributed to a lower range of somites than wild-type cells.
However, the anterior displacement of the hatching gland relatively to the anterior
edge of the neural plate in hsp70:HA-msgn1 bud stage embryos suggest that extension
movements are increased. This apparent contradiction may be explained by the fact
that cells overexpressing msgn1 converge faster than wild-type cells, reaching the
segmental plate earlier and, consequently, having less time to extend in a wild-type
environment, thus contributing to a lower range of somites in the anterior trunk.
IV.1.2. Mesogenin1 is required for tail formation in zebrafish
Fior et al. showed that msgn1 is required for the ventral diving of tailbud cells
into the PSM. They observed that in msgn1-/- embryos MPCs are retained longer in the
tailbud, which delays exhaustion of their stock and allows somitogenesis to continue
for longer than normal, leading to an increase in the final number of somites [12].
Our results showed that in the absence of msgn1 cells contribute in a higher
frequency to more posterior somites than wild-type cells, suggesting that cells are
maintained until the end of somitogenesis but are leaving the tailbud at a slower rate
than wild-type cells. On the other hand, cells overexpressing msgn1 contribute in a
higher frequency to more anterior somites than wild-type cells, suggesting that cells
are leaving the tailbud at a faster rate than wild-type cells. Moreover, MPCs that
overexpress msgn1 do not contribute to the last six somites unlike wild-type cells,
suggesting a premature extinction of transgenic cells in the tailbud. These results
44
support the hypothesis that overexpressing msgn1 results in truncated bodies because
MPCs that overexpress msgn1 leave the tailbud prematurely and, consequently, are
not maintained until the end of somitogenesis.
IV.1.3. Gastrulation versus Tailbud movements
A big controversy over vertebrate posterior body formation has been centered
on whether it forms by a developmental mechanism that is distinct from gastrulation,
which is responsible for the formation of the anterior body [47-49].
In the 1920s, Holmdahl proposed that the vertebrate body followed two distinct
programs of development. The first program, called “primary body development”, is
responsible for the formation of the head and trunk regions of the embryo. In the
second program, called “secondary body development”, an undifferentiated blastema
directly gives rise to tail tissues [15, 48, 49]. Other investigators of that time, such as
Pasteels, thought that the formation of the tail region represented a continuation of
gastrulation, instead of being two independent processes [47]. However, the early
comparisons of anterior versus posterior development were limited to morphological
criteria. Nowadays, investigators can benefit from molecular probes and cell imaging
technology, allowing them to collect new data that can give new insights into this
subject [15, 49].
Concerning zebrafish, there are some common cell movements during
gastrulation and tail elongation. For instance, the ventral diving of tailbud cells into the
PSM can be compared to the involution of germ ring cells during gastrulation [10, 12].
Also, both developmental processes involve convergence and extension movements
[6, 15, 26]. However, the correlation between the movements of cells and the
expression of developmentally relevant genes is necessary to address potential
similarities between both processes [15].
This work has brought new information to support the idea that cell movements
in the tailbud could indeed be a continuation of gastrulation movements. Here we
show that Mesogenin1 is regulating cell movements of MPCs during gastrulation and
also during tail extension. However, msgn1 is not the only factor regulating cell
45
movements, since msgn1 null mutants still form somites. Previous studies have shown
that spadetail (spt) acts redundantly with msgn1 in tail somite formation in zebrafish,
since either gene alone is sufficient to support the process, but msgn1;spt double
mutants fail to form both trunk and tail somites [11, 12]. Additionally, it has been
shown that Spt also controls cell movement during gastrulation, and the fact that spt
single mutants fail to form trunk somites supports this idea [38-40]. These data suggest
that Spt may also control motility in the tailbud, and if so we show that cell
movements during gastrulation and tail extension have at least two common
regulators, suggesting that there may be a continuation of cell movements from one
stage to the other.
IV.1.4. Reviewing the zebrafish fate map
Lineage tracing experiments allow the construction of fate maps, which show the
fate of each blastomere or a group of cells in terms of its position and the type of
tissue they give rise to [3].
In zebrafish, there are several studies that map the fates of cells from the entire
embryo or only from a particular domain [50-52]. However, different fate maps place
MPCs that will give rise to somites in slightly different specific regions [22, 53, 54].
Some studies revealed that MPCs located in the dorso-lateral margin contribute to
trunk somites, while precursors located in the ventral margin give rise to the tail
somites [7, 8]. In this work, MPCs transplanted into the lateral margin domain
contributed mostly to trunk somites, but also to anterior tail somites in some embryos,
while precursors transplanted into the ventral margin domain contributed mostly to
tail somites but also to a few posterior trunk somites. Thus, our results showed that
the fate map of MPCs is slightly different from what has been accepted in the
literature, since a small group of cells transplanted into the ventral margin and into the
lateral margin of a zebrafish gastrula gave rise to a wider range of somites than
predicted by fate maps. This suggests that MPCs that will form tail, posterior trunk and
anterior trunk somites are predominantly located in specific domains along the margin,
in a DV direction respectively, however these domains seem to slightly overlap.
46
These overlaps could result from misalignment of the data from different
embryos giving an apparent, rather than real, overlap. On the other hand, fate maps
are two-dimensional projections with low accuracy, because of uncertainties in
labeling and scoring cell position in any embryo. Still, they give valuable help in the
interpretation of molecular markers, as well as in the design of transplant experiments,
even though some adjustments are required.
IV.2. Mesogenin1 induces paraxial mesoderm production
Fior et al. showed that Msgn1 switches off progenitor maintenance gene in MPCs
as they exit from the tailbud [12]. Microarray experiments performed in our lab
showed that Mesogenin1 also regulates genes that are important for paraxial
mesoderm production (see Appendix IV). In this work, the expression patterns of two
of those genes were analyzed: crabp2b and ripply1. As previously described, Crabp2b
regulates access of RA to nuclear RA receptors, helping modulating the RA gradient,
which is important for somitogenesis [18-20]. Ripply1 is important for the termination
of the segmentation program in the PSM and for the maintenance of the rostrocaudal
polarity of somites [21]. Here we show that Msgn1 positively regulates both of these
genes, reinforcing the idea that it also regulates MPCs differentiation.
Another data suggesting the importance of Msgn1 for paraxial mesoderm
production is the disrupted notochord in hsp70:HA-msgn1 embryos when msgn1 is
overexpressed. It is possible that expression of msgn1 in cells that were committed to
become notochord could initiate the PSM differentiation program, by inducing PSM
markers, and become somitic cells instead. Also, the microarray experiment revealed
that Msgn1 represses floating head (flh) expression, which is important to maintain
development of the notochord-forming axial mesoderm [43]. In order to test if
expression of msgn1 in notochord progenitor cells change their fate to become somitic
cells, those cells could be transplanted to the notochord domain of a wild-type host
and later assayed for their ability to differentiate into somitic cells. This work tested
three different approaches. Performing heterochronic cell transplantation at blastula
stage may raise some doubts and a large number of embryos would be necessary since
most control transplants give rise to muscle fibers instead of notochord.
47
Isochronic/homotopic transplantation of shield cells is also not a good approach since
transplanted shield cells that overexpress msgn1 seem to die in most cases, which
prevents the question to be answered. In this experiment, transplanted cells were
induced by msgn1 into the paraxial mesoderm program. However, since they were
transplanted to an axial mesoderm progenitor niche, they were deprived from external
signals that would be necessary to progress the paraxial mesoderm differentiation
program and may have received signals for notochord differentiation instead.
Therefore, and because cells were probably receiving contradictory signals, they could
not integrate properly and may have died. This can only be confirmed analyzing cell
death and investigating in which tissue they are. Thus, the best approach would be
transplanting the whole shield, where the host normal axial mesoderm environment is
removed. However this procedure must be optimized.
IV.3. Mesogenin1 overexpression inhibits eye development
Overexpression of msgn1 during gastrulation also causes eye defects visible at 3
dpf. Interestingly, these eye defects are not visible at 1 dpf, suggesting that the eye
probably starts to form normally but then fails to progress its developmental program
and eventually becomes covered by epidermis. The microarray experiment performed
in our lab also provides some answers to this question. When msgn1 is overexpressed,
the expression of some neural genes important for eye development goes down, such
as sox1a, sox1b and sox21b, while tgfβ3 goes up.
Sox1a and Sox1b (SRY-box containing gene 1a and b) belong to B1 Sox genes
group, which encode high mobility group domain transcription factors that play major
roles in neural development [55]. In the phylogenetic trees, sox1a and sox1b are very
closely related, suggesting that they are Sox1 co-orthologs [55]. In mice, Sox1 is
essential to activate some γ-crystallin genes and for maintaining expression of all of
them, playing a critical role in lens development [56, 57]. In zebrafish not much is
known about the function of these two genes, however they are both expressed in the
lens 1 dpf [55]. The expression of sox1a/b in the lens of zebrafish is reminiscent of Sox1
expression in the lens of higher vertebrates, and both genes could also be important to
maintain all γ-crystallin genes expression, as in mice. When msgn1 is overexpressed it
48
downregulates sox1a/b expression, which could fail to activate some γ-crystallin genes,
however not hindering the initial formation of the eye. Later, the low levels of sox1a/b
expression could not be sufficient in some cases to maintain expression of γ-crystallin
genes, as in mice, leading to lens defects.
Sox21b (SRY-box containing gene 21b) also belongs to B1 Sox genes group and it
is also expressed in the lens at 1dpf [58, 59]. Pauls et al. showed that inhibition of
sox21b expression by morpholino injection leads to defects in lens development, which
exhibit a patch of aberrant tissue in its centre [59]. msgn1 overexpression causes
sox21b downregulation, which in turn could cause some defects in the lens of
hsp70:HA-msgn1 embryos.
TGFs-β (Transforming growth factors-β) have been implicated in the regulation of
programmed cell death (PCD) in many tissues, including the developing retina [60].
Although mouse tgfβ3 mutants exhibit inconspicuous corneal and lens phenotypes, in
chicken embryos TGFβ3 is detected in the central retina, a region where apoptosis is
most prominent [60, 61]. Furthermore, reduction of endogenous TGFβ prevents PCD in
the developing chick retina whereas application of exogenous TGFβ is able to rescue
the phenotype [61]. Considering these data and that tgfβ3 is expressed in the lens of
wild-type zebrafish embryos at 1dpf [62], the downregulation of tgfβ3 observed upon
msgn1 overexpression could cause an increase of PCD in the lens.
Some studies have shown that the correct development and differentiation of
the lens is important for eye development [22, 63, 64]. A good example is Astyanax
mexicanus, a teleost fish species with an eyed surface form and an eyeless cave form.
Yamamoto and Jeffery showed that eye formation is initiated in cave fish embryos, but
the eye subsequently arrests and degenerates. However, the surface fish lens is
sufficient to rescue eye development after transplantation into the cave fish eye
primordium, suggesting that a change in an inductive signal emanating from the lens is
necessary for normal eye development [64].
Since Msgn1 is repressing and inducing some genes that could be perturbing the
lens normal development, and supposing that in zebrafish the lens is also crucial for
eye development, we could assume that in hsp70:HA-msgn1 embryos, with a pulse of
msgn1 expression during gastrulation, the eye formation is initiated but then fails to

49
proceed its developmental program and degenerates because the lens becomes
incompetent.
Although msgn1 is not normally expressed on neural tissues, the tailbud also
comprises axial and neural progenitors, and msgn1 may be inhibiting them, thereby
ensuring the paraxial mesoderm formation. In fact, msgn1 also represses sox3
expression, which regulates neuronal differentiation in the nervous system and it is
observed in the anterior-dorsal region of the tailbud, where neural precursors are [15,
65].
IV.4. Concluding remarks and future directions
This work shows that Mesogenin1 plays a central role in the production of
paraxial mesoderm. First, we showed that Msgn1 controls cell movement during
gastrulation, thus contributing to trunk somites formation, and also throughout
segmentation, propelling the transition from tailbud into PSM in a cell-autonomous
fashion, contributing to tail somites formation. Tracking transplanted cells throughout
gastrulation and compare their behavior in the tailbud throughout segmentation could
be interesting to investigate further at what levels is Mesogenin1 acting. It would also
be interesting to analyze if Spt also controls motility in the tailbud by performing the
same experiments as for msgn1.
Secondly, this study added new information about Msgn1 contribution to switch-
on the characteristics of PSM, since it activates genes like crabp2b and ripply1 which
are important for paraxial mesoderm production. Additionally, msgn1 could be
ensuring paraxial mesoderm differentiation by inhibiting axial mesoderm and neural
genes as well. Therefore, homotopic shield grafts from embryos overexpressing msgn1
to wild-type hosts and analysis of those cells fate could be important to see if Msgn1
could respecify cells that were committed to an axial mesoderm fate to a paraxial
mesoderm fate. Likewise, examining whether neural progenitor cells that overexpress
msgn1 change to a paraxial mesoderm fate could also be interesting.

50
CHAPTER V
References
51
CHAPTER V - REFERENCES
1. Kimmel, C.B., et al., Stages of embryonic development of the zebrafish. Dev Dyn, 1995. 203(3): p. 253-310.
2. Heisenberg, C.P., et al., Silberblick/Wnt11 mediates convergent extension movements during zebrafish gastrulation. Nature, 2000. 405(6782): p. 76-81.
3. Solnica-Krezel, L., Conserved patterns of cell movements during vertebrate gastrulation. Curr Biol, 2005. 15(6): p. R213-28.
4. Kilian, B., et al., The role of Ppt/Wnt5 in regulating cell shape and movement during zebrafish gastrulation. Mech Dev, 2003. 120(4): p. 467-76.
5. Yin, C., B. Ciruna, and L. Solnica-Krezel, Convergence and extension movements during vertebrate gastrulation. Curr Top Dev Biol, 2009. 89: p. 163-92.
6. Myers, D.C., D.S. Sepich, and L. Solnica-Krezel, Convergence and extension in vertebrate gastrulae: cell movements according to or in search of identity? Trends Genet, 2002. 18(9): p. 447-55.
7. Holley, S.A., Anterior-posterior differences in vertebrate segments: specification of trunk and tail somites in the zebrafish blastula. Genes Dev, 2006. 20(14): p. 1831-7.
8. Holley, S.A., The genetics and embryology of zebrafish metamerism. Dev Dyn, 2007. 236(6): p. 1422-49.
9. Myers, D.C., D.S. Sepich, and L. Solnica-Krezel, Bmp activity gradient regulates convergent extension during zebrafish gastrulation. Dev Biol, 2002. 243(1): p. 81-98.
10. Solnica-Krezel, L., Gastrulation in zebrafish — all just about adhesion? Current Opinion in Genetics & Development, 2006. 16(4): p. 433-441.
11. Yabe, T. and S. Takada, Mesogenin causes embryonic mesoderm progenitors to differentiate during development of zebrafish tail somites. Dev Biol, 2012. 370(2): p. 213-22.
12. Fior, R., et al., The differentiation and movement of presomitic mesoderm progenitor cells are controlled by Mesogenin 1. Development, 2012. 139(24): p. 4656-65.
13. Yoo, K.W., et al., Characterization and expression of a presomitic mesoderm-specific mespo gene in zebrafish. Dev Genes Evol, 2003. 213(4): p. 203-6.
14. Thisse, B. and C. Thisse, Fast Release Clones: A High Throughput Expression Analysis. ZFIN Direct data Submission (http://zfin.org), 2004.
15. Kanki, J.P. and R.K. Ho, The development of the posterior body in zebrafish. Development, 1997. 124(4): p. 881-93.
16. Warga, R.M. and C.B. Kimmel, Cell movements during epiboly and gastrulation in zebrafish. Development, 1990. 108(4): p. 569-80.
52
17. Shih, J. and S.E. Fraser, Distribution of tissue progenitors within the shield region of the zebrafish gastrula. Development, 1995. 121(9): p. 2755-65.
18. Cai, A.Q., et al., Cellular retinoic acid-binding proteins are essential for hindbrain patterning and signal robustness in zebrafish. Development, 2012. 139(12): p. 2150-5.
19. Sharma, M.K., et al., Differential expression of the duplicated cellular retinoic acid-binding protein 2 genes (crabp2a and crabp2b) during zebrafish embryonic development. Gene Expr Patterns, 2005. 5(3): p. 371-9.
20. Diez del Corral, R. and K.G. Storey, Opposing FGF and retinoid pathways: a signalling switch that controls differentiation and patterning onset in the extending vertebrate body axis. Bioessays, 2004. 26(8): p. 857-69.
21. Kawamura, A., et al., Groucho-associated transcriptional repressor ripply1 is required for proper transition from the presomitic mesoderm to somites. Dev Cell, 2005. 9(6): p. 735-44.
22. Gilbert, S.F., Developmental Biology. 8th ed. 2006. 817.
23. Rohde, L.A. and C.P. Heisenberg, Zebrafish gastrulation: cell movements, signals, and mechanisms. Int Rev Cytol, 2007. 261: p. 159-92.
24. Solnica-Krezel, L. and W. Driever, Microtubule arrays of the zebrafish yolk cell: organization and function during epiboly. Development, 1994. 120(9): p. 2443-55.
25. Shimizu, T., et al., E-cadherin is required for gastrulation cell movements in zebrafish. Mech Dev, 2005. 122(6): p. 747-63.
26. Tada, M. and C.P. Heisenberg, Convergent extension: using collective cell migration and cell intercalation to shape embryos. Development, 2012. 139(21): p. 3897-904.
27. Szeto, D.P. and D. Kimelman, The regulation of mesodermal progenitor cell commitment to somitogenesis subdivides the zebrafish body musculature into distinct domains. Genes Dev, 2006. 20(14): p. 1923-32.
28. Row, R.H. and D. Kimelman, Bmp inhibition is necessary for post-gastrulation patterning and morphogenesis of the zebrafish tailbud. Developmental Biology, 2009. 329(1): p. 55-63.
29. Dequeant, M.L. and O. Pourquie, Segmental patterning of the vertebrate embryonic axis. Nat Rev Genet, 2008. 9(5): p. 370-82.
30. Wilson, V., I. Olivera-Martinez, and K.G. Storey, Stem cells, signals and vertebrate body axis extension. Development, 2009. 136(10): p. 1591-604.
31. O'Neill, K. and C. Thorpe, BMP signaling and spadetail regulate exit of muscle precursors from the zebrafish tailbud. Dev Biol, 2013. 375(2): p. 117-27.
32. Agathon, A., C. Thisse, and B. Thisse, The molecular nature of the zebrafish tail organizer. Nature, 2003. 424(6947): p. 448-52.
33. Griffin, K.J. and D. Kimelman, One-Eyed Pinhead and Spadetail are essential for heart and somite formation. Nat Cell Biol, 2002. 4(10): p. 821-5.
53
34. Martin, B.L. and D. Kimelman, Regulation of canonical Wnt signaling by Brachyury is essential for posterior mesoderm formation. Dev Cell, 2008. 15(1): p. 121-33.
35. Nikaido, M., et al., Tbx24, encoding a T-box protein, is mutated in the zebrafish somite-segmentation mutant fused somites. Nat Genet, 2002. 31(2): p. 195-199.
36. Yoon, J.K. and B. Wold, The bHLH regulator pMesogenin1 is required for maturation and segmentation of paraxial mesoderm. Genes Dev, 2000. 14(24): p. 3204-14.
37. Wittler, L., et al., Expression of Msgn1 in the presomitic mesoderm is controlled by synergism of WNT signalling and Tbx6. EMBO Rep, 2007. 8(8): p. 784-9.
38. Row, R.H., et al., Completion of the epithelial to mesenchymal transition in zebrafish mesoderm requires Spadetail. Dev Biol, 2011. 354(1): p. 102-10.
39. Ho, R.K. and D.A. Kane, Cell-autonomous action of zebrafish spt-1 mutation in specific mesodermal precursors. Nature, 1990. 348(6303): p. 728-30.
40. Kimmel, C.B., et al., A mutation that changes cell movement and cell fate in the zebrafish embryo. Nature, 1989. 337(6205): p. 358-62.
41. Draper, B.W., et al., A high-throughput method for identifying N-ethyl-N-nitrosourea (ENU)-induced point mutations in zebrafish. Methods Cell Biol, 2004. 77: p. 91-112.
42. Thisse, C. and B. Thisse, High-resolution in situ hybridization to whole-mount zebrafish embryos. Nat. Protocols, 2008. 3(1): p. 59-69.
43. Halpern, M.E., et al., Cell-autonomous shift from axial to paraxial mesodermal development in zebrafish floating head mutants. Development, 1995. 121(12): p. 4257-64.
44. Halpern, M.E., et al., Induction of muscle pioneers and floor plate is distinguished by the zebrafish no tail mutation. Cell, 1993. 75(1): p. 99-111.
45. Shih, J. and S.E. Fraser, Characterizing the zebrafish organizer: microsurgical analysis at the early-shield stage. Development, 1996. 122(4): p. 1313-22.
46. Pourquié, O. and P.P.L. Tam, A Nomenclature for Prospective Somites and Phases of Cyclic Gene Expression in the Presomitic Mesoderm. Developmental cell, 2001. 1(5): p. 619-620.
47. Pasteels, J., Proliferations et croissance dans la gastrulation et la formation de la queue des Vertebres. Arch Biol, 1943. 54: p. 1-45.
48. Holmdahl, D.E., Experimentelle Untersuchungen uber die Lage der Grenze primarer und sekundarer Korperentwicklung beim Huhn. Anat Anz, 1925. 59: p. 393-396.
49. Gont, L.K., et al., Tail formation as a continuation of gastrulation: the multiple cell populations of the Xenopus tailbud derive from the late blastopore lip. Development, 1993. 119(4): p. 991-1004.
54
50. Woo, K. and S.E. Fraser, Order and coherence in the fate map of the zebrafish nervous system. Development, 1995. 121(8): p. 2595-609.
51. Kozlowski, D.J., et al., Regional cell movement and tissue patterning in the zebrafish embryo revealed by fate mapping with caged fluorescein. Biochem Cell Biol, 1997. 75(5): p. 551-62.
52. Woo, K., J. Shih, and S.E. Fraser, Fate maps of the zebrafish embryo. Curr Opin Genet Dev, 1995. 5(4): p. 439-43.
53. Tam, P.P. and G.A. Quinlan, Mapping vertebrate embryos. Curr Biol, 1996. 6(2): p. 104-6.
54. Schier, A.F., Axis formation and patterning in zebrafish. Curr Opin Genet Dev, 2001. 11(4): p. 393-404.
55. Okuda, Y., et al., Comparative genomic and expression analysis of group B1 sox genes in zebrafish indicates their diversification during vertebrate evolution. Dev Dyn, 2006. 235(3): p. 811-25.
56. Nishiguchi, S., et al., Sox1 directly regulates the gamma-crystallin genes and is essential for lens development in mice. Genes Dev, 1998. 12(6): p. 776-81.
57. Jean, D., K. Ewan, and P. Gruss, Molecular regulators involved in vertebrate eye development. Mech Dev, 1998. 76(1-2): p. 3-18.
58. Lan, X., et al., Comparative analysis of duplicated sox21 genes in zebrafish. Dev Growth Differ, 2011. 53(3): p. 347-56.
59. Pauls, S., S.F. Smith, and G. Elgar, Lens development depends on a pair of highly conserved Sox21 regulatory elements. Dev Biol, 2012. 365(1): p. 310-8.
60. Dunker, N. and K. Krieglstein, Reduced programmed cell death in the retina and defects in lens and cornea of Tgfbeta2(-/-) Tgfbeta3(-/-) double-deficient mice. Cell Tissue Res, 2003. 313(1): p. 1-10.
61. Dunker, N., N. Schuster, and K. Krieglstein, TGF-beta modulates programmed cell death in the retina of the developing chick embryo. Development, 2001. 128(11): p. 1933-42.
62. Cheah, F.S., E.W. Jabs, and S.S. Chong, Genomic, cDNA, and embryonic expression analysis of zebrafish transforming growth factor beta 3 (tgfbeta3). Dev Dyn, 2005. 232(4): p. 1021-30.
63. Zhao, X.C., et al., The zebrafish cornea: structure and development. Invest Ophthalmol Vis Sci, 2006. 47(10): p. 4341-8.
64. Yamamoto, Y. and W.R. Jeffery, Central Role for the Lens in Cave Fish Eye Degeneration. Science, 2000. 289(5479): p. 631-633.
65. Harrington, M.J., K. Chalasani, and R. Brewster, Cellular mechanisms of posterior neural tube morphogenesis in the zebrafish. Developmental Dynamics, 2010. 239(3): p. 747-762.
66. J. Sambrook, D.W.R.a.T.M., Molecular Cloning - a Laboratory Manual. 2nd edition ed. 1989, New York.
AI-I
APPENDIX I

AI-II
APPENDIX I
AI.1. Identification of mesogenin1 mutants
AI.1.1. Biological material collection
To perform genotyping, adult fish were anesthetized in Tricaine 1X. Caudal fins
were properly cut with a disinfected scalpel and placed in 200 µl of lysis buffer.
AI.1.2. DNA extraction
To digest the tissues, 1% Proteinase K was added to the lysis buffer and samples
were placed at 56°C and 400 rpm overnight. To each sample, 200 µl phenol was added
and samples were centrifuged 10 minutes at 14600 rpm at RT. Aqueous phases were
collected to cleaned tubes, 200 µl of phenol chloroform was added and, after
centrifugation, aqueous phases were collected again. The addition of phenol
chloroform and forward steps were repeated. After collecting the aqueous phases to
cleaned tubes, 500 µl of ethanol 100% was added for DNA precipitation, and tubes
were left at -80°C for 30 minutes. Samples were centrifuged 10 minutes at 14600 rpm
at 4°C and supernatants were discarded. After samples were left to dry for 10
minutes, 50 µl of distillated nuclease-free water was added to resuspend DNA.
Samples were stored at -20°C.
AI.1.3. Polymerase Chain Reaction (PCR)
Amplification of mesogenin1 fragment containing the mutation site was
performed by PCR, using the following primers: msgn1-F 5’-
CCGGAATTCGCCGCCATGGCGCAAATCGACGTGGATG-3’ and msgn1-R: 5’-
AAAAGGCCTTTTTCACTGCTGCTCGAGGATGCC-3’. Reactions were prepared in a final
volume of 50 µl (1X Thermo Buffer, 200 µM dNTPs, 1,5 mM MgCl2, 0,4 µM of each
primer, 0,2 U Taq DNA Polymerase and approximately 1µg of DNA template).
Cycling sequencing was performed with the following conditions: an initial
heating period at 94°C for 5 minutes, followed by 35 cycles at 94°C for 30 seconds for
denaturation, an annealing period of 30 seconds at 63°C (Tm F=71,6°C; Tm R= 66°C) and

AI-III
an extension period at 72°C for 1 minute. The final extension period was at 72°C for 5
minutes, and then samples were stored at 4°C until purification.
AI.1.4. Agarose gel electrophoresis of DNA
DNA separation and size estimation were performed by agarose gel
electrophoresis. Gels were prepared by dissolving agarose in 1X TAE buffer to a final
concentration of 1%. To visualize the DNA, 0.1% SYBR Safe was added to the gel. DNA
samples were mixed with 6X gel loading buffer and electrophoresis was performed at
90 V until the appropriate resolution was achieved. The resolved DNA was visualized
using ultraviolet light at 302 nm, and the size was estimated by comparison with
known size markers such as the 1Kb Plus DNA Ladder (Invitrogen).
AI.1.5. Purification of specific DNA fragments from gel
In order to purify amplified DNA fragments of interest, the region of the gel
containing the appropriate band was excised under ultraviolet light (302 nm). DNA
was purified using the Wizard SV Gel and PCR Clean-up System kit, according to the
instructions of the manufacturer (Promega).
AI.1.6. DNA quantification and sequencing
The concentration of DNA was determined by spectrophotometry using
Nanodrop 1000 spectrophotometer. One A260 unit corresponds to 50 µg/ml of
double stranded DNA [66]. The purity of the nucleic acid preparation was estimated by
the ratio between the readings obtained at 260 nm and 280 nm (pure preparations of
DNA show ratio values of 1.8-2.0).
Samples were then sent to StabVida in a volume of 20 µl and a concentration of
10 ng/µl, as well as 5 µl of the forward primer per reaction at a concentration of 10
pmol/µl.
Sequences were then analyzed in A plasmid Editor (ApE).
AII-I
APPENDIX II
AII-II
APPENDIX II
AII.1. RNA probes synthesis
AII.1.1. Cloning of zebrafish crabp2b gene
Total RNA was extracted from the tailbud region of 8 somite stage wild-type
embryos using TRIzol (Invitrogen) and cDNA synthesized from 5 µg RNA with
RevertAid™ H Minus First Strand cDNA Synthesis Kit (Fermentas). Zebrafish crabp2b
coding sequence was amplified by PCR with the following primer set: crabp2b-F 5’-
ACAATCGATATGGAATCTAACACGGAGAAAAC -3’ and crabp2b-R 5’-
ACTGAATTCTCAATCTCGTTCATACACCC-3’. Reaction was prepared in a final volume of
30 µl, using 1X Phusion HF Buffer, 200 µM dNTPs, 10 µM of each primer, 0.6 U Phusion
DNA Polymerase and approximately 2,5 µl of cDNA template.
Cycling conditions included an initial heating period at 98°C for 30 seconds,
followed by 35 cycles at 98°C for 10 seconds for denaturation, an annealing period of
30 seconds at 64°C (Tm F=62,4°C; Tm R= 60,5°C) and an extension period at 72°C for 90
seconds. The final extension period was at 72°C for 10 minutes, and then samples
were stored at 4°C.
The amplified DNA fragment was then cloned in the pCS2+ expression vector into
the ClaI-EcoRI site. 700 ng of the insert and 1 µg of the plasmid and insert were
digested with ClaI and EcoRI restriction enzymes (2 U), in 1X NEBuffer 4 and 1X BSA
(New England Biolabs), 1 hour at 37°C.
Ligation reaction was carried out in a final volume of 20 µl, using 50 ng of vector
and the amount of insert required to obtain a 1:3 molar ratio. The ligation reaction
was performed overnight at 16°C, using 1 U of T4 DNA ligase (Promega) and the
suitable ligation buffer.
AII.1.2. Plasmid transformation of competent E.coli bacteria
Frozen aliquots of E.coli competent cells were thawed on ice. Up to 100 ng of
plasmid DNA was added to 100 µl of cells and they were kept on ice for 30 min. The
mixture was heat shocked for 45 seconds at 42°C and incubated on ice for 2 minutes.
900 µl of SOB solution supplemented with 10 mM MgCl2 and 10 mM MgSO4 was
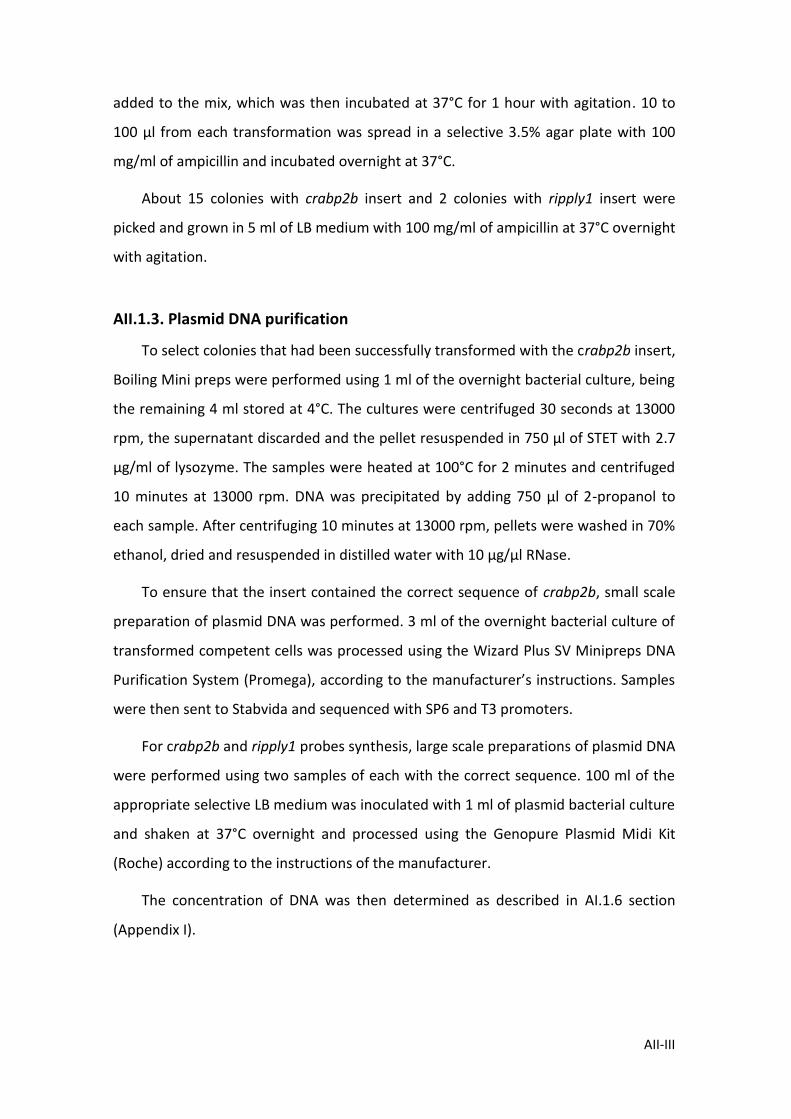
AII-III
added to the mix, which was then incubated at 37°C for 1 hour with agitation. 10 to
100 µl from each transformation was spread in a selective 3.5% agar plate with 100
mg/ml of ampicillin and incubated overnight at 37°C.
About 15 colonies with crabp2b insert and 2 colonies with ripply1 insert were
picked and grown in 5 ml of LB medium with 100 mg/ml of ampicillin at 37°C overnight
with agitation.
AII.1.3. Plasmid DNA purification
To select colonies that had been successfully transformed with the crabp2b insert,
Boiling Mini preps were performed using 1 ml of the overnight bacterial culture, being
the remaining 4 ml stored at 4°C. The cultures were centrifuged 30 seconds at 13000
rpm, the supernatant discarded and the pellet resuspended in 750 µl of STET with 2.7
µg/ml of lysozyme. The samples were heated at 100°C for 2 minutes and centrifuged
10 minutes at 13000 rpm. DNA was precipitated by adding 750 µl of 2-propanol to
each sample. After centrifuging 10 minutes at 13000 rpm, pellets were washed in 70%
ethanol, dried and resuspended in distilled water with 10 µg/µl RNase.
To ensure that the insert contained the correct sequence of crabp2b, small scale
preparation of plasmid DNA was performed. 3 ml of the overnight bacterial culture of
transformed competent cells was processed using the Wizard Plus SV Minipreps DNA
Purification System (Promega), according to the manufacturer’s instructions. Samples
were then sent to Stabvida and sequenced with SP6 and T3 promoters.
For crabp2b and ripply1 probes synthesis, large scale preparations of plasmid DNA
were performed using two samples of each with the correct sequence. 100 ml of the
appropriate selective LB medium was inoculated with 1 ml of plasmid bacterial culture
and shaken at 37°C overnight and processed using the Genopure Plasmid Midi Kit
(Roche) according to the instructions of the manufacturer.
The concentration of DNA was then determined as described in AI.1.6 section
(Appendix I).

AII-IV
AII.1.4. DNA template linearization
For DNA template preparation, 5 µg of plasmid DNA was linearized in a final
volume of 50 µl, using 10 U of the appropriate restriction enzyme (Table 1) and the
recommended buffer, for 1 hour at 37°C. In order to stop the reaction, samples were
put on ice and then purified.
AII.1.5. Analysis and isolation of DNA by agarose gel electrophoresis
DNA analysis and purification of specific fragments were performed as described
previously in Appendix I (AI.1.4 and AI.1.5 sections).
AII.1.6. In vitro transcription
Anti-sense transcripts were produced by using 1 µg of linearized plasmid DNA and
20 U of T3 (Stratagene) or T7 RNA polymerase or 40 U of SP6 RNA polymerase (Roche)
with 100 mM DTT, 1x DIG/Fluorescein RNA labeling mix (1 mM ATP, CTP, GTP, 0.65
mM UTP and 0.35 mM DIG/FLUO-UTP) (Roche), 20 U RNase inhibitor (Promega) and
1x Transcription Buffer (Stratagene and Roche), in a final volume of 20 µl (Table 1).
After incubating at 37°C for 3 hours, samples were purified using illustra ProbeQuant
G-50 Micro Columns (GE Healthcare) according to the instructions of the
manufacturer.
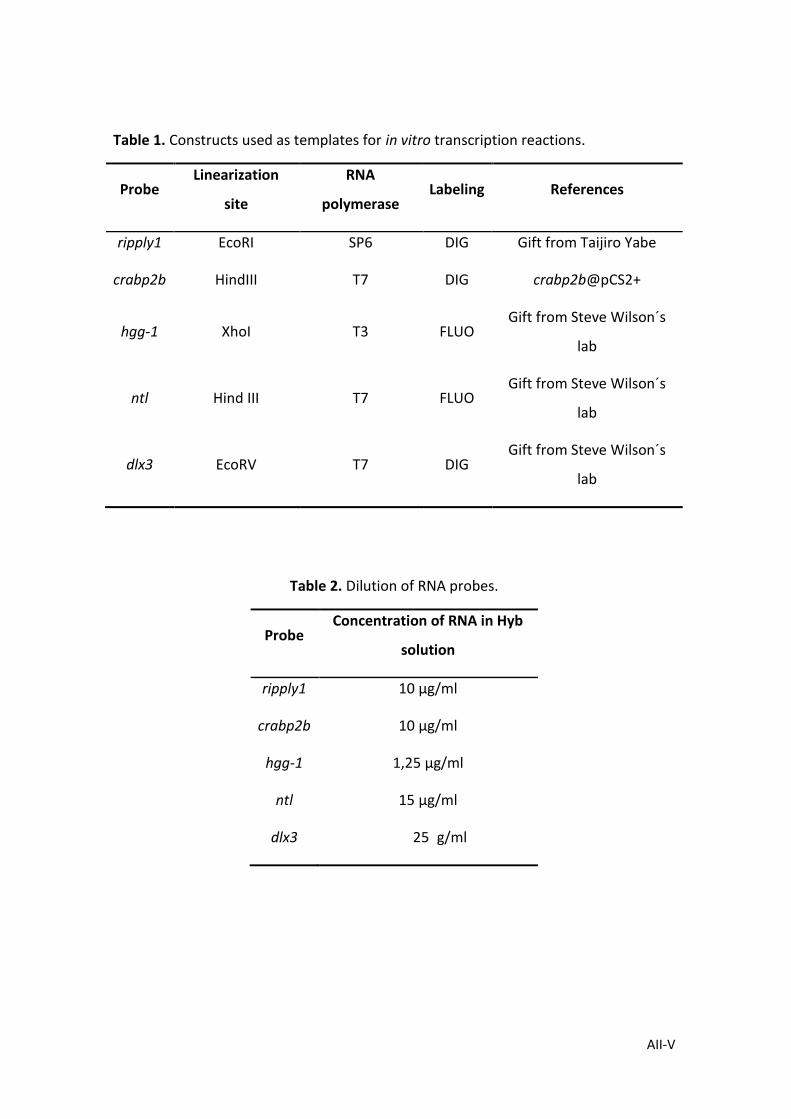
AII-V
Table 1. Constructs used as templates for in vitro transcription reactions.
Probe Linearization
site
RNA
polymerase Labeling References
ripply1 EcoRI SP6 DIG Gift from Taijiro Yabe
crabp2b HindIII T7 DIG crabp2b@pCS2+
hgg-1 XhoI T3 FLUO Gift from Steve Wilson´s
lab
ntl Hind III T7 FLUO Gift from Steve Wilson´s
lab
dlx3 EcoRV T7 DIG Gift from Steve Wilson´s
lab
Table 2. Dilution of RNA probes.
Probe Concentration of RNA in Hyb
solution
ripply1 10 µg/ml
crabp2b 10 µg/ml
hgg-1 1,25 µg/ml
ntl 15 µg/ml
dlx3 25 g/ml

AIII-I
APPENDIX III

AIII-II
APPENDIX III
AIII.1. Formulation of frequently used solutions
Hybridization buffer
50% Formamide, 5X SSC (pH7), 0.1% Tween 20 and 9 mM Citric acid to pH 6
Lysis buffer 125 mM NaCl; 50 mM EDTA; 10 mM Tris pH 8; 1% SDS
NTMT reaction buffer
0.1 M Tris-HCl pH 9.5; 50 mM MgCl2; 0.1 M NaCl; 0.1% Tween 20
1X PBS 137 mM NaCl; 2.7 mM KCl; 4.3 mM Na2HPO4.7H2O; 1.4 mM KH2PO4
1X PBT 1X PBS; 0.1% Tween 20
SOB solution 2% Tryptone; 0.5% Yeast extract; 10 mM NaCl; 2.5 mM KCl; 20 mM Glucose
STET 5% Triton; 8% Sucrose; 50 mM EDTA; 50 mM Tris HCl pH 8
20X SSC 3 M NaCl; 0.3 M Na3Citrate.2H2O; adjust with HCl to pH 7.0
1X TAE 40 mM Tris.acetate; 2 mM Na2EDTA.2H2O (pH 8.5)
Tris-Buffered Saline and Tween 20 (TBST)
50 mM Tris; 150 mM NaCl; 0.05% Tween 20; adjust with HCl to pH 7.6)
1X Transplant medium
15 mM NaCl; 0.5 mM KCl; 1.3 mM CaCl2.2H2O; 0.15 mM KH2PO4; 0.05 mM Na2HPO4; 1 mM MgSO4.7H2O; 0.6 mM NaHCO3 (recipe provided by Ben Martin)

AIV-I
APPENDIX IV

AIV-II
APPENDIX IV
AIV.1. Gene fold changes caused by Mesogenin1 after 1 hour HS at 8
somites stage with 1 hour recovery
lamb2l
tgfb3
bicc2
sfrp1a
snx9b
pcdh2ab10
ncam1a
myo1c
cdh17
pcdh7b
ripply1
crabp2b
mylka
pcdh18a
lbx1a
sox3
her2
flh
olig4
sox21b
twist1a
myf5
sox1b
waif2
sox19a
her15.2
her15.1
hey1
uncx4.1
wnt8a
bmp4
sox1a
bmp2b
wnt11
cox7a2
fezf1
Experiment and analysis performed by João Pereira.