the role of knowledge economy in african business
TRANSCRIPT

MPRAMunich Personal RePEc Archive
The Role of Knowledge Economy inAfrican Business
Vanessa Tchamyou
AFRICAN GOVERNANCE AND DEVELOPMENT INSTITUTE
30 June 2014
Online at https://mpra.ub.uni-muenchen.de/75089/MPRA Paper No. 75089, posted 21 November 2016 09:07 UTC
brought to you by COREView metadata, citation and similar papers at core.ac.uk
provided by Munich Personal RePEc Archive

1
AFRICAN GOVERNANCE AND DEVELOPMENT
INSTITUTE
A G D I Working Paper Forthcoming: the Journal of Knowledge Economy
WP/15/049
The Role of Knowledge Economy in African Business
Vanessa S. Tchamyou
African Governance and Development Institute,
Yaoundé, Cameroon.
E-mail: [email protected]
© 2015 African Governance and Development Institute WP/15/049
2
AGDI Working Paper
Research Department
The Role of Knowledge Economy in African Business
Vanessa S. Tchamyou
June 2015
Abstract
This paper assesses the role of knowledge economy (KE) in African business in 53 countries for
the period 1996-2010. The four KE components of the World Bank are employed, notably:
education, innovation, economic incentives & institutional regime and information &
communication technology. The business indicators are classified into: starting, doing and ending
business. Principal components analysis and panel instrumental variable fixed effect approaches
are employed as empirical strategies. The findings which are broadly consistent with intuition
and the predictions of economic theory suggest that KE policies will substantially boost the
starting and doing of business in Africa. This is relevant in fighting unemployment and
improving African competitiveness in global value chains. Policy implications for the relevance
of each specific KE dimension in African business are discussed with particular emphasis on the
theoretical underpinnings of the study. The investigation is original in its contribution at the same
time to the scarce literature on African KE and the growing challenges of improving the business
climate of the continent by means of KE.
JEL Classification: L59; O10; O30; O20; O55
Keywords: Knowledge Economy; Doing business; Development; Africa
1. Introduction

3
Over the past two decades, the economies of leading countries have increasingly evolved
towards knowledge-based economies, relying less on traditional resources such as labour and
capital for economic prosperity and wealth creation (Dahlman, 2007; Chavula, 2010; Chandra &
Yokoyama, 2011; Asongu, 2015a). It is widely acknowledged that the creation of new
knowledge, innovation and technological changes drive prosperity in these countries.
Accordingly, economic incentives based on new knowledge stimulate economic growth, improve
the ladder of employment opportunities, provide higher wages and ultimately enhance the
country’s competitiveness within the global environment. The appealing economic trends
prevalent in many developed countries strongly depend on investments in new technology, high
skilled labour and high-technology industries. These are essential ingredients for the development
of a knowledge-based economy (African Development Bank: AfDB, 2007).
Whereas innovation has been substantially identified as a driver of economic prosperity and
productivity in the developed world, the capacity to innovate remains relatively low in most
African countries (Anyanwu, 2012). The globalization of technology however presents new
opportunities for development in developing countries if governments can transform political will
into adequate economic policies needed for the building of knowledge-based economies (AfDB,
2007). Moreover, in order for developing countries to build their potential as knowledge
economies, substantial investments in human capital, high skilled labour force and infrastructure
for high-technology industries are imperative. In essence, the fostering of scientific technological
collaborations and networks with developed countries are also required to enhance the
competitiveness and international trade goals of corporations in developing countries (Lee &
Kim, 2009; Suh & Chen, 2007).
In light of the above, a recent stream of African related studies have been consistent on the
relevance of knowledge economy (KE) on the continent (AfDB, 2007; Amavilah, 2009; Andrés
& Asongu, 2013ab; Nyarko, 2013a; Andrés et al., 2014; Asongu, 2015b; Asongu & Tchamyou,
2016). These include amongst others: general discussions on KE (Rooney, 2005; Lin, 2006;
Anyanwu, 2012); innovation (Carisle et al., 2013); information & communication technologies
(Butcher, 2011); education (Ford, 2007; Weber, 2011); institutional regime & economic
incentives (Cogburn, 2003; Letiche, 2006); indigenous knowledge systems (Raseroka, 2008;
Lwoga et al., 2010); research & development (German & Stroud, 2007; Sumberg, 2005);
intellectual capital & economic development (Wagiciengo & Belal, 2012; Preece, 2013);

4
intellectual property rights (Zerbe, 2005; Lor & Britz, 2005; Myburgh, 2011; Andrés & Asongu,
2013ab; Andrés et al., 2014; Asongu, 2013a); KE in space transformation (Moodley, 2003;
Maswera et al., 2008) and spatiality in the production of knowledge (Bidwell et al., 2011;
Neimark, 2012).
The above stream of narratives is consistent with the need for more scholarly research on
factors encouraging KE in Africa. South Korea relied on KE in the doing of business to achieve
its spectacular development (Such & Chen, 2007). As far as we have reviewed, there is yet no
study that has investigated the relevance of KE in African business. Against this background, it is
relevant to position an inquiry on the relevance of KE in African business for the following
reasons.
First, since Africa is increasingly nursing ambitious of KE projects1, understanding the
relevance of these projects in the doing of business in the continent would provide policy makers
with the much needed guidance. This point is even more crucial due to failed post-independence
industrialization-based measures and thwarted structural adjustment policies of liberalization and
privatization (Rolfe & Woodward, 2004) that have not substantially boosted African business
(especially intra-regional trade).
Second, Knowledge-based African business growth holds high potential for the
improvement of existing agricultural economies and development of value-added technology-
based services essential for economic prosperity, competitiveness and adaptation to the
challenges of globalization2.
Third, KE potentially holds the promise of lifting the continent out of poverty through the
much needed investment opportunities and employment possibilities (to tackle soaring
demographic change). While there are growing challenges in African business (Leke et al., 2010;
Ernst & Young, 2013), the transition from product-based economies to a KE typically involves
1 Ghana is driving to become West Africa’s high tech hub with its ambitious 10 billion USD Information Technology
university in Hope City, launched by President John Mahama on the 4th of March 2013. In January 2013, Kenya also
unveiled plans to build an “Africa’s Silicon Savannah” within 20 years at the cost of 14.5 billion USD. Accordingly,
Kenya’s Konza Technology City is supposed to create more than 200 000 jobs by 2030. Rwanda and Paul Kagame’s
ambitions of creating a silicon valley in the small country cannot go unmentioned because, in the 2012 report
released by the International Telecommunication Union (ITU), Rwanda, Bahrain, Brazil, Ghana, Kenya, and Saudi
Arabia are the developing nations with strong dynamic information & communication technology (ICT) markets
because they are catching-up quickly to bridge the so-called ‘digital divide’ (ITU, 2012). 2 In comparison to technology-based economies, agricultural –based economies have fewer added values. This is
essentially because cocoa and coffee cash crops have not changed for generations (with prices relatively staying the
same after controlling for inflation). This is not the case with ICTs and patented innovative services which can create
billionaires overnight.

5
measures such as long-run investment in education, modernizing the information infrastructure,
innovation capability and nurturing an economic environment that is conducive for market
transactions.
In light of the above, this paper aims to assess how KE affects African business dynamics,
notably: starting business, doing business and ending business. We employ panel instrumental
variable fixed effects to account for the unobserved heterogeneity among sampled countries and
issues of potential endogeneity. Concerns of information redundancy in the KE dimensions are
mitigated by using principal components analysis. But for some exceptions, the findings broadly
show that KE drives the starting and doing of business in Africa. The investigation is original in
its contribution at the same time to the scarce literature on African KE and the growing
challenges of improving the business climate of the continent by means of KE.
The rest of the paper is organized as follows. Section 2 presents the conceptual framework
which embodies stylized facts and theoretical highlights. The literature review of KE and African
business is covered in Section 3. The methodology and data are presented in Section 4. The
empirical analysis is covered in Section 5. Section 6 concludes.
2. Conceptual framework: stylized facts and theoretical highlights
2.1 Stylized facts: the knowledge revolution and global business
As interestingly documented by Suh & Chen (2007), the worldwide rate at which
knowledge is created and disseminated has increased substantially over the past decades. One of
the reasons documented for this surge is the rapid growth in ICTs which have substantially
mitigated the cost of electronic networking and computing power. According to the narrative,
growing affordability of modern ICTs has led to more efficient diffusion of existing knowledge.
In this light, researchers from different locations can work together to improve research
productivity which ultimately leads to enhanced research and development (R&D), as well as the
generation of new technologies and knowledge. To put these creations of technologies and new
knowledge into perspective, the number of trademarks and patents granted in the United States
increased by more than 120% between 1981 and 2005. During the same period, the share of
patents granted outside the USA increased to 48% in 2005 from 39% in 1981.
The world economy has become more competitive with this growing speed in the creation
and diffusion of knowledge. The share of world trade as a percentage of GDP which captures

6
global competition and globalization increased to 47% in 2003 from 24% in 1960 (Suh & Chen,
2007). Hence, it is logical to infer that KE has increased the starting and doing of business
because international trade augments the number of market participating producers and
consumers. Hence, the revolution in knowledge accompanied with growing globalization is
presenting valuable opportunities for the promotion of business, social and economic
development.
The downside however of these evolving trends is that, nations could also be confronted
with a substantial risk of being left behind if they are unable to adapt to or keep even pace with
these changes. In addition to the growing levels of business activities, the nature of business itself
is also changing. Essentially, while business was once founded on only the dimension of ‘cost’, it
has today evolved to a degree whereby, innovation and speed are essential for a successful
venture. The production of goods and services that was previously left to the dictates of the
lowest-cost producers is no longer the rule of the ‘business game’ because massive competition
from an increasingly globalised economy has driven profits down to the neighborhood of zero. In
this light, the imperative of using added value is obvious: including design, efficient distribution,
differentiation of products, reputable brand names and effective marketing. Hence for an industry
to grow sustainably, it is essential for it to actively and productively generate new value chains as
well as contribute to existing ones. Accordingly, key elements in value chains are high-value
services and innovation, not necessarily production (Suh & Chen, 2007).
Against the above background, sustained economic prosperity in the age of globalization
significantly depends on the nurturing and developing of strategies that integrate sustained used
of knowledge creation at the center of the process of development. In this scenario, higher
development thresholds are characterized by: greater levels of technological capability and
science as well as motivations to engage in the production of commodities with higher value
added that are consistent with the higher wages demanded by workers in the economies. In the
same vein, lower development thresholds are characterized by: tapping from existing know-how
and adapting foreign knowledge and technologies locally to improve domestic productivity
because of lower levels in technological capability and science.
2.2 Theoretical highlights: knowledge economy and development

7
In accordance with the literature (Asongu, 2015a; Suh & Chen, 2007), a KE is one that
makes use of knowledge as the principal engine of economic prosperity. This is an economy in
which knowledge created, acquired, used and disseminated effectively improves economic
development. Contrary to some opinions and beliefs, the KE concept does not necessarily and/or
essentially revolve around high information technology or technology. As a case in point, the
application of subsistence farming techniques could significantly augment yields. According to
this narrative, the transition from product-based economies to a KE typically involves measures
such as long-run investment in education, modernizing the information infrastructure, innovation
capability and nurturing an economic environment that is conducive for market transactions. The
World Bank has qualified the four elements as pillars of KE.
On a specific note, some elaborate discussion on the four pillars is necessary. First,
institutional regime and economic incentives provide appealing institutions and economic
policies. The latter foster efficient resources allocation and stimulate incentives and creativity for
the efficient creation, use and dissemination of existing knowledge. Second, the skilled and
educated work force that continuously adapts and upgrades skills for the efficient creation and
use of knowledge. Third, an adequate and a modern information infrastructure that facilitates
effective processing, communication and dissemination of knowledge. Fourth, an effective
system of innovation in research centers, firms, consultants, universities and other organizations
have a number of positive rewards. They ensure the knowledge revolution derives from an
evolving stock of global knowledge that seemingly enhances the assimilation and adaptation of
knowledge to the needs of the local population. Hence, the KE framework is a postulation that
investments and interactions among the discussed four pillars are imperative for the sustained
use, creation, adaptation and adoption of knowledge in the production process of a domestic
economy. The ultimate outcome will be commodities with higher added-value that augment the
likelihood of economic success in the current globalized and competitive world economy.
Indeed, the globalization phenomenon is now an ineluctable process of which failure to
adapt to its challenges can only be at the price of sacrificing the economic prosperity of a nation.
Today, it has become very clear that for any country to be actively engaged in the global
economy, it has to be competitive. Competition in the 21st century has been centered on KE,
which has become the principal theme of the Organization for Economic Co-operation and
Development (OECD) and World Bank reports since the year 2000 (World Bank, 2007; Weber,

8
2011; Asongu, 2015a). In this light, KE has been perfectly understood by Europe and North
America who have been dominating development in the international arena for decades. Latin
America has been responding to the challenges in calculated steps that emphasize the growing
need for KE (Dahlman, 2007). The Japanese pattern has also set the KE course for the Newly
Industrialized Economies of Asia (South Korea, Hong Kong, Taiwan & Singapore), Malaysia and
China (Chandra & Yokoyama, 2011; Asongu, 2015a).
Among these freshly industrialized Asian nations, South Korea has achieved one of the
most spectacular transitions to ‘knowledge-based economy’ from its ‘product-based economy’ of
the industrialization era. In accordance with Suh & Chen (2007), the business oriented experience
of the republic of South Korea also known as the ‘Korean model’ could serve as a valuable lesson
for African countries because the country has witnessed one the most impressive prosperities of
the 20th century: from a low-income country in the 1950s to an OECD industrialized nation
before the end of the millennium. Korea is usually used as a model for African development
because it had almost the same level of development as most African countries in the 1960s3. The
Korean experience in KE is especially relevant in the area of doing business (Tran, 2011; Kim,
2013). This is essential in reversing the Knowledge Economy Index (KEI) trends of the continent
that fell between 2000 and 2009 (Anyanwu, 2012).
3 Knowledge Economy and Africa Business
3.1 Knowledge economy in Africa
The interesting literature on KE in Africa can be discussed in eleven main strands: general
discourses, innovation, education, ICTs, institutional regime & economic incentives, indigenous
knowledge systems, research & development, intellectual capital & economic development,
intellectual property rights (IPRs), KE in space information and spatiality in the production of
knowledge (Asongu, 2014; Asongu & Tchamyou, 2016).
In the first strand on general discourses about KE, Anyanwu (2012) has recently
investigated the state of knowledge on the continent and concluded that Africa is substantially
3 For instance, “After the Korean war, South Korea was one of the world's poorest countries with only $64 per capita
income. Economically, in the 1960s it lagged behind the Democratic Republic of the Congo (DRC) – currently
holding elections marred by violence . Since then the country's fortunes have diverged spectacularly. South Korea
now belongs to the rich man's club, the OECD development assistance committee (DAC). The DRC has gone
backwards since independence and, out of 187 countries, ranked bottom in the 2011 Human Development Index”
(Tran, 2011).

9
lagging behind when compared to other regions and advanced countries. The author confirms his
picture of the KE situation by stating that the KEI fell between the year 2000 and 2009. The
dominant discourses on society, knowledge, economy and technology had earlier been analyzed
by Rooney (2005) who concluded on limitations in a number of dimensions: amongst others,
technocracy and KE understanding. Lin (2006) criticizes the classical growth-oriented exposition
of KE by providing other neglected and important dimensions after rethinking the KE-growth
nexus. The author refocuses on the importance of knowledge in easing equality, environmental
conservation and wealth.
In the second strand on innovation, Carisle et al. (2013) assess the role of innovation in
tourism and find that institutions have a critical role in preserving best practices, networking and
transfer of knowledge. The phenomenon has been recognized as a principal source of
productivity and economic growth in an interesting investigation of ‘innovation in African
development’ (Oyelaran-Oyeyinka & Gehl, 2007). In summary, the imperative for more
innovation in African development has been discussed consistently in the stream of recent
literature (Anyanwu, 2012).
In the third stream on education, Africa’s position on the information highway has been
investigated by Ford (2007) who has documented interesting challenges the continent is facing in
the digital age. The value and production of doctoral dissertations has been investigated by
Amavilah (2009) who has concluded on the need for more investment in knowledge production
in Africa. Chavula (2010) has assessed how knowledge affects economic growth and concluded
that policy needs to lay more emphasis on KE projects. Weber (2011) establishes that education
diversifies the economy, preserves cultural integrity and ends illiteracy. Wantchekon et al. (2014)
assess the positive role of education on human capital externalities.
The fourth strand on ICTs largely draws from the African Partnership Forum (2008) report
which has established that as the continent is on the move, ICTs are necessary in boosting
economic growth and reducing poverty. Consistent with the interesting narrative, ICTs create
new income generating opportunities, enable access to new markets or services, improve
governance and ameliorate efficiency. This line of analysis is broadly in accordance with Butcher
(2011) and Chavula (2010).
Economic incentives & institutional regime constitute the fifth strand and fourth KE pillar.
In this stream, Cogburn (2003) has provided valuable insights into best practices and lessons for
10
other developing countries while trying to elucidate the transition in international
telecommunications regimes. Behavioral economics has been employed by Letiche (2006) to
explain the success of economic transitions, presented in an assessment on developing countries
with varying customs, traditions…etc. Andrés et al. (2014) have examined the importance of
formal governance in African KE to conclude that institutions are not necessarily a sufficient
premise for KE given the instrumentality of IPRs. Along the same institutional lines, Andrés &
Asongu (2013a) have concluded that the best channel in fighting software piracy is corruption-
control. Excess liquidity concerns have also been raised as possible causes for the lack of
investment on the continent (Saxegaard, 2006; Nguena & Tsafack, 2014).
The sixth strand is concerned with ‘indigenous knowledge systems’. Roseroka (2008) has
examined how to preserve indigenous knowledge space and consolidated some points on the
comparative advantages of oral knowledge. After applying approaches of knowledge
management to indigenous KE, Lwoga et al. (2010) have established that the former could be
employed to manage the latter when distinct features are controlled for.
The seventh stream is focused on R&D. In this strand, Sumberg (2005) has investigated the
evolving international architecture of research in agriculture and established that global research
systems are asymmetric with African research realities. The understanding and applications of R
& D have been undertaken by German & Stroud (2007) who have presented types, lessons and
implications of learning approaches. In a nutshell, the recent interesting stream of studies has
been consistent with the imperative of more R&D (African Development Bank, 2007; Chavula,
2010; Anyanwu, 2012).
In the eighth strand on ‘intellectual capital & economic development’, Wagiciengo & Balal
(2012) have been principally concerned with lifelong learning and information disclosure. Their
study concludes that intellectual capital disclosure is on the rise in corporations of the continent.
In the same vein, the relationship between the international ambition for lifelong learning and
foreign aid in less developed countries have been assessed by Preece (2013) who concludes that
international aid priorities have a negative effect on the manner in which government choices and
policies affect lifelong learning. This hypothesis has been rejected after verification in Africa
(Asongu & Tchamyou, 2015).
The ninth strand covers IPRs. In this stream, Zerbe (2005) has assessed the African Union’s
Legislation for the protection of Indigenous knowledge to establish that it meets the requirements

11
and needs of countries on the continent by balancing the rights of monopoly breeders with those
of the indigenes. The trends in knowledge and their effects on international information flow
have been assessed by Lor & Britz (2005) who have provided three main ethical pillars to explain
the flow: human rights, common good and social justice. Legal processes have been reviewed by
Myburgh (2011) in the protection of plant-related knowledge. The author as an IPRs lawyer
presents his/her views on differences in the protection of traditional knowledge that is plant-
based. Andrés & Asongu (2013b) and Asongu (2013a) have detailed timelines for common IPRs
protection initiatives globally and in Africa respectively. Corruption-control is the best weapon in
the fight against software piracy given the instrumentality or enforcement of IPRs (Andrés &
Asongu, 2013a). Along the same line of research, Andrés et al. (2014) conclude that formal
institutions are not necessarily enough mechanisms for the enhancement of KE.
The tenth strand deals with KE in the transformation of space. In this stream, Moodley
(2003) has assessed the importance of electronic (e)-business in the South African apparel sector:
discussing challenges, risks and opportunities of e-business in this sector. The adoption rate of e-
commerce in the tourism industry has been examined by Maswera et al. (2008). They have
concluded that, though Africa has informative websites, these do not have interesting e-
transactions interactive facilities.
In the eleventh strand, we cover the spatiality of knowledge production. Here, Bidwell et al.
(2001) have an interesting work that assesses how technology can be adapted to rural needs and
heritages. They provide valuable explanations on how a rural community manages information
spatially and temporarily. Neimark (2012) documents changes in bioprospecting in Madagascar
after examining its political economy.
The interesting literature above could be summarized in two points: there is need for greater
KE in Africa and like South Korea, business can be enhanced on the continent through KE
mechanisms.
3.2 African Business
As far as we have reviewed, African business literature can be classified into three main
strands: the factors affecting foreign direct investment (FDI), entrepreneurship, and strategies for
achieving sustainable development (Asongu & Tchamyou, 2016).
The first strand concerns a recent stream of studies that has focused on how Africa’s share
in investment (especially FDI) can be improved (Asongu, 2012). The Zambian experience of

12
using privatization policies to attract FDI has been assessed by Rolfe & Woodward (2004) who
conclude that in spite of soaring FDI in the previous decade, the economy was in stagnation.
According to the narrative, countries in many SSA nations need to seek alternative sources of
investment after the failed privatization projects. Bartels et al. (2009) investigate factors behind
SSA’s persistently low global share of FDI (1%) to establish that the location decisions of FDI in
SSA are strongly affected by political economy issues. Bartels et al. (2014) confirm the factors
affecting the location of FDI decisions in SSA in the international business literature: political
stability, economic stability, infrastructure, local market, legal framework, local supplies,
incentive packages, labour costs…etc. Using 1400 firms in 19 SSA countries, Amendolagine et
al. (2013) have examined the determinants of backward nexuses of FDI in the sub-region and
concluded that high local relationships are linked with local partners, time and market factors.
Kinda (2010) examines how the investment climate affects FDI in 77 developing countries for
period 2000 to 2006 to conclude that infrastructural, institutional and financial issues
substantially hamper FDI. Tuomi (2011) using micro level analysis finds that skill, exchange
volatility, labor regulation and political & regulatory uncertainty are key factors in driving FDI.
Yin & Vaschetto (2011) assess a strategic perspective of China’s investment in Africa and
conclude that China’s strategy on non-interference (soft power and complementarity) is paying-
off. Kolstad & Wiig (2011) have assessed the motivations for Chinese FDI on the continent to
conclude that weak institutions are primarily motivating Chinese FDI location decisions. The
public policy challenges, strategies and implications presented by Darley (2012) are broadly
consistent with the findings of above studies. De Maria (2010) examines corruption in Malawi
and concludes on a challenge on Western appropriation of African corruption.
In the second strand on entrepreneurship, Alagidede (2008) has postulated that doing
business in Africa is so risky. Eifert et al. (2008) have assessed the cost of doing business in
Africa using data from 7000 firms in 17 countries for the period 2002-2003 to conclude that
existing estimates undervalue the relative performance of African firms. Taplin & Synman (2004)
provide a legal perspective on doing business in South Africa and describe new regime changes
and challenges. Tapsoba (2010) has examined how trade intensity affects business cycle
synchronization in 53 African countries with data for the period 1965 to 2004 to conclude that
trade intensity increases the synchronization of business cycles. Khavul et al. (2009) study the
establishment and evolution of East African entrepreneurs to conclude that entrepreneurs use

13
strong family and community ties for the growth in activities. Bardy et al. (2012) have assessed if
FDI leads to social responsibility in least developed countries to provide valuable theoretical and
practical evidences on the relationship. Paul et al. (2010) investigate how labour regulation
affects the cost of doing business and conclude that the World Bank ‘Doing Business’ indices on
‘employing workers’ do not provide a complete picture. Gerba (2012) has investigated the
entrepreneurial intentions of undergraduate students in Ethiopia to conclude that entrepreneurship
studies increase motivations for doing business, especially in male management students. The
motivations of Nigerian women’s decisions to become an entrepreneur are assessed by Singh et
al. (2011) who find some significance in family capital, internal orientation of social recognition,
educational and an internal environment that is characterized by economic deregulation.
The third strand consists of a stream of studies that is oriented towards business strategies
for achieving sustainable African development. Rugimbana (2010) provides an interesting
literature that links sustainable development in Africa to varying contributions in different
business disciplines. The author addresses concerns with interesting outcomes for sustainable
development as well as future strategies and thinking. Dimba (2010) analyses the nexus between
strategic human resource management practices and firm performance to show that the practices
that best predict the performance of firms are compensation systems, training and development.
Oseifuah (2010) investigates the relationship between youth entrepreneurship and the level of
financial literacy in South Africa to conclude that the latter contributes to entrepreneurial skills.
Mensah & Benedict (2010) assess the long-run effect on entrepreneurship training to establish
that government hand-out poverty mitigation initiatives only have short-run effects, with
unintended consequences of demonstrations and violent protests. On the other hand, the provision
of entrepreneurial facilities and training procure small enterprises with the opportunities to
improve their businesses and ultimately remove the population from poverty.
The above studies are broadly consistent with recent reports on the challenges of doing
business in Africa (Leke et al., 2010; Ernst & Young, 2013). Hence, the current paper aims to
assess the role of KE in addressing some of the challenges.
As discussed in the motivation, my contribution to the above literature is threefold. First,
the paper is timely given that African countries are currently nursing ambitions of KE projects. It
should be recalled that structural adjustment policies of liberalization and privatization have not
yielded the expected fruits in terms of boosting African business (Rolfe & Woodward, 2004).

14
Second, Knowledge-based African business growth holds high potential for the improvement of
existing agricultural economies and development of value-added technology-based services that
are essential for economic prosperity, competitiveness and adaptation to the challenges of
globalization. Third, the most appealing of my modest contributions is that KE holds the promise
of lifting the continent out of poverty through the much needed investment opportunities and
employment possibilities.
4. Data and Methodology
4.1 Data
We examine a panel of 53 African countries with data from African Development
Indicators of the World Bank for the period 1996-2010. The data begins from 1996 because the
good governance variables needed for the institutional regime component of KE are only
available from the year 1996. The choice of the variables is broadly consistent with recent KE
(Asongu et al., 2014; Amavilah et al., 2014) and African business literature summarized in
Tables 1-2 and discussed in the preceding section (AfDB4, 2007; Aubert, 2005; Britz et al., 2006;
Chavula, 2010; World Bank, 2007; Asongu, 2015b; Asongu & Tchamyou, 2016). We classify the
indicators into dependent, independent and control variables in order to improve readability.
4.1.1 Dependent variables
As shown in Panel B of Table 1 below, African business dependent indicators are classified
into: starting, doing and ending business. The three classes of indicators are adopted for: (i) more
robustness and (ii) additional focused policy implications. Essentially, the life cycle of any
business activity has the three main phases adopted in the study.
First, three starting business indicators are adopted to appreciate: the time required to start a
new business, the cost of starting a new business and the number of newly created businesses.
Second, the doing business indicators are classified into trade openness, technology exports and
property rights institutions. (1) The cost of export, tariff on products, ‘exports plus imports’ are
used to proxy for trade openness. (2) Technology exports are presented in terms of: ICT good
exports, ICT service exports and High technology commodity exports. (3) Three main
4 African Development Bank.

15
dimensions of ‘property rights institutions’ are considered: contract enforcement (time required to
enforce a contract), registration of property (time required to register a property) and investor
protection (the extent of business disclosure). Third, the time required of resolve insolvency is
used to proxy for the last business category: ending business. The choice of the variables is
broadly consistent with recent African business literature (Leke et al., 2010; Ernst & Young,
2013). Moreover, the institutional web of formal rules, informal norms and the characteristics of
their enforcements determined business climate (La Porta et al., 1998, 1999).
4.1.2 Independent variables
The independent KE variables are in accordance with World Bank’s KEI: innovation,
education, institutional regime & economic incentives and ICT. The World Bank’s KEI provides
a measure of the relative state of the knowledge in a country. It depicts a view of the bigger
picture of a country’s performance in modern KE, as well as enabling benchmarking and
monitoring (Suh & Chen, 2007). Due to substantial issues of multicollinearity and
overparameterization, each KE dimension is derived from Principal Component Analysis,
summarized and defined in Panel A of Table 1, discussed in Section 4.2.1 and presented in Table
4.
4.1.3 Control variables
We control for macroeconomic factors that potentially affect the doing of business and are
not correlated with the KE independent variables of interest. These control variables include:
inflation, government expenditure, GDP growth and private investment. Naturally, the last-two
should be positively associated with starting and doing business while inflation should have the
opposite effect. The expected sign of government expenditure is unclear because it depends on a
number of factors, amongst others: the percentage of the budget allocated to facilitating business
activities and misallocation of budget through institutional malpractices like corruption. More
details on the control variables are provided in Panel C of Table 1 below.
Table 1: Variable definitions
Variables Signs Variable definitions Sources

16
Panel A: Dimensions in Knowledge Economy (KE)
A1: Education
Primary School Enrolment PSE School enrolment, primary (% of gross) World Bank (WDI)
Secondary School Enrolment SSE School enrolment, secondary (% of gross) World Bank (WDI)
Tertiary School Enrolment TSE School enrolment, tertiary (% of gross) World Bank (WDI)
Education in KE Educatex First PC of PSE, SSE & TSE PCA
A2: Information & Infrastructure
Internet Users Internet Internet users (per 100 people) World Bank (WDI)
Mobile Cellular Subscriptions Mobile Mobile subscriptions (per 100 people) World Bank (WDI)
Telephone lines Tel Telephone lines (per 100 people) World Bank (WDI)
Information & Communication
Technology (ICT) in KE
ICTex First PC of Internet, Mobile & Tel PCA
A3: Economic Incentive & Institutional Regime
Financial Activity (Credit) Pcrbof Private domestic credit from banks and
other financial institutions
World Bank (FDSD)
Interest Rate Spreads IRS Lending rate minus deposit rate (%) World Bank (WDI)
Economic Incentive in KE Creditex First PC of Pcrbof and IRS PCA
Corruption-Control CC “Control of Corruption (estimate):
Captures perceptions of the extent to
which public power is exercised for private
gain, including both petty and grand forms
of corruption, as well as ‘capture’ of the
state by elites and private interests”.
World Bank (WDI)
Rule of Law RL “Rule of Law (estimate): Captures
perceptions of the extent to which agents
have confidence in and abide by the rules
of society and in particular the quality of
contract enforcement, property rights, the
police, the courts, as well as the likelihood
of crime and violence”.
World Bank (WDI)
Regulation Quality RQ “Regulation Quality (estimate): Measured
as the ability of the government to
formulate and implement sound policies
and regulations that permit and promote
private sector development”.
World Bank (WDI)
Political Stability/ No violence PS “Political Stability/ No Violence
(estimate): Measured as the perceptions of
the likelihood that the government will be
destabilized or overthrown by
unconstitutional and violent means,
including domestic violence and
terrorism”.
World Bank (WDI)
Government Effectiveness GE “Government Effectiveness (estimate):
Measures the quality of public services,
the quality and degree of independence
World Bank (WDI)

17
from political pressures of the civil
service, the quality of policy formulation
and implementation, and the credibility of
governments commitments to such
policies”.
Voice & Accountability VA “Voice and Accountability (estimate):
Measures the extent to which a country’s
citizens are able to participate in selecting
their government and to enjoy freedom of
expression, freedom of association, and a
free media”.
World Bank (WDI)
Institutional Regime in KE Instireg First PC of CC, RL, RQ, PS, GE & VA PCA
A4: Innovation
Scientific & Technical Publications STJA “Number of Scientific & Technical Journal
Articles”
World Bank (WDI)
Trademark Applications Trademark “Total Trademark Applications” World Bank (WDI)
Patent Applications Patent “Total Residents + Nonresident Patent
Applications”
World Bank (WDI)
Innovation in KE Innovex First PC of Trademarks and Patents World Bank (WDI)
Panel B: Business Indicators
B1: Starting Business
Time to Start-up Timestart “Log of Time required to start a business
(days)”
World Bank (WDI)
Cost of Start-up Coststart “Log of Cost of business start-up
procedures (% of GNI per capita)”
World Bank (WDI)
New business density Newbisden “New business density (new registrations
per 1,000 people ages 15-64)”
World Bank (WDI)
Newly registered businesses Newbisreg “Log of New businesses registered
(number)”
World Bank (WDI)
B2: Doing Business
B2a: Trade
Cost of Export Costexp. “Log of Cost to export (US$ per
container)”
World Bank (WDI)
Trade Barriers Tariff “Tariff rate, applied, weighted mean, all
products (%)”
World Bank (WDI)
Trade Openness Trade “Export plus Import of Commodities (% of
GDP)”
World Bank (WDI)
B2b: Technology Exports
ICT Goods Exports ICTgoods: “ICT goods exports (% of total goods
exports)”
World Bank (WDI)
ICT Service Exports ICTser “ICT service exports (% of service
exports, BoP)”
World Bank (WDI)
High-Technology Exports Hightecexp “High-technology exports (% of
manufactured exports)”
World Bank (WDI)

18
B2c: Property Rights
Contract Enforcement Contenfor Log of Time required to enforce a contract
(days)
World Bank (WDI)
Registration of Property Regprop Log of Time required to register property
(days)
World Bank (WDI)
Investor Protection
Bisdiclos
“Business extent of disclosure index
(0=less disclosure to 10=more disclosure).
It measures the extent to which investors
are protected through disclosure of
ownership information”
World Bank (WDI)
B3: Closing Business
Insolvency Resolution
Insolv
“Time to resolve insolvency (years). The
number of years from the filling of
insolvency in court until the resolution of
distressed assets”.
World Bank (WDI)
Panel C: Control Variables
Government Expenditure Gov. Exp. Government final consumption
expenditure (% of GDP)
World Bank (WDI)
Inflation Infl. Consumer Price Index (annual %) World Bank (WDI)
Economic Prosperity GDPg GDP Growth Rate (annual %) World Bank (WDI)
Private Investment Priv. Ivt. Gross Private Investment (% of GDP) World Bank (WDI)
“WDI: World Bank Development Indicators. GNI: Gross National Income. BoP: Balance of Payment. GDP: Gross Domestic Product. PC: Principal
Component. PCA: Principal Component Analysis. Log: logarithm. Educatex is the first principal component of primary, secondary and tertiary school
enrolments. ICTex: first principal component of mobile, telephone and internet subscriptions. Creditex: First PC of Private domestic credit and interest rate spread. P.C: Principal Component. VA: Voice & Accountability. RL: Rule of Law. R.Q: Regulation Quality. GE: Government Effectiveness. PS: Political
Stability. CC: Control of Corruption. Instireg (Institutional regime): First PC of VA, PS, RQ, GE, RL & CC. FDSD: Financial Development and Structure
Database”.
Table 2 below presents the summary statistics of the variables (Panel A) and the countries used in
the sample (Panel B). This descriptive statistics has a twofold motivation. On the one hand, it shows
that variables can be compared based on the means. In essence, definition of some variables in Table 1
in logarithms is to enable such a comparison. On the other hand, it shows that there is a significant
variation in the variables (standard deviations). Therefore, we can be confident that some reasonable
estimated relationships would be derived.
Table 2: Summary statistics and presentation of countries
Panel A: Summary Statistics

19
Mean S.D Min Max Obs.
Knowledge
Economy
Educatex (Education) -0.075 1.329 -2.116 5.562 320
ICTex (Information & Infrastructure) 0.008 1.480 -1.018 8.475 765
Creditex (Economic Incentive) -0.083 0.893 -4.889 2.041 383
Instireg (Institutional Regime) 0.105 2.075 -5.399 5.233 598
Scientific and Technical Journal Articles(log) 1.235 0.906 -1.000 3.464 717
Trademarks(log) 6.973 1.567 0.000 10.463 276
Patentes(log) 5.161 2.077 1.386 9.026 121
Starting
Business
Time to Start-up (log) 3.624 0.812 1.098 5.556 386
Cost of Start-up (log) 4.354 1.312 0.741 8.760 386
New business density 1.032 1.962 0.002 10.085 111
Newly registered businesses (log) 7.965 1.878 2.639 11.084 111
Doing
Business
Cost of Export (log) 7.282 0.517 6.137 8.683 305
Trade Barriers (Tariff) 11.474 5.611 0.000 39.010 347
Trade Openness (log) 4.239 0.476 2.882 5.617 719
ICT Goods Exports 0.788 1.979 0.000 20.944 391
ICT Service Exports 6.098 5.792 0.017 45.265 277
High-Technology Exports 4.640 7.192 0.000 83.640 455
Contract Enforcement (log) 6.434 0.383 5.438 7.447 383
Registration of Property (log) 4.175 0.756 2.197 5.983 346
Investor Protection: Disclosure 4.774 1.976 0.000 8.000 293
Closing
Business Insolvency Resolution 3.337 1.452 1.300 8.000 330
Control
variables
Inflation 57.556 955.55 -100.00 24411 673
Government Expenditure 4.392 12.908 -57.815 90.544 468
Economic Prosperity 4.763 7.293 -31.300 106.28 759
Private Investment 12.979 9.400 -2.437 112.35 658
Panel B: Presentation of Countries (53)
Algeria, Angola, Benin, Botswana, Burkina Faso, Burundi, Cameroon, Cape Verde, Chad, Central African
Republic, Comoros, Congo Democratic Republic, Congo Republic, Côte d’Ivoire, Djibouti, Egypt, Equatorial
Guinea, Eritrea, Ethiopia, Gabon, The Gambia, Ghana, Guinea, Guinea-Bissau, Kenya, Lesotho, Liberia, Libya,
Madagascar, Malawi, Mali, Mauritania, Mauritius, Morocco, Mozambique, Namibia, Niger, Nigeria, Senegal,
Sierra Leone, Somalia, Sudan, Rwanda, Sao Tomé & Principe, Seychelles, South Africa, Swaziland, Tanzania,
Togo, Tunisia, Uganda, Zambia, Zimbabwe.
S.D: Standard Deviation. Min: Minimum. Max: Maximum. Obs: Observations
The correlation matrix presented in Table 3 below has two main purposes. On the one hand,
it helps to avoid overparameterization and multicollinearity issues that could substantially bias
the estimated coefficients by producing unexpected signs if specified in the same model. Hence,
it is in this regard that some variables are not fitted into the same model in initial specifications in
Tables 6-8. For instance ICT (ICTex) and education (Educatex) have a correlation coefficient of
0.73, implying that approximately 73% of the educated population use information and
communication technologies. On the other hand, the correlation analysis gives us some feeling on

20
the expected signs between the dependent and independent variables, especially the controlled
macroeconomic characteristics.

21
Table 3: Correlation Analysis
Knowledge Economy (KE) Business Indicators Control Variables
Educ
atex
IC
Tex
Cred
itex
Insti
reg
STJ
A
Starting Business Doing Business Closing
Business
Infl-
ation
Gov.
Exp.
GDP
g
Priv.
Ivt.
Time Start
Cost Start
Bis den
Bis num
Trade Technology Exports Property Rights
Cexp Tariff T.O ICTg ICTs HT C.En P.R BDis Insolv.
1.00 0.73 -0.55 0.50 0.39 -0.17 -0.7 0.48 0.70 -0.47 0.06 0.39 0.35 -0.42 -0.06 0.05 0.11 -0.40 -0.58 -0.001 -0.03 0.01 0.25 Educatex
1.00 -0.55 0.49 0.21 -0.25 -0.6 0.62 0.54 -0.42 -0.09 0.33 0.26 -0.14 -0.006 0.03 -0.15 0.04 -0.30 0.002 -0.02 -0.04 0.23 ICTex
1.00 -0.6 -0.50 0.26 0.60 -0.3 -0.50 0.35 0.16 0.03 -0.18 0.13 -0.01 0.02 0.30 -0.36 0.32 0.22 0.05 0.13 -0.04 Creditex 1.00 0.29 -0.24 -0.6 0.60 0.47 -0.37 -0.22 0.16 0.25 -0.31 -0.09 -0.02 -0.07 0.04 -0.35 -0.09 -0.004 0.06 0.42 Instireg
1.00 -0.35 -0.4 -0.2 0.67 -0.13 -0.12 -0.2 0.07 -0.16 -0.06 -0.06 -0.09 0.26 -0.44 0.019 -0.01 -0.14 -0.05 STJA
1.00 0.39 -0.05 -0.09 0.11 0.07 0.26 -0.12 0.02 0.01 0.21 -0.03 -0.02 0.310 0.074 -0.02 -0.03 -0.13 Time Start
1.00 -0.5 -0.63 0.23 0.25 -0.1 -0.26 0.44 0.07 0.03 0.30 -0.04 0.45 0.10 -0.10 0.03 -0.35 Cost Start
1.00 0.25 -0.29 -0.34 0.55 0.48 -0.28 0.21 0.33 0.03 0.15 -0.16 -0.11 -0.05 -0.22 0.23 Bis den 1.00 -0.44 -0.23 0.24 0.29 -0.63 -0.24 0.10 -0.18 0.007 -0.51 0.09 0.04 0.01 0.26 Bis num
1.00 -0.08 -0.1 -0.18 0.14 0.14 -0.11 -0.15 0.002 0.145 0.031 0.14 -0.004 -0.32 Cexp
1.00 0.09 0.03 0.02 -0.02 0.17 0.04 -0.15 0.19 0.02 -0.08 -0.03 0.08 Tariff 1.00 0.21 -0.09 -0.02 0.20 -0.06 -0.03 0.001 0.03 -0.04 0.09 0.39 T.O
1.00 -0.002 0.13 -0.03 0.16 -0.13 -0.30 -0.01 -0.008 0.04 0.30 ICTg
1.00 0.21 -0.05 0.04 -0.02 0.340 -0.08 -0.03 -0.14 -0.01 ICTs 1.00 -0.04 0.14 -0.04 0.108 -0.14 -0.03 0.05 0.05 HT
1.00 0.04 0.03 0.169 -0.06 -0.04 0.04 -0.05 C.En
1.00 0.018 0.075 -0.06 -0.06 0.08 -0.09 P.R 1.00 0.086 0.10 -0.09 -0.20 -0.09 BDis
1.00 0.001 -0.08 0.06 -0.19 Insolv.
1.00 -0.13 -0.05 -0.04 Inflation
1.00 0.10 0.05 Gov. Exp.
1.00 0.37 GDPg
1.00 Priv. Ivt.
“Educatex: Education. ICTex: Information & Communication Technology. Creditex: Economic Incentives. Instireg: Institutional Regime. STJA: Scientific & Technical Journal Articles. Time Start:
Time to Start a Business. Cost Start: Cost of Starting a Business. Bisden: Business density. Bisnum: Business number. Cexp: Cost of exports. Tariff: Trade Barriers. T.O: Trade Openness. ICTg: ICT
goods exports. ICTs: ICT service exports. HT: High-tech exports. C. En: Contract Enforcement. P.R: Property Registration Time. Dis: Business Extent Disclosure. Insolv: Insolvency. Gov. Exp: Government Expenditure. GDPg: Gross Domestic Product growth rate. Priv. Ivt: Private Investment”.

22
4.2 Methodology
4.2.1 Principal Component Analysis
Consistent with Asongu (2014), one might criticize the redundancy in the information
provided for the dependent variables and each dimension of the KEI because the independent
variables could be correlated or each dimension of the KEI could be correlated with its
component variables individually. Accordingly, we use principal component analysis (PCA).
PCA is a common statistical technique that is employed to reduce a larger set of correlated
variables into a smaller set of uncorrelated variables called principal components (PCs) that
account for most of the variation in the original dataset. The criteria used to determine how many
common factors to retain are from Kaiser (1974) and Jolliffe (2002). They recommend dropping
factors with an eigenvalue smaller than one.
From Table 4 below it can be observed that the first PC of education (Educatex) represents
more than 65% of information in primary school enrolment (PSE), secondary school enrolment
(SSE) and tertiary school enrolment (TSE) combined. In the same light, the first PC of
institutional regime (Instireg) represents more than 77% of information in political governance
(voice & accountability and political stability), economic governance (regulation quality and
government effectiveness) and institutional governance (corruption-control & rule of law). This
explanation is consistent with ICTex (Information & Communication Technology Index),
Innovex (Innovation Index) and Creditex (Economic Incentive Index).
The choice of the variables in each KE dimension is broadly consistent with the World
Bank’s KEI (Suh & Chen, 2007). Moreover, the choice of variables in the economic incentive
dimension is motivated by the substantially documented surplus liquidity issues that are stifling
business activities on the continent (Saxegaard, 2006).

23
Table 4: Principal Component Analysis (PCA) for Knowledge Economy Indicators Knowledge Economy
dimensions
Component Matrix (Loadings) First
PC
Eigen
Value
Indexes
Education School
Enrolment
PSE SSE TSE
0.438 0.657 0.614 0.658 1.975 Educatex
Information &
Infrastructure
ICTs Internet Mobile Telephone
0.614 0.584 0.531 0.730 2.190 ICTex
Innovation
System
Innovation STJA Trademarks Patents
0.567 0.572 0.592 0.917 2.753 Innovex
Economic
Incentive
&
Institutional
regime
Economic
Incentive
Private Credit Interest rate Spread
-0.707 0.707 0.656 1.313 Creditex
Institutional
index
VA PS RQ GE RL CC
0.383 0.374 0.403 0.429 0.443 0.413 0.773 4.642 Instireg
“P.C: Principal Component. PSE: Primary School Enrolment. SSE: Secondary School Enrolment. TSE: Tertiary School Enrolment. PC: Principal
Component. ICTs: Information and Communication Technologies. Educatex is the first principal component of primary, secondary and tertiary
school enrolments. ICTex: first principal component of mobile, telephone and internet subscriptions. STJA: Scientific and Technical Journal Articles. Innovex: first principal component of STJA, trademarks and patents (resident plus nonresident). VA: Voice & Accountability. RL: Rule
of Law. R.Q: Regulation Quality. GE: Government Effectiveness. PS: Political Stability. CC: Control of Corruption. Instireg (Institutional
regime): First PC of VA, PS, RQ, GE, RL & CC. Creditex: first principal component of private domestic credit and interest rate spread”.
The basis for the principal component analysis (or the high degrees of substitution among
different constituent variables in the KE dimensions) is detailed in the Appendices. The
justification for education (Panel A), ICT (Panel B) and Innovation (Panel C) are presented in
Appendix 1, whereas that for institutional regime is provided in Appendix 2. Due to substantial
issues in degrees of freedom in the Innovation index, we have exceptionally used Scientific and
Technical Journal Articles (STJA) as the proxy for innovation. This is essentially due to the low
number of patent applications in comparison to other innovation variables (see Panel A of Table
2). The used of STJA to appreciate innovation is consistent with Chavula (2010, p.20).
4.2.2 Estimation Technique
The estimation strategy controls for potential endogeneity between African business and
KE. The intuition for reverse causality is evident since; the improvement in the business climate
of countries has some impact on various dimensions of KE. The estimation technique that is
consistent with that employed by Ivashina (2009, p. 301) consists of regressing the KE variables
on their first lags, then saving the fitted values that are later used in the second-stage (main
equation) regressions. This empirical approach is summarized as follows.
24
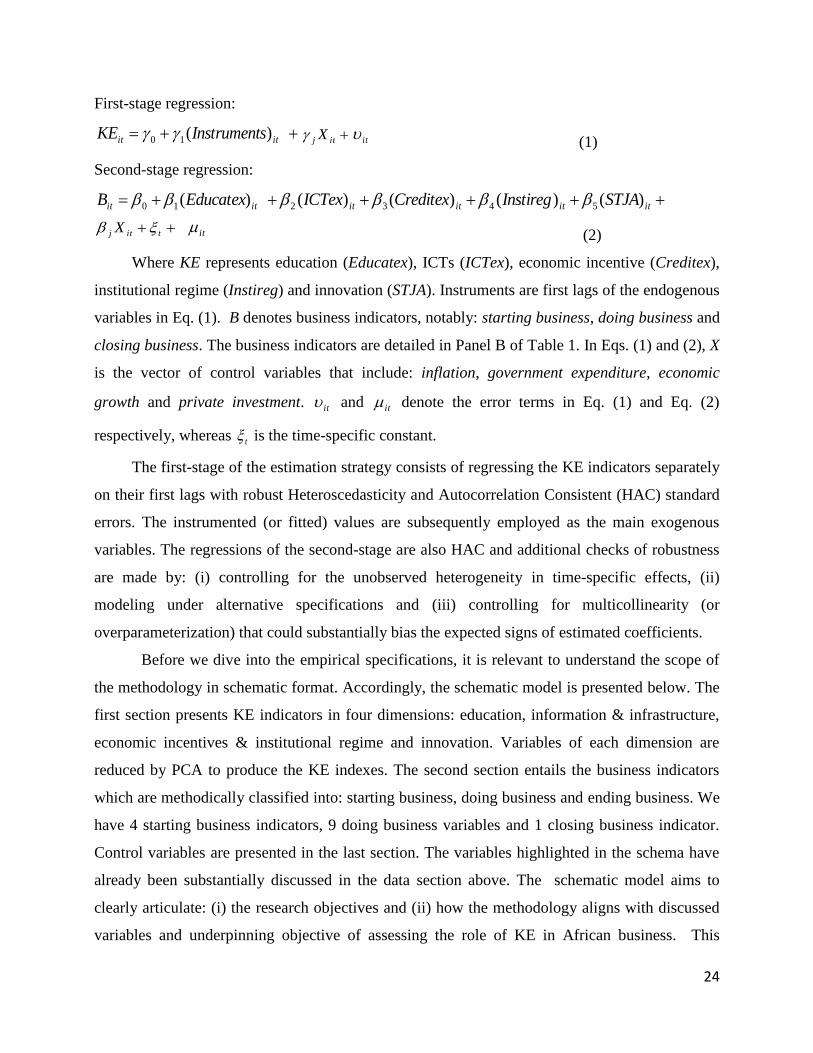
First-stage regression:
itit sInstrumentKE )(10 itj X it (1)
Second-stage regression:
itititititit STJAInstiregCreditexICTexEducatexB )()()()()( 543210
titj X it
(2)
Where KE represents education (Educatex), ICTs (ICTex), economic incentive (Creditex),
institutional regime (Instireg) and innovation (STJA). Instruments are first lags of the endogenous
variables in Eq. (1). B denotes business indicators, notably: starting business, doing business and
closing business. The business indicators are detailed in Panel B of Table 1. In Eqs. (1) and (2), X
is the vector of control variables that include: inflation, government expenditure, economic
growth and private investment. it
and it denote the error terms in Eq. (1) and Eq. (2)
respectively, whereas t is the time-specific constant.
The first-stage of the estimation strategy consists of regressing the KE indicators separately
on their first lags with robust Heteroscedasticity and Autocorrelation Consistent (HAC) standard
errors. The instrumented (or fitted) values are subsequently employed as the main exogenous
variables. The regressions of the second-stage are also HAC and additional checks of robustness
are made by: (i) controlling for the unobserved heterogeneity in time-specific effects, (ii)
modeling under alternative specifications and (iii) controlling for multicollinearity (or
overparameterization) that could substantially bias the expected signs of estimated coefficients.
Before we dive into the empirical specifications, it is relevant to understand the scope of
the methodology in schematic format. Accordingly, the schematic model is presented below. The
first section presents KE indicators in four dimensions: education, information & infrastructure,
economic incentives & institutional regime and innovation. Variables of each dimension are
reduced by PCA to produce the KE indexes. The second section entails the business indicators
which are methodically classified into: starting business, doing business and ending business. We
have 4 starting business indicators, 9 doing business variables and 1 closing business indicator.
Control variables are presented in the last section. The variables highlighted in the schema have
already been substantially discussed in the data section above. The schematic model aims to
clearly articulate: (i) the research objectives and (ii) how the methodology aligns with discussed
variables and underpinning objective of assessing the role of KE in African business. This

25
framework is broadly consistent with Mohapatra (2015) and Mohapatra and Thakurta (2014) in
recent business education and knowledge management literature.

26
PCA
PCA
PCA
PCA
PCA
Knowledge
Economy
(4 dimensions)
African Business
(3 Dimensions)
Control variables
- Government Expenditure
- Inflation
- GDP growth
- Gross Private Investment
4. Innovation
(STJA – Trademarks – Patents)
Educatex
ICTex
Instireg
Creditex
2. Doing Business
Innovex
2. Information & Infrastructure
(Internet – Mobile – Telephone)
3. Economic Incentive
(Credit - Interest Rate Spread (IRS))
- Time to start a business (1 variable)
- Cost of starting a business (1 variable)
- Number of new businesses (2 variables)
Schematic Model
1. Education
(PSE – SSE – TSE)
Institutional Regime - Voice & Accountability
- Political Stability
- Regulation Quality
- Government Effectiveness
- Rule of Law
- Corruption Control
1. Starting Business
3. Closing Business
- Trade (3 variables)
- Technology Exports (3 variables)
- Property Rights (3 variables)
Insolvency Resolution (1 variable)

27
5. Empirical Analysis
5.1 Presentation of Results
The section aims to investigate three main concerns: (i) the incidence of KE on starting
business; (ii) the effect of KE on doing business and (iii) the impact of KE on ending business.
Table 5 below summarizes the findings of Table 6 (starting business), Table 7 (doing business)
and Table 8 (ending business). From the summary the following conclusions could be drawn.
First, regarding the effect of KE on starting a business, we found the following. (1)
Education: (i) decreases the time of starting a business; (ii) reduces the cost of starting a business
and (iii) increases business density and numbers. (2) ICT: (i) reduces the time of starting a
business; (ii) decreases the cost of starting a business and (iii) increases the number of businesses.
(3) Economic incentives reduce the cost of starting business but unexpectedly also decrease
business density and number. (4) Institutional regime increases the time of starting a business and
decreases business density. (5) Scientific & Technical Journal Articles (STJA) proxying for
innovation decrease business density but increase business number.
Second, we highlight the incidence of KE on doing business in three strands. (1) On the
effect on trade: (i) education increases the cost of exports and reduces trade tariffs; (ii) ICT and
Economic incentives have a negative incidence on the cost of exports and trade tariffs whereas,
STJA decrease trade tariffs. (2) With regard to the impact of technology exports: (i) education,
ICT and economic incentives increase ICT services exports; (ii)ICT has a positive effect on high
technology goods exports while (iii) STJA increase ICT goods exports but decrease ICT services
and high technology commodity exports. (3) On property rights institutions: (i) education
decreases contract enforcement time and the extent of business disclosure; (ii) ICT has a negative
impact on contract enforcement and private property registration time but a positive effect on
business extent disclosure while (iii) economic incentives decrease private property registration
time.
Third, with the exception institutional regime that has a negative effect on the time needed
to resolve insolvency, the findings on closing a business are not overwhelmingly significant.
28
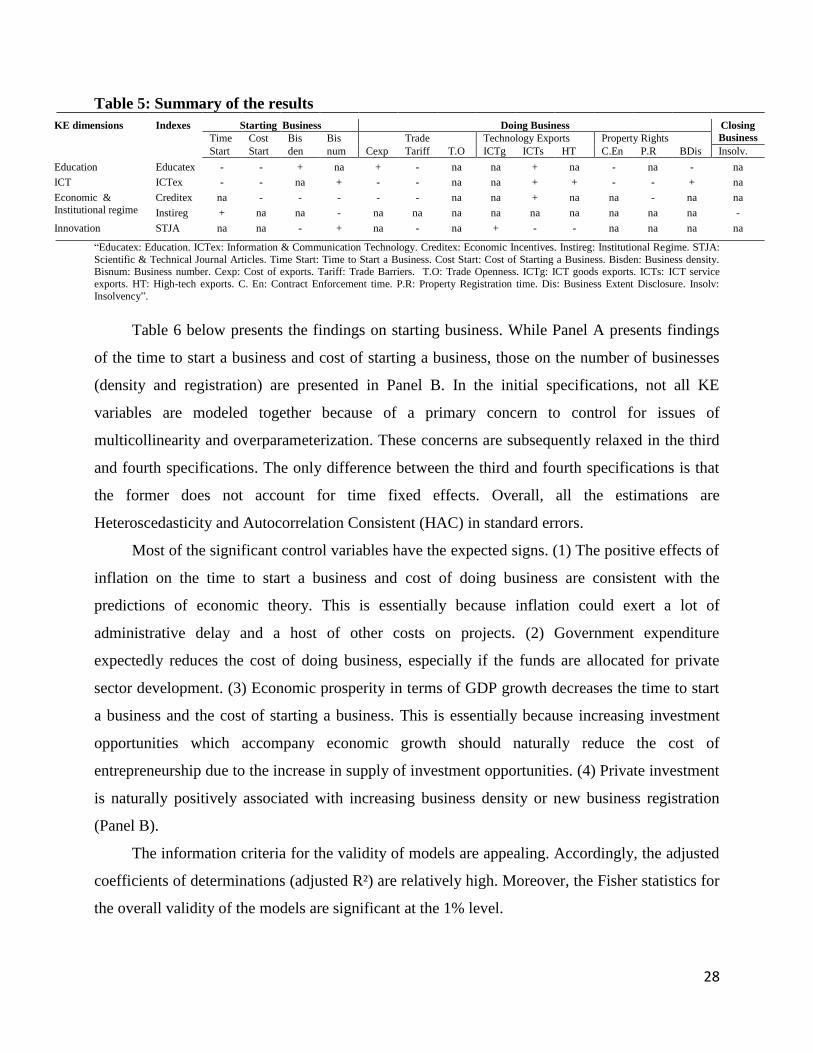
Table 5: Summary of the results
KE dimensions Indexes Starting Business Doing Business Closing
Business Time Cost Bis Bis Trade Technology Exports Property Rights
Start Start den num Cexp Tariff T.O ICTg ICTs HT C.En P.R BDis Insolv.
Education Educatex - - + na + - na na + na - na - na
ICT ICTex - - na + - - na na + + - - + na
Economic &
Institutional regime
Creditex na - - - - - na na + na na - na na
Instireg + na na - na na na na na na na na na -
Innovation STJA na na - + na - na + - - na na na na
“Educatex: Education. ICTex: Information & Communication Technology. Creditex: Economic Incentives. Instireg: Institutional Regime. STJA:
Scientific & Technical Journal Articles. Time Start: Time to Start a Business. Cost Start: Cost of Starting a Business. Bisden: Business density. Bisnum: Business number. Cexp: Cost of exports. Tariff: Trade Barriers. T.O: Trade Openness. ICTg: ICT goods exports. ICTs: ICT service
exports. HT: High-tech exports. C. En: Contract Enforcement time. P.R: Property Registration time. Dis: Business Extent Disclosure. Insolv:
Insolvency”.
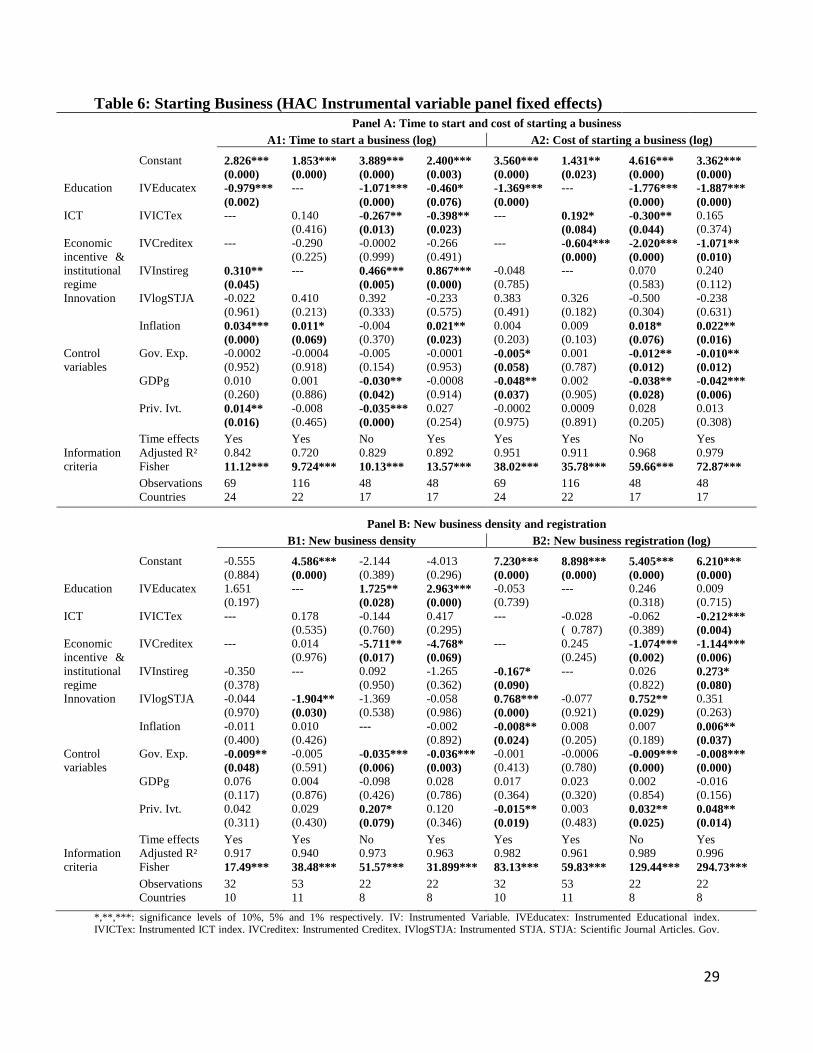
Table 6 below presents the findings on starting business. While Panel A presents findings
of the time to start a business and cost of starting a business, those on the number of businesses
(density and registration) are presented in Panel B. In the initial specifications, not all KE
variables are modeled together because of a primary concern to control for issues of
multicollinearity and overparameterization. These concerns are subsequently relaxed in the third
and fourth specifications. The only difference between the third and fourth specifications is that
the former does not account for time fixed effects. Overall, all the estimations are
Heteroscedasticity and Autocorrelation Consistent (HAC) in standard errors.
Most of the significant control variables have the expected signs. (1) The positive effects of
inflation on the time to start a business and cost of doing business are consistent with the
predictions of economic theory. This is essentially because inflation could exert a lot of
administrative delay and a host of other costs on projects. (2) Government expenditure
expectedly reduces the cost of doing business, especially if the funds are allocated for private
sector development. (3) Economic prosperity in terms of GDP growth decreases the time to start
a business and the cost of starting a business. This is essentially because increasing investment
opportunities which accompany economic growth should naturally reduce the cost of
entrepreneurship due to the increase in supply of investment opportunities. (4) Private investment
is naturally positively associated with increasing business density or new business registration
(Panel B).
The information criteria for the validity of models are appealing. Accordingly, the adjusted
coefficients of determinations (adjusted R²) are relatively high. Moreover, the Fisher statistics for
the overall validity of the models are significant at the 1% level.
29
Table 6: Starting Business (HAC Instrumental variable panel fixed effects)
Panel A: Time to start and cost of starting a business
A1: Time to start a business (log) A2: Cost of starting a business (log)
Constant 2.826*** 1.853*** 3.889*** 2.400*** 3.560*** 1.431** 4.616*** 3.362***
(0.000) (0.000) (0.000) (0.003) (0.000) (0.023) (0.000) (0.000)
Education IVEducatex -0.979*** --- -1.071*** -0.460* -1.369*** --- -1.776*** -1.887***
(0.002) (0.000) (0.076) (0.000) (0.000) (0.000)
ICT IVICTex --- 0.140 -0.267** -0.398** --- 0.192* -0.300** 0.165
(0.416) (0.013) (0.023) (0.084) (0.044) (0.374)
Economic
incentive &
institutional
regime
IVCreditex --- -0.290 -0.0002 -0.266 --- -0.604*** -2.020*** -1.071**
(0.225) (0.999) (0.491) (0.000) (0.000) (0.010)
IVInstireg 0.310** --- 0.466*** 0.867*** -0.048 --- 0.070 0.240
(0.045) (0.005) (0.000) (0.785) (0.583) (0.112)
Innovation IVlogSTJA -0.022 0.410 0.392 -0.233 0.383 0.326 -0.500 -0.238
(0.961) (0.213) (0.333) (0.575) (0.491) (0.182) (0.304) (0.631)
Control
variables
Inflation 0.034*** 0.011* -0.004 0.021** 0.004 0.009 0.018* 0.022**
(0.000) (0.069) (0.370) (0.023) (0.203) (0.103) (0.076) (0.016)
Gov. Exp. -0.0002 -0.0004 -0.005 -0.0001 -0.005* 0.001 -0.012** -0.010**
(0.952) (0.918) (0.154) (0.953) (0.058) (0.787) (0.012) (0.012)
GDPg 0.010 0.001 -0.030** -0.0008 -0.048** 0.002 -0.038** -0.042***
(0.260) (0.886) (0.042) (0.914) (0.037) (0.905) (0.028) (0.006)
Priv. Ivt. 0.014** -0.008 -0.035*** 0.027 -0.0002 0.0009 0.028 0.013
(0.016) (0.465) (0.000) (0.254) (0.975) (0.891) (0.205) (0.308)
Information
criteria
Time effects Yes Yes No Yes Yes Yes No Yes
Adjusted R² 0.842 0.720 0.829 0.892 0.951 0.911 0.968 0.979
Fisher 11.12*** 9.724*** 10.13*** 13.57*** 38.02*** 35.78*** 59.66*** 72.87***
Observations 69 116 48 48 69 116 48 48
Countries 24 22 17 17 24 22 17 17
Panel B: New business density and registration
B1: New business density B2: New business registration (log)
Constant -0.555 4.586*** -2.144 -4.013 7.230*** 8.898*** 5.405*** 6.210***
(0.884) (0.000) (0.389) (0.296) (0.000) (0.000) (0.000) (0.000)
Education IVEducatex 1.651 --- 1.725** 2.963*** -0.053 --- 0.246 0.009
(0.197) (0.028) (0.000) (0.739) (0.318) (0.715)
ICT IVICTex --- 0.178 -0.144 0.417 --- -0.028 -0.062 -0.212***
(0.535) (0.760) (0.295) ( 0.787) (0.389) (0.004)
Economic
incentive &
institutional
regime
IVCreditex --- 0.014 -5.711** -4.768* --- 0.245 -1.074*** -1.144***
(0.976) (0.017) (0.069) (0.245) (0.002) (0.006)
IVInstireg -0.350 --- 0.092 -1.265 -0.167* --- 0.026 0.273*
(0.378) (0.950) (0.362) (0.090) (0.822) (0.080)
Innovation IVlogSTJA -0.044 -1.904** -1.369 -0.058 0.768*** -0.077 0.752** 0.351
(0.970) (0.030) (0.538) (0.986) (0.000) (0.921) (0.029) (0.263)
Control
variables
Inflation -0.011 0.010 --- -0.002 -0.008** 0.008 0.007 0.006**
(0.400) (0.426) (0.892) (0.024) (0.205) (0.189) (0.037)
Gov. Exp. -0.009** -0.005 -0.035*** -0.036*** -0.001 -0.0006 -0.009*** -0.008***
(0.048) (0.591) (0.006) (0.003) (0.413) (0.780) (0.000) (0.000)
GDPg 0.076 0.004 -0.098 0.028 0.017 0.023 0.002 -0.016
(0.117) (0.876) (0.426) (0.786) (0.364) (0.320) (0.854) (0.156)
Priv. Ivt. 0.042 0.029 0.207* 0.120 -0.015** 0.003 0.032** 0.048**
(0.311) (0.430) (0.079) (0.346) (0.019) (0.483) (0.025) (0.014)
Information
criteria
Time effects Yes Yes No Yes Yes Yes No Yes
Adjusted R² 0.917 0.940 0.973 0.963 0.982 0.961 0.989 0.996
Fisher 17.49*** 38.48*** 51.57*** 31.899*** 83.13*** 59.83*** 129.44*** 294.73***
Observations 32 53 22 22 32 53 22 22
Countries 10 11 8 8 10 11 8 8
*,**,***: significance levels of 10%, 5% and 1% respectively. IV: Instrumented Variable. IVEducatex: Instrumented Educational index. IVICTex: Instrumented ICT index. IVCreditex: Instrumented Creditex. IVlogSTJA: Instrumented STJA. STJA: Scientific Journal Articles. Gov.
30
Exp: Government Expenditure. GDPg: GDP growth. Priv. Ivt: Private Investment. HAC: Heteroscedasticity & Autocorrelation Consistent. Log:
logarithm.
The findings on doing business are presented in Table 7 below. Panel A, Panel B and Panel
C respectively provide findings for trade, technology exports and property rights institutions.
Like in the preceding table, the initial specifications do not include all the explaining variables
for multicollinearity and overparameterization reasons already discussed above. However, the
concern is consistently relaxed in the third specifications. The estimations are also HAC in
standard errors. The information criteria for the validity of the models are appealing.
Accordingly, the adjusted coefficients of determinations (adjusted R²) are relatively high.
Moreover, the Fisher statistics for the overall validity of models are significant at the 1% level.
Exceptions to this significance are: (i) the third specification of tariffs in Panel A2 (2.805) and (ii)
third specification of high-technology exports in Panel B3 (1.240). Hence the corresponding
significance of estimates in these two insignificant models is not considered in the results
summarized in Table 5 above.
Most of the significant control variables have the expected signs. First, from Panel A: (1)
inflation increases the cost of exports due to increasing uncertainty in prices and interest rates; (2)
government expenditure expectedly reduces the cost of exports and is likely to potentially reduce
tariffs if funds are allocated for the improvement of trade openness and private sector
development; (3) economic prosperity increases trade openness since it is very likely that GDP is
trade-related; (4) private investment as expected is positively associated with trade openness
because it is very often linked to more import and export activities (bringing in raw materials and
exporting finished products or vice-versa). Second, from Panel B: inflation could substantially
reduce the exports of high technology goods, while GDP growth and private investment broadly
have the opposite effect. Third, in Panel C: (1) inflation decreases ‘contract enforcement time’
and ‘time for property registration’ but increases ‘business extent disclosure time’ possibly
because of uncertainty in prices and requirements for more disclosure on risks in price changes;
(2) economic growth expectedly decreases ‘contract enforcement time’ and increases pressures
on providing more information about businesses (business extent disclosure) and; (3) private
investment is more naturally expected to decrease the time needed to register a property.

31
Table 7: Doing Business (HAC Instrumental variable panel fixed effects)
Panel A: Trade
A1: Cost of Exports (log) A2: Tariffs A3: Trade Openness (log)
Constant 6.571*** 7.455*** 6.662** 11.411** 21.12*** -4.488 3.940*** 3.951*** 3.602***
(0.000) (0.000) (0.014) (0.028) (0.000) (0.520) (0.000) (0.000) (0.000)
Education IVEducatex 0.321* --- 0.020 -6.77*** --- -10.04** -0.009 --- -0.170
(0.064) (0.776) (0.004) (0.042) (0.842) (0.229)
ICT IVICTex --- -0.133** -0.012 --- -1.525** -3.700 --- 0.031 0.109*
(0.023) (0.859) (0.034) (0.214) (0.106) (0.053)
Economic
incentive &
institutional
regime
IVCreditex --- -0.247** -0.247 --- -1.522 -15.52* --- 0.017 0.091
(0.022) (0.347) (0.373) (0.089) (0.830) (0.252)
IVInstireg -0.039 --- -0.082 1.648 --- 4.413 0.055 --- 0.076
(0.629) (0.226) (0.388) (0.480) (0.351) (0.184)
Innovation IVlogSTJA 0.221 0.016 0.299 0.741 -5.868* 2.709 0.005 0.086 0.236**
(0.173) (0.873) (0.254) (0.815) (0.078) (0.616) (0.939) (0.357) (0.027)
Control
variables
Inflation -0.0002 0.0006 0.007* 0.036 -0.034 0.080 0.002 0.006*** 0.006
(0.888) (0.716) (0.078) (0.512) (0.529) (0.492) (0.559) (0.000) (0.130)
Gov. Exp. 0.0009 -0.004** -0.002 -0.033 -0.018 -0.113* 0.0005 -0.0006 0.0004
(0.453) (0.026) (0.195) (0.255) (0.619) (0.050) (0.622) (0.249) (0.736)
GDPg -0.005 -0.0008 0.013 0.014 0.117 0.092 0.0001 0.009*** 0.008*
(0.488) (0.829) (0.165) (0.924) (0.481) (0.769) (0.950) (0.000) (0.092)
Priv. Ivt. -0.001 0.003 0.009 -0.036 0.045 0.546 0.014*** 0.004 0.012***
(0.693) (0.319) (0.270) (0.672) (0.524) (0.110) (0.000) (0.106) (0.000)
Information
criteria
Time effects Yes Yes Yes Yes Yes Yes Yes Yes Yes
Adjusted R² 0.980 0.862 0.996 0.713 0.734 0.619 0.958 0.929 0.975
Fisher 68.12*** 17.23*** 261.73*** 4.54*** 11.42*** 2.805 50.96*** 94.51*** 69.41***
Observations 44 81 29 48 125 32 74 242 51
Countries 22 21 15 23 23 16 24 24 17
Panel B: Technology Exports
B1: ICT Goods B2: ICT Services B3: High-tech Exports
Constant -6.557* -0.077 -29.167* 3.600 2.398 16.65*** 4.899 9.255** -36.32**
(0.075) (0.965) (0.054) (0.409) (0.605) (0.000) (0.412) (0.036) (0.083)
Education IVEducatex 1.099 --- 4.360 1.359** --- 3.864*** 2.555 --- 3.837
(0.288) (0.186) (0.048) (0.000) (0.444) (0.484)
ICT IVICTex --- 0.038 -1.919 --- 0.342 1.499* --- 0.828*** 1.258
(0.791) (0.225) (0.274) (0.074) (0.004) (0.587)
Economic
incentive &
institutional
regime
IVCreditex --- -0.198 -10.590 --- 1.664 5.816* --- 2.235 -14.78**
(0.775) (0.103) (0.103) (0.075) (0.108) (0.013)
IVInstireg -0.165 --- -0.344 -1.311 --- 0.069 0.764 --- -0.238
(0.831) (0.653) (0.174) (0.791) (0.518) (0.873)
Innovation IVlogSTJA 3.339** 0.873 9.888* 1.654 1.073 -3.693* -6.099* -1.964 7.983
(0.033) (0.405) (0.060) (0.511) (0.654) (0.074) (0.061) (0.409) (0.206)
Control
variables
Inflation 0.085 -0.027 0.183*** -0.043 -0.018 -0.16*** -0.022 -0.105* 0.270***
(0.015) (0.466) (0.000) (0.190) (0.597) (0.000) (0.771) (0.079) (0.000)
Gov. Exp. 0.014 0.003 -0.036 -0.071* 0.002 0.011 0.060 -0.034 -0.062
(0.629) (0.731) (0.283) (0.094) (0.887) (0.499) (0.144) (0.134) (0.228)
GDPg -0.046 -0.027 0.122 0.068 -0.092 -0.165** 0.338** -0.041 0.864***
(0.673) (0.484) (0.187) (0.458) (0.131) (0.042) (0.022) (0.771) (0.000)
Priv. Ivt. 0.110* -0.035 0.573** 0.007 0.050 -0.45*** 0.343 -0.025 0.959**
(0.091) (0.375) (0.043) (0.934) (0.432) (0.000) (0.136) (0.682) (0.020)
Time effects Yes Yes Yes Yes Yes Yes Yes Yes Yes

32
Information
criteria
Adjusted R² 0.509 0.518 0.512 0.929 0.480 0.899 0.272 0.367 0.132
Fisher 3.047*** 6.825*** 2.713** 24.61*** 5.768*** 14.25*** 1.723* 4.693*** 1.240
Observations 62 174 45 51 140 38 57 192 42
Countries 21 22 15 18 17 13 19 20 14
Panel C: Property Rights
C1: Contract Enforcement Time
(log)
C2: Property Registration Time
(log)
C3: Business Extend Disclosure
Constant 6.501*** 6.514*** 6.536*** 3.881*** 4.093*** 4.037*** 3.248 3.852*** 4.147***
(0.000) (0.000) (0.000) (0.000) (0.000) (0.000) (0.151) (0.000) (0.000)
Education IVEducatex -0.046** --- 0.033** -0.039 --- 0.109 -3.367* --- 0.000
(0.037) (0.023) (0.625) (0.482) (0.065) (0.162)
ICT IVICTex --- -0.016 -0.013** --- -0.165* 0.009 --- 0.087 0.000**
(0.284) (0.015) (0.073) (0.758) (0.345) (0.048)
Economic
incentive &
institutional
regime
IVCreditex --- 0.009 -0.009 --- -0.159 -0.45*** --- 0.089 0.000
(0.697) (0.219) (0.424) (0.000) (0.664) (0.086)
IVInstireg 0.005 --- -0.003 0.097 --- -0.113 -0.817 --- 0.000
(0.628) (0.381) (0.161) (0.326) (0.199) (0.550)
Innovation IVlogSTJA -0.020 -0.029 -0.0002 0.408 0.028 0.450 3.761 0.380 0.000
(0.274) (0.644) (0.981) (0.189) (0.781) (0.358) (0.132) (0.255) (0.082)
Control
variables
Inflation 0.0005 0.002 -0.001** -0.004** 0.006 -0.005 0.048* 0.006 ---
(0.356) (0.147) (0.023) (0.049) (0.197) (0.322) (0.064) (0.215)
Gov. Exp. 0.0002 -0.0004 0.000 0.006*** 0.001 0.005** -0.014 -0.0009 ---
(0.263) (0.115) (0.267) (0.000) (0.384) (0.038) (0.156) (0.549)
GDPg -0.0004 0.002 -0.0009** 0.002 -0.0008 0.007 0.173* 0.023 ---
(0.395) (0.197) (0.018) (0.445) (0.906) (0.329) (0.094) (0.151)
Priv. Ivt. 0.001 0.003 -0.0002 -0.022** -0.002 -0.033** 0.005 0.001 ---
(0.212) (0.126) (0.451) (0.010) (0.738) (0.016) (0.869) (0.872)
Information
criteria
Time effects Yes Yes Yes Yes Yes Yes Yes Yes Yes
Adjusted R² 0.998 0.966 0.999 0.973 0.836 0.977 0.884 0.989 1.000
Fisher 1149*** 104.08*** 3820*** 63.87*** 16.97*** 59.21*** 11.38*** 247*** Inf***
Observations 68 115 47 57 98 39 43 76 34
Countries 24 22 17 23 21 16 21 20 17
*,**,***: significance levels of 10%, 5% and 1% respectively. IV: Instrumented Variable. IVEducatex: Instrumented Educational index. IVICTex: Instrumented ICT index. IVCreditex: Instrumented Creditex. IVlogSTJA: Instrumented STJA. STJA: Scientific Journal Articles. Gov.
Exp: Government Expenditure. GDPg: GDP growth. Priv. Ivt: Private Investment. HAC: Heteroscedasticity & Autocorrelation Consistent. Log:
logarithm. Inf: means the value is substantially high.
The third assessments of the effect of KE on closing business are presented in Table 8
below. But for the negatively significant effect of institutional regime on time needed to resolve
insolvency, the other KE variables do not significantly affect the dependent variable. The
information criteria are appealing because, while the coefficients of adjustments are close to
unity, the Fisher statistics for the overall validity of the models are significant at the 1% level.

33
Table 8: Closing Business (HAC Instrumental variable panel fixed effects)
Time to resolve insolvency
Constant 2.708*** 2.791*** 2.289*** 2.097***
(0.000) (0.000) (0.000) (0.000)
Education IVEducatex 0.089 --- 0.060 0.417
(0.361) (0.584) (0.139)
ICT IVICTex --- -0.020 0.020 -0.010
(0.288) (0.480) (0.803)
Economic
incentive &
institutional
regime
IVCreditex --- -0.017 0.149 0.128
(0.421) (0.367) (0.378)
IVInstireg -0.063 --- -0.067 -0.126*
(0.287) (0.366) (0.096)
Innovation IVlogSTJA 0.192 0.132 0.414 0.486
(0.327) (0.313) (0.278) (0.106)
Control
variables
Inflation -0.0009 0.001 -0.007 0.005
(0.790) (0.333) (0.331) (0.340)
Gov. Exp. 0.0004 0.0001 0.002 0.004
(0.555) (0.630) (0.343) (0.151)
GDPg 0.0005 0.002 -0.0007 0.015*
(0.822) (0.331) (0.840) (0.080)
Priv. Ivt. -0.002 0.0009 -0.011 -0.023*
(0.358) (0.364) (0.304) (0.062)
Information
criteria
Time effects Yes Yes No Yes
Adjusted R² 0.997 0.996 0.992 0.993
Fisher 619.08*** 982.02*** 223.79*** 210.74***
Observations 58 102 38 38
Countries 22 19 15 19
*,**,***: significance levels of 10%, 5% and 1% respectively. IV: Instrumented Variable. IVEducatex: Instrumented
Educational index. IVICTex: Instrumented ICT index. IVCreditex: Instrumented Creditex. IVlogSTJA: Instrumented
STJA. STJA: Scientific Journal Articles. Gov. Exp: Government Expenditure. GDPg: GDP growth. Priv. Ivt: Private
Investment. HAC: Heteroscedasticity & Autocorrelation Consistent.
5.2 Further discussion of results and policy implications
5.2.1 Education on African business and policy implications
First, on starting business we have found that education: decreases the time for starting a
business, reduces the cost of doing business and increases business density. This finding is
consistent with theoretical and empirical predictions from the literature review covered in Section
2 above. Notably: (i) Gerba (2012) on how entrepreneurial intentions of undergraduate students
increase with entrepreneurial studies, especially management lessons; (ii) Singh et al. (2011) on
general education; (iii) Oseifuah (2010) on the relationship between youth entrepreneurship and

34
the level of financial literacy and (iv) Mensah & Benedict (2010) on the positive long-run effects
of entrepreneurial activity on poverty and conflicts mitigation.
Second, with regard to doing business, education: (i) increases the cost of exports and
reduces trade tariffs (effects on trade openness); (ii) increases ICT services exports (effect on
technology exports) and (iii) decreases contract enforcement time and the extent of business
disclosure (effects on property rights institutions). But for the negative effect on the extent of
business disclosure, the signs are overwhelmingly consistent with the predictions of economic
theory. The unexpected sign on the business disclosure (or less investor protection through
disclosure of ownership and financial information) have a threefold justification: (i) the high rate
of informal entrepreneurial activities in African countries; (ii) businesses in the formal sector are
not generally prone to external finance from investors that formally need such disclosures and
(iii) the potentially high rate of business malpractices. Relationships with the expected signs are
broadly in accordance with the discussion presented in the first paragraph (Gerba, 2012; Singh et
al., 2011; Oseifuah, 2010; Mensah & Benedict, 2010; Wantchekon et al., 2014).
Third, while the effect of education in closing a business has not been significant, there is a
broad consensus that education is positively associated with starting and doing business in Africa.
Hence, in order to achieve optimal rewards from this dimension of KE, brain drain and lack of
investment in education are concerns to be addressed. They have been documented in Section 2
as some issues negatively affecting the consolidation of the educational KE pillar (Ford, 2007;
Amavilah, 2009; Chavula, 2010; Anyanwu, 2012). Accordingly, there is a substantial background
for dilapidating knowledge infrastructure, brain drain, limited relationships between science and
industry, thin support for R&D and outdated curricula. Therefore from an educational standpoint,
Africa is on a falling trend and may not completely reap the positive benefits of training in
starting and doing business. Hence, bold initiatives are essential to reinvigorate technology &
science in higher education. So what can be done to improve the educational climate? We discuss
the policy measures in the fourth and fifth strands.
Fourth, countries of the continent need to take very bold steps towards augmenting
enrolment rates in colleges and place greater emphasis on entrepreneurial lessons in management
specializations. In the same vein, the ratio of R&D to GDP should also be increased. The policy
measures should be in conjunction with considerable improvements in other economic and
institutional environments. Applying these initiatives would help education consolidate the
35
continent’s ability to acquire novel knowledge and technology. This will also reinvigorate the
know-how of individuals that is needed to consolidate blocks of technological knowledge. To this
end, it is essential for African governments to assume responsibility for the policy measures
needed to enhance this core development in human resources. For instance, consistent with the
Korean literature ( Suh & Chen , 2007; Asongu, 2014) while South Korea still imports some of
its technology, it has however constructed robust indigenous R&D platforms and puts aside
approximately 3% of GDP for R&D purposes.
Fifth, the relevance of education in favoring business activities should not be limited to
formal educational circles. The policies should also accompany workers throughout their
professional careers. This is essential if the workers are to cope with changing and evolving
technological conditions. It is complementary with the vocational and technical trainings that
African governments need to put in place. In essence, as a nation grows in business activities,
training at work places is a critical factor in the acquisition of knowledge and technological
competence is needed to face competition. African policy makers should also nurture high-caliber
scientists and engineers capable of handling growth and challenges in technology & science. In
the Korean situation for instance, business (or industrialization) and education were
complementary to each other (Suh & Chen, 2007; Asongu, 2015a). In other words, technological
learning and business were the result of education and the former increased the rate of return on
educational investment, which ultimately improved the demand for education.
5.2.2 ICT on African business and policy implications
We have established from the findings that ICT: reduces the time of starting a business,
decreases the cost of starting a business and increases the number of businesses. These findings
are broadly consistent with the predictions of economic theory. Accordingly, the ICT (especially
the mobile revolution) has substantially transformed business in Africa by providing not only
communication facilities but also access to finance to a previously unbanked fraction of the
population (Jonathan & Camilo, 2008; Demombynes & Thegeya, 2012; Asongu, 2014).
In doing business, we have also found that ICT: (i) has a negative effect on the cost of
exports and trade tariffs (effects on trade); (ii) increases ICT service exports (effect on high
technology exports) and (iii) has a negative impact on the time needed for contract enforcement
and property registration but a positive effect on business extent disclosure (effects on property
rights institutions). All the effects above are consistent with the predictions of economic theory.

36
Hence, it is natural to expect that, ICT would: (i) reduce the cost of exports due to reduction in
the cost of information; (ii) reduce trade tariffs due to lower information asymmetry, decreasing
cost of information and increasing competition; (iii) increase the export of ICT services and high
technology goods because they are positively correlated and (iv) improve property rights
institutions ( decrease the time needed to enforce a contract, decrease the period needed to
register a property and increase the extent of business disclosure) due to increasing
synchronization of information. We have established no significant ICT effect on closing
business. While we have found expected results on the appealing effects of ICT on starting and
doing business, it is important to note that more still needs to be done, especially if African
countries are to catch-up with reference models like South Korea highlighted in the theoretical
underpinnings of the paper. We have already covered how ICT benefits the African society in a
multitude of ways in Section 2 (African Partnership Forum, 2008; Chavula, 2010; Butcher,
2011).
In light of the above, in order for Africa to catch-up in ICT with an exemplary developed
country like Korea, policy makers should tailor ICT success with the implementation of soundly-
integrated measures that encompass a competitive & regulatory policy, an active informatization
policy and an industrial policy. African countries should massively invest in telephone lines,
internet equipment and multimedia, amongst others. As sustained by Suh & Chen (2007), these
investments have been critical for Korea’s emergence. According to their narrative, ICT policies
were clearly articulated along the three principal dimensions: (i) human resources, venture capital
and R&D (an industrial policy); (ii )market liberalization and privatization (enforced regulatory
and competitive policy) and (iii) the construction of advanced infrastructure and setting-up of e-
government (an active information policy). As sustained by the authors, combining these three
policy areas within a framework of consolidated ICT structure was crucial to the success of the
Korean development strategy.
5.2.3 Economic incentives on African business and policy implications
Due to substantially documented issues of surplus liquidity in African financial institutions
(Saxegaard, 2006; Nguena & Tsafack, 2014; Asongu, 2014), we have defined economic
incentives in this paper as the ability of surplus deposits in financial institutions to be transformed
into credit for economic operators who can then use the available finance to set-up new business

37
units or consolidate existing business structures. Hence, we have used ‘domestic credit to the
private sector’ and ‘interest rate spreads’ to appreciate this concern of economic incentives. The
effects of this economic incentive on business have overwhelmingly revealed the expected signs.
First, economic incentives reduce the cost of doing business but unexpectedly also decrease
the business density and number of businesses. The expected negative effect on the cost of
starting a business has a simple explanation: the interest rate required by formal banking
institutions is much lower than that demanded by non-formal and informal financial institutions
in Africa (Chung, 2013). The negative effects on the number of businesses have a twofold
explanation: credit from banks may be destined for non-business private investment
and/consumption purposes or new businesses could be unregistered because they are created in
the informal sector and rural areas.
Second, in the doing of business, economic incentives: (i) decrease the cost of exports and
trade tariffs (effects on trade); (ii) increase ICT services exports (effect on high technology
exports) and (iii) decrease the time needed to register a property (effect on property rights
institutions). There is no significant effect of economic incentives on closing a business. (i) On
trade, the negative impacts on the cost of exports and trade tariffs are broadly in line with the
predictions of economic theory. This is essentially because incentives by government tailored
towards import-substitution would most likely result in these outcomes. (ii) The positive effect on
ICT exports has a similar explanation to (i) above. (iii) The negative impact on the time needed to
register a property may possibly be explained by: a complementary effort to ease the doing of
business or higher preparedness/ability to pay bribes for the property to be registered without
delay.
We remain in line with the South Korean model in order to be consistent with our policy
implications across various components of KE. Hence, as we have discussed above, while the
export-led or extensive development model would expose African industries to more
competition, this outward-looking initiative should equally motivate government inducements
like fiscal incentives and intensive R&D programs that are essential for the success. Within this
framework, protectionist measures which are necessary at the starting stages of business should
be curtailed with the growth and competiveness of a given industrial sector. Otherwise this could
lead to complacency in business innovation.

38
Small & Medium Size Enterprises which inherently are prone to greater capital
requirements were helped by government backed research institutes in the Korean experience.
They were provided with new knowledge in terms of novel spinoffs and collaborative R&D (Suh
& Chen, 2007). Ultimately, the incentives to private enterprise are acutely needed to boost the
development of the private business sector and respond to the evolving stream of African
business literature on the need for investment (Anyanwu, 2007, 2009; Rolfe & Woodward, 2004;
Bartels et al., 2014; Bartels et al., 2009; Tuomi, 2011; Darley, 2012).
5.2.4 Institutional regime on African business and policy implications
First, we have observed from the findings that institutional regime increases the time for
starting a business and decreases business density. The finding was not unexpected given the
considerable degree of bureaucracy associated with business activities in Africa. This discourages
many who may end-up abandoning the whole idea of setting-up a business altogether which
ultimately affects business density in a negative manner. As a policy implication, genuine steps
are needed to substantially curb institutional bureaucracies that stifle the smooth creation of
corporations. Corruption along the lines should also be dealt with because it could be the result of
such lengthy administrative business setting processes.
Second, we have also found that while institutional regime has no significant effect on the
doing of business, it has a negative impact on the time needed to close a business. The latter
result corroborates the findings and discussion of the preceding paragraph. As for the consistent
insignificance of the former, it implies that the institutions governing businesses may not be
strong enough to adopt and enforce policies that significantly affect the manner in which business
on the continent is run. This may be due for several reasons which are not within the scope of this
paper, but deserve further investigation as an interesting future research direction.
Overall, in light of the above, institutions either have the unexpected signs or are
insignificant, which means policy makers need to work relentlessly on the institutional sectors
that affect the doing of business, notably: political governance (political stability and voice &
accountability), economic governance (government effectiveness and regulation quality) and
institutional governance (rule of law and corruption-control). This is consistent with recent
studies on African economies which have concluded that institutional development is crucial for
the emergence of the continent (Fosu, 2013ab). We have also gathered from Section 2 how

39
African economies are substantially lagging in this pillar of KE (Cogburn, 2003; Letiche, 2006),
especially on the relevance of institutions in KE (Andrés et al., 2014).
Against this background, it is essential for African institutions to be market focused through
the adoption of development strategies that liberate the competitive market forces needed for KE
completely. This will substantially enhance the starting and doing of business. In essence, a
market-oriented approach fosters competition because of the presence of competitive forces.
Moreover, government accountability, transparency in financial markets, foreign investment
regimes, liberalized trade and a leveled playing field for most participants in the market are
essential institutional components of KE needed to boost African business. An export-led
industrialization strategy can go a long way to achieving these goals because the adoption of such
an extensive growth strategy exposes African companies to global competition, which is
imperative for new business ideas and more investment needed to support the new business ideas
(technological assimilation and substantial innovation essential to remain competitive).
In improving institutional quality, policy makers would also be confronted with the very
thorny concern of corruption in business circles, especially among the political elite. Hence,
credible and effective governments are critical at this juncture to achieve long-run business
development objectives. The South Korean example could serve as a model for African policy
makers. In accordance with Tran (2011), the country’s leader Park adopted a very pragmatic
strategy to tackling elite corruption. Contrary to the recommendations of the USA, he did not
vehemently crack-down on business men, but forced them to invest in import-substitution
industries by expropriating their bank shares. In a nutshell, the principal lesson to be drawn by
African governments from this experience is the adoption of pragmatic approaches in fighting
corruption. Moreover, the Korean government played a pivotal mission in facilitating the other
dimensions of KE needed to boost business activities, notably: assimilation of foreign
technologies, mass education, training of the population, access to modern infrastructure,
domestic R&D, amongst others.
A credible institutional regime could also help in solving business crises like financial
meltdowns. A good case in point is how the South Korean government was able to manage the
1997 crises (Suh & Chen, 2007; Asongu, 2015a). Accordingly, confidence in government
institutions was largely credited for the successful reforms implemented by this government such
as the removal of non-performing loans, recapitalization of financial institutions...etc.

40
5.2.5 Innovation on African business and policy implications
Innovation in this paper has been proxied with the number of Scientific & Technical
Journal Articles (STJA) due to issues in degrees of freedom already discussed above (last
paragraph of Section 4.2.1). We have found the following. First, in starting a business, STJA
decrease business density but increase business registration. Second, in doing business, STJA: (i)
decrease tariffs (effect on trade); (ii) increase ICT good exports but decrease ICT service and
high technology exports (effects on technology exports) and (iii) have no significant effect on
property rights institutions. Third, the effect on ending a business is also insignificant. On the
first note, while the effect on increasing the number of newly registered businesses is consistent
with intuition, the negative effect on business density is unexpected and could be subject to
further research. The signs of the effects on trade are broadly in line with our expectations.
Elucidation of the positive and negative signs is also broadly in accordance with those already
covered and discussed above.
While the policy recommendations covered in the preceding sections also broadly apply to
innovation in African business, it is worthwhile highlighting some policy dimensions that are
specific to this pillar of KE in light of the East Asian miracle underlying this paper. In order to
facilitate innovation, at the early stages of business units and/or industrialization; imitation, less
stringent property rights and reversed engineering may be necessary. This policy which is
essential for the copying of commodities that are technology-intensive largely contributed to the
East Asian miracle (Bezmen & Depken, 2004). These informal technology transfer mechanisms
are needed at the early stages of industrialization in African countries. This would potentially
decrease the cost of acquiring new technology and reduce dependence on business operations. In
order to succeed, the policy initiatives should be clearly articulated with education and human
development in a strategy of lifelong learning.
6. Conclusion
This paper has analyzed the role of Knowledge Economy (KE) in African business with
data from 53 African countries for the period 1996 to 2010. The World Bank’s four KE
components have been employed: education, innovation, economic incentives & institutional
regime and information & communication technology (ICT). The business indicators are
classified into: starting, doing and ending business. The dimensions of the KE variables have

41
been reduced with principal component analysis due to multicollinearity and
overparameterization concerns. The empirical strategy adopted is an instrumental variable panel
fixed effects estimation method. The findings are classified in three strands.
First, regarding the effect of KE on starting a business, we found the following. (1)
Education: (i) decreases the time of starting a business; (ii) reduces the cost of starting a business
and (iii) increases business density and numbers. (2) ICT: (i) reduces the time of starting a
business; (ii) decreases the cost of starting a business and (iii) increases the number of businesses.
(3) Economic incentives reduce the cost of starting business but unexpectedly also decrease
business density and number. (4) Institutional regime increases the time of starting a business and
decreases business density. (5) Scientific & Technical Journal Articles (STJA) proxying for
innovation decrease business density but increase business number.
Second, we highlight the incidence of KE on doing business in three strands. (1) On the
effect on trade: (i) education increases the cost of exports and reduces trade tariffs; (ii) ICT and
Economic incentives have a negative incidence on the cost of exports and trade tariffs whereas,
(iii) STJA decrease trade tariffs. (2) With regard to the impact of technology exports: (i)
education, ICT and economic incentives increase ICT services exports; (ii) ICT has a positive
effect on high technology goods exports while STJA increase ICT goods exports but decrease
ICT services and (iii) high technology commodity exports. (3) On property rights institutions: (i)
education decreases contract enforcement time and the extent of business disclosure; (ii) ICT has
a negative impact on contract enforcement and private property registration time but a positive
effect on business extent disclosure while (iii) economic incentives decrease private property
registration time.
Third, with the exception institutional regime that has a negative effect on the time needed
to resolve insolvency, the findings on closing a business are not overwhelmingly significant.
Policy implications for the relevance of each specific KE dimension in African business are
discussed with particular emphasis on the theoretical underpinnings of the study. The
investigation is original in its contribution at the same time to the scarce literature on African KE
and the growing challenges of improving the business climate on the continent by means of KE.
As a caveat, whereas the fixed effects estimation technique employed has accounted for the
unobserved heterogeneity, employing other empirical strategies that have more bite on
endogeneity would improve the extant literature. Using the Generalized Method of Moments is a

42
step towards this direction because the underlying data structure is consistent with the estimation
technique (N>T)5.
5 N being the number of cross sections and T the number of years per cross section.

43
Appendices
Appendix1: Correlation analysis for Education, ICT & Innovation
Panel A: Correlation Analysis for Educatex (Education)
PSE SSE TSE
1.000 0.427 0.270 PSE
1.000 0.747 SSE
1.000 TSE
Panel B: Correlation Analysis for ICTex (Information and Communication Technology)
Internet Mobile Telephone
1.000 0.724 0.582 Internet
1.000 0.479 Mobile
1.000 Telephone
Panel C: Correlation Analysis for Innovex (Innovation)
STJA Trademarks Patents
1.000 0.901 0.831 STJA
1.000 0.919 Trademarks
1.000 Patents
PSE: Primary School Enrolment. SSE: Secondary School Enrolment. TSE: Tertiary School Enrolment. PC: Principal Component. ICTs:
Information and Communication Technologies. Educatex is the first principal component of primary, secondary and tertiary school enrolments.
ICTex: first principal component of mobile, telephone and internet subscriptions. STJA: Scientific and Technical Journal Articles. Innovex: first principal component of STJA, trademarks and patents (resident plus nonresident).
Appendix 2: Correlation analysis for Instireg (Institutional regime)
VA PS RQ GE RL CC
1.000 0.659 0.701 0.680 0.723 0.665 VA
1.000 0.630 0.640 0.795 0.684 PS
1.000 0.812 0.814 0.729 RQ
1.000 0.883 0.836 GE
1.000 0.871 RL
1.000 CC
VA: Voice & Accountability. RL: Rule of Law. R.Q: Regulation Quality. GE: Government Effectiveness. PS: Political Stability. CC:Control of Corruption. Instireg (Institutional regime): First PC of VA, PS, RQ, GE, RL & CC.

44
References
African Development Bank (2007, December). “Growing a Knowledge Based Economy:
Evidence from Public Expenditure on Education in Africa”, Economic Research Working Paper
Series No. 88, Tunis.
Alagidede, P., (2008). “African Stock Market Integration: Implications for Portfolio
Diversification and International Risk Sharing”, Proceedings of the African Economic
Conferences 2008, Tunis.
Amavilah, V. H. S., (2009). “Knowledge of African countries: production and value of
doctoral dissertations”, Applied Economics, 41(8), pp. 977-989.
Amavilah, V. H. S., Asongu, S. A., & Andrés, A. R., (2014). “Globalization, Peace & Stability,
Governance, and Knowledge Economy”, African Governance and Development Institute
Working Paper, 14/012, Yaoundé.
Amendolagine, V., Boly, A., Coniglio, N. D., Prota, F., & Seric, A., (2013). “FDI and Local
Linkages in Developing Countries: Evidence from Sub-Saharan Africa”, World Development, 50,
pp. 41-56.
Andrés, A. R., & Asongu, S. A., (2013a). “Fighting software piracy: which governance tools
matter in Africa?” Journal of Business Ethics: 118(3), pp. 667-682.
Andrés, A. R., & Asongu, S. A., (2013b). “Global dynamic timelines for IPRs harmonization
against software piracy”, Economics Bulletin, 33(1), pp. 874-880.
Andrés, A. R., Asongu, S. A., & Amavilah, V. H. S., (2014). “The Impact of Formal Institutions
on Knowledge Economy”, Journal of the Knowledge Economy: Forthcoming.
http://link.springer.com/article/10.1007%2Fs13132-013-0174-3 (accessed: 2/12/2013).
Anyanwu, J., (2007). “Promoting Investment in Africa”, African Development Review, 18(1), pp.
42-71.
Anyanwu, J., (2009). “Why Does Foreign Direct Investment Go Where It Goes?: New Evidence
From African Countries”, Annals of Economics and Finance, 13(2), pp. 425-462.
Anyanwu, J. C., (2012). “Developing Knowledge for the Economic Advancement of Africa”,
International Journal of Academic Research in Economics and Management Sciences, 1(2), pp.
73-111.
Asongu, S. A., (2012). “Government quality determinants of stock market performance in
African countries”, Journal of African Business, 13(2), pp. 183-199.
Asongu, S. A., (2013a). “Harmonizing IPRs on Software Piracy: Empirics of Trajectories in
Africa”, Journal of Business Ethics, 118(1), pp. 45-60.
45
Asongu, S. A., (2013b). “Modeling the future of Knowledge Economy: evidence from SSA and
MENA countries”, Economics Bulletin, 33(1), pp. 612-624.
Asongu, S. A., (2014). “Knowledge Economy and Financial Sector Competition in African
Countries”, African Development Review, 26(2), pp. 333-346
Asongu, S. A., (2015a). “Knowledge Economy Gaps, Policy Syndromes, and Catch-Up
Strategies: Fresh South Korean Lessons to Africa”, Journal of the Knowledge Economy.
http://link.springer.com/article/10.1007/s13132-015-0321-0
Asongu, S. A., (2015b). “Conditional Determinants of Mobile Phones Penetration and Mobile
Banking in Sub-Saharan Africa”, Journal of the Knowledge Economy
http://link.springer.com/article/10.1007/s13132-015-0322-z
Asongu, S. A., & Tchamyou, S. V., (2016). “The Impact of Entrepreneurship on Knowledge
Economy in Africa”, Journal of Entrepreneurship in Emerging Economies: Forthcoming.
Asongu, S. A., Amavilah, V., & Andrés, R. A., (2014). “Economic Implications of Business
Dynamics for KE-Associated Economic Growth and Inclusive Development in African
Countries”, African Governance and Development Institute Working Paper No. 14/023,
Yaoundé.
Aubert, J. E., (2005). “Knowledge economies: A global perspective”, In A. Bonfour & L.
Edvinsson (Eds.), Intellectual capital for communities. Elsevier, Oxford.
Bardy, R., Drew, S., Kennedy, T. F., (2012). “Foreign Investment and Ethics: How to Contribute
to SocialResponsibility by Doing Business in Less-Developed Countries”, Journal of Business
Ethics, 106, pp. 267-282.
Bartels, F. L., Alladina, S. N., & Lederer, S., (2009).“Foreign Direct Investment in Sub-Saharan
Africa: Motivating Factors and Policy Issues”, Journal of African Business, 10(2), 141-162.
Bartels, F. L. Napolitano, F., & Tissi, N. E., (2014). “FDI in Sub-Saharan Africa: A longitudinal
perspective on location-specific factors (2003–2010)”, International Business Review:
Forthcoming.
Bezmen, T. L., & Depken, C. A., (2004). “The impact of software piracy on economic
development”, Working Paper. Francis Marion University.
Bidwell, N. J., Winschiers-Theophilus, H., Kapuire, G. K., & Rehm, M., (2011). “Pushing
personhood into place: Situating media in rural knowledge in Africa”, International Journal of
Human-Computer Studies, 69 (10), pp. 618-631.
Bizri, O., (2009). “The Knowledge economy and the Arab Countries: current climate and future
prospects in education, innovation and technology”, Carthage High Level International
Conference on Building Knowledge Economies for job creation, increased competiveness and
balanced development. December, 1-3, 2009.

46
Blignaut, A. S., Hinostroza, J. E., Els, C. J., & Brun, M., (2010). “ICT in education policy and
practice in developing countries: South Africa and Chile compared through SITES 2006”,
Computers and Education, 55(4), pp. 1552-1563.
Blundell, R., & Bond, S., (1998). “Initial conditions and moment restrictions in dynamic panel
models”, Journal of Econometrics, 87(1), pp. 115-143.
Britz, J. J., Lor, P. J., Coetzee, I. E. M., & Bester, B. C., (2006). “Africa as a knowledge society:
A reality check”, The International Information & Library Review, 38, pp. 25-40.
Butcher, N., (2011). ICT in Africa. A Few Key Challenges, in: ICT, Education, Development, and
the Knowledge Society, Thematic Paper prepared for GeSCI African Leadership in ICT Program,
December 2011, pp. 33-39.
Carisle, S., Kunc, M., Jones, E., & Tiffin, S., (2013). “Supporting innovation for tourism
development through multi-stakeholder approaches: Experiences from Africa”, Tourism
Management, 35, pp. 59-69.
Chandra, D. S., & Yokoyama, K., (2011). “The role of good governance in the knowledge-based
economic growth of East Asia – A study on Japan, Newly Industrialized Economies, Malaysia
and China”, Graduate School of Economics, Kyushu University.
Chavula, H. K., (2010). “The Role of Knowledge in Economic Growth. The African
Perspective”, ICT, Science and Technology Division (ISTD),United Nations Economic
Commission for Africa (UNECA).
Chung, S., (2013). “Why do Microfinance Institutions Charge Higher Interest Rates? An
Empirical Assessment of the Fixed Cost Theory”, Michigan State University,
https://www.msu.edu/~chungs10/Chung_jmp.pdf (Accessed: 2/04/2014)
Cogburn, D., (2003). “Governing global information and communications policy: Emergent
regime formation and the impact on Africa”, Telecommunications Policy, 27, pp. 135-153.
Dahlman, C., (2007). “The Challenge of the Knowledge Economy for Latin America”,
Globalization, Competitiveness and Governability Journal, 1(1), pp. 18-46.
Darley, W. K., (2012). “Increasing Sub-Saharan Africa's Share of Foreign Direct Investment:
Public Policy Challenges, Strategies, and Implications”, Journal of African Business, 13(1),
pp. 62-69.
Demombynes, G., & Thegeya, A. (2012, March). “Kenya’s Mobile Revolution and the Promise
of Mobile Savings”. World Bank Policy Research Working Paper, No. 5988.
De Maria, W., (2010). “Why is the president of Malawi angry? Towards an ethnography of
corruption”, Culture and Organization, 16(2), pp. 145-162.

47
Dimba, B. A. (2010). “Strategic human resource managemet practices: effect on performance”,
African Journal of Economic and Management Studies, 1(2), pp. 128-137.
Eifert, B., Gelb, A., & Ramachandran, V., (2008). “The Cost of Doing Business in Africa:
Evidence from Enterprise Survey Data”, World Development, 36(9), pp. 1531-1546.
Ernst & Young (2013). “Doing business in Africa: From strategy to execution”, Growing Beyond
http://www.ey.com/Publication/vwLUAssets/Doing_business_in_Africa_-
_From_strategy_to_execution/$FILE/130130%20SGF%20Thought%20Leadership%20email%2
0version.pdf (Accessed : 07/12/2013).
Ford, D. M., (2007). “Technologizing Africa: On the bumpy information highway”, Computers
and Composition, 24 (2007), pp. 302-316.
Fosu, A., (2013a), “Growth of African Economies: Productivity, Policy Syndromes and the
Importance of Institutions”, Journal of African Economies, 22(4), pp. 523-551.
Fosu, A., (2013b), “Institutions and African Economies: An Overview”, Journal of African
Economies, 22(4), pp. 491-498.
Gerba, D. T. (2012). “Impact of entrepreneurship education on entrepreneurial intentions of
business and engineering students in Ethiopia”, African Journal of Economic and Management
Studies, 3(2), pp. 258-277.
German, L., & Stroud, A., (2007). “A Framework for the integration of diverse learning
approaches: Operationalizing agricultural research and development (R&D) linkages in Eastern
Africa”, World Development, 35(5), pp. 792-814.
Hanushek, E. A., & Woesmann, L., (2008). “The Role of Cognitive Skills in Economic
Development”, Journal of Economic Literature, 43(3), pp. 607-668.
ITU (2012). “Measuring the Information Society”, International Telecommunication Union
report.
http://www.itu.int/en/ITUD/Statistics/Documents/publications/mis2012/MIS2012_without_Anne
x_4.pdf (Accessed: 3/04/2014).
Ivashina, V., (2009), “Asymmetric information effects on loan spreads”, Journal of Financial
Economics, 92, pp. 300-319.
Jolliffe, I. T., (2002). Principal Component Analysis (2nd Ed.), New York: Springer.
Jonathan, D., & Camilo, T. (2008). “Mobile banking and economic development: Linking
adoption, impact and use”. Asian Journal of Communication, 18(4), pp. 318-322.
Kaiser, H.F., (1974). “An index of factorial simplicity”. Psychometrika, 39, pp. 31-36.

48
Kamara, A. B., Bousrih, L., & Nyende, M., (2007). “Growing a Knowledge-Based Economy:
Evidence from Public Expenditure on Education in Africa”, African Development Bank,
Economic Research Working Paper No. 88.
Kaufmann, D., Kraay, A., & Mastruzzi, M., (2010).“The Worldwide Governance Indicators:
Methodology and Analytical Issues”, World Bank Policy Research Working Paper No. 5430.
Khavul, S., Bruton, J. D., & Wood, E., (2009). “Informal Family Business in Africa”,
Entrepreneurship: Theory & Practice, 33(6), pp. 1219-1238.
Kim, S., (2013). “Korea in Africa: A Missing Piece of the Puzzle?”; (ed. Kitchen Nicolas) in
Emerging Powers in Africa, pp. 51-66.
http://www.lse.ac.uk/IDEAS/publications/reports/pdf/SR016/SR-016-Kim.pdf (Accessed:
28/03/2014)
Kinda, T., (2010). “Investment Climate and FDI in Developing Countries:Firm-Level Evidence”,
World Development, 38(4), pp. 498-513.
Kolstad, I., & Wiig, A., (2011). “Better the Devil You Know? Chinese Foreign Direct Investment
in Africa”, Journal of African Business, 12(2), 31-50.
La Porta, R., Lopez-de-Silanes, F., Shleifer, A., & Vishny, R.W., (1998). “Law and finance”,
Journal of Political Economy, 106(6), pp. 1113-1155.
La Porta, R., Lopez-de-Silanes, F., Shleifer, A., & Vishny, R. W., (1999), “The quality of
government”, Journal of Law, Economics and Organization, 15, pp. 222-279.
Lee, K., & Kim, B. Y., (2009). “Both Institutions and Policies Matter but Differently for
Different Income Groups of Countries: Determinants of Long-Run Economic Growth Revisited”,
World Development, 37(3), 533-549.
Leke, A., Lund, S., Roxburgh, C., & Van Wamelen, A., (2010). “What’s driving Africa’s
growth”, McKinsey & Company report.
http://www.mckinsey.com/insights/economic_studies/whats_driving_africas_growth (Accessed:
31/03/2014)
Letiche, J. M., (2006). “Positive economic incentives. New behavioural economics and
successful economic transitions”, Journal of Asian Economics, 17, pp. 775-796.
Lightfoot, M., (2011). “Promoting the Knowledge Economy in the Arab World”, London
Knowledge Lab, Institute of Education.
Lin, B., (2006). “A sustainable perspective on the knowledge economy: A critique of Austrian
and mainstream view”, Ecological Economics, 60(1), pp. 324-332.

49
Lor, P. J., & Britz, J., (2005). “Knowledge Production from an African perspective: International
information flows and intellectual property”, The International Information & Library review,
37, pp. 61-76.
Lor, P. J., & Britz, J. J., (2007). “Challenges of the Approaching Knowledge Society: Major
International Issues Facing LIS Professionals”, Libri, 57, pp. 111–122.
Lwoga, E. T., Ngulube, P., & Stilwell, C., (2010). “Managing indigenous knowledge for
sustainable agricultural development in developing countries: Knowledge management
approaches in the social context”, The International Information & Library Review, 42(3), pp.
172-185.
Makinda, S. M., (2007). “How Africa can benefit from knowledge”, Futures, 39, pp. 973-985.
Maswera, T., Dawson, R., & Edwards, J., (2008). “E-commerce adoption of travel and tourism
organisations in South Africa, Kenya, Zimbabwe and Uganda”, Telematics and Informatics, 25
(3), pp. 187-200.
Mensah, S. N., & Benedict, E., (2010). “Entrepreneurship training and poverty alleviation:
Empowering the poor in the Eastern Free State of South Africa”, African Journal of Economic
and Management Studies, 1(2), pp. 138-163.
Metcalfe, J. S., & Ramlogan, R., (2005). “Limits to the economy of knowledge and the
knowledge of the economy”, Futures, 37 (2005), pp. 655-674.
Mohapatra S., (2015). “Business school education and technology---a case study”, Journal
Education and Information Technologies, 20(2), pp. 335-346.
Mohapatra S., & Thakurta , R., (2014). “Knowledge management practices of an IT company”,
Emerald Emerging Markets Case Studies, http://dx.doi.org/10.1108/EEMCS-07-2013-0130
Moodley, S., (2003). “The Challenge of e-business for the South African apparel sector”,
Technovation, 23, pp. 557-570.
Myburgh, A. F., (2011). “Legal developments in the protection of plant-related traditional
knowledge: An intellectual property lawyer’s perspective of the international and South African
legal framework”, South African Journal of Botany, 77, pp. 844-849.
Neimark, B. D., (2012). “Industrializing nature, knowledge, and labour: The political economy of
bioprospecting in Madagascar”, Geoforum, 43, pp. 980-990.
Nguena, C. L., & Tsafack, N. R., (2014). “On the Sensitivity of Banking Activity Shocks:
Evidence from the CEMAC Sub-region”. Economics Bulletin, 34(1), pp. 354-372.
Nyarko, Y., (2013a). “Sustaining High Economic Growth in Sub-Saharan Africa: Knowledge and
the Structure of the Economy”, Journal of African Economies, 22, suppl_1(January), pp: -i101.

50
Oseifuah, E. K., (2010). “Financial literacy and youth entrepreurship in South Africa”, African
Journal of Economic and Management Studies, 1(2), pp. 164-182.
Oyelaran-Oyeyinka, B., & Gehl Sampath, P., (2007). “Innovation in African Development. Case
Studies of Uganda, Tanzania and Kenya”, A World Bank Study.
http://info.worldbank.org/etools/docs/library/239730/InnovationInAfricaFinalPaper.pdf
(Accessed: 28/03/2014).
Paul, B., Bhorat, H., & Cheadle, H., (2010). “The cost of “doing business and labour regulation:
The case of South Africa”, International Labour Review, 149(1), pp. 73-91.
Preece, J., (2013). “Africa and international policy making for lifelong learning: textual
revelations”, International Journal of Educational Development, 33, pp. 98-105.
Raseroka, K., (2008). “Information transformation Africa: Indigenous knowledge – Securing
space in the knowledge society”, The International Information and Library Review, 40, pp. 243-
250.
Rolfe, R. J., & Woodward, D. P., (2004). “Attracting foreign investment through privatization:
the Zambian experience”, Journal of African Business, 5(1), pp.5-27.
Rooney, D., (2005). “Knowledge, economy, technology and society: The politics of discourse”,
Telematics and Informatics, 22, pp. 405-422.
Rugimbana, R., (2010). “Business strategies for achieving sustainable development in Africa:
Introduction to the special issue”, African Journal of Economic and Management Studies,
1(2), pp. 121-127.
Saxegaard, M., (2006). “Excess liquidity and effectiveness of monetary policy: evidence from
sub-Saharan Africa”, IMF Working Paper No. 06/115.
Singh, S., Simpson, R., Mordi, C., & Okafor, C., (2011). “Motivation to become an entrepreneur
: a study of Nigerian women’s decisions”, African Journal of Economic and Management
Studies, 2(2), pp. 202-219.
Southall, R., (2008). “Doing Business in Africa”, Journal of Contemporary African Studies,
26(2), pp. 223-230.
Suh, J., & Chen, D. H. C., (2007). “Korea as a Knowledge Economy. Evolutionary Process and
Lessons Learned”, Korea Development Institute,
https://www.usp.ac.fj/worldbank2009/frame/Documents/Publications_regional/409300PAPER0K
R101OFFICIAL0USE0ONLY1.pdf (Accessed: 19/03/2014).
Sumberg, J., (2005). “Systems of innovation theory and the changing architecture of agricultural
research in Africa”, Food Policy, 30(1), pp. 21-41.

51
Taplin, R., & Snyman, M., (2004). “Doing business in South Africa’s new mining environment:
A legal perspective”, CIM Bulletin, 97(1078), pp. 91-98.
Tapsoba, S. J-A., (2010). “Trade Intensity and Business Cycle Synchronicity in Africa”, African
Development Review, 22(1), pp. 149-172.
Tran, M., (2011). “South Korea: a model of development?”, The Guardian,
http://www.theguardian.com/global-development/poverty-matters/2011/nov/28/south-korea-
development-model (Accessed: 28/03/2014).
Tuomi, K., (2011). “The Role of the Investment Climate and Tax Incentives in the Foreign Direct
Investment Decision: Evidence from South Africa”, Journal of African Business, 12(1),
pp. 133-147.
Wagiciengo, M. M., & Belal, A. R., (2012). “Intellectual capital disclosure by South African
companies: A longitudinal investigation”, Advances in Accounting, 28(1), pp. 111-119.
Wantchekon, L., Klasnja, M., & Novta, N., (2014). “Education and Human Capital Externalities:
Evidence from Colonial Benin”, Department of Politics, Princeton University.
Weber, A. S., (2011). “The role of education in knowledge economies in developing countries”,
Procedia Social and Behavioral Sciences, 15, pp. 2589-2594.
World Bank (2007). Building Knowledge Economies. Advanced Strategies for Development.
World Bank Institute Development Studies. Washington DC.
Wyk, J. V., Dahmer, W., & Custy, M. C., (2004). “Risk management and the business
environment in South Africa”, Long Range Planning, 37, pp. 259-276.
Yin, J. Z., & Vaschetto, S., (2011). “China’s Business Engagement in Africa”, The Chinese
Economy, 44 (2), pp. 43-57.
Zerbe, N., (2005). “Biodiversity, ownership, and indigenous knowledge: exploring legal
frameworks for community, farmers, and intellectual property rights in Africa”, Ecological
Economics, 53, pp. 493-506.