the role of haematocrit in oxygen transport and swimming in
TRANSCRIPT

THE ROLE OF HAEMATOCRIT IN OXYGEN TRANSPORT AND SWIMMING IN SALMONID FISHES
by
Patricia Elizabeth Gallaugher
B.Sc. University of British Columbia
THESIS SUBMITTED IN PARTIAL FULFILLMENT OF THE REQUIREMENTS FOR THE DEGREE OF
DOCTOR OF PHILOSOPHY
in the Department
of BIOLOGICAL SCIENCES
O Patricia Gallaugher 1994
SIMON FRASER UNIVERSITY
August 1994
All rights reserved. This work may not be reproduced in whole or in part, by photocopy or other means,
without pem~ission of the author.
APPROVAL
NAME: PATRICIA ELIZABETH GALLAUGHER
DEGREE: DOCTOR OF PHILOSOPHY
TITLE OF THESIS:
THE ROLE OF HAEMATOCRIT IN OXYGEN TRANSPORT AND SWIMMING IN SALMONID FISHES
Examining Committee:
Chair: Dr. Leah Bendell-Young, Professor
Dr. A P F a p l l , Professor, sen& Supervisor, ~ e ~ a r b e n t f Biological Sciences, SFU
Dr. A.H.J. Burr, Aksociate Professor Department of Biological Sciences, SFU
Dr. B. McKeown, Professor Department of Biological Sciences, SFU
-
Dr. C. Kennedy, Assistant Profess Department of Biological SciencxSFU Public Examiner
- Dr. Warren ~ u r ~ ~ r e n , Professor Department of Biology, Universitp bf Nevada Las Vegas External Examiner
Date Approved

PARTIAL COPYRIGHT LICENSE
I hereby g r a n t t o Simon Fraser U n i v e r s i t y t h e r i g h t t o lend
my t h e s i s , p r o j e c t o r extended essay ( t h e t i t l e o f which i s shown below)
t o users o f t h e Simon Fraser U n i v e r s i t y L i b r a r y , and t o make p a r t i a l o r
s i n g l e cop ies o n l y f o r such users o r i n response t o a reques t from t h e
l i b r a r y o f any o t h e r u n i v e r s i t y , o r o t h e r educa t i ona l i n s t i t u t i o n , on
i t s own beha l f o r f o r one o f i t s users . I f u r t h e r agree t h a t permiss ion
f o r m u l t i p l e copy ing o f t h i s work f o r s c h o l a r l y purposes may be g ran ted
by me o r t he Dean o f Graduate S tud ies . I t i s unders tood t h a t copy ing
o r p u b l i c a t i o n o f t h i s work f o r f i n a n c i a l ga i n s h a l l n o t be a l l owed
w i t h o u t my w r i t t e n permiss ion .
Au thor :
Patricia Gallaugher
(name)

ABSTRACT
The optimal haematocrit (Hct) hypothesis suggests that vertebrate Hct is set to
maximize the rate of oxygen transport in arterial blood (To2). Since To2 is equal to the
product of the oxygen content of arterial blood (Cag2) and cardiac output (Q), this
implies that Hct is adjusted to maximize blood oxygen carrying capacity without
compromising blood flow and cardiac work through elevated blood viscosity (q). Thus,
the Hct value which coincides with maximum To2 (ToZmax) represents the optimal Hct
(Hctopt).
I tested this hypothesis in rainbow trout (Oncorhynchus mykiss) by altering Hct
between extreme states of anaemia and polycythemia (Hct = 8 - 55%). I predicted that
the effects of q on cardiac work would be greatest at peak aerobic exercise levels when Q
would be maximum (emax). Moreover, I predicted that ToZmax and maximal oxygen
uptake (Vo2,,,) would peak at Hctopt. Therefore, my experimental approach was to
challenge fish to swim to their critical swimming velocity (Ucrit) in a swim-tunnel
respirometer while oxygen uptake (Vo2) and other cardiovascular variables were
measured. Furthermore, since blood viscosity is higher at lower temperatures,
experiments were performed at both 5 O C and 13 O C .
The mean normal Hct (normocythemia) for rainbow trout at rest was 27 - 30%.
Cao2 was linearly related to Hct across the experimental range from 8 - 55%. Consistent
with the Hctop, hypothesis, the decreased Cag2 in anaemic fish (Hct < 21%) caused a
significant reduction in Uc,it and V02max. As expected, there was an exponential
relationship between q, measured in vitro, and the experimental Hct, and Qmax was
significantly lower in fish with the highest Hct values.
Contrary to the Hctopl hypothesis, ToZmax was not compromised with
polycythemia (Hct > 33%). Despite the effects of q , ToZmax increased with Hct, up to

Hct = 55%, at both 5 "C and 13 "C, and moreover, polycythemia produced significant,
albeit small, increases in Ucrit Futhermore, peak V 02max occurred at an Hct (42%) well
above normal Hct (normocythemic) values. It appears that both Ucrit and VoZmax in
normocythemic fish are limited by the capacity for internal convection of 0 2 .
I suggest that while the lower limit for normocythemia is set by C q 2 , the
regulation of the upper limit for normocythemia involves more than q effects on cardiac
work. One factor which may set upper Hct is the Hct-dependent decrease in arterial
oxygen tension ( P w 2 ) observed at Ucrit. This decreased Pao2 (indicative of diffusion
limitations to O2 transfer at the gills) did not cause decreases in C w 2 at most Hct values,
but the peak for VoZmax may coincide with an Hct at which this arterial hypoxaemia
begins.
Other potential limiting factors for upper Hct were revealed in experiments with
exercise-trained chinook salmon (0. tshawytscha). Small (<20%) Hct increases in
trained, compared with control, fish were not associated with decreased Qmax. Trained
fish tended to have higher Vo2,,, but not Ucrit, values. Evidence is presented which
indicates that Hct is important in determining Vo2 for metabolic functions other than
contraction of locomotory muscles (e.g., osmoregulation and growth).
Thus, although Hct is a determinant of V 02, it is not optimized for swimming
performance. This may be related to the high cost of swimming for these species; i.e.,
V 02 (cost) increases faster than Ucrit (benefit).

This thesis is dedicated to my children, Nial and Mary, with my love,
and
to the memory of Arthur and Phyllis Gallaugher, my parents,
and of my grandfather, P. J. Bain.
We shall not cease from exploration And the end of all our exploring Will be to arrive where we started And know the place for the first time.
T. S. Eliot

Acknowledgements
I wish to thank my supervisor, Dr. Tony Farrell, for his counsel and support, and
his encouragement.
My thanks also to my collaborator on many of the experiments in this thesis, Dr.
Helgi Thorarensen, for his optimism, resourcefihess, humour and friendship.
I thank Dr. Michael Axelsson for his advice on many of the surgical methods and
technology used to obtain the data in this thesis, Dr. Anders Kiessling for the invitation to
collaborate on the chinook training experiments, and Dr. Mark Graham for his
collaboration on the visocisty measurements in Chapter 3.
I acknowledge the contribution of my committee members, Dr. Jay Burr and Dr.
Brian McKeown, in the editing of this thesis.
Finally, I wish to thank my friends who have been so supportive of my
endeavours during the past years.
While working on this thesis, I was supported by Graduate Fellowships from
Simon Fraser University. This research was supported by grants to A. P. Farrell fiom
NSERC.
vii

Table of Contents
... Abstract ................................................................................................................ 111
.............................................................................................. Acknowledgements vii
... Table of contents ................................................................................................. viii
List of tables ......................................................................................................... xii
... ....................................................................................................... List of figures xlll
................... Key to abbreviations and units of measurements used in this thesis xv
Introduction: ........................................................................................................ 1
................................. Introduction to the optimal haematocrit hypothesis 1
....................... Using an exercise challenge to test the Hctopt hypothesis 8
................................................... Statement of the purpose of this thesis 11
Chapter 1 . Literature Review ................................................................................. 13
Internal convection of oxygen ............................................................... 13
Blood oxygen carrying capacity ................................................... 13
The binding of O2 to haemoglobin ...................................... 13
....................................................................... Haematocrit 14 . . .................................................................... Erythropoiesis 17
......................................................... The role of the spleen 18
.................................................................................. Blood flow 21
Cardiac output in fish ......................................................... 21 . . .
Blood flow distribution ....................................................... 23
................................................................... Blood viscosity 24
..................... Factors which determine blood viscosity 25
....................... Temperature effects on blood viscosity 27
............... Exercise-induced changes in blood viscosity 28
Tests of the Hctopl hypothesis .............................................................. 29
..... Predicting Hctopt by calculating the oxgyen transport capacity 29 . . ............................ Using extreme Hct values to test Hctopr in vrvo 31
............................................................................ Anaemia 31
Polycythemia ..................................................................... 33
............................................................................................. Summary 37
... Vll l
Chapter 2 . Swimming performance and haematological variables in splenectomized
rainbow trout ................................................................................... 39
Introduction ................................................................................ Discussion ..................................................................................
Chapter 3 . Haematocrit is not optimized for oxygen transport in swimming
rainbow trout ....................................................................................... Introduction ................................................................................
................................................................. Material and Methods
......................................................... Experimental animals
Surgical Procedures ........................................................... .............................................. Experimental Protocol
............................................ Haematocrit adjustment
Swimming trials and oxygen uptake measurements .... 52
Blood sampling and analytical techniques .................. 53
........................................................................................ Results 55
Relationships between Hct (Hb) and Cag2. blood viscosity.
Q. and T o 2 .............................................................. 55
................................... Effects of Hct on Ucrit and V 02max 62
Arterial hypoxaemia and oxygen desaturation ...................... 68
Changes in haematological parameters associated with
swimming to Ucrit ..................................................... 68
............................................................. Cost of swimming 70
Discussion .................................................................................. 72
.................................................................. Normcythemia 72
Blood viscosity and relative conductance ............................ 72
CardiacOutput .................................................................. 75
................................ Internal convection of oxygen at UCrit 78
The relationship between Hct and maximum exercise
............................... performance and oxygen uptake 78
........................................................... Arterial hypoxaemia 83
.............................................................. Cost of swimming 88
Changes in haematological variables associated with
swimming to Ucrit .................................................... 89

............................................... change in Hct at Ucrit 89
.......................................................... pH and lactate 90
Blood volume ........................................................... 91
Effect of temperature on Ucrit and V oZrnax ....................... 93
Conclusion .................................................................................. 96
Chapter 4 . Effects of aerobic exercise-training on oxygen transport and swimming
performance in chinook salmon ................................................... 99
Introduction ............................................................................... 99
................................................................ Materials and Methods 107
.......................................................... Experimental animals 107
............................................................ Surgical procedures 108
Measuring swimming performance and oxygen uptake
and Q and blood sampling ......................................... 109
..................................................... Haematological analysis 109
Measurements of muscle dry matter ................................... 109
........................................................... Control experiment 110
............................................. Data acquisition and statistics 110
....................................................................................... Results 110
Training effects on haematological variables ....................... 110
........ Swimming performance and maximal oxygen uptake 113
Effect of exercise training and swimming to Ucrit on
............................................................ water balance 113
........................................................................ Heart size 114
.................................................................................. Discussion 117
Effects of endurance training on blood oxygen carrying ................................................................... capacity 117
Effect of exercise training on swimming performance and ........................................................ oxygen uptake 121
Effect of exercise training on osmoregulation ..................... 123
Haematological changes associated with swimming
.................................................................................. Conclusion 132

Chapter 5 . General Summary ................................................................................ 135
Establishing a range for normocythemia in salmonids .................... 135
........ The HctVl hypothesis for oxygen transport in rainbow trout 136
............. Factors setting limits for normocythemia in rainbow trout 140
..................................... The divorce between V oZmax and Ucrit 141
References ........................................................................................................... 143
........................................................................................................... Appendixes 178
Appendix 1 . Swimming performance and haematological variables in ...................................................... splenectomized rainbow trout 178
Appendix 2 . A summary of haematological parameters in rainbow trout and
chinook salmon at rest and changes which occur when
...................................................................... swimming to Ucrit 193
. ................................... Appendix 3 Cardiac output in swimming rainbow trout 206
Appenidix 4 . Intestinal blood flow in swimming chinook salmon and the
........................ effects of haematocrit on blood flow distribution 233

List of Tables
Table 1. Haematological parameters in anaemic (A), normocythemic (N) and ...... polycythemic (P) groups of SW summer and FW winter rainbow trout 65
Table 2. The effect of blood removal and replacement on blood viscosity in normocythemic SW rainbow trout (A) and the effect of Hct on blood
....................................... viscosity at rest and after swimming to Ucrit (B) 66
Table 3. Heart rate, cardiac output, and arterial blood pressure at rest and Ucrit7
and V 02rest in anaemic, normocythemic and polycythemic summer (S W) rainbow trout ............................................................................................. 67
Table 4. Haematological variables for the two training groups of chinook salmon ......... at rest, - 80% Ucrit, Ucrit and after one hour of recovery from Ucrit 11 1
Table 5. Body mass and plasma osmolality at rest, at Uc-it, and after one hour of recovery from Ucrit, in LS2, HS2, training groups of chinook salmon
................................ and in chinook salmon from the control experiment 11 7
Table 6. Plasma osmolality at rest, at Uc,it and after one hour of recovery from Ucrit in chinook salmon from TR1, and in FW- and SW-adapted
.......................................................................................... rainbow trout.. 125
Table 7. Summary of correlative analysis for plasma osmolality and pHa at rest ............................................ and Ucrit and for Pao2 and Cag2 at Uuit. 133
xii

List of Figures
Figure 1. The theoretical relationship between Cao2 and Hct, and between .................. blood viscosity and Hct, as predicted by the HctVt hypothesis 3
Figure 2. A schematic diagram showing the various parameters that are involved in .......................................................... determining oxygen transport in fish 6
Figure 3. The relationship between [Hb] and Hct at Ucrit in SW summer and ......................................................................... FW winter rainbow trout 56
Figure 4. The relationship between Cao2 and [Hb] at Ucrit for SW summer and F W winter rainbow trout.. ......................................................................... 5 7
Figure 5. Blood viscosity as a function of shear rate and Hct in SW ................................................................................... summer rainbow trout 59
Figure 6. (A) Relative conductance at rest and at Ucrit, and (B) Relative oxygen transport at Ucrit, as a function of Hct in
......................................................................... SW summer rainbow trout 61
Figure 7. Critical swimming velocity (Ucit) (A) and Maximum oxygen
uptake ( V 02max) (B) in relation to Hct at Ucrit in SW summer and ........................................................................ FW winter rainbow trout 63
Figure 8. Arterial blood oxygen tension (Pao2) at Ucrit in relation to Hct ................................ at Ucrit in SW summer and FW winter rainbow trout 69
Figure 9. Cost of Swimming and Ucit as functions of Hct in SW summer rainbow trout ......................................................................................... 7 1
Figure 10. The relationship between Cao2 and [Hb] (and Hct), at Ucrit, in S W summer and FW winter rainbow trout .............................. 84
Figure 1 1. Muscle dry weight of LS2 and HS2 training groups of chinook salmon and for chinook salmon one hour after swimming
........................................................................ to Ucrit in a swim tunnel 1 16
Figure 12. Changes in plasma osmolality in LS2 and HS2 training groups of chinook salmon at rest, while swimming to Ucrit, at Ucrit, and after a one hour recovery following Ucit ........................................................... 1 18
... X l l l

Figure 13. A summary of the observations reported in this thesis with regard to
maximum To2, V 02rnax, Ucrit and emax, as functions of Hct in rainbowtrout ......................................................................................... 137
xiv

Key to abbreviations and units of measurements used in this thesis
bl:
bm:
BV:
c o 2 :
CATS:
cao2 :
c v o 2 :
DA:
f ~ :
Epo:
E02:
[Hb] :
Hct:
Hct,:
HctU:
body length
Body mass (g)
Blood volume (m1.100g body mass-')
Carbon Dioxide
Catecholamines
O2 content of arterial blood (mL-dL-1; ~ 0 1 % )
O2 content of venous blood (mL.dL-1; ~ 0 1 % )
Dorsal aorta
Heart rate( beats per minute)
Erythropoietin
Fraction of O2 extracted from the blood in tissues
Concentration of haemoglobin (g.dL-I)
Haematocrit (% red blood cell fraction of blood)
Haematocrit measured at rest
Haematocrit measured at Ucrit
Hctopr: Optimal haematocrit
MCHC: Mean cell haemoglobin concentration (g.L-')
T : Blood viscosity (cP)
NTP: Nucleotide triphosphates
02: Oxygen

P w 2 :
Pvo*:
Pwo2:
Pc02:
PDA:
Q /P,:
VA:
pH,:
Q :
Qmax:
Qrest :
~ I A :
R, :
sv,:
T02:
Partial pressure of 0 2 in arterial blood (kPa)
Partial pressure of O2 in venous blood (kPa)
Partial pressure of 0 2 in water ( H a )
Partial pressure of C 0 2 (kPa)
Blood pressure in the dorsal aorta (kPa)
Relative systemic conductance (ml.min-l-kg-l.kPa-l)
Blood pressure in the ventral aorta ( H a )
pH of arterial blood
Absolute cardiac output (mL blo~d-min-~.kg-l) or as % change fiom resting levels
Maximum cardiac output
Resting cardiac output
Intestinal blood flow (either as % change fiom resting levels or as absolute blood flow mL-min-'+kg-')
Systemic vascular resistance (kPa.mL-1 minakg-1)
Stroke volume of the heart (mL.kg-I)
Cardiovascular 0 2 transport = Q Cao2 (mL02.min-'.kg-')
T02rnax: Maximum cardiovascular 0 2 transport
TPR: Total peripheral resistance (Systemic resistance + gill resistance)
Ucrit: Critical swimming velocity (cm.s-I or b1.s-I)
V 02: O2 uptake (m102.min-1-kg-l)
xvi

V Ozmax: Maximum O2 uptake
V 0 2 y s t : Resting O2 uptake
xvii

INTRODUCTION
Introduction to the Optimal Haematocrit Hypothesis
The amount of oxygen taken up from the environment and transported via the
cardiovascular system in vertebrates is a function of both blood flow and blood oxygen
(02) carrying capacity. Blood flow is produced by the pumping action of the heart which
creates pressures sufficient to overcome vascular resistance, while the 0 2 carrying
capacity of the blood is primarily determined by the concentration of the 0 2 binding
protein, haemoglobin (Hb), which is packaged into red blood cells. Thus, the fractionate
portion of blood that is red blood cells, or haematocrit (Hct), is a measure of the capacity
for blood to carry 02. Theoretically then, the greater the Hct, the greater the capacity for
oxygen transport (To2). However, resistance to blood flow is, in part, determined by
blood viscosity (q). Blood viscosity is primarily a function of Hct, increasing
exponentially as Hct increases from near zero up to levels as high as 70% in mammals
(Stone ef al., 1968; Chien, 1975), reptilians (Snyder, 1971), amphibians (Hillman et al.,
1985), and teleosts (Graham and Fletcher, 1983; Graham and Fletcher, 1985; Wells and
Baldwin, 1990), including rainbow trout (Fletcher and Haedrich, 1987; Wells and Weber,
1991). Therefore, higher Hct values would require greater cardiac work to overcome the
higher resistance associated with elevations in q. Since there is an upper limit to the
Pressure work that a heart can perform, a selection pressure limiting Hct in vertebrate
blood is likely to be q. On the other hand, higher Hct values would favour a greater
merial blood O2 concentration (Cao2), and possibly a higher O2 uptake (Vo2), and
greater aerobic scope.
It is generally held that vertebrates regulate Hct (Guyton, 1976). One explanation
for what sets resting Hct levels in vertebrates comes from the optimal haematocrit

(HctOpt) hypothesis, which suggests that there is a trade-off between 0 2 carrying capacity
and cardiac work, so that Hct is set at a level where the O2 carrying capacity of the blood
is maximized without compromising cardiac performance (or To*) through increased 11
(Richardson and Guyton, 1959; Guyton and Richardson, 1961 ; Crowell and Smith, 1967;
Guyton, 1976). Figure 1 describes this theoretical relationship. The theoretical Hctopt is
predicted as the point at which the lines for the two dependent variables intersect.
The initial experiments on resting, anaesthetized mammals which led to the
formation of this hypothesis (Richardson and Guyton, 1959; Guyton and hchardson,
1961) are supported by evidence from more recent studies with other vertebrates, e.g.,
measurements of Hct and q in diving mammals (Hedrick et al., 1986), manipulations of
Hct and 11 in exercising amphibians (Hillman et al., 1985), and theoretical calculations of
an Hctopt in fishes, including rainbow trout (Oncorhynchus mykiss), using in vitro blood
viscosity measurements (Wells and Weber, 199 1).
Fishes represent a particularly good experimental model in which to test Hctopt as
they are poikilothermic and q is known to increase with decreasing temperature (Rand et
a/., 1964). Therefore, Hct can be experimentally manipulated to vary q , and in addition
even greater q effects may be achieved by changing the ambient temperature. Indeed, the
best empirical evidence in favour of the Hctopt hypothesis comes from some species of
Antarctic fishes which may be entirely devoid of erythrocytes (the so-called
haemoglobin-free fishes), presumably as an adaptation to reduce the effects of at the
ambient sub-zero temperatures (Wells et al., 1990).
Since the inception of the Hctopt hypothesis, a number of empirical observations
have raised doubts about its validity. In general, these studies present findings which
question the underlying assumptions of the hypothesis. One such assumption is that
increased Hct, and the associated increase in q, cause an increase in cardiac work because

Figure 1 . The theoretical relationship between Cao2 and Hct (solid line), and between
blood viscosity and Hct (dashed line; plotted as 1 / q), as predicted by the
HctOpr hypothesis. Hctop, would occur at the intersection of the two lines,
indicating the best compromise for the trade-off between blood oxygen
carrying capacity and cardiac work. (for the dependent variables,
1 = maximum relative capacity and 0 = minimum relative capacity)

Hct

the geometric component of systemic resistance (Rs) is constant; i.e., the possibility of
vasodilatory activity in the presence of elevated Hct is ignored. A consistent finding in
mammalian studies is that vascular adjustments in conscious, resting (and particularly
exercising) animals when Hct is elevated, may compensate for the effects of increased q
(e.g., Gustafsson et al., 1980).
Moreover, the HctOpr hypothesis assumes that animals are incapable of increasing
Q sufficiently to compensate for elevated q . This is unlikely to be the case in resting
states, however, since most vertebrates can increase resting Q (Qrest) even if vascular
resistance is increased. This caveat is particularly true of salmonids and mammals which
have exceptionally good intrinsic homeometric regulation (i.e., the ability to maintain
power output over a broad range of output pressures) (Farrell and Jones, 1992).
Interspecific differences in the capacity of the heart for homeometric regulation will
clearly influence the importance of q in setting Hct.
Furthermore, mammalian studies have demonstrated a disparity between 7
measured when in vivo, compared with in vitro measurements, and in addition have
shown that exercise may actually induce decreases in q, compared with resting
conditions. (e.g., Gustafsson et al., 1980). In view of the general concerns regarding the
importance of q effects, and of the possibility of vasodilatory compensation for q , in vivo,
one should be cautious when drawing conclusions based on theoretical estimates of
Hctopt which employ in vitro measurements of q to infer information on the state of Q,
rather than direct measurements of Q or Rs (e.g., Hedrick et al., 1986; Wells and Weber.
1991).
Another important assumption underlying the Hctopt hypothesis is that q and
Ca02 are solely fimctions of Hct. m i l e the viscosity of blood is predominantly a
function of Hct, in some cases it may also be significantly affected by plasma viscosity.

The relationship between Cag2 and Hct is less direct. In fact, Cag2 is primarily
determined by the concentration of the oxygen-binding protein, haemoglobin ([Hb]), and
in addition is inhenced by the affinity of Hb for 02, and the arterial blood 0 2 tension
( P a 2 ) . Figure 2 describes the relationships between a number of these factors. Under
certain physiological conditions there may be changes in each of these factors, which
could significantly alter C w 2 without necessarily incurring changes in q. For example.
[Hb] is not always linearly related to Hct and thus the [Hb] / Hct ratio or mean cell [Hb]
(MCHC) may change. Conditions which bring about increases in plasma C02 tension
(Pco*) or catecholamine concentrations (CATS), may cause erythrocyte swelling,
resulting in an increase in Hct, but at the same time a decrease in MCHC. In addition,
fluid shifts between intra- and extra-vascular, or intra- and extra-cellular compartments,
and (or) the body and the environment, may all vary plasma osmotic balance and (or)
volume, potentially effecting changes in cellular dimensions and MCHC, and these
changes may in turn cause changes in plasma volume and thus Hct, without necessarily
affecting [Hb]. Moreover, increases in Hct may occur via spleen transfusion, and since
the MCHC of splenic erythrocytes may vary from the erythrocytes in the general
circulation, disproportionate changes could occur in [Hb] and Hct. Furthermore, C w 2
may be altered through changes in Hb-O2 affinity, which itself is related to a ~ m h r of
factors that are not directly related to Hct; e.g., erythrocyte pH, Pco2, nucleotide
triphosphate concentrations ([NTP]) and pw2 In turn, Pw2 is dependent on diffusive
gas exchange at the gills, and this is also subject to a number of variables, including
blood pH and [C02], and the oxygen tension of the water (Pwo2). Again, changes in this
Parameter would not be expected to alter Hct directly, but could have profound effects on
C w 2 . Thus. observations of the relationship between Hct (Cao2) and To2 may be
strongly influenced by the physiological state of the animal during blood sampling (e.g.,

Figure 2. A schematic diagram showing the various parameters that are involved in
determining oxygen transport in fish. & factors decrease Hct or MCHC,
? factors increase Hct or MCHC.

I Oxygen Transport
(Filling and output
pressures)
I I
Blood viscosity LJ
Cardiac Output
i
Plasma Viscosity
Blood Oxygen Carrying Capacity
lLlpkj(q Deformability
I
[HbI
I I
1 r
Hct
CATS
Ett: transfusion
haemoconcentration
osmotic hydration
I 1 haemodilution ' 1 osmotic dehydration
osmotic hydration
Hb - 0 2 affinity
erythropoietin
osmotic dehydration
Pw02
A-V 0 2 difference
gill blood flow pattern
diffusion distance

anaesthetized, conscious, resting, exercising, hypoxic, exposure to stressful handling
procedures, erc.) and a number of these factors may change Cag2 without affecting Hct
and q . The Hctopt hypothesis does not recognize the possibility of these changes. It is
also notable that the original work which led to the Hctopr hypothesis (i.e., Richardson
and Guyton, 1959), was performed on anaesthetized animals.
A more empirical concern with the Hctopt hypothesis is that it is hard to reconcile
the apparent large inter- and intraspecific variability in Hct values reported for vertebrate
species with the concept of an Hctopt. Hct values reported for non-diving mammals
range between 30% and 48% (Birchard and Tenney, 1990). An even larger interspecific
range from 0% to 53% has been reported for Hct in fishes (Fange, 1992). In addition, a
large degree of intraspecific variability in Hct has been reported for both mammalians and
fishes. For example, Hct values ranging from 17 - 44% have been reported for rainbow
trout (Wells and Weber, 1991).
The definition of normal Hct (normocythemia) is particularly problematic in fish,
in that the accuracy of an Hct measurement very much depends on the method used for
blood sampling, and on the condition of the animal at the time of sampling. Even the best
surgery leads to an unavoidable, albeit small, loss of blood due to the difficulty of
surgical repair of tissue damage in a water environment. Thus, some of the low Hct
values reported for rainbow trout are probably indicative of anaemia. In addition, the use
of caudal puncture or other "grab and stab" methods for blood sampling inevitably causes
handling stress and the consequent induction of cellular swelling, spleen transfusion, and
(or) fluid shifts, all of which may yield erroneously high Hct values. In fact, this may
also explain the apparent disparity between calculated and predicted Hctop values and
Hct values measured in viva in some studies. This emphasizes the need to measure Hct in

well-rested fish, cannulated with good surgical techniques, in order to obtain credible
values for normocythemia.
Finally. and of more fundamental concern, the Hctopt hypothesis assumes that Hct
is optimized solely for the function of To2, when in fact, Hct (Hb) has a number of other
h c t i o n s , including acid-base regulation, C 0 2 excretion, and 0 2 storage in diving birds
and mammals. Therefore, theoretically Hct could be optimized for any one of these
functions or perhaps for the best compromise for a combination of functions.
Using an exercke challenge to test the Hctopt hypothesis
Several explanations have been proposed for what limits exercise performance in
vertebrates (see Saltin and Strange, 1992). One school of thought is that there are
perfusion limitations such that the cardiovascular system cannot transport sufficient 0 2 to
meet the requirements of the tissues. If Hct is optimized because cardiac work is limited,
then there is a ceiling to blood 0 2 carrying capacity and this could limit the capacity to
deliver 0 2 to the tissues, thereby limiting exercise performance. Another view is that
there are diffusion limitations to exercise performance, and in this case it is assumed that
the convection of O2 is sufficient, and instead the limitations to exercise performance
stem from a reduction in the uptake of 0 2 , either by the blood from the environment or by
the tissues from the blood. Results of experiments which assess the role of Hct ([Hb])
and blood O2 carrying capacity in determining both maximum aerobic exercise
performance and V ozrnax also shed light on the longstanding perfusion versus diffusion
limitation debate (Saltin and Strange, 1992). Apart from anaemia, the importance of
TO^, and in particular Hct, in determining maximum exercise performance in fish has not
been well-investigated.

It is logical to test the Hctopt hypothesis in maximally aerobically exercising
animals since adequate oxygen transport is critical, if not limiting, to exercise
performance. Moreover, cardiac output is typically maximal, or at least approaching
maximum Q (Q,,,) during this time. Therefore, any detrimental effects of q on cardiac
work, and thus on To2, should be evidenced by a compromised maximal exercise
performance (e.g. decreased V 0 2 ~ ~ ) as manifested by the animal's heart not being able
to continue to pump maximally.
Exercise in fish is generally classified as either sustained, prolonged, or burst
swimming (Beamish, 1978). Sustained swimming, which is fueled aerobically and can be
maintained for long periods of time, includes the routine activity of a fish as well as
migratory movements. In contrast, burst swimming is the high speed, short duration (less
than 20 seconds), sprint type of activity which is fueled anaerobically and is essential as a
survival strategy. The term prolonged may be used to describe the steady type of activity
in the transition zone between sustained and burst performance. Prolonged activity can
be maintained from 2 to 200 minutes with an increasingly greater anaerobic component as
fatigue is approached at higher swimming velocities. (Beamish, 1978). It is this type of
activity which is usually measured in aerobic performance tests in the laboratory and
which is used to assess all measures of exercise performance in this thesis.
The type of swimming described as maximal aerobic exercise performance in fish
may be measured either indirectly as the critical swimming velocity (Ucrit) (i.e., the
maximal prolonged swimming speed), or directly as maximum Vo2 (Vo2rnax). The
primary determinant of Vo2 during maximal aerobic exercise is the demand of the
mitochondria of the red (oxidative) muscle fibres for O2 to fuel oxidative phosphorylation
(Lindstedt et al., 1988; Lindstedt, 1993; Weibel et al., 1992; Turner et al., 1993). The
Fick Equation,

describes the fact that a given V o2 measurement will equal the amount of 0 2 transported
away from the respiratory exchange site in the blood, where Q is cardiac output (or blood
flow), and ( C w 2 - Cvo2) is the difference in the 0 2 content of arterial and venous blood,
respectively; i.e., the arterial-venous (A-Vo2) difference. Therefore, (Q . A-Vo2
difference) is the internal convection requirement for Vo2. The A-Vo2 difference is
determined by [Hb] (Hct), the O2 binding capacity of Hb, the saturation of arterial blood
with 02, and the amount of 0 2 extracted in the systemic circulation. A change in any of
these parameters will affect Vo2. Depending on the species, significant changes in Q
and (or) the A-Vo2 difference will occur during exercise, to match V 0 2 with the 0 2
demands of muscle tissues. Theoretically then, reaching Qma and (or) maximum A-
V O ~ difference can potentially limit V oZmax and maximal exercise performance.
Rainbow trout, by virtue of their "athletic" nature and ability to swim in a wide
temperature range in their natural habitat, represent a good experimental subject in which
to study the Hctqr hypothesis. In addition, they can be challenged to swim at high
aerobic swimming velocities over long periods of time in a laboratory environment (in a
swim-tunnel respirometer) and exercise performance can be assessed by measuring Ucrit
and V02max. Moreover, there are a number of well-established surgical techniques for
sampling blood (arterial cannulation) and measuring blood flow (Doppler and Transonic
flow probes) in salmonids. Finally, it is possible to exercise-train salmonid species over
10% periods of time, to examine the plasticity of the various parameters involved in To2.

Statement of the purpose of this thesis
The purpose of this thesis is to examine T o 2 in swimming salmonid fishes and, in
particular, to test the HctVt hypothesis by determining whether Hct is optimized for To2
during maximal aerobic exercise in rainbow trout. In addition, this thesis will address the
factors which may alter, and control, Hct levels in two salmonid species (rainbow trout,
and chinook salmon, Oncorhynchus tshawytscha). The following is a list of the main
information conveyed in the each of the chapters of the thesis:
Chapter 1 reviews literature pertinent to the factors involved in the internal
convection of oxygen (including blood 0 2 carrying capacity and blood flow), as well as
details of experimental evidence for, and against, the Hctqt hypothesis.
Chapter 2 summarizes, and modifies, the interpretation of the results of my
previously published study (see Appendix I), which established that Hct is not related to
CTcrit in a simple manner (within a normal Hct range), and suggested that V 02rnax, rather
than Ucrit, may be a more appropriate measure of exercise performance in fish. In
addition, this study described some of the causes of haemoconcentration observed during
aerobic exercise in freshwater rainbow trout and the possible benefits of the spleen
transhsion, including the maintenance of Cao2, when Pag2 is decreased at Ucrit. This
chapter points to the possibility that Hct benefits functions other than T o 2 in rainbow
trout.
Chapter 3 describes the results of experiments which were performed explicitly to
test the Hctopt hypothesis in rainbow trout. Hct was adjusted over an extreme range of
blood viscosity values, the fish were subsequently challenged to swim to Ucrit, and Qmax
and Ozmax were measured. This chapter also examines the manner in which Hct ([Hb])
Interacts with other cardiovascular and respiratory parameters in determining Qmax,
C',rit, and V 02rnax. In addition, it describes what constitutes normocythemia for rainbow

trout, and as well proposes factors which may play a role in regulating Hct, and thus in
determining upper and lower limits for normocythemia in rainbow trout.
Chapter 4 examines the effects of aerobic exercise training on Hct ([Hb]) in
another salmonid species, chinook salmon, and determines which other cardiovascular
structures and functions may be altered in response to exercise training in this species. In
addition, it determines if any of these structural and functional changes produce changes
in Ucrit and V 02max, and it identifies factors which may determine upper limits for Hct
in salmonids.
Chapter 5 summarizes the major findings of the thesis and relates them to the role
of Hct in To2 and swimming in salmonids.
Appendixes 1 - 4 contain data collected during the research for the thesis, but
peripheral to the major topic.

CHAPTER 1. Literature Review
Internal Convection of Oxygen
Blood oxygen carrying capacity
The solubility of 0 2 in water-based plasma is low, and so for all vertebrates, the
0 2 carrying capacity of blood is increased considerably (up to 20 times) by the reversible
binding of 0 2 to Hb, a respiratory pigment molecule (Weber and Jensen, 1988). It is
estimated that for most teleosts, less than 5% of the 0 2 taken up across the gills is
physically dissolved in solution in the plasma of blood, the remainder being bound to Hb
molecules in erythrocytes (Perry and McDonald, 1993). Under resting, normoxic
conditions for most teleost species, arterial blood is at least 90% saturated with 0 2 (Pen7
and Reid, 1992). Therefore, the oxygen carrying capacity of arterial blood is essentially
linearly related to [Hb] and Hct.
The binding of O2 to haemoglobin
The teleost Hb molecule is composed of four protein units coupled with an iron-
containing metalloporphyrin or heme group (the site of the reversible complexing of 0 2 )
(Burggren et al., 1991). The number of binding sites associated with 0 2 depends on the
mbient partial pressure of 0 2 (Po2). A number of ligands, other than 02, interact with
the Hb molecule to modulate Hb-02 affinity and these interactions are sensitive to
ph~siological and environmental changes; i.e., hydrogen ions (H') and (or) C02, as well
as organophosphates (nucleotide triphosphates, NTP) bind to the subunits, and in so
doing alter the conformation of the molecule and depress the Hb-02 affinity.
Several adaptations have evolved to reduce the potentially negative effects of
these ligands on Cao2. For example, both strenuous activity and exposure to hypoxic
environments result in blood hypoxaemia, and a concommitant blood acidosis, which

may reduce Cag2 and thus To2. However, salmonid erythrocytes minimize the potential
reduction in To2 by uncoupling intracellular erythrocyte pH (pHi) from extracellular
plasma pH (pH,) (Borgese et al., 1987). This response involves adrenergically-mediated
Na+IHf counter-transport across the erythrocyte membrane, with Na' accumulating inside
the cell in exchange for the efflux of H+, resulting in an alkalinization of the cell
cytoplasm and protection of the 0 2 binding potential of Hb (Borgese et al., 1987). A
significant cellular swelling results from the passive influx of water which is coupled to
the influx of Na+ (Chiocchia and Motais, 1989). A consequence of this cellular swelling
is that Hct can change without changing Cag2, although an associated dilution of [NTP]
may increase Cag2.
Cag2 is not only determined by the 0 2 binding properties of the Hb molecule, but
also by the [Hb] of the blood. It is known that [Hb] may increase in response to
situations of chronic 0 2 shortage; e.g., [Hb] increases occur with hypoxia exposure in
mammals (Schmidt et al., 1991; Klausen et al., 1993), and with long term aerobic
exercise-training in teleosts (Hochachka, 1961; Farlinger and Bearnish, 1978; Zbanyszek
and Smith. 1984; Thorarensen et al., 1993). However, since Hb is always packaged in
erythrocytes, elevated Hb levels must be associated with either elevated Hct values, or
elevated mean cell [Hb] (MCHC).
Haematocrit
Haematocrit is a simple, indirect measure of [Hb] and C w 2 . Many Hct
measurements have been made in fish. Nevertheless, the values reported for teleost Hct
appear to be highly variable and frequently there is a disparity in the Hct values quoted
from different studies with the same species; e.g., values ranging from 17 to 44% have
been reported for rainbow trout (Wells and Weber, 1991). To explain interspecific
variability, there have been attempts to link Hct values to athletic ability and aerobic

scope in mammals (Karas et al., 1987), and in fish (Fange, 1992; Satchell, 1991, Fanell,
1991a). For example, in fishes, it appears that the most active species have higher Hct
values (e.g., 53%, tuna (Thunnus rhynnus); 52.5%, mackerel (Auxis rochei), and 43%,
blue marlin (Makaira nigricans), compared with values for more sedentary species (e.g.,
8.5%, hagfish (Eptatrerus cirrhatus)) (Fange, 1992; Satchell, 199 1). However, in
contrast to the Hct values reported above for tuna, Brill and Bushnell (1991) and Brill and
Jones (1994) have reported an Hct range of 27 - 35% for the same species when resting
and cannulated. This again points to the problem of obtaining credible resting Hct values
for normocythemia in fish.
Part of the problem associated with the intraspecific variability for Hct values, is
the fact that these values can change acutely due to erythrocyte swelling, spleen
transfusion, and (or) fluid shifts. In fish, fluid shifts may result from movements of
plasma between primary and secondary circulations (plasma skimming), fluid shifts
between intra- and extra-vascular compartments, movements of water between
intracellular and extracellular compartments, or from uptake or loss of water across the
gills or intestine into or out of the plasma. Many of these events take place
simultaneously when fish are stressed.
Hct has been observed to increase in freshwater rainbow trout (Thomas er a/.,
1987; Pearson and Stevens, 1991 a; Gallaugher ef al., 1992; Nielsen and Lykkeboe, 1992)
and in seawater yellowtails (Seriola quinqueradiata) (Yamamoto er al., 1980) during
strenuous aerobic exercise. Other conditions such as exposure to anaesthetic, acute
hypoxia and air exposure and (or) netting are also known to elicit increases in Hct (Wells
and Weber, 1991). Consequently, if any of these latter conditions precedes a study of
exercise performance in fish, there may not be sufficient time for recovery to normal

"resting" Hct (Hct,) values and erroneous conclusions may be reached with regard to
what constitutes nonnocythemia for a particular species.
References to measured Hct values do not always report on the conditions under
which blood is sampled, and therefore may not truly reflect Hct, values. One major
source of the intraspecific variability reported for Hct values in salmonid species is the
method used to sample blood. For example, sampling via "grab and stab" methods such
as caudal puncture, as opposed to sampling via cannulation, is known to be associated
with stress and the associated release of catecholamines in fish (Mazeaud and Mazeaud,
198 1 ; Wells and Weber, 1991). Catecholamines stimulate both contraction of the spleen
(Perry and Kinkead, 1989; Kita and Itazawa, 1989), and erythrocyte swelling (Nikinmaa
and Huestis, 1984) in salmonids. Therefore, unusually high values observed for Hct may
be due to a stressful method of blood sampling, rather than due to physiological
perturbation or interspecific differences (Wells and Weber, 1991).
Even though arterial cannulations offer a non-stressful means of sampling blood,
there are two additional problems which may come into play; (a) repeated blood
sampling, and (b) blood loss from injured vessels. Hct values are often reported after
sequential blood sampling and (or) extensive surgery. Both of these conditions ~ o u l d
tend to reduce normal Hct. Given the great range in Hct values reported for rainbow trout
(i.e., 32% to 44% for blood sampled via acute venesections, 17% to 30% for blood
sampled via cannula; Wells and Weber,l991), it is not possible at this time to draw any
firm conclusions with regard to how well-regulated Hct is, or in fact, how significant a
factor Hct is in determining Vg,,, and maximum exercise performance. Since the
32% to 44% range is likely high, and since the 17% to 30% range may be low, it could be
concluded that normal Hct for rainbow trout is around 30%.

The HctVt hypothesis offers an explanation for what sets Hct level. However, the
observations of elevated Hct values in response to chronic exposure to hypoxia and
possibly exercise-training, and of very significant acute increases in Hct during strenuous
exercise due to spleen transfusion (see below) and other causes of haemoconcentration,
strongly argue against a single fixed value for Hct.
Erythropoiesis
In mammals, the long-term regulation of Hct involves the hormone erythropoietin
(Epo), which itself is regulated by the O2 concentration of the blood via a typical negative
feedback loop (Bauer and Kurtz, 1989). The kidney is thought to be the location of both
the "oxygen sensor" and the site of Epo production (Bauer and Kurtz, 1989). Hypobaric
hypoxia, tissue hypoxaemia (e.g., anaemia), reduced blood flow and reduced Hb-02
affinity, and perhaps endurance training (Schmidt et al., 1991; Klausen et al., 1993) have
all been shown to stimulate Epo production in mammals.
The initial stages of erythropoiesis in teleost fish take place in the head kidney
and involve the production of stem cells and their differentiation to form erythroblasts.
Further differentiation of the erythroblasts and the synthesis of haemoglobin takes place
in the circulating blood under the influence of Epo (Fange, 1992). There is evidence that
erythropoiesis is stimulated in response to hypoxia exposure and anaemia in goldfish
(Carassius auratus), pinfish (Lagodon rhomboides) and rainbow trout (Cameron and
Wohlschlag, 1969, Tun and Houston, 1986; Murad et al., 1990; Houston and Murad,
1992), but the changes in Hct are inconsistent and when they occur they are not profound.
In addition, there have been attempts to link erythropoiesis to ambient temperature in
fish, but again inconsistent results emerge (Murad et al., 1990; Houston and Murad,
1992). Photoperiod has also been implicated as a stimulus for erythropoiesis in rainbow
trout (Tun and Houston, 1986). Finally, there is evidence that erythropoiesis may be
stimulated in response to aerobic exercise-training in teleost fish. Again the results are
equivocal; Davie et al., (1986) observed no change in Hct or [Hb] in adult rainbow trout,
while positive responses were observed by Hochachka (1961) in rainbow trout,
Zbanyszek and Smith (1984) in coho salmon (Oncorhynchus kisutch), Farlinger and
Beamish (1978) in largemouth bass (Micropterus salmoides), and i'horarensen et al.
(1993) in chinook salmon.
The possibility exists that there may be a ceiling on potential increases in Hct
([Hb]) due to the viscosity constraints of Hct on cardiac work, as suggested by the Hctopt
hypothesis, but it is not clear how this works as a negative feedback on [Epo].
The role of the spleen
The short-term regulation of Hct involves the spleen, a known reservoir of red
blood cells in both mammals and fish. There is considerable knowledge with respect to
spleen structure and cellular content but the mechanism whereby the spleen regulates Hct
is not well understood in any vertebrate group.
The general view is that the erythrocyte reservoir of the spleen could, upon
transfusion into the general circulation, enhance Cao2 and thus maintain, or even
augment, To2 during times of reduced O2 supplies (such as when tissue ckmands for 0 2
increase significantly as during strenuous aerobic exercise, or during diving apnea).
Evidence in support of this view is contradictory and indirect.
In the case of the racehorse, compared with Hct, values, there is a very significant
increase in Hct during aerobic exercise (i.e., from 40% to 70% (Fedde et al., 1993; Fed&
and Wood, 1993; from 37% to 55%, McKeever et al., 1993 a,b), and because it is
Prevented by splenectomy (Persson and Bergsten, 1973, 1975; Persson et al., 1973). this
increase is ascribed to a transfusion of cells from the spleen. With the Hctopt in mind.
One would predict that such significant increases in Hct would impair cardiac function.

Contrary to this prediction, however, is the evidence that the spleen transfusion may
actually facilitiate cardiac function in exercising horses. Splenectomized horses have
both lower Q and stroke volume values at maximal exercise compared with intact horses
(Persson and Bergsten, 1975; McKeever et al., 1993b). Thus, the considerable increases
in Hct (and q) observed in the horse during aerobic exercise clearly do not compromise
Qmax or To2.
In sharp contrast to the horse, there is no evidence of a spleen transfusion at either
submaximal or maximal aerobic exercise, in a similarly athletic mammal, the camel
(Camelus dromedarius) (Saltin and Rose, 1994). Moreover, although the spleen
transfusion apparently takes place during aerobic exercise in humans, the magnitude of
the resulting increase in Hct is small (i,e., <lo%) (Flarnrn et al., 1990; Allsop et al., 1992;
h u b et al., 1993). However, this increase has been positively correlated with increases
in V Ozmax (Flarnrn et al., 199O), indicating that the spleen transfusion benefits To2. This
observation is not supported by observatons from experiments with exercising dogs,
where maximal aerobic exercise performance was identical in splenectomized and intact
animals despite a higher Hct in the latter (Vatner et al., 1974).
The fish spleen is also known as a reservoir of red blood cells as evidenced by the
Hct values of 80 - 90% reported for the rainbow trout spleen (Kita and Itazawa, 1989;
Wells and Weber, 1990). Estimates of 20 - 25% have been proposed for the increase in
the volume of circulating red blood cells associated with maximum spleen transfusion
during stressful conditions (e.g., exhaustive exercise, air exposure), and adrenaline
infusion in rainbow trout (Kita and Itazawa, 1989; Wells & Weber, 1989; Pearson and
Stevens, 1991a). Even larger increases in Hct have been attributed to the release of cells
from the spleen of the Antarctic red-blooded nototheniid, Pagothenia borchgrevinki
(Franklin et al., 1993). Most of the 136% increase in Hct in this species at maximal

prolonged swimming velocities was attributed to an exercise-induced spleen transfusion
(Hct, = 15%, Hct at maximal swimming, = 33%).
Therefore, similar to horses, the teleost spleen transfbsion evidently has the
potential to increase blood O2 carrying capacity significantly, despite the probable
increase in rl and its detrimental effects on cardiac work. Although the general
conclusion is that the transfusion benefits the fish by maintaining or increasing TO:! (see
Wood and Perry, 1985; Perry and Wood, 1989; Wood, 1991; Perry and McDonald,
there are few studies which provide direct evidence of this benefit. Perry and
Kinkad (1989) demonstrated that the spleen transfusion is solely responsible for the
increase in Cag2 observed during exposure to hypercapnia in intact rainbow trout as they
observed a decrease in CQ in splenectomized fish. Franklin er a/. (1993) reported
significantly poorer swimming performance in spleen-ligated, compared with sham-
operated, P. borchgrevinki. Similarly, Pearson and Stevens (1991b) reported decreased
k r i t values for splenectomized, compared with sham-operated, rainbow trout. However,
this latter observation was not substantiated by Gallaugher et al. (1992) (see Chapter 2 ,
Appendix 1). On the other hand, the possibility that increased Hct (generated by a
transfbsion of erythrocytes from the spleen) impedes cardiac work in rainbow trout, as
suggested by the Hctopt hypothesis, has not been ruled out.
Clearly the spleen transfusion has the potential to alter Hct significantly, and
therefore 11. Moreover, there is enough evidence from a variety of both mammalian and
fish studies to indicate that the release of cells from the spleen is a regular occurrence. In
some cases the altered Hct is close to double the normal Hct, and yet there is no evidence
that cardiac fbnction, or exercise performance, is compromised, thus indirectly arguing
against the Hctopt hypothesis.

Blood Flow
Cardiac output infish
The heart is a muscular pump which develops pressure to overcome the resistance
of the blood vessels and generates a flow of blood through the vasculature to the tissues.
The total flow of blood from the heart, referred to as Q, is the product of stroke volume
(SVH) and heart rate (fH); i.e., Q = (SVH . fH).
There is considerable inter- and intra-specific variability in the values reported for
resting Q (Qrest). This can be attributed to variability in the resting state of the animal,
temperature, true interspecific differences, and (or) methodological differences in
measurements (Farrell and Jones, 1992).
Any condition which alters the control mechanisms of the heart may affect f H and
(or) SVH, and has the potential to alter Q. f H is primarily regulated by adrenergic and
(or) cholinergic controls, while control of SVH is volume-modulated, with the force of
contraction being altered intrinsically through the Frank-Starling mechanism and
modulated by neurohormonal factors (Farrell, 1991~). The same physiological
perturbations which produce changes in Hct may also significantly alter Q in fish (e.g.
temperature, elevated [catecholamines] due to "stress", changes in blood volume,
exhaustive exercise, exposure to hypoxia, and acidosis; Farrell and Jones. 1992). Reports
of Qrest frequently fail to mention the animal's physiological state when measurements
are made. Thus, it is particularly difficult to determine what constitutes a true erest value.
Changes in ambient temperature significantly affect Qrest in fish and, although
the effects are species-dependent, there appears to be a universal reduction in Q with
temperature reduction (Barren et a[., 1987; Farrell and Jones, 1992). Acute exposure to
low temperatures is known to have negative chronotropic effects, but cold temperature-
acclimation produces a compensatory increase in f (Graham and Farrell, 1989). Cardiac

muscle contractility also decreases with reductions in temperature (Ask et al., 1981).
However, in rainbow trout cold temperature-acclimation effects, such as ventricular
hypertrophy (Graham and Farrell, 1990), and increased adrenergic sensitivity (Keen el
al., 1993), can partially compensate for this reduction in cardiac contractility .
The relatively large size of the haemoglobin-free Antarctic fish ventricles may be
an extreme example of thermal adaptation (Farrell and Jones, 1992). In these fish, the
ventricular hypertrophy is associated with extremely high SVH (e.g., maximum SVH for
most teleosts ranges from 0.7 - 1.4 m ~ - k ~ - l body mass, but for Antarctic fishes it is 2 to
10 mL-kg-1 body mass), and Q values are among the highest known in fish (e.g., 60 - 120
mL.min-'.kg-1 for (Irest in Chaenocephalus aceratus) (Farrell and Jones, 1992) . This is
possible because of an overall reduction in Rs brought about by having wide-bore blood
vessels (Bushnell et al., 1992). The high Q is thought to compensate for the low Ca02 in
the blood due to the lack of Hb (which also results in very low q at 0 OC).
Q increases significantly with aerobic exercise in all teleosts. It is generally
thought that the Qmax reached during exercise is probably the maximum Q possible for
the particular species (Farrell and Jones, 1992), and thus it is possible that Qmax may be
limiting to maximal exercise performance in fish, particularly if Qmax coincides with
elevated q , due to an increase in Hct.
There are both anatomical and physiological limits to the increase in Q. A
physiological limit, relevant to the Hctopf hypothesis, is the capacity of the heart for
homeometric regulation. In general, fish hearts can maintain SVH over a broad range of
arterial blood pressures (homeometric regulation), and this only breaks down when
Pressures exceed an upper limit. There are significant interspecific differences in the
upper limit for pressure development in fish hearts and these differences are related to
for activity; e.g, , the sluggish hagfish has the lowest, and the athletic tuna the

highest, capacity for pressure development (Farrell, 1991 a, b). For example, rainbow
trout hearts can maintain SVH for Pv, values up to 60 rnm Hg, compared with only 15
mm Hg for hagfish hearts (Farrell and Jones, 1992). Since blood pressure must increase
concommitantly with increases in Q, in order to overcome vascular resistance, it is
possible that these upper limits for homeornetric regulation may be involved in
determining the upper limit for Hct in a particular species, if the concept of an Hctopt
applies (Farrell, 1991a). Elevated Hct levels have the potential to interfere with the
maintenance of SVH because the viscosity-induced increases in resistance require higher
pressure development for blood flow.
There are indications that homeometric regulation breaks down in the Antarctic
haemoglobin-free icefish heart. Tota er al. (1991a) has observed a maximum pressure
tolerance of only 30 mmHg in Chionodraco hamarus hearts, in vitro. An increase in
vascular resistance arising from the presence of erythrocytes would not be well-tolerated
by a heart with such poor pressure development capacity. Moreover, since blood pressure
increases during exercise, the poor homeometric regulation of the heart may limit
exercise capability in this group of fish (Bushnell er al., 1992).
Blood Flow Distribution
The entire cardiac output goes to the gills and from there goes to the systemic
circulation. A small fraction of the systemic blood flow goes to the secondary circulation
of the gills and to the head via the carotid arteries, but the major fraction goes to the trunk
and visceral organs via the dorsal aorta (Farrell, 1993). All of these parallel circuits
cannot be fully perfused at the same time, so the portion of blood flowing to any
particular organ will depend on the physiological state of the animal. Since arterial
Pressures are essentially the same for all components of the systemic circuit, and since all
components of the circuit are not fully perfused, there must be regional tonic

vasoconstriction to regulate blood flow distribution (Farrell, 199 lc). Moreover, because
blood volume is finite, there must be a redistribution of flow to meet the change in
demand for To;! which accompanies changes in metabolism, such as occur during
exercise and feeding.
Theoretically the flow of blood in vessels is proportional to the pressure
difference along the length of the vessel (AP) and the radius of the vessel to the fourth
power (9), and inversely proportional to the vessel length (L) and the viscosity of the
fluid (q), as described by Poisueille's Equation (Bushnell et al., 1992),
However, this equation describes the relationship between flow, pressure, and resistance,
in tubes which are not compliant or branching, and for fluid which flows continuously
homogeneously. The variable nature of blood vessel geometry, and the potential for
changes in dimensions in response to a variety of physiological conditions, in addition to
the pulsatile nature of blood flow and the heterogeneous nature of blood, makes this
equation only applicable in the broadest sense.
Blood viscosity
Blood flow through arteries and arterioles is, for the most part, laminar, so that
resistance to flow is due to frictional forces between adjacent layers, rather than between
blood and the vessel wall. Viscosity is a measure of the resistance of the adjacent layers
to slide past each other in the presence of a shearing force which causes the fluid to
deform (Burton, 1972). It is possible to obtain accurate in vitro measurements, and in
viva estimates and (or) measurements of blood viscosity.

The relative viscosity of blood (as measured in vitro) is primarily dependent on
Hct, increasing exponentially at Hct values above 40% (Rand et al., 1964; Crowell and
Smith, 1967; Stone et al., 1968, Snyder, 1971; Chien, 1975; Hillman et al., 1985; Graham
and Fletcher, 1983; Wells and Weber, 1991). The increase in q at higher Hct values
brings about an increase in resistance to blood flow and therefore, a greater blood
pressure is required to deliver an equivalent Q (i.e., cardiac work must increase for the
same flow rate). If blood pressure is raised beyond the capabilities for homeometric
regulation, Q,, will decrease in a compensating manner. If Qmax is reached at
maximum exercise levels in normocythemic vertebrates, the benefits to To2 of increased
Cao2 due to polycythemia may be offset by a reduction in Qmax, and thus exercise
performance and V o2 may be compromised (see Figure I). This is the principle
underlying the Hctqt hypothesis (Richardson and Guyton. 1959; Guyton and Richardson,
1961 ; Crowell and Smith, 1967).
Factors which determine blood viscosity
For homogeneous fluids (Newtonian fluids) such as water and saline, q is
independent of the difference in flow velocity of the different layers (i.e., shear rate). In
contrast, whole blood and separated plasma are non-Newtonian fluids due to their
heterogeneous nature, and their viscosity may be dependent on shear rate (Burton, 1972).
The dependence of q on shear rate stems from several factors. Most important is the
deformable nature of erythrocytes.
Cell deformability is a combined function of the elasticity of the cell membrane,
the internal fluid viscosity of the cell, and the cell geometry (including surface area to
volume ratio) (Chien, 1975). In addition to reducing the bulk viscosity of blood flowing
in large vessels, this property is necessary to allow normal erythrocytes to pass through
blood capillaries, where the vessel diameter is smaller than that of the cells (Chien, 1975;
Nash and Egginton, 1993). Characteristically. there is a high degree of both inter- and
intra-specific variability for a number of the properties of vertebrate red blood cells (e.g.,
cell size, age, and shape; MCHC and mean cell volume; and the presence or absence of a
nucleus). Some of these properties have been implicated as contributing to differences in
cell deformability and therefore in blood viscosity. However, the results are generally
inconclusive and controversial (e.g., see Stone et al., 1968; Chien er al., 1971; Hughes el
a/., 1982; Baldwin and Wells, 1990; Wells and Baldwin, 1990). Increases in Hct may
cause increased cell deformability, and this presumably offsets some of the erythrocyte
concentration-linked increases in q (Chien, 1975). Recent evidence suggests that a wide
range of cell deformability may be tolerated (in terms of the microcirculation) and thus
alterations in this characteristic of red cells may be less critical than once thought (Nash
and Egginton, 1993).
The shear-rate dependence of q also results from the tendency of red blood cells
to interact with large plasma proteins such as the macroglobulins and fibrinogen. These
molecules are adsorbed to the surface of the erythrocyte membrane, thus bridging the
blood cells, which aggregate (reversibly) to form rouleaux (Chien et al., 1967; Schmidt-
Schombein et al., 1969).
Blood viscosity is known to increase with decreasing shear rate (Schmidt-
Schombein et al., 1969). This is because cell deformability decreases, and cell
aggregation increases, at low shear rates (Chien, 1975). Thus, the effect of q on
resistance to flow will be greatest in vessels where the flow is slow; e.g., venules (Chien
et 1971), and perhaps the central veins in fish (Satchell, 1991). There is very little
information on values for shear rates in fish blood vessels. Estimates of shear rates of 60
s-' for the afferent branchial artery are much lower than the 2500 s-1 estimated for gill
in lingcod, Ophidon elongatus (Farrell et al., 1980; Graham and Fletcher.

1983). Shear rates in the muscle capillaries may be equally as high as those of the gill
capillaries, and the high density capillarization typical of fish oxidative muscle may be an
adaptation to compensate for this (Nash and Egginton, 1993). Therefore, cell aggregation
may not be a significant contributor to q in the microcirculation, as transit times may be
too short for rouleaux to form (Pries et al., 1992).
Plasma viscosity may also contribute to blood viscosity. Plasma viscosity is a
function of protein concentration and, in particular the concentration of the large
asymmetrical protein molecules (e.g., fibrinogen) (Chien, 1975). The relative importance
of plasma viscosity to overall blood viscosity varies considerably between species. For
example, plasma viscosity is independent of shear rate, and is very low (2.5 - 4.5 cP) in
both rainbow trout blood (Fletcher and Haedrich, 1987) and in the blood of the Antarctic
haemoglobin-free species, C. aceratus. In contrast, the plasma viscosity of winter
f h n d e r (Pseudopleuronectes americanus) blood is high (ranging from - 20 cP to - 40
cP, depending on temperature), accounting for about 50% of the whole blood viscosity at
normal Hct values (20%), and is highly shear-rate dependent (Graham and Fletcher,
1983).
Temperature eflects on blood viscosity
Both plasma viscosity and blood viscosity may be greatly influenced by temperature.
Water viscosity alone increases by 120% as temperature decreases from 37 "C to 2 'C
(Shorrock and Hillman, 1969). Blood viscosity may be even more temperature-
dependent than water viscosity, owing to temperature-induced changes in erythrocyte
deformability and aggregation properties. For example, low temperatures can decrease
cell deformability and increase cell aggregation in mammals (Neuhaum et al., 1987) and
fish (Hughes et a/., 1982; Kikuchi el al., 1982), and decrease membrane elasticity in
mammalian erythrocytes (Hoclunuth et al., 1979).

The best example of the effects of temperature-induced increases in q , lies with
the Antarctic icefish. For those species studied to date, either the complete absence of
cells, or very low Hct values, appears to be adaptive for habitation at extremely low
ambient temperatures; i.e., -1.8 - 2 "C (MacDonald et al., 1987; Wells et a/., 1990). In the
case of family Channichthyidae (sub-order, Notothenioidei) (e.g., C. aceratus), blood is
virtually free of erythrocytes, and q (i.e., 3.6 cP at 225 s-1 at -1.8 O C ; MacDonald and
Wells, 1991) is essentially the same as plasma viscosity. The absence of cells in the
blood is likely an adaptation to reduce temperature-related viscosity effects on blood
pressure, particularly in view of the poor homeometric capabilities of the heart in these
species. The blood viscosity of the red-blooded nototheniid (family Nototheniidae, sub-
order Notothenioidei), Pagothenia bernachii, (Hct = 8%) is also low; i.e., <5 cP at 0 O C
and shear rate 22.5 s-1. However, if the Hct is elevated in this species (e.g., due to stress-
induced spleen transfusion and cellular swelling), q increases exponentially, and this
effect is exacerbated at the lowest temperatures ; i.e., 11.2 cP at 0 O C and shear rate 22.5 s-
(Hct = 15.4%) (Wells et al., 1990).
Exercise-induced changes in blood viscosity
It has long been known from mammalian studies that in vivo measurements of rl
are significantly lower than would be predicted from in vitro measurements of rl
(Whittaker and Winton, 1933; Levy and Share, 1953; Djojosugito et a/., 1970;
Gustafsson et al., 1980; Celsing et al., 1987; Fedde el al., 1993). This difft~ence
probably reflects the Fahraeus-Lindqvist effect in small vessels (Doyle el a).. 1981;
Sarelius, 1989), as well as the compliant and dynamic nature of the arterial vasculature.
Moreover, there is also evidence that exercise induces changes in q, in vivo, in
mammals, and this may, in part, be explained by the vasomotor changes that occur during
For example, Lindenfeld el al. (1985) observed lower R, at all Hct levels (30 -

65%) in exercising, compared with resting dogs, and Gustafsson et al. (1980) observed
that r\ was significantly elevated when vasomotor activity was prevented in skeletal
muscle in vivo. These observations were supported by the finding that blood viscosity
measured in vivo was significantly lower in the circulation of working, compared with
non-working, skeletal muscle (Gustafsson et al., 1980). Combined, the above
observations suggest that the exponential increase in q associated with high Hct values,
may not necessarily impair 0 2 delivery to the musculature.
Evidence of exercise-induced alterations in q in fish species is limited and
indirect. Kikuchi et al. (1985) demonstrated a tendency for increased deformability in
rainbow trout erythrocytes after moderate aerobic exercise. Chiocchia and Motais (1 989)
showed that catecholamine-stimulation increases rainbow trout red cell defonnability.
Circulating catecholamine levels are known to be significantly elevated in association
with burst swimming and at Ucrit, but not during aerobic swimming, in rainbow trout
(Ristori and Laurent., 1985; Axelsson and Nilsson, 1986; Primmett et al., 1986; Hughes
ef a/. , 1988; Gallaugher et al., 1992).
The many examples described above suggest that q may not represent the
constraining force on Q that is assumed by the Hctopt hypothesis.
Tests of the HctoPl Hypothesis
Predicting Hctqt by calculating the oxygen transport capacity
Theoretical values for HctOpl can be obtained by using in vitro viscosity
measurements and calculated blood o2 carrying capacity values to empirically derive a
value for To2 as follows: oxygen transport capacity = blood 0 2 carrying capacity J q ,
where blood 0 2 carrying capacity is a calculated value (i.e., [Hb] x 0 2 binding capacity
of Hb (assumed to be approximately 1.3 m ~ O ~ . g - ' ) ) and q is the in vitro viscosity

measurement for that [Hb] (Crowell and Smith, 1967; Hedrick et al.,
Forster, 1989; Wells and Weber, 1991).
Hedrick et al. (1986) used this method to predict Hctopt values
1986; Wells and
for the northern
elephant seal (Mirounga angustirostris) and the rabbit (Oryctolagus cuniculus). Despite
the higher q for the seal, the predicted Hctopr of 35 - 40% was the same for both species.
thus matching Hct, (35%) for the rabbit, but being much lower than Hct, (65%) for the
seal. Wickam et al. (1989), however, demonstrated that q for the northem elephant seal
is significantly lower than that of the domestic pig (Sus domesticus) (Hctr = 28%) at the
lowest shear rates (1 1 s-I). (Hedrick et al. (1986) measured q only at very high shear
rates; i.e., 450 s -1). Wickam et al. (1989) view their findings as being evidence of an
adaptation to the high Hct, in the seal, and point to problems with interpretations that
may arise from the use of empirically derived values for Hctopt, particularly since these
values ignore the possiblity of compensatory adjustments for q, in vivo.
Wells and coworkers (Wells and Baldwin, 1990; Baldwin and Wells, 1990; Wells
and Weber, 1991) have also used this method to test for Hctopt in a number of fish
species, including rainbow trout. In all cases there are disparities between the theoretical
Hctopr and the measured Hct,. The predicted Hctopt for rainbow trout (30%) was
significantly higher than the actual Hct, of cannulated (20%) or acutely venesectioned
(25%) fish. However, Hct, measurements were highly variable, perhaps due to surgery or
"stress" (Wells and Weber, 1991). Similarly, the Hctopl predicted for five tropical reef
teleost species was 30% and this did not match any of the measured Hct, values (ranging
from 1840%) for any of these species (Wells and Baldwin, 1990). Brill and Jones (1994)
also used this method to predict an Hctopr for yellowfin tuna, and in this case they
estimated C a q based on Hct, [Hb], and MCHC. They predicted a broad HctOpr for this
beginning at around 30%, but did not define an upper limit for the plateau.

Therefore, the equivocal results of the above studies do not verify the Hctopt
hypothesis (more recently elevated to theory status; Hillman et al., 1985; Withers et al.,
1991 ; Wells and Weber, 1991). Most importantly, this method of determining Hctopt
does not consider the possibility of compensatory adjustments for elevated blood
viscosity, in vivo.
Using extreme Hct values to test Hctopt in vivo
Another approach used for examining the validity of the Hctopt hypothesis is to
study the effects of extreme ranges of Hct on exercise performance and To2.
Anaemia
According to the HctOpr hypothesis, Hct values which are less than Hctopt should
be associated with reductions in ToZrnax and V O ~ ~ ~ , due to the inability of Q to
increase beyond Q,, and compensate for the reduction in C w 2 . Thus, since exercise
performance is dependent on the convection of O2 to the muscle tissues, reductions in
Cag2 should llltimately limit exercise performance.
Anaemia may occur naturally in wild populations of fish, due to parasitic
infections (particularly of the gills), insufficient dietary iron for the synthesis of heme,
and a number of other causes (see Guyton, 1976, Wood et al., 1982). When anaemia is
induced experimentally, resting fish compensate for the reduction in the A-VO?
difference via increases in Q and ventilation volume, and reductions in total peripheral
resistance (TPR), thus maintaining V o2 (Cameron and Wohlschalg, 1969; Cameron and
Davis, 1970; Holeton, 1971; Wood et a/., 1979; Wood and Shelton, 1980; Smith and
Jones, 1982; Wood et al., 1982; Vorger and Ristori, 1985). The "anaemic" Antarctic
haemoglobin-free icefish obtain all their 0 2 requirements from the 0 2 in physical
solution in plasma (MacDonald et al., 1987). They compensate for the reduced Cag2 (0.7

vol. %) by increasing stores of 0 2 via a large blood volume, increasing 0 2 delivery via a
high Q, and reducing peripheral resistance by increasing capillary diameter (Hemmiwen
and Douglas, 1970, 1972; MacDonald et al., 1987; Egginton and Rankin, 199 1).
Only two studies have examined the effect of anaemia on aerobic exercise
performance in fish (Jones, 1971; Brauner et al., 1993). Ucrit was reduced when Hct
(Jones, 1971) and [Hb] (Brauner et al., 1993) was decreased by approximately 50%.
However, neither of these studies measured V O ~ ~ ~ ~ , nor did they measure any of the
other cardiovascular parameters that affect To2. However, anaemia has been observed to
significantly reduce V 02max in another anaemic poikilothem, Rana pipiens (Hillman,
1980).
There have been a number of studies which have examined the effects of anaemia
on cardiovascular function in mammals, both at rest and at V 0 - 2 ~ ~ ~ . Early work with
aaesthetized, resting dogs (Canis domesticus), demonstrated that both Q and venous
return increase, and TPR decreases, significantly with anaemia. However, the increase in
blood flow does not offset the reduced Cao2 at lower than Hct0p values, so To2 is less
than optimum in anaemic animals (Richardson and Guyton, 1959; Guyton and
Richardson, 1961; Murray et al., 1962; Fowler and Holmes, 1975; Fan et al., 1980).
The relevance of the above observations to conscious and exercising animals, is
open to question (Weisse et al., 1964; Manders and Vatner, 1976; Gustafsson et al., 1980;
Lindenfeld et al., 1985; Schumacker et al., 1985). For example, increased Q, and
reduced TPR, were observed in conscious, anaemic dogs at rest (Vatner et d . , 1972;
Horstman el al., 1974; Sarelius & Sinclair, 1981), but in contrast to the results from the
work with anaesthetized animals, these changes compensated for the reduction in C w 2 ,
a d the convection requirement at V ozrest was maintained. Moreover, during maximal
exercise, there was no change in v 02max, even at severe levels of anaemia ([Hb] < 75%

of normal). This was possible because, for this species, Qmax is greater in anaemic,
compared with normocythemic, animals (Horstman et al., 1974). In addition, the
decrease in TPR exactly matched the decrease in Cag2 (and A-Vo2 difference) (Vatner et
ul.. 1972; Sarelius and Sinclair, 1981). In humans, V O ~ , , , ~ remains unchanged, and
erest increases, in response to anaemia but unlike dogs, Qmax generally remains
unchanged during maximal aerobic exercise. Therefore, both V 02rnax and endurance
performance decrease concomitantly with anaemia-induced reductions in Cag2 and
To2 (Ekblom et al., 1972, 1976; Woodson et al., 1978; Kanstrup & Ekblom, 1982, 1984;
Gledhill, 1985; Celsing et al., 1986). This suggests that [Hb] plays a role in determining
V 02rnax in humans.
The above results in anaemic mammals, amphibians and fish are consistent with
the k t o p t hypothesis. If Cm2 (Hct) is less than optimum, the negative effects of
reductions in To2 are realized as reductions in aerobic exercise performance and this
may, in fact, set the lower limit for normocythemia in these species.
Pdycythemia
According to the Hctopt hypothesis, Hct values which are greater than Hctopt
should compromise To2 via the detrimental effects of viscosity on cardiac work.
Therefore. both V ozrnax and exercise performance would be predicted to decline at Hct
values higher than normocythemia.
There is considerable knowledge with regard to the effects of polycythemia in a
number of mammalian and amphibian species, but there have been no studies in which
~olycythemia has been examined in teleosts.
Evidence in support of the Hctopr hypothesis is provided by two studies of the
effects of polycythemia on To2 and v o2 during activity in amphibians (the toad, Bufo
marinus; Hillman et al., 1985; and, the bullfrog, Rana catesbelana, Withers et al., 1991).

In both cases, Hct, was increased by > 80% by erythrocyte infusion. Hillman et
(1985) observed that measured maximal systemic blood flow rates, Vozma,, and
calculated maximal To2, were all inversely related to 77 (which increased exponentially
in relation to increases in Hct). Using blood flow rate and Hct measurements, Withers et
01. (1991) empirically derived an HctOpr of 41% for the bullfrog, a value much higher
than the measured Hct, of 27%, and the calculated Hctopl of 30%. On the other hand.
there are concerns with regard to the methodology employed in the above experiments, in
that the activity used for this type of exercise was almost certainly fueled by anaerobic
metabolism. Moreover, V 02max was measured during recovery, rather than at maximal
exercise performance, and the q values used to calculate Hctopt were only measured at
the relatively high shear rates of 450 s-I.
There have been numerous studies of the effects of induced polycythemia ("blood
doping") in humans, and the evidence that increased Hct ([Hb]) produces improvement in
both V 0zmax and exercise performance is unequivocal (Pace et al., 1947; Ekblom al.,
1972; Buick et al., 1980; Williams et al., 198 1 ; Thomson et al., 1982; Robertson ef a/.,
1982, 1984; Spriet et al., 1986; Celsing et al., 1987; Brien and Simon, 1987; Berglund
and Hemmingson, 1987; Ekblom and Berglund, 1991 ; Turner et a)., 1993; Jones and
Lindstedt, 1993). On average, a 10% increase in Hct, [Hb] and (or) Cw2 results in about
a 10% increase in V o ~ ~ ~ ~ , and (or) exercise performance. These studies support the
hypothesis that maximal exercise performance is primarily limited by internal 0 2
convection in nonnocythemic humans. On the other hand, there is no evidence of
detrimental effects of the associated increases in on cardiac work in any of these
Studies; e.g., Celsing et al. (1987) observed no differences between the Qmax of humans
at the extremes of the Hct range 38 - 55%, despite an associated 40% increase in
(measured in vitro). Thus, these results contradict the Hctop hypothesis.

Similarly, there is no evidence of reductions in T o 2 in two studies with
polycythemic dogs (Lindenfeld et al., 1985; Schumacker et al., 1985). In both cases,
there was a linear increase in T o 2 during submaximal exercise, in proportion to increases
in Cag2, up to Hct values of 68%, despite a decrease in Q and an increase in R,.
Moreover, Schumacker et al. (1985) observed the same pattern of V Q increases with
submaximal exercise in polycythemic, as was observed in normocythemic, animals.
It is clear that the primary benefit of increased [Hb] is an increase in TO?. It is
also clear that an increase in To2 may effect an increase in V 02rnax However, the
importance of [Hb] in the role of the major determinant of V 02rnax in nonnocythemic
and polycythemic mammals is not clear. For example, despite a constant increase in
F b ] , significant variability is observed between individuals in terms of the magnitude of
the [Hbl-induced increase in V 02rnax (Lindstedt et al., 1988). After analyzing the results
of a number of studies with humans, Jones and Lindstedt (1993) concluded that there
must be a minimal [Hb] present to attain a particular V 02rnax, but above this level [Hbl
does not singularly limit V ozmax. This conclusion is supported by the observation that
Hct-induced increases in VoZrnax are not necessarily equally matched by increases in
T02; e.g., Turner et al., (1993) summarized the findings of a number of different studies
with polycythemic human subjects, and observed that the ratio of A V 02rnax to A To2max
was considerably less than unity (i.e., 0.52 +_ 0.07). Evidence of a diffusion limitation to
'02max in normocythemic mammals, at both the muscle tissue and the lung (Dempsey el
al., 1984; Powers et al., 1989; Roca et al., 1989), may explain the latter observation.
Therefore, it is unlikely that Hct is the sole determinant of Vozrnax, at least in
~olycythernic animals. In fact, the most recent literature in this field supports the concept
of a polyfactorial model in which diffusive and convective processes interact in a

complex manner to determine V OZmax (di Prarnpero and Ferretti, 1990; Wagner, 1993;
Turner et al., 1993; Jones and Lindstedt, 1993).
Benefits of polycythemia, other than increased To2, have been postulated, but
supportive experimental evidence is weak; e.g., there is no conclusive evidence of
differences in WTP], blood [lactate], or pH between polycythemic and nomocythemic
individuals at V 0zmax in any of the above studies.
Finally, based on all of the above evidence in polycythemic mammls, it s m m
safe to conclude that viscosity does not interfere significantly with Q and T o 2 at rest, or
during exercise. Furthermore, since both ToZmax and V Ozmax increase with
polycythemia in mammals, it is evident that Hct is not optimized for maximum To2 and
moreover, none of the various structures involved in T o 2 appear to be singularly limiting
to V 02rnax, except perhaps the lung (Dempsey et al., 1984).
The polycythemia-induced increases in V 02rnax in mammals run contrary to the
principle of symrnorphosis (Weibel and Taylor, 198 1 ; Taylor and Weibel, 198 1 ; Weibel
et d, 1992) and its inherent concept of an Hctopt. This principle suggests that all of the
structures of the mammalian respiratory chain, including Hct ([Hb]), are quantitatively
equally matched to optimize V oZmax, with no single structure (with the exception of the
lung of athletic mammals; Weibel et al., 1992) being present in excess. Accordingly,
each structure should be working at its maximal capacity and equally limiting to
vOzmax. If normal Hct is optimized for V oZmax, then any increases in Hct ([Hb]).
unless matched by equivalent changes in all other structures of the respiratory chain.
would not produce increases in V 02max.
The application of the symmorphosis concept and, in fact, of all optimality
models, to biological systems, has been brought into question (Garland and Huey, 1987;
Lindstedt and Jones, 1987; Dejour, 1990; Dudley and Gans. 1991). One major criticism
of this concept is that it fails to take into account the multifunctional role of the
respiratory system; for example, in addition to functioning in To2, this system plays a
significant role in removal of C02, and in the regulation of pH and osmotic balance of the
blood. Consequently, the structures of the respiratory chain should reflect an
optimization for these combined functions, rather than the single h c t i o n of 0 2 uptake.
(Garland and Huey, 1987; Jones and Lindstedt, 1987; Dudley and Gans, 1991). A f ~ ~ ? h e r
argument against this concept is that it seems unlikely that any system would be designed
for optimal, rather than sufficient capacity, in that the energetic costs associated with this
over-design would be "wasteful" (Garland and Huey, 1987., Lindstedt and Jones, 1987)
and thus may negatively impact the energy budget of the animal and hence be selected
against (see Diamond, 1986).
Summary
In summary, it appears that the elevation of the Hctapl hypothesis to theory status
is premature, as the evidence in support of an Hctopl is equivocal.
The most convincing evidence in support of an HctOpr are the observations of
reduced Q at high Hct (and q) values, and of anaemia-induced reductions in V 0 2 , ~ ~ and
exercise performance. Some of this evidence comes from studies with anaesthetized,
resting animals. However, the application of observations made under these conditions to
the ~h~siological status of conscious, exercising animals is questionable. Where
viscosity-induced reductions in Q have been observed in conscious, exercising animals.
they are in animals such as amphibians, which have hearts with poor homeometric
capacity. These species may be unable to compensate for the increased blood pressure
associated with elevated q . In fact, the adaptive loss of erythrocytes in the haemoglobin-
free Antarctic fishes may also be related to the presence of hearts with poor homeometric
capacity.

Evidence against an Hctopt includes the numerous observations of vasomotor
adjustments which compensate for elevated q, of increased erythrocyte deformability
under conditions where To2 may be limiting, and of exceptional aerobic exercise
performance in athletic mammals, such as horses, where the Hct may be as high as 70%
at V Ozmax. The consistent observations of improved aerobic exercise performance, and
increased vaiues for V ofmax in humans, when polycythemic, also argue against the
concept of an Hctopt and, as well, provide evidence in favour of convective limitations to
V 02rnax in normocythemic animals.
Although an Hctopt has been defined for several species of fish, in no case did the
calculated values match the measured values for Hct. Moreover, these calculated values
for Hctopt completely ignore the capacity of the heart and vasculature to compensate for
changes in q .
I decided to clarify this apparent discrepancy in support of the longstanding
Hctopt hypothesis (theory). If it is correct for rainbow trout, Hctopt would be revealed at
Qmax, V 0zmax and Ucrit, and moreover, it would be lower at colder temperatures owing
to elevated q. In addition, I hypothesized that the detrimental effects of increased q on
cardiac function would limit the potential for aerobic exercise-training to induce increases
in Hct and exercise performance, unless these increases were matched by equivalent
increases in Qmax. Finally, a close relationship would exist between Hct and exercise
perfOmance (i.e., Ucrit and V 0 2 ~ ~ ~ ) .

Chapter 2
Swimming performance and haematological variables in splenectomized rainbow
trout.
Introduction
The HctVt hypothesis does not consider the possibility of the significant increases
in Hct (haemoconcentration) which often accompany strenuous aerobic exercise in
vertebrates. Haemoconcentration is known to occur during strenuous exercise in fishes.
For example, Yamamoto et al. (1980) observed a very significant increase in Hct (from
28% at rest, to 41% at Ucrit) during aerobic swimming in yellowtails. Even greater
increases in Hct, from 15% at rest to 33% at maximum prolonged swimming, have been
reported for P. borchgrevinki (Franklin er al., 1993). Increases in Hct, although of less
magnitude than observed in the above species, have also been reported for rainbow trout
at Ucrit; e.g., Thomas et al. (1987) observed a significant increase from an Hct, of 24.5%
to an Hct at Ucrit (Hctci) of 28.3%, in blood sampled via an extracorporeal circulation. In
contrast, the difference between Hct, (22.6%) and Hctu (25.7%) was not statistically
significant in a study with cannulated rainbow trout (Kiceniuk & Jones, 1977). The
general view is that when haemoconcentration does occur, it benefits the animal by
increasing blood O2 carrying capacity, thereby augmenting aerobic exercise performance
(e.g., see Jones and Randall, 1978; Wood and Peny, 1985).
A large fraction of the haemoconcentration observed at maximal prolonged
swimming (40%, Yarnamoto et al., 1980; > loo%, Franklin et al., 1993) can be attributed
to the constriction of the spleen and the subsequent transfusion of erythrocytes into the
circulation. Thus, the concentration of erythrocytes in the general circulation increases at
a time hen Toz is critical. Since the degree of change in Hct may be quite significant.

the question arises as to whether Hct is optimized for T o 2 under resting conditions, or
whether it is optimized to cover the range of Hct over resting and Ucrit conditions.
Jones (1 97 1) examined the relationship between Hct and exercise performance by
inducing anaemia in rainbow trout. The observation that a 50%, or greater, reduction in
Hct (to values < 16%), led to a 36% reduction in Ucrit indicated that anaemia could
reduce internal Toz, as measured by UCj t The implication of this result, with respect to
the Hctopt hypothesis, is that the lower limit for Hct is likely set by the need for at least a
minimal Cag2 to maximize V 02. However, Jones (1 97 1) was unable to derive a positive
relationship between Hct and Ucrit in normocythemic fish. In view of the Hctopt
hypothesis, this observation could be explained in several ways. Firstly, if one assumes
that a spleen transfusion had occurred in all normocythemic fish prior to blood sampling
at Ucrit (Jones did not measure Hct,), and that Hct is optimized for exercise conditions, it
is possible that rather than taking the shape of a narrow discrete peak, the peak for the
Hctopt was more like a plateau, and broad enough to cover the range in Hctu reported for
these normocythemic fish (i.e., 29 - 36%). On the other hand, Ucrit may not be the best
measurement for assesssing To2 demands during aerobic swimming in rainbow trout,
and instead Hct may be optimized for V 02mart In this case, the presence (or absence) of
a relationship between Ucrjt and Hct would be irrelevant.
With this in mind, I hypothesized that if Hct was optimized for exercise
performance, rather than rest, and if the spleen autotransfusion was prevented, Hct at
ucrit would be reduced, and the swimming performance of these fish would also be
reduced, due to the decrease in To2. On the other hand, if HctOpr was confined to a
narrow range, or if Hct was optimized for To2 under resting conditions, then the group of
fish which were unable to transfuse cells from the spleen. would not increase 11, and
would be better able to maintain Q and therefore swimming performance.

I tested this hypothesis by surgically removing the spleen from one group of
rainbow trout (splenectomized) and comparing the blood 0 2 canying capacity and
swimming performance of these fish with a group of sham-operated fish (controls). The
methods and results of this study are described in Appendix I, which contains a reprint
entitled "Swimming performance and haematological variables in splenectomized
rainbow trout, Oncorhynchus mykiss", published in the Journal of experimental Biology.
171, 301-314 (1992).
A brief summary of the major results of this study follows:
There was a broad range of values for Hctr in both groups of fish (22 - 40% and
23 - 45% for sham-operated and splenectomized fish, respectively). In sham-operated
fish, Hct increased significantly at Uc,jt, compared with rest (mean Hctr = 27.7 +_ 1.84 %
S.E.M, mean Hctu = 34.4 rt_ 2.7 % S.E.M.). There was no significant change in Hctrj,
compared with Hctr, in splenectomized fish (mean Hctr = 32.6 +_ 2.8% S.E.M., mean
Hctu = 32.5 + 2.9% S.E.M.). Despite this range of values, there was no correlation
between Hc t , Hctu, or combined Hctr and Hctu, and Ucrit in either sham-operated or
s~lenectomized fish. Moreover, there was no significant difference in the Ucrit values of
s~lenectomized, compared with sham-operated fish. Neither Hct,, nor Hctu, were
significantly different between the two groups of fish.
was significantly reduced in both groups of fish at Ucrjt, compared with rest.
However, C w 2 was maintained in sham-operated fish because the Hct increased
significantly. In contrast, C w 2 decreased significantly (compared to resting values) at
Ucrit in splenectomized fish, because the Hct did not change. Therefore, the spleen
transfusion may have maintained CQ, in the presence of the exercise-induced arterial
hypoxaemia.

Nevertheless, the higher Cag2 values at Ucrit in the sham-operated fish did not
confer benefits in terms of Ucrit, since Ucrit values for sham-operated and splenectomized
fish were not different. Therefore, the apparent improvement of internal O2 convection
associated with the spleen transfusion. did not translate into better swimming
performance.
Discussion
Based on the above findings, I suggested that the spleen transfusion may have
functions other than that of increasing or maintaining To2 to loco motor^ muscles during
strenuous aerobic swimming; e.g., perhaps related to cardiovascular benefits, such as by
augmenting blood volume and Q, or by altering blood flow distribution. ~lternatively,
the increase in [Hb] produced by the spleen transfusion could function to buffer exercise
induced acid-base disturbances. I also suggested that a more direct measurement of
muscle cell demand for oxygen (i.e., V O ~ ~ , ) would better reveal any relationship
between Hct and exercise performance.
The lack of a positive correlation between Hct and Ucrit in this study does not
support the idea of a discrete peak for Hctopr within the normal range for Hct values.
Instead, these results suggest that if an HctOpt exists, it takes the form of a plateau ranging
at least from Hct, to HctU in nomocythemic fish. Moreover, it is possible that there
exists a weak relationship between Hct and Ucrit for Hct values within this plateau.
An indication of where the lower limit for the HctOpr plateau might fall, comes
from the observation that the values at the low end of the range (i.e., 22 - 23%) for both
groups of fish were not associated with a decline in Ucrit. Therefore, the lower limit for
Hctopt (as measured by Ucrit) must fall somewhere between these values, and the Hctu
values of < 16% which were associated with a significantly decreased Ucrit in the earlier

study by Jones (1971). Since my study was conducted, Brauner et al. (1993) examined
the effects of anaemia on swimming performance in chinook salmon. They noted a
correlation between [Hb] and Ucrit in anaemic, compared with control fish, but only at a
functional [Hb] < 4.5 g.dL-1 (equivalent to Hctu values < 20%), again concurring with the
above conclusion. Of interest is the fact that Brauner et al. (1993) used a different
method from that of Jones (1971) to induce anaemia. They exposed fish to sodium
nitrite, thereby converting Hb to metHaemoglobin (metHb). Since metHb does not bind
0 2 , the 0 2 carrying capacity of the blood is reduced in concert with the formation of
metHb without changes in Hct or q. Jones (1971) used phenylhydrazine to induce
anaemia via hemolysis, thus causing a reduction in both erythrocyte number and
presumably Cao2 and q. The results of Brauner et al. (1993) confirm that the primary
limitation to swimming performance in anaemic fish is due to reductions in Cry)*, rather
than to the effects of reductions in q on Q.
During the preparation of the manuscript for this study, another study with
splenectomized rainbow trout was published (Pearson and Stevens, 1991b) reporting
poorer swimming performance in splenectomized, compared with sham-operated, fish.
T k s e authors provided evidence of correlations between Hct (and [Hb]) and Ucrit in
rainbow trout, with splenectomized fish having Ucrit values 16% lower than sham-
operated animals, thus implying that Hct is optimized for swimming performance in
rainbow trout, and that Hctqt coincides with H c t ~ . However, the correlation for [Hb] vs
Grit was weak (significant only at the 10% level). This is surprising because, compared
with Hct, [Hb] is a better predictor of Cry)Z (see Chapter I), and increases in Cao2 would
be expected to bring about an increase in Thus, the support which their study
brings to the relationship between Hctopt and V 02rnax is limited.
There were additional concerns with regard to the Hct and [Hb] values which
Pearson and Stevens (1991b) reported. To begin with, they did not measure Hct, in either
group of fish. Therefore, the difference which they observed for Hctu in the two groups
of fish may have simply reflected an initial anaemic state for the splenectomized fish, or
alternatively, a different response to handling stress in the two groups of fish. Moreover,
they observed a mean Hctu of 42% for sham-operated fish, a value considerably higher
than the 34% which we observed in sham-operated fish at Ucrit. In spite of these
differences in HctU values, the values for [Hb] at Ucrit reported by Pearson and Stevens
(1991a) and ourselves were essentially the same, i.e., 9.92 vs 9.5 g.dL-l. These disparities
(i.e., high Hct, yet low [Hb]) can probably be explained by an inappropriate method of
blood sampling on the part of Pearson and Stevens (1991b). They sampled blood via
caudal puncture, after removing fish from the swim tunnel following swimming to Ucrit.
This technique would undoubtedly elevate Hct. Caudal puncture is a more stressful
method of sampling blood because of the associated, and unavoidable, handling stress.
This type of stress may cause the release of catecholamines (Mazeaud and Mazeaud,
1981), which in turn would cause erythrocyte swelling (see Chapter 1). I sampled blood
via dorsal aorta cannula in fish swimming at Ucrit. The similar [Hb], but much higher
Hct values, observed by Pearson and Stevens (1991b) compared with my results. is
consistent with the view that their method of sampling caused significant erythrocyte
Swelling. The lower Hctu values observed in my study were not the result of serial blood
I showed, in a separate group of resting fish, that the removal of the 1.2 mL
did not affect Hct in sham-operated fish, but did cause a slight, but significant.
decrease (-1.2%) in the absolute Hct value of splenectomized fish. Clearly, spleen
transfusion was responsible for regulating systemic Hct during blood sampling in the
sham-operated trout.

Given that the spleen, can to some degree, regulate Hct in rainbow trout, and with
the Hctopl hypothesis in mind, the high degree of variability observed in Hctr values for
both splenectomized and sham-operated fish groups was unexpected. I reasoned that
possibly Hct is not tightly regulated in rainbow trout, so that Hct may normally fall
within an extremely broad range ( 22 - 45%). This would mean that if an Hctopt existed
in rainbow trout, it was more likely to be a broad plateau, rather than the theoretical peak
for Hctopt predicted by Wells and Weber (1991).
This still leaves the question as to why Uoit and Hct were not related in the
present study, or in the earlier study of Jones (1971). The most likely answer to this
question is that UCrit may not be a good measure of aerobic scope and rather, the direct
measurement of aerobic metabolism at peak exercise performance (i.e., V 02rnax ) would
better reveal HctOpr. A further problem which I was unable to resolve, was anaemia due
to surgery, and red blood cell swelling due to stress. Both of these conditions could
create an unusually large range for Hct. Surgical procedures which involve excision of
the body wall invariably lead to blood loss. Similarly, dorsal aorta cannulation
techniques, unless well-practised, frequently result in leakage around the point at which
the camula is inserted into the blood vessel. These were the first set of experiments that I
conducted and I had not yet perfected my cannulation skills. A further cause of the
variability in Hct, values is related to the observation that the values for Hct, were
numerically, but not statistically, higher in splenectomized, compared with sham-
Operated, fish (i.e., 32.6% vs 27.7%). Based on my subsequent studies, I can now
that the Hct for the sham-operated group was probably closer to the mean Hct,
values observed in a much larger sample of cannulated rainbow trout (see Tables 1 and 2,
2). This could have come about in the following way: Both groups of fish at
least partially contracted their spleens due to the stress of netting and anaesthesia prior to

surgery (e.g., see Wells and Weber, 1990). During recovery, the sham-operated fish
resequestered erythrocytes into the spleen, but this was not possible in the splenectomized
fish. When taken together, these latter observations are another indication that the high
degree of variability in rainbow trout Hct, values is most likely due to surgical and
handling practices.
Based on the findings of this study, I decided to test the possibility that Hct may
be optimized for V 02maw, rather than Ucrit, by performing another set of experiments in
which I would measure both Ucrit and Vozmax. Moreover, in order to reduce the
apparent variability in Hct of normocythemic fish, I decided to attempt to minimize the
effects of handling stress, surgery, and blood loss due to sampling, and only use animals
where there was no evidence of bleeding following surgery. Finally, I decided to extend
the range for Hct to extreme values beyond those normally observed in rainbow trout, and
to test for an Hctopt across this Hct continuum, from a condition of extreme anaemia to a
condition of extreme polycythemia.

Chapter 3
Haematocrit is not optimized for oxygen transport in swimming rainbow trout
Introduction
The optimal Hct (Hctopr) hypothesis suggests that the fraction of red blood cells in
vertebrate blood is set at a level where the O2 carrying capacity of blood is maximized
without compromising cardiac performance due to the elevated q associated with higher
Hcts. More specifically, this hypothesis suggests that there is a balance between
inadequate Cag2 at low Hct values and viscosity-induced decreases in venous return and
Q at high Hct values (see Chapter 1).
In support of the HctOpr hypothesis, two studies with salmonids have
demonstrated anaemia-induced reductions in swimming performance (Jones, 197 1 ;
Brauner et al., 1993, see Chapter 2). Indeed, perhaps the best empirical support for an
Hctopt is provided by the haemoglobin-free Antarctic icefish that inhabit subzero
seawater. It is generally viewed that the loss of erythrocytes in the Channichthyidae is an
adapation to reduce q effects at these extreme cold temperatures (see Chapter I).
However, it is also possible that the effect of q on Q in this group of fishes may be more
critical than for other teleost species, because the hearts of the Channichthyidae
characteristically have weak homeometric capabilities, and therefore would not be able to
maintain stroke work at these subzero temperatures, if resistance were increased due to
the Presence of erythrocytes (Tota et al., 199 1 b; Farrell, 199 1 a, see Chapter I).
Several studies with amphibians have also provided evidence in support of the
Hctopt hypothesis. Weathers (1976) observed a temperature-dependency for HctOpr in the
bullfrog, and suggested that there is a downward adjustment of Hct under winter
conditions as expected by a temperature-related increase in q. Reductions in maximal

systemic blood flow rates, V oa,,, and maximal To2 were observed subsequent to >
80% increase in Hct, to an Hct value of 57% in the toad (Hillman et al. 1985) and the
bullfrog (Withers et al., 1991), and these changes were inversely related to Hct-induced
increases in q (see Chapter 1). Similar to the Antarctic icefish, amphibian hearts are
known to have a poor homeometric capacity (Farrell, 1991a), and therefore may not be
capable of compensating for the elevations in q and the associated increases in blood
pressure which were associated with polycythemia in these studies.
The Hctopt hypothesis has also been tested in a number of fish species, including
rainbow trout, but the findings are equivocal, as in no case did the predicted HctOpr match
Hct, when measured in vivo (see Chapter 1). This lack of a tight matching may, in part,
be attributable to the use of in vitro measurements of q to estimate oxygen transport
capacity (OTC) (see Chapter I), rather than direct measurements of Q. It could also be
that the viscosity effects on Q, in vivo, may not be significant, since unlike amphibians
and icefish, rainbow trout hearts, and indeed those of many other temperate teleost
species, have a broad range for homeometric regulation (Farrell, 199 1 a).
In the experiments described in Chapter 2, I was unable to establish a relationship
between Hct and exercise performance (as measured by Ucrit) within the normal range of
Hct values for rainbow trout. These findings led to the suggestion that if indeed an
Hctopt exists for this species, it must take the form of a plateau, rather than a discrete
peak. I also suggested that an Hctopr may become more evident using direct
measurements (i.e., V 02) of aerobic metabolic demands during exercise performance,
and if the range of Hct values was broadened to include more extreme Hct values.
Results from experiments with conscious, and particularly exercising,
polyc)ithemic mammals consistently demonstrate that mammalians can compensate for
the detrimental effects of elevated q on cardiac function and To2, through vascular

adjustments (see Chapter 1). Moreover, there is indisputable evidence that V oZmax
increases, and exercise performance improves, with "blood doping" in humans, although
in most cases the increases in Hct are relatively small ( ~ 1 0 % ) (see Chapter 1). Indirect
evidence of the magnitude of apparent increases in q which some mammalian species can
tolerate, comes from observations of profound increases in Hct to values that are close to
double the normal Hct, values, due to splenic transfusion during strenuous aerobic
exercise (e.g., thoroughbred horses (see Chapter 1). Similarly, Hct has been observed to
increase significantly during strenuous aerobic exercise in some fish species (see Chapter
I), including rainbow trout (see Chapter 2, Appendix 1). Combined, the above
observations indirectly argue against the Hctopt hypothesis.
In view of the equivocal support for an Hctopt hypothesis, and to extend the
findings of the work described in Chapter 2, I designed a more thorough set of
experiments in which I adjusted Hct in rainbow trout over the range from 8% to 55%, and
measured Vo2 and Q in addition to Ucrit. Moreover, I extended the putative viscosity
effects further, by performing the experiments at two temperatures, 5 OC and 13 OC. My
working hypothesis was: If Hct is optimized for To2 in rainbow trout, then experimental
adjustment of Hct to extreme values (8 - 55%), and exposure to an exercise challenge
which maximizes Q and oxygen demand, would reveal peak values for maximum
swimming performance (Ucrit) and V 02rnax within the range of normocythemia (i.e., 22 -
45%, as observed in Chapter 2). Moreover, because q increases with decreasing
temperature, the Hctopt would shift to a lower Hct value at 5 OC, compared with 13 OC.

Materials and Methods
Experimental animals
Two groups of rainbow trout (Oncorhynchus mykiss) were used in these
experiments. Both groups of fish (body mass = 500 g + 9 S.E.M.; length = 33 - 38 cm; N
= 64) were obtained from West Creek Trout Fann, Aldergrove, B.C., and were held in
large outdoor tanks for at least two months prior to surgery. During this period, they
were fed satiation levels of dry pellets (Moore Clarke, B.C.) once daily. The summer
group of fish were acclimated to seawater (SW) (12 - 14 OC; salinity 30 ppt (parts per
thousand)) and the winter group of fish were maintained in freshwater (FW) at 4 - 6 OC.
FW was chosen for the winter experimental medium because of the lower ambient water
temperatures, compared with SW. Under winter conditions, the SW temperatures were
never lower than 9 "C. All fish were starved for 24 hours prior to surgery.
Surgical Procedures
Fish were netted and immediately anaesthetized in a 1:2000 solution of 2-
phenoxyethanol (Sigma Chemical Co., St. Louis, Missouri). Body dimensions were
determined and the fish were transferred to an operating sling where their gills were
constantly irrigated with a 1:4,000 solution of 2-phenoxyethanol during surgery. A
cannula was inserted into the dorsal aorta as described by Soivio et al. (1975) using
polyethylene tubing (PE50, Clay Adams, Parsippany, NJ) filled with heparinized (50 i.u.
per mL) saline. In summer fish, relative cardiac output (Q) was measured using a pulsed
Doppler flow probe (TMI, Iowa City, Iowa) which was implanted on the ventral aorta
following the method of Thorarensen, Gallaugher and Farrell (see Appendix 3). The
probe leads were secured on the body surface and anchored dorsally with the DA cannula.
Q was not measured in winter fish.

Experimental Protocol
Haematocrit adjustment
Following surgery, summer fish were held for at least 24 h in 20 L circular tanks
at ambient temperature. They were then transferred to a Brett-type swim tunnel
respirometer (Kiceniuk and Jones, 1977), where they were allowed to recover for at least
4 h before resting values were recorded for heart rate CfH), relative Q, dorsal aortic blood
pressure (PDA), Vo2, Pao2 and Caoz, Hct, [Hb], arterial blood pH (pH& and lactate
concentration ([La]). Hct was adjusted (see below) and after an overnight recovery,
another set of resting values were recorded for the above variables.
Winter fish recovered from surgery for 24 h in black Plexiglass boxes which were
continuously supplied with well-aerated dechlorinated freshwater (4 - 6 "c), after which
Hct, was determined. These fish were then transferred to a swim tunnel similar to that
described by Gerkhe et al. (1990) and held with the water velocity at 10 cm-s-I for at least
1 h prior to Hct adjustment. After an overnight recovery, the new Hct, was recorded.
For both summer and winter fish, Hct was adjusted in the following manner.
Cannulated donor fish, held in a blackened Plexiglass box for at least 24 h after surgery,
acted as either donor or recipient fish. Polycythemia was induced in recipient fish over
the period of 48 h by infusion of small volumes of blood (1 - 2 mL at a time) from donor
fish. The donor fish became the future anaemic fish. An equivalent volume of rainbow
trout plasma was used to replace blood removed from the anaemia group of fish. The
recipient fish, in turn, became polycythemic donor fish (Hct > 50%) to achieve a higher
level of polycythemia for the polycythemic fish used in the experiments. The number of
blood withdrawals or infusions, and the total volume of blood withdrawn or infused (1 - 2
mL per infusion per 2 h) in order to obtain a desired Hct, was calculated assuming a
blood volume of 3.5 m L 100 g-I body mass (see Olson, 1992). Blood removal or infusion

was performed over a period of at least 5 min. Normocythemic fish that acted as controls.
were prepared by first removing blood (2 mL), and then infusing an equivalent volume of
blood from an equivalent-Hct donor fish. This process was repeated several times over 3
- 4 h. At no time was there evidence of cross-reactivity between the blood cells of
different individuals due to these manipulations.
Swimming trials and oxygen uptake measurements
For both groups of fish, Ucrit was determined by increasing the water velocity,
first in steps of 0.50 b1.s-I and then by 0.25 b1.s-I. Each velocity step was maintained for
either 30 minutes or until the fish fatigued. Fatigue was evident when the fish could not
swim off the rear grid (SW summer fish), or if they remained on the 8 V electrified rear
grid for longer than several seconds (FW winter fish). Fatigue is a discrete event which
Occurs when the fish can no longer swim against the imposed water velocity. Therefore,
to get a representative blood sample, in some cases it was necessary to quickly reduce the
swimming speed at fatigue by one step so that the fish continued to swim while the blood
Was sampled. Uc,it values were calculated after appropriate adjustment for the blocking
effect of the fish (Bell and Terhune, 1970). Water velocity was calibrated at least once
per week with a flow meter.
The O2 tension of the water in the swim tunnel (Pw02) was continuously
monitored with an O2 electrode (Radiometer E5046, Copenhagen), thermostatically
controlled at the experimental temperature and connected to a PHM 71 acid-base analyzer
(Radiometer, Copenhagen). Calibration of the 0 2 electrode was achieved by setting the
meter to zero when the electrode was disconnected and setting Pw02 using aerated water
at the ambient temperature and barometric pressure. Water from the tunnel was
c~ntinuously drawn past the electrode via a pressure head and the Pwo2 was recorded
every second by a computer. V o 2 was measured by closing off the tunnel for 6 min
(summer fish) or at least 30 min (winter fish). Oxygen consumptior. was calculated as:
V o 2 = V . ~ w o 2 . d r l . a . m - 1
where V is the tunnel volume (39 L summer fish; 130 L. winter fish). a is the solubility
constant for O2 at the experimental temperature and salinity (pmol 0 2 . ~ - ' . k p a - ' )
(Boutilier er al., 1984), and m is body mass. At no time did the water temperature of the
larger tunnel change by more than 1.0 "C during the V 0 2 measurement.
Blood sampling and analytical techniques
Arterial blood samples (0.6 mL) were taken before and after Hct adjustment, a1
rest, once at a velocity of approximately 80% Ucrit, and at Uc,it. An equivalent volume
of blood from an equivalent-Hct donor fish was used to replace blood removed for
sampling. For some summer fish, blood samples (0.5 mL) were also withdrawn after Hct
adjustment at rest and at Ucrit, and similarly replaced with blood from an equivalent-Hct
donor fish, for measurements of q . Blood viscosity was not measured in winter fish.
Measurement of Pag2 was made using a Radiometer E5046 Po2 electrode in a
D616 cell and whole blood pHa was determined on samples injected into a Radiometer
pH microelectrode (type E5021). Both electrodes were regulated at the tunnel water
temperature and linked to a Radiometer (Copenhagen) PHM 7 1 acid-base analyzer. Cag2
was measured in 30 pL samples using the method of Tucker (1967). Hct was measured
in triplicate (20 pL samples drawn into microcapillary tubes) by spinning samples in a
Haemofuge (Heraeus Sepatech, Netherlands) centrifuge at 12,000 rpm for 3 min.. Sigma
diagnostic kits (Sigma Chemical Co., St. Louis, Missouri) were used to measure blood
[Hb] (no. 525A) in 20 pL whole blood samples and [La] (no. 826-UV) in 100 pL plasma
samples. Blood viscosity was determined at I5 "C using a cone-plate viscometer with

cone angle 0.8' (model LVT. Brookfield Engineering Laboratories, Massachusetts).
Samples were used immediately, or within 12 h (in the latter case they were refridgerated
at 4 'C until use).
In summer fish, the dorsal aorta cannula was connected to a pressure transducer
(Narco, LD 15). Signals from flow meters, pressure transducers, and oxygen meters were
amplified and monitored by a Grass chart recorder (model 7CP B, Grass Instruments,
Quincy, Massachusetts) and stored in a computer. The computer sampled Q and Pd,
signals at a rate of 5Hz, and recordings were averaged over 6 min for each swimming
velocity. Labtech Notebook software (Laboratory Technology Corporation,
Massachussetts) was used to convert the signals to digital form, to process the signals,
and to calculate f H.
Blood volume (BV) was measured in summer fish, immediately after fatigue,
using the Evan's Blue dye dilution technique (Smith, 1966; Nikinmaa et al., 198 1). After
an initial sample of blood was withdrawn to determine Hct and obtain plasma, a known
amount of Evan's Blue solution (0.6 mL) was injected via the dorsal aorta cannula and
the cannula was flushed with saline (0.4 mL). Timed (30, 60, 90, 120 min) serial blood
samples (0.25 mL) were withdrawn. The total volume of blood withdrawn was equal to
the volume of Evan's Blue injected + the volume of saline used to rinse the cannula. The
blood was centrifuged, Hct was measured, and plasma was diluted with saline, and the
optical density (O.D.) read against the original plasma sample (also diluted) at 600 nm
wavelength using a Pye Unicam SP8 spectrophotometer. Plasma volume was calculated
using the density of the dye in the plasma and the injected amount of dye as follows:
Plasma volume (PV) = [EB] VEB / 0 . D (where [EB] is the concentration of the injected
Evan's Blue stock solution (0.6 g.L-I) and VEB is the injection volume, and O.D. was the
value for Evan's Blue at time zero (obtained by regressing the relationship between O.D.

and time to zero). Since Hct did not change significantly during the sampling, BV was
calculated as follows: BV = PV /((I - Hct/lOO).PV) (Nikinrnaa et al., 1981). BV was not
measured in winter fish.
Some variables were compared as discrete groups of fish. For summer fish, these
groupings are: the most anaemic fish (mean Hct = 12.4 %), the most polycythemic fish
(mean Hct = 47.9%), and normocythemic fish (mean Hct = 26.3 %); for winter fish, the
most anaemic fish (mean Hct = 17.2%), the most polycythemic fish (mean Hct = 46.9%)
and normocythemic fish (mean Hct = 32.5%) (see Table 1). The significance of
differences in various parameters (PDA, Qrest, Qmax, pHa, [La]) between anaemic,
normocythemic and polycythemic groups of fish was tested using ANOVA.
The significance of changes in haematological variables at Ucrit, compared with
rest, was tested using paired t-tests. For the data describing [Hb], Cag2, Ucrit, V 02rnax,
To2, conductance, and Pag2 as functions of Hct, curves were fit with the use of a
segmented polynomial model as modified by M. Zhan (Department of Mathematics and
Statistics, Simon Fraser University) (Zhan et al., 1994).
Results
Relationships between Hct (Hb) and CaO2 blood viscosity, Q, and To2
The initial mean Hct was 27.0% + 0.8 S.E.M. (N = 35) for summer fish, and
30.0% + 0.3 S.E.M. (N = 29) for winter fish. The initial Hct range for all fish used in
these experiments was between 23% and 33%. For the rest of this chapter, this range of
Hct values will define normocythemia.
[Hb] increased proportionately with Hct, in both summer and winter fish (Figure
3). The relationship between [Hb] and Hct was not different in summer and winter fish
(Figure 3) (P < 0.01, Student's t-test).

Figure 3. The relationship between [Hb] and Hct at Ucrit in SW summer (filled symbols)
and FW winter rainbow trout (open symbols). The slopes of the lines were not
significantly different for the two groups of fish (Equation for the regression
line fitted to the combined sets of data: y = 0.3233.x, R2 = 0.912).

summer
0 winter

Figure 4. The relationship between Cag2 and [Hb] at Ucrit for SW summer (filled
symbols) and FW winter (open symbols) rainbow trout. The solid lines show
polynomials fitted to the data for the two groups of fish (y = 0.0092-x* +
1 .306 .~ + 0.013, R2 = 0.876, for summer fish; y = 0.023ax2 + 1.3701.~ + 0.013,
R2 = 0.824, for winter fish). The dashed line represents the line of identity,
calculated assuming that 1 g of Hb binds 1.3 mol 02.

0 5 10 15 20
[Hb] U (go1 00 mL -')

C w 2 increased with increasing [Hb] (Hct), but the relationship between Cao2 and
[Hb] was not directly proportional and was different, albeit not significantly so, in
summer and winter fish (Figure 4) (P < 0.01, Student's t-test). At a [Hb] E 10 g.100 mL-1
(Hct r 30%), the relative increase in C w 2 , per unit increase in [Hb], was less than would
be predicted by the theoretical line of identity (calculated by assuming that 1 g of Hb
binds 1.3 mol of 02), indicating that the saturation of Hb with 0 2 declined as the [Hb]
increased (Figure 4). This decrease was more profound in summer than in winter fish
(Figure 4).
Calculations for the amount of 0 2 bound to Hb (pmol-02.gHb-') (i.e., 0 2 bound to
Hb = Cag2 - ((P~2.a02)(1-Hctl100))/ [Hb], where Cag2 was converted fiom vol % to p
mo1.L-I, and the fraction of 0 2 dissolved in the plasma was calculated using the tabulated
solubility coefficient for 0 2 at the relevant temperature (a) (Boutilier et al., 1984) (see
Milligan and Wood, 1987)), revealed a trend for desaturation in polycythemic summer,
but not winter, fish at Ucrit, compared with rest (Table 1). However, the Hct-dependence
for the amount of 0 2 bound to Hb was not significant. The amount of 0 2 bound to Hb
was significantly higher in polycythemic winter, compared with polycythemic summer,
fish (Table 1).
Blood viscosity changed predictably with changes in Hct in summer fish.
Viscosity of blood sampled from fish under resting conditions was significantly higher (P
< 0.05, N = 5) in polycythemic, and lower (P < 0.05, N = 6) in anaemic, compared with
normocythemic fish, at all shear rates (Figure 5, Table 2B). Blood viscosity was shear-
rate dependent (Figure 5). Viscosity values for blood sampled before and after Hct
adjustment in normocythemic control fish were not different (Table 2A), indicating that
the process of blood removal and reinfusion did not affect q. For the polycythemic fish,
q was significantly lower at Ucrit, compared with rest, at the lowest shear rate (Table 2B).

Figure 5. Blood viscosity as a function of shear rate and Hct in SW summer rainbow
trout. These data were obtained in collaboration with Dr. Mark Graham.

I r I I I r I I I I
Hct
- T 0 12.2*1.1% 3
26.5*3.1% v 42.2*1.9%
-
-
I I I I I I I I I I
- 1 Shear ra te ( s )

The Hct-dependent changes in q had a significant effect on relative Q. Relative Q at rest
(i.e., Qrest, where Qrest = Q21Q1, and Q2 and Q1 are relative Q after Hct adjustment.
and initial Q, respectively) was significantly higher in anaemic (P <0.05), but was not
significantly lower in polycythemic, compared with normocythemic fish (Table 3).
Relative maximum Q ( i.e., Qmax, where Qmax = QulQI, and Qr/ is relative C,
at Ucrit) in anaemic fish, was not significantly different from Qmax in nonnocythemic
fish, but Qmax for the most polycythemic fish (mean Hct = 47.9%) was a significant 25%
lower (Pc0.05) than the Qmax for normocythemic fish (Table 3).
Values for f H in resting summer fish, after Hct adjustment, were unchanged in
normocythemic and polycythemic groups, compared with initial f H (mean initial f H =
5 1.5 bpm + 4.9 S.E.M., N = 24), but f H values were significantly higher after Hct
adjustment in anaemic fish, and were significantly higher in anaemic fish, compared with
fFl values for normocythemic fish. f H increased significantly for all fish at LTcrit
compared with rest, and there were no differences in f H at Ucrit between any of the
groups of fish (Table 2). Thus, since Q is the product o f f and SVH, changes in Qrest
can be attributed to changes in f H, but changes in SVH account for changes in Qmax
The changes in q also affected blood pressure in summer fish, as reflected in
values for PD,l. PDA was significantly higher in polycythemic fish at rest, but not at Ucrit,
compared with normocythemic fish (Table 3). PDA was significantly lower in anaemic,
compared with normocythemic, fish at Ucrit.
The effects of q on both Q and PDA were reflected in the Hct-dependence of
relative conductance (calculated as Q/PD,4, where Q = the ratio between relative Q at
Ucrit ( Q u = Qmax), or relative Q at rest, after Hct adjustment (Q2), and initial Q (Q1) in
summer fish. Over the Hct range tested (i.e., 8% -55%), relative conductance at rest was
decreased significantly in polycythemic, and increased significantly in anaemic,
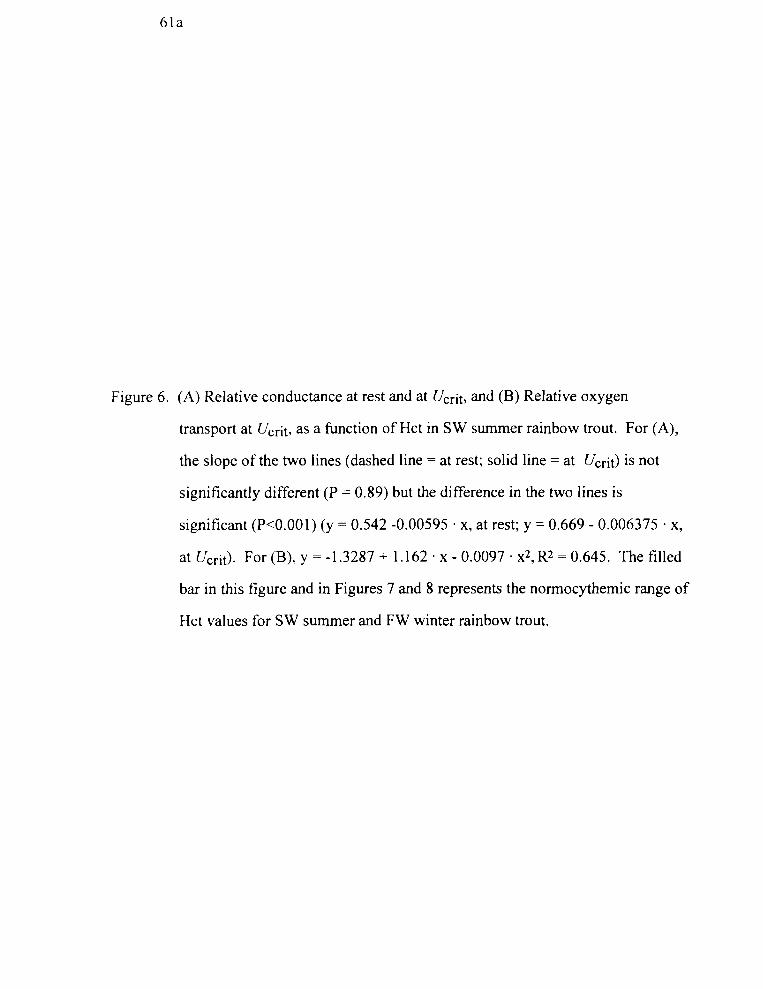
Figure 6. (A) Relative conductance at rest and at Ucrit, and (B) Relative oxygen
transport at Ucrit, as a function of Hct in SW summer rainbow trout. For (A),
the slope of the two lines (dashed line = at rest; solid line = at Ucrit) is not
significantly different (P = 0.89) but the difference in the two lines is
significant (P<0.001) (y = 0.542 -0.00595 . x, at rest; y = 0.669 - 0.006375 . x,
at Ucrit). For (B), y = -1.3287 + 1.162 . x - 0.0097 . ~ 2 , R2 = 0.645. The filled
bar in this figure and in Figures 7 and 8 represents the normocythemic range of
Hct values for SW summer and FW winter rainbow trout.

Hct a t U crit (V

compared with normocythemic fish (P <0.001) (Figure 6A). Relative conductance was
increased at all Hct levels after swimming to Ucrit, compared with rest (Figure 6A).
Despite the increase in q, and related reductions in both Qmax and relative
conductance in the most polycythemic fish, relative To2 (calculated as Cao2.QrllQl)
continued to increase in proportion to Hct up to the highest Hct values (Figure 6B),
indicating that the detrimental effects of elevated q were offset by the increased C m , at
the highest Hct values.
Effects of Hct on Ucrit and V02max
UCrit was positively correlated with Hct ([Hb]) in both summer and winter fish.
Ucrit values were significantly lower at all Hct values in winter, compared with summer,
fish. However, despite the prediction that the increase in q at the lower temperature
would cause a shift in the Ucrit vs Hct relationship, the shape of the curve for this
relationship was the same in both groups of fish (Figure 7A).
Ucrit was not linearly related to Hct over the entire range tested (i.e., from 8% to
55%). Anaemia (Hct < 21 %) was associated with a marked reduction in Ucrit (Figure
7A). In contrast, although Ucrit did increase linearly with increasing Hct in the Hct range
for normocythemic and polycythemic fish (i.e., 22% to 55%), the increases were small.
This indicates that the positive effect of Hct on exercise performance (as measured by
Ucrit) was more profound in anaemic, than in normocythemic or polycythemic fish
(Figure 7A). Even though the relationship between Ucrit and Hct changed in
normocythemic and polycythemic, compared with anaemic fish, there was no evidence of
an Hct-induced viscosity limitation to Ucrit in polycythemic fish (i.e., Hct values > 33 %),
as there was no evidence of a peak in the Ucrit versus Hct relationship.

Figure 7. Critical swimming velocity (Ucrit) (A) and Maximum oxygen uptake
( V O ~ , , , ~ ~ ) (B) in relation to Hct at Ucrit in SW summer (filled symbols) and
FW winter (open symbols) rainbow trout. For (A), the slopes of the two lines
are not significantly different (P = 0.089), but the two lines are significantly
different (P<0.001). For winter fish, if Hct < 20.6, y = 1.2564 f 0.01 1 . x - 0.004584 (20.61 - x ) ~ , if Hct 2 20.6, y = 1.2564 + 0.001 1 . x (R2 = 0.73). For
summer fish, if Hct < 20.6, y = 1.7907 + 0.01 1 . x - 0.004584 . (20.61 - x)2, if
Hct > 20.6, y = 1.7907 + 0.01 1 x (R2 = 0.73). For (B), y = -1 S332 +
0.2838 - x - 0.0034 x2 (R2 = 0.66).

0 10 20 30 40 50 60
~ c t a t u (Q

V 02rnax was also positively correlated with Hct in both summer and winter fish
(Figure 7B). The shape of the relationship between these two variables was the same in
summer and winter fish. Moreover, temperature-related viscosity effects on V ozrnax
were not apparent, since in contradiction to my prediction, V 0lmax values for winter and
summer fish were not significantly different (P = 0.17) (Figure 7B). Thus the higher q at
5 OC, compared with 13 OC, apparently did not affect Vo2rnax.
The relationship between V oZmax and Hct was different from the Ucrit versus Hct
relationship. V02rnax increased with Hct to a peak at Hct 42%, whereupon it declined
(Figure 78). Again, there was a marked reduction in VoZmax in anaemic fish (i.e., Hct
8% to 22%). Within the normocythemic range, and up to Hct 42%, there was also an
increase in V ozrnax per unit Hct, but the increase was less profound than that observed
for fish within the anaemic Hct range (Figure 7B). Thus, although the elevated C w 2 and
relative 7'0, values for polycythemic fish in the Hct range 33% to 42% were reflected in
higher values for V 02,,, compared with normocythemic fish, the increase in V 02max
per unit Hct, was diminished, compared with anaemic fish. After the peak at Hct 42%,
V 02rnax declined, so that V 02rnax was significantly lower at an Hct of 55%, compared
with the Hct of 42% (V02rnax at 55% < 42%, P = 0.024) (Figure 7B), indicating that the
higher C w 2 , and the increase in relative To2, for this group of fish did not benefit
V Ozmax Therefore, although there was a peak for V 02rnax, it coincided with Hct values
well above the normocythemic range (Figure 7B).
For the most anaemic summer fish, the negative effects of the lower C w 2 and
relative To2 was reflected in lower values for Vo2 at rest (V02rest), compared with
normocythemic fish (Table 3). V 02rest was not significantly different in polycythemic,
compared with normocythemic fish (Table 3). V 02rest was not measured in winter fish.

Table 1 . Haematological parameters in anaemic (A), normocythemic (N) and polycythemic (P) groups of summer (SW) and winter (FW) rainbow trout.
Hct % (rest)
P Ha (rest)
(ucrit)
Pa02 (kPa)
(rest)
(ucrit)
Hb02 (um01.~-')
(rest)
(ucrit)
[La1 ( m m o l , ~ - ~ )
(ucrit)
Blood volume ( m L 100 g'l)
(ucrit)
Summer Fish
Numbers in parentheses are +I- S.E.M.
Winter Fish N
32.5 (1 .O)
N =I3
8.01 a (0.0 1) N= 12
7.84*** (0.02) N = 12
15.9 a (0.4)
N = 12
1 1.8***,a (0.6)
N = 12
54.8 (5.9) N = 9
53.7 (2.2) N = 9
-
-
* 3 * * , *** Significantly different from rest (*, P < 0.05, **, P < 0.01, ***, P < 0.001) a Significantly different from the same Hct group in summer fish (P < 0.01) b Significantly different from normocythemic fish (P < 0.01)

Table 2. The effect of blood removal and replacement on blood viscosity (cP) in normocythemic (SW) rainbow trout (Hct 1 = before adjustment, Hct 2 = after adjustment) (A) and the effect of Hct on blood viscosity (cP) at rest and after swimming to Ucrit (B).
Shear rate ( s ' ) A.
Hct 1 (%) 26.2 (2.1) N = 5
Hct 2 (%)
25.8 (2.4) N = 5
B.
Polycythemic Hct (%) (rest)
42.8 (2.9) N = 5
(ucrit) 42.2 ( 1.9) N = 5
Normocythemic Hct (%) (rest)
23.8% (1.5) N = 5 ( Ucrit) 26.5% (3.1) N = 5
Anaemic Hct (%) (rest)
12.7 (1 5 ) N = 5 (Gr i t )
12.2 (1.1) N = 5
* Significantly different from rest (P < 0.5). Numbers in parentheses are * S.E.M.

Table 3. Heart rate, cardiac output, arterial blood pressure at rest and Ucrit, and V o~~~~~ in anaemic, normocythemic, and polycythemic groups of summer (S W) rainbow trout.
Anaemic Normocythemic Polycythemis
Jfr (beats.minel)
(rest)
(Ucrit)
Relative erest 1.42 a 1.18 0.9 1 ( Q ~ Q I ) (0.08) (0.13) (0.08)
N= 10 N = 6 N = 8
Relative Q,,, 2.1 2.2 1.65 a
(QdQ,) (0.13) (0.19) (0.23) N = 10 N = 6 N = 8
** Significantly different from rest, P <0.01 a Significantly different from normocythemic fish, P <0.05

Arterial hypoxaemia and oxygen desaturation
Resting values for Pag2 were significantly higher in all winter fish, compared
with summer fish. There were no signficant differences between resting values for p w 2
in anaemic, normocythemic and polycythemic summer fish (Table 1).
Results of a previous study with rainbow trout (see Appendix 1) demonstrated a
graded decrease in Pag2 in normocythemic rainbow trout as they swam faster (see
Chapter 2, Appendix 1). In the present study, Pag2 was significantly lower at Ucrit,
compared with rest, in all fish, except for the anaemic summer fish, where P w 2 was
unchanged. Moreover, the decline in Pag2 was greater in the polycythemic. compared
with the normocythemic group of fish. The extent of this arterial hypoxaemia wa?
therefore dependent on Hct in both summer (P < 0.01) and winter (P < 0.05) fish (Figure
8). Thus, the Hct-dependent decline in Pag2 at Ucrit may account for both the trend
toward less O2 bound to Hb in polycythemic fish at CTCrit (Table 2), and for the lack of
linearity in the relationship between Cag2 and Hct in summer fish at higher Hct values
(Figure 4, see above). Although the shape of the relationship between Pag2 and Hct was
different over most of the Hct range in summer and winter fish. the two curves converged
at Hct values 2 42%, and thereafter continued to decline in parallel (Figure 8). This Hct
value was similar to the Hct peak observed for J'o2rnax for Summer and winter fish (see
Figure 7B).
Changes in haemutological parameters associated with swimming to Ucrit
In summer fish, blood volume at Ucrit was significantly higher in the most
polycythemic, but not significantly different in the most anaemic, compared with
normocythemic fish, after swimming to Ucrit (Table 1).

Figure 8. Arterial blood oxygen tension (Pa02) at Ucrit in relation to Hct at Ucrit in
SW summer (filled symbols) and FW winter (open symbols) rainbow trout.
For summer fish, y = 172.247 - 9.1359 . x + 0.2502 + x2 - 0.0024 . x3 (R2 =
0.65). For winter fish, y = 102.8598 + 0.4716 x - 0.0284 x2 (R2 = 0.59).


Hct did not increase significantly at UCrit, compared with rest, in summer fish;
i.e., Hct, and Hctu were: 12.6% + 1.1 S.E.M. and 12.4% 4 0.9 S.E.M. (N = 9) in anaemic
fish, 25.5% + 1.4 S.E.M. and 26.3% + 1.4 S.E.M. (N = 6) in normocythemic fish, and
44.1 % + 1.4 S.E.M. and 47.9% + 1.4 S.E.M. (N = 9) in polycythemic fish. In winter fish,
HctU was significantly higher, compared with Hct,, in anaemic, normocythemic and
polycythemic fish, with the magnitude of the increase being greatest in the polycythemic
fish. Hct, and HctU were: 15.0% + 0.5 and 17.2% + 0.9 S.E.M. (N = 5) in anaemic fish,
28.0% _+ 0.9 S.E.M. and 32.5% It 1.0 S .E.M. (N = 13) in normocythemic fish, and 39.0%
+ 1 .O S.E.M. and 46.9% + 1.6 S.E.M. (N = 10) in polycythemic fish.
pHa decreased significantly with swimming compared to rest, in anaemic, but not
in normocythemic or polycythemic, summer fish (Table 1). pHa decreased significantly
with swimming for all winter fish, but there were no significant differences between
anaemic, normocythemic and polycythemic fish (Table I). The values for pH, were
consistently significantly higher in winter, compared with summer fish.
Plasma [La] increased significantly in all summer fish at Ucrit. Values for [La] at
rest were significantly higher in anaemic, compared with normocythemic and
polycythemic groups of fish (anaemic, 1.35 mmol.L-' f 0.19 S.E.M. (N = 4);
normocythemic, 0.49 mmo1.L-1 f 0.19 S.E.M. (N = 4); polycythemic, 0.76 mmo1.~-1 + 0.20 (N = 7)). There were no differences in [La] between groups of fish at Ucrit (Table
1). [La] was not measured in winter fish.
Cost of swimming
The cost of swimming (oxygen uptake for a unit mass to travel a unit distance) in
summer fish was calculated as: (V 02max - V 02resJ Ucrit, where Vo2 was measured in
mL02.kg-l.min-l Ucrit in m.min-1. The cost of swimming was significantly lower
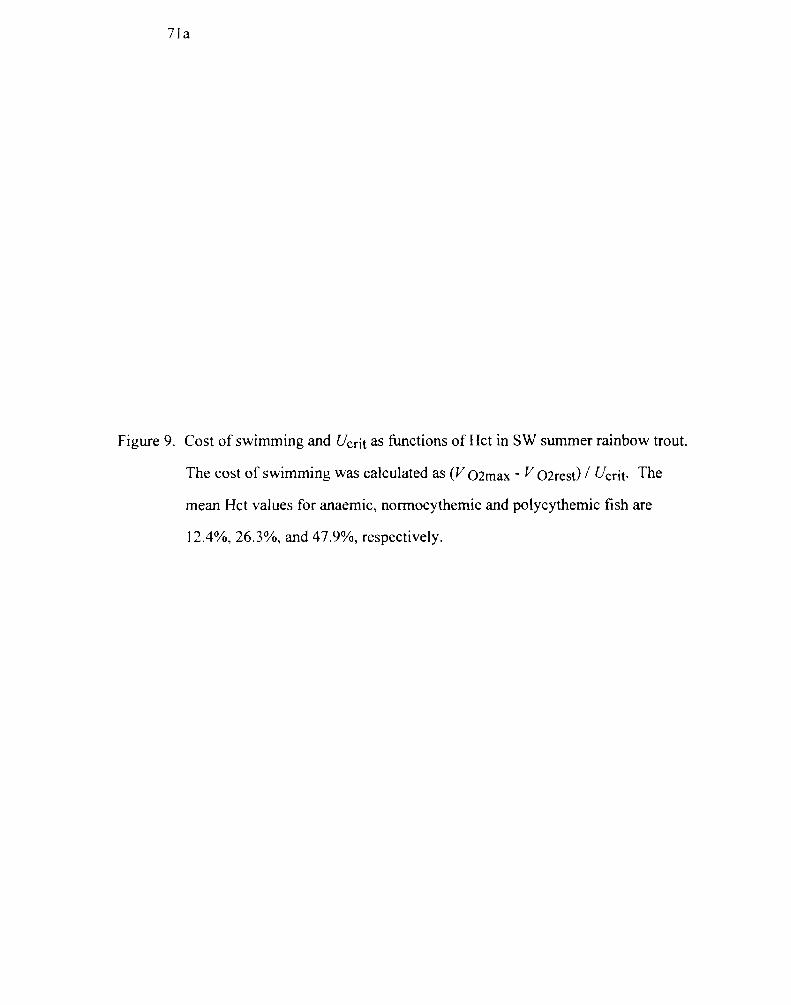
Figure 9. Cost of swimming and Ucrit as functions of Hct in SW summer rainbow trout.
The cost of swimming was calculated as (V 02max - V 1 Ucrit. The
mean Hct values for anaemic, normocythemic and polycythemic fish are
1 2.496, 26.3%, and 47.9%, respectively.

CI Cost of swimming (ml021 kg/m Imin)
Ucrit ( d m i n )
Anaemic ~omocy themic Polycythemic

(P <0.001) in the most anaemic, and significantly higher (P <0.05) in the most
polycythemic fish, compared with nonnocythemic fish (Figure 9).
Dkcussion
Normocythemia
The normocythemic Hct range for the combined summer and winter fish was
much smaller than the range reported by Wells and Weber (1991) in their survey of Hct
values for a number of studies with rainbow trout. This can, in part, be attributed to the
fact that I sampled blood via cannulae rather than by the more stressful method of acute
venesection (see Chapter 1). Moreover, based on MCHC values for resting fish (see
Table 2, Appendix 2), there was no evidence of elevated Hct values due to cellular
swelling, indicating that catecholarnine levels were probably low. Furthermore, the
resting [lactate] values and pHa levels in normocythemic fish were in line with values
reported in other studies with well-rested cannulated rainbow trout held in black boxes
(e.g., see Tang et al., 1989a; Milligan and Wood, 1986a, b), thus giving no indication of
the typical anaerobically-fueled burst swimming escape responses and suggesting that the
effects of handling and surgical procedures had expired. Finally, resting values for f H
were comparable to those reported for f H in other studies with resting rainbow trout
(Farrell and Jones, 1992). Combined these observations indicate that these fish were in
good physiological condition, and relatively free from stress.
~ l o o d viscosity and relative conductance
Blood viscosity did not change as a function of handling "stress" as suggested by
Wells et al. (1990). Values for q in blood from normocythemic fish, before and after ~ c t
adjustment, were not significantly different. Therefore, in the present study "stress" was
either unimportant, or it was a consistent factor in the experiments. Wells et al. (1990)

also suggested that the method of blood sampling may affect q. This suggestion is not
supported by our findings of very similar values for q to those reported in another study
of rainbow trout blood viscosity, where blood was sampled via acute caudal puncture
(Fletcher and Haedrich, 1987).
Blood viscosity changed predictably with changes in Hct; q was significantly
lower and higher in anaemic and polycythemic blood, respectively, compared with
normocythemic blood. Although I did not measure q in the winter fish, I assumed that q
increased with the lower temperature to the same degree as reported in a previous study
with rainbow trout (Fletcher and Haedrich, 1987), and that changes in q with
experimentally-induced Hct changes were similar to those for the summer fish. Increases
in q have also been observed in polycythemic humans. For example, Celsing et al.
(1987) observed a 40% increase in q (measured in vitro) concommitant with a 25%
increase in [Hb] in humans. However, in vivo measurements of q are known to be lower
than values for q measured in vitro in mammals, so that the Hct-induced increase in q
may also be less in vivo (see Chapter 1).
The significantly lower value for q reported at the lowest shear rate in the
polycythemic fish in samples taken after exercise, compared with rest, is indicative of an
exercise-induced adjustment of q at the level of the erythrocyte and (or) plasma.
Erythrocyte deformability is a very important determinant of q and vascular resistance at
the capillary level, and there is evidence of exercise-induced increases in this property in
mammals (see Chapter 1). In rainbow trout erythrocytes, there is also evidence of
increased deformability, both following exposure to hy~oxia, and after exhaustive
exercise (Hughes and Kikuchi, 1984; Kikuchi et al., 1985). Moreover, catecholamines
may play a role in causing the changes in cell deformability observed under both of these
conditions (Chiocchia and Motais, 1989). Wells et al. (1991) have demonstrated that the

viscosity of rainbow trout blood, and its dependence on shear rate, is reduced in the
presence of 10 -5 M adrenaline. Although I did not measure plasma [catecholamines] in
this study, I have previously demonstrated that there are significant increases in both
adrenaline and noradrenaline at Uoit in FW rainbow trout (see Appendix 1) and I have
since observed similar levels of catecholamines in SW chinook salmon at Ucrit (see
Appendix 2, Table 5). Therefore, it is very likely that plasma [catecholamines] were
elevated at Ucrit in the present study and could have reduced q by increasing erythrocyte
deformability.
Similarly, Fedde and Wood (1993) have provided indirect evidence of
compensation for elevated q , when Hct increases so significantly (e.g., from 40% to 70%)
during strenuous exercise in horses. Although they observed that q (measured in vitro)
was high when Hct was high (70%) at low shear rates, q decreased very significantly as
shear rate increased, to values similar to those observed at low shear rates in
normocythemic (40%) animals at rest. Fedde and Wood (1993) argue that since shear
rates in the circulation would be extremely high (e.g. > 2000 S-') during maximum
exercise performance, and since they observed such dramatic decreases in apparent q in
high Hct blood with increasing shear rate, then the Hct-related effects of q during
strenuous exercise in this species must be minimal.
The dependence of q on Hct explains the Hct-dependence of both PDA and
relative vascular conductance observed in the present study, although the degree of this
dependence was not profound. Increases in Rs have been reported for dogs when Hct was
increased from 40% to 68% (Lindenfeld et al., 1985). However, similar to the
observation of higher conductance at all Hct values in exercising, compared with resting
fish, Lindenfeld et a]. (1985) observed lower resistance for exercising, compared with
resting animals, at all Hct values. Thus, it is apparent that exercise may induce

compensatory vascular adjustments for q during polycythemia in mammals. In support
of this, Gustaffson et al. (1980) observed that q was much lower when measured in viva
in the circulation of working, compared with non-working, musculature and moreover,
that blood viscosity was elevated when vasomotor activity was prevented in skeletal
muscle (see Chapter 1).
It is possible that similar adjustments for q , both at the level of the vasculature
and at the level of the erythrocyte, as occur in mammals, may also occur in rainbow trout
during exercise. These adjustments could explain the disparity in the theoretical values
predicted for Hctopt (obtained using calculations employing in vitro measurements of q )
and Hct values measured in vivo (e.g., Hedrick et al., 1986; Wells and Baldwin, 1990;
Baldwin and Wells, 1990; Wells and Weber, 1991; see Chapter 1). Similarly, the failure
to account for compensatory adjustments for q may also explain the disparity in the
conflicting results obtained from mammalian experiments designed to test the Hctopr
hypothesis, where observations in support of Hctopt in anaesthetized mmmals (e.g.,
Richardson and Guyton, 1959; Guyton and Richardson, 196 1 ; Murray et al., 1963), differ
from observations which provide evidence against an Hctopt in conscious resting, or
exercising, mammals (Weisse et al., 1964; Lindenfeld et al., 1985; Schumacker et al.,
1985; Celsing et al., 1987; Kuwahira et al., 1993) (see Chapter 1).
Cardiac Output
Hct-dependent changes in q had a significant effect on relative Q in summer fish.
In anaemic fish, there was an increase in Qrest to compensate for the reduction in C q 2 .
In earlier studies with resting rainbow trout, a more severe degree of anaemia was also
associated with an elevated Qrest (calculated using the Fick principle) (Cameron and
Davis, 1970; Hct = 8%), an increase in f (Wood et al., 1979; Hct = 4%), and an increase
in Qrest as Hct decreased over time (Wood and Shelton, 1980). Unlike observations in
some mammalians (e.g. Horstman et al., 1974, see Chapter I), Qmax in anaemic fish did
not differ from values for normocythemic fish, despite the reduction in q.
While the decrease in relative Qrest was not significantly different in the most
polycythemic (mean Hct = 47.9%) fish, compared with normocythemic fish, Qmax was
lower by a significant 25%, indicating that q did indeed affect Q in this group of fish, as
predicted by the Hctopt hypothesis. Since /H at Ucrit was not different in polycythemic,
compared with normocythemic fish, the reduction in relative Qmm was due to a
reduction in SVH. The effects of equivalent levels of extreme polycythemia on Q have
also been examined in mammals. Decreases in both Qrest, and Q during sub-maximal
exercise have been observed during exercise in polycythemic (Hct = 68%) dogs
(Lindenfeld et al., 1985; Schumacker et al., 1985). In addition, Kuwahira et al. (1993)
observed elevations in both f H and aortic blood flow, although no change in stroke
volume, in rats under resting conditions, when polycythemia (> 50% increase in [Hb])
was induced in response to chronic hypoxia.
Just how Q is modulated in response to polycythemia is not understood.
Consistent with the concept of homeometric regulation, the viscosity-induced elevations
in blood pressure in the polycythemic fish of the present study, most likely led to a
reduction in maximum SVH. Rainbow trout hearts are known to have good homeometric
capabilities (Farrell, 199 1 a), which may explain why the reductions in Qmax were only
significant in the fish with the most extreme polycythemia (mean Hct = 47.9%). Such is
apparently not the case for polycythemic amphibians (Hillman et a/., 1985; Withers et al.,
1991) where Q (systemic arch blood flow) and To2 decreased in ~ r o ~ o r t i o n to 11 (which
increased exponentially with Hct). It appears therefore that amphibian hearts cannot
withstand the elevated q associated with higher Hct values. This is most likely related to

the relatively poor homeometric capacity of these hearts, in comparison with mammalian
and salmonid hearts (see Chapter I). Antarctic icefish would also belong in this general
category. Therefore, the magnitude of the effects of polycythemia (and thus the
applicability of the Hctopt hypothesis) may be a function of the relative homeometric
capacity of the heart.
On the other hand, Guyton and Richardson (1961) suggest that y effects on
preload are paramount in determing Q. For example, in mammals, Q is not reduced with
the chronic polycythemic condition, polycythemia Vera, and this may be due to the
expanded blood volume which accompanies this condition and the associated stimulating
effect of this greater blood volume on venous return (Guyton and Richardson, 1961).
Rainbow trout hearts are very sensitive to filling pressure, and consequently SVH plays a
major role in increasing Q during exercise (Farrell, 1985, see also Appendix 3).
However, the decrease in SVH in the polycythemic fish in the present study, could not
have been related to blood volume, because the blood volume of this group of fish at UCrit
was significantly higher, compared with normocythemic fish. Thus, it follows that the
reduction in SVH was probably not related to changes in venous rehxn.
Q may also be modulated directly by Cag2 in the polycythemic condition. For
example, Q does not decrease in polycythemic humans unless the increase in Hct is
accompanied by an increase in Cag2, suggesting that Q may be adjusted in response to
Cag2 and (or) the A-Vo2 difference (Grover et al., 1986; Ferretti et a/., 1992). This has
not been tested in fish, but Barrett and Taylor (1984) observed a significant transient,
bradycardia in dogfish (Scyliorhinus canicula) when hyperoxaemic blood was injected
into the venous system. Furthermore, hyperoxia and associated increases in Cag2 have
been linked to inhibitory effects on other physiological functions in rainbow trout; e.g.,
catecholamine release (Perry et al., 1989) and ventilation (Aota et al., 1990). Control of
Q in rainbow trout is largely volume-modulated, and part of this modulation is under
adrenergic control (Farrell, 1993). The possibility exists that the high C w 2 may have
had an inhibitory effect on Qmax in polycythemic fish, perhaps via an inhibitory effect on
catecholamine release.
Internal Convection of Oxygen at Ucrit
Despite the polycythemia-induced decrease in Q,,, continued to
increase with Hct values up to 55%. This indicates that the benefit of the Hct-related
increase in C w 2 offsets the detrimental effects of the reduction in vascular conductance
and the decrease in Qmax in polycythemic fish. Therefore, contrary to the Hctopt
hypothesis, viscosity contraints on internal To2 capacity were not evident for
polycythemic SW rainbow trout at 13 OC.
The relationship between Hct and maximum exercise performance and oxygen uptake
There was a clear breakpoint in the relationship between both Ucrit and V02max,
and Hct, at Hct values below normocythemia (21.6%) in both summer and winter fish.
Therefore, I consider that below this breakpoint rainbow trout are anaemic.
For both summer and winter fish, C w 2 was proportionally related to [Hb] (Hct).
The reduced capacity for internal convection of 0 2 in anaemic fish brought about by the
decreased C w 2 and unchanged Q,,, resulted in significantly hwer Ucrit and YoZmax
values for these fish. These findings are consistent with the HctOpt hypothesis, and
indicate that the exercise performance of these fish was perfusion-limited. When Hct was
reduced to values approximately one-third of nomocythemic Hct values, Ucrit was
reduced by about 35%, compared with normocythemic fish (Figure 7A). This decrease in
Ucrit is similar to results of earlier studies with anaemic salmonids. For example, Jones
( 1 971) reported a 34% - 40% reduction in Ucrit in anaemic rainbow trout where Hct was

reduced by 33% - 50% of normocythemic values, respectively. Brauner et al. (1993)
demonstrated a positive relationship between functional [Hb] and Ucrit in anaemic
chinook salmon when functional [Hb] was reduced by more than 50% (see Chapter 2).
This is the first time that anaemia has been shown to cause a decrease in V 02rest
in fish. The reduction in V 02rest in the most anaemic fish, indicates that the increases in
Qrest and conductance did not compensate for the reduction in Cag2. Two other studies
with anaemic rainbow trout report no difference between the values for VoZrest in
anaemic fish and those for normocythemic fish (Cameron and Davis, 1970 (Hct = 8%);
Smith and Jones, 1982, Hct = 14%). The disparity between these observations, and those
of the present study, may reflect not only the differences in the degree of anaemia but also
the different methods used to determine V O ~ ~ ~ ~ ~ Both Cameron and Davis (1970) and
Smith and Jones (1982) obtained V 02rest values by using the Fick equation to calculate
V 0zrest as the product of ventilation volume (Vg) (obtained using the Van Dam method),
and the difference in 0 2 tensions between inspired and expired water. My measurements
were made with fish in a swim-tunnel (where the water velocity was 0.25 blsec-1 with
the fish resting on the bottom of the tunnel. There are concerns with estimates of Vo2
using Vg measurements obtained via the Van Dam method, because accurate
measurements of expired Po2 are difficult to obtain. Moreover, holding fish in Van Dam
boxes may be more stressful, in that these fish have experienced extensive surgery
involving suturing of "masks" to the jaws, and furthermore all movements are confined.
No other study in fish has examined the relationship of anaemia and VoZmax
during maximal aerobic exercise. However, similar to the present study, a linear
relationship between YoZmax and Hct was observed in the frog (Rana pipiens) for Hct
values < 15% (Hillman, 1980). Moreover, in anaemic humans, Ekblom et al. (1972)
observed a 30% decrease in maximal exercise performance and an 18% decrease in

concommitant with an 18% decrease in [Hb]. In the present study, when Hct
was reduced to approximately one-third of normocythemic values, there was a > 70%
decrease in V 0*max (Figure 7B).
Combined, the above observations support the hypothesis that [Hb] is a major
determinant of V o 2 at lower [Hb] values in vertebrates (Celsing et al., 1987; Hogan et
al., 199 1 ; Schaffartzik et al., 1993; Jones and Lindstedt, 1993). The physiological basis
underlying this positive relationship between decreases in [Hb] and V 02rnax goes beyond
a simple decrease in C'ag2. Recent work with in situ dog muscle preparations (Hogan et
al., 1 993) and intact hunlans (Schaffartzik et al., 1993) suggests that while the majority of
the [Hbl-induced decrease in Vo2max is due to a reduction in the convective supply of
0 2 to the muscle cell microcirculation, about one-third of the reduction can be attributed
to a reduction in the diffusive transport of 02, either by an increase in intracapillar~
erythrocyte spacing, and (or) in erythrocyte flow heterogeneity, or alternatively, by a
reduction in the capacity for offloading of 0 2 from Hb (Hogan et a/., 1990; Honig and
Gayeski, 1993).
This is the first time that the effects of polycythemia have been examined in fish,
although past studies have attempted to link slight (environmentally-induced) increases in
normal Hct with viscosity constraints on cardiac work (e.g., see Butler et al., 1992). My
results provide no evidence of viscosity constraints on maximal exercise performance,
even with extreme polycythemia and low temperatures. Rainbow trout must either have
additional capacity for cardiac work or can compensate for elevated q.
Even though q did increase in a predictable manner with Hct in summer fish,
there was no peak for the relationship between Uc,it and Hct. Similarly, there was no
evidence of a viscosity-related limitation to Ucrit in polyc~themic fish at 5 "C, when q
Would have been significantly higher. These observations clearly illustate that the

increased C ' q 2 continued to benefit the fish in terms of swimming speed, even at Hct
values almost double the normal value. However, the accrued benefit of the additional
Cao2 within the Hct range from 22% to 55% was significantly less than that for the
anaemic fish. A more than doubling of Hct from normocythemic values of 23% to the
polycythemic value of 55% produced only a 13% increase in Ucrit. Therefore. in terms of
the relationship between Ucrit and Hct, a graded plateau exists with the upper limit
greater than 55%, and the lower limit less than about 22%, in both FW winter and SW
summer rainbow trout.
These results are consistent with the findings of the induced polycythemia ("blood
doping") studies in humans described in Chapter 1, where there was no evidence of q
constraints on either cardiac performance or on To2 in polycythemic subjects. However,
the magnitude of change in Hct (and thus in q ) in the human studies was significantly less
than in the present study; an overall average increase in Hct ([Hb]) of about 10% was
associated with increases of about 10% in exercise performance. Only two mammalian
studies (Lindenfeld et al., 1985; Schumacker et al., 1985) have induced polycythemia to
the extent of the present study. In both studies, Hct was adjusted to values close to
double that of the normal Hctr (up to Hct = 65%) in dogs. However, only submaximal
exercise was tested. In neither study was there evidence of constraints on To2 or Vo2,
despite the polycythemia-induced increase in R, and decrease in Q.
In the present study, and similar to the Ucrit Vs Hct relationship, in terms of
V O ~ ~ ~ ~ , there were decreasing benefits from the increased C w 2 at Hct values greater
than the lowest level for nomocythemia. V Ozmax did increase in relation to Hct within
the Hct range 22% to 42%, but the rate of increase was less than that which was observed
in the anaemic fish; i.e., Vo2,,, was only 25% greater at Hct 42%, compared with Hct
23% vs a 70% difference in Yozmax between Hct 8% and Hct 22%. Within the Hct

range 42% to 55%, Vo2max declined, so that the Vo2rnax for Hct 55% was not
significantly different from that of Hct 42%. Therefore, there was a peak for V 02rnax in
relation to Hct, but contrary to my working hypothesis, it was at an Hct value
considerably higher than the normocythemic Hct range. Furthermore, the peak for
was unaffected by the colder experimental temperature. Similar to the
relationship observed between Ucrit and Hct between Hct values 22% to 55%, there was a
graded plateau in the Vo2rnax vs Hct relationship, with a lower limit at about 23%, but in
this case the upper limit was at an Hct of about 42%. Again, these results agree with the
findings of induced polycythemia studies in humans, where elevations of about 10% in
Hct produced 10% higher V 02max values.
Studies of polycythemia in amphibians have provided evidence of Hct-related
viscosity constraints on v ozmax, thus providing support for the concept of an Hctopt
(Hillman et al., 1985; Withers et al., 199 1). In these species, the viscosity effects may be
related to either less capacity for vasomotor activity, or to the known poorer homeometric
capabilities of the heart compared with rainbow trout (Farrell, 199 1 a). On the other hand,
the lack of an apparent effect of viscosity on Vo2rnax and exercise performance in both
rainbow trout and mammalians supports the view that vasomotor adjustments can
contribute to the compensation for viscosity-induced decreases (increases) in conductance
(resistance) (Gustaffson et a[., 1980; Lindenfeld et a/., 1985; Schumacker et al., 1 985;
Celsing et al., 1987; Kuo and Pittman, 1990).
The increases in T~~ in polycythemic rainbow trout were clearly not matched by
equivalent increases in V 02max. Evidently, factors other than [Hbl and To27 may play a
role in determining VoZmax when [Hb] is at normal or supra-normal levels. For
mammalians, while there is no doubt that increases in [Hb] are associated with increases
in V ozmax on an individual basis, it is also apparent that [Hbl is not the sole determiIlant

of V 02max (Jones and Lindstedt., 1993, see Chapter 1). For example, Sawka et a/.
(1 987a) were unable to demonstrate any significant relationships between the increase in
[Hb] and the increase in V 02max in the data compiled from four studies of polycythemia
in humans. Similarly, using the combined data from about 20 mammalian studies
involving Hct adjustment, Lindstedt et al. (1988) showed that there was no absolute
correlation between [Hb] and Vo2rnax, thus providing evidence against a causal
relationship between [Hb] and V oZmax. at least for [Hbl> 10 g.dL-' (nomocythemia).
The apparent breakdown in the relationship between [Hb] and for
polycythemic rainbow trout in the present study, was also observed in polycythemic
humans. A survey of the results of five different blood-doping studies found that the A
V02maxlA (Q.Cag2)max ratio was significantly less than unity (Turner et al., 1993, see
Chapter 1).
Arterial Hypoxaemia
One factor which may be responsible for the lack of linearity in the above
relationship between Cam and (or) Tot , and V 0 2 ~ ~ ~ , and which may also be involved
in setting the upper limit for nomocythemia in rainbow trout, is the observed decrease in
at Ucrit. Although this arterial hypoxaemia has been observed previously as a
graded response in rainbow trout swimming to Ucrit (Thomas et al., 1987; Gallaugher et
al., see Chapter 2, Appendix I), a novel finding in the present study was that Pag2 at
ucrit was inversely dependent on Hct. Pa02 was not reduced in the most anaemic
summer fish and only slightly reduced, in the most maemic winter fish, at Ucrit,
compared with rest. However, for normocythemic and polcythemic summer and winter
fish, r a g 2 was reduced significantly at UCrit, compared with rest. The extent of the
h~poxaemia was greatest in the polycythemic fish, and moreover, within the

Figure 10. The relationship between C q 2 (and [Hb]) and Hct, at Ucrit, in SW summer
and FW winter rainbow trout. The solid lines show polynomials fitted to the
data ([Hb]), as described in Figure 4. The dashed lines represent theoretical
lines of identity for the relationship between C q 2 and [Hb], where C q 2 was
calculated based on the assumption that 1 g of Hb binds 1.4, 1.3, 1.2, or 1.0
mol of 02.

[Hb] at Ucrir (g 100rn~'~)

norrnocythemic range of Hct values, the reduction in P w 2 was greater in summer,
compared with winter fish.
This arterial hypoxaemia was not associated with a statistically significant arterial
desaturation (Table 1). However, there was a clear trend towards a reduction in the
amount of O2 bound to Hb in polycythemic fish as evidenced by the nowlinearity
observed in the relationship between C w 2 and [Hb] (see Figure 4). The difference in the
lines for the Cao2 vs [Hb] relationship in summer and winter fish, may be indicative of
an additional effect of temperature. Generally, it is assumed that 1 g of Hb binds 1.3 mol
of 0 2 (cf Figure 4). However, this relationship could be temperature-dependent (see Brill
and Jones, 1994). Figure 10 shows lines of identity for several theoretical values for the
amount of O2 bound to Hb.
Arterial hypoxaemia (and an associated arterial desaturation) is also commonly
observed at maximal exercise in some mammalians (e.g., human athletes, Dempsey et a/. ,
1984, Powers et al., 1989; horses, Wagner et al., 1989, Jones et al., 1989, Butler et a/.,
1993; and steers, Jones et al., 1989). In the case of horses hypoxaemia is not
accompanied by arterial desaturation (Jones et al., 1989).
The underlying mechanisms for the hypoxaemia are still a matter of speculation.
A diffusive limitation at the lungs, possibly brought about by reduced red blood cell
transit time or inhomogeneity of blood flow, and (or) a ventilation-perfusion inequality
and possible hypoventilation, have all been postulated for mammals (Dempsey et al.,
1984; Powers et a/., 1989; Jones el al., 1989; Constantinopol et d . , 1989; Wagner et al.,
1989; Miyachi and Tabata, 1992; Wagner, 1993; Butler et al., 1993). The arterial
hypoxaemia observed in the fish in the present study could have resulted from a difhsive
limitation at the gills. Piiper el a/. (1977) have provided evidence of a difhsion
limitation to brachial O2 transfer in dogfish during strenuous aerobic swimming and this
may be related to an inhomogeneity of blood flow at the gills (Piiper and Schied, 1975;
Malte and Weber, 1989). Perry el al. (1985) observed evidence of a limitation to o2 diffusion at the gills in an isolated saline-perfused trout head preparation. The
homogenity of the perfusion of secondary lamellae, which is known to depend upon
perfusion pressure (Farrell et al., 1980), may also depend upon Hct.
It is also possible that the high Cag2 of polycythemic fish affected ventilation.
Hyperoxia has been shown to have a depressing effect on ventilation during hypercapnia
(Smith and Jones, 1982) and internal acidosis (Aota et al., 1990; Aota and Randall, 1993)
in rainbow trout. Hyperoxia is also known to have an inhibitory effect on the release of
catecholamines in hypercapnic rainbow trout (Perry et a/., 1989). Since catecholamines
may play a role in stimulating ventilation in rainbow trout (Aota et al., 1990), it is
possible that ventilation may have been depressed via an inhibitory effect of the high
Cag2 on the release of catecholamines. I did not measure [catecholamines], ventilation,
or branchial diffusive transfer of 0 2 in these experiments, and therefore these possibilities
remain to be tested.
The possibility also exists that the decline in Pag2 simply reflects an artefact of
the Pag2 measurement due to an Hf-Hb disequilibrium in the blood leaving the fish gills
(Perry and Gilmour, 1993). In this case the change in pH, over the duration of the Pa02
measurement would tend to lower P a 2 .
It is surprising that the profound arterial hypoxaemia in nomoc~themic and
~olcythemic fish at Ucrit did not appear to impair To2,,, especially in view of the non-
linearity in the relationship of Cao2 versus [Hb] at the higher Hct values, and the
observed decrease in Q,,, in the most p~lycythemic fish. However, it is possible that
with a larger sample of fish with polycythemic Hct values > 42% the curve for Tozmax
may have plateaued, rather than show the linear increase which we described in Figure

68. This points to the problems associated with statistical line fitting, especially for data
with such an inherent variability as in the present study.
At an Hct value of about 40% (and greater), the Pw2 values at Ucrit were similar
in summer and winter fish. This Hct value was similar to that for the peak in the
V02max versus Hct relationship. Therefore, it is possible that the reduction in pwZ
may have caused the significant reduction in VoZmax observed in fish with Hct values >
42%. Circumstantial evidence of a possible causal relationship between P a 2 and
VoZmax has been noted in several mammalian studies. Dempsey et al. (1984)
demonstrated that the exercise-induced arterial hypoxaemia in highly-trained human
athletes could be corrected by exposure to mild hyperoxia. Similarly, Powers et al.
(1989) showed that hyperoxia exposure not only corrects the arterial hypoxaemia, but it
also causes an increase in Vo2max in highly-trained human athletes. Moreover, Jones et
a/. (1993) observed increases in both Vo2rnax and Pw2 for horses running under
hyperoxic, compared with normoxic, conditions.
Other evidence linking arterial hypoxaemia to reductions in Yozmax was reported
in studies with an in situ dog muscle preparation; despite maintaining a constant
convective 0 2 delivery, the V oZmax of the muscle was reduced, due to a concommitant
reduction in Pag2 subsequent reduction in the diffusion of 0 2 to the muscle tissue
(Hogan et a/., 1989, 1990, 1993; Wagner, 1992). significantly, these experiments
demonstrated that there can be a dissociation between VOzmax and oxygen delivery in
dog muscle; this also seems to be the case in the present study. The c o n t i n ~ ~ ~ s increase
in the amount of oxygen being transported to the tissues (i.e., To2) at Hct values > 42%,
Yet the decrease in vOZmax, is Suggestive of an extraction problem at the tissue level,
Possibly due to a diffusion limitation similar to the ~bservations reported for
mammalians.

Conceivably, the apparent relationship between the decline in Y o Z m a x and P q 2
in polycythemic fish may simply have been a coincidence, and the decrease in
may have been caused by other factors. Theoretically, Vo2rnax is a global parameter, so
that a change in Y o Z m a x could reflect changes in any of the steps of the O2 transport
pathway, from atmosphere to mitochondria (di Prampero, 1985; Lindstedt et al., 1988; di
Prampero and Ferretti, 1990; Wagner, 1992, 1993; Jones et al., 1993; Jones and
Lindstedt, 1993). The results of the present study are strongly supportive of the
hypothesis that V o Z m a x is not determined by any single factor in the oxygen cascade
(e.g., [Hb] and (or) T o 2 ) but rather by an interaction between convective and diffusive
factors (Lindstedt et al., 1988; Wagner, 1992,1993; Turner et al., 1993).
Based on my data, the relative contribution of the convective and diffusive factors
appears to vary with Hct (see Chapter 5). In anaemic fish, V02max is clearly perfusion-
limited. In polycythemic fish, VoZmax appears to be diffusion-limited at the site of
oxygen uptake (muscle), in that decreased, despite the increase in the capacity
for internal To2 at Hct values > 42%. This may have been compounded by a reduction
in the transfer of 0 2 at the gills, as evidenced by the Hct-de~endent reduction in Pq2 .
Cost of swimming
Whatever the cause for the decline in Vo2rnax in the present study, it did not lead
to a reduction in exercise performance, as the fish with the highest Hct values were also
the best swimmers. ~n uncoupling of Ucrit and values has been observed
Previously in salmonids. For example, Brett (1964) reported that increased
significantly when coho salmon (Onc~rh~nchus kisutch) s ~ a m in hyperoxic water, but
Ucrit did not change. Similarly, we have observed similar V02max values for cannulated
and uncannulated chinook salmon, although the Ucrit of the cannulated fish was 23%
lower than that of the uncannulated fish (see Appendix 2, Table 4). This uncoupling of
maximal exercise performance and V O ~ ~ ~ ~ has also been noted for mammalians and
may be related to efficiency of locomotion (see Noakes, 1988, Saltin and Rose, 1994).
In view of the above observations, another factor which may play a major role in
setting the upper limit for Hct in rainbow trout is the cost of swimming. The cost of
swimming for salmonids increases as the square of swimming velocity ( U z ) (see
Thorarensen et a/., 1993). Therefore, the diminishing returns in terms of Ucrit with Hct
values above 22% may simply reflect the higher cost of swimming at higher swimming
velocities: for example, the metabolic cost to the most polycythemic fish (mean Hct =
48%) compared with nomocythemic controls (mean Hct z 27%), was about 40% more
for an 1 1 % higher Ucrit (see Figure 9). The survival value of this increased swimming
capability may not warrant the 40% greater metabolic cost of swimming this additional
distance. Furthermore, it may not warrant the expensive production of, and cardiac work
in pumping, about 85% more Hb, nor the costs associated with the detection and
transduction of the signal indicating decreased blood O2 levels, or the costs of cell
~roliferation and protein synthesis associated with erythropoiesis.
Changes in haematological variables associated with swimming to Ucrit
change in Hct at Ucrit
Contrary to our earlier observations with FW rainbow trout (e.g., Gallaugher er
a/., 1992; see Chapter 2, Appendix l ) , Hctr, was not significantly higher than Hct, in the
SW summer fish. Since Hctu was significantly higher than Hct, in all the FW winter
fish. this suggests that a disruption of the osmotic balance of the blood when swimming
in SW may have, in some way, inhibited the haemoconcentration and cellular swelling
responses at Ucrit in the sw summer fish (for fbrther discussion, see Chapter 4).

The fact that the greatest difference between Hctu and Hct, in the winter fish was
observed in polycythemic fish, indicates that Hct may be adjusted downwards in response
to the greater blood viscosity at the lower temperartwe (i.e., 5 "C).
pH and Lactate
Plasma pH affects the Hb-02 affinity (Perry and McDonald, 1993) and so may
also affect To2 in rainbow trout. Resting arterial blood pH (pHa) values for winter FW
fish were significantly higher than those for summer SW fish and were independent of
Hct. pHa is known to be inversely related to temperature in fish (Butler and Day, 1993).
In fact, the difference between pHa at rest in the normocythemic winter, compared with
summer, fish is similar to the dpWdr (difference in pH per difference in temperature) of -
0.017 ~n i t . "C-~ observed in another study with rainbow trout (Randall and Cameron,
1973) and to -0.016 unit.OC-l reported for brook trout (Butler and Day, 1993). Of course,
differences between sw and FW could also explain the differences in the summer and
winter groups of fish; e.g., FW has a higher pH than SW- and SW has a higher [HC03-]
and higher buffering capacity (Tang et al., 1989). However, in a series of studies
Comparing SW-adapted with FW-adapted rainbow trout (10 "C), there were no differences
reported in initial PH, ( ~ a n g et a[., 1988; Tang et al., 1989a,b; Tang and Boutilier, 1988).
Thus, the initial pHa differences in the winter and summer fish of the present study can
almost certainly be attributed to the difference in ambient temperature. These differences
did not affect ~ b - 0 ~ affinity in anaemic and normocythemic summer and winter fish, but
could have been responsible, in part, for the lower Hb-O2 in summer, compared with
winter, polycythemic fish.
Several mammalian studies have suggested that a benefit of polycythemia is the
increased buffering capacity of the blood due to increased [Hbl. In fact, both a smaller

change in pHa and a lower blood [La] have been described for polycythemic, compared
with normocythemic, human athletes at, and during recovery from, maximal exercise
performance (e.g., Spriet et al., 1986). However, the results of other studies are
contradictory and where significant differences are reported, they are generally not
profound (Ekblom et al., 1972; Thomson et al., 1982; Gledhill, 1982; Turner et a/.,
1993). In the present study with winter fish, the decrease in pHa at Ucrit was independent
of Hct. In contrast, summer fish better defended pH, at Ucrit, and while there was no
change in pHa at Ucrit compared with rest, for polyc~themic and normoc~themic fish,
pHa was decreased at Ucrit in anaemic fish. Therefore, it appears that anaemia impaired
buffering, at least in summer fish.
Blood volume
Values for blood volume at Ucrit in normocythemic summer fish fall within the
range of values obtained using the same Evan's Blue dye method in resting rainbow trout
in earlier studies (range = 33 - 62 mL.kg-', see Olson, 1992) Although blood volume at
ucrit in the most anaemic and normocythemic fish groups was the same, blood volume
Was signficantly higher in the most polycythemic fish, compared with nomocythemic
controls. However, the change in blood volume (+ 25%) was not proportional to the
increase in Hct (+ 75%). There is no other information available on the effects of
infusion on blood volume in fish.
In mammals, it is generally thought that an acutely expanded blood volume due to
infusion is rapidly (several hours) corrected by a compensatory reduction in
plasma volume (Gregersen el al., 1959; Gledhill, 1985; Sawka and Young, 1989).
Reports of polycythemia-induced changes in blood volume are contradictory. For
example, although Kanstrup and Ekblom (1 984) reported a slight (+ 4%), but significant,

hypervolemia accompanying a 5% increase in Hct in humans after erythrocyte infusion,
Celsing et al. (1987) noted no significant change in blood volume when Hct was
increased by 15% in humans. On the other hand, there is evidence of an expanded blood
volume in chronically polycythemic humans and this hypervolemia is attributed to an
homeostatic mechanism which acts to dilute the effects of the high Hct and associated
elevations in 11, thereby maintaining constant blood pressure (Castle and Jandl, 1966;
Erslev and Caro, 1984). Based on the above evidence, it seems likely that any
h~pervolemia brought about by erythrocyte inhsion is at the most, very small.
A larger blood volume, as observed in polycythemic summer fish, could reflect
better osmoregulation when swimming in a dehyrating SW environment. Strenuous
aerobic swimming and exhaustive exercise in fish causes fluid shifts between intra- and
extravascular compartments (Yamarnoto et al., 1980; Wood and Perry, 1985; Milligan
and Wood, 1982; Gallaugher el a/., 1992) and possibly a reduced blood volume in sw ello ow tails (Yamamoto et al., 1980). In other experiments that I have conducted, SW-
adapted fish became dehydrated as they swam to Ucrit (see Chapter 4). f'kisma osmolality
of both SW rainbow trout chinook salmon increased, and in chinook salmon, there
Was also a significant reduction in muscle moisture content and body mass (see Chapter
4). It is likely that this degree of dehydration may also be accompanied by a ductio ion in
blood volume as was observed in hyper-osmotic amphibians (see Hillman and Withers,
1988). One benefit of blood doping in human athletes is a reduced dehydration after
maximal exercise performance in heat (Sawka et a[., 1987b). Thus, the larger blood
Volume in polycythemic fish at ucrit may simply mean that their higher blood O2
carrying capacity allowed these fish to better defend their osmotic balance when
swimming to Ucrit in seawater.

Effect of temperature on Ucrit and Vo2rnax
Although the relationship between Ucrit and Hct was the same for both summer
and winter fish, winter fish were slower swimmers. Since the t w ~ groups of fish were
from the same genetic stock, it is most likely that the environmental differences (i.e.,
water salinity and (or) temperature) between these two groups could account for the
observed differences in ~wimming performance. I have found no evidence of differences
between SW-adapted and FW-adapted adult rainbow trout with respect to swimming
performance; e.g., the Ucrit for FW sham-operated fish at 18 "C (2.1 + 0.1 S.E.M. b1.s-1;
Gallaugher et al., 1992, see Appendix 1) agrees with the Uuit for SW normocythemic
fish at 12 - 14 "C in the present study (2.13 & 0.05 S.E.M. b1.s-I).
The solubility of O2 in the plasma would be expected to be lower at the highel
temperatures and the higher salinites experienced by the SW S ~ ~ ~ e r fish, compared with
the F W winter fish (Boutilier et al., 1984; Burggren et al., 199 1). However, it is unlikely
that any associated decrease in Pao2 would cause the carrying capacity of the blood to
fall below the flat upper portion of the O2 dissociation CLU-W ( P ~ v and Reid, 1992), and
SO it is safe to assume that the arterial blood was fully saturated with o2 despite these
differences in salinity and temperature.
Several studies have demonstrated a reduction in swimming performance
associated with lower temperatures in a variety of fish species (Brett, 1964; Griffiths and
Alderdice, 1972; Brett Glass, 1973; Beamish, 1970,1978; Bernatchez and Dodson,
1985; Rome el 1990; Butler et al., 1992; Kolok 1992) including adult (Keen and
Fanell, 1994) and juvenile rainbow trout (Facey and Grossman, 1990). There is
Considerable inter- and intramspecific variability in the degree of reduction observed. In
juvenile rainbow trout, (/,,it was significantly lower (38%) at 5 "C compared with 15 "C
(Facey and Grossman, 1990). There is no informati~n available for swimming
performance differences in adult rainbow trout at 5 "C and 13 "C, although Keen and
Farre11 (1994) noted reduced (25%) Ucrit values for uncannulated adult rainbow trout
swimming in FW at 8 OC, compared with I8 "C. Brett (1964) observed reductions of 10%
and 20% in Ucrit for uncannulated yearling (35 - 55 g) sockeye salmon (Oncorhynchus
nerka), at 10 "C and 5 "C respectively, compared with 15 "C, and Butler et al. (1992)
observed a 15% decrease in Ucrit values of uncannulated (320 - 520 g) adult brown trout
(Salmo trutta), swimming at 5 "C, compared with 15 "C. In the present study, Ucrit was
reduced by more than 25% in normocythemic winter fish at 5 "C, compared with summer
fish at 13 OC. In general then, for adult salmonids, the decrease in Ucrit with temperature
appears to be about 15 - 30%, for a 10 "C decrease in temperature.
There are several possible explanations for the temperature-induced reduction il,
swimming performance; for example, the drag that the fish must overcome when
swimming should increase the energetic cost of swimming when water viscosity is
increased at lower temperatures. Weihs (1984) states that water viscosity is 30% greater
at 10 OC, compared with 20 "C. In addition, temperature has a direct effect on muscle
fibre contractility. For example, maximal muscle fibre shortening speed and maximal
Power output are significantly reduced with acute exposure to low temperatures (e.g., the
Q lo for maximal muscle fibre shortening speed in carp red r ~ ~ ~ l e is 1.63 between 10 "C
a d 20 OC; Rome el 1990). This has been directly linked to a reduction of about 33%
in the maximal sustainable swimming performance of carp swimming at 10 "C, compared
with 20 OC (Rome et al., 1990). ~ ~ ~ l i m a t i z a t i o n to low temperatures produces a number
of anatomical and (or) physiological responses in fish Inuscle fibres which may
for the reduced muscle fibre power output at low temperatures (Sisson and
Sidell, 1987; Johnson el al,, 1990; Johnson and Johnson, 1991; Rome et ale, 1990; see
Webb, 1993) and there is evidence of compensatory responses in carp oxidative skeletal
muscle (Langfeld et al., 1991) and in rainbow trout cardiac muscle in response to low
temperature acclimation (Graham and Farrell, 1989).
Despite the differences in Ucrit between summer and winter fish, the curve for
Vozmax in these two groups of fish was identical. This is surprising because the general
findings indicate that Vo2 is reduced in concert with reductions in enviromental
temperature. For example, Butler et al. (1992) measured a decrease (22%) in standard
Vo2 (Yozrest) in b r o w trout at 5 "C, compared with 15 "C. They did not measure
VoZmax at Ucrit, and therefore it is not known if a change in Vo2rnax was associated
with the 15% decrease in Ucrit. Brett (1964) observed 30% and 4 5 % increases in
VoZrest of yearling sockeye salmon (Oncorhynchus nerka) when the temperature was
increased from 5 "C, to 10 "C and 15 "C, respectively. In the same study, v ozmax values
were 20% and 45% higher in fish at 10 "C and 15 "C respectively, compared with 5 "c. In
lake whitefish (Coregonus clupeoformis), VOzmax W* 35% higher at 12 "C, compared
with 5 "C (Bernatchez and Dodson, 1985) and in largemouth bass (Micro~terus
"almoides) the Q lo values for V 02rest and ~o~~~~ (across the range from 10 "C - 30 "C),
were 1.32 and 1.65, respectively. ~ h u s , for the above species there is evidence of a
significant depressing effect of lower temperatures on both ~02res t and V02max, over
the temperature range 5 oc - 15 "c. ~t is not clear why this was not the case for rainbow
trout in the present study. Vo2rnax was not significantly different in operated and
unoperated chinook salmon (see Appendix 2, Table 4). Therefore, the less severe surgery
in winter fish, with summer fish, does not explain the higher values for
'02max.
Another way to assess swimming performance and Oxygen is to
examine the cost of swimming (Brett, 1964; Webb, 1971 ; Jones and Randall, 1978). By
assuming that winter fish had VOzrest values I those of summer fish, and with the
observed 25% lower Ucrir in these fish compared with summer fish, the cost of swimming
must have been at least 25% higher in winter, compared with summer, n~rmocythemi~
fish. Using the data of Brett (1964) and Webb (1975), Jones and Randall (1978)
estimated that the cost of swimming was lower in yearling sockeye salmon at 5 "c, compared with 15 "C, at the lowest swimming velocities. However, the cost of
swimming, per kilometer, increased much faster at 5 "C, compared with 15 "c, as
swimming velocity increased from 30 to about 55 cm set-l. This indicates that there is a
significant reduction in the temperature-dependence of the cost of swimming with
increasing velocity in this species. The Ucrit values for the winter fish in the present
Study fall within this swimming velocity range.
Perhaps the best explanation for the identical curve for Vo2rnax in winter and
Summer fish comes from the argument that fish attain Vo2rnax when making maximal
effort, regardless of swimming velocity (Jones & Randall; 1978).
Conclusion
The results of this study call for a complete revision of the Hctopt hypothesis as it
applies to TO^, v~~~~~ , Swimming performance in rainbow trout. On one hand, I
have clearly demonstrated that in anaemic SW rainbow trout at 13 "C, the reductions in
C a ~ 2 cause reductions in T02, V 0 2 ~ ~ ~ , and exercise performance. Therefore, the lower
limit for Hct in this species (i.e., - 22%), is rob ably determined by the reduced capacity
for the internal convection of o2 to the locomotory musculature and other tissues. These
findings are consistent with the Hctopt hypothesis. However, in contradiction to my
Working hypothesis T o 2 increased with Hct up to the highest values tested, as did
perfommce. There was no evidence of an Hctopt for either T02 or uci,,it.
This was also true for T~~ and ucrit at a lower temperature of 5 O C , despite the assumed

increase in q. Moreover, although there was a peak for versus Hct, the optimum
k t (42%) was considerably higher than the normocythemic range for this species.
Therefore, the concept of an HctOpr does not relate to ucrit in rainbow trout, at either 5 "C
Or 13 "C, and if it does relate to V02max, it only applies to Hct values well beyond
nomocythemia.
Although I was unable to clearly define which factors set the upper limit for Hct
in this species, several possible factors were revealed in my experiments. To begin with,
'1 did constrain cardiac performance, as predicted. However, Qmm was only reduced
when Hct values were close to double the normal Hct, value. Therefore, viscosity effects
on cardiac work are probably not a primary determinant of the upper limit for
nOrm0cythemia in rainbow trout. An alternative factor involved in setting the upper limit
for Hct could be exercise-induced arterial hypoxaemia. The observed Hct-dependency of
this arterial hypoxaemia suggests that there is a transition from perfusion limited O2
t r ~ s p o r t in anaemia to diffusion limited 0 2 transport in polycythemia. The Hct-
dependence of this hypoxaemia is to my knowledge, novel. Although arterial
h ~ ~ o x a e m i a has been well described for athletic mammals during strenuous exercise, it
has not before been linked to Hct.
Another factor which may be involved in setting the upper limit for Hct in
rainbow trout is the cost of swimming at high velocities. V02max increased more rapidly
than the increase in swimming velocity for fish with Hct values above about 22%.
Therefore, the rapidly accelerating costs associated with very small increments
in ucrit (and thus decreasing benefits in survival ~otential) may be involved in setting the
Hct limit. 1f the cost-benefit ratio of [Hb] to swimming performance is assessed, it
may prove that in terms of swimming ability the benefits derived from the additional Hb
do not merit the additional cost of maintaining this s u ~ ~ ~ - ~ ~ ~ ~ ~ LHb1.

Taken together, my data strongly suggest that the viscous effects of elevated Hct
in rainbow trout are significant only at Hct values well beyond the normal range. The
absence of a temperature effect is particularly damaging for the Hctqr hypothesis as it
relates to T o 2 in swimming rainbow trout. Thus, the lower limit for Hct in rainbow trout
is clearly set by a reduced capacity for O2 delivery, but the major factors setting the upper
limit are unclear. Moreover, since there was an increase in both Uc,it and V o Z m a X as a
function of T o 2 across the normocythemic Hct range, my data also suggest that exercise
Performance in nomocythemic fish is limited by the capacity for internal oxygen
convection.
Finally, although the HctOpr hypothesis does not apply to To2 in swimming
rainbow trout, I suggest that the viscous effects on maximum cardiac performance could
be more significant in other vertebrates, particularly those such as the Antarctic
haemoglobin-free icefish and amphibians, that have hearts with a lower pressure-
generating capacity, compared with mammals and rainbow trout. Alternatively, Hct may
be optimized for some other function in rainbow trout.
The above expeiments have demonstrated the effects of an acute change in Hct
On exercise perfommce in rainbow trout. The following chapter studies the effects of
the chronic stimulus of exercise-training on changes in Hct, T02, and exercise
Performance in chinook salmon.

Chapter 4 Effects of aerobic exercise-training on oxygen transport and swimming performance
in chinook salmon (Oncorhynchus tshawaytscha )
Introduction
In the previous chapter (Chapter 3), I reported that experimentally-induced
Polycythemia led to significant increases in both and ucrit for rainbow trout.
Gains in exercise performance were associated with polycythemia at Hct values well
beyond normocythemic range. These improvements would be expected to carry some
selective advantage in nature, given the active lifestyle of rainbow trout. This chapter
addresses the plasticity (or compliance to external influence) of the phenotypic expression
of Hct in another salmonid species, the chinook salmon, in relation to internal To2,
Swimming performance and V 02rnax.
The experimental approach was to exercise-train fish aerobically in an attempt to
induce improvements in To2, and thus, in exercise performance. The observations of
effects of aerobic exercise training on cardiovascular function, exercise performance and
'ozmax in mammals (see Blomqvist and Saltin, 1983), and on cardiovascular function
and exercise in fish (see Davison, 1989; Farre11 al., 1990, 1991) formed
the basis for this approach. Fmhermore, the results of Chapter 3 suggested that To2 may
limit YoZmax in normocythemic fish.
Numerous studies exist for aerobic exercise-training in salmonids, but evidence of
in To2 capacity and (or) Ucrit, where measured, is equivocal, and
moreover, there are no reported measurements for v02max . Hochachka (1 96 1) observed
a 25% increase in [Hb] in trained rainbow trout fingerlings (swimming continuously at 30
Cm.sec-1 for 6 months at 4 OC), with untrained fish (swimming continuously at
1 cm-sec-l), and a concommitant increase (+ 20%) in heart size relative to body mass.
Zbanyszek and Smith (1984) 15% and 22% increases in [Hb] in coho salmon

(Oncorhynchus kisutch) smolts exercise-trained for 4 h per day for I2 weeks (1 5 - 18 OC)
at 1 and 2 blesec-1, respectively. In contrast, Davie et al. (1986) found no evidence of an
improved capacity for To2 in trained (swum continuously at 1 blsec-I for 200 days;
water temperature not reported), compared with untrained (held in still water for 200
days) FW adult rainbow trout; there were no training effects on Hct, [Hb], [ATP]/Hb, Hb-
0 2 , or heart size (relative to body mass). Woodward & Smith (1985) noted a
significantly lower (1 5% - 20%) yo2 at rest and at 3 b1.s-I in trained (swimming at 1.5
bl.s-l, 8 h per day and 5 days per week for 6 weeks at 20 "C), compared with untrained
(swimming continuously at 0.2 b1.s-1) adult freshwater (FW) rainbow trout. Hct was not
different in the two groups of fish. Similarly, Nahhas ef al. (1982) observed an overall
lower V o2 (measured at each training velocity) for trained (swimming at 1.4, 2.2 and 3.5
bl.sec-1 for 46 days at 6 OC), with untrained (held under the same conditions but
in still water) FW juvenile rainbow trout (6 cm in length).
The evidence for training effects on swimming performance varies between
Studies. In the above study, Nahhas el a/. (1982) reported significantly higher values for
ucrit for juvenile rainbow trout trained at high water velocities (i.e., 3.5 bl.s-'), compared
with low velocities (i.e., 1.4 b1.s-1). Since haematological parameters were not measured
in this study, it is not know whether the improved swimming performance, or the lower
V O ~ of trained fish at each swimming velocity, was correlated with training effects on
To2. An increase of about 15% in Ucrit was associated with an 1 1% increase in [Hb] in
response to exercise-training (swimming continuously at 2 or 3 bl.sec-' for 30 days at 25 O
C) in young (1 5 - 40 g) largemouth bass (Micropterus salmoides) (Farlinger & Beamish,
1978). Besner and Smith (1983) observed very significant increases in the Ucrit of
Juvenile coho salmon trained for 40 days at 15 OC; i.e., increases of 55% and 76% in fish
trained at 1.5 ~ I . ~ - I and 2 ~ I . ~ - I , respectively, but no m ~ ~ u r e m e n t s of T02 were made.


and Goldspink, 1978). Intraspecific variation in heart size in rainbow trout may also be
linked to exercise exposure. For example, populations of wild rainbow trout (lake-
dwelling and anadromous) have larger ventricular mass compared with hatchery-reared
fish (Graham and Farre]], 1992). These observations are supported by the observation
that exercise has a stirnulatory effect on cardiac protein synthesis in rainbow trout
(Houlihan et a( 1988). Graham & Farrell (1 992) also reported evidence of higher [Hb] I
for wild, compared with hatchery-reared, populations of this species.


The major benefit derived from the training effect on Hct (and V02max) was
apparently related to blood flow distribution, rather than to Ucrit. We observed that blood
flow in the intestinal artery (qIA) was better maintained in the HS1 group as Vo2
increased with swimming velocity (see Appendix 4, Figure 2A, Figure 3). We suggested
that this was possible because the greater To2 associated with the higher Hct of the HSl
fish meant there was less need to redistribute blood away from the intestines, and toward
the working muscles, during swimming (see Appendix 4, Figure 4). Therefore, we
concluded that the Hct-induced increase in To2 may benefit the fish in ways other than
providing for the 0 2 demands of locomotory muscles during swimming.
A specific physiological function that may benefit from increased T o 2 is
osmoregulation. Among the various cardiovascular adjustments which are associated
with increased Vo2 during strenuous aerobic exercise is an increase in the functional
surface area of the gills through lamellar recruitment (Booth, 1979; see also Wood and
Perry, 1985). However, any changes in the gill surface area to facilitate Vo2 may also
affect the diffusion of ions and (or) water between the environment and the gill tissues
and blood, and hence has the potential to disrupt the acid-base and osmotic balance of the
fish (Randall et al., 1972; Nilsson, 1986). The extent of this potential conflict at the gills
is dependent on the salinity of the environment.
Evidence of small fluid shifts from the environment into the body have been
observed in adult rainbow trout swimming aerobically in FW (Wood and Randall, 1973).
Thus, the rate of water gain via the gills temporarily exceeds the rate of water loss via the
kidneys in these fish. SW teleost fish are hypo-osmotic to their environment (i.e., natural
full-strength SW is about 700 mOsm, compared with a plasma osmolality in salmonids
which ranges from 250 -350 mOsm) (Eddy, 1982). Moreover, the diffusive capacity of
the gills of SW fish is greater than for the gills of FW fish (Evans, 1979; Laurent and

Hebibi, 1989). Therefore, SW fish are faced with a possible dehydration and potentially
greater ion and water imbalances, compared with FW fish. A compounding factor is that
SW fish drink seawater in order to replenish the water lost via difhsion across the gills
(Evans, 1979). Therefore, any reduction in q,, which occurs during swimming will
likely compromise the absorption of water across the gut (Thorarensen et al., 1993, see
Appendix 4). Ionic and water imbalances have previously been observed during
strenuous aerobic swimming in seawater tilapia (Tilapia nilotica) (Farmer and Bearnish,
1969; Febry and Lutz, 1987), Atlantic salmon (Salmo salar) (Byme et al., 1972), and
rainbow trout (Rao, 1968, 1969; Webb, 1975).
This temporary dehydration in exercising SW fish may affect aerobic capacity.
Dehydration-related reductions in aerobic swimming performance have been reported for
juvenile salmonids after acute transfer from FW to SW (Houston, 1959, Brauner et al.,
1992). The relationship between osmoregulatory capacity and swimming performance
and V ozrnax has not been well-investigated in adult salmonids, chronically adapted to
SW.
The processes involved in the restoration of ionic and osmotic imbalances are
metabolically expensive (Gonzalez and McDonald, 1994). Although estimates for the
cost of osmoregulation for strenuous aerobic swimming in both FW and full-strength SW
are highly variable (see Febry and Lutz, 1987), results from several studies with a number
of different species, including rainbow trout, indicate that the cost of osmoregulation may
be escalated to as much as 20% of the net cost of swimming at velocities approaching
Ucrit (Rao, 1968; Farmer and Bearnish, 1969; Webb, 1975; Febry and Lutz, 1987).
Presumably, fish with a higher aerobic capacity would be better able to cover this cost
and thus defend their ionic and osmotic balance while swimming to Ucrit. In TR1, we
showed that Vo2, but not Ucrit, is linked to Hct in chinook salmon (see Appendix 4,

Equation 3). Therefore, I hypothesized that a different benefit for the relationship
between Hct and aerobic scope may be the ability to maintain osmotic and ionic balance
during strenuous aerobic swimming in SW.
Based on the results of TR1 (Appendix 4), it was concluded that either there is
very little flexibility for change in the cardiovascular system of these fish, or
alternatively, that the exercise regime which we had employed was not extreme enough to
elicit more significant changes in the system. With this in mind, I collaborated with the
same colleagues in a more strenuous training experiment (TR2), using the same fish as
used in TR1 (i.e., LS 1 fish that were not sampled upon the completion of TRl, but held in
the same tanks swimming at 0.5 b1.s-I). My purpose was to determine if this training
regime would elicit even greater increases in Hct, [Hb] and Cao2, and if any such effect
was correlated with a training effect on the ability to defend osmotic balance when
swimming in SW.
Materials and Methods
Experimental Animals
The LSl fish held-over from TR1 were divided into two groups. One group
continued to swim continuously at 0.5 b1.s-I for the duration of the experiment (low speed
trainees, LS2). The other group of fish was trained (high speed trainees; HS2) in the
following manner: on alternate days during the first month, the fish swam every other day
at 1 bls-1 for 20 min, and swimming velocity was subsequently increased in steps of 0.5
bl-s-1 and 10 min duration, until either Ucrit or 3.5 bl-s-1 was reached. After the first
month, the intensity of the training was increased, so that the fish swam for 20 min at
each velocity. This procedure lasted approximately 2 h. When this training regimen was
not being applied, these fish swam at 0.5 b1.s-1. Both groups of fish were fed satiation
levels of dry pellets on the non-training days via an automatic food dispenser. During the
four month duration (November through February) of the training period, water
temperature ranged from 8 - 10 "C. Further description of the training tanks and
husbandry are described elsewhere (Kiessling et al., 1994a).
Growth during the four month training period was identical in the two groups of
fish; there was an overall weight increase of 15% (P > 0.05) (Kiessling et al., 1994b).
For the two tanks of LS2 fish, initial body mass was 326 g and 359 g, respectively, and
final body mass was 388 g and 386 g, respectively. Inital body mass for the two tanks of
HS2 fish were 341 g and 335 g, respectively, and final body mass was 388 g, and 386 g,
respectively. Final length of the fish ranged from 3 1 - 33 cm.
Surgical Procedures
Fish were transferred from the large outdoor training tanks to indoor holding tanks
(20 L of continuously flushing natural SW; water temperature, 9 - 10 "C), 24 h prior to
surgery. Fish were not fed during this time. A cannula was inserted into the dorsal aorta
and a Doppler flow probe was implanted on the ventral aorta, using the surgical
procedures described in Chapter 3. The Doppler flow probes were calibrated in situ using
a Transonic flow probe, as described by Thorarensen (1994). The fish recovered from
surgery while swimming freely in the 20 L tanks for at least 24 h prior to being
transferred to the swim tunnel.
Measuring swimming performance, oxygen uptake and Q, and blood sampling
Before initiating the swimming step test, fish were held in the swim tunnel
overnight. Measurements of Uoit and V 0 2 were determined using the method described
previously (Thorarensen et al., 1993; Appendix 4). Water temperature in the tunnel was

the ambient temperature (9 - 10 "C). After swimming to UCrit, and following a one hour
recovery period, fish were removed from the swim tumel and weighed.
Data for Q were collected as described in Thorarensen (1994).
Initial blood samples (1.0 mL) were drawn via the DA cannula from fish at rest
(i.e., at 5 - 10 cmes-1 water velocity in the swim tunnel with the fish not swimming), at 1.5
b1.s-I, and subsequently at every velocity step after the fish appeared to approach Ucrit.
Ucrit blood samples were always drawn while the fish was swimming. In some cases this
required a reduction of velocity by 1 step (see Gallaugher et al., 1992; Appendix 1).
Blood samples were also drawn after one hour of recovery. Each time blood was
sampled, Pag2, pH,, Cag2, Hct, [Hb], and plasma osmolality were determined. Plasma
[La] was measured in the rest, Ucrit and recovery samples only. Blood used to measure
Pag2 and pHa was returned to any of the remaining blood, the total volume was made up
to 1 .O mL with blood from a normocythemic donor, and this blood was reinjected into the
fish (see Chapter 3).
Haematological analysis
Measurements of Pag2, Cag2, Hct, [Hb], MCHC, and [La] were made following
the procedures described in Chapter 3. Plasma osmolality was measured in triplicate on
10 pL samples using a calibrated Wescor (5100) Vapour Pressure Osmometer (Wescor,
Logan, Utah).
Measurements of muscle dry matter
Analyses of muscle dry matter and ash content were performed on LS2 (N = 20)
and HS2 fish (N = 20) after the training experiment was terminated following the
procedure described in Kiessling et al. (1994b). Similar analysis was performed for LS2
(N = 8) and HS2 (N = 8) fish after swimming to Ucrit in the swim tunnel and the
subsequent 1 h recovery period. Analysis was carried out in accordance with standard
procedures: drying in 100 "C for 16 - 18 h ( muscle dry matter, % of tissue wet weight)
and 3 h in 600 "C (ash content, % of tissue wet weight).
Control experiment
During the course of this study, we observed evidence of a swimming-induced
disruption in osmotic balance. To determine if this was in some way linked to the effects
of the invasive placement of the Doppler flow probes, we conducted a control experiment
using the HS2 fish (although the training regimen had been discontinued for
approximately 2 weeks). This group of fish (Control fish) received a DA cannula only;
all other aspects of this control study were the same as described above.
Data acquisition and statistics
Signals from the flow meter, pressure transducer and oxygen meter were obtained
as described by Thorarensen et al. (1993) (See Appendix 4).
Statistical analysis of haematological variables at different swimming speeds for
the two training groups was by ANOVA. Changes in haematological variables within
each group was analyzed by a paired t-test for means. Correlative analysis for
haematological variables was by SAS using Pearson Correlation Coefficients. Other
variables reported (heart mass, growth data, muscle dry matter and ash content, skeletal
red muscle) were analyzed by SAS using the General Linear Models procedure.
Results
Training effects on haematological variables
Training effects (i.e., HS2 versus LS2) on blood O2 carrying capacity were
evident, but minimal, in this group of chinook salmon. [Hb] was significantly higher, at
rest, at - 80% Ucrit, and after 1 h of recovery, but not at Ucrit (Table 4). In contrast, Hct

Table 4. Haematological variables for the two training groups of chinook salmon (LS2, HS2) at rest, - 80% Ucrit, Ucrit, and after one hour of recovery from Ucrit.
Hct (%)
Rest
29.7 (0.8) N = 9
31.8 (1 4
N = I0
11.4 (0.3) N = 9
13.2 a (0.8)
N = 10
3 85 (14)
N = 9
4 13 (12)
N = 10
13.7 (0.5) N = 9
14.9 (1.2) N = 9
12.98 (0.63) N = 9
13.9 (0.91) N = 10
7.93 (0.03) N = 9
7.91 (0.02) N = 10
Recovery
28.4 (1.7) N = 9
31.4 (1.3)
N = 10
11.0 (0.5) N = 9
12.8 a
(0.7) N = I0
390 (15)
N = 9
3 84 (19)
N = I0
13.8 (1.1) N = 7
14.7 (0.8) N = 9
11.18 * (0.76) N = 8
11.14 * (1.23) n = 7
7.8 * (0.03) N = 8
7.82 * (0.03) N = 7
Mean
29.4 (0.7) N = 9
32.3 a (0.7)
N = I0
11.4 0.2
N = 9
13.1 a 0.4
N = 10
388 (7)
N = 9
408 a
(1 0) N = I0
13.9 (0.3) N = 7
14.7 (0.5) N = 9
Numbers in parentheses are +I- S.E.M. a Significantly different from LS2 (P < 0.05) * Significantly different from values at rest (P < 0.05)

was significantly higher at Ucrit, but not at rest, - 80% Ucrit or after a 1 h recovery. The
overall means for Hct, [Hb], and MCHC were significantly higher in HS2 fish (Table 4).
However, despite the changes in Hct and [Hb], Cao2 was not significantly higher in HS2
fish.
Compared with values reported for LSl and HS1 fish, Hct, [Hb], C w 2 and
MCHC at rest, were all significantly higher in both LS2 and HS2 fish (see Tables 1-4,
Appendix 2).
Neither Hct, [Hb], nor MCHC changed with swimming velocity in either LS2 or
HS2 fish, nor were they significantly different following 1 h of recovery, compared with
resting values (Table 4).
Compared with resting values, P a 2 was significantly reduced at all swimming
velocities, and during recovery in both LS2 and HS2 fish, and was significantly lower at
Ucrit in HS2 fish, compared with LS2 fish (Table 4). Despite this arterial hypoxaemia.
C w 2 at Ucrit was unchanged, compared with values at rest.
pHa was the same in both LS2 and HS2 fish, and was significantly decreased at
all swimming velocities, and following 1 h of recovery, compared with rest (Table 4).
Likewise, plasma [La] changed similarly in both groups of fish, increasing significantly at
Ucrit, compared with rest, and increasing further after a 1 h recovery. For LS2 and HS2
fish respectively, ([La] at rest = 0.4 mmo1.L-I + 0.1 S.E.M. (N= 5) and 0.8 mmol-L-I + 0.2
S.E.M. (N=9); at Ucrit = 3.6 mmo1.L-I f 0.4 S.E.M. (N=6) and 3.0 mrno1.L-' + 0.4 S.E.M.
(N=8); after a 1 h recovery = 4.6 mmo1.L-I + 0.7 S.E.M. (N=6) and 5.1 mmo1.L-I + 0.8
S.E.M. (N=8).

Swimming performance and maximal oxygen uptake
Ucrit values for LS2 and HS2 fish were not significantly different; i.e., LS2 = 2.15
bls- ' f 0.08 S.E.M. and HS2 = 2.3 1 b l ~ ' f 0.06 S.E.M. (P<0.05) (see Appendix 2, Table
4). Ucrit values were identical to those for fish in TRl, despite the significant differences
in blood O2 carrying capacity between the fish in the two studies (See Appendix 2, Table
4). V 02max for HS2 fish was a significant 35% higher compared with LS2 fish (i.e., 366
pmol.kg-Ismin-' k 28 S.E.M. vs 244 pmolakg-'.min-' k 31 S.E.M., for HS2 and LS2 fish,
respectively) (see Appendix 2, Table 4). While V 02max values for the LS2 fish were the
same as those for LS1 fish, the Vo2max for HS2 fish was a significant 15% higher
compared with HS1 fish (see Appendix 2, Table 4).
Effect of exercise training and swimming to Ucrit on water balance
Compared with body mass values measured prior to surgery, body mass was a
significant 8%, 5% and 5 % lower after a 1 h recovery following a swim to Ucrit in LS2,
HS2 and Control fish, respectively (Table 5). There was no significant difference in the
degree of dehydration between HS2 and LS2 fish.
Muscle dry matter, as a percentage of tissue wet weight, was significantly higher
in HS2, compared with LS2 fish; i.e., 25.8% f 0.4 S.E.M. vs 24.7% f 0.4 S.E.M. (P <
0.05) for HS2 and LS2 fish, respectively (Figure 11). Ash content (as a percentage of
tissue wet weight) was also significantly higher in HS2, compared with LS2 fish; i.e.,
1.56% f 0.03 S.E.M. vs 1.51% f 0.03 S.E.M. (p < 0.05) for HS2 and LS2 fish,
respectively. Muscle dry matter (mean value for LS2 and HS2 fish = 27.4% of tissue wet
weight f 0.40 S.E.M.) and ash content as a percentage of tissue wet weight (mean value
for LS2 and HS2 fish = 1.75% of tissue wet weight + 0.03 S.E.M.) were significantly

higher in fish which had completed a Ucrit swim, followed by a 1 h recovery period in the
tunnel, compared with fish sampled directly from the training tanks (P < 0.01) (Figure
12). There were no significant differences between the HS2 and LS2 fish after the swim
to Ucrit and the subsequent 1 hour recovery in the swim tunnel.
Plasma osmolality was significantly increased at - 80% Ucrit, Ucrit and after the 1
h recovery period, compared with rest, in LS2, HS2 and control fish (Table 5, Figure 12).
Plasma osmolality was significantly lower in HS2, compared with LS2 fish, at - 80%
Ucrit, and at Ucrit. Therefore, despite the similar level of overall dehydration, HS2 fish
were better able to defend plasma osmolality while swimming to Ucrit (Table 5, Figure
12). Plasma osmolality at rest, and after the 1 h recovery period was not significantly
different in LS2 and HS2 fish (Figure 12, Table 5).
Heart size
Ventricle mass was significantly larger (P < 0.05) for HS2, compared with LS2
fish; the ventricle index (% of body mass) was 0.1 14 f 0.003 S.E.M. for HS2 fish (N=
12) and 0.101 + 0.003 S.E.M. for LS2 fish (N=12).

Table 5. Body mass and plasma osmolality at rest, at Ucrit, and after one hour of recover), from Ucrit in LS2 and HS2 training groups of chinook salmon, and in chinook salmon from the control experiment.
Rest Ucrit Recovery
Control fish
Plasma LS2 330 396 * 3 70 Osmolality (12) (12) (mosmol.kg-') N = 9 N = 9 N = 7
(31)
Control fish 302 339 * (7) (1 1)
N = 6 N = 6
Numbers in parentheses are +I- S.E.M. * Significantly different from rest (P < 0.01) a Significantly different fiom LS training group (P < 0.01) Control fish received a DA cannula only; LS2 and HS2 fish received both a DA cannula and a Doppler flow probe implanted on the VA.

Figure 1 1 . Muscle dry weight of LS2 and HS2 training groups of chinook salmon and
muscle dry weight of both LS2 and HS2 chinook salmon one hour after
swimming to Ucrit in a swim tunnel (Ucrit). a = significantly different fiom
LS2, b = significantly different from HS2, (P <0.05).


Discussion
Eflects of endurance training on blood oxygen carrying capacity
The nature of the training regimen in TR2 was very different from that of TR1.
We considered that the regime which the HS2 fish experienced was a more strenuous
form of aerobic exercise-training than experienced by the HS1 fish. Although over the
120 day training period, the HS2 fish swam less total distance (i.e., about 130 km)
compared with the total distance swum by HS1 fish during the 240 day training period
(i.e., about 700 km), the HS2 fish were required to routinely swim to VoZmax
Moreover, there was a burst swimming component to the regime for these fish which was
not present for the HSl fish; i.e., in contrast to steady continuous swimming at 1.5 bls-1
(i.e., - 60 % Ucrit), swimming to Ucrit involves burst swimming as the fish approaches
fatigue. In terms of energy expenditure, 20 sec of burst swimming is considered to be
equivalent to about 15 min of maximum sustainable swimming or about 3 h of basal
metabolism (Brett, 1983).
There were additional differences between the training regimens of HS1 and HS2
fish. Since the HSl fish were never experimentally challenged to swim to V oZmax, any
osmo-respiratory compromise was likely to be less severe than for HS2 fish. Moreover,
the protocol used to induce the fish to swim to Ucrit involved a number of potentially
disruptive factors including noise, interruptions and some physical contact. This type of
stress has previously been associated with disruptions in osmoregulation (Stevens, 1968).
Furthermore, the two training studies were conducted in different seasons; TR2 was
conducted during the Winter (November to February) whereas TR1 was conducted from
the Spring through to the Fall (March to October). There were also slight differences in
the range of ambient temperatures during the two studies ji.e., 9 - 11 "C, TR1; 8 - 10 "C,
TR2). Finally, the rate of growth for HS2 fish was slower, compared with HS1 fish. This

Figure 12. Changes in plasma osmolality in LS2 and HS2 training groups of chinook
salmon at rest, while swimming to Ucrit, at Ucrit , and after a one hour
recovery following Ucrit. (Filled squares, dashed line, LS2 training group;
Open squares, solid line, HS2 training group; * significantly higher than
resting values, P < 0.01; a, significantly higher values compared with HS fish ,
P < 0.01).

Rest 1 bl*sec-' 80% U,,it Ucrit Recovery
Swimming Velocity

was to be expected based on the fact that HS2 fish were only fed every other day,
compared with the daily feeding routine for HS1 fish (see Kiessling et al., 1994b).
Moreover, the initial body mass of the HSl fish was smaller (i.e., - 70g versus - 350 g,
for the HS1 and HS2 groups of fish, respectively) and therefore the growth rate was
relatively higher, compared with the larger HS2 fish. Clearly, TR1 and TR2 were very
different, and theoretically, the different effects elicited by exercise-training in the two
studies could be attributed to any of the above-described differences.
Simlar to the results of TRl, there was a training effect on Hct and [Hb] in TR2,
although the changes were less profound (i.e., mean Hct was 23% for LS1 and 27% for
HSI fish versus 29.4% in LS2 and 32.3% in HS2 fish). Moreover, the higher Hct ([Hb])
of HS2 fish was not reflected in a significantly higher Cao2 in this group of fish,
compared with LS2 fish. The observation that the differences between the mean Hct and
[Hb] values for LS2 and HS2 fish were not as profound as the differences between LSl
and HS1 fish may be indicative of a limited scope for erythropoiesis in chinook salmon,
particularly since the value for Hct, in the HS2 fish was the highest of all Hct, values that
were measured in either chinook salmon or rainbow trout (see Appendix 2, Table 1). The
disproportionate increases in [Hb], relative to Hct, were reflected in significantly higher
MCHC values for both LS2 and HS2, compared with LS1 and HS1 fish. Therefore, if the
32% Hct value of the HS2 fish represents an upper limit for normocythemia in this
species, further increases in blood O2 carrying capacity induced by exercise-training and
(or) temperature and seasonal effects could have been invoked by adding more Hb to each
red blood cell. Moreover, if 32% does indeed represent the upper limit for
normocythemia in chinook salmon, this may explain the lack of plasticity in Hct in
response to this training regimen.

The differences observed between all of the parameters of blood O2 c m i n g
capacity in LSl and LS2 fish was unexpected, since these were the same fish and, with
the exception of the duration of the training period, they were exposed to the same
training regimen. Therefore, the differences in Hct values for LS1 (23.3%) and LS2 fish
(29.7%) cannot be attributed to training effects.
There are several alternative explanations for these differences. A number of
studies have examined the possibility of temperature and (or) seasonal effects on Hct and
(or) [Hb] in fish. However, the findings are contradictory (see Chapter 1). Since the
mean ambient SW temperature during the two training studies only varied by 1 - 2 OC, it
seems unlikely that the differences observed between Hct, [Hb] and Cag2 values for LS1
and LS2 fish were related to temperature differences. On the other hand, chinook salmon
are known to be particularly sensitive to low temperatures (Anders Kiessling, personal
communication), and the minimum temperature of 8 "C during TR1 could represent a
lower threshold for erythropoiesis. There also exists the possibility that these differences
could be related to seasonal effects on erythropoiesis. Increases in Hct and [Hb] have
been linked to "winter" (short day) photoperiod in rainbow trout (Tun and Houston,
1986). Finally, the differences in Hct for LS1 and LS2 fish could possibly have been the
result of blood loss in the TR1 fish due to the use of more invasive surgical procedures;
i.e., the surgery employed in the placement of the intestinal artery flow probe involved
excision of the lateral body wall. Since Hct values were not determined at the beginning
of the TRl study, it is not clear to what extent Hct changed in the LS1 fish over the
duration of the study. Based on the Hct values observed for the LSl fish at the
termination of TR1 (i.e., 23.3%), it could be assumed that the initial Hct values for both
LS2 and HS2 fish were also about 23%. This would indicate that Hct increased by 30%
(i.e., from 23.3% to 29.7%) in the LS2 fish over the duration of the study. This would

seem to be unlikely, and therefore the possibility exists that invasive surgical procedures
may have been responsible for an under-estimation of Hct in both groups of fish from
TRl .
Effect of exercise training on swimming performance and oxygen uptake
The absence of a training effect on Ucrit in this study agrees with the findings of
TR1. Previous studies have reported contradictory findings with regard to training effects
on swimming performance in rainbow trout; e.g., positive training effects on Ucrit were
observed by Nahhas et al. (1982), Besner and Smith (1983) and Farrell et al., (1990),
whereas no training effects were observed by Farrell et al. (1991).
The lack of correlation between Hct and Ucrit in the present study was similarly
observed for both groups of fish in TRl. Based on the results showing a lack of
correlation between Hct and Ucrit for rainbow trout in Chapter 2 (Gallaugher et al., 1992;
see Appendix I), these results are not surprising. However, in Chapter 3, I was able to
derive a positive linear relationship between Ucrit and Hct in rainbow trout within the
normocythemic range (i.e., Hct = 23 - 33%) by extending Hct to extreme values both
below and above normocythemia, although the benefits to Ucrit, per unit Hct, were
minimal (approximately 5%) within this range (see Figure 7B). The Hct and [Hb] values
for both LS2 and HS2 chinook salmon fall within the normocythemic range for Hct
observed for rainbow trout in Chapter 3. Typically, the individual variability in both
Ucrit, and Hct ([Hb]) is relatively large. This may explain why a positive relationship
between Hct and UCrit, as would be predicted from the results of Chapter 3, was not
revealed in the present study or in that of TR1.
There was a significant training effect on V02,, in the present study.
Moreover, the 35% higher VO~,,, value in HS2 fish, was considerably greater than

would be predicted from the results of Chapter 3 on the basis of Hct alone (i.e., a 10%
increase in V Ozma, was observed across the Hct range 29% to 31%; see Figure 7B,
Chapter 3). Furthermore, there was neither a difference in Cao2, nor a difference in
(Imax, between HS2 and LS2 fish. Qmax was 65.6 ml.min".kg-' ? 7.3 S.E.M. (N = 6)
and 65.1 ml.min-'.kg-' + 7.9 S.E.M. (N = 6) for LS2 and HS2 fish respectively (see
Thorarensen, 1994). Thus, the only explanation for the higher VoZmax value in HS2 fish
is that there was an increased extraction of O2 by the tissues with a concommitant
decrease in Cvo2. We did not measure Cvg2 in these fish. We did, however, estimate
tissue extraction of 0 2 (Eo2) by calculating Vo2max 1 ToZmax These calculations
showed that Eo2 at Ucrit was 90% in HS2 fish, and 62% in LS2 fish (Thorarensen,
1994).
The difference in Eo2 in the two groups of fish could reflect our observations of a
training effect on red muscle tissue in the caudal region of HS2 fish. Total red muscle,
measured as a percentage of cross-section, was greater in tissue sampled from the caudal,
but not from the rostral, region of HS2, compared with LS2 fish; i.e., 10.18% 0.83
S.E.M (N=12) (HS2) vs 5.4% * 0.73 S.E.M. (NZ12) (LS2) for caudal red muscle, and
2.75% * 0.26 S.E.M. (N=12) (HS2) versus 2.48% * 0.23 S.E.M. (NZ12) (LS2) for rostral
red muscle (P<0.05) (Kiessling et al., 1994b).
Mammalian studies have reported evidence of improved 0 2 extraction in the
musculature of trained, compared with untrained subjects (Roca et al., 1992; Bebout et
al., 1993). Moreover, Davie et al. (1986) observed a training-induced increase in the
capillarity of red muscle in rainbow trout. There is also evidence of increases in the
diameter, and myoglobin content, of individual red muscle fibres in response to aerobic
exercise-training in fish (see Davison, 1989). Combined, these anatomical changes are
indicative of an increased diffusive surface for V 0 2 at the tissue level. However, if Eo2

was indeed greater in HS2, it did not improve swimming performance. Therefore, it is
likely that tissues other than the musculature were responsible for the increased extraction
of 07. - Since the Ucrit values were the same for both the LS2 and HS2 training groups,
and V 02max was 35% higher in the HS2 group, the metabolic cost of swimming at
velocities approaching, and at, Ucrit was considerably higher in the HS2 fish. This could
indicate that the LS2 fish were more efficient swimmers.
On the other hand, if it is assumed that all fish used the same muscle energy while
swimming to the same Ucrit, and incurred the same cardiac and ventilatory pump
expenses, then the higher Vo2 of the HS2 group must have been used by other tissues.
This reinforces the view put forward in both Chapter 2 and TRI, that functions such a:
digestion, nutrient absorption, and osmoregulation, may also benefit fiom increases in
V 0 2 and (or) To2 during locomotion (see Appendix 1, 4). Therefore, it is possible that
the higher V oZrnax of the HS2 fish was used for osmoregulation (Webb, 1975).
Efect of exercise training on osmoregulation
Based on the changes in muscle dry matter, body mass and plasma osmolality, it
is evident that chinook salmon became progressively dehydrated as they swam to UCrit in
the tunnel, independent of training. The fact that similar changes in body mass and
plasma osmolality also occurred in fish which received only a DA cannulae (Control
fish), indicates that these changes were not the result of invasive surgical procedures, but
rather that water loss via the gills exceeded water absorption via the small intestine as fish
swam to Ucrit. This indicates that the osmoregulatory function of the gills was
compromised in favour of gas exchange, leading to dehydration in these SW fish.
The osmorespiratory compromise was affected by training, however. Plasma
osmolality did not increase as much in HS2 as in LS2 fish, while swimming to UCrit in

the tunnel, indicating that HS2 fish were better able to defend their osmotic balance under
these conditions. Plasma osmolality values measured in TR1 and in other experiments
that I have conducted with both SW- and FW-adapted rainbow trout are reported in Table
6. The observation that plasma osmolality was increased after swimming to Ucrit in SW-
adapted, but not in FW-adapted, normocythemic rainbow trout, indicates that the change
in osmolality is primarily due to the SW environment. Similarly, there was a training
effect observed for osmoregulation in HS1 chinook salmon, although in this case the
effect was more ~rofound, in that plasma osmolality was not significantly changed at
Ucrit, compared with rest. Combined, the observations of the present study and those
reported in Table 6 support the view that swimming to Ucrit in SW leads to dehydration.
This dehydration did not compromise skeletal muscle function in fish swimmin? - to Ucrit in the swim tunnel since Ucrit values were the same in all groups (LS 1, HS 1,
LS2, HS2), independent of training. In addition, blood lactate concentrations at Ucrit
were the same in both LS2 and HS2 fish, indicating that the musculature of the two
groups likely had the same aerobic scope. Similarly, since Qmax was the same in both
groups of fish (Thorarensen, 1994), there was no evidence of a dehydration limitation on
maximal cardiac muscle perfomance. We have previously observed a negative
correlation between f H , but not Q, in rainbow trout at Ucrit (see Appendix 3). In
amphibians, both hyper-osmolality and dehydration have been shown to have a negative
inotropic influence on cardiac muscle (Hillman, 1984).
Changes in plasma osmolality have been observed in previous studies with teleost
fish during strenuous aerobic swimming in both FW and SW. Plasma osmolality was
significantly higher for rainbow trout swimming in full-strength SW, compared with FW
or iso-osmotic SW (Rao, 1969), and for Atlantic salmon swimming in 30% SW, but not
in lower salinities or FW (Bryne et al., 1972), and there was a trend for higher and lower

Table 6. Plasma osmolality at rest, at Ucrit, and after one hour of recovery from Ucrit in chinook salmon from TRl. and in FW- and SW-adapted rainbow trout.
CI IINOOK
(TRAINING EXPERIMENT 1 )
RAINBOW TROUT
(SW) (winter 199 1)
SW (summer 1992) (Hct = 26.3%)
SW (winter 1993)
DA cannula and Doppler flow probe
SW (winter 1993)
DA cannula only
FW (winter 1993, 5 O C )
(Hct = 32.5%)
Rest
3 00 (8)
N= 10
276a (1 1) N=7
285 (17) N=7
335 (17) N=7
339 (3)
N=10
334 (1 1) N=6
290
(4) N= 10
Plasma Osmolality (mOsm.kg-1) Ucri t Recovery
341 *** 348***
(12) (1 6) N=10 N=7
292a 295a (1 4) (16) N=7 N=6
Numbers in parentheses are +I- S.E.M. *.**.*** Significantly different from rest (* P <0.05, **P <0.01, ***P <0.001) a Significantly lower than LS1 fish (P <0.05)

plasma osmolality values for tilapia swimming in SW and FW, respectively (Farmer and
Beamish, 1969).
There are several possible explanations for why exercise-training might improve
osmoregulatory ability. One possibility is that there was a training effect on the shift of
fluid between the secondary and primary circulations in the HS2 fish, analogous to the
fluid shifts between the lymphatic system and the vasculature observed in dehydrated
amphibians. Hillman and Withers (1988) noted that the amphibian species which could
best resist dehydration under hyper-osmotic conditions was the species which could best
maintain plasma volume, and this was accompished by shifting fluid into the vascular
compartment from the lymphatic system (Hillman, 1987; Hillman et al., 1987), resulting
in a smaller reduction in body mass under these conditions (Hillman et al., 1988).
It is also possible that there was a training effect on blood volume in HS2 fish. A
well-known effect of exercise-training in mammals is an expanded blood volume
(Schmidt et al., 1988). In fact, one benefit believed to be associated with polycythemia in
mammals is a better resistance to dehydration during strenuous exercise, and this may be
attributed to hypervolemia which is frequently associated with polycythemia (Sawka et
al., 1987 b).
Another possibility is the Hct-dependence of the redistribution of blood away
from the viscera in chinook salmon swimming to U ~ i t (Thorarensen et al., 1993;
Appendix 4). Trained fish with a higher Hct ([Hb]) in the present study may have
similarly maintained intestinal artery blood flow during swimming, thus facilitating a
greater absorption of water across the small intestine and a better defence of the blood
water balance.
The possibility also exists that the osmotic changes were less severe in the HS2
fish because of a training effect on the ability to tolerate "handling" stress. Some of the

physiological changes which occur in response to swimming to Ucrit also occur during
handling in fish; e.g., increased VQ, increased gill blood flow, increased levels of
circulating catecholamines. Young and Cech (1993) observed that plasma osmolality
increased due to "handling" stress in FW striped bass (Morone saxatilis) but that the
extent of this change was reduced by previous aerobic exercise-training (i.e., swimming
at 1.2 - 2.4 bls" for 60 d).
Further studies will be needed to prove any the above possibilities. In all cases,
however, it can be expected that a better osmoregulatory ability will have a metabolic
cost; e.g., the cost of pumping ions at the gills and (or) the gut. In this regard, the higher
V o~~~~ values of the HS2 fish may at least partially reflect this osmoregulatory cost.
A number of studies have provided estimates of the cost of osmoregulation in
active fish. In general the values are highly variable, with estimates ranging from 2 -
20% of the total cost of swimming (e.g., see Morgan and Iwama, 1991). There are
several possible explanations for the variability in these estimates. One explanation
relates to the difficulty in obtaining accurate measurements for the cost of
osmoregulation, as distinct from other maintenance metabolic costs (e.g., digestion and
nutrient absorption). Moreover, at least part of the variability in osmoregulatory costs
may be attributed to different stages of the life cycle of the species compared; the
metabolic costs of juvenile fish may be considerably different from those of adult fish
(Brett, 1983, Kaufman, 1990). In addition, there are differences between studies in
acclimation times under conditions of salinity. The broad range of values reported for the
cost of osmoregulation includes estimates for juvenile fish acutely exposed to SW as well
as estimates for adult fish which are well-adapted to SW. Finally, values for the cost of
osmoregulation may vary according to whether this cost has been estimated as a
percentage of the net, or of the total, cost of swimming (e.g., see Febry and Lutz, 1987).

There are several studies which have used fish comparable to those of the present
study; i.e., adult fish, well-adapted to SW. These studies propose a cost of
osmoregulation which constitutes a relatively large fraction of the total cost of swimming.
For example, Febry and Lutz (1987) determined that the cost of osmoregulation for
exercise-trained (1 b1.s-1 for 3 wk) hybrid tilapia adapted to hll-strength SW during
prolonged swimming (- 2.5 b1.s-1) in SW, was 20% of the net cost of swimming, relative
to the cost for the same fish swimming in iso-osmotic SW. Using the data of Rao (1 968)
and Farmer and Beamish (1969), Webb estimated that cost of osmoregulation for both
SW-adapted adult rainbow trout and tilapia, swimming at UCrit, was about 16% of the net
cost of swimming. The observations of higher Naf/K+ ATP-ase activity in gill tissue of
Atlantic salmon smolts, after an 18 d acclimation to SW, supports observations of greatc,
energetic costs associated with ionoregulation in SW, compared with FW (McCorrnick et
ul., 1989).
In contrast, theoretical calculations suggest that the cost of osmoregulation would
be less than 2% of resting metabolic rate in salmonids (Eddy, 1982). Moreover, in an
empirical analysis of the influence of swimming pattern on the net energetic cost of
swimming in a variety of fish species, Boisclair and Tang (1993) calculated that salinity
effects could never explain more than 3% of the net cost of swimming, regardless of
swimming pattern. In addition, McCormick et 01. (1989) were not able to link the
increased ion pump activity to increases in the metabolic capacity of either gill or kidney
tissue and concluded that values put forward by Rao (1968) and Farmer & Beamish
(1978) for the cost of osmoregulation are likely over-estimates. However, recently
Lyndon (1994) has shown that the V O ~ of flounder (Platichthys flesus) perhsed gills
(where pressure and flows were maintained at levels similar to those observed in viva)
was 100% greater under hyperosmotic, compared with isoosmotic conditions.

Thus, at this time, it is not appropriate to choose a 2% or a 20% value for the cost
of osmoregulation. If, however, I assume that all of the additional V 02max in HS2 fish
was used for osmoregulation, then the cost of osmoregulation was 35% and there was still
evidence of osmotic imbalance in the blood. This value would appear to be excessively
high when compared with other estimates of the cost of osmoregulation during
swimming, and thus lends support to the view that other functions (e.g., protein synthesis,
digestion) also benefitted from the elevated V 0 2 during swimming. For TRI, the more
complete compensation for dehydrating effects was evidenced by the less severe changes
in plasma osmolality in HS, compared with LS fish, as they swam to Ucrit. Based on the
difference in numerical values for V 02rnax between these two groups of fish, the better
osmoregulatory ability of the HS 1 fish must have cost about 10%. This value may be rn
under-estimate however, since these fish may also have been more efficient swimmers
and thus more of the V o2 would have been available for functions other than locomotion.
Therefore, in terms of the energy budget (see Brett and Groves, 1979), the energy
available for growth and maintenance was not compromised by the greater
osmoregulatory challenge associated with the higher level of activity in the HS groups of
fish in both TRl and TR2, and these fish were able to maintain growth at the same rate as
the LS groups of fish. Although not tested in this study, it is possible that the higher Hct
and (or) V ozmax of the HS groups of fish also benefitted the processes involved in the
recovery from the Ucrit swim.
Clearly, there was considerable variability in the training effects on Hct, To2, and
aerobic scope between the two training studies. Since none of these variables was
measured prior to the onset of either training study, it was impossible to separately assess
the impact of the training regimen on each group of fish. This points to the problems

associated with cross-sectional studies, and suggests that future studies involving
exercise-training in fish should be of a longitudinal nature.
Haematological changes associated with swimming to Ucrit
An increase in Hct at Ucrit has previously been observed in FW rainbow trout (see
Chapter 2, Appendix 1; Thomas et al., 1987) and similar observations have been made in
SW yellowtails (Yamarnoto et al., 1980). This increase has been attributed to a
combination of cellular swelling, splenic transfusion of cells, and haemoconcentration
due to fluid shifts between intravascular and extravascular compartments (see Chapter 1,
Appendix 1; Peny and McDonald, 1993). However, this phenomenon did not occur in
either TRl or TR2. Similar observations were made in studies with SW rainbow trout
(see Table 2, Appendix 2; Appendix 3). Since both the chinook salmon and the SW
rainbow trout were dehydrated during the swim to Ucrit, it is possible that the progressive
dehydration of the plasma and other tissues prevented the cellular swelling response
which normally results from the influx of water into adrenergically-stimulated
erythrocytes (Nikimaa and Huestis, 1984). Based on results from TR1 (see Table 5,
Appendix 2), plasma catecholamine levels were likely to be elevated at Ucrit. A survey
of the MCHC values for all fish from both training studies shows a trend for MCHC to
decrease in HS, but not in LS groups of fish (see Table 3, Appendix 2) , suggesting that
disruption to osmotic balance, rather than the absence of adrenergic stimulation, explains
the lack of the swelling response in erythrocytes at Ucrit. In support of this view, Motais
et al. (1991) have demonstrated different cellular swelling in response to differences in
ionic strength in trout erythrocytes, in vitro.
This dehydration effect of swimming in SW may also have been responsible for
the apparent absence of a spleen transfusion, at Ucrit. Similar observations were reported
by Perez-Pinzon and Lutz (1991) for juvenile snook (Centropomus undecimalis); Hct

increased by 30% in fish swimming to Ucrit, compared with rest, in FW, but did not
change in fish swimming in SW. On the other hand, Brauner et al. (1992) noted
reductions in Hct at Ucrit in SW coho pan. However, they sampled blood via caudal
puncture when the fish were removed from the swim tunnel after fatigue and during the
onset of recovery . We have repeatedly observed lower Hct values for fish, where blood
was sampled via cannula immediately after the cessation of swimming due to fatigue,
compared with the same fish swimming at velocities at, or close to, Ucrit (Gallaugher and
Thorarensen, unpublished observations), and in addition have observed significant
reductions in Hct after 1 h of recovery from a Ucrit swim, compared with rest, in SW
rainbow trout (see Appendix 2, Table 2). This reduction in Hct during recovery most
probably reflects inter-compartmental fluid shifts, rather than blood loss due to sampling.
The mainentance of Cag2 at Ucrit despite the obvious arterial hypoxaemia, in all
measurements that we have made in SW-adapted fish (see Appendix 2, Table 3), strongly
suggests that the spleen transfusion has taken place. In fact, the possibility exists that the
spleen transfusion took place prior to the onset of the swimming trials, possibly due to the
"stress" of handling, or to the initial disturbed state of the fish before it became
completely oriented to the swim-tunnel. However, in contradiction to these observations,
Yamamoto et al. (1980) observed a significant rise in Hct in the SW yellowtails
swimming to Ucrit.
We have consistently observed a decline in Pag2 in salmonid fishes swimming
velocity to UCrit (see Gallaugher et al., 1992, Appendix 2, 4). In the present study, the
Pa02 at UCrit was significantly lower in the HS2, compared with the LS2 fish. This
supports the previous observation in rainbow trout that the degree of arterial hy~oxaemia
is Hct-dependent (see Chapter 3).

Finally, since there is an osmo-respiratory compromise at the gills, exercise-
induced changes in plasma osmolality may be indicative of changes in gas exchange and
acid-base regulation. For the combined LS2 and HS2 fish, a correlative analysis of
plasma osmolality llersus gas exchange ( P w 2 , Cao2) and acid-base (pHa) variables was
performed (Table 7). As expected, Cao2 at Ucrit was positively correlated with both
Paoz and pHa at Ucrit, probably reflecting the effects of both Pw2 and pH on the Hb-O2
affinity. Cao2 was negatively correlated with plasma osmolality at Ucrit, indicating that
fish with higher blood 0 2 carrying capacity could better defend osmotic balance. Pw2
was also negatively correlated with plasma osmolality at Ucrit, again indicative of the
osmo-respiratory compromise at the gills. The most significant correlations in this
analysis were those between pHa and plasma osmolality. This may reflect the common
branchial pathways used for acid-base and osmotic regulation.
Conclusion
Aerobic exercise-training in chinook salmon can stimulate increases in T o 2 via
increases in Hct, [Hb] and C w 2 . However, these training effects are generally small
(changes are < 20%) and depend, to some extent, on the intensity of the training regimen.
In TR2, the fish with the highest Hct values also had the highest MCHC values,
indicating that there may be a limit to the plasticity of Hct in this species in response to
exercise-training. An increase in VoZmax was possible in the HS2 fish, without a
significant increase in Cao2. Therefore, the training effect on VoZmax in HS2 fish may
have resulted from an expanded A-V02 difference as a result of a greater extraction of 0 2
by the tissues. This was most likely at the site of tissues other than skeletal musculature
(e.g., tissues responsible for osmoregulation), since the higher Vo2rnax values were not
associated with higher Ucrit values.

Table 7. Summary of correlative analysis for plasma osmolality and pHa at rest and at Ucrit, and for Pao2, and Cao2 at Ucrit. Correlations were performed on the combined values of LS2 and HS2 chinook salmon.
Osmolality Osmolality P H ~ P H ~ (rest)
pa02 (rest) (ucrid ( ucrid ( UcriJ
Osmolality
( UcriS C.C. P N
pHa (rest) C.C. P N
P H ~ (Ucrid C.C. P N
Pa02 (Ucrit) C.C. P N
Ca02 (ucrit) C.C. P N
C.C. = correlation coefficient (R) P = level of significance N = number of fish

Although exercise-training did not improve Ucrit, it apparently minimized the
osmo-respiratory compromise at high swimming velocities. Therefore, I suggest that the
higher v OZmax of the trained fish, helped to support some of the cost of osmoregulation
incurred at the gill and (or) the gut in these fish over the duration of the training period,
when they were exposed to the continuous dehydrating effects of swimming in SW. HSI
fish were also better able to maintain osmotic balance while swimming to Ucrit, despite
the lack of a significant increase in VoZmax Therefore, they must have been more
efficient swimmers, thus making more To2 available for osmoregulation and other
hnctions. This may also have benefitted the fish in terms of recovery from the UCrit
swim.
CHAPTER 5. GENERAL SUMMARY
A number of novel observations have been reported in this thesis with regard to
the role of Hct in oxygen transport and aerobic swimming in salmonids. These
observations have been discussed in detail in the preceding chapters. The purpose of this
chapter is to outline the major findings of this thesis and relate them to the existing field
of knowledge of oxygen transport and cardiovascular function in teleost fish.
Establishing a range for normocythemia in salmonids
To begin with, it is now apparent that Hct is well-regulated in adult (non-gravid)
rainbow trout and chinook salmon over the Hct range 23% to 33%. This range for
norrnocythemia is much narrower than what has been previously described for rainbow
trout. This thesis has demonstrated that Hct values less than about 22% reflect anaemia,
which under experimental conditions could be due to blood loss during surgery, or serial
blood sampling, but in the wild, may result from a number of natural conditions including
parasitic infections and insufficient dietary iron. Hct values greater than about 35% in
adult non-gravid salmonids most likely reflect the effects of handling stress and the
associated splenic transfusion, erythrocyte swelling, and (or) intercompartmental fluid
shifts.
On an individual basis, Hct may vary in response to several factors. For example,
when swimming to UCrit, a temporary haemoconcentration may result from spleen
transfusion, erythrocyte swelling, and (or) fluid shifts. The extent of the increase in Hct
does not exceed the upper level for normocythemia. This thesis also demonstrates that
the occurrence of these responses varies in salmonids, according to whether fish are
swimming in FW or in SW.

Chronic increases in Hct may be induced by some types of long-term aerobic
exercise-training regimes. Again, the responses do not exceed the upper limit for
normocythemia. Therefore, the cardiovascular system of both adult chinook salmon (this
thesis), and rainbow trout (earlier studies), responds minimally to aerobic-exercise
training. Statistically significant increases in blood oxygen carrying capacity (Hct, ~ b ,
C ~ Q ) , internal T o 2 capacity, and Vo2rnax can occur, but they do not benefit UCri,.
Therefore, tissues other than locomotory muscle must benefit from the elevated T o 2 and
V o 2 . There may also be an increase in swimming efficiency. An important benefit
associated with these changes is a better osmoregulatory ability when swimming to Ucrit
in seawater.
The Hctopt hypothesis for oxygen transport in rainbow trout
A finding of this thesis which is consistent with the HctOpt hypothesis is the
observation that a minimum [Hb] is required for T o 2 in aerobically swimming rainbow
trout. This is the first time that a complete set of cardiovascular variables have been
measured in anaemic fish, swimming to Ucrit. At Hct values below about 22% in
rainbow trout, Q,, is not increased above the values for Qmax in nomocythemic fish,
and thus T o 2 is reduced in proportion to the reductions in Cag2. The result is a very
significant decrease in both UCrit and VoZmax These decreases occur in direct
proportion to the decrease in Hct. Given the results of earlier studies showing anaemia-
induced reductions in UCrit, these results are not surprising.
The most significant and novel findings of this thesis relate to the effects of
polycythemia and the overwhelming evidence which contradicts the general applicability
of the Hctopt hypothesis to rainbow trout. This thesis demonstrates that within the
normocythemic Hct range for rainbow trout, and in polycythemic rainbow trout, there is
no evidence for an Hctop,, either for To2, or for Ucrit. Although Hct-related increases in
viscosity did occur, viscosity contraints on relative Qmax and vascular conductance were
minimal, and only apparent when Hct was close to double the normocythemic values.
Moreover, since the relationship between both Ucrit and VoZmax Versus Hct is the same
in summer and winter fish, increased viscosity at lower temperatures does not
significantly affect To2 in rainbow trout. Therefore, it is likely that similar to
mammalians, polycythemic rainbow trout can compensate for the potentially detrimental
effects of viscosity on To2. Moreover, in contradiction to the Hctopt hypothesis, the
negative effect of rl on cardiac work is not a constraint in rainbow trout, at least until very
high Hct values, well in excess of normocythemia. If anything, other factors related to
polycythemia (e.g., arterial hypoxaemia, cost of swimming) are more important in
constraining T o 2 and V o~~~~ in this species (see below).
Consequent to the increase in To2, exercise performance was improved up to the
highest Hct values (55%) tested in polycythemic rainbow trout. There is no evidence of a
peak in the relationship between Ucrjt and Hct in polycythemic fish up to Hct 55%.
However, since the benefit to UCrit, per unit Hct, is less profound than for anaemic fish,
the relationship takes the form of a graded plateau. Although there is a peak in the
V 0 2 m a x versus Hct relationship, it occurs at an Hct of about 42%, a value much higher
than the normocythemic range for Hct in this species. This peak may represent a
limitation to O2 transfer at the gills.
Figure 13 summarizes the various observations reported above for rainbow trout,
to better define the relationships between maximum T02map Qmax, VO2ma. and Ucrit,
and Hct ([Hb]) at Ucrit. This figure demonstrates that, contrary to the predictions of
Figure 1 describing Hctopt as a compromise between the effects of viscosity and Cao2,
there was no evidence of a trade-off between To2 and cardiac work, even at Hct values

Figure 13. A summary of the observations reported in this thesis with regard to
maximum ToZmax, V 0 2 ~ ~ ~ , Ucrit and Qmx as functions of Hct in rainbow
trout. Solid lines represent data measured in this thesis. Dashed vertical lines
identify specific Hct values at which changes were observed. Dashed
horizontal line represents maximum relative capacity. For dependent variables,
0 = minimum relative capacity, and 1 = maximum relative capacity.


which approximate double the normocythemic values for this species. Q,, does
decrease, but only when Hct is very high (mean Hct, 48%), and in fact, despite this
reduction, both Tozmax and Ucrit continue to increase in relation to increases in ~ c t , up
to 55%. Similarly, VoZmax increases in relation to increases in Hct up to an H C ~ of about
42%, again a value well beyond normocythemic values. These findings provide strong
evidence against the Hctopl hypothesis for f o2 and swimming performance in salmonids.
Furthermore, the fact that both Ucrit and Vo2rnax increase in relation to Hct and To2
within the normocythemic range, suggests that exercise performance in normocythemic
rainbow trout is limited by internal 0 2 convection. This lends support to the view that
exercise performance is normally perfusion-limited in this species. The findings of this
thesis also contradict the concept of syrnmorphosis, in that changes in one variable (Hct)
in the O2 cascade are able to bring about increases in To2 and exercise performmce,
without :he occurrence of equivalent changes in all of the other variables in the o2 cascade. That polycythemia (up to Hct values of 42%) did induce increases in Vozmax,
indicates that the rate of O2 uptake was not limited at the gills, and therefore in
normocythemic rainbow trout, the gills must be over-designed.
The above observations, which run contrary to the HctW hypothesis for To2 in
rainbow trout, are primarily dependent on Qmax being maintained at high q values
because of the inherent homeometric capacity of the rainbow trout heart. In view of this,
the Hctopl hypothesis may be applicable to other species such as the Antarctic
haemoglobin-free icefish, or amphibians, that have hearts with less homeometri~
capabilities than those of salmonid fishes and mammals, and are therefore less able to
maintain pressure output when viscosity-induced increases in resistance occur.

It is also possible that Hct is optimized for functions other than TO2 in salmonid
fishes, such as C 0 2 excretion and acid-base regulation. These possibilities remain to be
tested.
Factors setting the limitsfor normocythemia in rainbow trout
This thesis identifies several factors as being involved in changing Hct within the
range of normocythemia in rainbow trout and chinoo~ salmon; i.e., changes in the size of
the spleen reservoir, changes associated with aerobic exercise-training and detraining, and
possible seasonal effects. It also identifies factors and theoretical selection pressures
which may play a role in determining the upper and lower limits for normocythemia in
these species.
In rainbow trout, if Hct falls below about 22'33, the reduction in Cao2 cause. a
perfusion limitation to O2 transfer and both swimming ability and are decreased
significantly. An anaemia-related decrease in exercise performance would clearly be
detrimental to the potential for survival in the wild. Moreover, anaemia-related
reductions in VoZrnav would also compromise maintenance and growth in these fish.
This would represent a selection pressure for raising Hct to the lower limit for the
observed normocythemic value of 23%.
The factors which are likely involved in setting the upper limit for nomocythemia
in rainbow trout and chinook salmon are less clear. However, the occurrence of a well-
defined exercise-induced arterial hypoxaemia points to a diffusive limitation in these fish
as they swim to UCrit. It is possible that this decrease is related to insufficient diffusive
capacity at the gills. Therefore, a diffusion limitation to 0 2 transfer at the gills, coupled
with a diffusion limitation in terms of O2 extraction by the tissues, may explain the peak
in the vO2,,, versus Hct relationship at Hct values 2 42%. Thus, while perfusion

limitations most likely set the lower limit for normocythemia, diffusion limitations may
be involved in setting the upper limit for normocythemia in rainbow trout.
In terms of UCrit, the benefits accrued by increased To2 at higher Hct values are
small, because the cost of swimming increases exponentially ?s swimming velocity
increases. Therefore, it may be too costly to manufacture and transport extra Hb, for the
minimal benefit to survival in terms of swimming ability. This might change, however,
when maintenance of the energy budget is not critical in salmonids, such as might occur
during reproduction. In this case, an increase in Hct beyond the upper level for
normocythemia, and the consequent improvement in arerobic exercise performance, may
enhance the opportunity to contribute to the gene pool. This possibility remains to be
tested.
The uncoupling of V oZmax and UCrit
The results of this thesis show clearly that an increase in VoZmax does not
necessarily result in an equivalent increase in exercise performance in salmonid fishes.
The rate of increase in VO~,, is greater than the rate of increase for Ucrit in both
normocythemic and polycthemic rainbow trout (see Figure 13). Moreover, training-
induced increases in ~o~~~ in chinook salmon are not reflected in higher values for
Uait. It is likely that the additional Vo2 consuned (but not used by the locomotory
musculature) by normocythemic and polycythemic rainbow trout, and exercise-trained
chinook salmon, is used to support maintenance functions such as digestion and
osmoregulation while swimming at maximal sustainable velocities.
These findings reinforce the suggestion Put forth in Chapter 2 that Hct-related
changes in UCrit may be too small to detect, and instead V02max measurements would
better reveal the relationships between H c ~ , To2 and tissue demands for O2 during

strenuous aerobic swimming in salmonids. Based on the findings of this thesis, I
recommend that future studies incorporating assessments of swimming performance in
salmonids utilize the more meaningful memmment of ~ 0 2 m a x . rather than UCri,.

References
Allsop, P., Peters, A. M., Arnot, R. N., Stuttle, A. W. J., Deenrnarnode, M., Gwi]]im, M.
E., Myers, M. J. and Hall, G. M. 1992. Intrasplenic blood cell kinetics in man
before and after brief maximal exercise. Clin. Sci. 83,47-54.
Aota, S. and Randall, D. J. 1993. The effect of exogenous catecholamines on the
ventilatory and cardiac responses of normoxic and hyperoxic rainbow trout,
Oncorhynchus mykiss. J. Comp. Physiol. B. 163, 138-146.
Aota, S., Holmgren, K. D., Gallaugher, P. and Randall, D. J. 1990. A possible role for
catecholamines in the ventilatory responses associated with internal acidosis or
external hypoxia in rainbow trout Oncorhynchus mykiss. J. exp. Biol. 151, 57-70.
Ask, J. A., Stene-Larsen, G. and Helle, K. B. 198 1. Temperature effects on the P2-
adrenoceptors of the trout atrium. J. Comp. Physiol. 143, 16 1 - 168.
Axelsson, M. and Nilsson, S. 1986. Blood pressure control during exercise in the Atlantic
cod (Gadus morhua). J. exp. Biol. 126,225-236.
Baldwin, J. and Wells, R. M. G. 1990. Oxygen-transport potential in tropical
elasmobranchs from the Great Barrier Reef: Relationship between hematology and
blood viscosity. J. Exp. Mar. Biol. Ecol. 144, 145- 155.
Barrett, D. J. and Taylor, E. W. 1984. Changes in heart rate during progressive
hyperoxia in the dogfish Scyliorhinus canicula L.: evidence for a venous oxygen
receptor. Comp. Biochem. Physiol. 78A, 697-703.
Barron, M. G., Tarr, B. D. and Hayton, W. L. 1987. Temperature-dependence of cardiac
output and regional blood flow in rainbow trout, Salmo gairdneri (Richardson). J.
Fish Biology 31,735-744.

Bauer, C and Kurtz, A. 1989. Oxygen sensing in the kidney and its relation to
erythropoietin production. Ann. Rev. Physiol. 51, 845-856.
Beamish, F. W. H. 1970. Oxygen consumption of largemouth bass, Microprerus
salmoides, in relation to swimming speed and temperature. Can. J Zool. 48, 122 1-
1228.
Beamish, F. W. H. 1978. Swimming capacity. In "Fish physiology" (W.S. Hoar, D. J.
Randall, eds.), Vol. VII, pp. 101 -1 87. Academic Press, New York.
Bebout, D. E., Hogan, M C., Hempleman, S. C. and Wagner, P. D. 1993. Effects of
training and immobilization on v 02 and Do2 in dog gastrocnemius muscle in siru. J
Appl. Physiol. 74(4) 1697- 1 703.
Bell, W. M. and Terhune, L. D. B. 1970. Water tunnel design for fisheries research.
Tech. Rep. Fish. Res. Bd. Can. 195,69pp.
Berglund, B., and Hemmingson, P. 1987. Effect of reifision of autologous blood on
exercise performance in cross-country skiers. Int. J. Sports Med. 8,23 1-233.
Bernatchez, L. and Dodson, J. J. 1985. Influence of temperature and current speed on
the swimming capacity of lake whitefish (Coregonus clupeaformis) and cisco (C.
artedii). Can. J Fish. Aquat. Sci. 42, 1 522- 1 529.
Besner , M. and Smith, L. S. 1983. Modification of swimming mode and stamina in two
stocks of coho salmon (Oncorhynchus kisurch) by differing levels of long-term
continuous exercise. Can. J. Fish. Aquat. Sci. 40, 933-939.
Birchard, G. F. and Tenney, S. M. 1990. Relationship between blood-oxygen affinity
blood volume. Respir. Physiol. 83,365-374.
Blomqvist, C. G. and Saltin, B. 1983. Cardiovascular adaptation to physical training.
Ann. Rev. Physiol. 45, 169- 189.
Boisclair, D. and Tang, M. 1993. Empirical analysis of the influence of swimming
pattern on the net energetic cost of swimming in fishes. J. Fish Biol. 42, 169-1 83.
Booth, J. L. 1979. The effects of oxygen supply, epinephrine and acetlycholine on the
distribution of blood flow in trout gills. J. exp. Biol. 83, 3 1-39.
Borgese, F., Garcia-Romeu, F. and Motais, R. 1987. Control of cell volume and ion
transport by beta-adrenergic catecholamines in erythrocytes of rainbow trout, SaImo
gairdneri. J. Physiol. (Lond.) 382, 123- 144.
Boutilier, R. G., Heming, T. A. and Iwarna, G. K. 1984. Physiochemical parameters for
use in fish respiratory physiology. In "Fish Physiology" (W.S. Hoar, D. J. Randall,
eds.), vol. XA , pp. 403-430. New York: Academic Press.
Brauner, C. J., Shmpton, J. M. and Randall, D. J. 1992. Effect of short-duration
seawater exposure on plasma ion concentrations and swimming performance of coho
salmon (Oncorhynchus kisurch) pan. Can. J. Fish. Aqua. Sci. 49,2399-2405.
Brauner, C. J., Val, A. L. and Randall, D. J. 1993. The effect of graded rnethaemogl~bi~
levels on the swimming performance of chinook salmon (Oncorhynchus
rshawyrscha). J. exp. Biol. 185, 121-135.
Brett, J. R. 1964. The respiratory metabolism and swimming performance of young
sockeye salmon. 3: Fish. Res. Bd. Can. 21, 1183-1226.
Brett, J. R. 1983. Life energetics of sockeye salmon, Oncorhynchus nerka. In
"Behavioural energetics: the cost of survival in vertebrates: (W.P. Aspey & S.1,
Lustic, eds.) pp 29-63. Ohio State University Press, Columbus, Ohio.

Brett, J. R. and Glass, N. R. 1973. Metabolic rates and critical swimming speeds of
sockeye salmon (Oncorhynchus nerku) in relation to size and temperature. J. Fish.
Res. Bd Can. 30.379-387.
Brett, J. R. and Groves, T. D. D. 1979. Physiological Energetics. In Fish Physiology
(W.S. Hoar and D. J. Randall, eds), VIII, pp 280-352.
Brett, J. R., Hollands, M. and Alderdice, D. F. 1958. The effect of temperature on the
cruising speed of young sockeye and coho salmon. J. Fish. Res. Bd Can. 15, 587-
605.
Brien, A. J. and Simon, T. L. 1987. The effects of red blood cell infusion on 10-km race
time. J A . M.A. 257,2761-2765.
Brill, R. W. and Bushnell, P. G. 1991. Metabolic and cardiac scope of high energy
demand teleosts, the tunas. Can. J. 2001. 69,2002-2009.
Brill, R. W. and Jones, D. R. 1994. The influence of hematocrit, temperature and shear
rate on the viscosity of blood from a high-energy-demand teleost, the yellowfin tuna
Thuunus albacares. J. exp. Biol. 189, 199-2 12.
Broughton, N. M. and Goldspink, G. 1978. Biochemical changes in the lateral muscles
of roach, Rurilus rufilus from two habitats following exercise. J. Fish Biol. 13, 61 3-
618.
Broughton, N. M., Goldspink, G. and Jones, N. V. 1980. The effect of training on the
lateral musculature of 0-group roach, Rurilus rurilus (L.), and their fatigue in
subsequent exercise tests. J. Fish Biol. 17,209-21 7.
Buick, F. J., Gledhill, N., Froese, A. B., Spriet, L., and Meyers, E. C. 1980. Effect of
induced erythrocythaemia on aerobic work capacity. J. Appl. Physiol. 48, 636-642.

Burggren, W., McMahon, B. and Powers, D. 1991. Respiratory functions of blood. In
"Environmental and Metabolic Animal Physiology" (C. L. Prosser, ed.), pp. 437-508.
New York: John WiIey & Sons Inc.
Burton, A. C. 1972. Viscosity and the manner in which blood flows. In "Physiology and
Biophysics of the Circulation" pp. 39-48. Yearbook Medical Publishers, Inc.
Chicago.
Bushnell, P. G., Jones, D. R. and Farrell, A. P. 1992. The arterial system. In "Fish
Physiology" (W.S. Hoar, D. J. Randall, A. P. Farrell, eds.1, Val. XIIA, pp. 89-139.
Academic Press, Inc. New York.
Butler, P. J. and Day, N. 1993. The relationship between intracellular pH and seasonal
temperature in the brown trout Salmo trutta. J exp. Biol. 177,293-297.
Butler. P. J., Day, N. and Namba, K. 1992. Interactive effects of seasonal temperature
and low pH on resting oxygen uptake and swimming performance of adult brown
trout Salmo trurta. J: exp. Biol. 165, 195-2 12.
Butler, P. J., Woakes, A. J., Smale, K., Roberts, C. A., Hillidge, C. J., Snow, D. H. and
Marlin, D. J. 1993. Respiratory and cardiovascular adjustments during exercise of
increasing intensity and during recovery in thoroughbred racehorses. J. exp. Biol.
179, 159-1 80.
Byme, J. M., Beamish, F. W. H. and Saunders, R. L. 1972. Influence of salinity,
temperature, and exercise on plasma osmolality and ionic concentration in Atlantic
salmon (Salmo salar). J: Fish. Res. Bd Can. 29: 12 17- 1220.
Cameron, J. N. and Wohlschlag, D. E. 1969. Respiratory response to experimentally
induced anemia in the pinfish (Lagodon rhomboides). J exp. Biol. 50,307-3 17.
Cameron, J. N. and Davis, J. C. 1970. Gas exchange in rainbow trout (Salmo gairdneri)
with varying blood oxygen capacity. J Fish. Res. Bd. Can. 27, 1069-1085.
Castle, W. B. and Jandl, J. H. 1966. Blood viscosity and blood volume: opposing
influences upon oxygen transport in polycythemia. Semin. ffemarol. 3 (3), 193- I 98.
Celsing, F., Mystrom, J, Pihlstedt, P., Werner, B. and Ekblom, B. 1986. Effects of long-
term anemia and retransfusion on central circulation during exercise. J. App/.
Physiol. 61 (4), 1358- 1362.
Celsing, F., Svedenhag, J., Pihlstedt, P., Ekblom, B. 1987. Effects of anemia and
stepwise-induced polycythaernia on maximal aerobic power in individuals with high
and low haemoglobin concentration. Acra Physiol. Scand. 129,47-54.
Chien, S. 1975. Biophysical behaviour of red cells in suspensions. In "The Red Blood
Cell" (Surgenor, D. McN., ed.), Vo1.2, pp. 1032-1 13 1. New York: Academic Press.
Chien, S., Usami, S. Dellenback, R. J., Gregersen, M. I., Nannings, L. B. and Guest, M.
M. 1967. Blood viscosity: influences of erythrocyte aggregation. Science, 157, 829.
Chien, S., Usarni, S., Dellenback, R. J. and Bryant, C. A. 1971. Comparative
hemorheology-hematological implications of species differences in blood viscosity.
Biorheology 8,35-57.
Chiocchia, G. and Motais, R. 1989. Effect of catecholamines on deformability of red cells
from trout: relative roles of cyclic AMP and cell volume. J Physiol. (Lond.) 412,
321 -332.
Constantinopol, M., Jones, J. H., Weibel, E. R., Taylor, C. R-, Lindholm, A., and Karas,
R. H. 1989. Oxygen transport during exercise in large m m n a l s . 11. Oxygen uptake
by the pulmonary gas exchanger. J. Appl. Physiol. 67,871--878.

Coyle, E. F., Hernmert, M. K. and Coggan, A. R. 1986. Effects of detraining on
cardiovascular responses to exercise: role of blood volume. J Appl. Physiol. 60, 95-
99.
Crowell, J. W. and Smith, E. E. 1967. Determinant of the optimal hematocrit. J. ~ ~ ~ l .
Physiol. 22, 501 -504.
Davie, P. S., Wells, R. M. G. and Tetens, V. 1986. Effects of sustained swimming on
rainbow trout muscle structure, blood oxygen transport, and lactate dehydrogenase
isozymes: evidence for increased aerobic capacity of white muscle. J. Exp. Zoo/. 237,
159-171.
Davison, W. 1989. Training and its effects on teleost fish. Comp. Biochem. Physiol. 94A,
1-10.
Dejour, P. 1990. Comparative aspects of maximal oxygen consumption. Respir. Physiof
80, 155-162.
Dempsey, J. A., Hanson, P. G., and Henderson, K. S. 1984. Exercise induced arterial
hypoxemia in healthy human subjects at sea level. J. Physiol. (Lond) 355, 16 1 - 175.
Diamond, J. M. ] 986. M y do disused proteins become genetically lost or repressed?
Nature 321, 565-566.
di Prarnpero, P. E. 1985. Metabolic and circulatory limits to V02rnax at the whole
animal level. J. exp. Biol. 1 15, 3 19-33 1.
di Prarnpero, P. E. and Ferretti, G. 1990. Factors limiting maximal oxygen consumption
in humans. Respir. Physiol. 80, 1 13-1 28.

Doyle, M. P., Galey, W. R. and Walker, B. R. 1981. Reduced erythrocyte deformability
alters pulmonary hemodynarnics. J. Appl. Physiol. 67 (60, 2593-2599.
Dudley, R. and Gans, C. 1991. A critique of syrnrnorphosis and optimality models in
physiology. Physiol. Zool. 64, 627-63 7.
Duthie, G. 1987. Observations of poor swimming performance among hatchery-reared
rainbow trout, Salmo gairdneri. Environ. Biol. Fishes 18, 309-3 1 1.
Eddy, F.B. 1982. Osmotic and ionic regulation in captive fish with particular reference to
salrnonids. Comp. Biochem. Physiol. 73B, 125- 14 1.
Egginton, S. and Rankin, J. C. 1991. The vascular supply to skeletal muscle in fishes with
and without respiratory pigments. Int. J. Microcirc. 10, 396.
Ekblorn, B. and Berglund, B. 1991. Effect of erythropoietin administration on maximal
aerobic power. Scand. J. Med Sci. Sports. 1,88-93.
Ekblom, B., Goldbarg, A. N., Gullbring, B. 1972. Response to exercise after blood loss
and reinfusion. J. Appl. Physiol. 33 (2), 175- 180.
Ekblom, B., Wilson, G. and Astrand, P.-0. 1976. Central circulation during exercise after
vensection and reinhsion of red blood cells. J. Appl. Physiol. 40 (3), 379-383.
Eliot, T. S. 1963. Little Gidding. In "T.S. Eliot, Collected Poems, 1909 - 1962". 22 lp.
Harcourt, Brace and World, Inc. New York.
Evans, D. H. 1979. Fish. In "Comparative Physiology of Osmoregulation in Animals."
(Maloiy, G. M. 0. ed.). pp305-390. ~ c a d e m i c Press. New York.

Facey, D. E. and Grossman, G. D. 1990. The metabolic cost of maintaining position for
four North American stream fishes: effects of season and velocity. Physiol. Zool. 63
(4), 757-776.
Fan, F.-C., Chen, R., Schuessler, G. and Chien, S. 1980. Effects of hematocrit variations
on regional hemodynamics and oxygen transport in the dog. Am. J. Physiol. 238,
H545-H552.
Fange, R. 1992. Fish red blood cells. In "Fish Physiology" (W. S. Hoar, D. J. Randall,
A. P. Farrell, eds.), XIIA, pp. 2-46. Academic Press. New York.
Farlinger, S. and Beamish, F. W. H. 1978. Changes in blood chemistry and critical
swimming speed of largemouth bass, Micropterus salmoides, with physical
conditioning. Trans. Am. Fish. Soc. 107, 523-527.
Farmer, G.J. and Beamish, F.W.H. 1969. Oxygen consumption of Tilapia nilotica in
relation to swimming speed and salinity. J. Fish. Res. Bd. Can. 26,2807-282 1.
Farrell, A. P. 1985. Cardiovascular and hemodynamic energetics of fishes. In
"Circulation, Respiration and Metabolism" (R. Gilles, ed). pp. 377-385.
Springer-Verlag, Berlin.
Fanell, A. P. 199 1 a. From hagfish to tuna: A perspective on cardiac function in fish.
Physiol. Zool. 64(5), 1 13 7- 1 164.
Fanell, A. P. 1991 b. Cardiac scope in lower vertebrates. Can. J. Zool. 69, 198 1-1984.
Farrell, A. P. 199 1 c. Circulation of body fluids. In "Environmental and Metabolic Animal
Physiology" (C. L. Prosser, ed.), pp. 509-558. New York: John Wiley & Sons Inc.
Farrell, A. P. 1993. Cardiovascular system. In "The Physiology of Fishes" (D. H.
Evans, ed.), pp. 21 9-249. CRC Press Inc..

Farrell, A. P. and Jones, D. R. 1992. The heart. In "Fish Physiology" (W. S. Hoar, D. J.
Randall, A. P. Farrell, eds.), XIIA, pp. 1-88. Academic Press. New York.
Farrell, A. P., Sobin, S. S., Randall, D. J. and Crosby, S. 1980. Intralamellar blood flow
in fish gills. Am. J Physiol. 239, R428-R436.
Farrell, A. P., Johansen, J. A., Steffensen, J. F., Moyes, C. D., West, T. G. and Suarez,
R. K. 1990. Effects of exercise training and coronary ablation on swimming
performance, heart size and cardiac enzymes in rainbow trout, Oncorhynchus mykiss.
Can J Zool.68, 1 174-1 179.
Farrell, A. P., Johansen, J. A. and Suarez, R. K. 1991. Effects of exercise-training on
cardiac performance and muscle enzymes in rainbow trout, Oncorhynchus mykiss.
Fish Physiol. Biochem. 9,303-3 12.
Febry, R. and Lutz, P. 1987. Energy partitioning in fish: the activity related cost of
osmoregulation in a euryhaline cichlid. J. exp. Biol. 128, 63-85. c4, 5
Fedde, M. R. and Wood, S. C. 1993. Rheological characteristics of horse blood:
significance during exercise. Respir. Physiol. 94, 323-335.
Fedde, M. R., Ho, H. H. and Wood, S.C. 1993. Oxygen transport in exercising horses:
importance of rheological properties of blood. In "The Vertebrate Gas Transport
Cascade: Adaptations to Environment and Mode of Life" (J. E. P. W. Bicuido, ed).
pp. 200-207. Boca Raton. FL: CRC Press, Inc.
Ferretti, G., Kayser, B., Schena, F., Turner, D. and Hoppeler, H. 1992. Regulation of
perfusive 0 2 transport during exercise in humans: effects of changes in haemoglobin
concentration. J. Physiol. (Lond.). 455,679-688.
Flamm, S. D., Junichi, T., Moore, R., Lewis, S., Keech, F., Maltais, F., Ahmad, M.,
Callahan, R., Dreagotakes, S., Alpert, N. and Strauss, H. W. 1990. Redistribution of
regional and organ blood volume and effect on cardiac function in relation to upright
exercise intensity in healthy human subjects. Circulation 81, 1550-1 559.
Fletcher, G. L. and Haedrich, R. T. 1987. Rheological properties of rainbow trout blood.
Can. J. Zool. 65, 879-883.
Fowler, N. 0. and Holmes, J. C. 1975. Blood viscosity and cardiac output in acute
experimental anemia. J. Appl. Physiol. 39 (3), 453-456.
Franklin, C. E., Davison, W. and McKenzie, J. C. 1993. The role of the spleen during
exercise in the antarctic teleost, Pagothenia borchgrevinki. J. exp. Biol. 174, 381-
386.
Gallaugher, P., Axelsson, M. and Fanell, A. P. 1992. Swimming performance and
haematological variables in splenectomized rainbow trout, Oncorhynchus mykiss. J.
exp. Biol. 171, 301-314.
Garland, T. Jr. and Huey, R. B. 1987. Testing symmorphosis: does structure match
functional requirements? Evolution 41 (6), 1404- 1409.
Garland, T. Jr. and Bennett, A. F. 1990. Quantitative genetics of maximal oxygen
consumption in a garter snake. Am. J. Physiol. 259: R986-R992.
Gerkhe, P. C., L. E. Fidler, D. C. Mense, and Randall, D. J. 1990. A respirometer with
controlled water quality and computerized data acquisition for experiments with
swimming fish. Fish Physiol. Biochem. 8,61-67.
Gilmour, K. M., Randall, D. J., and Peny, S. F. 1994. Acid-base disequilibrium in the
arterial blood of rainbow trout. Resp. Physiol. 96,259-272.

Gledhill, N. 1985. The influence of altered blood volume and oxygen transport capacity
on aerobic performance. Exerc. Sports Sci. Rev. 13, 75-93.
Gonzalez, R. J. and McDonald, D. G. 1994. The relationship between oxygen uptake and
ion loss in fish from diverse habitats. J. exp. Biol. 190, 95-108.
Graham, M. S. and Farrell, A. P. 1989. The effect of temperature acclimation and
adrenaline on the performance of a perhsed trout heart. Physiol. 2001. 62, 38-61.
Graham, M. S. and Farrell, A. P. 1990. Myocardial oxygen consumption in trout
acclimated to 5 O C and 15 "C. Physiol. Zool. 63, 536-554.
Graham, M. S. and Farrell, A. P. 1992. Environmental influences on cardiovascular
variables in rainbow trout, Oncorhynchus mykiss (Walbaum). J. Fish Biol. 41, 85 1 - 858.
Graham, M. S. and Fletcher, G. L. 1983. Blood plasma viscosity of winter flounder:
Influence of temperature, red cell concentration, and shear rate. Can. J. Zool. 61,
2344-2350.
Graham, M. S. and Fletcher, G. L. 1985. On the low-viscosity of two cold-water marine
sculpins. A comparison with the winter flounder. J. Comp. Physiol. B 155,455-459.
Gregersen, M. I. and Rawson, R. A. 1959. Blood volume. Physiol. Rev. 39, 307-342.
Griffiths, J. S. and Alderdice, D. F. 1972. Effects of acclimation and acute temperature
experience on the swimming speed of juvenile coho salmon. J. Fish. Res. Bd. Can.
29, 25 1-264.
Grover, R. F., Weil, J. V. and Reeves, J. T. 1986. Cardiovascular adaptation to exercise
at high altitude. Exerc. Sports Sci. Rev. 14, 269-302.

Gustafsson, L., Appelgren, L and Myrvold, H. E. 1980. The effect of polycythemia on
blood flow in working and non-working skeletal muscle. Acta Physiol. Scand. 109,
143- 148.
Guyton, A. C. and Richardson, T. Q. 1961. Effect of hematocrit on venous return. Circ.
Res. 9, 157- 164.
Guyton, A. C. 1976. Textbook of Medical Physiology. W. B. Saunders Company,
Philadelphia, PA. 1 194 pp.
Hedrick, M. S., Duffield, D. A. and Cornell, L. H. 1986. Blood viscosity and optimal
hematocrit in a deep-diving mammal, the northern elephant seal (Mirounga
angustirostris). Can. J. Zool. 64,208 1-2085.
Hemrningsen, E. A. and Douglas, E. L. 1970. Respiratory characteristics of the
hemoglobin-free fish Chaenocephalus aceratus. Comp. Biochem. Physiol. 33, 733-
744.
Hemmingsen, E. A. , Douglas, E.L., Johansen K., and Millard, R. W. 1972. Aortic
blood flow and cardiac output in the hemoglobin-free fish Chaenocephalus aceratus.
Comp. Biochem. Physiol. 43A, 1045- 105 1.
Hillman, S. S. 1980. The effect of anemia on metabolic performance in the frog, Rana
pipens. J. Exp. Zool. 2 11, 107- 1 1 1.
Hillman, S. S. 1984. Inotropic influence of dehydration and hyperosmolal solutions on
amphibian cardiac muscle. J. Comp. Physiol. B, 154, 325-328.
Hillman, S. S. 1987. Dehydrational effects on cardiovascular and metabolic capacity in
two amphibians. Physiol. 2001. 60,608-6 13.

Hillman, S. S. and Withers, P. C. 1988. The hemodynamic consequences of hemorrhage
and hypematremia in two amphibians. J. Comp. Physiol. 157, 807-8 13.
Hillman, S. S., Zygmunt, A. and Baustian, M. 1987. Transcapillary fluid florces during
dehydration in two amphibians. Physiol. Zool. 60 (3), 339-345.
Hillman, S. S., Withers, P. C., Hedrick, M. S. and Kirnrnel, P. B. 1985. The effects of
erythr~c~thernia on blood viscosity, maximal systemic oxygen transport capacity and
maximal rates of oxygen consumption in an amphibian. J. Comp. Physiol. B 155,
577-58 1.
Hochachka, P. W. 196 1. The effect of physical training on oxygen debt and glycogen
reserves in trout. Can. J. Zool. 39, 767-776.
Hochmuth, R. M., Worthy, P. R. and Evans, E. A. 1979. Red cell extensional recovery
and the determination of membrane viscosity. Biophys. J. 26, 10 1 - 1 14.
Hogan, M. C., Roca, J., West, J. B., and Wagner, P. D. 1989. Dissociation of maximal
0 2 uptake from 0 2 delivery in canine gastrocnemius in situ. J. Appl. Physiol. 66 (3)
1219-1226.
Hogan, M. C., Bebout, D. E., Wagner, P. D., and West, J. B. 1990. Maximal 0 2 uptake
of in situ dog muscle during acute hypoxemia with constant perfusion. J. Appl.
Physiol. 69 (2), 570-576.
Hogan, M. C., Bebout, D. E. and Wagner, P. D. 1991. Effect of hemoglobin
concentration on maximal 0 2 uptake in canine gastrocnemius muscle in situ. J. Appl.
Physiol. 70 (3) 1 105- 1 1 12.

Hogan, M. C., Bebout, D. E. and Wagner, P. D. 1993. Effect of blood flow reduction on
maximal 0 2 uptake in canine gastrocnemius muscle in situ. J. Appl. Physiol. 74 (4),
1742- 1747.
Holeton, G. F. 197 1. Oxygen uptake and transport by the rainbow trout during exposure
to carbon monoxide. J. exp. Biol. 54,239-254.
Honig, C. R. and Gayeski, T. E. J. 1993. Resistance to 0 2 difhsion in anemic red
muscle: roles of flux density and cell P02. Am. J. Physiol. 265, H868-H875.
Horstman, D. H., Gleser, M., Wolfe, D., Tyron, T. and Delehunt, J. 1974. Effects of
hemoglobin reduction on V 0 2 ~ ~ and related hemodynamics in exercising dogs. J.
Appl. Physiol. 37 (I) , 97-102.
Houlihan, D. F., Agnisola, C., Lyndon, A. R., Gray, C. and Hamilton, N. M. 1988.
Protein synthesis in a fish heart: responses to increased power output. J. exp. Biol.
137, 565-587.
Houston, A. H. 1959. Locomotor performance of chum salmon fry (Oncorhynchus keta)
during osmoregulatory adaptation to sea water. Can. J. 2001. 37, 591-605.
Houston, A. H. and Murad, A. 1992. Erythrodynamics in goldfish, Carassius auratus
L.: temperature effects. Physiol 2001. 65, 55-76.
Hughes, G. M. and Kikuchi, Y. 1984. Effects of in vivo and in vitro changes in P o 2 on
the deformability of red blood cells of rainbow trout (Salmo gairdneri R. ). J. exp.
Biol. 11 1,253-257.
Hughes, G. M., Kikuchi, Y. and Watari, H. 1982. A study of the deformability of red
blood cells of a teleost fish, the yellowtail (Seriola quinqueradiata), and a
comparison with human erythrocytes. J. exp. Biol. 96, 209-220.

Hughes, G. M., Le Bras-Pennec, Y., and Pennec, J.-P. 1988. Relationships between
swimming speed, oxygen consumption, plasma catecholamines and heart
performance in rainbow trout (S. gairdneri R.). Experimental. Biol. 48,4549.
Johnson, T. P. and Johnson, I. A. 1991. Power output of fish muscle fibres performing
oscillatory work: Effects of acute and seasonal temperature change. J. exp. Biol. 157,
409-423.
Johnson, I. A., Fleming, J. D. and Crockford, T. 1990. Thermal acclimation and muscle
contractile properties in cyprinid fish. Am. J. Physiol. 259, R23 1 -R236.
Jones, D.R. 197 1. The effect of hypoxia and anemia on the swimming performance of
rainbow trout (Salmo gairdneri). J. exp. Biol. 55, 541 -55 1.
Jones, D. R. and Randall, D. J. 1978. The respiratory and circulatory systems during
exercise. In "Fish Physiology"(W.S. Hoar, D.J. Randall, eds), vol. VIII, pp. 425-501.
New York: Academic Press.
Jones, J. H. and Lindstedt, S. L. 1993. Limits to maximal performance. Ann. Rev
Physiol. 55, 547-569.
Jones, J. H., Birks, E. K. and Pascoe, J. R. 1993. Factors limting aerobic performance. In
"The Vertebrate Gas Transport Cascade: Adaptations to Environment and Mode of
Life" (J. E. P. W. Bicuido, ed.). pp. 169-178. Boca Raton. FL: CRC Press.
Jones, J. H., Longworth, K. E., Lindholm, A., Conley, K. E., Karas, R. H., Kayar, S. R.
and Taylor, C. R. 1989. Oxygen transport during exercise in large mammals. I.
Adaptive variation in oxygen demand. J. Appl. Physiol. 67 (2), 862-870.
Kanstrup, I. -L. and Ekblom, B. 1982. Acute hypervolemia, cardiac performance, and
aerobic power during exercise. J. Appl. Physiol. 52 ( 9 , 1186-1 191.

Kanstrup, I.-L. and Ekblom, B. 1984. Blood volume and hemoglobin concentration as
determinants of maximal aerobic power. Med. Sci. Sports Exerc. 16, 256-263.
Karas, R. H., Taylor, C. R., Rosler, K. and Hoppeler, H. 1987. Adapative variation in the
mammalian respiratory system in relation to energetic demand: V. Limits to oxygen
transport by the circulation. Respir. Physiol. 69,6579.
Kaufman, R. 1990. Respiratory cost of swimming in larval and juvenile cyprinids. J.
exp. Biol. 150, 343-366.
Keen, J. E., Vianzon, D.-M., Farrell, A. P., and Tibbit, G. F. 1993. Thermal acclimation
alters both adrenergic sensitivity and adrenoceptor density in cardiac tissue of
rainbow trout. J. exp. Biol. 181,27-47.
Keen, J. E. and Farrell, A. P. 1994. Maximum prolonged swimming speed and
maximum cardiac performance of rainbow trout, Oncorhynchus mykiss, acclimated
to two different water temperatures. Comp. Biochem. Physiol. In press.
Kicenuik, J.W. and Jones, D.R. 1977. The oxygen transport system in trout (Salmo
gairdneri) during sustained exercise. J. exp. Biol. 69,247-260.
Kiessling, A., Higgs, D. A., Eales, J. G., and Dosanjh, B. S. 1994a. Influence of sustained
exercise and ration level on the performance of chinook salmon (Oncorhynchus
tshawytscha Walbaum) in seawater. Can. J. Fish. Aquat. Sci. 51. In press.
Kiessling, A., Gallaugher, P., Thorarensen, H., Kolok, A., Eales, J., Sweeting, R., Gong,
B., Dosanjh, B., Farrell, A., and Higgs, D. 1994b. Influence of sustained exercise and
endurance training on growth, muscle physiology, cardiovascular parameters, and
plasma levels of metabolic hormones of seawater adapted all-female chinook salmon.
Trans. Am. Fish. Soc., 6pp.

Kikuchi, Y. Hughes, G. M. and Albers., C. 1982. Temperature dependence of the
deformability of carp (Cyprinus carpio) red blood cells. Experientia 38, 822-823.
Kikuchi, Y., Hughes, G. M. and Duthie, G. G. 1985. Effects of moderate and severe
exercise in rainbow trout on some properties of arterial blood, including red blood
cell deformability. Jap. J Ichthyol. 31,422-426.
Kita, J. and Itazawa, Y. 1989. Release of erythrocytes from the spleen during exercise and
splenic constriction by adrenaline infusion in the rainbow trout. Jap. J. Ichthyol. 36,
48-52.
Kita, J. and Itazawa, Y. 1990. Effects of adrenaline on the blood flow through the spleen
of rainbow trout (Salmo gairdneri). Comp. Biochem. Physiol. 95A, 59 1-595.
Klausen, T., Breum, L., Fogh-Andersen, N., Bennett, P. and Hippe, E. 1993. The effect
of short and long duration exercise on serum erythropoietin concentrations. Eur. J.
Appl. Physiol. 67, 2 13-2 17.
Kolok, A. S. 1992. The swimming performances of individual largemouth bass
(Micropterus salmoides). J exp. Biol. 170,265 -270.
Kuo, L. and Pittman, R. N. 1990. Influence of hemoconcentration on arteriolar oxygen
transport in hamster striated muscle. Am. J. Physiol. 259, H 1694-H 1 702.
Kuwahira, I., Heisler, N., Piiper, J. and Gonzales, N. C. 1993. Effect of chronic hypoxia
on hemodynamics, organ blood flow and 0 2 supply in rats. Respir. Physiol. 92, 227-
238.
Langfeld, K.S., Crockford, T. and Johnson, I. A. 1991. Temperature acclimation in the
common carp: force-velocity characteristics and myosin subunit composition of slow
muscle fibres. J. exp. Biol. 155,291-304.

Laub, M., Hvid-Jacobsen, K, Hovind, P., Kanstrup, I-L., Christensen, N. J. and Nielsen,
S. L. 1993. Spleen emptying and venous hematocrit in humans during exercise. J.
Appl. Physiol. 74, 1024- 1026.
Laurent, P. and Hebibi, N. 1989. Gill morphometry and fish osmoregulation. Can J.
Zool. 67,3055-3063.
Levy, M. L. and Share, L. 1953. The influence of erythrocyte concentration upon
pressure-flow relationships in the dog's hind limb. Circ. Res. 1, 247-255.
Lindenfeld, J., Weil, J. V., Travis, V. L., and Horwitz, L. D. 1985. Hemodynamic
response to normovolemic polycythemia at rest and during exercise in dogs. Circ.
Res. 56, 793-800.
Lindstedt, S. L. 1993. Oxygen delivery to the tissues in animal athletes: keeping up with
demand. In "The Vertebrate Gas Transport Cascade: Adaptations to Environment and
Mode of Life" ( J. E. P. W. Bicuido, ed.). pp. 293-303. Boca Raton. FL: CRC Press.
Lindstedt, S. L. and Jones, J. H. (1987). Symmorphosis: the concept of optimal design. In
"New Directions in Physiological Ecology". (M. Feder, A.G. Bennett, W. Burggren,
R. Huey, eds), pp.289-309. Cambridge, University Press.
Lindstedt, S. L., Wells, D. J., Jones, J. H., Hoppeler, H. and Thronson, H. A. Jr. (1988).
Limitations to aerobic performance in mammals: interaction of structure and demand.
Int. J. Sports Med. 9 , 2 10-2 17.
Lyndon, A. R. 1994. A method for measuring oxygen consumption in isolated perfused
gills. J. Fish Biol. 44, 707-71 5.
Malte, H. and Weber, R. 1989. Gas exchange in fish gills with parallel inhomogeneities.
Respir. Physiol. 76, 129- 138.

MacDonald, J. A. and Wells, R. M. G. 1991. Viscosity of body fluids from Antarctic
Notothenioid Fish. In " Biology of Antarctic Fishes". (G. di Prisco, B. Maresca, B.
Tota, eds). pp. 163- 178. Springer Verlag. New York.
MacDonald, J. A., Montgomery, J. C. and Wells, R. M. G. 1987. Comparative physiology
of Antarctic fishes. Adv. Mar. Biol. 24, 32 1-388.
Manders, W. T. and Vatner, S. F. (1976). Effects of sodium pentobarbital anesthesia on
left ventricular function and distribution of cardiac output in dogs, with particular
reference to the mechanism for tachycardia. Cir. Res. 39, 5 12-5 17.
Mazeaud, M. M. and Mazeaud, F. 1981. Adrenergic responses to stress in fish. In
"Stress in Fish" (A.D.Pickering, ed), pp. 49-76. Academic Press, New York.
McCormick, S. D., Moyes, C. D. and Ballantyne, J. S. 1989. Influence of salinity on the
energetics of gill and kidney of Atlantic salmon (Salmo salar). Fish Physiol.
Biochem. 6,243-254.
McKeever, K. H., Hinchcliff, K. W., Reed, S. M. and Robertson, J. T. 1993a. Role of
decreased plasma volume in hematocrit alterations during incremental treadmill
exercise in horses. Am. J. Physiol. 265, R404-R408.
McKeever, K. H., Hinchcliff, K. W., Reed, S. M., and Harnlin, R. L. 1993b. Splenectomy
alters blood pressure response to incremental treadmill exercise in horses. Am. J.
Physiol. 265, R409-R4 1 3.
Metcalfe, J. D. and Butler, P. J. 1982. Differences between directly measured and
calculated values for cardiac output in the dogfish: A criticism of the Fick method. J.
exp. Biol. 99,255-268.

Milligan, C. L. and Wood, C. M. 1982. Disturbances in haematology, fluid volume
distribution and circulatory function associated with low environmental pH in the
rainbow trout, Salmo gairdneri. J. exp. Biol. 99, 397-415.
Milligan, C. L. and Wood, C. M. 1986a. Intracellular and extracellular acid-base status
and H+ exchange with the environment after exhaustive exercise in the rainbow trout.
J. exp. Biol. 123,93- 12 1.
Milligan, C. L. and Wood, C. M. 1986b. Tissue intracellular acid-base status and the fate
of lactate after exhaustive exercise in the rainbow trout. J. exp. Biol. 123, 123-144.
Miyachi, M. and Tabata, I. 1992. Relationship between arterial oxygen destaturation and
ventilation during maximal exercise. J. Appl. Physiol. 73(6), 2588-2591.
Morgan, J. D. H. and Iwama, G. K. 1991. Effects of salinity on growth, metabolism and
ion regulation in juvenile rainbow trout and steelhead trout (Oncorhynchus mykiss)
and fall chinook salmon (Oncorhynchus tshawytscha). Can. J. Fish Aquat. Sci. 48,
2083-2094.
Motais, R., Guizouarn and Garcia-Romeu, F. 1991. Red cell volume regulation: the
pivotal role of ionic strength in controlling swelling-dependent transport systems.
Biochimica et Biophysica Acta, 1075, 169- 180.
Murad, A., Houston, A. H. and Samson, L. 1990. Haematological response to reduced
oxygen-carrying capacity, increased temperature and hypoxia in goldfish, Carassius
auratus L. J. Fish Biol. 36,289-305.
Murray, J. F., Gold, P. I. and Johnson, B. L. Jr. 1962. Systemic oxygen transport in
induced normovolemic anemia and polycythemia. Am. J. Physiol. 203 (4), 720-724.

Murray, J. F., Gold, P. and Johnson, B. L. 1963. The circulatory effects of hematocrit
variations in normovolemic and hypervolemic dogs. J. Clin. Invest. 42:, 1 150-1 159.
Nahhas, R., Jones, N. V. and Goldspink, G. 1982. Some aspects of sustained training of
rainbow trout, Salmo gairdneri Richardson. J. Fish Biol. 20,35 1-358.
Nash, G. B. and Egginton, S. 1993. Comparative rheology of human and trout red blood
cells. J. exp. Biol. 174, 109-122.
Neuhaum, F.-J., Schmid-Schonbein, H. and Ohlenbusch, H. 1987. Temperature-
dependence of red cell aggregation. Pflugers Arch. 408, 524-530
Neuhaus, D., Behn, C., and Gaehtgens, P. 1992. Haemorheology and exercise: intrinsic
flow properties of blood in marathon running. Int. J. Sports Med. 13 (7), 506-5 1 1.
Nielsen, O.B. and Lykkeboe, G. 1992. Changes in plasma and erythrocyte K+ during
hypercapnia and different grades of exercise in trout. J. Appl. Physiol. 72 (4) 1285-
1290.
Nikinmaa, M. and Huestis, W. H. 1984. Adrenergic swelling of nucleated erythrocytes:
cellular mechanisms in a bird, domestic goose, and two teleosts, striped bass and
rainbow trout. J. exp. Biol. l l 3 , 2 15-224.
Nikinmaa, M., Soivio, A., and Railo, E. 1981. Blood volume of Salmo gairdneri:
influence of ambient temperature. Comp. Biochem. Physiol. 69A, 767-769.
Nilsson, S. 1983. Autonomic Nerve Function in the Vertebrates. Berlin, Heidelberg,
New York. Springer Verlag. 253 pp.
Nilsson, S. 1986. Control of gill blood flow. In "Fish Physiology: Recent Advances" (S.
Nilsson, S. Holmgren,ed.), pp. 87-1 0 1. London: Crornrn Helm.

Nilsson, S. and Grove, D. J. 1974. Adrenergic and cholinergic innervation of the spleen
of the cod: Gadus morhua. Eur. J Pharmac. 28, 135- 143.
Noakes, T. D. 1988. Implications of exercise testing for prediction of athletic
performance: a contemporary perspective. Med. Sci. Sports Exerc. 20, 3 19-330.
Olson, K. R. 1992. Blood and extracellular fluid volume regulation: role of the renin-
angiotensin, kallikrein-kinin systems and atrial natriuretic peptides. In "Fish
Physiology" ( W . S. Hoar, D. J. Randall, A. P. Farrell, eds.), XIIA, pp. 136-232.
Academic Press. New York.
Pace, N., Loner, E. I., Consolazio, W . V., Pitts, G. C., and Pecora, I. J. 1947. The
increase in hypoxia tolerance of normal man accompanying the polycythemia
induced by transfuson of erythrocytes. Am. J Physiol. 148, 152- 163.
Pearson, M. P. and Stevens, E. D. l99la. Size and hematological impact of the splenic
erythrocyte reservoir in rainbow trout, Oncorhynchus mykiss. Fish Physiol. Biochem.
9, 39-50.
Pearson, M. P. and Stevens, E. D. 1991 b. Splenectomy impairs aerobic swim
performance in trout. Can. J 2001. 69,2089-2092.
Perez-Pinzon, M. A. and Lutz, P. L. 1991. Activity related cost of osmoregulation in the
juvenile snook (Centropomus undecimalis). Bull. Mar. Sci. 48, 58-66.
Persson. S. G. B., and Bergsten, G. 1973. Circulatory effects of splenectomy in the horse.
I. Effects on red-cell distribution and variability of haematocrit in the peripheral
blood Zentralbl. Veterinaermed.A. 20,44 1-455.

Persson, S. G. B., Ekrnan, L., Lydin, G. and Tufvesson, G. 1973. Circulatory effects of
splenectomy in the horse. 11. Effect on plasma volume and total and circulating red-
cell volume. Zentralbl. Veterinaermed. 20,456-468.
Persson, S. G. B., and Bergsten, G. 1975. Circulatory effects of splenectomy in the
horse. IV. Effect on blood flow and blood lactate at rest and during exercise.
Zentralbl. Veterinaermed. 22, 80 1-807.
Perry, S. F. and K. M. Gilmour. 1993. An evaluation of factors limiting carbon dioxide
excretion by trout red blood cells in vitro. J. exp. Biol. 180, 39-54.
Perry, S. F. and Kinkead, R. 1989. The role of catecholarnines in regulating arterial
oxygen content during acute hypercapnic acidosis in rainbow trout (Salmo
gairdneri). Respir. Physiol. 77, 365-378.
Perry, S. F. and McDonald, D. G. 1993. Gas Exchange. In "The Physiology of Fishes"
(D. H. Evans, ed.), pp. 251-278.
Perry, S. F. and Reid, S. D. 1992. Relationship between blood 0 2 content and
catecholarnine levels during hypoxia in rainbow trout and American eel. Am. J.
Physiol. 263, R240-R249.
Pew, S. F and Wood, C. M. 1989. Control and coordination of gas transfer in fishes.
Can. J. 2001. 67,2961-2970.
Perry, S. F., Daxboeck, C. and Dobson, G. P. 1985. The effect of perfusion flow rate and
adrenergic stimulation on oxygen transfer in the isolated, saline-perfbsed head of
rainbow trout. J. exp. Biol. 116, 25 1-269.
Perry, S. F., Kinkead, R., Gallaugher, P. and Randall, D. J. 1989. Evidence that
hypoxemia promotes catecholamine release during hypercapnic acidosis in rainbow
trout (Sulmo gairdneri). Respir. Physiol. 77, 35 1-364.
Piiper, J. and Schied, P. 1975. Gas transport efficacy of gills, lungs and skin: Theory and
experimental data. Respir. Phyisol., 23,209-22 1.
Piiper, J. and Schied, P. 1983. Comparison of diffusion and pefision limitations in
alveolar gas exchange. Respir. Physiol. 51,287-290.
Piiper, J., Meyer, M., Worth, H. and Willmer, H. 1977. Respiration and circulation
during swimming activity in the dogfish, Scyliorhinus stellaris. Respir. Physiol. 30,
221-239.
Powers, S. K., Lawler, J., Dempsey, J. A., Dodd, S. and Landry, G. 1989. Effects of
incomplete pulmonary gas exchange on V 02rnax. J Appl Physiol. 66 (6), 2491 -
24%.
Pries, A. R. , Neuhaus, D. and Gaehtgens, P. 1992. Blood viscosity in tube flow:
dependence on diameter and hematocrit. Am. J Physiol. 263, H1770-H1778.
Primmett, D. R. N., Randall, D. J., Mazeaud, M. and Boutilier, R. G. 1986. The role of
catecholamines in erythrocyte pH regulation and oxygen transport in rainbow trout
(Salmo gairdneri) during exercise. J. exp. Biol. 122, 139- 148.
Rand, P. W., Lacombe, E., Hunt, E. H. and Austin, W. H. 1964. Viscosity of normal
human blood under normothermic and hypothermic conditions. J. Appl. Physiol. 19
(1). 117-122.
Randall, D. J. and Cameron, J. N. 1973. Respiratory control of arterial pH as temperature
changes in rainbow trout, Salmo gairdneri. Am. J Physiol. 225,997-1 002.

Randall, D. J., Baumgarten, D. and Malyusz, M. 1972. The relationship between gas and
ion transfer across the gills of fishes. Comp. Biochem. Physiol. 41A, 629-637.
Rao, G. M. M. 1968. Oxygen consumption of rainbow trout (Salmo gairdneri) in relation
to activity and salinity. Can. J. Zool. 46, 78 1-786.
Rao, G. M.M. 1969. Effect of activity, salinity and temperature on plasma concentrations
of rainbow trout. Can. J. Zool. 47, 13 1 - 134.
Richardson, T. Q., and Guyton, A.C. 1961. Effects of polycythemia and anemia on
cardiac output and other circulatory factors. Am. J. Physiol. 197 (6), 1 167- 1 170.
Ristori, M. T. and Laurent, P. 1985. Plasma catecholamines and glucose during moderate
exercise in the trout: comparison with bursts of violent activity. Experimental Biol.
44, 247-253.
Roberston, R. J., Gilcher, R., Metz, K. F., Skrinar, G. S., Allison, T. G., Bahnson, H. T,
Abbot, R. A., Becker, R., and Falkel, J. E. 1982. Effect of induced erythrocythemia
on hypoxia tolerance during physical exercise. J. Appl. Physiol. 53 (2), 490-495.
Robertson, R. J., Gilcher, R., Metz, K. F., Caspersen, C. J., Allison, T. G., Abbott, R. A.,
Skrinar, G. S., Krause, J. R. and Nixon, P. A. 1984. Haemoglobin concentration and
aerobic work capacity in women following induced erythrocythaemia. J. Appl.
Physiol 57 (2), 568-575.
Roca, J., Hogan, M. C., Story, D., Bebout, D. E., Haab, P., Gonzalez, R., Ueno, 0 . and
Wagner. P. D. 1989. Evidence for tissue diffusion limitation of V 0 2 ~ ~ in normal
humans. J. Appl. Physiol. 67 (I), 29 1-299.

Roca, J., Agusti, A., Alonso, A., Poole, D., Viegas, C., Barbera, J., Rodriguez-Roisin, R.,
Ferrer, A. and Wagner, P. D. 1992. Effects of training on muscle 0 2 transport at
V 0 2 ~ ~ J Appl. Physiol. 73 (3), 1067-1 076.
Rome, L. C., Funke, R. P. and Alexander, R. M. 1990. The influence of temperature on
muscle velocity and sustained performance in swimming carp. J. exp. Biol. 154, 163-
178.
Saltin, B. and Rose, R. J. 1994. The racing camel. Acta Physiol. Scand. 150, SUPPI. 61 7,
9 5 ~ ~ .
Saltin, B. and Strange, S. 1992. Maximal oxygen uptake; "old" and "new" arguments for
a cardiovascular limitation. Med. Sci. Sports Exer.24 (I), 30-37.
Sarelius, I. H. 1989. Microcirculation in striated muscle after acute reduction in systemic
hematocrit. Respir. Physiol. 78, 7- 1 7.
Sarelius, I. H. and Sinclair, J. D. 1981. Effects of small changes of blood volume on
oxygen delivery and tissue oxygenation. Am. J Physiol. 240, H 1 77-H 184.
Satchell, G. H. 1991. In "Physiology and Form of Fish Circulation." 233p. Cambridge
University Press, Cambridge, England.
Sawka, M. N. and Young, A. J. 1989. Acute polycythemia and human performance
during exercise and exposure to extreme environments. Exer. Sports Sci. Rev. 17,
265-293.
Sawka, M. N., Young, A. J., Muza, S. R., Gonzalez, R. R. and Pandolf, K. B. 1987a.
Erythrocyte reinfusion and maximal aerobic power. An examination of modifying
factors. J A. M. A. 257, 1496- 1499.

Sawka, M. N., Dennis, R. C., Gonzalez, R. R., Young, A. J., Muza, S. R., Martin, J. W.,
Wenger, C. B., Francesconi, R. P., Pandolf, K. B., and Valeri, C. R. 1987b. Influence
of polycythemia on blood volume and thermoregulation during exercise-heat stress.
J Appl. Physiol. 62 (3), 91 2-91 8.
Schaffartzik, W., Barton, E. D., Poole, D. C., Tsukimoto, K., Hogan, M. C., Bebout, D.
E. and Wagner, P. D. 1993. Effect of reduced hemoglobin concentration on leg
oxygen uptake during maximal exercise in humans. J. Appl. Physiol. 75 (2), 491-498.
Schmid-Schonbein, H., Wells, R. and Goldstone, J. 1969. Influence of deformability of
human red cells upon blood viscosity. Circ. Res. 25, 13 1 - 142.
Schmidt, W., Maasen, N., Trost, F. and Boning, D. 1988. Training induced effects on
blood volume, erythrocyte turnover and haemolglobin oxygen binding properties.
Eur. J Appl. Ph~siol . 57,490-498.
Schmidt, W., Eckardt, K. U., Hilgendorf, A. , Strauch, S., and Bauer, C. 1991. Effects of
maximal and submaximal exercise under normoxic and hypoxic conditions on serum
erythropoietin level. Int. J Sports Med. 12,457-461.
Schumacker, P. T., Guth, B., Suggett, A. J., Wagner, P. D. and West, J. B. 1985. Effects
of transfusion induced polycythemia on 0 2 transport during exercise in the dog. J.
Appl. Physiol. 58 (3), 749-758.
Shorrock, J. E. T. and Hillman, H. 1969. The viscosity of rat blood between the
temperatures of 2 and 350 C. Cryobiolog~ 5 (5), 324-327.
Sisson, J. E. and Sidell, B. D. 1987. Effect of thermal acclimation on muscle fiber
recruitment of swimming striped bass (Morone saxatilis). Physiol. Zool. 60 ,3 10-320.

Smith, L. S. 1966. Blood volumes of three salmonids. J. Fish. Res. Bd. Can. 23, 1439-
1446.
Smith, F.M. and Jones, J.R. 1982. The effect of changes in blood oxygen carrying
capacity on ventilation volume in the rainbow trout (Salmo ga~rdneri). J. exp. Bio/.
97, 32.5-334.
Snyder, G. K. 197 1. Influence of temperature and hematocrit on blood viscosity. Am. J.
Physiol. 220(6), 1667- 1672.
Soivio, A., Nyholm, K. and Westman, K. 1975. A technique for repeated sampling of the
blood of individual resting fish. J. exp. Biol. 62,207-21 7.
Spriet, L. L., Gledhill, N., Froese, A. B. and Wilkes, D. L. 1986. Effect of graded
erythrocythemia on cardiovascular and metabolic responses to exercise. J. dppl.
Physiol. 61(5), 1942- 1948.
Stevens, E. D. 1968. Change in body weight caused by handling and exercise in fish. J.
Fish. Rex Bd. Can. 29,202-203.
Stone, H. O., Thompson, H. K. and Schmidt-Nielsen, K. 1968. Influence of erythrocytes
on blood viscosity. Am. J. Physiol. 214 (4), 91 3-91 8.
Tang, Y. and Boutilier, R. G. 1988. Correlation between catecholamine release and
degree of acidotic stress in trout. Am. J. Physiol. 255, R395-R399.
Tang, Y., Nolan, S. and Boutilier, R. G. 1988. Acid-base regulation following acute
acidosis in seawater-adapted rainbow trout, Salmo gairdneri: a possible role for
catecholamines. J. exp. Biol. 134, 297-3 12.

Tang, Y., McDonald, D. G. and Boutilier, R. G. 1989a. Acid-base regulation following
exhaustive exercise: a comparison between freshwater- and seawater-adapted
rainbow trout (Salmo gairdneri). J. exp. Biol. 141,407-41 8.
Tang, Y., McDonald, D. G. and Boutilier, R. G. 1989b. Adrenergic regulation of blood
acid-base status following exhaustive exercise in seawater-adapted rainbow trout,
Salmo gairdneri. Physiol. 2001. 62 (4), 950-963.
Taylor, C. R. and Wiebel, E. R. 198 1. Design of the mammalian respiratory system. 1.
Problem and strategy. Respir. Physiol. 44, 1 - 10.
Taylor, E. B. and Foote, C. J. 199 1. Critical swimming velocities of juvenile sockeye
salmon and kokanee, the anadromous and non-anadromous forms of Oncorhynchus
nerka (Walbaum). J. Fish Biol. 38,407-419.
Thomas, S., Poupin, J., Lykkeboe, G. and Johansen, K 1987. Effects of graded exercise
on blood gas tensions and acid-base characteristics of rainbow trout. Respir. Physiol.
68, 85-97.
Thomson, J. M., Stone, J. A., Ginsburg, A. D. and Hamilton, P. 1982. O2 transport
during exercise following blood reinfusion. J. Appl. Physiol. 53 ( 5 ) , 12 13- 12 19.
Thorarensen, H. 1994. Gastrointestinal oxygen transport in fed and unfed chinook
salmon, Oncorhynchus tshawytscha. PhD Thesis. Simon Fraser University, B.c.
Thorarensen, H., Gallaugher, P. E., Kiessling, A. K., and Farrell, A. P. 1993. Intestinal
blood flow in swimming chinook salmon Oncorhynchus tshawytscha and the effects
of haematocrit on blood flow distribution. J. exp. Biol. 179, 11 5-129.

(Lonnberg): effects of loading conditions and temperature. Phil. Trans. R. soc.
Lond. B 332, 191 -1 98.
Tota, B., Agnisola, C., Schioppa, M., Acierno, R., Harrison, P. and Zummo, G. 1991 b.
Structural and mechanical characteristics of the heart of the icefish, Chionodraco
hamatus (Lonnberg). In "Biology of Antarctic Fishes" (G. di Prisco, B. Maresca, B.
Tota, eds.). pp 204-219. Springer Verlag. New York.
Tun, N. and Houston, A. H. 1986. Temperature, oxygen, photoperiod, and the
hemoglobin system of the rainbow trout, Salmo gairdneri. Can. J 2001. 64, 1883-
1888.
Turner, D. L., Hoppeler, H., Noti, C., Gurtner, H. -P., Gerber, H., Schena, F., Kayser, B.
and Ferretti, G. 1993. Limitations to V 02,, in humans after blood retransfusion
Respir. Physiol. 92, 329-34 1.
Vatner, S.F., Higgins, C.B. and Franklin, D. 1972. Regional circulatory adjustments to
moderate and severe chronic anaemia in conscious dogs at rest and during exercise.
Circ. Res. 30, 73 1-740.
Vatner. S. F., Higgins, C. B., Millard, R. W. and Franklin, D. 1974. Role of the spleen
in the peripheral vascular response to severe exercise in untethered dogs. Cardiovas.
Res. 8, 276-282.
Vorger, P. and Ristori, M.-T. 1985. Effects of experimental anemia on the ATP content
and the oxygen affinity of the blood in the rainbow trout (Salmo gairdneri). Cornp.
Biochem. Physiol. 82A ( I ) , 22 1-224.
Wagner, P. D. 1992. Gas exchange and peripheral diffusion limitation. Med. Sci. Sports
Exerc. 24 (I), 54-58.

Wagner, P. D. 1993. Algebraic analysis of the determinants of V 0 2 ~ ~ Respir. Physiol.
93,221-237.
Wagner, P. D., Gillespie, J. R., Landgren, G. L., Fedde, M. R., Jones, B. W., DeBowes,
R. M., Pieschl, R. L., and Erickson, H. H. 1989. Mechanism of exercise-induced
hypoxemia in horses, J Appl. Physiol. 66 (3), 1227- 1233.
Weathers, W. W. 1976. Influence of temperature on the optimal hematocrit of the
bullfrog (Rana catesbeiana). J Comp. Physiol. 105, 173-1 84.
Webb, P. W. 1971. The swimming energetics of trout. 11. Oxygen consumption and
swimming efficiency. J exp. Biol. 55,52 1-540.
Webb, P. W. 1975. Hydrodynamics and energetics of fish propulsion. Bull. Fish. Res.
Bd. Can. 190, 158 pp.
Webb, P. W. 1993. Swimming. In "The Physiology of Fishes" (D. H. Evans, ed.), pp. 47-
73.
Weber, R. E. and Jensen, F. B. 1988. Functional adaptations in hemoglobins from
ectothermic vertebrates. Ann. Rev. Physiol. 50, 1 6 1 - 1 79.
Weibel, E. R. and Taylor, C. R. 198 1. Design of the mammalian respiratory system.
Respir. Physiol. 44, 1-1 64.
Weibel, E. R., Taylor, C. R. and Hoppeler, H. 1992. Variations in function and design:
Testing syrnrnorphosis in the respiratory system. Respir. Physiol. 87, 325-348.
Weihs, D. 1984. Bioenergetic consideration in fish migration. In "Mechanisms of
migration in fishes. (J.D. McCleave, G.P. Arnold. J.J. Dodson, W.H Neill, eds), pp.
487-508. Plenum Pub. Corp. N. Y.

Weisse, A. B., Calton, F. M., Kuida, H. and Hecht, H. H. 1964. Hernodynamic effects of
normovolemic polycythemia at rest and during exercise. Am. J. Physiol. 207, 136 1 -
1366.
Wells, R. M. G. and Baldwin, J. 1990. Oxygen transport potential in tropical reef fish
with special reference to blood viscosity and hematocrit. J. Exp. Mar. Biol. Ecol.
141, 131-143.
Wells, R. M. G. and Forster, M. E. 1989. Dependence of blood viscosity on haematocrit
and shear rate in a primitive vertebrate. J. exp. Biol. 145,483-487.
Wells, R. M. G. and Weber, R.E. 1990 The spleen in hypoxic and exercised rainbow
trout. J. exp. Biol. 150,46 1-466.
Wells, R. M. G. and Weber, R. E. 1991. Is there an optimal haematocrit for rainbow trout,
Oncorhynchus mykiss (Walbaum)? An interpretation of recent data based on blood
viscosity measurements? J. Fish Biol. 38, 53-65.
Wells, R. M. G., MacDonald, J. A. and diPrisco, G. 1990. Thin-blooded Antarctic fishes:
a rheological comparison of the haemoglobin-free icefishes, Chionodraco kathleenae
and Cryodraco antarcticus , with a red-blooded nototheniid, Pagothenia bernacchii.
J. Fish Biol. 36, 595-609.
Wells, R. M. G., Davie, P. S. and Weber, R. E. 1991. Effect of P-adrenergic stimulation
of trout erythrocytes on blood viscosity. Cornp. Biochem. Physio1.100~, 653-655.
Whittaker, S. F. R. and Winton, F. R. 1933. The apparent viscosity of blood flowing in
the isolated hind limb of the dog and its variation with corpuscular concentration. J.
Physiol. Lond. 78,339-369.

Wickam, L. L., Elsner, R., White, F. C. and Cornell, L. H. 1989. Blood viscosity in
phocid seals: possible adaptations to diving. J Comp. Physiol. B. 159, 153-1 58.
Williams, M. H., Wesseldine, S., Somrna, T. and Schuster, R. 1981. The effect of
induced erythrocythemia upon Smile treadmill run time. Med. Sci. Sports Exercise
13, 169-175.
Winz, R. A. 1985. A genetic basis for swim stamina differences between strains of the
rainbow trout, Salmo gairdneri. M. Sc. Thesis. University of B.C.
Withers, P. C., Hillman, S. S., Hedrick, M. S. and Kimmel, P. B. (1991). Optimal
hematocrit theory during activity in the bullfrog (Rana catesbeiana). Cornp.
Biochem. Physiol. 99A, 55-60.
Wood, C. M. 1991. Acid-base and ion balance, metabolism, and their interactions, after
exhaustive exercise in fish. J. exp. Biol. 160, 285-308.
Wood, C.M. and Perry, S.F. 1985. Respiratory, circulatory, and metabolic adjustments
to exercise in fish. In "Circulation, Respiration, Metabolism" (R. Gilles, ed.), pp. 2-
22. Berlin: Springer-Verlag.
Wood, C.M. and Randall, D.J. 1973. The influence of swimming activity on water
balance in the rainbow trout (Salmo gairdneri). J Comp. Physiol. 82, 257-276.
Wood, C. M. and Shelton, G. 1980. The reflex control of heart rate and cardiac output in
the rainbow trout: interactive influences of hypoxia, hemorrhage and systemic
vasomotor tone. J. exp. Biol. 87,27 1-284.
Wood , C. M., Pieprzak, P., and Trott, J. N. 1979. The influence of temperature and
anaemia on the adrenergic and cholinergic mechanisms controlling heart rate in the
rainbow trout. Can. J. 2001. 57,2440-2447.

Wood, C. M., MacDonald, D. G. and McMahon, B. R. 1982. The influence of
experimental anaemia on blood acid-base regulation in viva and in vitro in the s t q
flounder (Platichthys stellatus) and the rainbow trout (Salmo gairdneri). J exp. Biol.
96, 221-237.
Woodson, R. D., Wills, R. E. and Lenfant, C. 1978. Effect of acute and established
anemia on 0 2 transport at rest, submaximal and maximal work. J Appl. Physiol.
44(1), 36-43.
Woodward, J. J. and Smith, L. S. 1985. Exercise training and the stress response in
rainbow trout, Salmo gairdneri Richardson. J Fish Biol. 26,435-447.
Yarnarnoto, K. I., Itazawa, Y and Kobayashi, H. 1980. Supply of erythrocytes into the
circulating blood from the spleen of exercised fish. Comp. Biochem. Physiol. 6 5 4 5-
11.
Young, P. S. and Cech, J. J. Jr. 1993. Effects of exercise conditioning on stress responses
and recovery in cultured and wild young-of-the-year striped bass, Morone saxatilis.
Cbn. J Fish. Aquat. Sci. 50,2094-2099.
Zbanyszek, R. and Smith, L. 1984. Changes in carbonic anhydrase activity in coho
salmon smolts resulting from physical training and transfer into seawater. Cornp.
Biochem. Physiol. 79A (2), 229-233.
Zhan, M., Dean, C. B., Routledge, R., Gallaugher, P., Thorarensen, H. and Farrell, A. p.
1994. Use of a segmented polynomial model far examining the Optimal Hematocrit
Hypothesis. Submitted to Biometries.

Appendix 1 . Swimming performance and haematological variables in splenectomized rainbow trout.

J . rxp. B i d . 171. 301-314 (1992) Prinrrtl in Creur Brlraln 0 Thr Cornpuny of Bdogisrs Llrnirrtf 1992
SWIhl%fING PERFORMANCE AND HAEMATOLOGICAL VARIABLES IN SPLENECTOiLIIZED RAINBOW TROUT,
ONCORHYNCHUS MYKISS
BY P. GALLAUGHER, M. AXELSSON A N D A. P. FARRELL
Department of Biological Sciences, Simon Fraser Unirpersity, Biirnaby, British Columbia, Canada VjA IS6
Summary
Haematological variables were measured during aerobic swimming (45-55 % of U,,,,) and at critical swimming velocity (u,,,,) in acutely splenectomized and sham- operateci rainbow trout. There was no correlation between haematocrit (Hct) and U,,,, in either group of tish. The control values for the haematological variables did not differ significantly between the two groups of fish. Some haematological variables changed during aerobic swimming and at (/,,,,. but there were no significant differences between the two groups for any of the variables. Arterial blood oxygen tension was significantly reduced at Ucrl,. Arterial blood oxygen content (Cao:) was maintained in sham-operated fish because the Hct increased significantly. However, in the splenectomized animals. Cao, decreased (compared to control values) during aerobic swimming and at u,,,, because the Hct did not change. Plasma concentrations of lactate and catecholamines were elevated only at C/,,,,. We provide evidence of a graded spleen contraction during aerobic swimming.
Introduction
One factor which may limit aerobic swimming performance of fish is the oxygen- carrying capacity o f the blood. An earlier study with rainbow trout demonstrated that phenylhydrazine-induced anaemia or exposure to hypoxia reduced aerobic swimming performance (Jones, 1971). Moreover, this response was apparently correlated with temperature. Anaemic fish that were cold-acclimated ( 8 - 1 0 0 ~ ) had a 40 O/o lower haematocrit (Hct) and a 3-l yo lower critical swimming velocity (U,,,,) than non-anaemic fish, whereas warm-acclimated (21-23•‹C) anaemic fish showed a 67% decrease in Hct and a 40% decrease in ucr,, compared to non- anaemic fish held at the same temperature. In addition. hypoxic exposure r e d u c d swimming performance by 43 % in cold-acclimated fish but by only 3 0 % in the warm-acclimated group. In this case, the better swimming performance of the warm-acclimated fish was associated with an 8 % higher Hct. Although these results suggest that blood oxygen-carrying capacity may be an important factor in


Swimming and haematology in splenectomized tro~lt 303
Stevens (1991a) and in support o f those of Jones (1971), we were unable to demonstrate a significant relationship between Hct and Ucri,.
Materials and methods
E.rperimenra1 animals
Rainbow trout, Oncorhynchus mykiss (Walbaum). were obtained from a local hatchery (West Creek Trout Farm. Aldergrove, BC) and held outdoors in a 200-1 fibreglass tank for at least 1 month prior to experimentation. Aerated dechlori- nated tap water flowed through the tank at 5 I min-l. the temperature varying from 17 to 19•‹C. The mean body masses and lengths for both groups of fish were 530-738g and 36-41 cm, respectively.
Fish were netted and immediately anaesthetized in a l:l0(MlO solution of tricaine methanesulphonate MS222 (Sigma Chemicals, St Louis). buffered to p H 7.5 with sodium bicarbonate. Body dimensions were determined and the fish were transferred to an operating sling where their gills were irrigated with a buffered solution o f 1:30000 MS222 during surgery. A cannula was inserted into the dorsal aorta as described by Soivio e ta[ . (1975) using polyethylene tubing (PE-50, Intramedic, Parsippany, NJ) filled with heparinized (50i.u. ml-I) saline. In one group of fish (splenectomized fish), a small abdominal incision was made, and blood vessels to the spleen were tied off before removal of the spleen. In another uroup (sham-operated fish). the same procedure was followed except that the 2
spleen was not removed and the blood vessels to the spleen were not tied off . The two different surgical procedures were used alternately as fish were caught from the stock aquarium. Recovery from the anaesthetic was initiated by irrigating the gills with fresh ~vater until body movements began. The fish were then allowed to recover and swim freely in oval aquaria for at least 48 h prior to experimentation.
E.rperimenra1 protocol
Swimming trials Fish were transferred from the holding aquarium to a s~vim tunnel similar to that
described by Gehrke et al. (1990) and held with the water velocity at 10cm s-I for at least 4 h prior to swimming trials. The temperature of the water in the swim tunnel ranged from 18 to 19•‹C. A swimming step test was used to determine f f C r i ,
as fo l l ows . Water velocity was increased in increments of locms- ' and the fish swam for 10 min at each speed until fatigued. Fish were considered to be fatigued when they remained on an 8 V electrified grid at the rear of the tunnel for at least 10s. The time swum at that water velocity was noted. Fatigue is a discrete event which occurs when the fish can no longer swim at the imposed water velocity. Therefore, to get a representative blood sample at Ucrit, we quickly reduced the

swimming speed bv one step so that the fish continued swimming while the blood was sampled. U,,,, values were calculated after appropriate adjustment for the blocking effect of the fish (Bell and Terhune, 1970). Water velocity was calibrated prior to the swimming trials using a pitot tube (Gehrke er al. 1990). The oxvgen . L
tension of the water was never less than 19 kPa (140 mmHg).
Blood samples
Arterial blood samples (0.6ml) were taken before the swim at 10cms-' (control), during aerobic swimming at 40cm s-' (45-55 % of I/,,,,), and immedi- ately after U,,,, had been reached but while the fish was kept swimming at a velocity of approximately 90 % of C/,,,,. Sampling was completed within 30s of the reduction in swimming speed. Blood samples were replaced with an equivalent volume o f heparinized saline. The dorsal aorta cannula was connected to a pressure transducer (Narco, LDIS) and a chart recorder (Gould, RS3400) during the entire experiment to provide a continuous record of dorsal aortic blood pressure ( P D A ) . Heart rates C ~ H ) were determined from the P D A traces.

Swimming and haematology in splene~torni~ed troirt 305
Results
There was no significant difference between the U,,,, values obtained for splenectomized and sham-operated fish (Fig. 1B). Although Hct values varied widely (22-40 % for sham-operated fish; 73-35 % for splenectomized fish), there was no significant correlation between U,,,, and Hct for either of the groups. Under control conditions, f ~ , Paol. Gaol, [lactate]. [protein]. [catecholamine], Hct. bICV, MCHC and RBC counts were not significantly different in sham- operated compared with splenectomized fish (Figs l A , ?A,B; Table 1). While there were significant changes from control values in some of these variables during sustained swimming ( 1 5 5 5 % of u,,,,) and at I/,,,,, there were no significant differences between the two groups. Since there were no differences between the groups, the following description applies to both groups except where noted.
Cllnrlges associated with aerobic sbvimming
When fish were swimming at approximately half of their U,,,,, both arterial blood pressure and heart rate were elevated significantly but there was no significant change in plasma lactate, protein or catecholamine concentrations. Hct and Ca,,, were significantly lower than in the controls (Figs IA, 2B). Pao, was significaitly decreased in sham-operated but not splenectomized fish (Fig. 2 ~ ) .

Fig. 2 . ( A ) Arterial blood oxkgen tension ( Pao,) of sham-operated (open bars, N=8) and splenectomized (filled bars. ,h'= 10) rainbow trout under control conditions, during sustained aerobic swimming (45-55 96 of Lr,,,,) and at critical swimming speed (U,,,,). Vertical bars indicate s . t . u . Significant differences from the control value (P<O.Oj, paired test) are indicated hy an asterisk for aerobic swimming and a dagger for U,,,,. ( B ) Arterial blood ouygsn contznt (Cao,) of sham-operated (open bars, iV=lO) and splcnsctomizcd (filled bars. A'= I I ) rainbow trout undcr control conditions. during sust;~ined aerobic swimming (45-55 % of L:,,,) and at critical swimming speed (U,,,,). Significant differences from the control value (P<0.05. paired test) are indicated by an asterisk for aerobic wimming and a d q g e r for L',,,,. Shaded area indicates the ehtimated change in Cao. duc to splenic blood cell transfusion (see Fig. 3 and text for explanation).
When fish were swimming at U,,,, there were significant changes in most of the haematological variables. Compared with control values, PDA was elevated by 23 % and heart rate was elevated by 32--39 %. Plasma lactate and catecholamine concentrations were significantly increased (Table 2) . Pao, was significantly decreased compared with controls in both sham-operated and splenectomized fish (Fig. 7A). MCHC was decreased and MCV was increased, indicating significant erythrocyte swelling (Table I ) . Compared with control values, Hct was increased by 6.7% in sham-operated fish but was unchanged in the splenectomized group (Fig. 1 ) . Although Cao, was unchanged compared with control values in sham-

Swimming and hnenzatology in splenectomized trout 307
Table 1. Recorded and calcrilated haematological variables in the sham-operated nnti splenectomized rainbow trout under control conditions, during sustained
aerobic swimming (35-55 % U,,,,) and at critical swimming speed (U,,,,)
Rest 45-55 % of L',.,,, crc r , t IV
Sham-operated PDA (kPa) fn (beats min-') I O - ' X RBC (mm-3) MCV ( H ) hlCHC (g I - I ) [Lactate] (mmol I - ' ) [Noradrenaline] (nmol I - ' ) [Adrenaline] (nmol I- ' )
Splcnectomized PDA (kPa)
fti (beatsmin-I) IO-'X RBC (mm-') MCV ( H ) MCHC (g I - ' ) (Lactate] (mmol I - ' ) [Noradrenaline] (nmol I- ' ) [Adrenaline] (nmol I - ' )
Values are m e a n t s . ~ . a l . kSignificantly different from rest value (P<O.Oj. Wilcoxon signed-ranks test for paired
samples). +Significantly different from 45-55 % U,,,, value (P<0.05. Wilcouon signed-ranks test for
paired samples). /'I-,\, dorsal aortic pressure; f ~ , heart rate; RBC, red blood cells: MCV, mean cell volume:
hlCHC, mean cell hacmoglobin concentration.
operated fish, the Cao, of splenectomized fish was even lower than that during sustained swimming (Fig. 2B).
Effect of blood sampling
During these experiments 1.2ml of blood was removed from the fish and replaced with 1.2ml of saline. To test the possibility that haemodilution may have occurred as a result of blood sampling, the sampling protocol was repeated on separate groups of sham-operated and splenectomized trout which were not exercised. The results showed that sampling had no significant effect on the Hct values of either group after removal of the first 0.6 rnl blood sample [the absolute change in Hct was -0.67% (s.~.b1.=0.65) for nine sham-operated fish and -0.59 % (s.~.b1.=0.34) for nine splenectomized fish]. After removal of the second 0.6ml blood sample, the Hct of sham-operated fish again did not change significantly [the absolute change in Hct was +0.46% (s.~.bt.=0.65) for nine sham-operated fish]; however, there was a significant decrease in the Hct of

splenectomized fish [the absolute change in Hct was -1.20% (s .~.hi .=0.45) for nine splenectomized fish]. In fact, when the blood removal procedure was extended by removing 0.5 ml of blood at 30 min intervals, more than 3 ml of blood had to be removed to produce a 4 % decrease in Hct in sham-operated fish.
Factors contributing to observed changes in haematocrit
The results presented in Fig. 3 are based on the assumption that observed changes in Hct are due to a combination of four separate changes: transfusion of cells from the spleen, erythrocyte swelling, the blood sampling procedure, and shifts of fluid between the red blood cells and the plasma. The values reported for Hct and for the change due to sampling are measured values. The values for erythrocyte swelling were calculated from the MCV and MCHC, and the percentage difference in these values was compared to control values. Since the splenectomized group cannot use the spleen transfusion route to change Hct, the change in Hct due to fluid shift for splenectomized fish was deduced as follows:
Observed
Changes due to I Sampling I Fluid shifts 1 Mean cell volume
;.Spleen transfusion
Observed
Changes due to I L ' c ~ I Sampling
Fluid shifts
Mean cell volume I C1
Percentage change in Hct
Fig. 3. Estimates of the relative contribution of blood sampling. fluid shifts, cell swelling and splenic blood transfusion to the observed changes in haematocrit (Hct) during swimming in ( A ) splenectomized and ( B ) sham-operated rainbow trout (see text for details of the calculations).

Swimming and haematology in s p l e n e c t ~ m i ~ e d trout 309
change in fluid volume=(observed Hct+change due to sampling-change due to cell swelling). Then, by assuming that the fluid shifts in sham-operated fish were equal to those of splenectomized fish, excepting minor differences due to changes resulting from sampling, we were able to estimate the change due to spleen transfusion in the sham-operated fish by comparing the two groups of fish. With this value we were able to show the proportion of Cao, due to spleen transfusion in the sham-operated fish as swimming intensity increased (hatched area in Fig. 2B).
Discussion
Contrary to the results of Pearson and Stevens (19910) we found no difference in the average UCri, values of splenectomized and sham-operated fish, indicating that aerobic swimming performance was not affected by spleen removal. Moreover, we were unable to establish a positive correlation between Hct and U,,,, in either group of fish, supporting the results of Jones (1971).
In reviewing the work of Pearson and Stevens (1991~). we note that, while the splenectomized fish clearly did not perform as well as the sham-operated group, we question the validity of their conclusions about a correlation between lower U,,,, values and reduced Hct and [Hb] in the splenectomized fish. They were unable to establish a relationship between Hct and U,,,, within each group of fish, and thus the significance of their regression for the Hct and Ucri, relationship for the combined data sets is questionable, particularly given the large degree of overlap of individual Hct values for the two experimental groups. Furthermore, the [Hb] and U,,,, regression is only significant at the 10% level. [Hb] is a more accurate measure of blood oxygen-carrying capacity than is Hct as i t does not reflect changes caused by stress-induced cell swelling. Thus, the relationship between oxygen-carrying capacity of the blood and aerobic performance of the two groups of fish in the study by Pearson and Stevens (1991a) was only significant at the 10% level. Finally. since Pearson and Stevens did not report initial Hct values for either group of fish, we cannot be sure that the better performance in the sham-operated fish was the result of an increased Hct due to addition of cells from the spleen. It is possible that the two groups of fish had a differential response to handling stress.
There are several observations which may explain some of the differences between the results of the present study and those of Pearson and Stevens (1991~). Our study was conducted at 1SoC but their fish were swimming at 8.2"C. The results of Jones (1971) and others have shown temperature-related differences in swimming performance of rainbow trout. Moreover, Pearson and Stevens assessed the chronic effects of splenectomy on swimming performance 6 months after spleen removal, whereas we used acute splenectomy (38 h recovery) to assess the role of spleen transfusion during aerobic swimming.
The lack of difference in haematological values between the sham-operated and splenectomized groups of fish in the present study is in agreement with results of other studies, where the shorter-term effects of splenectomy were assessed.

Johansson-Sjobeck (1979) reported no significant differences in Hct, [Hb] o r MCV in unoperated compared with splenectornized groups of eels after 1 week. In addition, Perry and Kinkead (1989) observed no differences in Hct and [Hb] between splenectomized and sham-operated rainbow trout 2 months after surgery.
Control Hct values observed here (27.72 1.84 %, s.E.M., for sham-operated fish. N = 12: 32.6k2.76 %, s .E.M., for splenectomized fish, iL'=ll) are similar to those o f other studies using cannulated rainbow trout. In an analysis of Hct data from a number of these studies, Wells and h'eber (1991) reported control Hct values ranging from 17 to 30 %. Compared ni th the Hct values reported by Pearson and Stevens (1991~) for non-cannulated rainbow trout at U,,,,, our Hct values were similar for splenectomized fish (32.522.94 %, s.E.ar., N = l l vs 3 3 . l k l . 9 %, s.E.M.) but lower for sham-operated fish (34.4f 2.7 %, S.E.M. vs 42.021.5 %, s.E.M.). Additionally, in support o f the observations of Wells and Weber (1991), we found that the variability of Hct \ .dues within groups exceeded that caused by experimental manipulation, i .e. alteration of skvimming velocity. This variability as kvell as the lack of correlation bet\veen U,,,, and Hct in both groups of fish suggests that individual differences in Hct are compensated for by a number of interacting adjustments in the cardio~.ascular system during swimming.
As in other studies (Butler et al. 1992; Nielsen and Lykkeboe, 1992; Thomas et 01. 1987). there was a significant increase in Hct at UCri , in sham-operated fish. The absence of this increase in splenectomized fish indicates that the increase in Hct is due to a transfusion o f cells from the spleen. The higher red blood cell count in sham-operated but not in splenectomized fish supports this observation. Other investigators have reported splenic constriction following exhaustive (anaerobic) exercise in a number o f different fish species (Yamamoto et 01. 1980; Yamamoto, 1989. 1991) including rainbow trout (Milligan and Wood, 1987; Kita and Itazawa, 1989; Wells and Weber, 1990, 1991: Pearson and Stevens, 1991a.b).
The observation that the aerobic s\vimming performance of splenectomized fish was not compromised by spleen removal leads us to question the view that the dominant role of the spleen transfusion response (increasing Hct) is to enhance aerobic swimming performance. Instead. we propose the following relationships for Hct and critical swimming speed in rainbow trout. Very low Hct values (below around 2 0 % ) reduce aerobic swimmins performance in rainbow trout, presum- ably as a result of reduced blood oxygen-carrying capacity caused by a lower blood [Hb] (Jones, 1971). In contrast. the ele\.ated blood viscosity associated with very high Hct values may impede blood oxygen transport, thereby reducing swimming performance in the way suggested by LVells and Weber (1991). who put forward an optimal Hct concept. We propose that there are lower and upper 'threshold Hcts' between which there is a weak relationship between UCri , and Hct, and that the 'plateau' between the lower and upper thresholds probably spans the normal range for Hct in rainbow trout (approximately 25-40%). Thus, rather than a discrete peak for the 'optimal' Hct (Wells and Weber, 1991). we propose a broader 'optimal plateau'. This weak relationship between U,..;, and physiological Hct valucs may account for the differing conclusions of earlier studies. There are a
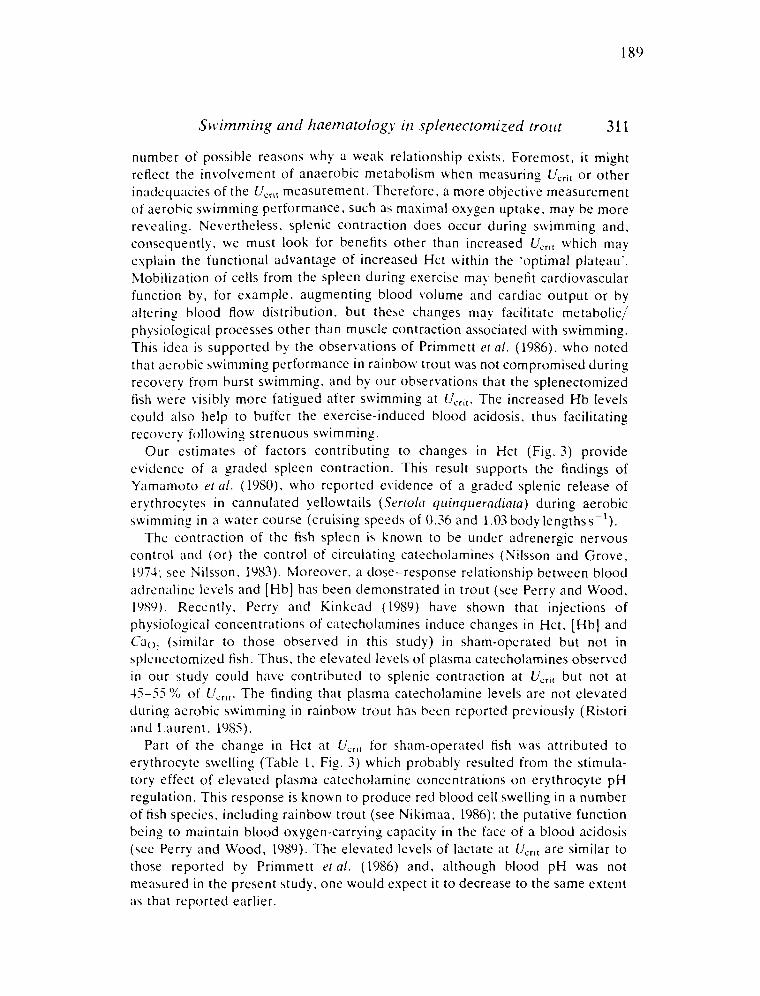
Sr~qimniitzg and tlaematology in splenectomized trortt 311
number of possible reasons why a weak relationship exists. Foremost, it might reflect the involvement of anaerobic metabolism when measuring UCri, or other inadequacies of the U,,,, measurement. Therefore. a more objective measurement o f aerobic swimming performance, such as masimal oxygen uptake, may be more revealing. Nevertheless, splenic contraction does occur during swimming and, consequently, we must look for benefits other than increased U,,,, which may esplain the functional advantage o f increased Hct within the 'optimal plateau'. hlobilization of cells from the spleen during exercise may benefit cardiovascular function by, for example, augmenting blood volume and cardiac output or by altering blood flow distribution. but these changes may facilitate metabolic/ physiological processes other than muscle contraction associated with swimming. This idea is supported by the observations of Primmett er al . (1986). who noted that aerobic swimming performance in rainbow trout was not compromised during recoi.ery from burst swimming. and by our observations that the splenectomized fish werc visibly more fatigued after swimming at U,,,,. The increased H b levels could also help to buffer the exercise-induced blood acidosis. thus facilitating recovery following strenuous swimming.
Our estimates of factors contributing to changes in Hct (Fig. 3 ) provide evidence of a graded spleen contraction. This result supports the findings of Yamamoto er al. (lC)SO), who reported evidence of a graded splenic release of erythrocytes in cannulated yellowtails (Serioln qrlinqueraciinm) during aerobic s~virnming in a water course (cruising speeds of 0.36 and 1.03 body lengths s-I).
The contraction of the fish spleen is known to be under adrenergic nervous control and (or ) the control of circulating catecholamines (Nilsson and Grove, 1974; sec Nilsson. 1983). Moreover, a dose-response relationship between blood aclrt.nnline levels and [Hb] has been demonstrated in trout (see Perry and Wood, 19S9). Recently, Perry and Kinkead (1989) have shown that injections of physiological concentrations of catecholamines induce changes in Hct. [Hb] and Cao. (similar to those observed in this study) in sham-operated but not in splenectomized fish. Thus, the elevated levels of plasma catecholamines observed i n our study could have contributed to splenic contraction at U,,,, but not at 45-55 % of U,,,,. The finding that plasma catecholamine levels are not elevated during aerobic swimming in rainbow trout has been reported previously (Ristori and Laurent. 1985).
Part of the change in Hct at U,.,,, for sham-operated fish was attributed to erythrocyte sivelling (Table 1, Fig. 3) which probably resulted from the stimula- tory effect of elevated plasma catecholamine concentrations on erythrocyte p H regulation. This response is known to produce red blood cell swelling in a number of fish species. including rainbow trout (see Nikimaa, 1986): the putative function being to maintain blood oxygen-carrying capacity in the face of a blood acidosis (see Perry and Wood, 1989). The elevated levels of lactate at U,,,, are similar to those reported by Primmett et al . (1986) and, although blood pH was not measured in the present study, one would espect i t to decrease to the same extent as that reported earlier.
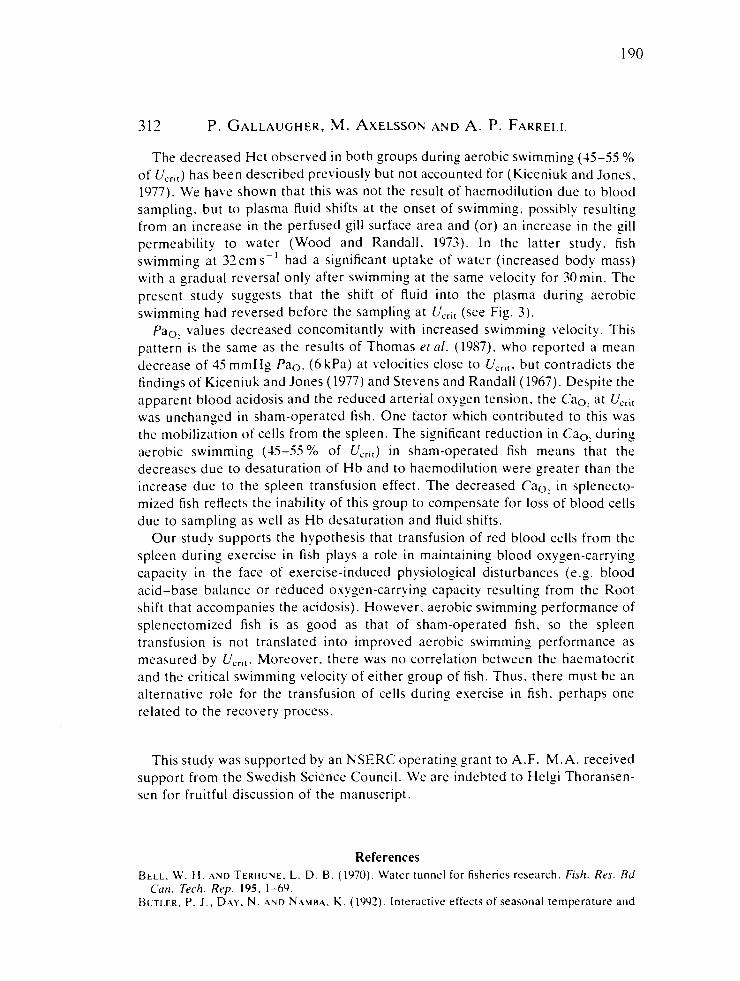
The decreased Hct observed in both groups during aerobic swimming (45-55 % of U,,,,) has been described previously but not accounted for (Kiceniuk and Jones. 1977). We have shown that this was not the result of haemodilution due to blood sampling. but to plasma fluid shifts at the onset of swimming, possibly resulting from an increase in the perfused gill surface area and (or) an increase in the gill permeability to water (Wood and Randall, 1973). In the latter study. fish swimming at 32 cms-I had a significant uptake of water (increased body mass) with a gradual reversal only after swimming at the same velocity for 30min. The present study suggests that the shift o f fluid into the plasma during aerobic swimming had reversed before the sampling at U,,,, (see Fig. 3).
Pao, values decreased concomitantly with increased swimming velocity. This pattern is the same as the results of Thomas er nl. (1987), who reported a mean decrease of 35 mmHg Pao. (6 kPa) at velocities close to U,,,,, but contradicts the findings of Kiceniuk and lines (1977) and Stevens and Randall (1967). Despite the apparent blood acidosis and the reduced arterial oxygen tension. the Cao, at UCri, was unchanged in sham-operated fish. One factor which contributed to this was the mobilization of cells from the spleen. The significant reduction in Cao, during aerobic swimming (45-55% of UCr,,) in sham-operated fish means that the decreases due to desaturation of H b and to haemodilution were greater than the increase due to the spleen transfusion effect. The decreased Cao. in splenecto- mized fish reflects the inability of this group to compensate for loss of blood cells due to sampling as well as Hb desaturation and fluid shifts.
Our study supports the hypothesis that transfusion of red blood cells from the spleen during exercise in fish plays a role in maintaining blood oxygen-carrying capacity in the face of exercise-induced physiological disturbances (e.g. blood acid-base balance or reduced oxygen-carrying capacity resulting from the Root shift that accompanies the acidosis). However, aerobic swimming performance of splenectomized fish is as good as that of sham-operated fish, so the spleen transfusion is not translated into improved aerobic swimming performance as measured by U,,,,. Moreover, there was no correlation between the haematocrit and the critical swimming velocity of either group of fish. Thus. there must be an alternative role for the transfusion of cells during exercise in fish. perhaps one related to the recovery process.
This study was supported by an NSERC operating grant to A.F. M.A. received support from the Swedish Science Council. We are indebted to Helgi Thoransen- sen for fruitful discussion of the manuscript.
References BELL., W. H . AND T E R H U N E , L. D. B . (1970). Water tunnel for fisheries research. Fish. Rrs. Bd
Cun. Tech. Rep. 195, 1-69. BUTLER, P. J . , DAY, N. AND NAMBA, K . (1992). Interactive effects of seasonal temperature and

Swimming and haernntology in splenectomized trorlt 3 13
low pH on resting oxygen uptake and swimming performance of adult brown trout Salmo trritta. J. exp. Biol. 165, 195-212.
G E H R K E . P. C . . F IDLER, L . E.. MENSE. D. C. A N D R.ANDALL. D. J . (19%)) . A respirometer with controlled water quality and computerized data acquisition for experiments with swimming fish. Fish Physiol. Biochrm. 8, 61-67.
JOHANSSON-SJOBECK. M. L. (1979). The effects of splencctomy on the hematology and on the activity of delta-amino-levulinic acid dehqdratase (ALA-D) in hematopoietic tissues o f the European eel. Angrtilla arlgrtillu L . Comp. Biochrm. Physiol. 63.A. 333-338.
JONES. D. R . (1971). The effect of h>poxia and anaemia on the swimming performance o f rainbow trout (Snlmo goirt inrr i) J . exp. Blol. 55, 5-11-551.
K I C E N I U K , J . W. A N D JONES. D. R. (1977). The oxygen transport system in trout (Sdmo yairtineri) during sustained exercise. J. exp. Riol. 69. 2-17-2150,
KITA. J . A N D I T A Z A W A , Y . (1989). Release of erythrocytes from the spleen during exercise and splenic constriction by adrenaline infusion in the rainbow trout. Jap. J. Ichthyol. 36, 38-52.
M I L L I G A N . C. L. A N D WOOD. C. M. (1987). Regulation of blood oxygen transport and red cell pHi after exhaustive activity in rainbow trout (Salmo gairt inrr i) and starry flounder (Platichthys srrlliirlts). J. rxp. Biol. 133. 263-282.
NIEI.SEN. 0. B. A Y D LYKKEBOE. G . (1992). Changes in plasma and erythrocyte K' during hypercapnia and different grades o f exercise in trout. J. appl. Physiol. 72, 1285-1290.
N I K I V A A , M. (1986). Control of red cell pH in teleost fishes. Ann. Zool. Fenn. 23, 223-235. NII SSON. S. (1983). A~i tor~orn lc .%'erw Funcrion in rhe Vrrtebrcztrs. Berlin. Heidelberg, New
York: Springer Verlag. 253pp. Nlr.sso~. S. A N D GROVE, D. J . (1974). Xdrenergic and cholinergic innervation of the spleen of
the cod: Gtitilis morhria. E w . J. Phnrrnr~c. 28, 135-143. PE.AKSOY. bl. P. A N D STEVENS. E. D. (199la) . Splenectomy impairs aerobic swim performance in
trout. Can. J. Zool. 69. 2089 - 2 W . P I ~ A K S O N , M. P. A N D ST.EVENS. E . D. ( 19916). Size and hematological impact of the splenic
erythroc)te reservoir in rainbow trout. Oncorhynch~is mykiss. Fish Physiol. Biochrm. 9, -39-50.
P I : K K \ ~ . S. F. A U D KINKF..\D. R. (1989). The role of catecholamines in regulating arterial oxygen content during acute hypercapnic acidosis in rainbotv trout (Snlnro gurrdrrrri). Rrsplr. Physiol. 77, 365-378.
P ~ . R K I . S. F. . A N D WOOD. C. hl. (1989). Control and coordination of g3s transfer in fishes. Can. J. Zool. 67, 2961 -2970.
P K I ~ ~ I - ~ , D . . R A Y D A L L . D. J . . kl.\z~.\cln, hl. \ Y D BOCTII . I~ .R. R. G . (1986). The role of catecholaminc.~ in erythroc)tc pH regulation and oxygen transport in rainbow trout (Salnlo gmrtineri) during exercise. J. exp. Biol. 122. 1-39- 1%.
R I S T O K I , bl. T . A N D L A U R ~ : N T . P. ( I % ) . Plasma catecholamines and glucose during moderate c.tercisc in the trout: comparison with bursts of Liolent activity. Expl Biol. 4. 2-16-253.
SOIVIO. A.. N I ~ ~ O I A . K . A N D W t s r h ~ ~ \ x . K . (1975). A technique for repeated sampling of the blood of individilal resting fish. J. rxp. Blol. 62. 107-217.
SII . \ I :YS. E . D. A ~ D KANDAI.I. . D. J . (1967). C h a n ~ e s of gas concentrations in blood and water during moderate swimming activity in rainbou trout. J. r.rp. R i d . 46, 3 3 - 3 7 .
THOMAS, S . , POUPIU. J . . L ~ K K I : B O ~ - . G . A ~ D J o t i ~ ~ s t ~ . K. ( IYS7). Effects of graded exercise on blood gas tensions and acid-base charxteristics of rainbou trout. Rrspir. Physiol. 68. 85-97.
T L C K ~ K , V. A. (1967). A method for ox?gen content and dissociation curves on microliter blood samples. J. uppl. Physiol. 23, 407--110.
WEI.I.S, R . M . G . A N D WEBEK, R. E. (IYYO). The spleen in hypouic and exercised rainbow trout. J. t,.rp. Biol. 150. -161-466.
WF.LI.S. R . M . G . A N D WEBEK. R. E . (1991). 1s there an optimal haematocrit for rainbow trout, 0nc~orhynch~t.s mykiss (Walbaum)? An interpretation of recent data based on blood viscosity measurements'? J. Fish Biol. 38, 53-65.
WOOD, C. M. A N D RANDAI.~ . . D. J . ( 1973). The influence of swimming activity on water balance in the rainbow trout (Sulnlo grrirtinrrl). J. cornp. Physiol. 82, 257-276.
W o o r m ~ ~ ~ . J . (1982). Plasma catecholamines in resting trout. Sulmo gairtinrri Richardson by high pressure liquid chromatography. J. Fish Biol. 21, 429-432.

YAMAMOTO. K. I . (1989). Contraction o f spleen in three perciformes and two tetraodontiformes during severe exercise. Comp. Biochem. Physiol. 9JA. 633-634.
YAMAMOTO, K. (1991). Increase of arterial O2 content in exercised yellowtail (Seriola quinq~~eradiata). Comp. Biochem. Physiol. 98A, 43-46,
Y-\\IA\IOTO. K . I . , ITAZAWA. Y. A N D KOBAYASHI, H. (1980). Supply of erythrocytes into the circulating blood from the spleen of exercised fish. Comp. Biochem. Physiol. 6 jA . 5-11.
Appendix 2. A summary of haematological parameters in rainbow trout and chinook salmon at rest and changes which occur when swimming to U,,it.

'I'nb
lc I
. I\l
oo
tl o
syg
cn c
arr
yin
g c
ap
aci
ty o
f art
eri
al (
A)
an
d V
CI~
OU
S (V
) b
loo
d i
n ra
inb
ow
tro
ut
(a)
and
chin
oo
k sa
lnio
n (I
)) at
[)A
cal
iliul
a S
lia~
ii-op
crat
ctl.
ope1
1 bod
y w
all
I)A
ca
~i~
iula
T
ra~
~s
o~
iic
flo
w p
robe
oc
Sea
s011
(y
cnr)
l:W/S
W
18
swiil
iier
( I 99
O)F
W
5 w
inte
r (1
993)
FW
12
s111
1111
ier
( 1
99
2)s
~
10
win
ler
(19
9l)
SW
9
win
ter
(199
3)S
W
I Icl
("/.I
[Clb
] C
a02
MC
I IC
(g
.dL-
I )
(~0
1%
) (g
. 1,-
I)


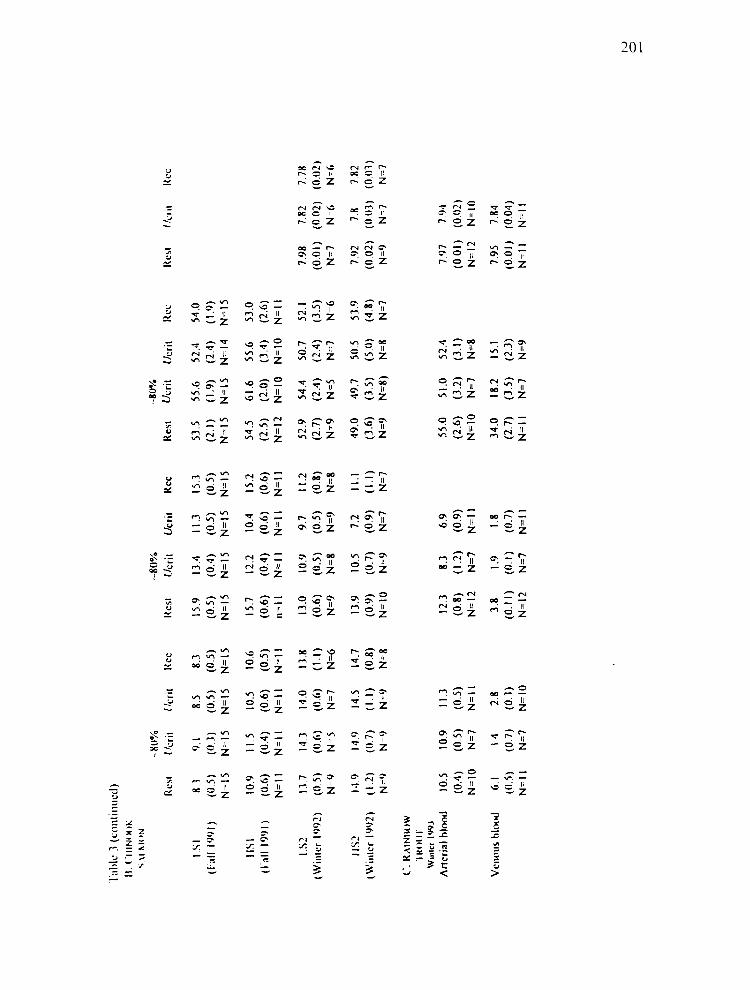
Rcc
15.3
(0
.5)
N-I
S
15.2
(0
.6)
N=
l l
11.2
(0
.8)
N=
8
11.1
(1
.1)
N=7
-80%
Res
t U
cril
53.5
55
.6
(2.1
) (1
.9)
N=
15
N=1
5
54.5
61
.6
(2.5
) (2
.0)
N=1
2 N
=IO
52.9
54
.4
(2.7
) (2
.4)
N=
9 N
=5
49.0
49
.7
(3.6
) (3
.5)
N=
9 N
-8)
55.0
51
.0
(2.6
) (3
.2)
N=I
O
N=7
34.0
18
.2
(2.7
) (3
.5)
N=
l l
N=7


Table 4. A summary of the mavimal swimming performance and oxygen uptake o f rainbow trout ( A ) and chinook salmon (B).
A. RAMBOW TROUT
FW S ham-operated
FW 5 OC
Adjusted Hct
SW (Winter 199 1)
SW (Summer 1992)
Adjusted Hct
SW (Winter 1993)
DA cannula only
DA and Transonic flow probe
DA and Doppler flow probe
weight ( 9 )
530 - 73 8
466 (19)
N=10
554 ( 2 )
N=9
514 (2 7 ) N=8
550
B. CHIKOOK SALMON Fall 1991 368
LS I (30) N=25
length (cm)
36 - 41
32.9 (1.4) N=9
34.3 (0.5) N=9
35.1 (0.6) N=8
34.7
30.3 (0.3) N=25
30.1 (0.3) N=2 l
Hct (&rid ("/.)
34.4
33.1
28.5
30.1
30.7
25.6
24.5 (0.9) N= 15
28.3 ( 1 .O) N=15
V ~ ~ r n a x (umolkg
Im in)
I87 (8.7) N=11
176.3 (12.0) N=7
138
121
126
250 (22)
N= I0
290 (15.3) N= 10
318 (25)
N-l l 330' (12.8) N= I0

e Winter 1992 442
LSZ (48, N=7
D A only 336 (18) N=8
Numbers in parentheses are +I- S.E.M. * represents unoperated fish.

Tab
le 5
. C
once
ntra
tions
of c
atec
hola
min
es (
nora
dren
alin
e an
d ad
rena
line)
at
UC
rit in
chi
nook
sal
mon
fro
m T
R1.
LS
1 tr
aini
ng g
roup
HS
1 tr
aini
ng g
roup
LS
= e
xerc
ise-
trai
ned
at 0
.5 b
l-se
c-I
HS
= e
xerc
ise-
trai
ned
at 1
.5 b
lsec
-1
Figu
res
in p
aren
thes
es r
epre
sent
* S.
E.M
.
[Nor
adre
nalin
e]
(nrn
01.L
-1)
[Adr
enal
ine]
(n
mol
-L-1
)
Met
hods
use
d fo
r cat
echo
lam
ine
anal
ysis
aft
er A
ota
and
Ran
dall
(1 9
94)

Appendix 3. Cardiac output in swimming rainbow trout.

Cardiac output in swimming rainbow trout, Oncorhynchus mykiss.
Helgi ~horarensen*, Patricia Gallaugher and Anthony P. Farrell
Cardiac output in swimming rainbow trout
Department of Biological Sciences, Simon Fraser University, Burnaby, British Columbia,
Canada V5A 1 S6

Summary
This is the first study to report absolute measurements of cardiac output (Q) with
Transonic flow probes during prolonged swimming in a salmonid. Simultaneous
measurements of hematocrit and arterial blood oxygen content in seawater-acclimated
rainbow trout (Oncorhynchus mykiss) (body mass 40 1 - 1025g) at 1 1 "C, indicated that
the fish were in a good physiological condition, while measurements of resting heart rate,
arterial blood pressure, and systemic resistance suggested relatively low levels of stress.
Maximum Q (Q,,,) (48.7 mL.min-'.kg-') was reached at 97.3% of the maximum
prolonged swimming speed, and is similar to the Q,, estimated by the Fick principle
during swimming in freshwater rainbow trout (Kiceniuk and Jones, 1977). em,, was
84% greater than the resting cardiac output (QresJ (26.6 mL.min-'.kg-') and was brought
about by a 38% increase in heart rate V ,̂) and a 25% increase in stroke volume (SV,).
Correlation analysis showed that individual variability in Q,, was mainly due to
variability in maximum SVH; maximum fH was relatively invariant among individuals. At
rest, SV, andf, were negatively correlated. Individual fish with a high Q,, were
characterized by a low resting fH and a high resting SV,.

Introduction
As salmonids increase swimming speed up to the maximum prolonged (= critical)
swimming velocity (U,,,,; Hoar and Randall, 1978), the transfer of gasses between the
environment and the locomotory muscles increases as a result of a host of concurrent
adjustments to the cardio-respiratory system. An important adjustment during swimming
in rainbow trout is an increase in Q (Stevens & Randall, 1967a, b; Kiceniuk and Jones,
1977). However, Q was estimated with the Fick principle in these earlier studies and this
technique has been criticized in its application to fishes because of inherent errors related
to gill blood flow shunts, gill oxygen consumption and skin oxygen uptake (Johansen and
Petterson, 198 1 ; Metcalfe and Butler, 1982; Daxboeck et al. 1982; Randall, 1985).
Compounding this technical problem, is the fact that Stevens and Randall, (1967a) only
estimated Cw, from measurements of blood Po2. In support of the use of the Fick
principle, Randall (1 985) argued that the errors tend to cancel each other out under resting
conditions. Furthermore, our view is that the errors may become insignificant when
rainbow trout are swimming and skeletal muscle oxygen consumption dominates the
overall oxygen consumption of the animal. Given the importance of rainbow trout as a
model for studying fish physiology, it seemed important to resolve the issue of the
accuracy of previous Q measurements in swimming rainbow trout. In this study we used
a technique that directly measures Q in rainbow trout engaged in prolonged swimming.
A number of direct and indirect techniques have been used to measure Qrest in rainbow
trout, including flow probes (Wood and Shelton, 1980a,b; Xu and Olson, 1993; Garnperl,
Pinder and Boutilier, 1994), dye dilution techniques (Neuman, Holeton and Heisler,
1983; Barron, Tarr and Hayton, 1987) and the Fick principle (Holeton and Randall, 1967;
Stevens and Randall, 1967b; Cameron and Davis, 1970; Davis and Cameron 1971 ;
Kiceniuk and Jones, 1977; Neuman, Holeton and Heisler, 1983). The past difficulties in

measuring QreSt in rainbow trout are reflected in the very large range reported for erest ,
from 16 to 65 m~.min-1 .kg-l (see Farrell and Jones, 1992). However, comparisons
between studies are further complicated because of differences in the extent of the
surgery, the state of the fish, and the experimental temperatures (5-1 8 "C) (Banon, ~m
and Hayton, 1987). We were particularly interested in a direct comparison with the data
of Kiceniuk and Jones (1 977), the most comprehensive data set for swimming rainbow
trout, albeit on a small sample size.
Recently, ultrasonic flow probes (i.e., Doppler and Transonic) have been used to
continuously measure Q in swimming fish (Axelsson and Nilsson, 1986; Axelsson et a/.
1 989; Axelsson and Fritsche, 199 1 ; Thorarensen et al. 1993; Kolok, Spooner and Farrell,
1993). We chose Transonic flow probes because they give readings of absolute blood
flow as well as a zero flow signal, a feature not shared by either the Doppler or the
electromagnetic flow probes. Our laboratory has developed techniques to use the
Transonic flow probes to measure Q in swimming fish without affecting the rank order of
swimming performance within a group of fish (Kolok, Spooner and Farrell, 1993; Kolok
and Fmell, 1994). Qrest has been measured in rainbow trout with Transonic flow probes
(Xu and Olson, 1993), but in this case, placement of the flow probe on the ventral aorta
involved opening the pericardium. Rupturing of the pericardium is known to impair
cardiac performance, since vis afionte filling of the heart can only occur if the
pericardium is intact (Farrell, Johansen and Graham, 1988). We used a novel method was
used in the present experiment to place a Transonic probe on the ventral aorta without
opening the pericardium. We report the first absolute measurement of Q during sustained
swimming in a salmonid, which are compared with earlier estimates of Q using the Fick
principle..

Materials and methods
Experimental animals.
Rainbow trout, Oncorhynchus mykiss, of both sexes (mean weight 6 10 g, range 40 1 - 1025
g) were transported from West Creek Trout Farm, Aldergrove, British Columbia, to the
West Vancouver Laboratory (Department of Fisheries and Oceans) where the
experiments were performed. The fish were acclimated to seawater (salinity 30 parts per
thousand; 9-1 1 OC) for at least two months prior to the experiments which were
conducted in November and December, 1992. During the seawater-acclimation period,
the fish were kept outdoors in circular tanks, supplied with an ample flow of seawater,
and were fed satiation levels of dry pellets (Moore Clarke, British Columbia) once daily.
Prior to surgery, the fish were starved for at least 24 h.
Surgery.
The fish were anaesthetized in a 1 :2,000 solution of 2-phenoxyethanol (Sigma Chemical
Co., St. Louis, MO) in seawater, and the anaesthesia was maintained by continuously
irrigating the gills with a 1 :4,000 solution of 2-phenoxyethanol in seawater. A cannula
(PE 50) was inserted into the dorsal aorta (DA) as described by Thorarensen et al. (1993)
and allowed measurements of blood pressure (P,,) and sampling of arterial blood. P,,
was measured with a LDI5 pressure transducer (Narco, Houston, TX).
To measure Q, a Transonic flow probe (Transonic Inc., Ithaca, NY) was placed around
the ventral aorta (VA) of the trout, just distal to the bulbus arteriosus. The VA was
accessed from the opercular cavity. When the operculum and the gills are folded forward,
the VA is readily visible as it runs dorsad immediately below the gills. This site has been
used previously for the cannulation of the VA, for ligation of the coronary artery (Farrell

and Steffensen, 1987), and for Doppler blood flow measurements in the VA and the
coronary artery (Axelsson and Farrell, 1993).
The VA was exposed by gently teasing apart overlying skin and connective tissue, and the
flow probe was placed around the VA without rupturing the pericardi~un or obstructing
the coronary artery. The flow probe was secured in place with crosswise stitches (3-0 silk
suture) that were tied to the probe, and this ensured that the flow probe would not move
while the fish swam. The probe leads were anchored with a 1-0 silk suture near the
pectoral fin and again anterior to the dorsal fin. TWO sizes of Transonic flow probes were
used, depending on the size of the fish; the larger probe was 9 rnm long had a 14.8 mm2
rectangular sensing window and the smaller probe was 8 rnrn long with a 4 mrn2 sensing
window. The surgery was completed in less than 30 minutes and the fish were allowed to
recover for 18-24 hours before swimming trials commenced.
Experimental procedures
Fish were swum in the same swim tunnel (volume 39 L) used by Kiceniuk and Jones
(1977). All experiments were performed at 1W1 O C . Prior to a swimming trial, the fish
was allowed to habituate to the tunnel for at least 12 h. Q,,,, and P,, at rest were
recorded while the water velocity was 5 - 10 body-length s-l (blasec-1) with the fish
resting on the bottom of the chamber. An arterial blood sample was also taken for the
measurement of resting values for haematocrit (Hct), haemoglobin concentration ([Hb]),
Pag, and Cag2. Swimming velocity was then increased to approximately 1 b1.s-1 and the
same variables were recorded again. Subsequently, swimming speed was increased in
steps of 0.25 b1.s-1, each step being maintained for 30 min, or until the fish fatigued. At
each step, 10 min after the velocity had been increased, and when Q and P,, had reached
a stable level, cardiovascular recordings were sampled for 6 minutes. At approximately

50% U,,,,, blood samples were taken at each velocity increment until the fish reached Ucri,.
This minimized the amount of blood removed from the fish. After swimming to U,,, the
fish were allowed to recover in the swim-tunnel at A water velocity of 0.25 b1.s-1. After 1
hour of recovery, the cardiovascular variables were recorded and a final arterial blood
sample was taken.
Analysis of blood samples.
Each blood sample was 1 mL. Some of the blood sample was used for analysis, and the
remainder was reinjected into the fish along with enough saline to replace the fluid used
for the haematological measurements. A maximum of six blood samples was taken from
the fish while they swam, resulting in a total volume of 1-1.5 mL of blood being replaced
with saline prior to the final sample. Replacing this amount of blood with saline has a
minimal effect on Hct in rainbow trout (Gallaugher, Axelsson and Farrell, 1992).
Pao2 was measured with a thennostatted electrode (E5046, Radiometer, Copenhagen),
maintained at the experimental temperature and connected to a PM71 unit. CaOz was
measured with the method of Tucker (1967). Triplicate samples for Hct were spun in
micropipettes (10 pL) for 3 min at 12,000 rpm. Blood [Hb] and plasma [la~:dte] were
analyzed with Sigma kits 52544 and 826-UV, respectively. Plasma osmolality was
measured in triplicate on 10 pL samples using a calibrated Wescor (5 100) Vapour
Pressure Osmometer (Wescor, Logan, Utah). Mean cell [Hb] was calculated as [HbIlHct.
The saturation of haemoglobin in arterial blood was calculated as:
where a is the solubility of O2 in plasma (Boutilier, Hemming and Iwama, 1984) and it is
assumed that l g of haemoglobin can bind 1.34 mL of oxygen.

Data acquisition and statistical analyses.
The signals for P,, and Q were recorded directly on a Grass chart recorder (model 7PCP
B, Grass Instruments, Quincy, MA) and relayed to a computer for storage and on-line
processing with Labtech Notebook (Laboratory Technology Corp., MA). At each
velocity step, the computer sampled the signals for PDA and Q for 6 minutes at a rate of 5
Hz and calculated heart rate from the flow pulses. The mean values for the 6 min periods
were used for analysis. Systemic vascular resistance (Rsys) was calculated from mean PDA
and Q at each step ( R,,, = P,, I Q), with the assumption that changes in venous pressure
were negligible relative to those in arterial pressure (Farrell, 199 1).
Statistical comparisons were performed using the General Linear Models Procedure and
the Correlation Procedure in SAS (Version 6, SAS Institute). Data for variables recorded
at different swimming velocities were compared using an analysis of variance (ANOVA)
with repeated measures. Individual means were compared with Tukey's tests. To
examine the variability in the cardiovascular variables, the coefficients of variation (CV)
were calculated (CV = 100.standard deviation I mean). Residual correlations (Bennett,
1987) were performed on cardiovascular data. Values of P<O.O5 were used to infer
statistical significance.
Results
Q as a function of body mass.
To normalize Q per kg body mass (bm), Q must scale isometrically with bm and
intercept the y-axis at zero (Packard and Boardman, 1988). Both Q,, and QXst of the
rainbow trout (expressed as mL.min-I) increased linearly with body mass and the
intercepts were not significantly different from zero. The relationships between Q and
body mass (in mL.min-1) were ( ~ 2 = 0.78, both for QreSt and Q,,,):
Therefore, the use of normalized Q values is justified.
Cardiac variables.
The continuous blood flow in the ventral aorta during the entire cardiac cycle and the
increase in Q with swimming are well illustrated by Figure I . Q increased from a resting
value of 26.612.4 mL.min-l.kg-l to a Q,, of 4 8 M . O mL.min-l.kg-l. Q,, was reached
when mean swimming speed was 97.3Ydl.3 of Ucri,. U,,, was 82 ems-1 or 2.35 b1.s-1. Q
increased as soon as swimming started at 20% of UCrit, and the largest increases in Q
occured at swimming speeds greater than 50% U,,i, (Figure 2). The pattern for the
increase in fH was similar to that for Q. The 84% increase in Q with swimming velocity
was a result of a 38% increase in fH (48.4*3.3 to 66.9*2.l bpm) and a 25% increase in
SV, (0.5810.06 to 0.73k0.05 mL.kg-I) (Figure 2a). PDA did not increase significantly
until 80% of U,,,,. At U,,,,, PDA had increased by 25% (3.29*0.20 kPa to 4.12*0.19 Oa) .
The regulation of P,, at lower swimming speeds while Q increased, resulted from a
continuous decrease in Rsys when swimming speed and Q increased (Figure 2b). ~t uCrit, RsYs had decreased by 29% (0.126*0.008 to 0.09N0.007 kPa.mL-l.min.kg).
A 1 h recovery period saw the return of Q to a value (29.3*2.15 mL.min-1-kg-1) not
significantly different from the resting value. However, SVH and PDA were significantly
lower, andf, was significantly higher, than at rest (Figure 2).
Correlations of cardiac variables.

Correlations of Q and SVH were normalized with bm. However, to ensure that these
correlations were not an artefact of normalization (e.g. mL.min-'.kg-'), they were
confirmed by correlating residuals from the regression of non-normalized Q and SvH (eeg.
mL.min-1) with bm (Bennett, 1987).
There were significant correlations between SVH at rest and Q,,,, (P<0.01) and between
maximum SVH and Q,, (p<0.0005) (Figure 3a). However, there were no significant
correlations between either restingf, and Q,,,,,or b e i ~ e e n maximum& and Q,,
(Figure 3b). In fact, the variance in maximumfH (CV = 9.8%) was relatively low, being
significantly (p<0.01) lower than that for maximurn SVH (CV= 23.6%), resting SvH
(33.6%), and resting fH (CV= 2 1.8%).
There was a significant (P<0.002) negative correlation between SVH and fH at rest (Figure
3 ~ ) . The fish with the largest resting SVH also had the highest Q,,. Fish with a low
resting fH had the greatest scope for increasing SVH (Figure 2 4 . Therefore, fish with a
lowfH and large SVH at rest had the greatest Q,,. The scope for increasing SVH was not
correlated with SVH at rest.
Plasma osmolality at UCri, was negatively correlated with f,, (p<0.003, data not shown),
I I but otherwise neither plasma osmolality, nor any of the haematological variables in Table
1, were correlated with either Q swimming performance.
Huemutological variables.
All the variables measured in blood and plasma as the fish swam to U,,,, had not changed
significantly at around 50% U,,,, (Table 1). Even though Pwz was significantly reduced
at 86% U,,,,, and almost halved at Ucri,, Caoz and oxygen saturation of haemoglobin were
unchanged (Table 1). Hct increased significantly at U,,. However, the similar changes
in H C ~ (+9%) and MCHC (-1 0%) at U,,,, suggest that the increase in Hct was caused by

swelling of erythrocytes (Table 1). Plasma lactate and plasma osmolality increased
significantly at Ucri, (Table 1). With the exception of [Hb] and plasma lactate, all blood
variables had returned to resting vaues after 1 h of recovery.
Discussion
This is the first study to report direct measurements of Q in rainbow trout undergoing
prolonged swimming. Before a comparison with previous Q values can be made, an
assessment of the general status and swimming performance of our fish is needed. Even
though the rainbow trout in this study were burdened with the drag of the arterial cannula
and the lead from the flow probe, their swimming performance was similar to, or better
than, that observed previously. The UCr, in this study (2.35 bls-1) was considerably
higher than the U,,, (0.5-1.5 b1.s-1) reported for freshwater rainbow trout swimming in
the same swim tunnel (Kiceniuk and Jones, 1977). It also compares favorably with the
range of uCrit values (1.74-2.65 bl-s-') reported in some recent studies of similar-sized
unc-ulated salmonids, swimming in either freshwater or seawater (Duthie, 1983;
Randall, Mense and Boutilier, 1987; Farrell et 01. 1990, Farrell, Johansen and Suarez,
199 1 ; Pearson and Stevens, 1991 ; Butler, Day and Namba, 1992). This suggests that the
flow probes had little effect on maximum swimming performance.
Haematological variables (Table 1) were comparable to those reported in other studies of
swimming salmonids (Thomas et al., 1987; Butler, Day and Namba, 1992; Gallaugher,
Axelsson and Farrell, 1992; Thorarensen et a/. 1993). In particular, the mean Hct at rest
for rainbow trout in this study (27.6%) was within the range of that reported in other
studies with rainbow trout (Kiceniuk and Jones, 1977; Thomas et al. 1987; Gallaugher,
Axelsson and Farrell, 1993), and higher than the range of values (1 5-25%) reported in

previous studies where flow probe placement involved substantial dissection of red
skeletal muscle overlying the ventral aorta and opening of the pericardial cavity (Wood
and Shelton, 1980a; Gamperl, Pinder and Boutilier, 1994). This suggests that the fish in
the present study did not suffer excessive bleeding due to surgery. Furthermore, the
values for plasma lactate at rest were low and comparable to those previously reported for
resting fish (Milligan and Wood, 1986; Tang, M A h ~ l d and Boutilier, 1989; Gallaugher,
Axelsson and Farrell, 1992; Thorarensen et al. 1993), indicating that the fish were not
unduly stressed prior to the experiment. As in some recent experiments with salmonids,
Pag, fell significantly as the fish am up to U,,,, (Thomas et 01. 1987; Butler, Day and
Narnba, 1992; Gallaugher, Axelsson and Farrell, 1992
affecting Cao, and haemoglobin saturation.
Since fH is an easily and frequently measured variable
Thorarensen et al. 1993) without
n fish, cross-study comparisons of
,f;, are useful. The resting fH in this study (48.4 bpm) was hwer than the range (53 to 56
bpm) reported previously for DA-cmnulated rainbow trout held at a similar temperature
(1 0- 15 OC) (Smith, 1977; Wood, Pieprzak and Trot4 1979; Butler, Metcalfe and Ginley,
1986), but was higher than the value (37.8 bpm) reported by Kiceniuk and Jones (1 977).
The fH observed in this study (66.9 bpm) is in keeping with other studies (63
bpm; Smith, 1977; 70 bpm; Butler, Metcalfe and Ginley, l986), but greater than the
maximum fH (5 1.4 bpm) reported by Kiceniuk & Jones (1 977). The reason for the
difference in fH between the present study and that of Kiceniuk & Jones (1 977) may be
related to body mass, since the fish used by Kiceniuk Jones (1977) were at least two or
three times larger. In mammals and in some invertebrates, fH is known to scale negatively
with body mass (~chrnidt-Nielsen, 1984). This may also be true for rainbow trout even
though we were unable to find any correlation betweenf, and body mass. The size range
of our fish was rather narrow, perhaps too narrow to reveal such a relationship.

Values for Q,,, (48.7 mL.min-1 . kg -I) in this study were similar to the 52.6 mLemin-l .
kg -1 reported by Kiceniuk & Jones (1977). The similarity in Qmax values obtained by
Fick estimates, and by direct measurement, concurs with the suggestion of Randall (1 985)
that the errors inherent in the Fick estimate tend to cancel out. Alternatively, the errors
may become insignificant when rainbow trout are swimming and oxygen comsumption is
elevated. In support of this, Neuman, Holeton and Heisler (1 983) found good agreement
between both Fick estimate and direct measurements of Q in rainbow trout when their
oxygen consumption was elevated by stress. Thus, it seems reasonable to conclude that
previous estimates of Q,, in swimming rainbow trout using the Fick principle are valid.
A difference between the present study and that of Kiceniuk and Jones (1977), is that our
fish reached the same Q,,, with a higher fH and a h e r SV,. This could be related to a
variety of factors, including the fact that the Ucrit values for our fish were higher and they
swam in seawater.
Comparisons between maximum cardiac perfomance of swimming rainbow trout and
that of an in situ heart preparation (Fmell, MacLeod and Chantey, 1986) offer insight
into how much of the maximum cardiac potential is used during swimming. The highest
Q values reported for an in situ rainbow trout heart at 10 "C range from 63 mL.min-j.kg-l
(untrained fish) to 74 rnL.min-l.kg-l (trained fish) for similar heart rates V;, = 72 to 77
bpm) (Farrell, Johansen and Suarez, 1991). The em,, of the rainbow trout of the present
study (48.7 mL.min-'.kg -1) was lower than the in situ values, largely due to the lower
SC',,, i.e., 0.729 mLekg-1 vs 0.9-1.1 mLvkg-l. Thus, these rainbow trout may not have fully
exploited the flow potential of their heart while swimming.
was higher in the present study (26.6 mL.min-l.kg-l) than in that of Kiceniuk and
Jones (1 7.6 mL.min-'.kg-'). It is unlikely that this difference is due to excessive stress in
our fish, since P,, and Rsys were lower than those reported by Kiceniuk and Jones

(1 977). Moreover, the difference is probably not related to the use of the Fick principle,
since it would tend to overestimate Qrest. w e used a slow water velocity in the swim
tunnel to keep the fish correctly orientated under resting conditions. The slow water
velocity also reduced the tendency of the rainbow trout to attempt escape responses. ~t is
possible that our Qre,, was elevated as a result. Xu and Olson (1993) reported Q,,, as
20.3 rnL.min-1 at 12 OC for rainbow trout that were 250 - 500 g, meaning that ere,, was
likely twice as high as our value.
We examined the basis for individual variability in Qrest and Q,,, and found it was
primarily determined by SVH, and not by fH. In fact, maximum fH was relatively
invariable among individuals. Previous studies have also shown a tenuous relationship
between fH and QreSt (Cameron and Davis, 1970; Wood and Shelton, 1980b).
j;, and svH were not entirely independent of each other. A negative correlation was
observed between fH and SVH at rest (Figure 3c), a relationship that may be explained by
the time for atrial filling (Farre4 1985; Farrell, 199 1). Consequently, fish with
a high SVH and low fH at rest had a greater scope for increasing f, and Q, compared with
fish that had a high resting fH. The present data clearly illustrate that even though SVH
and fH contributed approximately equally to the increase in Q with swimming (as far as
the group of ten fish was concerned), considerable individual variability, especially with
respect to SV,, underlies this response. The basis for this individual variability is an open
question at this time.
Acknowledgements
This research was supported by an NSERC grant to A.P. Farrell. H. Thorarensen and p.
Gallaugher were recipients of Simon Fraser University Graduate Fellowships. We wish to
thank Mr. Scott Mattice for his assistance in maintaining the SFULJBCIDFO fish facility.

Literature Cited
Axelsson, M. and S. Nilsson. 1986. Blood pressure control during exercise in the Atlantic
cod, Gadus morhua. Journal of Experimental Biology 126: 225-236.
Axelsson, M. and R. Fritsche. 1991. Effects of exercise and feeding on the
gastrointestinal blood flow in the Atlantic cod, Gadus morhua. Journal of
Experimental Biology 158: 18 1 - 198.
Axelsson, M. and A. P. Farrell. 1993. Coronary blood flow in the coho salmon.
American Journal of Physiology 264: R963-R97 1.
Axelsson, M., W. R. Driedzic, A. P. Farrell, and S. Nilsson. 1989. Regulation of cardiac
output and gut blood flow in the sea raven, Hemitripterus americanus. Fish
Physiology and Biochemistry 6: 3 15-326.
Barren, M. G., B. D. Tan and W. L. Hayton. 1987. Temperature dependence of cardiac
output and regional blood flow in rainbow trout, Saimo gairdneri Richardson.
Journal of Fish Biology: 3 1, 735-744.
Bennett, A. F. 1987. ~nterindividual variability: an underutilized resource. Pages 147- 169
in M. E. Feder, A. F. Bennett, W. W. Burggren and R. B. Huey, eds. New Directions
in Ecological Physiology. Cambridge University Press. Cambridge, New Yo&,
Me1 bourne.
Boutilier, R. G., T. A. Hemming, and G. K. Iwama. 1984. Physicochemical parameters
for use in fish physiology. Pages 403-430. in W. S. I-Ioar and D. J. Randall, eds. Fish
Physiology. Volume XA. Academic Press, San Diego.

Bushnell, P. G., A. P. Farrell and D. R. Jones. 1992. The arterial system. Pages 89-139.
in W. S. Hoar, D. J. Randall and A. P. Farrell, eds. Fish Physiology. Volume XIIA.
Academic Press, San Diego.
Butler, P .J., J. D. Metcalfe,. and S. A. Ginley. 1986. Plasma catecholamines in the lesser
spotted dogfish and rainbow trout at rest and during different levels of exercise.
Journal of Experimental Biology 123: 409-42 1.
Butler, P.J., N. Day, and K. Namba. 1992. Interactive effects of seasonal temperature and
low pH on resting oxygen uptake and swimming performance of adult brown trout.
Journal of ~xperimental Biology 165: 195-2 12.
Cameron, J. N. and J. C. Davis. 1970. Gas exchange in rainbow trout (Salmo gairdneri)
with varying blood oxygen capacity. Journal of the Fisheries Research Board of
Canada 27: 1069-1085.
Davis, J. C. and J. N. Cameron. 1971. Water flow and gas exchange at the gills of
rainbow trout, Salmo gairdneri. Journal of Experimental Biology 54: 1-1 8.
Daxboeck, C., P. S. Davie, S. F. P e w , and D. J. Randall. 1982. Oxygen uptake in a
spontaneously ventilating blood-perfused trout preparation. Journal of Experimental
Biology 101: 33-45.
Duthie, G. G. 1987. Observations of poor swimming performance among hatchery-reared
rainbow trout, Salmo gairdneri. Environmental Biology of Fishes 18: 309-3 1 1.
Farrell, A. P. 1985. Cardiovascular and hernodynamic energetics of fishes. Pages 377-
385. in R. Gilles, ed. Circulation, Respiration and Metabolism. Springer-Verlag,
Berlin.

Farrell, A. P. 1991. From hagfish to tuna - a perspective on cardiac function.
Physiological Zoology 64: 1 137- 1 164.
Fanell, A. P. and J. F. Steffensen. 1987. Coronary ligation reduces maximum sustained
swimming speed in chinook salmon (Oncorhynchus tshawytscha). Comparative
Biochemistry and Physiology 87A: 35-37.
Fmell, A. P. and D. R. Jones. 1992. The heart. Pages 1-88. in W. S. Hoar, D. J. Randall,
and A. p. Fmell, eds. Fish Physiology. Volume XIIA. Academic Press Inc. Sari
Diego.
Fmell, A. p., K. R. MacLeod, and B. Chancey. 1986. Intrinsic mechanical properties of
the perfused rainbow trout heart and the effects of catecholamines and extracellular
calcium under control and acidotic conditions. Journal of experimental Biology 125:
3 19-345.
Farrell, A. P., J. A. Johansen, and M. S. Grahm. 1988. The role of the pericardium in
cardiac performance of the trout (Salmo gairdneri). Physiological Zoology 68: 2 13-
22 1.
Farrell, A. P., J. A. Johansen, and R. K. Sxi.rez. 1991. Effects of exercise-training on
cardiac preformance and muscle enzymes in rainbow trout, Oncorhynchus mykiss.
Fish Physiology and Biochemistry 9: 303-3 12.
Farrell, A. P., J. A. Johansen, J. F. Steffensen, C. D. Moyes, T. G. West, and R. K.
Suarez. 1990. Effects of exercise-training and coronary ablation on swimming
performance of a ~erfused trout heart. Canadian Journal of Zoology 68: 1 174- 1 179.

Gallaugher, P., M. Axelsson, and A. P. Farrell. 1992. Swimming performance a d
haematological variables in splenectomized rainbow trout, Oncorhynchus mykiss.
Journal of Experimental Biology 17 1 : 30 1-3 14.
Gamperl, A. K., A. W. Pinder, and R. G. Boutilier. 1994. Effect of coronary ablation
and adrenergic stimulation on in viva cardiac performance in trout (Oncorhynchus
mykiss). Journal of Experimental Biology. In Press.
Graham, M. S. and A. P. Farrell, A.P. 1989. The effect of temperature acclimation and
adrenaline on the performance of a perfused trout heart. Physiological Zoology 62:
38-61.
HOX, W. S. and D. J. Randall. 1978. Terminology to describe swimming activity in fish.
Pages xx - xx. W. S. Hoar and D. J. Randall, eds. in Fish Physiology. Volume VII.
Academic Press, New Yo&.
Holeton, G. .F. and D. J. Randall. 1967. Changes in blood pressure in the rainbow trout
during hypoxia. Journal of Experimental Biology 46: 297-305.
Johansen, K. and K. Petterson. 198 1. Gill oxygen consumption in a teleost fish, G Q ~ ~ ~
morhua. Respiratory Physiology 44277-284.
Kiceniuk, J. W. and D. R. Jones. 1977. The oxygen transport system in trout (&Imo
gairdneri) during sustained exercise. Journal of Experimental Biology 69: 247-260.
Kolok, A. S. and A. P. Farrell. 1994. Individual variation in the swimming performance
and cardiac performance of northern squawfish, Ptytocheilus oregnensis.
Physiological Zoology. In Press.

Kolok, A. S., R. M. Spooner, and A. P. Farrell. 1993. The effect of exercise on the cardiac
output and blood flow distribution of the largescale sucker, Catastomus macrocheilus.
Journal of Experimental Biology 183, 30 1-32 1.
Metcalfe, J. D. and P. J. Butler. 1982. Differences between directly measured and
calculated values for cardiac output in the dogfish: A criticism of the Fick method.
Journal of Experimental Biology 99: 255-268.
Milligan, C. L. and C. M. Wood. 1986. Tissue intracellular acid-base status and the fate
of lactate after exhaustive exercise in the rainbow trout. Journal of Experimental
Biology 123: 123-144.
Neuman, P., G. F. Holeton and N. Heisler. 1983. Cardiac output and regional blood flow
in gills and muscles after exhaustive exercise in rainbow trout (Salmo gairdneri).
Journal of Experimental Biology 105: 1 - 14.
Packard, G. C. and T. J. Boardman. 1988. The misuse of ratios. indices, and percentages
in ecophysiological research. Physiological Zoology 61 : 1-9.
Pearson, M. P, and E. D. Stevens. 1991. Splenectomy impairs swim performmce in
trout. Canadian Journal of Zoolgoy 69: 2089-2092.
Randall, D. J., 1985. Shunts in fish gills. Pages 71 - 87. K. Johansen and W. W.
Burggren, eds. in Cardiovascular Shunts. Munksgaard Copenhagen.
Randall, D. J., Mense, D. and R. G. Boutilier. 1987. The effects of burst swimming on
aerobic swimming in chinook salmon (Oncorhynchus tshawytscha). Mar. Behav.
Physiol. 13, 77-88.
Schmidt-Nielsen, K. 1984. Scaling: Why is Animal Size So Important? Cambridge
University Press. 237 pages.
Smith, D. G. 1977. Neural regulation of blood pressure in rainbow trout (Salmo
gairdneri). Canadian Journal of Zoology 56: 1678- 1683.
Stevens, E. D. and D. J. Randall. 1967a. Changes in blood pressure, heart rate and
breathing rate during moderate swimming activity in rainbow trout. Journal of
Experimental Biology 46: 307-3 15.
Stevens, E. D. and D. J. Randall. 196%. Changes in blood and water concentrations
during moderate swimming activity in rainbow trout. Journal of Experimental
Biology 46: 329-337.
Tang, Y., D. G. McDonald, and R. G. Boutilier. 1989. Acid-base regulation following
exhaustive exercise: a comparison between freshwater and seawater-adapted rainbow
trout. Journal of Experimental Biology 14 1 : 407-4 18.
Thomas, S., J. Poupin, G. Lykkeboe and K. Johansen. 1987. Effects of graded exercise on
blood gas tensions and acid base characteristics of rainbow trout. Respiration
Physiology 68: 85-97.
Thorarensen, H., P. E. Gallaugher, A. K. Kiessling, and A. P. Farrell. 1993. Intestinal
blood flow in swimming chinook salmon Oncorhynchus tshawytscha and the effects
of haematocrit on blood flow distribution. Journal of Experimental Biology 179: 1 15-
129.
Tucker, V. A. 1967. A method for oxygen content and dissociation curves on microliter
blood samples. Journal of Applied Physiology 23: 407-4 10.
Wood, C. M. and G. Shelton. 1980a. Cardiovascular dynamics and adrenergic responses
of the rainbow trout in vivo. Journal of Experimental Biology 87: 247-270.

wood, C. M. and G. Shelton. 1980b. The reflex control of heart rate and cardiac output
in the rainbow trout: interactive influences of hypoxia, haemorrhage, and systemic
vasomotor tone. Journal of Experimental Biology 87: 271-284.
wood, C. M., P. Pieprzak and J. N. Trott. 1979. The influence of temperature and
anaemia on the adrenergic and cholinergic mechanisms controlling heart rate in the
rainbow trout. Canadian Journal of Zoology 57: 2440-2447.
XU, H.Y. and K. R. Olson. 1993. Evidence for multiple adrenoceptor sites in rainbow
trout vasculature. Journal of Comparative Physiology B 163: 470-476.
* Current address and address for correspondence: Department of Physiology and
Anatomy, Massey University, Private Bag 14 222, Palmerston North, New Zealand.
Phone: 0-6-356 9099. FAX 0-6-350-5609. EMail P [email protected].

Table 1. Haematological variables recorded in rainbow trout at different swimming
velocities and after 1 hour of recovery. N=10 for all means except osmolality, where
N=7.
4 , i t Pa02 Ca02 Hct Hb Sat. Lact. Osm MCHC
% torr YO YO g . % rnrnol mosm g.L-1
vol. dL-I
Mean
SEM
Mean
SEM
Mean
SEM
Mean
SEM
After 1 hour recovery
SEM 6.0 0.5 1.4 0.3 1.9 0.63 20 0.004
* Values are significantly (p<0.05) different from resting values.
Figure legends
Figure 1 . Traces of cardiac output and PDA in a rainbow trout while at rest and when
swimming at velocities up to -1 00% UCri,.
Figure 2, Cardiovascular variables in rainbow trout at different swimming speeds and
following a 1 hour recovery. a) Cardiac output (.I, stroke volume (0) and heart rate (+)
b) Dorsal aortic blood pressure and systemic resistance (pDA/Q).


Figure 3

Appendix 4. Intestinal blood flow in swimming chinook salmon and the effects of haematocrit on blood flow distribution.

/. rxp. Biol. 179. 115-1179 (1993) Prirrted in Gretit Brirciin Q The Cornpuny o/Biologists Limited 1993
INTESTINAL BLOOD FLOW IN S\VIMhIING CHINOOK SALMON ONCORHYNCHUS TSHAWYTSCHA AND THE EFFECTS
OF HAEMATOCRIT ON BLOOD FLOW DISTRIBUTION
H. THORARENSEN', P. E. GALLAUGHER' , A. K. KIESSLING', and A. P. FARRELL1
ISitnan Fraser Utzirersity. Department of Biological Sciences, Burncrbv. British Col~rmbio, Ctrtlaclo C'jA IS6 and ?~eparrtnent of Fisheries and Oceans. Biological Sciences Branch. Biorechnolog.v, Getletics and Nl~trir iotl Secriotz. Wexr V<zncollr,er
Laboraton, 416 Mari t~e Drive. West Vnncoltrrer, British Coll~mbia. Carrodcr V7V I N6
Accepted 19 Febr~ tnp 1993
Summary Blood flow in the intestinal artery ( ~ I A ) . the r i te o f oxygen consumption ( i /02 ) and a
number o f haemutological variables were measured in chinook salmon. Onc~rh~nchrrs r.sl~c~,r~~rschn. while they swam up to the critical swimming velocity (LrClll). The fish used in this study had previously been exposed to one of two different exercise-training regimes, swimming for 8 months at either 1.5 b ls - ' (HS) or 0.5 b ls - ' (LS) (where bl is body length). During this period. growth rate was the same in both groups.
At re\[. (/I.-\ was approximately 36 9 of cardiac output. (114 was inversely related to Vo2. indicating that blood flow was gradually redistributed from the viscera as the oxygen demands o f the locomotory muscles increawd. Both Vo, and (11. uere relatibely constant at swimming velocities less than 50 7r L'cnr. but at Ucnr. q14 had decreased by 60-70 Q as
reached a maximum. Blood flow redistribution away from the intestine contributed signiticantly to the oxygen supply for locomotory m u ~ l e s . since i t was estimated that the o~ygen-transporting capacity of this redistributed blood How was enough to support 12-18 % of the maximum internal oxygen consumption (total I;bl - gill i'o,).
Follouing exercise training. haematocrit (Hct) in the HS group (27.1 Q ) was \isniticantly higher than in the LS group (22.3 9). Ho~ve\er, neither the maximum Vo2 nor Lrcrl, was significantly different in the tuo groups. ((1.4 was inbersely related to Hct but, in spite of lower q1.4 at rest. oxygen transport to the inte\tines was greater ut all swimming speeds in the HS than in the LS training group. In addition, blood flow in the HS group was better maintained as the swimming speed *as increased. As a result of the higher Hct in the HS-trained group, oxygen transport to the intestines was similar in both groups at their respective training \elocities. Therefore. we suggest that, by increasing Hct and thereby maintaining oxygen delivery to the intestines. the HS group maintained normal intestinal function while swimming at the higher velocity, enabling overall growth rate to be the same as in the LS group.
Key words: chinook salmon. Olr~.orh~nc.lr~~.s t.rl~trw~r,schtr. intestinal blood flow, blood flow distribution. haematwrit, metabolic rate. exercise [mining.

Introduction
Salmon migrate to the ocean to exploit the more abundant food resources found there. When foraging they must maintain normal body functions and grow. whilst swimming more or less continuously. This is a challenge to the cardiovascular system, ~vhich must transport o x y p to working locomotory muscles and. at the same time. support the substantial metabolic maintenance requirements for feeding and growth. Following feeding. oxygen consumption of resting fish may double because of the metabolic costs of digestion, absorption and assimilation (Brett and Zala. 1975; Jobling, 1981; Brown and Cameron. 1991 ), such that the postprandial metabolic rate may represent up to 43 % of the active metabolic rate (Brett and Zala, 1975). Even though i t is unlikely that salmonids can maintain intestinal blood flow while swimming maximally, they can maintain relatively high swimming speeds ( 1.5-2 body lengths s-I (bl s - l ) without compromising growth (see Davison. 1989; Christiansen and Jobling, 1990).
The cardiovascular system of most vertebrates does not have the capacity to support simultaneously maximum blood flow demands for locomotion, feeding and maintenance functions (Farrell. 1991 ). Consequently. blood flow is redistributed from organs such as the intestines when the demands of locomotory muscles for oxygen increase (Vatner et (11. 1974; Vatner, 1978; Laughlin and Armstrong. 1982; Armstrong er al. 1987; Eriksen et 01. 1990; McKirnan et 01. 1991). The blood flow requirement depends on blood oxygen content. which is in part determined by Hct (Lindenfeld et al. 1985). Therefore, Hct may affect how much blood flow has to be redistributed from the viscera to locomotory muscles during exercise (Vatner et al. 1972, 1974).
I n resting fish, intestinal blood flow constitutes a signiticant (3040%) proportion of cardiac output and. postprandially. splanchnic blood flow increases by 6 6 7 0 % (Axelhson et 01. 1989: Axelsson and Fritsche, 1991: H. Thorarensen and A. P. Farrell, i n preprtration). However, during exercise fish reduce blood flow to the intestines (Randall and Daxboeck. 1981; Axelason et (11. 1989; Axelsson and Fritsche, 1991). and this reduction in intestinal blood flow may ultimately limit nutrient absorption and transport from the absorptive surfaces (blailman. 1982). In addition. seawater tish must drink to regrlin water lost across the gills to the hypertonic environment (Eddy. 1982; Kirsch et al. IC)84), an uptake process that probably depends on adequate intestinal blood flow. Since
blood How to the intestines can limit energy intake and the ability to osmoregulate. the swimming speeds that can be sustained over an extended period may be determined by the ability of the cardiovascular system to maintain intestinal blood flow.
The purpose of this research was to study to what extent intestinal blood flow can be maintained in chinook salmon as swimming speed increases. This is probably determined by the oxygen-transporting capacity of the cardiovascular system. which is set by cardiac output and blood oxygen content. During exercise. the maximum oxygen-transporting capacity determines how much blood flow can be delivered to other organs in excess of what is required to meet the oxygen demand of the locomotory musculature. Exercise trainins of fish is known to increase heart size (Hochachka, 1961; Greer-Walker and Emerson, 1978: Farrell rt (11. 1990), enhance cardiac performance (Farrell et al. 199 1 ) and

Inresrinal bloodjow in sn~itrvning salmon 117
increase haemoglobin content of blood (Hochachka. 1961; Farlinger and Beamish, 1978); all of these effects may contribute to increased oxygen-transporting capacity of the cardiovascular system. Thus. in addition to the general changes i n intestinal blood flow associated with swimming. we were interested in defining whether exercise training caused any cardiovascular adjustments that affected intestinal blood flow. Therefore. two groups of fish were compared following 8 months of exercise training, at either high or low swimming speeds. in order to identify any changes that migt,t improve the fishes' ability to maintain blood flow to the intestine while swimming.
I n this study we measured blood flow in the intestinal artery ( IA) , one of four arteries thut supply the gastrointestinal tract of chinook salmon (Thorarensen rt al. 1991). Judging from the diameters of these vessels, the 1.4 carries at least 80-90% of the total blood flow. The IA. through its various branches. supplies blood to the liver. the pyloric carcue, the spleen and the intestine. Since the I A carries most of the blood flow to the gut, i t was a>sumed thut. during exercise. blood flow to the IA reflected total blood flow to the digestive tract.
hlaterial and methods
An all-female (feminized) stock of Chinook salmon ( O t ~ c o r h ~ t ~ c h ~ ~ s tsturr.vt.rcha (Wa lba~~m)] was obtained from Big Qualicum Hatchery. Qualicum Beach. British Columbia. and kept in outdoor tanks under natural photoperiod for the duration of the experiment. The chinook were exercise trained for 8 months (December to July), hwimrning continuously at either 0.5 bodylengthss-' (b l s - ' ) (low speed: LS) or I .5 bl s-I (high speed: HS) in annular swimming channels (outer diameter 3.35 m; inner diameter 2.90 m). The water velocity was measured in the centre of the flume and regular checks indicated that variability in cross-sectional flow was less than 10%. The velocity i n the channels was adjusted every month as the ti sh increased i n size. Ample supplies of sell bvnter at ambient temperature (8-1 I "C) and salinity (3W1 %c) were provided throughout the training period. The fi sh lvere fed satiation levels of dry pellets twice daily (Biodiet dry. Oregon Bioproducts). Further descriptions of the training tanks and husbandry will be provided by A. K. Kiesslins and D. Higgs (in preparation).
Growth of fish in both groups was identical. The initial mean miisses were 76.5g and 76.42, re\pectively, for the LS and HS groups. The final masses were 365k30.2g ( ~ s . E . v . . N = 3 ) and 36315 .9g (iV=21), and the lengths were 30.3M.34crn and 30.1k0.36cm respectively. However. the HS fish consumed 25 % more food.
Criticwl srr~irntnit~g speed mu/ the rrspirotnrter
UCnt and VO2 were measured at 10+1 "C in a Brett-type swim-tunnel respirometer. The tjsh were allowed to recover for more than 5 h in the respirometer before UC,,( was determined by increasing the swimmins speed. first in steps of 0.5 bls- ' and then of 0.25 bl s-I. Each velocity step was maintained for either 30min or unt i l the fish fatigued. i.e. when the fish could not swim off the rear grid. We did not induce fish to swim by applying electric shocks. The velocity settings on the swim tunnel were calibrated

regularly with a flow meter. Ucr i t was calculated as described by Brett (1964) and corrected for the blocking effect of the fish in the tunnel (Bell and Terhune, 1970).
Oxygen tension ( Pwol) i n the swim tunnel was monitored continuously by an oxygen (Radiometer E50.16) thermostatically controlled at the experimental
temperature and connected to a PM7 1 unit (Radiometer. Copenhagen), Water from [he swim tunnel was drawn past the electrode by a roller pump and the Pwo, was recorded every second by a computer. Vo, was measured by closing off the tunnel for 6 min while pwo, was recorded. A least-squares procedure was used to calculate the slope or dPwo21dt. Oxygen consumption was calculated as:
where V is the volume of the tunnel (39.1 I ) . a is the solubility constant for oxygen at the experimental temperature and salinity (pmol02 1 - I kPa-I). and m is body mass. The pwo2 was never allowed to decrease b j more than 1 kPa while Voz was recorded.
At-terid cat~t~~rlarion ntld in~plar~tcrtiot~ offlorr.pmbe.r
The fish were anaesthetized in a 1:7000 solution of 2-phenoxyethanol (Sigma Chemical Co., St Louis. Missouri) in sea water and anaesthesia was maintained by irrigating the gills continuously with chilled 1 :4000 2-phenoxyethanol in sea water. The fish were cannulated in the dorsal aorta (DA) with polyethylene tubing (PE-50). The cannula was inserted with a trocar between the second and third gill arches and sutured to the roof of the mouth. The cannula was externalized in front of the nasal openings, secured with stitches i n front of the dorsal fin. and filled with saline (0.9% NaCI) containing heparin at 150 i.u. ml-I.
Two types of flow probes were used to measure blood flow in the IA: pulsed Doppler flow probes (PDP) (TMI. Iowa City. Iowa) and Transonic flow probes (TFP) (Transonic Inc., Ithaca, New York). depending on whether blood flow was being measured in resting or swimming fish. The PDP only measures the velocity of blood in the vessel, whereas the TFP measures absolute flow. However. the TFP has bulkier leads than the PDP and is therefore not as well suited for measuring blood flow in swimming fish. The flow probes were placed on the intestinal artery ( IA ) through a lateral incision, beginning 2 cm ventral to the lateral line. directly abo1.e the pectoral fin and extending 4cm ventrally in parallel with the myotomes. The skin was cut ~ . i t h a scalpel and the myotomes were carefully separated with blunt disection. A short section of the intestinal artery was freed from the surrounding fascia and the probe cuff placed on the vessel. The incision was closed with 3-0 silk thread, using interrupted stitches throuzh both muscles and skin. The probe leads were secured on the body surface and anchored dorsally with the DA cannula. The total time for surgery was less than 30min. The fish were allowed to recover for at least 23 h before experiments were performed.
Each time blood samples were taken from swimming fish, 1 ml of blood was removed to measure arterial Po, (Pao2). oxygen content (Cao,), haematocrit (Hct), and

haemoglobin concentration [Hb]. Pao, was measured with a thermostatted electrode (E5046) connected to a PM7I unit. Cao, was measured in 30pl blood samples by the method of Tucker ( 1967). Sigma diagnostic kits numbers 525A and 826-UV were used to measure blood haemoplobin ( i n 2OpI samples) and plasma lactate ( i n I O O p l samples) respectively. The blood that was used to measure Pao, and any leftover blood from the initial 1 ml sample (total amount around 0.8 ml) was reinjected into the fish and enough saline was added to make the total volume 1 ml. Before the fish fatigued, L 5 blood samples were taken, resulting i n approximately I.Oml of blood being replaced by saline.
E.rperitnet~tal protocol
Three sets of experiments were performed. In the first set. the critical swimming speed (Ucr,[) and oxygen consumption (Vo.) of unoperated fish were determined. I n the second set, fish were cannulated i n the dorsal aorta (DA) and a pulsed Doppler flow probe (PDP) was implanted on the intestinal artery (IA). The fish were then swum to U,,i, while relati1.e blood How in the IA ( q r ~ ) . blood pressure in the DA (PD,A). heart rate C~H) and Voz were measured after each increment in swimming speed. Arterial blood samples for Pao,, Cao,. Hct and [Hb] were taken at rest (5-IOcms-' water velocity in the swim tunnel with the tish not swimming) and at a swimming speed of 1.5 bl s-I. When the fish appeared to be approaching their maximum swimming speed. as indicated by the more frequent bursts of swimming that were required to maintain position. blood samples were taken at every \.elocity step. Thus, blood was sampled 4-5 times from every fish before i t fatigued and then after I h of recovery. Samples for lactate were taken at rest, as the fish fatigued. and after I h of recovery. For statistical analysis. huematological data recorded between 75 ur.d 95 '7c of Ucnl (mean 85 %) were pooled. as were samples taken above 95 7~ of Ucrit
The third set of experiments was performed on a separate group of LS fish. Resting levels of blood How in the inlestinal artery were measured with TFP. to provide absolute ~ a l u e s for blood How i n the 1.4 and thus an estimate of +I for the fish i n experiment 2. The tish with TPFs were placed in dark holding boxes and, after 34 h of recovery, blood tlow i n the IA was recorded overnight by a coniputer every minute. Between O4:OOh and 08:00 h I A blood How was the most stable, so these values were averaged to represent resting blood How. Following this period. Hct and Cao, were measured and the I ml of blood removed from the ti sh was replaced with saline to reduce Hct. Hct was reduced in a progressive fashion by repeating the same procedure one to three times at 24 h intervals and the relationship between Hct and absolute values of t p was established for individual fish. A few attempts were made to increase Hct with a transfusion of packed red blood cells. but only two were successful.
Signals from How meters, pressure transducers and oxygen meters were amplified and monitored by a Grass chart recorder (model 7PCP B, Grass Instruments. Quincy, fvIussachusetts) and stored in a computer. The computer sampled (11.4 and PDA signals at a rate of 5 Hz and recordings were averaged over 6min for each swimming velocity. Labtech Notebook software (Laboratory Technology Corporation, R.lassachusetts) was used to convert the signals to digital form, to process the signals and to calculate f ~ .

Statistical analyses were performed using the General Linear Models procedure and Proc Corr in SAS (Version 6. SAS Institute). q ~ x . PDA. f ~ . splanchnic vascular resistance and the haernatological variables were compared at different swimming speeds, in the two training groups. by a two-way analysis of variance (ANOVA) with repeated measures on individual fish. Other models are described as they are presented in the Results section. Values are presented as mean +_ s.E.kr. throughout text and figures. The fiducial limits for accepting significance were P<0.05.
Results
Criticd src,imtning speed and o.n.gen consumption
Neither the $'02mJx (HS: 319.9kI2.8 pmol min-I kg-': LS: 29W15.3 pmol min-1 kg-!) nor the U C n ~ (HS: 87.5k2.2 cm s - ' ; LS: 85.5kl.9cm s-I) of the two training groups differed significantly following 8 months of exercise training (N=10 fish from each group). There was significant correlation between the Ucnt and Voio2max of individual fish (P<0.0021).
A second-order polynomial modelled Vo2 (r2=0.86, Fig. 1 ) as function of swimming speed (Lr) in cms-I. No parameters of the model were significmtly different in the two training groups and. therefore. the data were pooled. This model accounted for individual variability by allowing a different intercept ( I f ) for each fish:
The equation implies that the energy budget of swimming fish consists of two components: one that increases with the square of the swimming speed and another that decreases as a function of swimming speed. This model gave a closer f i t to the data than a linear regression of the logarithm of Vo2 on swimming speed (r2=0.79).
The UCrl t of the operated fish from the two groups was not significantly different. being 63.8+3.1 bls-I for the HS group (N=I I ) and 65.Ok2.8 bls-I for the LS group (IV=15). Similarly. the V~:rnax not si,onifcantly different i n the two groups (350+22 pmol min-' kg- ' in LS and 3 18k25 pmol min-I kg-' in HS). The was not significantly different in operated and unoperated (experiment I ) fish, but the Ucr,[ kbas 33 % lower in operated fi sh compared with unoperated f 5h. When hz of cannulated fish was modelled as a function of swimming speed. Hct could be incorporated into the model as a significant variable (P<0.008). indicating that fish with higher Hct have higher vo2:
Vo2 = I t .+ 3.72Hct - 1.81U + 0.065U2. (3)
Rrl~l(ii*e changes in intrstind biootljYorc atld hnet~~atological \wriables of s~r~irnnzitzg/isl~
In both training groups. q h was progressively reduced as swimming speed increased above 3WOcms- I (Fig. l A ) because of a concomitant increase in splanchnic vascular resistance (Fig. 2B). A comparison with ANOVA of the mean changes in (71.4 as swimming speed was increased showed that, in the HS group, blood flow was significantly less reduced (P<0.0003) than in the LS group. Since the number of

Intestinal bloodJlow in sb~'imming snltnon
Swimming speed (bl s-I )
0.0 0.5 I .O 1.5 2.0 2.5 3.0 3.5 I I I 1 I T
Swimming speed (cms-I)
Fis. 1 . The rate of oxygen consumption of unoperatrd chinook salmon. Open symbols: fish trained at 0.5 bls-I (LS); tilled symbols: fish trained at 1.5 b ls- ' (HS). N=IO fish from each croup.
observations for each point in Fig. 2 is reduced at the highest swimming speeds, observations made at swimming speeds greater than the mean Uc,il were not included in the analysis. However, the values for the best swimmers have been included in the figure. PDA did not change significantly with swimming speed (Fig. 7C). but f~ increased by 3 1 9 (Fig. 3D, P<0.0001). Neither PDA nor f~ was significantly different between the t u o training groups.
There was a negative linear relationship (r2=0.83) between Vo2 and q1.4 (Fig. 3). suggesting that intestinal blood How was gradually reduced as the oxygen demands of locomotory muscles increased. The slopes of this relationship for the two groups in Fig. 3 were not significantly different.
The mean haematocrit of the HS training group was significantly (P<0.0001) higher than that of the LS group (Table 1 ). This difference was also reflected in the significantly higher (P<0.0001) [Hb] and Cao, (Table 1) . Mean cell huemoglobin concentration (MCHC) was slightly lower (P<O.Oj) in the LS group (Table I) . Neither Cloz nor [Hb] changed significantly with increased swimming speed. Pao, was. however, significantly (P<O.OOOI) reduced at swimming speeds higher than 85% of Ucrir. but there was no sisnificant difference between the two training groups (Table I).
Absollrtr b lood jow it1 the itltestird a r t r c
Blood flow in the intestinal artery of resting fish was inversely (P<0.0002) related to Hct. In spite of significant variability among individuals. all fish showed this same relationship and there was no significant difference between the slopes for individual fish.

Swimming speed ( c m s-')
60 0 70 1 0 60 80 100
Swimming speed (cm s-I)
Fig. 2. Cardiovascular changes during exercise in chinook salmon, swimming with a D A cannula and a Doppler flow probe on the intestinal artery. Bars show + S . E . V . . N=I0 for each group o f tish shown connected u i t h a line. Individual points represent mean values for 2-3 fish o f the group that swam faster than the remainder. ( A ) Blood How i n the intestinal artery. expressed ah the percentage change from the resting level. There is significant difference betueen group\ (Pc0.0003) and significant changes in both groups as su imming speed increa\cs (P<0.0001). ( B ) Relative resistance o f the splanchnic va.;cular bed. Resistance Incrt.aw\ signiticantly with swimming speed in both group.; (P<0.0001). (C) Pressure in the d o r d aorta. The results for the two group.; are not significantly different and there are no significant changes with swimming speed. (D) Heart rate shows a significant increase with cwininiing speed (P<O.(XJOI ), but heart rate in the t h o groups was not significantly different.
A linear regression of (11.4 ~ ~ e r s l r . ~ Hct that assumed the same slope (s.E.M. M.12) for all tish (N= 10) but different intercepts. explained 86 % of the total variance:
cl1.4 = I f - 0.57Hct. (4)
The mean intercept was 27.5 (k1.52). Recordings of q 1 4 made at Hcts lower than 20% were not included in the analysis since. at lower Hct, ~ I A appeared to decrease. but this phenomenon was not explored further. The highest recorded Hct was 36 %.
Discussion
At rest. intestinal blood flow was quite variable among individuals. but q r ~ of all fish increased as Hct and blood oxygen-carrying capacity were reduced. This indicates that blood flow is adjusted to maintain oxygen delivery to the intestines. The resting q l . ~
values of the LS and HS training groups, as predicted by equation 4 (and mean intercept

Intestinal bloodj?obv in swimming salmon 123
Fig. 3. Blood flow in the intestinal artery as a function o f oxygen uptake. Horizontal and hertical bars show ? s.E.M.. N=lO in each group.
for all fish), were 14.2 and I2.Omlmin-'kg-', respectively, indicating that resting intestinal blood flow was not appreciably changed by the two exercise training regimes.
Assuming that c l r is 80-90 54 of the total gastrointestinal blood flow. blood flow to the gut should amount to 13-18 ml min-' kg-' i n chinook salmon. This compares well with the 13 ml min-' kg-] measured i n the hepatic portal vein of anaesthetized rainbow trout (AIcLean and Ash, 1989). but i t is substantially higher than the resting gut blood flow reporttd for the sea raven (5.6 ml min-' k g - ' ) and the cod (7.6 ml min-I kg-') (Axelsson el ((1. 1989; Axelsson and Fritsche. 199 1 : Auelsson, 199 1 ). However, the cardiac output of chinook is also considerably higher than that of sea raven (18.8 ml min-I kg- ') and cod ( 18-19 ml min-' kg-]). being 33 ml min-' kg-' at rest in fish with a Hct of 30% ( H . Thorarensen, unpublished observation). The predicted q1.4 for a fish with this Hct uould be 12 mlmin-' kg-'. so the total pastrointestinal blood flow constitutes about 36 % of cardiac output. The proportion of cardiac output going to the gastrointestinal tract is. therefore, very similar to the values reported for sea raven (30 %) and for cod (40 %) (Axelsson rt a/. 1989; Axelsson and Fritsche. 1991 ; Axelsson. 199 1) . Direct measurements of gastrointestinal blood flow appear to indicate consistently that a higher proportion of cardiac output goes to the gut than the 10-20% estimated using radiolabelled microspheres (Daxboeck, 198 1 ; Barron rt al. 1987; H. Thorarensen, unpublished observations). Barron et dl . (1987) have suggested that the microsphere method may underestimate visceral blood flow.
Our results imply that the pumping capacity of the heart of chinook salmon is not enough to allow the fish to maintain maximum aerobic swimming velocity without redistributing blood How from the viscera to the locomotory muscles. Reduced gut blood

Table 1 . Hnemntocrir (Hct) , blood o.ngen conrrnf (Cao,l, haemoglobin concentrnrion ([Hb]), orrerial Po, (Pno,), mean cell Iiciemoglobin concentrcuion (MCHC) nnci ~ l a s m a
lrzctote concenrrnfion it1 fish rrr variolls str.inrming speeds --
Swimmtng speed
Training 85 Q speed Rest 1 bl s-I L / c m U c n ~ Recovery Mean -
LS 23.3 (0.9) 33.8 (0.3) 2-1.4(0.6) 24.5 (0.9) 2 ( 0 2 3 . 3 ~ HS 27.1 (1.0) 27.2 (0.91 2S.J(0.7) 28.3 (1.0) 16.7 ( 1.0) 27.6 LS 8.3 (0.5) 9 3 0 . 9.1 (0.3) 8.5 (0.5) 8.3 (0.5) 8.7: HS 10.9(0.6) I l . O ( O . i ] 11.5 (0.4) 10.5 (0.6) 10.6(0.5) 10.9 LS 7.16(0.3) 6.95 (0.3) 7.22(0.7) 7.11 (0.3) 6.57(0.3) 7.0: HS 8.61 (0.3) 8.24(0.3) 8.61 (0.7) 8.37(0.4) 8.07 10.3) 8.1 LS 15.9 (0.5) 15.0 (0.5) I . 0 . 4 11.3 (0.5) 15.3 ( 0 . 5 ) 14.lf HS 15.7 (0.6) 4 8 0 5 12.2 (0.4) 10.4 (0.6) 5 3 0 . 6 ) 13.6f LS 304(5) 290 (4 ) 294 (3) 295 (5) 297 (5) 296* HS 312(6) 303 (5) 305 (51 295 (6 , 303 (5) 3M LS 0.0 (0.5) 1.5 (0.4) 2.6 (0 .3) I . 4 i
The tish were trained at either 0.5 bl s-' (LS. N= 15) or 1.5 bl s-I (HS. iV= I I ). Numbers in parentheses are + s.E.v. *S~gnificant difference betueen training groups (P<0.05). +Significant difference betueen trainins groups (P<0.0001). $Significant difference among swimming speeds (P<0.0001). Recovery, measurements were taken after 1 h of recovery.
Ho~c has also been reported for swimming rainbow trout (Randall and Daxboeck, 1982), sea raven (Axelsson rt ol. 1989) and cod (Axelsson and Fritsche. 199 1 ). Houever. this is the tirst time that intestinal blood flo~c. has been shown to be linearly related to h, (Fig. 3). This indicates that. at swimming velociries over 50% Ucrit. c p is regulated in relation to the metabolic demands of the locomotory muscles. At lower swimming velocities. Vo, did not increase appreciably (Fig. I ) and q1.4 remained relatively constant. hut at swimming speeds higher than 50% of Ucr,t. cp.4 was reduced as Vo, increased. because of a concurrent increase in splanchnic vascular resistance (Fig. 2B) . The exact control mechanism for this is unkno~m. However. the resistance of the intestinal vasculnture of fish increases in responjr: to adrenergic. cholinergic and peptidergic stimulation (Holrngren and Nilsson. 1974; A.xelsson er (11. 1989; Olson and kleisheri, 1989; Axelsson and Fritsche rr (11. 1991; Holmgren et al. 1992; H . Thorarensen. unpublished observations).
The absolute intestinal blood flow in s~vimming fish was estimated (Fig. 4A) from the predicted resting blood flow and the relative changes in ~ I A shown i n Fig. 2A. In addition, oxygen transport to the intestines was estimated by multiplying L ~ I A by Caoz (Fig. 4B). . The HS-trained fish maintained adequate intestinal oxygenation while swimming at 1.5 bl s - ' by increasing Hct. Increased Hct was observed in earlier studies of exercise training in fish (Hochachka. 1961; Farlinger and Beamish. 1978). The increased Hct elevated the oxygen-carrying capacity of the blood. and thus oxygen transport to the
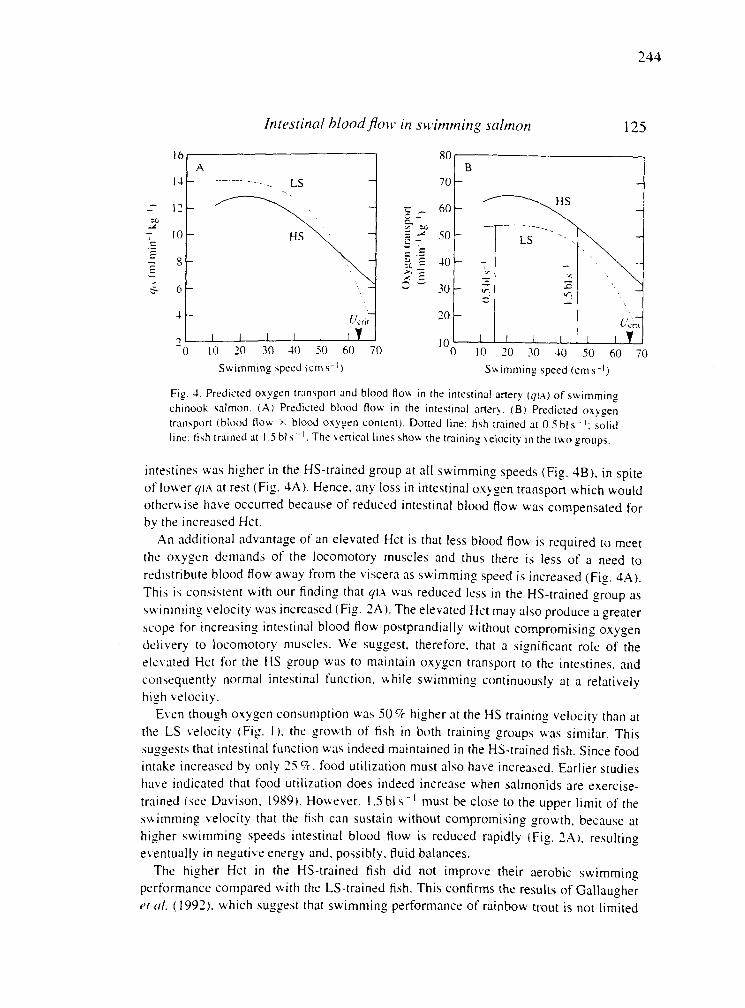
Intestinal bloodyon. in sk~*irnming salmon 125
Swimming speed (cm s-' ) Suimrning speed (cms-1)
Fig. 4. Predicted oxygen t r m p o n and blood f l o ~ in the intestinal artery ( ~ I A ) of swimming chlnook salmon. ( A ) Predicted b l ~ d f l ~ b in the intestinal men. . (B) Predicted oxygen tran\port (blood How x blood oxygen content). Dotted line: ti\h trained at 0.5 bl s-I; solid line: ti\h trained at 1.5 bl s - ' . The vertical lines show the training velocity in the two groups.
intestines was higher in the HS-trained group at all swimming speeds (Fig. 4B), in spite of lower ~ I A at rest (Fig. 4A). Hence. any loss in intestinal oxygen transport which would otherwise have occurred because of reduced intestinal blood flow was compensated for by the increased Hct.
An additional advantage of an elevated Hct is that less blood flow is required to meet the oxygen demands of the locomotory muscles and thus there is less of a need to redistribute blood flow away from the viscera as swimming speed is increased (Fig. JA). This is consictent with our finding that q l A was reduced less in the HS-trained group as swimmin_r velocity was increased (Fig. ?A). The elevated Hct may also produce a greater scope for increasing intestinal blood How postprandially without compromising oxygen delivery to locomotory muscles. We suggest. therefore, that a significant role of the elevated Hct for the HS group was to maintain oxygen transport to the intestines, and consequently normal intestinal function. while swimming continuously at a relatively hish velocity.
Even though oxygen consumption was 50% higher at the HS training velocity than at the LS velocity (Fig. I ) . the growth of fish in both trainins groups was similar. This susgests that intestinal function was indeed maintained in the HS-trained tish. Since food intake increased by only 25 5%. food utilization must also have increased. Earlier studies have indicated that food utilization does indeed increase when salmonids are exercise- trained (see Davison, 1989). However. 1.5 bl s - ' must be close to the upper limit of the swimming velocity that the tish can sustain without compromising growth, because at higher swimming speeds intestinal blood flow is reduced rapidly (Fig. ?A), resulting eventually in negative energy and, possibly, fluid balances.
The higher Hct in tht: HS-trained fish did not improve their aerobic swimming performance compared with the LS-trained fish. This confirms the results of Callaugher rt trl. (1992). which suggest that swimming performance of rainbow trout is not limited

Table 2. lnlportance of retiistriblition of intestinal blootiflorr dliring e.rercise forfisfI trained nt 0.5 bl s-' (LS) and 1.5 bl s-I ( H S )
LS H S
Internal Vo2* 175 223 (prnol rnin-' kg-I)
02-transporting capacity o f blood flow 37 3 I redistributed from the intestma1 artery at Us,,r (pmol min-I kg-I):
Contribution to tissue Vo, 32 2 7
Percentage of internal vo, 18 12
*Internal Vo, is oxygen consumption of tissues other than gills. assumed to be 70% of total VO2 (Daxboeck el d. 1982).
:Total redistribution from the intestines could be as much as 10-20% higher. $Assuming that average tissue oxygen extraction IS 86 5 (Kiceniuk and Jones. 1977).
by blood oxygen-carrying capacity within their normal Hct range. However, the results of the present study indicate that the significance of the Hct response to exercise is to allow other functions. such as digestion and perhaps osmoregulation, to be maintained while the tish are swimming.
in order to assess the relevance of the redistribution of blood flow away from the intestines for muscle oxygen delivery. at high swimming speeds, an estimate was made of the oxygen-transporting capacity of the blood flow redirected away from the intestines during swimming (Table 7). I t was assumed that the internal oxygen consumption (VO2 - gill oxygen consumption) was 70% of i'o, (Daxboeck et al. 1982) and that. at Ucrit, evtracrion of oxygen from blood was 86% (Kiceniuk and Jones, 1977). These calculations indicate that blood flow redistributed auay from the IA can transport at least 12% of the total oxygen consumed at L'crit in the HS-trained group and 18 '3 in the LS-trained group. Since the I A may only carry 80-90% of the total intestinal blood flow. the actual values are likely to be higher than our estimates. I t is evident. therefore. that redistribution of blood flow away from the intestines contributes significantly to the oxygen supply of aerobic m~lscles at swimming velocities close to Uzrir. and that the relative importance of this redistribution is greater in the LS-trained group with a lower Hct.
The redistribution of blood flow from the intestines will undoubtedly reduce the oxidative metabolism of these tissues. This sugehtion is consistent with the polynomial model of Vo, as a function of swimming speed. namely the component that decreases linearly with swimming velocity. Other studies have also indicated that less oxygen is allocated to the maintenance functions of tish as swimming speed increases (Furnell. 1987; Kaufmann and Wieser. 1997). I t has been suggested that the oxygen demand of swimming tish may exceed the rate at which oxygen can be delivered. resulting in a temporary shift of . enersy allocation from maintenance to locomotory functions (Wieser, 1989). Our results indicate that this shift is at least accompanied by. if not a result of. redistribution of blood flow. Furthermore, the degree to which this happens may be set by the factors, such as Hct, that alter the oxygen-transporting capacity of the cardiovascular system.

I t is assumed i n the polynon~ial model that the cost of locomotion increases in proportion to u'. In previous studies, the metabolic cost of swimming has been estimated to increase in proportion to U1."U' (see Jones and Randall. 1978; Kaufmann. 1990). However, these models implicitly assume that the standard metabolic rate remains the same at all swimming speeds. This no longer appears to be a reasonable assumption. If energy allocation to maintenance functions is reduced as s~vimming velocity increases, i t
is obvious that the metabolic cost of swimming will be underestimated, i.e. the value of the exponent should be higher. Therefore. our assumption that the oxygen consumption of swimming muscles increases in proportion to U' is i n keeping with the earlier estimates of the aerobic cost of swimming.
As the chinook salmon swam to Ucrit. Hct did not increase significantly. This has also been observed in coho salmon (Brauner et a(. 1993). However, an increase i n Hct has repeatedly been observed in rainbow trout and in brown trout swimming to Ucrir in fresh water (Thomas et 01. 1987: Butler et al. 1992; Gallaugher el al. 1997). Whether this is a reflection of interspecies differences, different environment (sea water rerslrs fresh water) or some other factor is unknown. It has been suggested that the significance of the increased Hct in rainbow trout is to maintain Cao, at Ucrit when Paoz is reduced (Thomas rt ~ r l . 1987: Butler er nl. 1992; Gallaugher et (11. 1991). However, in the chinook salmon the Cao, was not reduced at Ucrlt . i n spite of a substantial reduction in Pao, and unchanged Hct.
I n conclusion, our results show that intestinal blood flow is approximately 36% of cardiac output in resting chinook salmon. During exercise. blood flow is redistributed from the viscera to meet the increased oxygen demands of the skeletal muscles. Intestinal blood flow is relatively constant at swimming speeds lower than 40-50% of Ucrlt, when VO2 increases only slightly. At Ucr i t . however. (I[.\ is reduced by 60-70%. A significant proportion of muscle oxygen consumption during exercise can be supported by this blood ttow redistribution away from the viscera.
High-speed exercise training resulted in an increased Hct and oxygen-carrying capacity of the blood. thus facilitating oxygen transport to the viscera at all swimming speeds. Since less blood flow is required to meet the oxygen demands of locomotory muscles i n fish with an elevated Hct. this indirectly helps to maintain intestinal blood flow while the fish are swimming because there is less need to redistribute blood flow. Therefore, increased Hct allows the fish to swim continuously at higher speeds without compromising growth and maintenance functions.
This study was supported by an NSERC operating grant to A.P.F. A.K.K. received support from the Swedish Science Council and H.T. and P.G. were supported by Graduate Fellowships from Simon Fraser University.
References ~ \ K V S T K O N G . R. B.. DELP. M. D.. G O L J A ~ . E. F. ASD L.\LGHLIU. bl. H. (1987). Distribution o f blood Row
in muscle\ of rntniature swine during exercise. I . trppl. PI~x.rioi. 62. 1285-1298. A,YELSSON, M. ( 1990). On the cardiovascular control in representatives o f three vertebrate groups:
Effects of exercise and feeding. PhD thesis. University o f Gothenburg.

ASELSSOS, hl., DRIEDZIC. W. R.. F,ARRELL. A. P. ASD NILSSOS. S. (1989). Regulation o f cardiac output and gut blood flow in the sea raven. Hetnirriprrrlts nmericrrn~rs. Fish Physiol. Biochem. 6. 3 lj-326.
~ \ E L S S O N . h.1. AND FRITSCHE. R. (1991 ). Effects of exercise, hypoxia and feeding on the gastrointestinal blood flow in the Atlantic cod Gtrtlrls morhrlcr. J. exp. Biol. 158. 181-198.
BIRRON, hl. G.. T.ARR. B. D. . A m HAYTON. W. L. (1987). Temperature dependence of cardiac output and regional blood How in rainbow trout. Saltno gc~irdetrri Richardson. J . Fish Biol. 31, 735-74.
BELL. W. M. ASD TERHCSE. L. D. B. (1970). Water tunnel design for fisheries research. Tec.h. Rep. Fish. Rrs . Bti Cnn. 195. 69pp.
BR.-\C.SER, C. J.. SHRIWTOS. J . h.1. .ASD RASDALL. D. J. (1993). The effects of elevated plasma ion concentrations on swimming performance in coho salmon (Oncorh~trch~rs kis~rrch) parr. Can. J . Fish. clqlrclt. Sci. (in press).
BRETT. J. R. ( 1964). The respiratory metabolism and swimming performance of young sockeye salmon. J. Fi.vh. Rrs. Bd Crln. 21. I 183-1 226.
BRETT. J. R. .ASD ZALA. C. A. (1975). Daily pattern of nitrogen excretion and oxygen consumption of sockeye salmon. O n c o r h ~ n c h s neri(.fr, under controlled conditions. J. Fish. Res. Btl C L I ~ . 32, 2479-2486.
BROUL. C. R. .AYD C A ~ E R O \ . J. N. ( 1991). The induction of specific d)namic action in channel catfish by infusion of essential amino acids. Physiol. Zool. 64. 276297.
BCTLER. P. J.. D.AY. N. .ASD NAVBA. K. (1992). Interactive effects of seasonal temperature and low pH on resting oujgen uptake and swimming performance of adult broun trout Salrrro rrlrrrrr. J. exp. Biol. 165, 195-2 12.
CHRISTI.ASSES, J. S. ASD JOBLI~C. bl. (1990). The behaviour and the relationship between food intake and growth o f juvenile Arctlc charr, Scr1relitrrr.s t11pin~r.s L.. subjected to sustained exercise. Con. J . ZOO^. 68.2 I 85-2 19 I.
D-\L.ISOV. W. (1989). Training and its effects on teleost fish. Cotnp. Biochern. P l~ys io l . 94A. 1-10. DLYBOECK, C. (198 1 ). A study of the cardiovascular system of fish ( S d t n o gt~ir t lnrri) at reht and during
swimming exercise. PhD thesis, University of British Columbia. Vancouver. DASBOECK, C.. DAVIE. P. S.. PERRY. S. F. AND R.ASDALL. D. J. (1982). Oxygen uptake in a spontaneousl;,
ventilating. blood-perfused trout preparation. J. exp. Biol. 101. 35-45. E D O ~ . F. B. (1982). Osmotic and ionic regulation in captive tish with particular reference to salmonids.
Camp. Biochem. Physiol. 738. 125-1 4 I. EKIKSES. > I . . U',A,ALER. B. A.. WLLOE. L. AND WESCHE. J. ( 1990). Dynamics and dimensions of cardiac
o u t p ~ ~ t changes in humans at the onset and at the end of moderate rhythmic exercise. J. Phyriol. . Lotld. 416.423-437.
F {KLIXER. S. ,A&D BE,A~IISH. F. LV. H. ( 1978). Changes in blood chemistry and critical swimming speed of largemouth bass, ,Wicroprrrlr.s schorric1r.s. ui th physical conditioning. Trcrn.~. ,4111. Fish. Soc. 107. 523-527.
FAKRELL. A. P. ( 199 1 ). Circulation of body fluids. In Ert~~riorrttretrrrrl irtrii .I./rrerholic Anitntrl P h ~ s i o l o g y (ed. C. L. Prosser). pp. 509-558. New York: John Wiley & Sons Inc.
F\RREI.L. A. P.. JOHASSES. J. A.. STEFFENSES. J. F.. MOYES. C. D.. LC'EST. T. G. ,ASD SUAREZ, R. K. ( 1900). Effects of exercise training and coronary ablation on s\rlmming performance. heart size and cardiac enzymes in rainbow trout. 0ncorhyrrch~r.v nr\.ki.s.s. Ctrtr. J . Zool. 68, 1 174-1 179.
F.ARRELL. A. P.. JOHASSFS. J. A . .A\D S ~ A R E Z . R. K. ( 199 I ) . Effects of e.xercise-training on cardiac performance and n ~ u x l e enzymes in rainbou trout. Oncorlrj~t~c~lrrrs ttrjXis.s. Frsh Phy.~iol . Biochetrr. 9. 303-3 12.
FL.RSELL. D. J. (1987). Partitioning of locomotor and feeding nietabolism in sabletish (Atrczploportr(r j t trhri~r) . Cwr . J . 2001. 65. 486489.
GALLAC'CHER. P., ASELSSOS. hl. AND F.ARRELL. A. P. (IY(i2). Swimming performance and haen1;1tologica1 variables in \plenectomized rainbow trout. 0t1corhwch1r.s myki.ss. J. e.rp. B i d . 171, 301-314.
GREER-WAI.KER. bl. AND EXIERSOL. L. (1978). Sustclined swimming speeds and myotomal muscle function in the trout. S~~lrrro gaircltrrri. J. Fish Biol. 13. 47548 1.
H~CHACHK.A. P. W. (1961). The effect o f physical training on oxygen debt and glycogen reserves in trout. C m . J. Zool. 39, 767-776.
HOI-LIGREN. S., ASELSSON, M. ASD FARRELL, A. P. (1992). The effect of catecholamines, substance P and vasoactive intestinal polypeptide on blood How to the gut in the dogfish Syridlrs actmihias. J. exp. Biol. 168. 16 1 - 175.

Ittrestinal bloodJon: in sbr-itnming salmon 129
HOLLIGRES. S. A V D NILSSON. S. (197-1). Drug effects on isolated artery strips from two teleosts. Godlts rnorlruii and Sclltno gclircineri. Acrn phr.siol. scirtrti. 90. 43 1-437.
JOBL.IS(;. h l . ( 198 1 ). The influences of feeding on the metabolic rate of fishes: a shon review. J. Fish Biol. 18. 385400.
JOES. D. R. .ASD RASIIALL. D. J. (1978). The respiratory and circulatory system5 during exercise. In Fish Ph~.s iolog~, vol. VI1 Id. %'. S. Hoar and D. J. Randall). pp. 425-501. New York: Academic Pres.
K.AC.FLIASS. R. ( 1990). Respiratory cost of swimming in larval and juvenile cyprinids. J. e.rp. Biol. 150, 343-366.
K . i u ~ a l ~ x x , R. AKD WIESER. W. (1992). Influence of temperature and amb~ent oxygen on the swimming energetics of cyprinid larvae and juveniles. En\./ Biol. Fi.che.s 33. 87-95.
KICESIUK. J . W. ASD JOSES. D. R. ( 1977). The oxygen transport sqstem in trout (Salmogoirdneri) during sustained exercise. J. exp. Biol. 69. 217-260.
KIKSCH, R.. HLLIBEKT. W. ASD RODEAC. J. L . (1981). Control o f the blood osmolarity in fishes with reference to the functional anatomy of the gut. In Osmoregttlorion in Esrrrurine and Mt~rine Animals (ed. A. Pequeux. R. Gilles and L. Bolis). pp. 68-92. Berlin, Heidelberg, New York. Tokyo: Springer- Verlag.
LAC.GHI.IS. 1L1. H. AND AR~ISTROSG. R. B. (1982). M u m l a r blood flow distribution patterns as a function ot' running speed in rats. Am. J. Plr.vsiol. 2-13. H296H306.
L I~DE~FELD. J . . WEIL. J. V.. TRAVIS. V. .AsD H o ~ u . 1 ~ . L. D. (198.5). Hemodynamic response to normo~olemic polqcytemia at rest and during exercise in dogs. Circrrlnrion Res. 56. 793-800.
~ ~ A I L L I A ~ . D. (1982). Blood How and intestinal absorption. Fedn Proc. Fedn Atn. Socs e.rp. Biol. 41. 2096-2 100.
~ ICKIRSAS. h1. D.. GRAY. C. G. . A ~ D WHITE. F. C. (1991). Effects of feeding on muscle blood flow during prolonged elercise in miniature swine. J. oppl. Phyiol. 70. 1097-1 10.4.
h lcL~; \s . E. OD ASH. R. ( 1989). Chronic cannulatinon of the hepatic portal vein in rainbow trout, Solmo giririi~rrri: A prerequisite to net absorption studies. Aqrtacrilrrire 78. 195-105.
O~sou . K. R. AsD ~~EISHERI. K. D. ( 1989). Effects of atrid natriuretic factor on isolated arteries and perfubed organs o f trout. Am. J. Ph~siol. 256. R 10-R 18.
R-\\u-\LL. D. J. A ~ D D.AXBOECK. C. (1982). Cardiovascular changes in the rainbow trout (Scllmo ,qtrinitrrri Richardson) during exercise. Con. J. Zool. 60, 1135-1 110.
'I'HOVAS. S., PULPI~, J.. LYKKEBOE. G. ASD JOHASSES. K. (1987). Effects of graded exercise on blood gas tt.n\ion\ and acid base characteristics of rainbou trout. Respir. Ph~siol. 68. 85-97.
THOR.AKESSES. H.. MCLEAS. E.. DOXALDSON. E. b1. .ASD FARRELL. A. P. (1991). The blood vasculature of the ga4trointestinaI tract in chinook. Otrcwll\nch~l.t r.thnrcyschn (Wal baum) and coho. 0 . kisilrch i U'albaum) salnwn. J. Fish Biol. 38. 53-53 1 .
TLCKER. V. A. ( 1967). lllethod for onysen content and dissociation curves on microliter blood samples. J. trpl~l. Ph~.tio/. 23. 4 10-4 l 1.
L'AT\~.R. S. F. (1978). Effects of e.tercise and e~citement on mesenteric and renal dynamics in conxxous. unrebtrained baboons. Am. J. Ph~.viol. 23-1. H I 10-Hz 14.
V A T ~ E R K . S. F.. HIGCISS. C. B. ASD FR.A\KLI.S, D. (1972). Regional circulatory adjustments to moderate and sebere chronic anemia in conscious dogs at re\t and during exercise. Circt~lnrion Re.?. 30, 73 1-7-10.
L'- \T~ER. S. F.. HIGGI~S. C. B.. MII-L.ARD. R. W. .A.\D FR.ANKLIN. D. ( 1971). Role of the spleen in the peripheral vascular rebpome to wvere exercihe in untethered dogs. Ccrrtiir~c Res. 8, 276282.
U'IESF.~, W. (1989). Energy allocation bq addition and by compensation: an old principle revisited. In Etrrr,y~ Trcrrr.vfi)rrniitiun irr Ct41.v cord Atritnct1.s (ed. b'. W i e w and E. Gnaiger). pp. 98-105. Stuttgan: Georg Thieme Verlag.