the role of geography in human adaptation€¦ · suggest that selection is often weak enough that...
TRANSCRIPT
The Role of Geography in Human AdaptationGraham Coop1.¤a*, Joseph K. Pickrell1.*, John Novembre1¤b, Sridhar Kudaravalli1, Jun Li2, Devin
Absher3, Richard M. Myers3, Luigi Luca Cavalli-Sforza4, Marcus W. Feldman5, Jonathan K. Pritchard1,6*
1Department of Human Genetics, University of Chicago, Chicago, Illinois, United States of America, 2Department of Human Genetics, University of Michigan, Ann Arbor,
Michigan, United States of America, 3HudsonAlpha Institute for Biotechnology, Huntsville, Alabama, United States of America, 4Department of Genetics, Stanford
University, Stanford, California, United States of America, 5Department of Biological Sciences, Stanford University, Stanford, California, United States of America, 6Howard
Hughes Medical Institute, University of Chicago, Chicago, Illinois, United States of America
Abstract
Various observations argue for a role of adaptation in recent human evolution, including results from genome-wide studiesand analyses of selection signals at candidate genes. Here, we use genome-wide SNP data from the HapMap and CEPH-Human Genome Diversity Panel samples to study the geographic distributions of putatively selected alleles at a range ofgeographic scales. We find that the average allele frequency divergence is highly predictive of the most extreme FST valuesacross the whole genome. On a broad scale, the geographic distribution of putatively selected alleles almost invariablyconforms to population clusters identified using randomly chosen genetic markers. Given this structure, there aresurprisingly few fixed or nearly fixed differences between human populations. Among the nearly fixed differences that doexist, nearly all are due to fixation events that occurred outside of Africa, and most appear in East Asia. These patternssuggest that selection is often weak enough that neutral processes—especially population history, migration, and drift—exert powerful influences over the fate and geographic distribution of selected alleles.
Citation: Coop G, Pickrell JK, Novembre J, Kudaravalli S, Li J, et al. (2009) The Role of Geography in Human Adaptation. PLoS Genet 5(6): e1000500. doi:10.1371/journal.pgen.1000500
Editor: Mikkel H. Schierup, University of Aarhus, Denmark
Received November 12, 2008; Accepted May 4, 2009; Published June 5, 2009
Copyright: ! 2009 Coop et al. This is an open-access article distributed under the terms of the Creative Commons Attribution License, which permitsunrestricted use, distribution, and reproduction in any medium, provided the original author and source are credited.
Funding: This work was supported by a Packard Foundation grant to J. Pritchard. J. Pickrell was supported by a National Institutes of Health training grant to theUniversity of Chicago. G. Coop was also supported by funds from UC Davis. J. Novembre was supported by a US National Science Foundation postdoctoralresearch fellowship in bioinformatics. M. Feldman was supported by grant GM28016. J. Pritchard is an investigator of the Howard Hughes Medical Institute. Thefunders had no role in study design, data collection and analysis, decision to publish, or preparation of the manuscript.
Competing Interests: The authors have declared that no competing interests exist.
* E-mail: [email protected] (GC); [email protected] (JKP); [email protected] (JKP)
¤a Current address: Section of Evolution and Ecology and Center for Population Biology, University of California Davis, Davis, California, United States of America¤b Current address: Department of Ecology and Evolutionary Biology, University of California Los Angeles, Los Angeles, California, United States of America
. These authors contributed equally to this work.
Introduction
One of the central problems in evolutionary biology is tounderstand the genetic and ecological mechanisms that driveadaptation. With the advent of large-scale SNP and DNAsequence data it is now possible to study selection and adaptationat a genome-wide scale. In recent years there has beenconsiderable progress in identifying potential signals of selectionin a wide variety of species [1–4].In this study, we focus on recent adaptation in human
populations. In particular, we examine the role of geography andpopulation history in the spread of selectively favored alleles. Themethods that we use provide information about adaptive events thathave occurred since the divergence of African and non-Africanpopulations—i.e., over the last 50–100 KY [5–8]. During this timeperiod the environment and ecology of humans have changedprofoundly. Humans have spread out of Africa to colonize almost allof the world’s land mass, and in the process have experienced a vastrange of new climates, diets and ecosystems [6,9]. Humans havealso encountered new pathogens as they moved around the globeand moved into close proximity with domesticated animals, and ashuman population densities increased.These changes in human ecology suggest that there has been
ample scope for the action of natural selection in recent human
evolution.Moreover, most species, including humans, probably facevarious additional selection pressures on a persistent basis: e.g., dueto sexual competition, viability selection and resistance to evolvingpathogens. Hence, it seems reasonable that our genomes wouldshow evidence for recent selection, and there is great interest inunderstanding what types of environmental pressures and biologicalprocesses show the strongest signals of adaptation [1,10,11].Some of the strongest evidence for recent adaptation comes
from candidate genes where there is both a strong biologicalhypothesis for selection as well as evidence for selection fromunusual haplotype patterns, homozygosity, or extreme values ofFST [1]. Examples include genes involved in malaria resistancesuch as G6PD and the Duffy antigen gene [12–14]; genes involvedin lighter skin pigmentation in non-Africans (e.g., SLC24A5,SLC45A2 and KITLG) [15–21]; and a pair of genes involved indietary adaptations (lactase and salivary amylase) [22–25].Recent studies have also cast a wider net to identify signals of
selection using genome-wide SNP data [16,17,26–31], or large-scale resequencing data [32,33]. Most of these studies report manycandidate signals of positive selection. However, for most of thesignals detected in this way, we do not yet know how the variationaffects phenotypes or the nature of the selective pressures; indeedeven the target genes are often uncertain. It is difficult to assesswhat fraction of the candidate signals are genuinely due to
PLoS Genetics | www.plosgenetics.org 1 June 2009 | Volume 5 | Issue 6 | e1000500

selection, rather than being extreme outliers in the neutraldistribution [34]; however, simulations generally show thatextreme values of various test statistics are more abundant in thereal data than would be expected under neutral models[16,17,28,35]. Some studies have also reported enrichment ofselection signals in and around genes, as might be expected ifselection is concentrated near genes [16,31,36], and a recent studyhas provided robust genome-wide evidence of selection shapingpatterns of diversity [37].While most recent papers on selection in humans have focused on
identifying genes and phenotypes involved in selection, our paperaims to learn more generally about the nature and prevalence ofpositive selection in humans. We also highlight some of theconceptual and methodological challenges in studies of selection. Aseparate companion paper focuses more closely on individualselection signals of particular interest [21], and a genome browser ofour results is available (http://hgdp.uchicago.edu/).
Data and Populations StudiedWe analyzed genome-wide SNP data from two primary sources,
namely, the Human Genome Diversity Panel CEPH (HGDP), andthe Phase II HapMap. Together, these two data sets provide thebest available combination of dense geographic sampling (HGDP)and dense SNP data (Phase II HapMap) and hence providecomplementary information for our analysis.The HGDP data reported by Li et al. [38] consist of 640,000
autosomal SNPs genotyped in 938 unrelated individuals. Theseindividuals include samples from 53 different human populations.They represent much of the span of human genetic diversity[39,40], albeit with notable sampling gaps in Africa and elsewhere[41,42]. Using these samples, Rosenberg et al. [40] identified fivemajor genetic clusters corresponding to native populations fromsub-Saharan Africa, west Eurasia, east Asia, Oceania and theAmericas. There is also an overall relationship between geneticdifferentiation and geographic distance [43,44] suggesting thathuman population history is likely a complex mixture ofpopulation splits and gene flow [45].The HapMap data consist of over 3 million SNPs genotyped in
210 unrelated individuals [26,36]. These individuals include 60Yoruba from Ibadan, Nigeria (YRI), 60 individuals of northwestEuropean ancestry from Utah (CEU) and 90 individuals from eastAsia (from Beijing and Tokyo) that we analyzed as a single‘‘analysis panel’’(here denoted ASN). For those analyses in whichuniform SNP ascertainment is most important, we used a subset ofthe HapMap data consisting of 900,000 SNPs identified by
Perlegen Sciences [46]. These SNPs were detected using array-based resequencing in a multiethnic panel, and subsequentlygenotyped in the HapMap. This screen should have good power todetect high- FST SNPs since both alleles of a high- FST SNP arelikely to be present in a multiethnic sample (see Methods forfurther details). Throughout this paper we consider only theautosomes since the smaller effective population size and thesmaller sample sizes in the X chromosome data make itinappropriate to merge the X and autosomal data.
Overview of the PaperAs noted above, we now know of several genes in which recent
selection appears to have been very strong, driving new alleles tohigh frequencies in particular populations or groups of populations[48–50]. Some genome-wide studies have estimated that strongselection, with selection coefficients above 1%, is widespread in thegenome (e.g., [16,47]). Similarly, studies of other organisms haveidentified cases in which selection has created large allelefrequency differences between populations, even in the presenceof high rates of gene flow [48,49,50]. Together, these studiessuggest that selection in humans might be a strong force thatallows for local adaptation via large allele frequency shifts atindividual loci.If this were the case, then we might expect to find SNPs whose
frequency distributions in the HGDP differ dramatically fromneutral patterns. For example, some SNPs might show extremeallele frequency differences between closely related populationsdue to divergent selective pressures [51]. More broadly, we mightexpect to find alleles whose geographic distributions differdramatically from the expectations of neutral population structure,if their frequencies are driven by factors such as diet or climate[24,52]. However, neutral forces including migration andadmixture would tend to work against selection, reducingfrequency differences between geographically close populations[53,54]. Hence it is unclear whether selection pressures in humansare strong enough, and sufficiently divergent over short geographicscales, to produce large frequency differences at individual loci.In this paper, we begin to answer some of these questions by
examining the distributions of potentially selected SNPs at avariety of geographic scales. Our approach combines thecomplementary strengths of the HGDP and HapMap data sets:we use the HGDP to study the geographic distributions ofputatively selected alleles at fine scales, and the much denserHapMap data to study differences between continental popula-tions. We aim to learn whether selection in humans is strongenough to generate highly divergent allele frequencies betweenclosely related populations, and geographic distributions thatdiverge strongly from neutral patterns. At the largest geographicscales, we ask: How effective has selection been at driving allelefrequency differentiation between continental groups?
Results
At its most basic level, natural selection acts to change allelefrequencies in populations. Hence, geographically localizedselection will lead to allele frequency differences betweenpopulations, both at a selected locus and at other closely linkedloci. Throughout this paper, we use extreme allele frequencydifferences between populations as a tool for identifying candidatesignals of selection [55].A major hurdle for any population genetic study of positive
selection is to show that the measures used do in fact detect signalsof selection rather than just the outliers of a neutral distribution.To test whether the extremes of allele frequency differentiation
Author Summary
Since the beginning of the study of evolution, people havebeen fascinated by recent human evolution and adapta-tion. Despite great progress in our understanding ofhuman history, we still know relatively little about theselection pressures and historical factors that have beenimportant over the past 100,000 years. In that time humanpopulations have spread around the world and adapted ina wide variety of ways to the new environments they haveencountered. Here, we investigate the genomic signal ofthese adaptations using a large set of geographicallydiverse human populations typed at thousands of geneticmarkers across the genome. We find that patterns atselected loci are predictable from the patterns found at allmarkers genome-wide. On the basis of this, we argue thatselection has been strongly constrained by the historicalrelationships and gene flow between populations.
The Role of Geography in Human Adaptation
PLoS Genetics | www.plosgenetics.org 2 June 2009 | Volume 5 | Issue 6 | e1000500
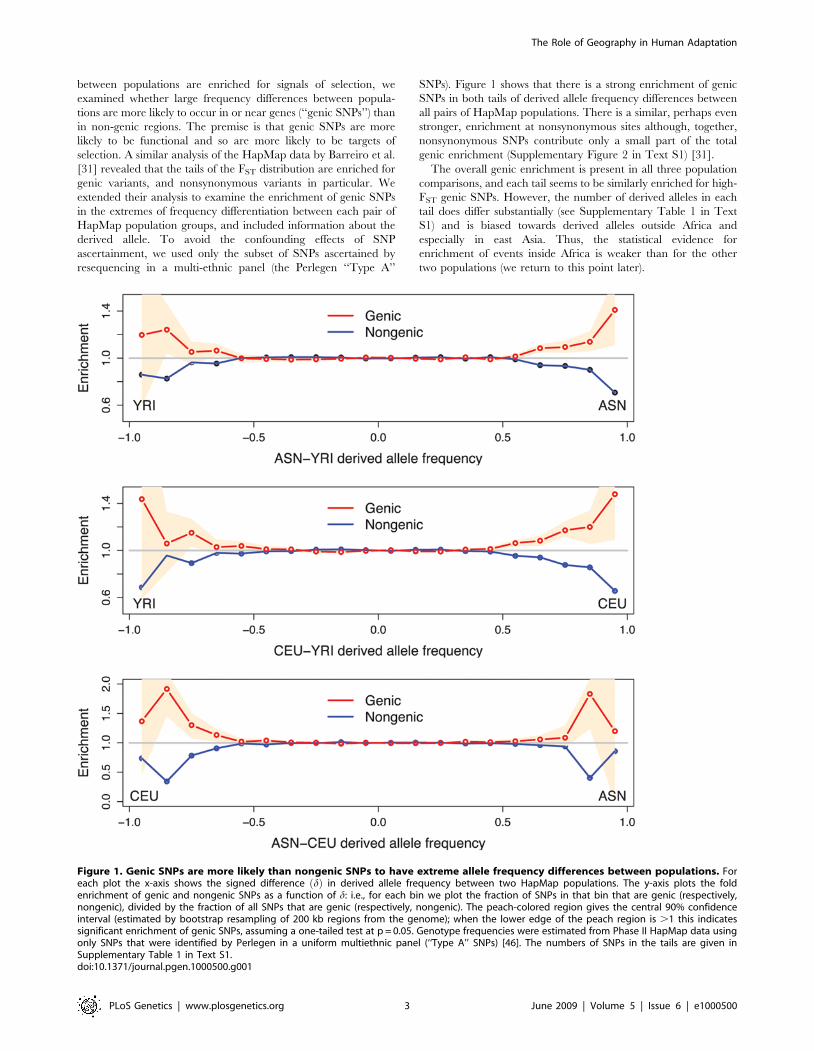
between populations are enriched for signals of selection, weexamined whether large frequency differences between popula-tions are more likely to occur in or near genes (‘‘genic SNPs’’) thanin non-genic regions. The premise is that genic SNPs are morelikely to be functional and so are more likely to be targets ofselection. A similar analysis of the HapMap data by Barreiro et al.[31] revealed that the tails of the FST distribution are enriched forgenic variants, and nonsynonymous variants in particular. Weextended their analysis to examine the enrichment of genic SNPsin the extremes of frequency differentiation between each pair ofHapMap population groups, and included information about thederived allele. To avoid the confounding effects of SNPascertainment, we used only the subset of SNPs ascertained byresequencing in a multi-ethnic panel (the Perlegen ‘‘Type A’’
SNPs). Figure 1 shows that there is a strong enrichment of genicSNPs in both tails of derived allele frequency differences betweenall pairs of HapMap populations. There is a similar, perhaps evenstronger, enrichment at nonsynonymous sites although, together,nonsynonymous SNPs contribute only a small part of the totalgenic enrichment (Supplementary Figure 2 in Text S1) [31].The overall genic enrichment is present in all three population
comparisons, and each tail seems to be similarly enriched for high-FST genic SNPs. However, the number of derived alleles in eachtail does differ substantially (see Supplementary Table 1 in TextS1) and is biased towards derived alleles outside Africa andespecially in east Asia. Thus, the statistical evidence forenrichment of events inside Africa is weaker than for the othertwo populations (we return to this point later).
Figure 1. Genic SNPs are more likely than nongenic SNPs to have extreme allele frequency differences between populations. Foreach plot the x-axis shows the signed difference d! " in derived allele frequency between two HapMap populations. The y-axis plots the foldenrichment of genic and nongenic SNPs as a function of d: i.e., for each bin we plot the fraction of SNPs in that bin that are genic (respectively,nongenic), divided by the fraction of all SNPs that are genic (respectively, nongenic). The peach-colored region gives the central 90% confidenceinterval (estimated by bootstrap resampling of 200 kb regions from the genome); when the lower edge of the peach region is .1 this indicatessignificant enrichment of genic SNPs, assuming a one-tailed test at p = 0.05. Genotype frequencies were estimated from Phase II HapMap data usingonly SNPs that were identified by Perlegen in a uniform multiethnic panel (‘‘Type A’’ SNPs) [46]. The numbers of SNPs in the tails are given inSupplementary Table 1 in Text S1.doi:10.1371/journal.pgen.1000500.g001
The Role of Geography in Human Adaptation
PLoS Genetics | www.plosgenetics.org 3 June 2009 | Volume 5 | Issue 6 | e1000500

Simulations show that this type of enrichment is expected undermodels with positive selection and is difficult to explain by othermechanisms (Supplementary Figure 3 in Text S1). One mightworry that subtle biases in the Perlegen ascertainment could leadto better detection of high- FST SNPs in genic regions, but thisdoes not seem to be the case (see Methods). Another reasonableconcern is whether models with weakly deleterious mutationscould produce this effect either through drift [36] or allelic surfing[56]. However, simulations suggest that models of bottlenecks withweak purifying selection do not inflate FST in genes (Supplemen-tary Figure 3 in Text S1). Finally, background selection couldincrease drift in genic regions, thereby increasing the abundance ofhigh- FST SNPs [57, Supplementary Figure 4 in Text S1].Theoretical considerations suggest that background selection inhumans may be weak [58]; however, direct empirical estimates ofthe size of this effect are yet to be made, and there is a need formore work on this issue. Thus, in summary, Figure 1 and oursimulations strongly suggest that positive selection and associatedhitch-hiking are the cause of many of the extreme frequency
differences between populations. In light of these results, we willuse extremely high- FST SNPs between these populations ascandidate selection signals, while noting that some fraction of thesehigh- FST SNPs are likely to be drawn from the extreme tail of theneutral distribution.
Extreme Frequency Differences between Populations asa Function of Mean FSTGiven that a substantial fraction of SNPs with high FST between
the HapMap groups may be targets of selection, we next examinedthe geographic distributions of high- FST SNPs across the HGDP.For signals of local adaptation, we searched for examples of SNPsthat have highly diverged allele frequencies in pairs of populationsthat are closely related according to mean FST (Figure 2). Notethat mean FST between a pair of population is a reasonable proxyfor the geographic distance separating the pair [43,44]. Of course,a possible caveat of studying FST in the HGDP data is that theIllumina tag SNP panel contains only a subset of all SNPs, and theselected sites might not be included. However, sweeps should
Figure 2. The relationship between mean FST and the most extreme allele frequency differences genome-wide between pairs ofHGDP populations. The x-axis of each plot shows the autosomal mean FST for pairs of HGDP populations, considering all possible pairs fromamong the 26 HGDP populations with samples of $15 individuals. The y-axes show the value of (A) the maximum autosomal allele frequencydifference ( dj j) for each population pair, and (B) the value of the 65th most extreme dj j for each population pair (i.e., the 99.99th percentile of theallele frequency distribution). To provide a sense of scale on the figure, red arrows are used to indicate the mean autosomal pairwise FST betweensome arbitrary pairs of populations (key: French (Fra), Palestinian (Pal), Han-Chinese (Han) and Yoruba (Yor)). The red lines plot lowess fits to the data.Plots of the extremes of pairwise FST and with different sample size cutoffs are similar (Supplementary Figures 5 and 6 in Text S1).doi:10.1371/journal.pgen.1000500.g002
The Role of Geography in Human Adaptation
PLoS Genetics | www.plosgenetics.org 4 June 2009 | Volume 5 | Issue 6 | e1000500

usually be detectable because they would change the allelefrequencies at nearby tag SNPs; tag SNPs tend to transfer wellamong the HGDP populations [59]. (Sweeps on standingvariation–i.e., existing polymorphisms–are likely to be less-welltagged than sweeps that start from new mutations [60].)In fact, the data show no examples of SNPs with very extreme
allele frequency differences between closely related populations(i.e., population pairs with low mean FST). Moreover, the meanpairwise FST is highly predictive of the very extreme tail of allelefrequency differentiation. If local adaptation were a strong force,we might have expected to find at least some SNPs with extremefrequency differences between closely related populations, or somepopulation pairs with large numbers of high- FST SNPs. Thiswould be true especially if strong antagonistic selection werewidespread: i.e., where different alleles were strongly favored indifferent locations. Instead, the observation that the extremes ofallele frequency differences are so well-predicted by mean FSTmight seem consistent with the expectations of an entirely neutralmodel [61].However, several observations argue against a fully neutral
model for these data. First, simulations show that the tails ofdifferentiation observed here are more extreme than expectedunder neutral models (see Supplementary Figure 7 in Text S1).Second, as shown in Figure 1, the extremes of allele frequencydifferences in the HapMap are enriched for genic SNPs, as mightbe expected if many of these SNPs are selectively favored. Thisresult is also observed at finer geographic scales in the HGDP data(Supplementary Figure 8 in Text S1), although it is unclearwhether this result is robust to the Illumina SNP ascertainmentscheme. Finally, many of the most extreme SNPs (across a range ofmean FST) fall close to strong candidate genes for selection,including skin pigmentation genes, lactase, and Toll-like receptor 6[21, 22, 62, Supplementary Figure 9 in Text S1]. Although suchSNPs with large allele frequency differences are especially strongcandidates for being targets of selection, they are not strongoutliers from the curves seen in Figure 2, suggesting that they, too,are governed by the predictive relationship between mean FST andextreme allele frequency differences.
The Geographic Distributions of High- FST SNPsTo further investigate the geographic patterns of putatively
selected loci, we next focused on the global distributions of SNPsthat show extreme differentiation between particular pairs ofpopulations. In the following discussion, we focus on SNPs withextreme pairwise FST between three HGDP populations: theYoruba, French and Han Chinese. These three populations werechosen because they are geographically far apart and becausethere is evidence that selection is responsible for many of theextreme FST values between each of these groups (Figure 1).Results for additional comparisons are shown in SupplementaryFigures 10 and 11 in Text S1.Under strong selection, the geographic distributions of selected
alleles detected in pairwise comparisons might differ greatly fromone locus to another. For example, a selected allele that stronglydifferentiates the French from both the Yoruba and Han could bestrongly clinal across Europe, or at high frequency in Europe andabsent elsewhere, or follow any other distribution according to thegeographic nature of the selective pressure.However, we see that the global geographic distributions of
these putatively selected alleles are largely determined simply bytheir frequencies in Yoruba, French and Han (Figure 3). Theglobal distributions fall into three major geographic patterns thatwe interpret as non-African sweeps, west Eurasian sweeps and EastAsian sweeps, respectively. The boundaries of these three patterns
are highly concordant with neutral population structure inferredfrom random microsatellites or SNPs [38,40]. This is the case evenfor loci such as KITLG, SLC24A5 and EDAR where there is astrong biological case for the genes being targets of selection.Moreover, these patterns are robust to the choice of populationsused to identify high- FST SNPs: for example, very similar resultsare obtained for SNPs with high FST between Mandenka, Balochiand Yakut (Supplementary Figure 14 in Text S1).The first pattern, the ‘‘non-African sweep’’, is exemplified by a
sweep near the KIT ligand gene (KITLG) (Figure 4A, B). It hasbeen reported previously that HapMap Europeans and EastAsians have undergone a selective sweep in the KITLG region on avariant that leads to lighter skin pigmentation [20]. Haplotypepatterns in the HGDP indicate that a single haplotype has sweptalmost to fixation in nearly all non-African populations (Figure 4A).More generally, at SNPs that strongly differentiate the HGDPYoruba from both the Han and French (Figure 3A, B), we observethat typically one allele is rare or absent in all the HGDP Africans,and at uniformly high frequency across Eurasia, the Americas, andusually Oceania. This pattern could be consistent either withsweeps across all the HGDP African populations, or with non-African sweeps that pre-date the colonization of the Americassome 15 KYA [6]. As outlined below, it seems that in fact most ofthese signals are, like KITLG, due to non-African sweeps.The second pattern, the ‘‘west Eurasian sweep’’ is illustrated by
a nonsynonymous SNP in the SLC24A5 gene (Figure 4C, D). Thederived allele at this SNP is also strongly associated with lighterskin color [15,63] and has clear signals of selection in the HapMapEuropeans [15,17,35], and in the Middle East and south Asia(Figure 4C). The derived allele is also at high frequency in US-sampled Indian populations [64], supporting the idea that thesampled Indian populations may be similar to the western eurasianHGDP populations at selected as well as neutral SNPs [65]. Thederived allele is near fixation in most of the HGDP Eurasianpopulations west of the Himalayas, and at low frequency elsewherein the world. More generally, alleles that strongly differentiate theFrench from both the Han and Yoruba (Figure 3D) are typicallypresent at high frequency across all of Europe, the Middle Eastand South Asia (an area defined here as ‘‘west Eurasia’’), and atlow frequency elsewhere. This pattern of sharing across the westEurasian populations is highly consistent with observations fromrandom markers showing that the populations in west Eurasiaform a single cluster in some analyses of worldwide populationstructure [40]. Allele frequencies at high- FST SNPs in two centralAsian populations, the Uygur and Hazara, tend to be intermediatebetween west Eurasia and east Asia, consistent with observationsthat these populations have recent mixed ancestry between westEurasia and east Asia [38,40,66].Finally, the ‘‘east Asian sweep’’ pattern is defined by SNPs that
differentiate the Han from French and Yoruba (Figure 3E, F). Oneexample is provided by a nonsynonymous SNP in the MC1R gene[67], for which the derived allele is at high frequency in the eastAsian and American populations, and virtually absent elsewhere(Figure 4E, F). MC1R plays an important role in skin and haircoloration, although the functional impact of this variant inMC1R–if any–is unknown [68]. A nonsynonymous SNP in theEDAR gene that affects hair morphology shows a very similargeographic pattern [35]. It is interesting that although westEurasians and east Asians have both evolved towards lighter skinpigmentation, they have done so via largely independent sets ofgenes [18]. This suggests that favored mutations have not spreadfreely between the two regions.It should be noted that rare examples of strong frequency clines
within geographic regions do exist, in contrast to the sharp steps
The Role of Geography in Human Adaptation
PLoS Genetics | www.plosgenetics.org 5 June 2009 | Volume 5 | Issue 6 | e1000500

seen in Figure 3. For example, SNPs in the lactase [22,69] and Toll-like receptor 6 [62] gene regions are among the most differentiatedSNPs between the French and Palestinian populations (Supple-mentary Figure 10 in Text S1), and are strongly clinal acrossEurope. However, these clinal alleles do not appear in Figure 3because the FST values for these SNPs between the Yoruba,French and Han are less extreme than for the SNPs in Figure 3.We suggest that these alleles may represent relatively recentselection events that have not yet generated extremely largefrequency differences between continental groups or had time todisperse more evenly across a broad geographic region.
In summary, we find that the geographic distributions of SNPswith extreme FST values are highly regular, and agree withpopulation clusters identified using randomly chosen markers.While selected alleles that spread rapidly between geographiclocations would not be detectable by FST [70], such shared sweepswould be visible from haplotype based signals of selection. Patternsof sharing of haplotype-based signals of selection in the HGDPbased on the ‘‘integrated haplotype score’’ (iHS) [16], whilesomewhat more noisy, support the observation that there isrelatively little sharing of partial sweep signals between east Asia,west Eurasia and Africa, but many shared signals within west
Figure 3. Global allele frequency distributions for SNPs with extreme FST between certain population pairs. Each row plots frequencydistributions for 50 of the most extreme SNPs genome-wide in the following pairs of comparisons: (A, B): SNPs for which Yoruba are highlydifferentiated from both Han and French; (C, D): French are differentiated from Yoruba and Han; (E, F): Han are differentiated from Yoruba and French.Left column: pie charts of the mean allele frequencies of the 50 highly differentiated SNPs across the HGDP populations; blue and red denote themajor and minor alleles in Yoruba, respectively. Right column: The same data are plotted in an expanded format: populations with $10 sampledindividuals are listed along the x-axis, roughly ordered by geography [40]; vertical grey lines divide the populations based on broad geographicregion and dashed grey lines identify populations known to be admixed between broad geographic regions. The y-axis plots allele frequencies ineach population; alleles are polarized according to the minor allele in Yoruba. Individual SNP frequencies in each population are shown as grey dots.The mean and median frequencies are shown as gray and black lines, respectively; the peach colored region shows the frequency interval containingthe central 94% of the plotted SNP frequencies in each population. SNPs were selected so that each plot includes at most one SNP from clusters ofhigh- FST SNPs (Methods).doi:10.1371/journal.pgen.1000500.g003
The Role of Geography in Human Adaptation
PLoS Genetics | www.plosgenetics.org 6 June 2009 | Volume 5 | Issue 6 | e1000500

Eurasia (Supplementary Figure 15 in Text S1; [21]). Thus, theoverall distribution of selected alleles is strongly determined by thehistorical relationships among populations, and suggests again that
very local selection pressures (e.g., divergent selection pressureswithin continental regions) have not given rise to very high- FSTSNPs.
Figure 4. Global allele frequencies and haplotype patterns at three genes with signals of positive selection. The left-hand columnshows pie charts of allele frequencies (blue ancestral, red derived) across the HGDP populations for: (A) a SNP upstream of KITLG (rs1881227); and fornonsynonymous SNPs in (B) SLC24A5 (rs1426654; data from [18]), and (C) MC1R (rs885479). The right-hand column shows a representation ofhaplotype patterns for 500 kb around each gene, in each case centered on the SNP displayed in the pie charts. Each box represents a singlepopulation, and observed haplotypes are plotted as thin horizontal lines, using the same haplotype coloring for all populations (see Methods and[59]). In all three cases the derived allele plotted in the pie charts is found mainly on the red haplotype.doi:10.1371/journal.pgen.1000500.g004
The Role of Geography in Human Adaptation
PLoS Genetics | www.plosgenetics.org 7 June 2009 | Volume 5 | Issue 6 | e1000500
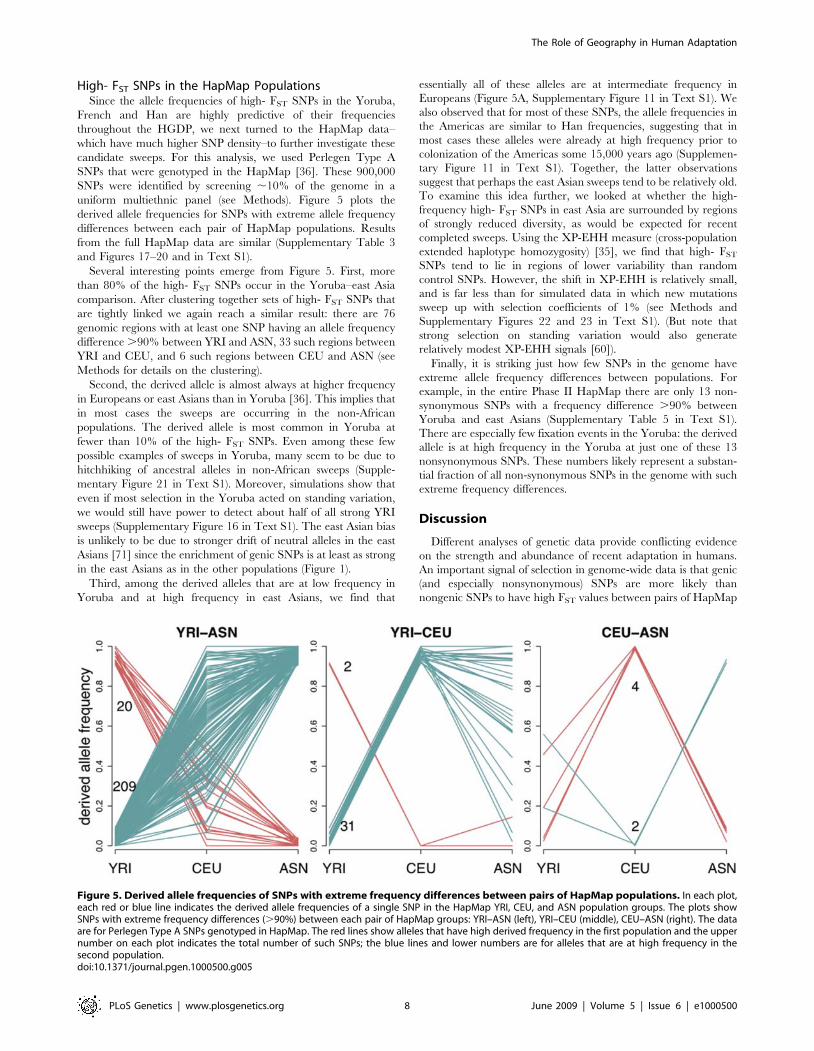
High- FST SNPs in the HapMap PopulationsSince the allele frequencies of high- FST SNPs in the Yoruba,
French and Han are highly predictive of their frequenciesthroughout the HGDP, we next turned to the HapMap data–which have much higher SNP density–to further investigate thesecandidate sweeps. For this analysis, we used Perlegen Type ASNPs that were genotyped in the HapMap [36]. These 900,000SNPs were identified by screening ,10% of the genome in auniform multiethnic panel (see Methods). Figure 5 plots thederived allele frequencies for SNPs with extreme allele frequencydifferences between each pair of HapMap populations. Resultsfrom the full HapMap data are similar (Supplementary Table 3and Figures 17–20 and in Text S1).Several interesting points emerge from Figure 5. First, more
than 80% of the high- FST SNPs occur in the Yoruba–east Asiacomparison. After clustering together sets of high- FST SNPs thatare tightly linked we again reach a similar result: there are 76genomic regions with at least one SNP having an allele frequencydifference.90% between YRI and ASN, 33 such regions betweenYRI and CEU, and 6 such regions between CEU and ASN (seeMethods for details on the clustering).Second, the derived allele is almost always at higher frequency
in Europeans or east Asians than in Yoruba [36]. This implies thatin most cases the sweeps are occurring in the non-Africanpopulations. The derived allele is most common in Yoruba atfewer than 10% of the high- FST SNPs. Even among these fewpossible examples of sweeps in Yoruba, many seem to be due tohitchhiking of ancestral alleles in non-African sweeps (Supple-mentary Figure 21 in Text S1). Moreover, simulations show thateven if most selection in the Yoruba acted on standing variation,we would still have power to detect about half of all strong YRIsweeps (Supplementary Figure 16 in Text S1). The east Asian biasis unlikely to be due to stronger drift of neutral alleles in the eastAsians [71] since the enrichment of genic SNPs is at least as strongin the east Asians as in the other populations (Figure 1).Third, among the derived alleles that are at low frequency in
Yoruba and at high frequency in east Asians, we find that
essentially all of these alleles are at intermediate frequency inEuropeans (Figure 5A, Supplementary Figure 11 in Text S1). Wealso observed that for most of these SNPs, the allele frequencies inthe Americas are similar to Han frequencies, suggesting that inmost cases these alleles were already at high frequency prior tocolonization of the Americas some 15,000 years ago (Supplemen-tary Figure 11 in Text S1). Together, the latter observationssuggest that perhaps the east Asian sweeps tend to be relatively old.To examine this idea further, we looked at whether the high-frequency high- FST SNPs in east Asia are surrounded by regionsof strongly reduced diversity, as would be expected for recentcompleted sweeps. Using the XP-EHH measure (cross-populationextended haplotype homozygosity) [35], we find that high- FSTSNPs tend to lie in regions of lower variability than randomcontrol SNPs. However, the shift in XP-EHH is relatively small,and is far less than for simulated data in which new mutationssweep up with selection coefficients of 1% (see Methods andSupplementary Figures 22 and 23 in Text S1). (But note thatstrong selection on standing variation would also generaterelatively modest XP-EHH signals [60]).Finally, it is striking just how few SNPs in the genome have
extreme allele frequency differences between populations. Forexample, in the entire Phase II HapMap there are only 13 non-synonymous SNPs with a frequency difference .90% betweenYoruba and east Asians (Supplementary Table 5 in Text S1).There are especially few fixation events in the Yoruba: the derivedallele is at high frequency in the Yoruba at just one of these 13nonsynonymous SNPs. These numbers likely represent a substan-tial fraction of all non-synonymous SNPs in the genome with suchextreme frequency differences.
Discussion
Different analyses of genetic data provide conflicting evidenceon the strength and abundance of recent adaptation in humans.An important signal of selection in genome-wide data is that genic(and especially nonsynonymous) SNPs are more likely thannongenic SNPs to have high FST values between pairs of HapMap
Figure 5. Derived allele frequencies of SNPs with extreme frequency differences between pairs of HapMap populations. In each plot,each red or blue line indicates the derived allele frequencies of a single SNP in the HapMap YRI, CEU, and ASN population groups. The plots showSNPs with extreme frequency differences (.90%) between each pair of HapMap groups: YRI–ASN (left), YRI–CEU (middle), CEU–ASN (right). The dataare for Perlegen Type A SNPs genotyped in HapMap. The red lines show alleles that have high derived frequency in the first population and the uppernumber on each plot indicates the total number of such SNPs; the blue lines and lower numbers are for alleles that are at high frequency in thesecond population.doi:10.1371/journal.pgen.1000500.g005
The Role of Geography in Human Adaptation
PLoS Genetics | www.plosgenetics.org 8 June 2009 | Volume 5 | Issue 6 | e1000500
populations ([31,36], Figure 1). This supports the role of positiveselection in generating a substantial fraction of the very high- FSTsignals. Further support for the action of selection comes from therecent work of [37], and comparisons of genome-wide selectionscans with neutral simulations [16,17,28,35]. But in other respects,the data seem to argue that neutral processes–especiallypopulation history, migration, and drift–exert powerful influencesover the fate and geographic distribution of selected alleles.We propose below that even if positive selection is common in
the genome, strong selection that drives new mutations rapidly tofixation appears to be rare. Our results also argue against a strongform of adaptation in local populations by very large allelefrequency shifts at individual loci. However, our data do notpreclude a weaker level of adaptive tuning: i.e., modest frequencychanges may often occur in response to local conditions[23,24,52]. Indeed, it is still possible that small frequency shiftsat multiple loci could allow populations to effectively adapt to localconditions even in the absence of large frequency changes atindividual loci.
Geographic Patterns of Selected VariantsRecent studies of humans and other species have shown that
populations may adapt to local selection pressures by largefrequency changes at relatively few loci [20,22,49]. When selectionis antagonistic–i.e., different alleles are favored in differentenvironments, as seen for skin pigmentation–then strong selectionshould generate large allele frequency differences betweenpopulations. However, our data show that the geographicdistributions of even the highest- FST SNPs follow patterns thatare predictable from neutral variation. Across the entire HGDPdata set there are no examples of SNPs with very extreme allelefrequency differences between closely related populations, and thedistribution of the largest values of allele frequency differentiationbetween population pairs is accurately predicted by mean FST(Figure 2). Similarly, at a global scale, the geographic distributionsof alleles with high FST between Yoruba, French and Han, orbetween Mandenka, Balochi and Yakut, fall into predictablepatterns based just on their frequencies in those three populations.Why is this? First, it is likely that environmental pressures often
vary smoothly with geographic distance, and so closely relatedpopulations would usually experience similar pressures. Nonethe-less, there should be cases in which pairs of closely relatedpopulations do face sharply divergent selective pressures due todifferences in diet, climate, pathogens or other factors [23,24,52].Similarly, although there should be sets of populations that shareparticular selective pressures despite not being closely related, thedata do not provide obvious examples of this. For example, recallthat within Eurasia, the geographic distribution of the skinpigmentation locus SLC24A5 agrees with population structureestimated from neutral markers, rather than with latitude orclimate (Figure 3B).Our results therefore suggest that local adaptation is tightly
constrained by the ancestral relationships and migration ratesamong populations. It seems likely that selection in humans isgenerally not divergent enough to generate large frequencydifferences at individual loci between population pairs that areeither recently separated, or regularly exchange migrants [53,54].Furthermore, populations may be too mobile, or their identitiestoo fluid, to experience very localized pressures consistently overthe several thousand years that may be required for large allelefrequency changes.However in contrast, it seems that selected alleles may not
spread effectively between broad geographic regions (see Figure 3,Supplementary Figure 15 in Text S1 and [21]). Perhaps this is
because populations usually adapt to similar selection pressures byparallel mutation [18,23,25] rather than by the spread of migrantsbetween regions [72,73].In summary, we propose that the strongest determinants of the
geographic distribution of favored variants may be the times atwhich they first spread to intermediate frequencies and thesubsequent history of population movements and range expan-sions, population splitting and exchange of migrants. We suggestthat variants that are broadly distributed across the non-Africanpopulations (such as the KITLG mutation) typically reachedintermediate frequencies shortly after the out-of-Africa migration,and subsequently spread around the globe as populationsexpanded. At the other extreme, we suggest that local, stronglyclinal patterns (as seen in Europe at lactase and Toll-like receptor 6[62]) may usually indicate that these alleles have spread tointermediate frequency comparatively recently. These hypotheseswill need to be tested by future studies.
SNPs with High- FST between Continental GroupsWe next turn to our results on SNPs that have high FST between
continental groups (Figures 5 and 6). Most notably, we observedthat the total number of nearly fixed differences is surprisingly low,especially at nonsynonymous sites; that there is a strong fixationbias towards non-Africans, and east Asians in particular; and thathigh-frequency, high- FST SNPs in east Asians generally appear tobe old. However, the enrichment of genic SNPs among thoseSNPs with the highest FST argues against a mostly-neutral model.A key issue for interpreting these data is the long-term rate of
gene flow among continental populations. Recent populationgenetic studies have disagreed on whether there has beenmeasurable gene flow between African and non-African popula-tions [71,74]. In principle, high rates of gene flow could preventfavored alleles from achieving high FST , and indeed, asymmetricgene flow of beneficial alleles from Africa towards east Asia couldhelp generate the bias that we saw towards high- FST SNPs in eastAsia (Figure 5). However, some aspects of the data suggest thatselected alleles have generally not been able to spread freelybetween continental groups, and especially between Africa andeast Asia (Figure 3, Supplementary Figure 15 in Text S1 and [21]).This does not rule out the possibility that selected alleles may beintroduced at low frequencies by migration between broadgeographic regions. A potential example of this is the light-skinallele at SLC24A5, which is at very low frequency in sub-SaharanAfrica and east Asia (Figure 4B). However, the fact that most of theHGDP SNPs in Figure 3 are tags rather than the actual selectedalleles prevents us from knowing how common it is for selectedalleles to spread to low frequencies in other continents. Moreover,even if migration levels have been nontrivial, both the Asian XP-EHH results (Figure 6) and the similarity between Eurasians andall the American populations (Figures 3A, 3B) argue that therehave been very few rapid, recent fixations in Eurasia.We interpret these results to imply that it is rare for strong
selection to drive new mutations rapidly to near fixation. Thegenomic regions around high- FST SNPs in east Asians show onlya modest increase in haplotype homozygosity compared torandom SNPs (Figure 6). Moreover, the overall dearth of high-FST SNPs shows that strong selection has rarely acted to createnearly fixed differences between populations. The Yoruba haveespecially low rates of completed sweeps: for example, theHapMap data include just one nonsynonymous SNP for whichthe derived allele is at high frequency in Yoruba and has afrequency difference from east Asians that exceeds 90%. Figure 7shows that the separation times between populations would haveallowed ample time for strongly selected variants to fix within
The Role of Geography in Human Adaptation
PLoS Genetics | www.plosgenetics.org 9 June 2009 | Volume 5 | Issue 6 | e1000500

populations. For example, new variants with a 1% advantagecould have fixed since the European-east Asian split, and variantswith a 0.5% advantage could have fixed since the split of Africansand non-Africans.Taken together, these results suggest that it is rare for variants to
experience selection that is both strong enough and sustainedconsistently over the 10–50 KY required to drive a new mutationto fixation. Additionally, we suggest that some or all of thefollowing factors may help to explain the data: non-Africanpopulations may have experienced more novel selection pressuresthan Africans; bottlenecks inflated the number of weakly selectedalleles that have reached high frequency in non-Africans; and mostselected traits are multigenic, and that this leads to a systematic
weakening of selection on individual variants as these variantsincrease in frequency. We now discuss each of these factors inturn.
Humans Experienced Novel Selection Pressures as TheyLeft AfricaWe observed more high-frequency high- FST SNPs in the
HapMap Europeans and east Asians than in the Yoruba,consistent with a recent genome-wide scan for full sweeps thatfound few compelling signals in the Yoruba [35]. A plausibleexplanation is that humans experienced many novel selectivepressures as they spread out of Africa into new habitats and cooler
Figure 6. The distribution of XP-EHH, a measure of haplotype homozygosity, at high- FST SNPs in east Asians. The solid line shows thedistribution of XP-EHH [35] in the ASN population at SNPs with a frequency difference .90% between the ASN and YRI samples. For comparison, weplot the XP-EHH distribution both for SNPs randomly chosen from the HapMap and for simulated SNPs with a selective advantage of 1%. Theseanalyses used the full HapMap data, but choosing only one high- FST SNP in genomic regions where there are clusters of high- FST SNPs (seeMethods). Simulations applied the cosi demographic model with minor modifications [7, Methods]. SNPs simulated with selection were included ifthere was a frequency difference.90% between ASN and YRI and where the derived allele is at high frequency in ASN. Density curves were obtainedusing the default settings of the density function in R [95].doi:10.1371/journal.pgen.1000500.g006
Figure 7. Average allele frequency trajectories of selected alleles, as a function of the strength of selection. The lines plot the meantrajectories of codominant alleles, starting from frequency 1=2N at time 0, conditional on the alleles not being lost within 4000 generations.Simulations were performed under an effective population size of 24,000 chosen to match the effective population size of the ‘Yoruba’ in cosi [7]. Toprovide some context, the bars at the top indicate the divergence times of the HapMap Europeans and Asians, and HapMap Africans and non-Africans according to the cosi model [7], though it should be noted that there is considerable uncertainty in the true split times. The numbers inparentheses indicate times in years, assuming 20 years per generation.doi:10.1371/journal.pgen.1000500.g007
The Role of Geography in Human Adaptation
PLoS Genetics | www.plosgenetics.org 10 June 2009 | Volume 5 | Issue 6 | e1000500

climates [75,76]. Hence, there may simply have been moresustained selective pressures on non-Africans for novel phenotypes.The selective sweeps at skin pigmentation loci are likely examplesof this.While novel selection pressures outside Africa may be an
important factor, this is likely not the entire story. In particular,this does not easily explain the excess of high-frequency high- FSTalleles in east Asians compared to Europeans. (Greater drift ofneutral alleles in east Asia is also unlikely to explain this patternsince the enrichment of genic SNPs among high- FST SNPs issimilar in both populations (Figure 1A,B)). It is not obvious whythere would be more sustained strong selection in east Asia than inEurope, and besides, our results suggest that most of these alleleswere already at intermediate frequency prior to the European-eastAsian divergence. A higher rate of gene flow of selected allelesbetween Europe and Africa than East Asia and Africa couldpotentially generate this result, although we currently have littleevidence for widespread migration of selected alleles between theAfrican and non-African populations (Supplementary Figure 15 inText S1 and [21]).It is also worth noting that this explanation does not imply an
absence of positive selection in the Yoruba. Indeed, two studies ofpartial sweeps have actually reported more signals in YRI [16,47].African populations have presumably also experienced a variety ofnew selection pressures during the same time-period, due to theappearance of new pathogens, changes in diet, etc. While thesepressures may have been less numerous or sustained than in non-Africans, there may also be reasons why we might have lowerpower to detect them. Given that African populations harbor moregenetic variation than non-Africans, it is possible that there havebeen more sweeps on standing variation, which we are more likelyto miss. Similarly, the response to selection pressures within Africamight also have been more polygenic (see below), resulting insmaller changes in allele frequencies at larger numbers of loci.
The Interaction between Drift and Weak SelectionAnother important part of the explanation may be the impact of
genetic drift on weakly selected variants. If strong selection is rare,then perhaps adaptation is more often due to selection on alleleswith smaller fitness advantages. For selection coefficients of about0.3% or less, the average time to fixation of a new favored allele isconsiderably longer than the ,70,000 years since the split of theAfrican and non-African HapMap populations (Figure 7). There-fore, such mutations would usually not generate extremefrequency differences between modern populations. However,since the frequency trajectory taken by a favored allele as it goes tofixation is stochastic–due to genetic drift–there will be some allelesthat increase in frequency faster than expected. Given that themagnitude of drift since the HapMap populations diverged hasbeen greatest in the east Asians, and least in the Yoruba, thismodel predicts a larger fraction of high- FST high-frequencyderived alleles in the east Asians and Europeans than in theYoruba (Figure 8 and Supplementary Figure 24 in Text S1). Thisgreater fixation rate comes at the expense of these populations alsohaving lost many favored alleles during bottlenecks.While our simulations do show an east Asian fixation bias, the
magnitude of the bias is smaller in the simulations than in the realdata (Supplementary Figure 24 in Text S1). Hence it is possiblethat the effect of increased drift combines with geographicdifferences in selection pressures (e.g., between African and non-African environments) to generate the observed bias. Additionally,inaccuracies in the assumed demographic model might lead us tounderestimate the importance of drift in east Asians. For example,it has been proposed that drift is especially active at the front of
range expansions [56,77–79], which might model human historybetter than the bottleneck model used here.
Fluctuating Environments and Polygenic AdaptationAdditionally, properties of selection pressures themselves may
contribute to the observed low rate of rapid fixation events (andsmall number of high- FST signals). First, it is likely that selectionpressures fluctuate through time [80], and also that humancultural change modifies selection pressures through time. Thus,mutations may be driven to intermediate frequency by strongselection, but subsequently drift to loss or fixation when theselective pressure weakens.Second, the genetic architecture of selected phenotypes has
fundamental implications for the action of selection. While thegenetic basis of some selected phenotypes may be monogenic (e.g.lactase within Europe), it is likely that most selected phenotypes areinfluenced by mutations at multiple genes (as seen for skinpigmentation, for example). If favored mutations increase infrequency at several genes simultaneously, then this can shift thephenotype of typical individuals of a quantitative trait towards anadaptive optimum, thus reducing the overall strength of selectionon each favored mutation [81,82]. This is a form of epistasis onfitness. Consequently, even a strongly selected phenotype may notlead to rapid fixation of favored mutations. Instead, favoredmutations may increase in frequency rapidly at first, and then startto drift as the strength of selection becomes weaker.Similarly, the ‘‘soft sweep’’ model in which multiple equivalent
mutations sweep up simultaneously at a single locus also does notlead to full sweeps. The population adapts to a new selectionpressure, but none of the favored mutations sweeps up to very highfrequency [83].
ConclusionsWe have argued here that strong, sustained selection that drives
alleles from low frequency to near fixation has been relatively rareduring the past ,70 KY of human evolution. Is this conclusioncompatible with recent work on haplotype-based signals reportingan abundance of partial sweeps with selection coefficients of $1%[16,29,35,47]? One possible explanation for the apparentdiscrepancy is that there might be many more partial sweepsthan completed sweeps. This could occur if selection pressurestend to be highly variable so that favored alleles often rise tointermediate frequency and then start to drift as a result offluctuating selection pressures or polygenic adaptation.Alternatively, it is possible that recent studies have substantially
overestimated the number and strength of partial sweeps. Perhapsthe most important current challenge in selection studies is toobtain better estimates of the fraction of true positive selectionsignals in different types of analyses. This is especially pressingsince we have shown that even extreme signals of the data havepatterns that are predictable from neutral loci.Moreover, one important unknown is the extent and strength of
background selection. If background selection is concentrated inand around genes, thereby increasing the rate of drift in genicregions, it could well contribute to the observed enrichment ofhigh- FST SNPs in genic regions [57, Supplementary Figure 4 inText S1]. The impact of background selection for plausiblebiological parameters requires further investigation; see [37] fordiscussion of selected sweeps and background selection. Ifbackground selection is an important factor, then the role ofpositive selection in generating nearly fixed differences may be yetsmaller than we have estimated here.To some extent, our understanding of these issues has been
hampered by the limitations and caveats of analyzing SNP data.
The Role of Geography in Human Adaptation
PLoS Genetics | www.plosgenetics.org 11 June 2009 | Volume 5 | Issue 6 | e1000500

Hopefully the next generation of genome sequence data will allowmajor progress on these issues. Additionally, the increasingnumber of genotype-phenotype associations offer the possibilityof linking more selection signals to phenotypes; this maystrengthen the evidence that individual signals are real and giveus deeper insight into the overall impact of selection.Finally, since high- FST SNPs are rare in the human genome,
our study raises the question of whether human populations caneffectively adapt to new environments or new selective pressuresover time-scales of, say, ten thousand years or so. Our results seemto suggest that rapid adaptation generally does not occur by(nearly) complete sweeps at single loci. If human populations canadapt quickly to new environments, then we propose that thismight instead occur by partial sweeps simultaneously at many loci.
Materials and Methods
HGDP DataThe HGDP consists of 1048 individuals, some of whom were
previously found to be related [84]. For the analysis in this paperwe used the set of 938 ‘‘unrelated’’ individuals genotypedpreviously on Illumina’s ‘‘HumanHap650Y’’ platform [38]. The
SNPs genotyped by this platform were selected to provide effectivegenome-wide SNP tagging in all of the HapMap populations [85].Data cleaning and manipulation of the HGDP data was
performed in PLINK [86]. We excluded 74 SNPs that weremonomorphic across the entire HGDP panel, and 177 SNPs thatwere missing more than 5% of genotypes. To test for violations ofHardy-Weinberg Equilibrium (HWE) we constructed three largegroups of individuals from three sets of populations (East Asia,Europe, Bantu Africa) that have relatively little populationstructure, and performed a test for HWE for each SNP withineach large group [86,87]. 1808 SNPs were removed for failing theHWE test at pv0:05 cutoff in at least two of the three groups (andhave minor allele count greater than five in each group failing).We excluded 2055 SNPs in total. We note that none of the HWE-violating SNPs excluded showed pairwise population frequencydifferences extreme enough to contribute to Figure 2 or 3. Weanalyzed a total of 640,698 autosomal SNPs.
Perlegen DatasetThroughout the paper we make use of the Type A SNPs
reported in Hinds et al. [46]. While these SNPs represent just a
Figure 8. Population bottlenecks can simultaneously increase both the rate of loss and the rate of fixation of favored alleles.Trajectories of favored variants were simulated according to demographic models for the (A) Yoruba, and (B) East Asian populations [7]. In eachsimulation the selected variant was introduced 4000 generations before the present (,80 KYA), i.e., prior to the out-of-Africa event. The plots showheat maps of the distributions of frequencies at each time, conditional on the allele not being lost by the present day (time= 0). The timing ofbottleneck events in the model are indicated by vertical grey bars in the ASN population. Redder shades indicate a higher density of selectedmutations in a particular frequency bin. The black lines indicate the mean frequencies and the grey lines bracket the central 95% of the frequencydistributions. The histograms on the right show the frequency spectrum of favored mutations in the present day, for each population, excludingmutations at frequency 0. The area of each histogram is proportional to the fraction of selected alleles that have frequency .0 in the present. Noticefrom the histograms that a much larger fraction of favored alleles survive to the present under the YRI demography, even though the fraction ofalleles that are near fixation is much smaller in the YRI.doi:10.1371/journal.pgen.1000500.g008
The Role of Geography in Human Adaptation
PLoS Genetics | www.plosgenetics.org 12 June 2009 | Volume 5 | Issue 6 | e1000500
subset of the SNPs in HapMap Phase II, they offer two importantadvantages:
N The SNPs were discovered by resequencing an ethnicallydiverse panel of individuals from the NIH PolymorphismDiscovery Panel [88], rather than single populations.
N The SNP discovery process is homogeneous over the regionsresequenced. Thus the depth of coverage does not differsubstantially between genomic regions covered.
The ascertainment was based on 20–50 haploid anonymousgenomes isolated from the NIH Polymorphism DiscoveryResource [88]. That resource is 27% European-, 27% eastAsian-, 27% African-, 13% Mexican- and 13% native American[88]. The median coverage depth was 14 chromosomes per baseresequenced [46]. The depth of resequencing at discovered SNPswas essentially the same for genic and non-genic SNPs. Themedian number of chromosomes assayed was 17 for both genicand non-genic SNPs; the mean number was 15.84 for genic and16.17 for non-genic SNPs (personal communication, D. Hinds).This confirms that the ascertainment is indeed relatively uniformacross genic and non-genic regions, suggesting that while it is anincomplete representation of all SNPs, the discovery process forType A SNPs does not differ substantially between genic and non-genic regions due to ascertainment.Hinds et al. [46] reported that they screened 964 MB to identify
1.62 M SNPs; they designed successful genotyping assays for1,263,750 Type A SNPs. 896,758 of these ‘‘Type A’’ SNPs weregenotyped in all three of the HapMap samples and haveunambiguous dbSNP entries. There are a number of reasonswhy certain Type A SNPs were not included in the Phase 2HapMap: the bulk of the excluded SNPs were SNPs in which itwas difficult to design a genotyping assay; other criteria forexclusion included a minor allele frequency MAFv0:05 in aprevious study or that SNP which is a perfect proxy (r2~1) hadalready been typed in the HapMap [36]. None of these criteriasuggest a bias in favour of preferentially including high FST SNPsin genes. Further none of the criteria should have reduced ourability to detect high FST SNPs, or bias detection towardsparticular HapMap populations. The MAF cutoff should nothave excluded high FST Perlegen type A SNPs as they would havea global MAF well above 0.05 in [46]. While not typing perfectproxies could have excluded Perlegen SNPs from the Hapmap, aperfect proxy would still be in HapMap.The approximate expected number of SNPs from sequencing L
base pairs in 14 chromosomes would be hL|P14
i~11i , where h is
the population scaled mutation rate per base pair (,0.0008 inhumans). This suggests that the ,900,000 Perlegen Type A SNPstyped in HapMap represent a screen of around 345 Mb, or,10%of the genome (taking the genome length = 3300 Mb). Weanalyzed frequencies in the HapMap data, rather than in thePerlegen data, since the HapMap sample sizes are larger andPerlegen used African-Americans, who have substantial Europeanancestry. We used allele frequencies calculated from the HapMapphased data, with the small amount of missing data filled in byimputation. To confirm that the anonymous chromosomes inHinds et al. [46] resequencing panel contained representatives ofall three continental groups we examined the HapMap ‘‘type A’’dataset for alleles present in only one of the populations and found,93,000 YRI-, ,24,000 CEU-, and ,12,000 ASN-specificalleles, suggesting that all three populations had close represen-tatives in the anonymous resequencing panel, and so fixeddifferences between these populations would have been detectedby the resequencing. We excluded 24 SNPs that have high FST in
HapMap, but where the high FST appears to be due to allelelabeling problems (allele-flips) since the reported allele frequenciesin the corresponding HapMap and Perlegen samples differed by.50%.
HapMap DataThe genotyped SNPs were identified from a variety of sources
[26,36]. Phase II includes nearly all SNPs in dbSNP release 122that could be genotyped on the Perlegen platform [36].To identify all non-synonymous SNPs with high levels of
differentiation between HapMap populations, we used the March2008 ‘all’ dataset from hapmap.org, consisting of 3.9 M SNPs inASN and 3.8 M in CEU and YRI. This set contains SNPs thatmay have only been successfully typed in one or two populations.The list of non-synonymous SNPs with .90% frequencydifference was checked by hand for potential allele calling flipsusing the dbSNP database and HGDP data (when the SNP wastyped on this panel). A list of these non-synonymous SNPs is givenin Supplementary Table 5 in Text S1.The XP-EHH statistic was calculated on the HapMap
‘‘consensus’’ phased data released in July 2006 from hapmap.org,which contains all SNPs successfully genotyped in all threepopulations. After removing monomorphic SNPs, these dataconsist of 3,106,757 SNPs.
Identification of Likely Allele Flips in the HapMap DataWe checked the highly differentiated SNPs found in consensus
HapMap data for allele flips (these data are used in the main paperto identify regions for the XP-EHH analysis and in the Text S1 forXP-EHH and versions of Figure 5). We downloaded the HapMap‘‘2007-3 redundant genotype frequencies’’ data, which containsinformation about SNPs typed by multiple centers. SNPs that hadbeen typed by multiple centers were discarded if the centersdisagreed by more than 50% in the estimate of the allele frequencyin any of the three populations.
Obtaining Genic and Ancestral StatesGene annotation information was obtained from the RefSeq
database [89]. This information was primarily used for obtainingthe gene start and gene end coordinates. Where required, genomecoordinates were converted from NCBI build 36 (hg18) to build 35(hg17) using the Batch Coordinate Conversion tool available atUCSC web browser [90]. A SNP was defined as nongenic if it ismore than 2 kb from an annotated gene transcript; otherwise itwas considered genic. Ancestral states for all SNPs were estimatedusing whole genome human-chimpanzee alignments from theUCSC database [90]. Based on the physical position of the SNP inthe human genome (Build hg17), the allele at the correspondingposition in the chimp genome (Build pantro2) was obtained. If thehuman SNP position aligned to missing data in the chimpanzeegenome, or if the chimpanzee allele did not match either humanallele, then the corresponding SNP was excluded from furtheranalysis.
Calculation of FSTFST was calculated using the Weir and Cockerham estimator
[91]. This estimator is unbiased by sample size; however, extremevalues of the distribution still depend on sample size. Accordingly,we excluded low sample size populations from Figure 2.
Clustering of SNPs with Extreme Frequency DifferencesHitchhiking results in clustering of highly differentiated SNPs,
reducing the number of independent signals in the data. When we
The Role of Geography in Human Adaptation
PLoS Genetics | www.plosgenetics.org 13 June 2009 | Volume 5 | Issue 6 | e1000500

needed to ensure that independent genomic regions underlie ourresults or count the number of signals, we assigned stronglydifferentiated SNPs within 100 kb of another strongly differenti-ated SNP to the same cluster, such that different clusters do notcontain any SNPs within 100 kb of another cluster.
The Geographic Distributions of High- FST SNPsTo produce Figure 3, for each particular pair of comparisions
(e.g. Yoruba-Han Chinese, Yoruba-French) we found all SNPsthat fall in the 99.8% tail of FST for both comparisons. We thenclustered these SNPs as described in ‘Clustering of SNPs withextreme frequency differences’. For each cluster we then plottedthe HGDP allele frequencies for the ‘‘top’’ SNP for each cluster;where the top SNP was chosen by ranking SNPs in a cluster by theproduct of their empirical p-values in the two pairwise FSTcomparisons. For the HGDP Yoruba-French, Yoruba-Hancomparison (Figure 3A, B) the minimum frequency differencebetween the pairs was 80% and 86% respectively. For the Yoruba-French, French-Han comparison (Figure 3C, D) the minimumfrequency difference between the pairs was 73% and 63%respectively. For the Yoruba-Han, French-Han comparison(Figure 3E, F) the minimum frequency difference between thepairs was 79% and 63% respectively. In Supplementary Figures10–14 in Text S1 we give versions of the plot for smaller numbersof SNPs and single pairwise comparisons. The pie chart maps weregenerated using the program of Wessel et al. [92].
Haplotype VisualizationThe HGDP data were phased using fastPHASE; see Text S1 for
details. To visualize the haplotypes in each genomic region shownin Figure 4, we used an algorithm similar to that presented inConrad et al. [59]. This algorithm starts by identifying the eightmost common haplotypes spanning a genomic region. These eighthaplotypes are called the ‘template’ haplotypes. Each template isassigned a distinct color. Next, it colors each observed haplotype asa mosaic of the eight templates, requiring exact matches betweenthe observed haplotype and the template that is being copied.Roughly speaking, the coloring minimizes the number of switchesbetween templates (see Text S1 for more details). Rare alleles notfound on any template were dropped from the analysis in theversion shown in Figure 4. The populations shown in Figure 4 are,from left to right and top to bottom: Mandenka, Russian, French,Mongola, Pima, Bantu Kenya, Druze, Balochi, Han, Maya, BiakaPygmy, Palestinian, Makrani, Cambodian, and Papuan. For eachpopulation, 20 chromosomes were sampled without replacementfor plotting.
XP-EHHXP-EHH was calculated as in Sabeti et al. [35]. Briefly, XP-
EHH is defined relative to a given SNP i in two populations, Aand B. In each population, the expected haplotype homogygosity(EHH) [14] was integrated with respect to genetic distance in bothdirections from i. The log of the ratio of these integrals is theunnormalized XP-EHH. We chose the limit of the integration tobe where the EHH in the pooled population sample AB droppedbelow 0.05. The final XP-EHH was normalized with respect to thegenome as a whole by subtracting out the mean and dividing bythe standard deviation. For the analyses presented in the maintext, the genetic map used was estimated by the method presentedin Voight et al. [16] in the YRI population only; for the detectionof selection in the ASN populations, this approach gave us themost reliable results in simulations (data not shown).In Figure 6, XP-EHH is plotted for SNPs with a greater than
90% frequency difference between YRI and ASN. To ensure that
independent signals were plotted, we clustered all SNPs with.90% frequency difference between YRI and ASN (as describedin ‘Clustering of SNPs with extreme frequency differences’) andplotted the XP-EHH value for the SNP with the largest frequencydifference in a cluster (choosing at random amongst tied SNPs). Aversion of this figure including only SNPs typed by multiplecenters (to further reduce the potential for allele flips) is given inSupplementary Figure 22 in Text S1.
Simulation DetailsWe used simulations that are based, with slight modifications,
on a historical population genetic model, ‘‘cosi’’ [7], as this model isone of the few that incorporates both the Africa–non-Africa andEurope–east Asia population splits. This model provides a close fitto various aspects of the genetic data (Supplementary Table 4 andSupplementary Figure 25 in Text S1), although there is stillconsiderable uncertainty about key parameters of this model,including the population split times and the amount of subsequentgene flow–if any–among them.Simulations of haplotypes for the calculation of XP-EHH were
done using a hybrid coalescent/forward-time scheme following thecosi model of human demography [7]. In the coalescent step, theportion of the demographic history before the split of the threepopulations was simulated using cosi. After this initialization of thepopulation, the haplotypes were simulated forwards in time using aWright-Fisher model. To increase efficiency, parameters werescaled by a factor of five, following Hoggart et al. [93]. That is, allpopulation sizes and generation times were decreased by a factor offive, while all other parameters were increased by a factor of five.As these simulations were compared to the HapMap, we had to
match ascertainment and SNP density. Since the ascertainment ofSNPs in the HapMap is variable and largely irreproducible, weused rejection sampling to match the joint allele frequency of thesimulation SNPs and the real data [16]. We first estimated thejoint allele frequency distribution of the HapMap and that of thesimulations on a 12612612 grid of allele frequencies across thethree populations. We used rejection sampling to roughly matchthe simulated distribution to the HapMap distribution: for eachSNP in a simulation, it was accepted if a uniform(0,1) randomvariable u was vf x! "=Mg x! ", where f x! " is the density in thesimulations, g x! " is the density in the HapMap and M is anormalizing constant. Note that x is a vector of three allelefrequencies. In order to perfectly match the HapMap distribution,M should be the maximum of the ratio between the two densities,g and f . However, perfect matching to the HapMap distributionresulted in inefficient simulations; we found that a value of M~8produced satisfactory results while maintaining efficiency.Simulations of single sites (i.e. independent sites) were designed
to simulate a constant rate of new mutations, m per individual pergeneration, with a selection coefficient s. This constant rate perindividual assumes that evolution is mutation limited, such that therate of adaptation scales roughly linearly with the population size.To increase efficiency of our simulations, we modified the cosidemographic model [7], removing the very low levels of migrationbetween the populations and the weak pre-out-of-Africa popula-tion expansion (both of these aspects are present in the haplotypesimulations). In this model, then, there are five branches of the treeon which a new mutation can arise: the branch before the splitbetween African and non-African populations, the branch beforethe split between Europe and Asia, and the three population-specific branches. For each simulation, a mutation is chosen tohave arisen on a given branch i with probability f i! "; conditionalon this it arises uniformly at random on this branch. The allelefrequency is then simulated using a Wright-Fisher model forward
The Role of Geography in Human Adaptation
PLoS Genetics | www.plosgenetics.org 14 June 2009 | Volume 5 | Issue 6 | e1000500
in time until the present day. Alleles which are lost from thepopulations are discarded.For a branch i, the probability that a selected allele arises on this
branch, fi, is proportional to the number of selected alleles thatarise on the branch. This quantity is the time length of the branch(Ti) weighted by population size (2Ni) along that branch:
fi~2NimTiP5j~1 2NjmTj
The exception is branch 1 that represents the ancestral populationbefore the out-of-Africa split, which in our modified cosi modelrepresents the population at equilibrium. To avoid having tosimulate the process from far enough in the past to ensureequilibrium, we sampled the process directly from the equilibriumstationary distribution. The number of selected alleles weintroduced on this branch (2N1mT1), is the expectation of thenumber of derived selected alleles segregating at equilibrium,namely
2N1mT1~2N1m
!1{1= 2N! "
1= 2N! "p x! "dx, !1"
where
p x! "~ 1
x 1{x! "esxu x! "
and u x! "~ e{sf{e{s
1{e{s, with s~2Ns [94]. If the selected
mutation is chosen to have arisen on the branch before the out-of-Africa split, we draw its allele frequency, x, from the stationarydistribution p x! "=T1 (we discretize this distribution into units of1= 2N1! ").
Statistical AnalysisWe used R to perform many of the analyses and to produce
most of the figures [95].
Supporting Information
Text S1 Supplementary material.Found at: doi:10.1371/journal.pgen.1000500.s001 (2.61 MB PDF)
Acknowledgments
We thank Anna Di Rienzo, Richard Hudson, Molly Przeworski, Jeff Walland the Pritchard, Przeworski and Stephens lab groups for many helpfuldiscussions and the anonymous reviewers for comments.
Author Contributions
Analyzed the data: G. Coop, J. Pickrell, J. Novembre, S. Kudaravalli, J.Pritchard. Contributed reagents/materials/analysis tools: J. Li, D. Absher,R. Myers, L. Cavalli-Sforza, M. Feldman. Wrote the paper: G. Coop, J.Pickrell, J. Novembre, M. Feldman, J. Pritchard. Conceived and designedthe project: J. Pickrell, J. Novembre, S. Kudaravalli, J. Pritchard, G. Coop.
References
1. Sabeti P, Schaffner S, Fry B, Lohmueller J, Varilly P, et al. (2006) Positivenatural selection in the human lineage. Science 312: 1614–1620.
2. Volkman S, Sabeti P, DeCaprio D, Neafsey D, Schaffner S, et al. (2007) Agenome-wide map of diversity in Plasmodium falciparum. Nat Genet 39:113–119.
3. Begun D, Holloway A, Stevens K, Hillier L, Poh Y, et al. (2007) Populationgenomics: whole-genome analysis of polymorphism and divergence inDrosophila simulans. PLoS Biol 5: e310.
4. Clark R, Schweikert G, Toomajian C, Ossowski S, Zeller G, et al. (2007)Common sequence poly-morphisms shaping genetic diversity in Arabidopsisthaliana. Science 317: 338–342.
5. Stringer C, Andrews P (1988) Genetic and fossil evidence for the origin ofmodern humans. Science 239: 1263–1268.
6. Jobling M, Hurles M, Tyler-Smith C (2003) Human Evolutionary Genetics:Origins, Peoples and Disease. Garland Science.
7. Schaffner S, Foo C, Gabriel S, Reich D, Daly M, et al. (2005) Calibrating acoalescent simulation of human genome sequence variation. Genome Res 15:1576–1583.
8. Fagundes N, Ray N, Beaumont M, Neuenschwander S, Salzano F, et al. (2007)Statistical evaluation of alternative models of human evolution. Proc Natl AcadSci USA 104: 17614–17619.
9. Cavalli-Sforza L, Menozzi P, Piazza P (1994) The History and Geography ofHuman Genes. Princeton University Press.
10. Biswas S, Akey J (2006) Genomic insights into positive selection. Trends Genet22: 437–446.
11. Nielsen R, Hellmann I, Hubisz M, Bustamante C, Clark A (2007) Recent andongoing selection in the human genome. Nat Rev Genet 8: 857–868.
12. Hamblin M, Di Rienzo A (2000) Detection of the signature of natural selectionin humans: evidence from the Duffy blood group locus. Am J Hum Genet 66:1669–1679.
13. Tishkoff S, Varkonyi R, Cahinhinan N, Abbes S, Argyropoulos G, et al. (2001)Haplotype diversity and linkage disequilibrium at human G6PD: recent origin ofalleles that confer malarial resistance. Science 293: 455–462.
14. Sabeti P, Reich D, Higgins J, Levine H, Richter D, et al. (2002) Detecting recentpositive selection in the human genome from haplotype structure. Nature 419:832–837.
15. Lamason R, Mohideen M, Mest J, Wong A, Norton H, et al. (2005) SLC24A5, aputative cation exchanger, affects pigmentation in zebrafish and humans.Science 310: 1782–1786.
16. Voight B, Kudaravalli S, Wen X, Pritchard J (2006) A map of recent positiveselection in the human genome. PLoS Biol 4: e72.
17. Williamson S, Hubisz M, Clark A, Payseur B, Bustamante C, et al. (2007)Localizing recent adaptive evolution in the human genome. PLoS Genet 3: e90.
18. Norton H, Kittles R, Parra E, McKeigue P, Mao X, et al. (2007) Geneticevidence for the convergent evolution of light skin in Europeans and East Asians.Mol Biol Evol 24: 710–722.
19. Sulem P, Gudbjartsson D, Stacey S, Helgason A, Rafnar T, et al. (2007) Geneticdeterminants of hair, eye and skin pigmentation in Europeans. Nat Genet 39:1443–1452.
20. Miller C, Beleza S, Pollen A, Schluter D, Kittles R, et al. (2007) cis-Regulatorychanges in Kit ligand expression and parallel evolution of pigmentation insticklebacks and humans. Cell 131: 1179–1189.
21. Pickrell J, Coop G, Novembre J, Kudaravalli S, Li J, et al. (2009) Signals ofrecent positive selection in a worldwide sample of human populations. GenomeResearch.
22. Bersaglieri T, Sabeti P, Patterson N, Vanderploeg T, Schaffner S, et al. (2004)Genetic signatures of strong recent positive selection at the lactase gene.Am J Hum Genet 74: 1111–1120.
23. Tishkoff S, Reed F, Ranciaro A, Voight B, Babbitt C, et al. (2007) Convergentadaptation of human lactase persistence in Africa and Europe. Nat Genet 39:31–40.
24. Perry G, Dominy N, Claw K, Lee A, Fiegler H, et al. (2007) Diet and theevolution of human amylase gene copy number variation. Nat Genet 39:1256–1260.
25. Enattah N, Jensen T, Nielsen M, Lewinski R, Kuokkanen M, et al. (2008)Independent introduction of two lactase-persistence alleles into humanpopulations reflects different history of adaptation to milk culture. Am J HumGenet 82: 57–72.
26. International HapMap Consortium (2005) A haplotype map of the humangenome. Nature 437: 1299–1320.
27. Carlson C, Thomas D, Eberle M, Swanson J, Livingston R, et al. (2005)Genomic regions exhibiting positive selection identified from dense genotypedata. Genome Res 15: 1553–1565.
28. Kelley J, Madeoy J, Calhoun J, Swanson W, Akey J (2006) Genomic signaturesof positive selection in humans and the limits of outlier approaches. Genome Res16: 980–989.
29. Wang E, Kodama G, Baldi P, Moyzis R (2006) Global landscape of recentinferred Darwinian selection for Homo sapiens. Proc Natl Acad Sci USA 103:135–140.
The Role of Geography in Human Adaptation
PLoS Genetics | www.plosgenetics.org 15 June 2009 | Volume 5 | Issue 6 | e1000500
30. Tang K, Thornton K, Stoneking M (2007) A New Approach for Using GenomeScans to Detect Recent Positive Selection in the Human Genome. PLoS Biol 5:e171.
31. Barreiro L, Laval G, Quach H, Patin E, Quintana-Murci L (2008) Naturalselection has driven population differentiation in modern humans. Nat Genet40: 340–345.
32. Akey J, Eberle M, Rieder M, Carlson C, Shriver M, et al. (2004) Populationhistory and natural selection shape patterns of genetic variation in 132 genes.PLoS Biol 2: e286.
33. Bustamante C, Fledel-Alon A, Williamson S, Nielsen R, Hubisz M, et al. (2005)Natural selection on protein-coding genes in the human genome. Nature 437:1153–1157.
34. Teshima K, Coop G, Przeworski M (2006) How reliable are empirical genomicscans for selective sweeps? Genome Research 16: 702–712.
35. Sabeti P, Varilly P, Fry B, Lohmueller J, Hostetter E, et al. (2007) Genome-widedetection and characterization of positive selection in human populations.Nature 449: 913–918.
36. International HapMap Consortium (2007) A second generation humanhaplotype map of over 3.1 million SNPs. Nature 449: 851–861.
37. Cai JJ, Macpherson JM, Sella G, Petrov DA (2009) Pervasive hitchhiking atcoding and regulatory sites in humans. PLoS Genet 5: e1000336.
38. Li J, Absher D, Tang H, Southwick A, Casto A, et al. (2008) Worldwide humanrelationships inferred from genome-wide patterns of variation. Science 319:1100–1104.
39. Cann H, de Toma C, Cazes L, Legrand M, Morel V, et al. (2002) A humangenome diversity cell line panel. Science 296: 261–262.
40. Rosenberg N, Pritchard J, Weber J, Cann H, Kidd K, et al. (2002) Geneticstructure of human populations. Science 298: 2381–2385.
41. Serre D, Paabo S (2004) Evidence for gradients of human genetic diversitywithin and among continents. Genome Res 14: 1679–1685.
42. Reed F, Tishkoff S (2006) African human diversity, origins and migrations. CurrOpin Genet Dev 16: 597–605.
43. Manica A, Prugnolle F, Balloux F (2005) Geography is a better determinant ofhuman genetic differentiation than ethnicity. Hum Genet 118: 366–371.
44. Ramachandran S, Deshpande O, Roseman C, Rosenberg N, Feldman M, et al.(2005) Support from the relationship of genetic and geographic distance inhuman populations for a serial founder effect originating in Africa. Proc NatlAcad Sci USA 102: 15942–15947.
45. Rosenberg N, Mahajan S, Ramachandran S, Zhao C, Pritchard J, et al. (2005)Clines, clusters, and the effect of study design on the inference of humanpopulation structure. PLoS Genet 1: e70.
46. Hinds D, Stuve L, Nilsen G, Halperin E, Eskin E, et al. (2005) Whole-genomepatterns of common DNA variation in three human populations. Science 307:1072–1079.
47. Hawks J, Wang E, Cochran G, Harpending H, Moyzis R (2007) Recentacceleration of human adaptive evolution. Proc Natl Acad Sci USA 104:20753–20758.
48. Jain S, Bradshaw A (1966) Evolutionary divergence among adjacent plantpopulations. I. The evidence and its theoretical analysis. Heredity 21: 407–441.
49. Hoekstra H, Drumm K, Nachman M (2004) Ecological genetics of adaptivecolor polymorphism in pocket mice: geographic variation in selected and neutralgenes. Evolution 58: 1329–1341.
50. Schemske D, Bierzychudek P (2007) Spatial differentiation for flower color in thedesert annual Linanthus parryae: was Wright right? Evolution 61: 2528–2543.
51. Nagylaki T (1975) Conditions for existence of clines. Genetics 80: 595–615.52. Hancock A, Witonsky D, Gordon A, Eshel G, Pritchard J, et al. (2008)
Adaptations to climate in candidate genes for common metabolic disorders.PLoS Genet 4: e32.
53. Slatkin M (1973) Gene flow and selection in a cline. Genetics 75: 733–756.54. Lenormand T (2002) Gene flow and the limits to natural selection. Trends in
Ecology and Evolution.55. Cavalli-Sforza L (1966) Population structure and human evolution. Proc R Soc
Lond, B, Biol Sci 164: 362–379.56. Travis J, Mkemler T, Burton O, Best A, Dytham C, et al. (2007) Deleterious
mutations can surf to high densities on the wave front of an expandingpopulation. Mol Biol Evol 24: 2334–2343.
57. Charlesworth B, Nordborg M, Charlesworth D (1997) The effects of localselection, balanced polymorphism and background selection on equilibriumpatterns of genetic diversity in subdivided populations. Genet Res 70: 155–174.
58. Nordborg M, Charlesworth B, Charlesworth D (1996) The effect ofrecombination on background selection. Genet Res 67: 159–174.
59. Conrad D, Jakobsson M, Coop G, Wen X, Wall J, et al. (2006) A worldwidesurvey of haplotype variation and linkage disequilibrium in the human genome.Nat Genet 38: 1251–1260.
60. Przeworski M, Coop G, Wall J (2005) The signature of positive selection onstanding genetic variation. Evolution 59: 2312–2323.
61. Lewontin R, Krakauer J (1973) Distribution of gene frequency as a test of thetheory of the selective neutrality of polymorphisms. Genetics 74: 175–195.
62. Todd J, Walker N, Cooper J, Smyth D, Downes K, et al. (2007) Robustassociations of four new chromosome regions from genome-wide analyses of type1 diabetes. Nat Genet 39: 857–864.
63. Stokowski R, Pant P, Dadd T, Fereday A, Hinds D, et al. (2007) A genomewideassociation study of skin pigmentation in a South Asian population. Am J HumGenet 81: 1119–1132.
64. Pemberton TJ, Mehta NU, Witonsky D, Di Rienzo A, Allayee H, et al. (2008)Prevalence of common disease-associated variants in Asian Indians. BMC Genet9: 13.
65. Rosenberg NA, Mahajan S, Gonzalez-Quevedo C, Blum MG, Nino-Rosales L,et al. (2006) Low levels of genetic divergence across geographically andlinguistically diverse populations from India. PLoS Genet 2: e215.
66. Xu S, Huang W, Qian J, Jin L (2008) Analysis of genomic admixture in Uyghurand its implication in mapping strategy. Am J Hum Genet 82: 883–894.
67. Rana B, Hewett-Emmett D, Jin L, Chang B, Sambuughin N, et al. (1999) Highpolymorphism at the human melanocortin 1 receptor locus. Genetics 151:1547–1557.
68. Makova K, Norton H (2005) Worldwide polymorphism at the MC1R locus andnormal pigmentation variation in humans. Peptides 26: 1901–1908.
69. Jakobsson M, Scholz S, Scheet P, Gibbs J, VanLiere J, et al. (2008) Genotype,haplotype and copy-number variation in worldwide human populations. Nature451: 998–1003.
70. Santiago E, Caballero A (2005) Variation after a selective sweep in a subdividedpopulation. Genetics 169: 475–483.
71. Keinan A, Mullikin J, Patterson N, Reich D (2007) Measurement of the humanallele frequency spectrum demonstrates greater genetic drift in East Asians thanin Europeans. Nat Genet 39: 1251–1255.
72. Slatkin M (1976) Population Genetics and Ecology. New York: Academic Press,Inc., chapter The Rate of Spread of an Advantageous Allele in a SubdividedPopulation.
73. Morjan C, Rieseberg L (2004) How species evolve collectively: implications ofgene flow and selection for the spread of advantageous alleles. Mol Ecol 13:1341–1356.
74. Plagnol V, Wall J (2006) Possible ancestral structure in human populations.PLoS Genet 2: e105.
75. Kayser M, Brauer S, Stoneking M (2003) A genome scan to detect candidateregions influenced by local natural selection in human populations. Mol BiolEvol 20: 893–900.
76. Storz J, Payseur B, Nachman M (2004) Genome scans of DNA variability inhumans reveal evidence for selective sweeps outside of Africa. Mol Biol Evol 21:1800–1811.
77. Edmonds C, Lillie A, Cavalli-Sforza L (2004) Mutations arising in the wave frontof an expanding population. Proc Natl Acad Sci USA 101: 975–979.
78. Klopfstein S, Currat M, Excoffier L (2006) The fate of mutations surfing on thewave of a range expansion. Mol Biol Evol 23: 482–490.
79. Handley L, Manica A, Goudet J, Balloux F (2007) Going the distance: humanpopulation genetics in a clinal world. Trends Genet 23: 432–439.
80. Gillespie JH (1991) The Causes of Molecular Evolution. Oxford, UK: OxfordUniversity Press. pp xiv + 336.
81. Lande R (1983) The response to selection on major and minor mutationsaffecting a metrical trait. Heredity 50: 47–65.
82. Chevin LM, Hospital F (2008) Selective sweep at a quantitative trait locus in thepresence of background genetic variation. Genetics 180: 1645–1660.
83. Pennings P, Hermisson J (2006) Soft sweeps II–molecular population genetics ofadaptation from recurrent mutation or migration. Mol Biol Evol 23: 1076–1084.
84. Rosenberg N (2006) Standardized subsets of the HGDP-CEPH HumanGenome Diversity Cell Line Panel, accounting for atypical and duplicatedsamples and pairs of close relatives. Ann Hum Genet 70: 841–847.
85. Eberle M, Ng P, Kuhn K, Zhou L, Peiffer D, et al. (2007) Power to detect riskalleles using genome-wide tag SNP panels. PLoS Genet 3: 1827–1837.
86. Purcell S, Neale B, Todd-Brown K, Thomas L, Ferreira M, et al. (2007) PLINK:a tool set for whole-genome association and population-based linkage analyses.Am J Hum Genet 81: 559–575.
87. Wigginton J, Cutler D, Abecasis G (2005) A note on exact tests of Hardy-Weinberg equilibrium. Am J Hum Genet 76: 887–893.
88. Collins F, Brooks L, Chakravarti A (1998) A DNA polymorphism discoveryresource for research on human genetic variation. Genome Res 8: 1229–1231.
89. Pruitt K, Tatusova T, Maglott D (2007) NCBI reference sequences (RefSeq): acurated non-redundant sequence database of genomes, transcripts and proteins.Nucleic Acids Res 35: D61–65.
90. Karolchik D, Kuhn R, Baertsch R, Barber G, Clawson H, et al. (2008) TheUCSC Genome Browser Database: 2008 update. Nucleic Acids Res 36:D773–779.
91. Cockerham C, Weir B (1986) Estimation of inbreeding parameters in stratifiedpopulations. Ann Hum Genet 50: 271–281.
92. Wessel P, Smith W (1998) New, improved version of generic mapping toolsreleased. EOS Trans Amer Geophys U 79: 579.
93. Hoggart C, Chadeau-Hyam M, Clark T, Lampariello R, Whittaker J, et al.(2007) Sequence-level population simulations over large genomic regions.Genetics 177: 1725–1731.
94. Sawyer S, Hartl D (1992) Population genetics of polymorphism and divergence.Genetics 132: 1161–1176.
95. R Development Core Team (2007) R: A Language and Environment forStatistical Computing. Vienna, Austria: R Foundation for Statistical Computing,URL http://www.R-project.org. ISBN 3-900051-07-0.
The Role of Geography in Human Adaptation
PLoS Genetics | www.plosgenetics.org 16 June 2009 | Volume 5 | Issue 6 | e1000500