the role of genotypes that modify the toxicity of chemical
TRANSCRIPT

Int. J. Environ. Res. Public Health 2015, 12, 2465-2485; doi:10.3390/ijerph120302465
International Journal of
Environmental Research and Public Health
ISSN 1660-4601 www.mdpi.com/journal/ijerph
Article
The Role of Genotypes That Modify the Toxicity of Chemical Mutagens in the Risk for Myeloproliferative Neoplasms
Carol Ann Gross-Davis 1,2,*, Karyn Heavner 2, Arthur L. Frank 2, Craig Newschaffer 3,
Judith Klotz 2, Regina M. Santella 4 and Igor Burstyn 2,3
1 Environmental Protection Agency, Region 3, 1650 Arch Street, Philadelphia, PA 19103, USA 2 Department of Environmental and Occupational Health, Drexel University, Philadelphia, PA 19104,
USA; E-Mails: [email protected] (K.H.); [email protected] (A.L.F.); [email protected] (J.K.);
[email protected] (I.B.) 3 A.J. Drexel Autism Institute, Drexel University, Philadelphia, PA 19104, USA;
E-Mail: [email protected] 4 Department of Environmental Health Services, Mailman School of Public Health,
Columbia University, New York, NY 10032, USA; E-Mail: [email protected]
* Author to whom correspondence should be addressed; E-Mail: [email protected];
Tel.: +1-215-814-5738; Fax: +1-215-814-2124.
Academic Editor: Paul B. Tchounwou
Received: 5 January 2015 / Accepted: 12 February 2015 / Published: 24 February 2015
Abstract: Background: The etiology of myeloproliferative neoplasms (MPN) (polycythemia
vera; essential thrombocythemia; primary myelofibrosis) is unknown, however they are
associated with a somatic mutation—JAK2 V617F—suggesting a potential role for
environmental mutagens. Methods: We conducted a population-based case-control study in
three rural Pennsylvania counties of persons born 1921–1968 and residing in the area
between 2000–2008. Twenty seven MPN cases and 292 controls were recruited through
random digit dialing. Subjects were genotyped and odds ratios estimated for a select set of
polymorphisms in environmentally sensitive genes that might implicate specific
environmental mutagens if found to be associated with a disease. Results: The presence of
NAT2 slow acetylator genotype, and CYP1A2, GSTA1, and GSTM3 variants were
associated with an average 3–5 fold increased risk. Conclusions: Exposures, such as to
OPEN ACCESS

Int. J. Environ. Res. Public Health 2015, 12 2466
aromatic compounds, whose toxicity is modified by genotypes associated with outcome in our
analysis may play a role in the environmental etiology of MPNs.
Keywords: case-control study; candidate gene; polycythemia vera (PV); essential
thrombocythemia (ET); primary myelofibrosis (PMF); Mendelian randomization
1. Introduction
Myeloproliferative neoplasms (MPNs), including polycythemia vera (PV), essential thrombocythemia
(ET), and primary myelofibrosis (PMF), are rare cancers characterized by an overproduction of red
blood cells and platelets [1]. Mandatory reporting on MPNs in the US began in 2001. The National Cancer
Institute (NCI) estimated the incidence of PV, ET and PMF at 2.8, 1.5, and 0.4 cases per 100,000 person-
years for 2001–2004 [2]. In 2008 the World Health Organization (WHO) revised the diagnostic criterion
to include a diagnostic algorithm with genetic information (JAK2 V617F) along with clinical
information [3]. There are no known causes of MPNs although there have been a number of
speculations about an environmental etiology [4].
The presence of the acquired JAK2 V617F somatic point mutation—a single-base substitution resulting
in a change from valine to phenylalanine at position 617 in the protein on chromosome 9p [5]—is
suspected to be pathognomonic of PV. It is present in nearly all PV patients (>95%), about half of those
with ET or PMF, and less frequently in other hematologic diseases but not in any other cancers [6–8].
JAK2 is a protein that acts as an on-and-off switch regulating bone marrow activity [9]. In the presence
of the mutation, a tyrosine kinase complex in bone marrow, normally responsible for regulating blood
cell production, is activated to increase blood cell production [6]. The causes of the JAK2 V617F
mutation are unknown [7].
There is strong evidence supporting familial risk for MPNs [4,10]. The role of inherited genetics
has been suspected to influence MPN phenotype and susceptibility, including potential germ-line
mutations yet to be identified [11]. Although functional genes that may modify the biological dose of a
chemical mutagen have been studied for a wide range of cancers, no studies have investigated
associations of these genotypes with MPNs [12]. Because of the role of the somatic JAK2 V617F
mutation in the etiology of MPNs, genes that modify susceptibility to mutagenic chemicals are of
particular interest.
If we assume that there are genes that are not sufficient independent causes of MPNs but act
exclusively to increase susceptibility to prevalent environmental mutagens, we can evaluate the main effect
associations of these genes with MPNs to efficiently explore the potential role of the exposures whose
effect they modify (i.e., under these assumptions genotype associations infer existence of the gene-
environment interactions) [13–15]. This approach is related to the Mendelian randomization that
allows one to infer causation without directly measuring the exposure of interest by making the
defensible assumption, in the given case, that genes are allocated independent of exposure and
confounders [13]. The main objective of such analyses is not so much to quantify the extent of the
gene-environment interaction but to use evidence of such interactions (assessed via genotype) to
implicate specific exposures in the etiology of a disease.

Int. J. Environ. Res. Public Health 2015, 12 2467
The aim of the current analysis is thus to use this approach to identify potential classes of
environmental exposures implicated in MPN etiology.
2. Methods
The study protocol was approved by the Drexel University and Geisinger Health Systems
Institutional Review Boards. Participants received a $25 gift card for completing the phone survey phase
and an additional $25 gift card if they gave a blood sample which was used in genotyping.
2.1. Selection of Cases and Controls
A case-control study was conducted in a tri-county area in Northeast Pennsylvania (Carbon,
Luzerne, and Schuylkill counties) [16]. Cases and controls were eligible if they were born between
1921 and 1968 (i.e., 42–89 years old at the time of the study), resided in the tri-county area between
2000 and 2008 and completed a telephone survey. Cases were identified from the Pennsylvania Cancer
Registry (PCR) using the International Classification of Diseases codes (ICD-O) for MPNs (codes for
PV, M-9962/3; ETM, 9961/3; PMF, M-9931/3) as well as a PV cluster investigation in 2009 that
included cases diagnosed between 2001 and 2006 in the three county area [17,18]. We included cases
diagnosed up to 31 December 2010. We attempted to contact eligible cases that had relocated from the
tri-county area. Controls were selected using a random digit dialing sample, stratified by age, sex and
county to obtain distributions that reflected those of the source counties. Controls had to be free of
MPNs during the time period that cases were ascertained. Among persons who consented to an
interview, 57% of the cases and 62% of controls also provided DNA for the current analysis. Medical
records of all cases not previously confirmed by the ATSDR cluster investigation [18] were evaluated
by one of two expert panels (one created by the Pennsylvania Department of Health and one used in
case ascertainment for a related study done by the University of Pittsburgh) [19]. Both panels used a
similar methodology, and a two-thirds majority decision rule for case determination. Of the 31 cases
genotyped and identified through the PCR and aforementioned ATSDR cluster investigation, 27 were
confirmed as consistent with clinical records. These 27 cases of MPNs and 292 controls were eligible
for the current analysis.
2.2. Selection of Environmentally Sensitive Genes
The National Institute of Environmental Health Sciences’ Environmental Genome Project (NIEHS
EGP) has enumerated 647 known environmentally sensitive genes (ESG). We considered only genes
identified by the NIEHS EGP that contained non-synonymous single nucleotide polymorphisms
(nsSNPs), with a >5% minor allele frequency (MAF). Thus, 114 metabolism genes were given initial
consideration, predominantly, the Phase I and Phase II detoxifying enzyme classes. The functional gene
groups of interest regulate enzymes of two categories: metabolism or detoxification. Although other
functional categories may be associated with the effect of chemicals of interest, they are out of the
scope of this research. To facilitate the nsSNP selection, we used the Genome Variation Server (GVS) to
obtain SNP information for nearly all EGP genes [20]. Only 82 of the 114 genes had coding SNP data
in the GVS database. We reviewed the remaining 82 genes with nsSNP data for relevance to chemicals
acting through a mutagenic pathway and the ability to be tested using the Illumina Bead Express

Int. J. Environ. Res. Public Health 2015, 12 2468
platform. We ultimately included 21 genes using this platform for this project, in addition to the three
genes without coding data, as shown in Table 1. In general, the variants included in this analysis
modify enzyme function to magnify the mutagenic effect of the xenobiotic substrate [21] and include
variants of the following genes: AHR, ARNT, CYP1A1, CYP1A2, CYP1B1, CYP2B6, CYP2C9,
CYP2E1, CYP3A5, CYP4B1, EPHX1, GSTA1, GSTP1, GSTM1, GSTM3, GSTT1, GSTZ1, MPO, NAT2,
NQO1, OGG1, TP53 and XRCC1 (Table 1) [20,22]. A tag SNP rs1495741 was included for NAT2 and
was used to infer NAT2 slow phenotype [23].
Genotyping
DNA was extracted from white blood cells by a standard salting-out protocol [24]. DNA quality
was assessed by absorption at 260 and 280 nm. Samples were aliquoted into 96 well plates for
analysis. Genotyping for all selected SNPs, except rs1048943 and rs4646903, was carried out using the
Illumina Bead Express platform that employs VeraCode technology (Illumina, San Diego, CA, USA).
Rs1048943 and rs4646903 were genotyped by TaqMan™ assays (LifeTechnologies/Applied
Biosystems, Carlsbad, CA, USA) in a 384 well plate format using an Applied Biosystems 7900 PCR
system. About 7% of samples were run in duplicate for both SNP genotyping assays. Deletions in
GSTM1 and GSTT1 were determined using TaqMan Copy Number Assays™ with RNase P as the
control gene. Samples were run in triplicate and CopyCaller™ Software was used for determination of
the copy number. The bead express for the genotyping was run by Dr. Robin J. Leach, Co-Director of
the Genomics Resource Core of the University of Texas, Health Services Center, School of Medicine,
San Antonio. The JAK2 V617F testing was completed by Dr. Mingjiang Xu at Mt. Sinai School of
Medicine.
2.3. Statistical Analysis
Descriptive analysis was conducted on the characteristics of the study population. Logistic
regression estimated adjusted odds ratios (OR) and associated 95% confidence intervals (CI). All ORs
were adjusted for the design variables used to stratify the population for selection of controls (sex, age,
county).
We used the highest frequency of the homozygous genotype as the reference unless the literature
indicated a different referent group (see Table A1). We conducted analysis of genotypes in the control
population to evaluate Hardy-Weinberg equilibrium in the genetic variants. We applied “gene-only
analysis” [13] to estimate the main effect of the gene of interest as a signal for gene-environment
interaction. Each genotype was tested one at a time. We also restricted analysis to only confirmed PV
cases as well as only JAK2 V617F as additional case categories. In addition, an analysis that
considered the total number of deleterious SNPs was also performed. Statistical analyses were
conducted in SAS v. 9.2 (SAS Institute, Cary, NC, USA).

Int. J. Environ. Res. Public Health 2015, 12 2469
Table 1. Genes associated with a mutagenic chemical and minor allele frequency in the general population [19].
Genes Function and Variant Effects (GVS) Minor Allele Frequency (%) Chemical Exposure
AHR This gene encodes a ligand-activated transcription factor involved in the regulation of biological responses to planar aromatic hydrocarbons.
10 2,3,7,8-TCDD, benzo[a]pyrene 2,4'-DDT, Benzene
ARNT The aryl hydrocarbon (Ah) receptor in xenobiotic Metabolism. 40 Dioxin and polycyclic aromatic hydrocarbons
CYP1A1 CYP1A1 is also known as AHH (aryl hydrocarbon hydroxylase). It is involved in the metabolic activation of aromatic hydrocarbons (PAH) some of which are found in cigarette smoke.
10
2,3,7,8-TCDD, sodium arsenite (NaAsO2), 2,4'-DDT, Aroclor-1260(weak), benzo[a]pyrene, benzo[k]fluoranthene, cadmium chloride
CYP1A2
The protein encoded by this gene localizes to the endoplasmic reticulum and its expression is induced by some PAHs, some of which are found in cigarette smoke. The enzyme’s endogenous substrate is unknown; however, it is able to metabolize some PAHs to carcinogenic intermediates. Other xenobiotic substrates for this enzyme include caffeine, aflatoxin B1, and acetaminophen.
24 2,3,7,8-TCDD, benzo[a]pyrene
CYP1B1 Metabolizes pro-carcinogens such as PAHs and 17beta-estradiol. 44 2,3,7,8-TCDD, benzo[a]pyrene
CYP2B6 This enzyme is known to metabolize some xenobiotics, such as the anti-cancer drugs cyclophosphamide and ifosphamide.
21 2,4'-DDT
CYP2E1 Inactivates a number of drugs and xenobiotics and also bioactivates many xenobiotic substrates including ethanol to their hepatotoxic or carcinogenic forms.
6 Benzene, methylene chloride, Styrene, 1,1,1-trichloroethane, Trichloroethylene
CYP3A5 In liver microsomes, this enzyme is involved in a NADPH-dependent transport pathway. It oxidizes a variety of structurally related compounds such as xenobiotics, fatty acids and steroids.
31 Drug metabolism and synthesis of cholesterol, steroids and other lipids
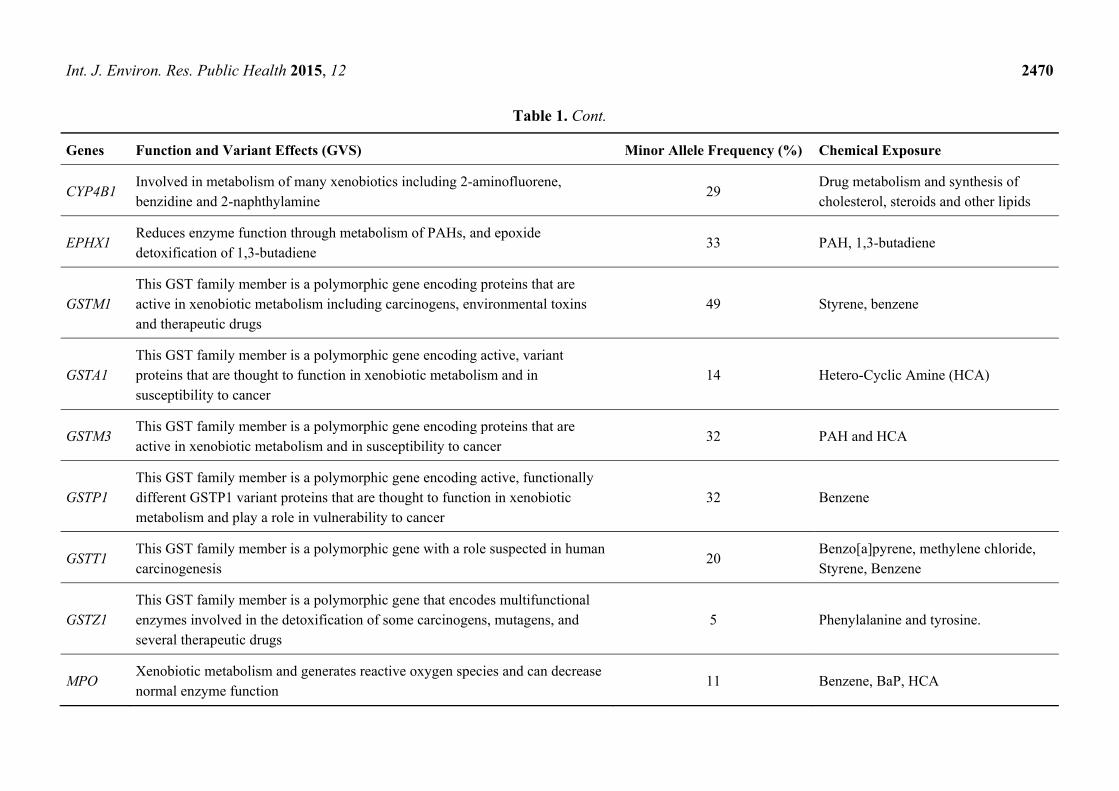
Int. J. Environ. Res. Public Health 2015, 12 2470
Table 1. Cont.
Genes Function and Variant Effects (GVS) Minor Allele Frequency (%) Chemical Exposure
CYP4B1 Involved in metabolism of many xenobiotics including 2-aminofluorene, benzidine and 2-naphthylamine
29 Drug metabolism and synthesis of cholesterol, steroids and other lipids
EPHX1 Reduces enzyme function through metabolism of PAHs, and epoxide detoxification of 1,3-butadiene
33 PAH, 1,3-butadiene
GSTM1 This GST family member is a polymorphic gene encoding proteins that are active in xenobiotic metabolism including carcinogens, environmental toxins and therapeutic drugs
49 Styrene, benzene
GSTA1 This GST family member is a polymorphic gene encoding active, variant proteins that are thought to function in xenobiotic metabolism and in susceptibility to cancer
14 Hetero-Cyclic Amine (HCA)
GSTM3 This GST family member is a polymorphic gene encoding proteins that are active in xenobiotic metabolism and in susceptibility to cancer
32 PAH and HCA
GSTP1 This GST family member is a polymorphic gene encoding active, functionally different GSTP1 variant proteins that are thought to function in xenobiotic metabolism and play a role in vulnerability to cancer
32 Benzene
GSTT1 This GST family member is a polymorphic gene with a role suspected in human carcinogenesis
20 Benzo[a]pyrene, methylene chloride, Styrene, Benzene
GSTZ1 This GST family member is a polymorphic gene that encodes multifunctional enzymes involved in the detoxification of some carcinogens, mutagens, and several therapeutic drugs
5 Phenylalanine and tyrosine.
MPO Xenobiotic metabolism and generates reactive oxygen species and can decrease normal enzyme function
11 Benzene, BaP, HCA

Int. J. Environ. Res. Public Health 2015, 12 2471
Table 1. Cont.
Genes Function and Variant Effects (GVS) Minor Allele Frequency (%) Chemical Exposure
NAT2
Polymorphisms in this gene are responsible for the N-acetylation polymorphism in which human populations segregate into rapid, intermediate, and slow acetylator phenotypes. Polymorphisms in this gene are also associated with higher incidences of cancer and drug toxicity.
37 Benzo[a]pyrene, arylamine and hydrazine metabolism
NQO1 Mutations in this gene have been associated with tardive dyskinesia (TD), an increased risk of hematotoxicity after exposure to benzene, and susceptibility to various forms of cancer.
22 2,3,7,8-TCDD, benzo[a]pyrene
OGG1 Can result in decreased base excision DNA repair. 22 Aromatic hydrocarbons, most are repaired by NER not BER, this does repair 8-oxoG
TP53 Encodes a tumor suppressor protein and has an effect on cell-cycle regulation including DNA repair and changes in metabolism.
39 All genotoxic compounds
XRCC1 Involved in base excision repair and is linked to OGG1 gene. 12 Aromatic hydrocarbons

Int. J. Environ. Res. Public Health 2015, 12 2472
3. Results
The majority of MPN cases were confirmed to be primary PV (24/27). A greater proportion of cases
were older (median age = 71 vs. 63 years.) and male (56% vs. 40%) compared to controls but
otherwise were demographically similar (Table 2). The study population was entirely Caucasian with
only two Latino controls. None of the cases and only six controls reported Jewish ancestry. All
examined genes existed in Hardy Weinberg equilibrium (details not shown). The prevalence of CYP1A2,
GSTA1, GSTM3, and NAT2 risk genotypes in controls were 7%, 18%, 9% and 57%, respectfully,
which is in agreement with the reported frequency in the literature (Table 1).
Table 2. Demographic characteristics of cases and controls.
Variable All MPN Cases n = 27 (%)
JAK2 V617F Positive Cases n = 22 (%)
PV Cases n = 24 (%)
Controls n = 292 (%)
County Carbon 4 (15) 4 (18) 4 (17) 31 (11) Luzerne 12 (44) 10 (45) 10 (42) 177 (61) Schuylkill 11 (41) 8 (36) 10 (42) 84 (29)
Age 42–64 7 (26) 6 (27) 5 (21) 167 (57) 65+ 20 (74) 16 (73) 19 (79) 125 (43)
Sex (male) 15 (56) 12 (55) 13 (54) 118 (40) Race/ethnicity Non-Hisp. White 27 (100) 22 (100) 24 (100) 290 (99) Latino, Hispanic 0 0 0 2 (1)
Marital status Married 18 (67) 15 (68) 15 (63) 183 (63) Widowed 7 (26) 5 (23) 7 (29) 47 (16) Currently single 2 (7) 2 (9) 2 (8) 62 (21)
Education Less than high school 2 (7) 2 (9) 2 (8) 5 (2) High school/GED 13 (48) 11 (50) 13 (54) 106 (36) Some college 7 (26) 5 (23) 5 (21) 104 (36) Bachelors degree 2 (7) 2 (9) 2 (8) 36 (12) More than bachelors 3 (11) 2 (9) 2 (8) 41 (14)
Household income Less than $20,000 3 (12) 3 (15) 3 (14) 38 (14) $20,000—$35,000 9 (36) 7 (35) 9 (41) 67 (24) $35,000—$50,000 2 (8) 2 (10) 2 (9) 54 (20) $50,000—$75,000 6 (24) 4 (20) 6 (27) 67 (24) More than $75,000 5 (20) 4 (20) 2 (9) 48 (18) Don’t know or refused to answer 2 2 2 18
Results for associations of MPNs with the environmentally sensitive genes are summarized in
Table 3. The crude estimates were very similar to the effect estimates adjusted for the design variables.
It must be noted that all estimates of ORs had wide confidence intervals and any interpretation of the

Int. J. Environ. Res. Public Health 2015, 12 2473
magnitude of the effect and reliability of the hypothesis test should be approached with considerable
caution. Having the most common homozygous CYP1A1 rs4646903, CYP1A2, EPHX1 rs2234922 and
Tp53 alleles increased the odds of MPNs by four- to five-fold, with the point estimates of the odds
ratios of 5.1, 4.1, 5.0, and 5.4, respectively. The CYP3A5 rs776746 AA genotype increased the risk of
having an MPN on average 9-fold. The GSTA1 rs3957356 AA genotype was associated with an
increase in effect estimates for any MPNs, with an average OR of 1.9. The GSTM3 rs7483 AA
genotype was associated, on average, with elevated risk of any MPNs (OR = 3.9). The GSTM1 null
and GSTZ1rs7972 AA genotypes followed a similar trend of doubling the odds of having an MPN,
e.g., OR of 2.4 and 2.8, respectively. We found that the NAT2 slow acetylator AA genotype
(rs1495741) was, on average, three times more common than wild-type genotype among cases, e.g.,
for any MPNs (OR = 3.1). We were not able to test for all seven of the other NAT2 SNPs shown in the
literature to determine slow acetylator phenotype, but we were able to test for four of them. We
observed a 2-fold increase for CYP2E1 across all case definitions. A similar increased risk was found
for individuals with NQO1 rs1800566 AG (OR = 1.9) and a 3-fold increase for ARNT rs12410394 AG
or GG genotypes with an OR of 3.2.
Table 3. Association of myeloproliferative neoplasm with environmentally sensitive gene
in case-control analysis: Odds ratios and (95% confidence intervals), adjusted for age, sex,
and county 1.
Gene 2 SNP At Risk Coding
Sequence Variant All MPN Cases (n = 27) JAK2 V617F Cases (n = 22) PV Cases (n = 24)
AHR rs2066853 AG 1.0 (0.4, 2.9) 1.3 (0.4, 3.8) 1.2 (0.4, 3.5)
ARNT rs12410394 GG 0.4 (0.2, 1.0) 0.5 (0.2, 1.3) 0.4 (0.1, 1.0)
AA 0.2 (<0.1, 1.8) -- 0.2 (<0.1, 2.0)
rs12410394 AA 0.3 (<0.1, 2.4) -- 0.3 (<0.1, 2.8)
rs12410394 GG 0.5 (0.2, 1.2) 0.6 (0.2, 1.6) 0.4 (0.2, 1.2)
AG or GG 3.2 (0.4, 25.6) -- 2.9 (0.4, 23.3)
CYP1A1 rs1048943 CT 2.1 (0.5, 8.1) 2.4 (0.6, 9.5) 1.4 (0.3, 7.0)
rs4646903 CC 5.1 (0.5, 57.5) -- 6.8 (0.6, 80.3)
CT 1.5 (0.6, 4.2) 1.6 (0.5, 4.6) 1.4 (0.5, 4.0)
CYP1A2 rs762551 AA 0.8 (0.3, 1.7) 0.8 (0.3, 1.9) 0.8 (0.3, 1.9)
CC 4.1 (1.3, 13.2) 3.9 (1.1, 13.8) 3.7 (1.0, 13.3)
CYP1B1 rs1056836 CC 1.9 (0.7, 5.4) 1.5 (0.5, 4.4) 1.5 (0.5, 4.5)
CG 0.7 (0.2, 1.8) 0.4 (0.1, 1.3) 0.6 (0.2, 1.6)
CYP2B6 rs3745274 AC 1.1 (0.5, 2.6) 1.2 (0.5, 3.0) 1.3 (0.5, 3.2)
CYP2C9 rs1057910 AC 1.4 (0.4, 4.5) 1.2 (0.3, 4.5) 1.6 (0.5, 5.3)
rs1799853 AG 0.9 (0.3, 2.5) 0.9 (0.3, 2.6) 0.6 (0.2, 1.9)
CYP2E1 rs2031920 AG 2.0 (0.4, 9.8) 2.4 (0.5, 12.3) 2.3 (0.4, 11.7)
rs2070673 AT 0.7 (0.2, 2.0) 0.7 (0.2, 2.1) 0.6 (0.2, 1.9)
rs6413432 AT 1.5 (0.6, 4.2) 2.0 (0.7, 5.6) 1.8 (0.6, 5.0)
CYP3A5 rs776746 AA 9.1 (0.5, 162.6) 11.0 (0.6, 200.1) 10.7 (0.6, 192.5)
AG 0.9 (0.3, 3.4) 0.7 (0.2, 3.4) 1.1 (0.3, 4.2)
CYP4B1 rs2297810 AG 1.3 (0.5, 3.0) 1.2 (0.5, 3.1) 1.5 (0.6, 3.7)

Int. J. Environ. Res. Public Health 2015, 12 2474
Table 3. Cont.
Gene 2 SNP At Risk Coding
Sequence Variant All MPN Cases (n = 27) JAK2 V617F Cases (n = 22) PV Cases (n = 24)
EPHX1 rs1051740 GG 2.3 (0.6, 8.4) 2.4 (0.6, 8.9) 2.3 (0.6, 8.8)
AG 1.6 (0.6, 3.9) 1.0 (0.4, 2.8) 1.3 (0.5, 3.2)
rs2234922 GG 5.0 (0.7, 34.1) 3.7 (0.3, 39.9) 6.4 (0.9, 46.7)
AG 0.9 (0.3, 2.2) 0.9 (0.3, 2.4) 1.0 (0.4, 2.7)
GSTA1 rs3957356 AA 1.9 (0.8, 4.7) 2.7 (1.0, 7.0) 2.3 (0.9, 5.9)
GSTM1 Null 2.4 (1.0, 5.9) 2.2 (0.8, 6.0) 2.5 (0.9, 6.5)
GSTM3 rs7483 AA 3.9 (1.2, 12.3) 4.5 (1.2, 16.0) 3.3 (1.0, 11.2)
AG 1.2 (0.5, 3.1) 1.6 (0.6, 4.5) 1.0 (0.4, 2.6)
rs1332018 CC 0.8 (0.3, 2.2) 0.6 (0.2, 2.1) 1.0 (0.3, 3.0)
AC 0.2 (0.1, 0.7) 0.3 (0.1, 0.7) 0.3 (0.1, 0.9)
rs1799735 TG 0.5 (0.2, 1.4) 0.4 (0.1, 1.6) 0.6 (0.2, 1.7)
GSTM3 rs7483 AA 3.5 (1.2, 10.0) 3.5 (1.1, 10.7) 3.3 (1.1, 10.3)
GSTP1 rs1695 AG 0.8 (0.4, 1.9) 0.7 (0.3, 1.8) 0.7 (0.3, 1.8)
rs1138272 AA 1.2 (0.4, 4.0) 1.1 (0.3, 4.0) 1.0 (0.3, 3.8)
AG 0.4 (<0.1, 2.9) -- 0.4 (0.0, 3.2)
GSTT1 Null 0.8 (0.3, 2.5) 0.5 (0.1, 2.1) 0.6 (0.2, 2.4)
GSTZ1 rs7972 AA 2.8 (0.3, 28.7) 4.0 (0.4, 41.2) 3.4 (0.3, 37.3)
AG 1.4 (0.5, 3.9) 1.8 (0.6, 5.3) 1.6 (0.5, 4.8)
rs1046428 AG 0.4 (0.2, 1.1) 0.3 (0.1, 1.0) 0.4 (0.1, 1.1)
NAT2 rs1041983 AA 0.6 (0.1, 2.5) 0.7 (0.1, 3.1) 0.3 (<0.1, 2.2)
rs1495741 AA 3.1 (1.1, 8.7) 4.6 (1.3, 16.1) 3.5 (1.1, 10.8)
rs1799929 AA 2.4 (1.0, 5.7) 3.4 (1.3, 8.4) 2.4 (1.0, 6.1)
rs1799930 AA 0.3 (<0.1, 2.6) 0.4 (<0.1, 3.1) --
rs1801280 GG 2.8 (1.2, 6.5) 4.0 (1.6, 9.9) 2.9 (1.2, 7.1)
NQO1 rs1131341 AG 1.7 (0.4, 6.6) 2.3 (0.6, 8.8) 1.2 (0.2, 5.6)
rs1800566 AA 1.6 (0.2, 14.4) -- 2.0 (0.2, 17.9)
AG 1.9 (0.8, 4.3) 1.8 (0.7, 4.4) 1.7 (0.7, 4.1)
OGG1 rs1052133 CG 1.0 (0.4, 2.4) 0.9 (0.4, 2.4) 1.0 (0.4, 2.6)
GG 0.6 (0.1, 4.7) 0.7 (0.1, 5.6) 0.6 (0.1, 5.3)
Tp53 rs1042522 GG 5.4 (1.4, 20.8) 8.0 (2.0, 33.0) 6.8 (1.7, 28)
CG 1.0 (0.4, 42.3) 1.3 (0.5, 3.4) 1.0 (0.4, 2.6)
XRCC1 rs25487 AA 0.9 (0.3, 2.6) 1.4 (0.4, 5.0) 1.1 (0.3, 3.8)
AG 0.5 (0.2, 1.3) 0.8 (0.3, 2.1) 0.5 (0.2, 1.4)
rs25489 GG 0.8 (<0.1) 0.8 (<0.1) 0.7 (<0.1)
rs1799782 AA 18.2 (1.0, 339) - -
AG 1.6 (0.4, 6.1) 1.3 (0.3, 6.2) 1.1 (0.2, 5.3)
1 Odds ratios could not be calculated because there were no cases/controls with those variants for missing
results and specifically, MPO rs2333277 genotype CC and XRCCI, rs25489 AG genotypes had no cases with
any case definition; 2 Susceptible genes to mutagenic chemicals and Single Nucleotide Polymorphisms
(SNPs) with rs number.
All but one case (97%) harbored at least two of the evaluated SNPs that signal association of the
outcomes with exposure to xenobiotics (AHR, CYP1E2, GSTM1, Tp53, GSTT1, GSTM3, CYP1A2,

Int. J. Environ. Res. Public Health 2015, 12 2475
NAT2, or GSTA1 30/31) compared to 63% of controls (Table 4). None of the results, either for
individual genotype or presence of two or more of these SNPs varied materially in analyses restricted
to only PV cases or to cases with confirmed JAK2 somatic mutations.
Table 4. Total number deleterious genes, number and frequency for cases and controls.
Number of Deleterious Genes 1 Number and Frequency Deleterious Genes 1 Frequency Deleterious Genes 1
Cases Controls Cases (%) Controls (%)
0 0 11 0 3.70
1 1 99 3.23 33.30
At least 2 30 182 96.78 63.00 1 AHR, CY1A2, CY1E2, GSTA1, GSTM1, GSTM3, GSTT1, NAT2, TP53.
4. Discussion
After studying the main effects of 24 environmentally sensitive genes, we found that variants in
NAT2, CYP1A2, GSTA1, and GSTM3 were statistically significantly associated with MPN risk with
ORs between 1.5 and 4. In addition, variants in CYPA1, CYP2E1, CYP3A5, EPHX1, TP53, MPO,
GSTZ1, ARNT, and NQO1 were associated with MPNs in this study with ORs between 1.4 and 9.
While these results do not confirm gene-environment interaction for any one specific chemical, the
findings encourage further explanation of the interaction hypothesis with respect to biological
pathways and chemical exposures implicated by these genes. These same genes appear to be associated
with the presence of the JAK2 V617F mutation that is pathogenomic of MPNs.
To detect the potential for existence of gene-environment interactions, the main effects of genes were
used in this analysis. We did not have measures of the exposures of interest available and therefore could
not estimate interactions or stratified effects directly. If we assume that genes alone do not cause MPNs, but
can only act by modifying the toxicity of an environmental exposure, then testing the main effect of the
genes is an efficient way to generate evidence supporting qualitative gene-environment interaction [13,14].
Based on this reasoning, we are essentially assuming the existence of gene-environment interaction
without an independent gene effect. A main gene effect without exposure is unlikely, based on the
knowledge about the pathway for these diseases [6,7]. Therefore we have no reason to believe that
MPNs are caused exclusively by the genotypes under investigation.
In our study sample, we did not find any associations with smoking or occupational exposure to
polycyclic aromatic hydrocarbons with risk of developing an MPN [16]. However, perhaps
paradoxically, our findings suggest that specific genotypes that modify the toxicity of these exposures
may play a role in MPNs. The lack of an association of smoking with MPNs is consistent with the
limited prior literature [4]. However, the existing literature on occupational and chemical exposures and
MPN is neither specific, nor consistent [25–29].
Moore et al., reported an association of bladder cancer with NAT2 slow acetylator genotype and
smoking intensity [30]. Since aromatic amines are detoxified by NAT2, interaction is biologically
plausible. Thus, if carcinogens in tobacco smoke where implicated in MPNs, as they are in bladder
cancer, then we should have detected the main effect of NAT2 in our study. However, absence of an
effect from smoking per se suggests that compounds not important to the toxicity of tobacco smoke
but affected by NAT2 should be scrutinized.

Int. J. Environ. Res. Public Health 2015, 12 2476
Functional SNPs associated with benzene exposure were also explored in this analysis: CYP2E1,
GSTM1, AHR, and GSTT1 variants modify the biological dose of benzene. In addition, Tp53 has been
reported to be involved with benzene hematopoietic stem-cell toxicity in mice [31]. Effect estimates
for AHR and GSTT1 were essentially null but not for GSTM1 and Tp53. Work by Quiroga, Kaplan et
al., and Mele et al., implicated benzene or petroleum products as risk factors [25,32,33]. Among
analyses with the best available estimates of exposure to benzene, a pooled analysis of 29 cases of
myelodysplastic syndrome (MDS), showed a monotonic-dose response relationship with cumulative
exposure to benzene (odds ratio (OR) = 4.33 95% CI: 1.31, 14.3) but not for other subtypes including
30 myeloproliferative disease (MPD) cases (OR = 1.79, 95% CI: 0.68, 4.74) [29]. Work of Schnatter et
al. implies that diagnostic heterogeneity may be complicating attribution to specific MPNs to
environmental exposures [29]. Overall, our results are consistent with the supporting prior body of
literature that suggests that benzene may be implicated in some MPNs, although clearly the evidence is
far from being consistent and conclusive.
Our study was limited by the small number of cases. MPNs are rare hematological malignancies
with only a limited number of cases available for recruitment—even under cluster outbreak conditions.
Our study is most informative about PV cases only. We included a total of 24 PV cases, which is in the
range of other studies of MPN etiology with case groups ranging from 10 to 133 [32,33] (see also
n = 53 [31] and n = 30 [29]). Another limitation could be an unbalance in age and sex distribution of cases
and controls. We attempted to control this by including these factors in the logistic regression. But
residual confounding cannot be ruled out.
Although MPNs are classified at malignant, they became a reportable disease in the US only
recently, in 2001, and in Pennsylvania only hospitals were able to report until recently, so there is the
possibility of under-reporting of these MPNs to the cancer registry. There were also changes in the
diagnostic criteria by the WHO in 2001 and again in 2008 [34]. The 2008 diagnostic criteria included
molecular as well as histological information for diagnosis, including the JAK2 V617F mutation [34].
Our ability to test for this mutation directly helped minimize outcome misclassification. Furthermore,
by considering only individuals with JAK2 mutation to be cases in some of our analyses, we reduced
the possibly of outcome misclassification if one were to assume that persons with the mutation
experience exposures that already placed them on pathway towards developing clinical MPN.
The misclassification of genotypes was not a concern in this study because our call rate was high
(>95%), and we only had one SNP (UGT1A) that consistently did not perform well [35,36]. Our study
is vulnerable to false positive discovery due to “multiple comparisons” [37]. However, unlike GWAS
studies, we started with 648 genes of interest and only examined genes that met our a priori “plausible
candidate”. Our selective genotypes were functional SNPs which directly affect the enzymatic activity
of the gene, influencing biological pathways that affect metabolic activation or detoxification
processes of metabolism for mutagenic chemicals. We did not correct for elevated type II error
associations in applying a correction factor in the analysis.
5. Conclusions
Our research made two main pivotal assumptions. First, we assumed that genotype and
environmental exposures in this study population are independent. Second, we assumed that disease

Int. J. Environ. Res. Public Health 2015, 12 2477
risk will not vary with genotype for subjects without environmental exposure. From this, we exploit
the most generic form of Mendelian randomization that individuals receive a random allocation of
alleles from their parents. Gustasfon and Burstyn presented this method and concluded that when both
of these assumptions are met, using data on genotype and disease jointly, with only knowledge of the
prevalence of exposure without individual level data on exposure, can be a practical approach to
investigate gene-environment interaction [14]. Through this approach, a signal of increased risk will
only result if an environmental exposure is operating through gene-environment interaction [27]. Our
findings therefore suggest that aromatic compounds and heterocyclic amines play a role in MPNs.
Future research on the exposures (other than smoking) affected by the NAT2, GST, and CYP genes may
be fruitful avenues to better evaluate the environmental etiology of MPNs.
Acknowledgments
This work would not have been possible without the assistance of the PV Partnership coordinated
by the Grant sponsor: Centers for Disease Control and Prevention (CDC) and award though Grant:
EH09-006E. We also wish to thank Elizabeth Irvin-Barnwell, Steve Dearwent, and Vince Seaman
from the CDC/ATSDR for their guidance throughout the project. This work was also supported by the
Biomarkers Laboratory of Columbia’s NIEHS Center, Grant sponsor: National Institute Environmental
Health Services (NIEHS), Grant: ES009089. Adam Lynch was invaluable to our team in every aspect
of obtaining IRB approval and the data from the Cancer Registry, as well as development of the panel
of environmentally sensitive genes. We also want to acknowledge the Geisinger Health System Survey
Unit, and their IRB office for all their assistance in collecting data from the participants. We are
greatly indebted to the assistance of the Pennsylvania Department of Health personnel, including:
James N. Logue, David Marchetto, Michael Makowski, MPH, and the Pennsylvania Cancer Registry.
In addition, our study benefited from the opinions of our expert panel members organized by both the
Pennsylvania Department of Health and University of Pittsburgh. The panels included Emmanuel Besa
(Thomas Jefferson University), Samuel Lesko (the Northeast Regional Cancer Institute), Paul I. Roda
(Geisinger Health System), Roy E. Smith (the University of Pittsburgh), and Donald Woytowitz (the
University of Pittsburgh). We are also like to thank the members of the Community Action Committee,
in particular Joe Murphy and Henry Cole for their support within the community. Thoughtful advice of
Allison Evans and Palak Raval-Nelson is gratefully acknowledged (members of the dissertation
committee of CAGD).
Author Contributions
All authors equally contributed to the conception and study design and the acquisition of data from
the Cancer Registry. Karyn Heavner and Carol Ann Gross-Davis were responsible for recruitment and
follow-up of study participant, responsible for data cleaning and carried out the analyses. Regina M.
Santella conducted the genotype analysis. Carol Ann Gross-Davis drafted the manuscript, which was
revised by all authors. All authors read and approved the final manuscript.
Int. J. Environ. Res. Public Health 2015, 12 2478
Conflicts of Interest
The authors declare no conflict of interest.
Disclaimer
This study was funded by a Cooperative Agreement/Earmark (CDC Research Grant Number:
1R01EH000640-01). It must be noted that this article’s contents are solely the responsibility of the
authors and does not relate to the views of ATSDR or CDC. The research presented in this paper has
been conducted by an employee of U.S. Environmental Protection Agency (EPA), Region III and was
funded through the Centers for Disease Control and Prevention (CDC). Its contents are solely the
responsibility of the authors and do not necessarily represent the official views of the CDC, EPA or the
U.S. government.
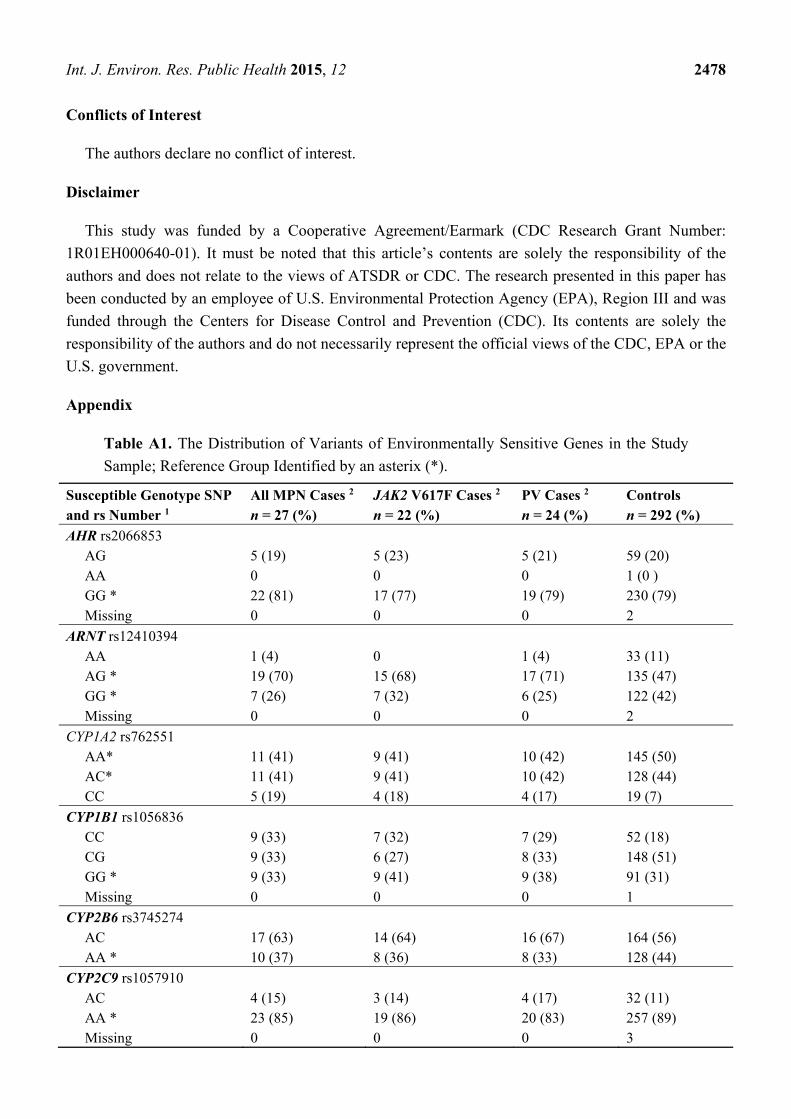
Appendix
Table A1. The Distribution of Variants of Environmentally Sensitive Genes in the Study
Sample; Reference Group Identified by an asterix (*).
Susceptible Genotype SNP and rs Number 1
All MPN Cases 2 n = 27 (%)
JAK2 V617F Cases 2 n = 22 (%)
PV Cases 2 n = 24 (%)
Controls n = 292 (%)
AHR rs2066853 AG 5 (19) 5 (23) 5 (21) 59 (20) AA 0 0 0 1 (0 ) GG * 22 (81) 17 (77) 19 (79) 230 (79) Missing 0 0 0 2
ARNT rs12410394 AA 1 (4) 0 1 (4) 33 (11) AG * 19 (70) 15 (68) 17 (71) 135 (47) GG * 7 (26) 7 (32) 6 (25) 122 (42) Missing 0 0 0 2
CYP1A2 rs762551 AA* 11 (41) 9 (41) 10 (42) 145 (50) AC* 11 (41) 9 (41) 10 (42) 128 (44) CC 5 (19) 4 (18) 4 (17) 19 (7)
CYP1B1 rs1056836 CC 9 (33) 7 (32) 7 (29) 52 (18) CG 9 (33) 6 (27) 8 (33) 148 (51) GG * 9 (33) 9 (41) 9 (38) 91 (31) Missing 0 0 0 1
CYP2B6 rs3745274 AC 17 (63) 14 (64) 16 (67) 164 (56) AA * 10 (37) 8 (36) 8 (33) 128 (44)
CYP2C9 rs1057910 AC 4 (15) 3 (14) 4 (17) 32 (11) AA * 23 (85) 19 (86) 20 (83) 257 (89) Missing 0 0 0 3

Int. J. Environ. Res. Public Health 2015, 12 2479
Table A1. Cont.
Susceptible Genotype SNP and rs Number 1
All MPN Cases 2 n = 27 (%)
JAK2 V617F Cases 2 n = 22 (%)
PV Cases 2 n = 24 (%)
Controls n = 292 (%)
rs1799853 AG 6 (22) 5 (23) 4 (17) 64 (22) GG * 21 (78) 17 (77) 20 (83) 225 (78) Missing 0 0 0 3
CYP2E1 rs2031920 AG 2 (7) 2 (9) 2 (8) 12 (4) GG * 25 (93) 20 (91) 22 (92) 275 (96) Missing 0 0 0 5
rs2070673 AT 5 (19) 4 (18) 4 (17) 74 (26) AA 0 0 0 9 (3) TT * 22 (81) 18 (82) 20 (83) 206 (71) Missing 0 0 0 3
rs6413432 AT 6 (22) 6 (27) 6 (25) 48 (17) TT 0 0 0 2 (1) AA * 21 (78) 16 (73) 18 (75) 240 (83) Missing 0 0 0 2
CYP3A4 rs2740574 AG 0 0 0 14 (5) AA * 26 (100) 22 (100) 23 (100) 277 (95) Missing 1 0 1 1
CYP3A5 rs776746 AA 1 (4) 1 (5) 1 (4) 1 (0) AG 3 (11) 2 (9) 3 (13) 38 (13) GG * 23 (85) 19 (86) 20 (83) 252 (87) Missing 0 0 0 1
CYP4B1 rs2297810 AG 9 (33) 7 (32) 9 (38) 74 (26) AA 0 0 0 3 (1) GG * 18 (67) 15 (68) 15 (63) 212 (73) Missing 0 0 0 3
EHPX1 rs1051740 GG 4( 15) 4 (18) 4 (17) 27 (9) AG 14 (52) 9 (41) 11 (46) 131 (45) AA * 9 (33) 9 (41) 9 (38) 131 (45) Missing 0 0 0 3
rs2234922 GG 2 (7) 1 (5) 2 (8) 4 (1) AG 7 (26) 6 (27) 7 (29) 85 (29) AA * 18 (67) 15 (68) 15 (63) 200 (69) Missing 0 0 0 3

Int. J. Environ. Res. Public Health 2015, 12 2480
Table A1. Cont.
Susceptible Genotype SNP and rs Number 1
All MPN Cases 2 n = 27 (%)
JAK2 V617F Cases 2 n = 22 (%)
PV Cases 2 n = 24 (%)
Controls n = 292 (%)
GSTA1 rs3957356 AA * 9 (33) 9 (41) 9 (38) 53 (18) AG * 11 (41) 7 (32) 9 (38) 148 (51) GG 7 26 6 (27 6 (25) 91 (31)
GSTM1 Undetermined 0 0 0 1 (0) 0 20 (74) 16 (73) 18 (75) 155 (53) 1 * 7 (26) 6 (27) 6 (25) 116 (40) 2 * 0 0 0 20 (7)
GSTM3 rs7483 AA 6 (22) 5 (23) 5 (21) 26 (9) AG 11 (41) 10 (45) 9 (38) 124 (43) GG * 10 (37) 7 (32) 10 (42) 137 (48) Missing 0 0 0 5
rs1332018 CC 7 (26) 5 (23) 7 (29) 45 (16) AC 7 (26) 6 (27) 7 (29) 156 (54) AA * 13 (48) 11 (50) 10 (42) 89 (31) Missing 0 0 0 2
rs1799735 TG 4 (15) 3 (14) 4 (17) 81 (28) TT 0 0 0 8 (3) GG * 23 (85) 19 (86) 20 (83) 200 (69) Missing 0 0 0 3
GSTP1 rs1695 AG 13 (48) 10 (45) 11 (46) 135 (47) GG 0 0 0 33 (11) AA * 14 (52) 12 (55) 13 (54) 122 (42) Missing 0 0 0 2
rs1138272 AA 4 (15) 3 (14) 3 (13 (35 12) AG 1 (4) 0 1 (4 ) 30 (10) GG * 22 (81) 19 (86) 20 (83) 227 78
GSTT1 3 * 0 0 0 1 (0) Undetermined 0 0 0 1 (0) 0 4 (15) 2 (9) 3 (13) 46 (16) 1 * 22 (81) 20 (91) 21 (88) 197 (67) 2 * 1 (4) 0 0 47 (16)

Int. J. Environ. Res. Public Health 2015, 12 2481
Table A1. Cont.
Susceptible Genotype SNP and rs Number 1
All MPN Cases 2 n = 27 (%)
JAK2 V617F Cases 2 n = 22 (%)
PV Cases 2 n = 24 (%)
Controls n = 292 (%)
GSTZ1 rs7972 AA 1 (4) 1 (5) 1 (4) 6 (2) AG 5 (19) 5 (23) 5 (21) 44 (15) GG * 21 (78) 16 (73) 18 (75) 242 (83)
rs1046428 AG 6 (23) 4 (19) 5 (22) 98 (34) AA 0 0 0 9 (3) GG * 20 (77) 17 (81) 18 (78) 184 (63) Missing 1 1 1 1
MPO rs2333277 CC 0 0 0 1 (0.3) AA * 27 (100) 22 (100) 24 (100) 289 (99) Missing 0 0 0 2
NAT2 rs1041983 GG * 13 (48) 12 (55) 12 (50) 140 (48) AG * 12 (44) 8 (36) 11 (46) 116 (40) AA 2 (7) 2 (9) 1 (4) 35 (12) Missing 0 0 0 1
rs1495741 GG 1 (4) 1 (5) 1 (4) 22 (8) AG 4 (15) 2 (9) 3 (13) 104 (36) AA * 22 (81) 19 (86) 20 (83) 164 (57) Missing 0 0 0 2
rs1799929 GG* 9 (33) 7 (32) 7 (29) 112 (38) AG* 8 (30) 5 (23) 8 (33) 124 (42) AA 10 (37) 10 (45) 9 (38) 56 (19)
rs1799930 GG * 14 (52) 13 (59) 13 (54) 148 (51) AG * 12 (44) 8 (36) 11 (46) 114 (39) AA 1 (4) 1 (5) 0 29 (10) Missing 0 0 0 1
rs1801279 GG * 27 (100) 22 (100) 24 (100) 291 (100) AG * or AA Missing 0 0 0 1
rs1801280 GG * 11 (41) 11 (50) 10 (42) 58 (20) AG * 9 (33) 6 (27) 9 (38) 127 (44) AA 7 (26) 5 (23) 5 (21) 106 (36) Missing 0 0 0 1

Int. J. Environ. Res. Public Health 2015, 12 2482
Table A1. Cont.
Susceptible Genotype SNP and rs Number 1
All MPN Cases 2 n = 27 (%)
JAK2 V617F Cases 2 n = 22 (%)
PV Cases 2 n = 24 (%)
Controls n = 292 (%)
NQO1 rs1131341 AG 3 (11) 3 (14) 2 (8) 17 (6) GG * 24 (89) 19 (86) 22 (92) 275 (94)
rs1800566 AA 1 (4) 0 1 (4) 12 (4) AG 12 (44) 10 (45) 10 (42) 87 (30) GG * 14 (52) 12 (55) 13 (54) 193 (66)
CYP1A1 rs1048943 CT 3 (12) 3 (14) 2 (9) 18 (6) TT * 23 (88) 19 (86) 21 (91) 269 (94) Missing 1 0 1 5
rs4646903 CC 1 (4) 0 1 (4) 3 (1) CT 6 (23) 5 (24) 5 (22) 46 (16) TT * 19 (73) 16 (76) 17 (74) 239 (83) Missing 1 1 1 4
Tp53 rs1042522 GG 4 (15) 4 (18) 4 (17) 12 (4) CG 10 (37) 9 (41) 9 (38) 117 (40) CC * 13 (48) 9 (41) 11 (46) 160 (55)
XRCC1 rs25489 AG 27 (100) 22 (100) 24 (100) 239 (84) GG 0 0 0 7 (2) AA * 0 0 0 37 (13) Missing 0 0 0 9
rs1799782 AA 3 (11) 2 (9) 2 (8) 1 (0.3) AG 1 (4) 0 0 23 (7) GG * 23 (85) 20 (91) 22 (92) 267 (91) Missing 0 0 0 1
rs25487 AA 4 (15) 4 (18) 4 (17) 42 (14) AG 9 (33) 9 (41) 8 (33) 125 (43) GG * 14 (52) 9 (41) 12 (50) 120 (41) Missing 0 0 0 5
1. Susceptible genes to mutagenic chemicals and Single Nucleotide Polymorphisms (SNPs) with rs number; 2. All MPN cases include PV, ET and PMF, confirmed cases by expert panel, confirmed JAK2 V617F
mutation with PV, ET or PMF confirmed by expert panel, confirmed by expert panel PV cases only.
Int. J. Environ. Res. Public Health 2015, 12 2483
References
1. Campbell, P.J.; Green, A.R. Management of polycythemia vera and essential thrombocythemia.
Hematol. Am. Soc. Hematol. Educ. Progr. 2005, 2005, 201–208.
2. Kutti, J.; Ridell, B. Epidemiology of the myeloproliferative disorders: Essential
thrombocythaemia, polycythaemia vera and idiopathic myelofibrosis. Pathol. Biol. 2001, 49, 164–
166.
3. Vardiman, J.W.; Thiele, J.; Arber, D.A.; Brunning, R.D.; Borowitz, M.J.; Porwit, A.; Harris, N.L.;
le Beau, M.M.; Hellström-Lindberg, E.; Tefferi, A.; Bloomfield, C.D. The 2008 revision of the
World Health Organization (WHO) classification of myeloid neoplasms and acute leukemia:
rationale and important changes. Blood 2009, doi:10.1182/blood-2009-03-209262.
4. Anderson, L.A.; Duncombe, A.S.; Hughes, M.; Mills, M.E.; Wilson, J.C.; McMullin, M.F.
Environmental, lifestyle, and familial/ethnic factors associated withmyeloproliferative neoplasms.
Am. J. Hematol. 2012, 87, 175–182.
5. Langabeer, S.; Ni Ainle, F.; Conneally, E.; Lawler, M. Incidence and significance of the JAK2
V617F mutation in patients with chronic myeloproliferative disorders. Ir. J. Med. Sci. 2007, 176,
105–109.
6. Spivak, J.L. Narrative review: Thrombocytosis, polycythemia vera, and JAK2 mutations:
The phenotypic mimicry of chronic myelofibrosis. Ann. Intern. Med. 2010, 152, 300–306.
7. Kralovics, R.; Passamonti, F.; Buser, A.S.; Teo, S.; Tiedt, R.; Passweg, J.R.; Tichelli, A.; Cazzola, M.;
Skoda, R.C. A gain-of-function mutation of JAK2 in myeloproliferative disorders. N. Engl. J.
Med. 2005, 352, 1779–1790.
8. Tefferi, A.; Thiele, J.; Orazi, A.; Kvasnicka, H.M.; Barbui, T.; Hanson, C.A.; Barosi, G.;
Verstovsek, S.; Birgegard, G.; Mesa, R.; et al. Proposals and rationale for revision of the World
Health Organization diagnostic criteria for polycythemia vera, essential thrombocythemia, and
primary myelofibrosis: Recommendations from an ad hoc international expert panel. Blood 2007,
110, 1092–1097.
9. Baxter, E.J.; Scott, L.M.; Campbell, P.J.; East, C.; Fourouclas, N.; Swanton, S.; Vassiliou, G.S.;
Bench, A.J.; Boyd, E.M.; Curtin, N. Acquired mutation of the tyrosine kinase JAK2 in human
myeloproliferative disorders. Lancet 2005, 365, 1054–1061.
10. Landgren, O.; Goldin, L.R.; Kristinsson, S.Y.; Helgadottir, E.A.; Samuelsson, J.; Bjiou, G.S.;
Bench, A.J.; Boyd, E.M. Increased risks of Curtolycythemia vera, essential thrombocythemia, and
myelofibrosis among 24,577 first-degree relatives of 11,039 patients with myeloproliferative
neoplasms in Sweden. Blood 2008, 112, doi:10.1182/blood-2008-03-143602.
11. Andrikovics, H.; Nahajevszky, S.; Koszarska, M.; Meggyesi, N.; Bors, A.; Halm, G.; Tordai, A.
JAK2 46/1 haplotype analysis in myeloproliferative neoplasms and acute myeloid leukemia.
Leukemia 2010, 24, 1809–1813.
12. Thier, R.; Brüning, T.; Roos, P.H.; Rihs, H.P.; Golka, K.; Ko, Y.; Bolt, H.M. Markers of genetic
susceptibility in human environmental hygiene and toxicology: The role of selected CYP, NAT
and GST genes. Int. J. Hyg. Environ. Health 2003, 206, 149–171.
Int. J. Environ. Res. Public Health 2015, 12 2484
13. Burstyn, I.; Kim, H.-M.; Yasui, Y.; Cherry, N.M. The virtues of a deliberately mis-specified
disease model in demonstrating a gene-environment interaction. Occup. Environ. Med. 2009, 66,
374–380.
14. Gustafson, P.; Burstyn, I. Bayesian inference of gene–environment interaction from incomplete
data: What happens when information on environment is disjoint from data on gene and disease?
Stat. Med. 2011, 30, 877–889.
15. Luo, H.; Burstyn, I.; Gustafson, P. Investigations of gene-disease associations: Costs and benefits
of environmental data. Epidemiology 2013, 24, 562–568.
16. Heavner, K.; Gross-Davis, C.A.; Frank, A.; Newschaffer, C.; Klotz, J.; Burstyn, I. Working
environment and myeloproliferative neoplasm: A population-based case-control study following a
cluster investigation. Am. J. Ind. Med. 2014, submitted.
17. Pennsylvania Cancer Registry (PCR). Appendix B: Title 28, Part III, Chapter 27 Communicable
and Noncommunicable Diseases, Section 27.31; PCR: Harrisburg, PA, US, 2006.
18. Seaman, V.; Jumaan, A.; Yanni, E.; Lewis, B.; Neyer, J.; Roda, P.; Hoffman, R. Use of molecular
testing to identify a cluster of patients with polycythemia vera in eastern Pennsylvania. Cancer
Epidemiol. Biomark. Prev. 2009, 18, 534–540.
19. Buchanich, J.; Mertz, K. Updated and expanded study of polycythemia vera and other
myeloproliferative neoplasms in the tri-county area. In Final Report to Pennsylvania Department
of Health; University of Pittsburg, Pittsburg, PA, USA, 2013.
20. GVS:Genome Variation Server, GVS . Available online: http://gvs.gs.washington.edu/GVS141/
(accessed between September 2010 and February 2011).
21. Dong, L.M.; Potter, J.D.; White, E.; Ulrich, C.M.; Cardon, L.R.; Peters, U. Genetic susceptibility
to cancer. JAMA 2008, 299, 2423–2436.
22. Hung, R.J.; Boffetta, P.; Brockmoller, J.; Butkiewicz, D.; Cascorbi, I.; Clapper, M.L.; Garte, S.;
Haugen, A.; Hirvonen, A.; Anttila, S. CYP1A1 and GSTM1 genetic polymorphisms and lung
cancer risk in Caucasian non-smokers: A pooled analysis. Carcinogenesis 2003, 24, 875–882.
23. Garcia-Closas, M.; Rothman, N.; Figueroa, J.D.; Prokunina-Olsson, L.; Han, S.S.; Baris, D.;
Jacobs, E.J.; Malats, N.; de Vivo, I.; Albanes, D. Common genetic polymorphisms modify the
effect of smoking on absolute risk of bladder cancer. Cancer Res. 2013, 73, 2211–2220.
24. Miller, S.A.; Dykes, D.D.; Polesky, H.F. A simple salting out procedure for extracting DNA from
human nucleated cells. Nucleic Acids Res. 1988, 16, 1215.
25. Kaplan, S.D. Update of a mortality study of workers in petroleum refineries. J. Occup. Med. 1986, 28,
514–516.
26. Zoloth, S.R.; Michaels, D.M.; Villalbi, J.R.; Lacher, M. Patterns of mortality among commercial
pressmen. J. Natl. Cancer Inst. 1986, 76, 1047–1051.
27. Johnson, E.S.; Zhou, Y.; Lillian Yau, C.; Prabhakar, D.; Ndetan, H.; Singh, K.; Preacely, N.
Mortality from malignant diseases—Update of the Baltimore union poultry cohort. Cancer
Causes Control 2010, 21, 215–221.
28. Pasqualetti, P.; Casale, R.; Colantonio, D.; Collacciani, A. Occupational risk for hematological
malignancies. Am. J. Hematol. 1991, 38, 147–149.

Int. J. Environ. Res. Public Health 2015, 12 2485
29. Schnatter, R.; Glass, D.C.; Tang, G.; Irons, R.D.; Rushton, L. Myelodysplastic syndrome and benzene
exposure among petroleum workers: An international pooled analysis. J. Natl. Cancer Inst. 2012,
104, 1724–1737.
30. Moore, L.E.; Baris, D.R.; Figueroa, J.D.; Garcia-Closas, M.; Karagas, M.R.; Schwenn, M.R.;
Johnson, A.T.; Lubin, J.H.; Hein, D.W.; Dagnall, C.L.; et al. GSTM1 null and NAT2 slow
acetylation genotypes, smoking intensity and bladder cancer risk: Results from the New England
bladder cancer study and NAT2 meta-analysis. Carcinogenesis 2011, 32, 182–1989.
31. Hirabayashi, Y. p53-dependent gene profiling for reactive oxygen species after benzene
inhalation: Special reference to genes associated with cell cycle regulation. Chem. Biol. Interact.
2005, 153, 165–170.
32. Quiroga Micheo, E.; Calcagno, E.J.; Calabria, S.I.; Besuschio, S.C.; Magnasco, J.H.;
Sackmann Muriel, F.; Maccione, E.; Barros, C.; Santoro, A.; de Soto, Z.C. Retrospective
epidemiological study of hemopoietic system neoplasms in Argentina. Medicina 1981, 41, 187–200.
33. Mele, A.; Visani, G.; Pulsoni, A.; Monarca, B.; Castelli, G.; Stazi, M.A.; Gentile, G.; Mandelli, F.
Risk factors for essential thrombocythemia: A case–control study. Cancer 1996, 77, 2157–2161.
34. Vakil, E.; Tefferi, A. BCR-ABL1—Negative myeloproliferative neoplasms: A review of
molecular biology, diagnosis, and treatment. Clin. Lymphoma Myeloma Leuk. 2011, 11, S37–S45.
35. Smith, G.D.; Palmer, L.; Burton, P. An Introduction to Genetic Epidemiology; Policy Press,
University of Bristol: Bristol, UK, 2011; pp. 140–141.
36. Deitz, A.C.; Rothman, N.; Rebbeck, T.R.; Hayes, R.B.; Chow, W.H.; Zheng, W.; Hein, D.W.;
García-Closas, M. Impact of misclassification in genotype-exposure interaction studies: Example
of N-acetyltransferase 2 (NAT2), smoking, and bladder cancer. Cancer Epidemiol. Biomark. Prev.
2004, 13, 1543–1546.
37. Hunter, D.J. Gene–environment interactions in human diseases. Nat. Rev. Genet. 2005, 6, 287–
298.
© 2015 by the authors; licensee MDPI, Basel, Switzerland. This article is an open access article
distributed under the terms and conditions of the Creative Commons Attribution license
(http://creativecommons.org/licenses/by/4.0/).