the role of dna in kinship analysis · 2017-12-20 · the role of dna in kinship analysis kristen...
TRANSCRIPT

The Role of DNA in Kinship Analysis
Kristen E. Lewis, Ph.D.
National Institute of Standards and Technology
Biochemical Science Division
Applied Genetics Group – DNA Biometrics Project
Lockheed Martin BEACON Lecture
April 14, 2010
Outline
• Forensic DNA analysis / DNA biometrics
• Complex kinship testing
• Kinship analysis software
Forensic DNA Analysis
DNA Biometrics

Steps in Forensic DNA Analysis
DNA
Extraction
Multiplex PCR Amplification
Interpretation of Results
Sample Collection
& Storage
Buccal swabBlood Stain
DNA
Quantitation
Usually 1-2 day process (a minimum of ~8 hours)
Statistics Calculated
DNA database search
Paternity test
Reference sample
Applied Use of Information
STR Typing
DNA separation and sizingTechnology
Biology
Genetics

Forensic DNA Typing
A common set of 13 Short Tandem Repeat (STR)
markers (“CODIS loci”) are genotyped to search
state and national databases
Example of 6 markers + sex-typing marker
14,15 17,18 23,24
X,X 13,13 30,30 15,19
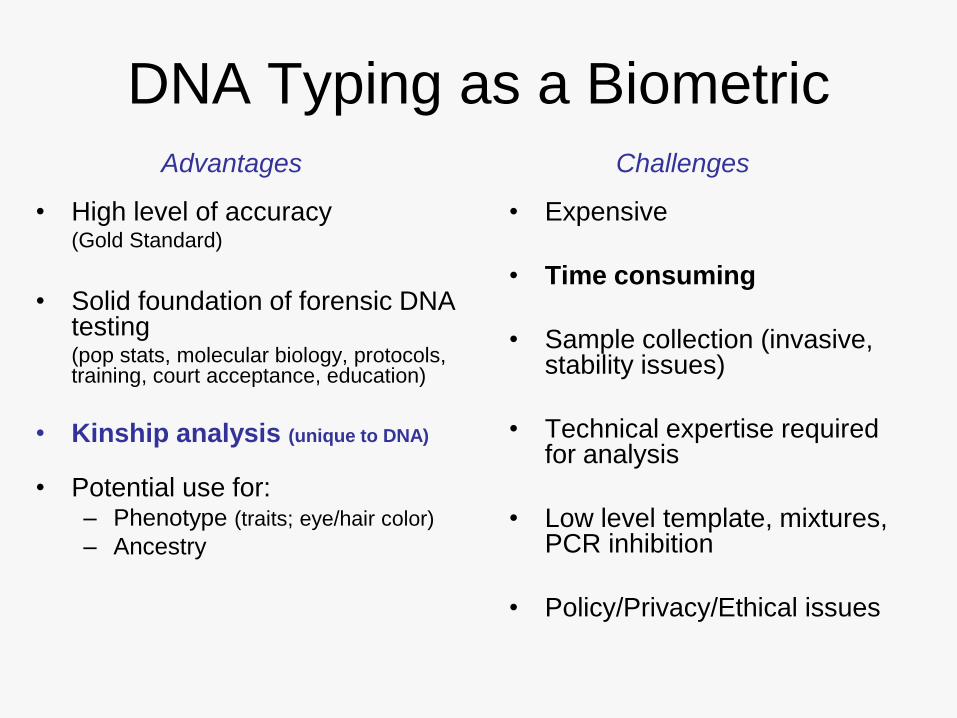
DNA Typing as a Biometric
• High level of accuracy (Gold Standard)
• Solid foundation of forensic DNA testing (pop stats, molecular biology, protocols, training, court acceptance, education)
• Kinship analysis (unique to DNA)
• Potential use for:– Phenotype (traits; eye/hair color)
– Ancestry
• Expensive
• Time consuming
• Sample collection (invasive, stability issues)
• Technical expertise required for analysis
• Low level template, mixtures, PCR inhibition
• Policy/Privacy/Ethical issues
Advantages Challenges
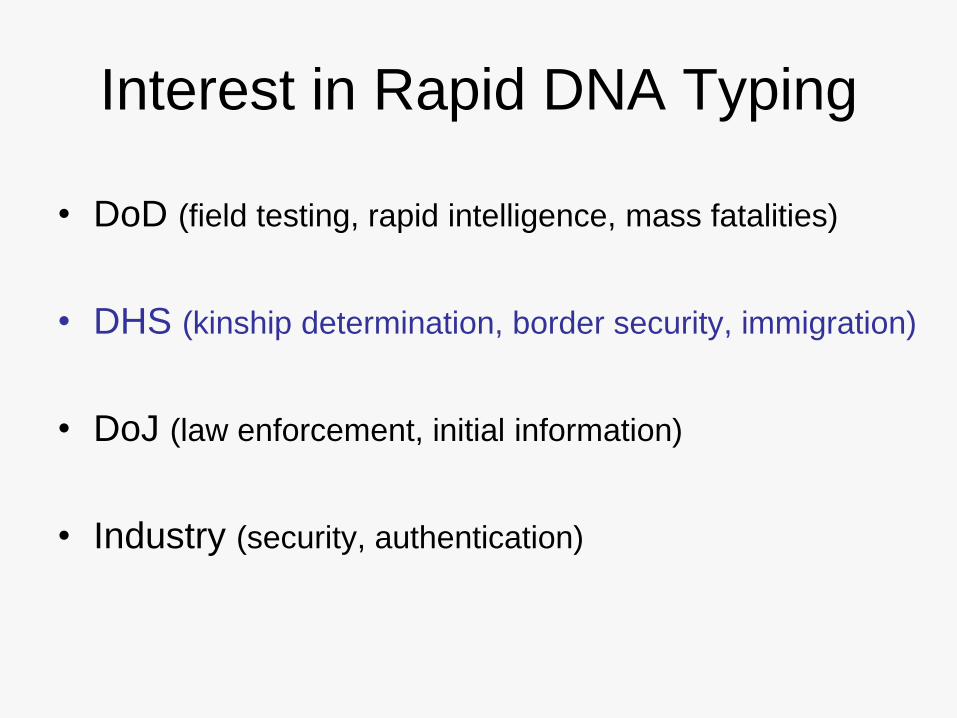
Interest in Rapid DNA Typing
• DoD (field testing, rapid intelligence, mass fatalities)
• DHS (kinship determination, border security, immigration)
• DoJ (law enforcement, initial information)
• Industry (security, authentication)

Rapid DNA Typing Systems
under Development
• Systems are currently under development and are not yet commercially available
• Network Biosystems (Woburn, MA)
http://www.netbio.com
• MicroLab Diagnostics and Lockheed Martin (Charlottesville,VA)
http://www.microlabdiagnostics.com
• Microchip Biotechnologies, Inc. (Pleasanton, CA)
http://www.microchipbiotech.com
• Forensic Science Service (UK)
http://www.forensic.gov.uk/
Use of DNA as a Biometric Tool American Academy of Forensic Science, Feb 22, 2010, Seattle, WAhttp://www.cstl.nist.gov/biotech/strbase/NISTpub.htm

Complex Kinship
Analysis

Using DNA to Detect Genetic Relationships
• DNA profiles can be used to evaluate the probability of a specific kinship relationship
• Various situations– Paternity (civil and criminal)
– Familial searching
– Mass disasters
– Unidentified human remains
– Inheritance
– Immigration
– Military intelligence
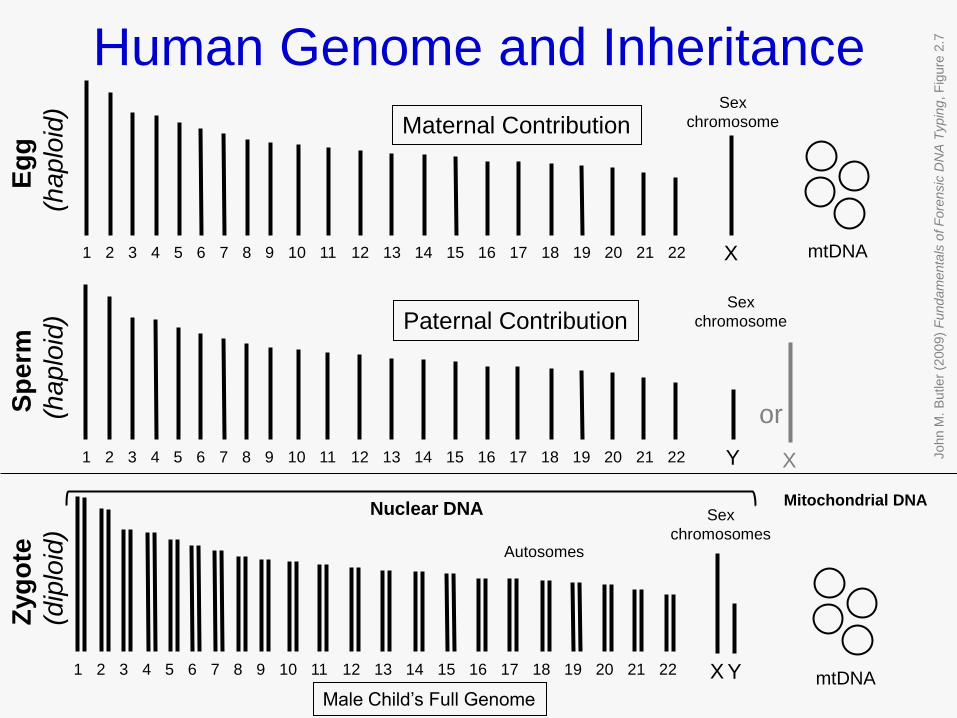
1 2 3 4 5 6 7 8 9 1110 12 13 14 15 16 17 18 19 20 21 22 X mtDNA
Y1 2 3 4 5 6 7 8 9 1110 12 13 14 15 16 17 18 19 20 21 22
Maternal Contribution
Paternal Contribution
X
or
Sex
chromosome
Sex
chromosome
1 2 3 4 5 6 7 8 9 1110 12 13 14 15 16 17 18 19 20 21 22 X Y mtDNAMale Child’s Full Genome
Nuclear DNAMitochondrial DNA
Autosomes
Sex
chromosomes
Zyg
ote
(dip
loid
)
Sp
erm
(ha
plo
id)
Eg
g
(ha
plo
id)
John M
. B
utler
(2009)
Fundam
enta
ls o
f F
ore
nsic
DN
A T
ypin
g, F
igure
2.7Human Genome and Inheritance
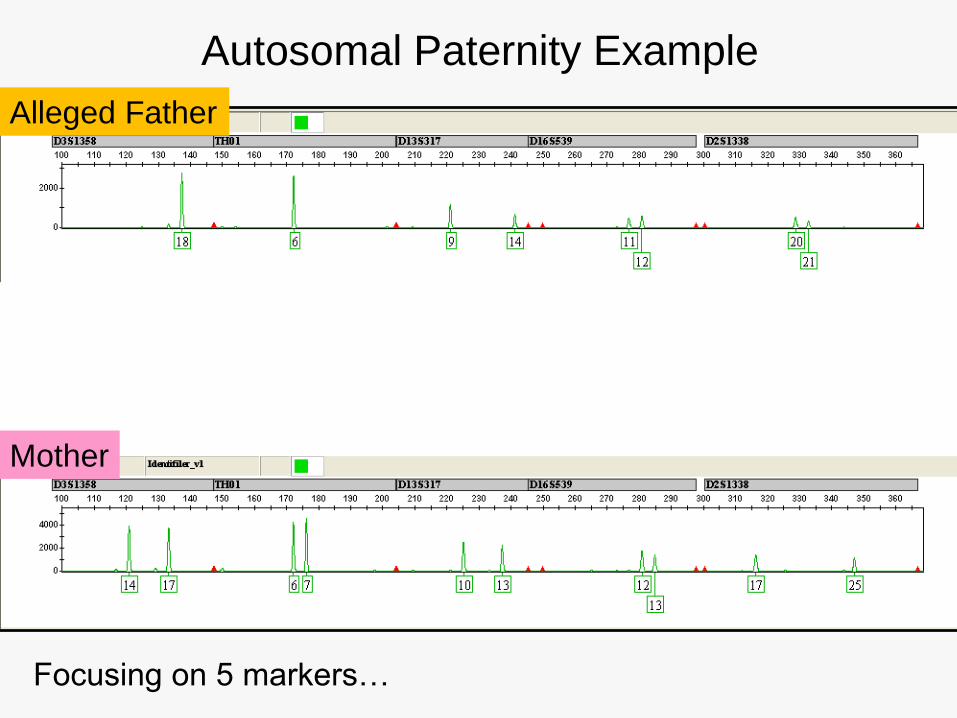
Alleged Father
Autosomal Paternity Example
Focusing on 5 markers…
Mother

Alleged Father
Mother
Child
Autosomal Paternity Example
Focusing on 5 STR markers…
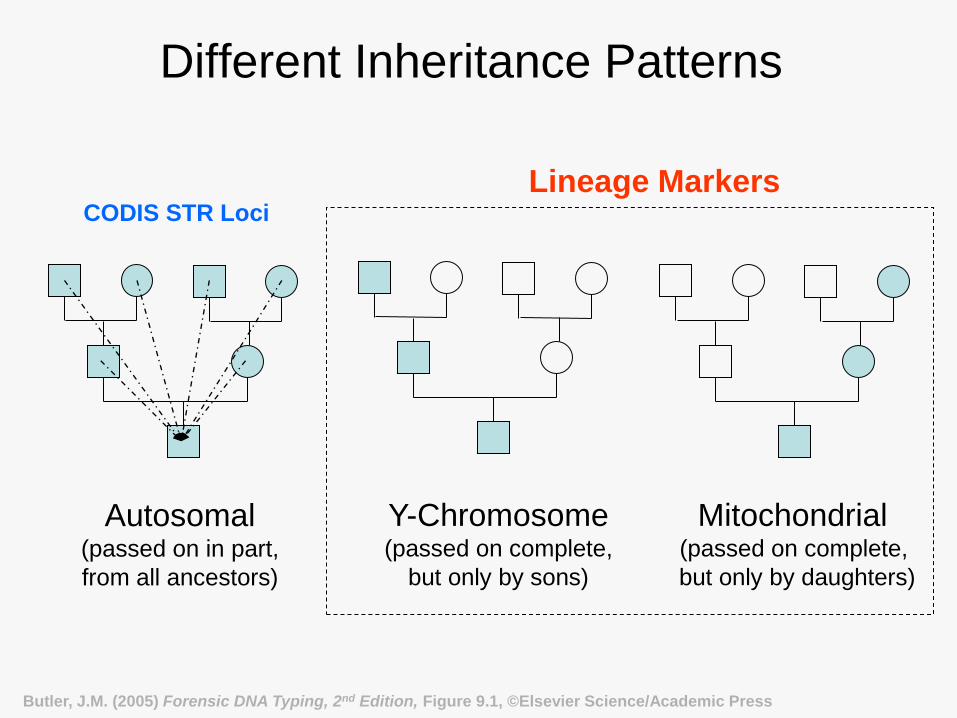
Autosomal(passed on in part,
from all ancestors)
Y-Chromosome(passed on complete,
but only by sons)
Mitochondrial (passed on complete,
but only by daughters)
Lineage Markers
Butler, J.M. (2005) Forensic DNA Typing, 2nd Edition, Figure 9.1, ©Elsevier Science/Academic Press
Different Inheritance Patterns
CODIS STR Loci

Mutation of STR Markers
12,15 8,13
13,13
F M
C?

Mutation of STR Markers
12,15 8,13
13,13
• Typically observe 1-step mutations (99%)
• Gain or loss of repeat unit possible
• Average STR mutation frequency = 0.001
• Must factor in mutation for kinship analyses
F M
C?
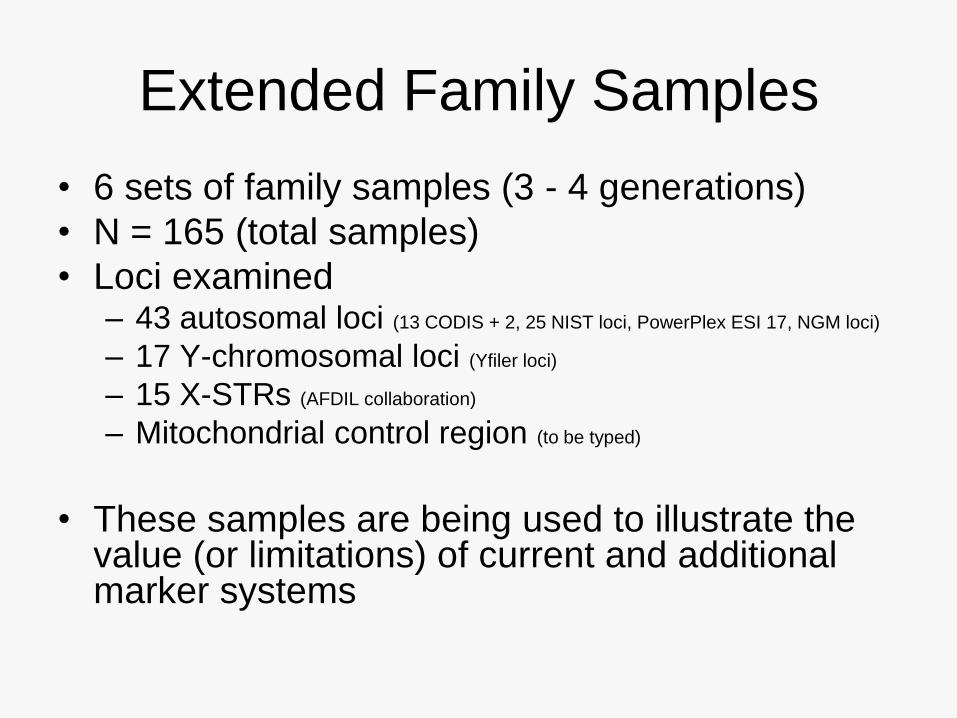
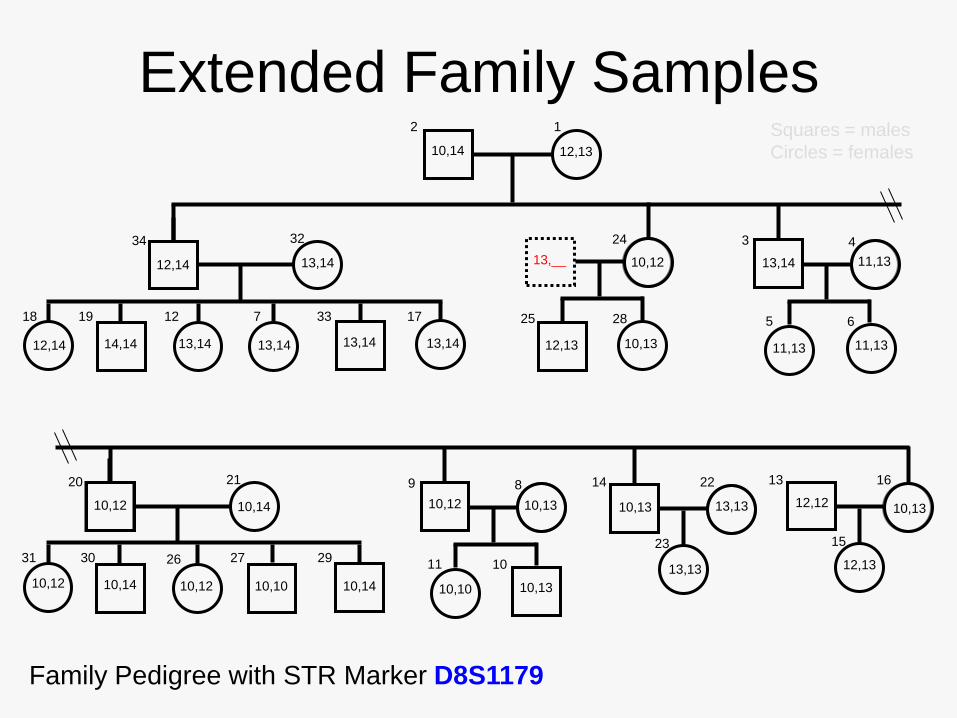
Extended Family Samples
• 6 sets of family samples (3 - 4 generations)
• N = 165 (total samples)
• Loci examined– 43 autosomal loci (13 CODIS + 2, 25 NIST loci, PowerPlex ESI 17, NGM loci)
– 17 Y-chromosomal loci (Yfiler loci)
– 15 X-STRs (AFDIL collaboration)
– Mitochondrial control region (to be typed)
• These samples are being used to illustrate the value (or limitations) of current and additional marker systems
2 1
24
25 283318 19 12 7 17
34 32 4
5 6
3
8
11 10
9 16
15
1322
23
14
2931 30 26 27
20 21
Squares = males
Circles = females10,14 12,13
12,14 13,14 10,12
12,12
13,14 13,14 13,14
13,13
13,__
12,14 12,13 10,13
13,14 11,13
11,13 11,13
10,13
12,13
10,12 10,14 10,12 10,10 10,14
10,12 10,13
10,10 10,13
10,12 10,13
13,1414,14
13,1310,14
Extended Family Samples
Family Pedigree with STR Marker D8S1179
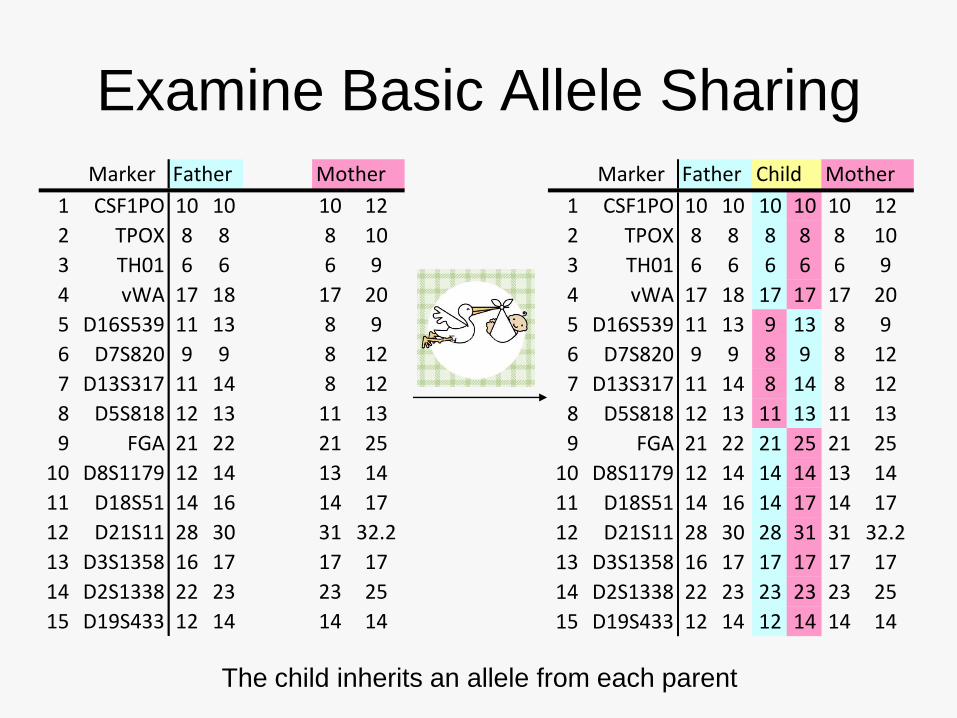
Examine Basic Allele Sharing
Marker Father Mother
1 CSF1PO 10 10 10 12
2 TPOX 8 8 8 10
3 TH01 6 6 6 9
4 vWA 17 18 17 20
5 D16S539 11 13 8 9
6 D7S820 9 9 8 12
7 D13S317 11 14 8 12
8 D5S818 12 13 11 13
9 FGA 21 22 21 25
10 D8S1179 12 14 13 14
11 D18S51 14 16 14 17
12 D21S11 28 30 31 32.2
13 D3S1358 16 17 17 17
14 D2S1338 22 23 23 25
15 D19S433 12 14 14 14
Marker Father Child Mother
1 CSF1PO 10 10 10 10 10 12
2 TPOX 8 8 8 8 8 10
3 TH01 6 6 6 6 6 9
4 vWA 17 18 17 17 17 20
5 D16S539 11 13 9 13 8 9
6 D7S820 9 9 8 9 8 12
7 D13S317 11 14 8 14 8 12
8 D5S818 12 13 11 13 11 13
9 FGA 21 22 21 25 21 25
10 D8S1179 12 14 14 14 13 14
11 D18S51 14 16 14 17 14 17
12 D21S11 28 30 28 31 31 32.2
13 D3S1358 16 17 17 17 17 17
14 D2S1338 22 23 23 23 23 25
15 D19S433 12 14 12 14 14 14
The child inherits an allele from each parent

Siblings and Avuncular Marker Brother Sister
1 CSF1PO 10 10 10 12
2 TPOX 8 8 8 10
3 TH01 6 6 6 9
4 vWA 17 17 17 20
5 D16S539 9 13 9 11
6 D7S820 8 9 9 12
7 D13S317 8 14 11 12
8 D5S818 11 13 11 12
9 FGA 21 25 21 25
10 D8S1179 14 14 13 14
11 D18S51 14 17 14 14
12 D21S11 28 31 30 32
13 D3S1358 17 17 16 17
14 D2S1338 23 23 23 25
15 D19S433 12 14 14 14
Marker Uncle Nephew
1 CSF1PO 10 10 11 12
2 TPOX 8 8 8 10
3 TH01 6 6 6 9.3
4 vWA 17 18 16 17
5 D16S539 11 13 11 13
6 D7S820 9 9 9 11
7 D13S317 11 14 11 12
8 D5S818 12 13 12 12
9 FGA 21 22 20 24
10 D8S1179 12 14 10 13
11 D18S51 14 16 13 13
12 D21S11 28 30 27 31
13 D3S1358 16 17 16 18
14 D2S1338 22 23 18 22
15 D19S433 12 14 14 14

Evaluating Relatedness
• Examining or counting shared alleles is
qualitative
• Likelihood ratio can be used to help
quantify the information
Probability of data under one hypothesis
Probability of data under alternative hypothesisLR =
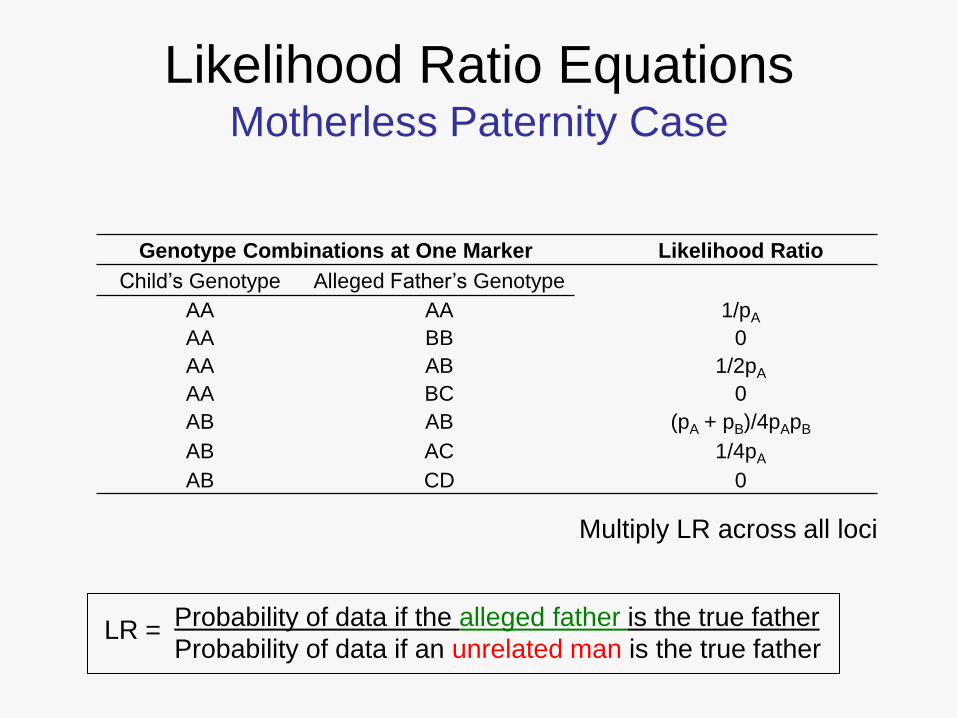
Likelihood Ratio EquationsMotherless Paternity Case
Genotype Combinations at One Marker Likelihood Ratio
Child’s Genotype Alleged Father’s Genotype
AA AA 1/pA
AA BB 0
AA AB 1/2pA
AA BC 0
AB AB (pA + pB)/4pApB
AB AC 1/4pA
AB CD 0
Multiply LR across all loci
Probability of data if the alleged father is the true father
Probability of data if an unrelated man is the true fatherLR =

Allele Sharing Probabilities
Relationship 0 alleles 1 alleles 2 alleles
Parent-child 0 1 0
Full siblings 1/4 1/2 1/4
Half siblings 1/2 1/2 0
Cousins 3/4 1/4 0
Uncle-nephew 1/2 1/2 0
Grandparent-grandchild 1/2 1/2 0
Half siblings, uncle-nephew,
and grandparent-grandchild are genetically identical.

Requirements:• Genotypes of individuals being
tested
• Allele frequencies for the loci
involved in the testing
• A Hypothesis!
• Basic statistical equations are
known
• Difficult to identify distant
relationships
• Discriminatory power comes
from multiple family members
and the use of informative
markers
Complex Kinship Testing
The statistical power for complex
kinship testing significantly decreases
compared to one-to-one matching
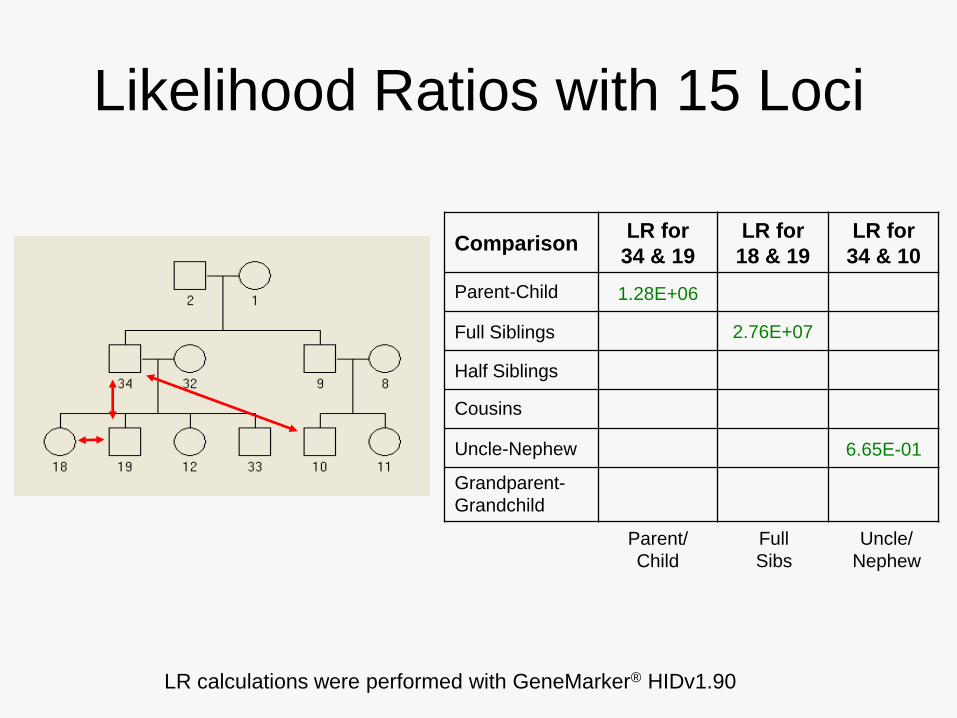
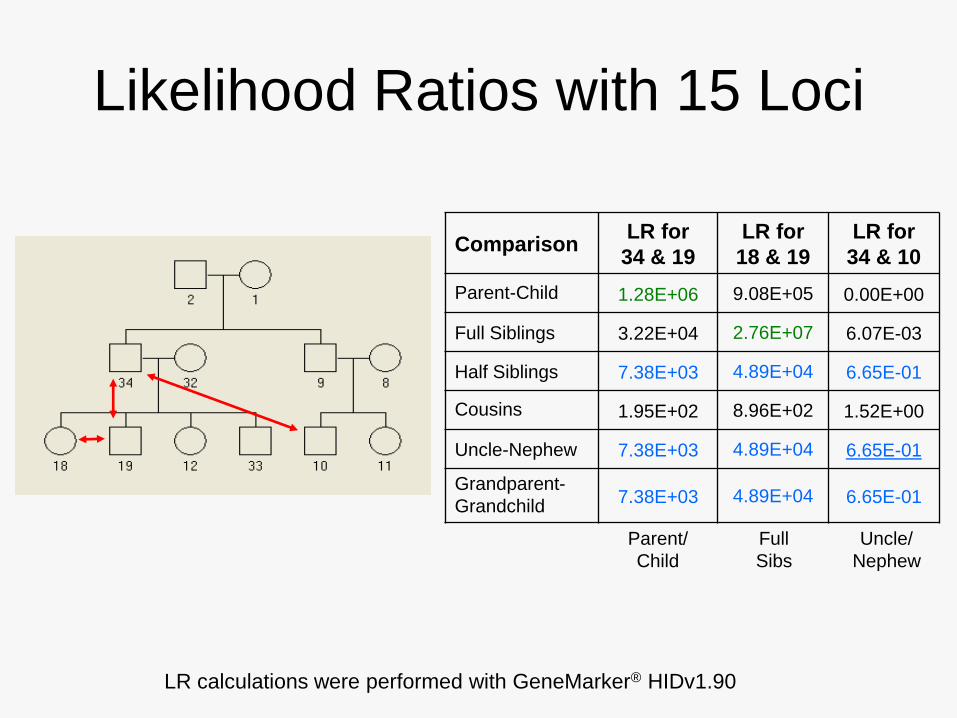
Likelihood Ratios with 15 Loci
ComparisonLR for
34 & 19
LR for
18 & 19
LR for
34 & 10
Parent-Child 1.28E+06
Full Siblings 2.76E+07
Half Siblings
Cousins
Uncle-Nephew 6.65E-01
Grandparent-
Grandchild
Parent/
Child
Full
Sibs
Uncle/
Nephew
LR calculations were performed with GeneMarker® HIDv1.90
ComparisonLR for
34 & 19
LR for
18 & 19
LR for
34 & 10
Parent-Child 1.28E+06 9.08E+05 0.00E+00
Full Siblings 3.22E+04 2.76E+07 6.07E-03
Half Siblings 7.38E+03 4.89E+04 6.65E-01
Cousins 1.95E+02 8.96E+02 1.52E+00
Uncle-Nephew 7.38E+03 4.89E+04 6.65E-01
Grandparent-
Grandchild7.38E+03 4.89E+04 6.65E-01
Likelihood Ratios with 15 Loci
Parent/
Child
Full
Sibs
Uncle/
Nephew
LR calculations were performed with GeneMarker® HIDv1.90

ComparisonLR for
34 & 19
LR for
34 & 19
LR for
18 & 19
LR for
18 & 19
LR for
34 & 10
LR for
34 & 10
Parent-Child 1.28E+06 6.68E+16 9.08E+05 0.00E+00 0.00E+00 0.00E+00
Full Siblings 3.22E+04 5.73E+12 2.76E+07 1.57E+19 6.07E-03 3.30E+03
Half Siblings 7.38E+03 8.63E+11 4.89E+04 4.99E+12 6.65E-01 8.98E+05
Cousins 1.95E+02 1.32E+08 8.96E+02 1.05E+09 1.52E+00 2.17E+04
Uncle-Nephew 7.38E+03 8.63E+11 4.89E+04 4.99E+12 6.65E-01 8.98E+05
Grandparent-
Grandchild7.38E+03 8.63E+11 4.89E+04 4.99E+12 6.65E-01 8.98E+05
Benefit of Additional Loci
Likelihood Ratios with 40 Loci
Parent/
Child
Full
SibsUncle/
Nephew
15 40 15 40 15 40
LR calculations were performed with GeneMarker® HIDv1.90
15 STR loci typed with commercial Identifiler kit
25 STR loci typed with an in-house NIST assayHill, C.R., Butler, J.M., Vallone, P.M. (2009) A 26plex autosomal STR assay to aid human identity testing. J. Forensic Sci. 54(5): 1008-1015.

What would Mitochondrial
sequencing tell you?
Square = male
Circle = female
Mitochondrial DNA is maternally inherited
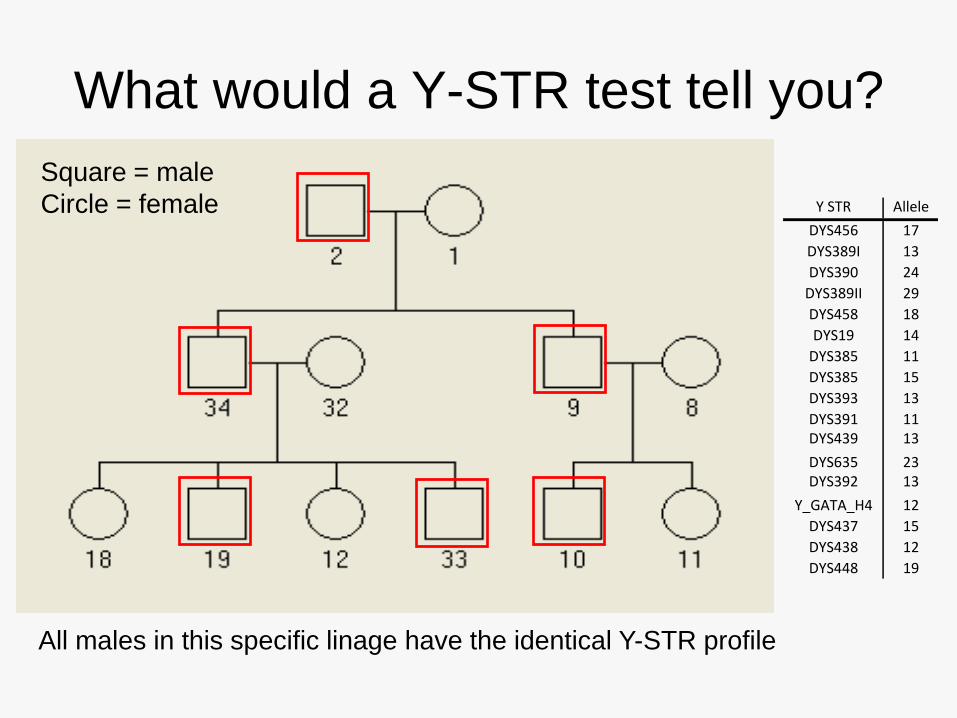
What would a Y-STR test tell you?
Square = male
Circle = female
All males in this specific linage have the identical Y-STR profile
Y STR Allele
DYS456 17
DYS389I 13
DYS390 24
DYS389II 29
DYS458 18
DYS19 14
DYS385 11
DYS385 15
DYS393 13
DYS391 11DYS439 13
DYS635 23DYS392 13
Y_GATA_H4 12
DYS437 15
DYS438 12
DYS448 19

Likelihood Ratios with Y-STR Loci
Y-STR profile frequency = 0.00009
For father-son (34 vs 19):
LR = 1 / 0.00009 = 1.1E+04
LR with 40 autoSTRs = 6.68E+16
For uncle-nephew (34 vs. 10):
LR = 1 / 0.00009 = 1.1E+04
LR with 40 autoSTRs = 8.98E+05
BUT…
For brother vs. sister (19 vs 18):
LR = 0
LR with 40 autoSTRs = 1.57E+19
Y STR Allele
DYS456 17
DYS389I 13
DYS390 24
DYS389II 29
DYS458 18
DYS19 14
DYS385 11
DYS385 15
DYS393 13
DYS391 11DYS439 13
DYS635 23DYS392 13
Y_GATA_H4 12
DYS437 15
DYS438 12
DYS448 19
Lineage markers may not be as statistically robust as autosomal markers,
but they are lineage specific and can link distant relatives.

Frequency of Y-STR and mitochondrial DNA profiles
in the NIST population database (n = 572)
1 2 3 4 5
Number of times a profile is observed in database
96% of Y-STR profiles are unique
84% of mtDNA profiles are unique
0
0.1
0.2
0.3
-18 -14 -10 -6 -2 +2 +6 +10 +14 +18
0
0.1
0.2
0.3
-18 -14 -10 -6 -2 +2 +6 +10 +14 +18
0
0.2
0.4
0.6
0.8
1
-9 -6 -3 0 +3 +6 +9 +12 +15
0
0.2
0.4
0.6
0.8
1
-9 -6 -3 0 +3 +6 +9 +12 +15
0
0.1
0.2
0.3
0.4
0.5
-18 -14 -10 -6 -2 +2 +6 +10 +14 +18
Likelihood ratio (10x)
0
0.1
0.2
0.3
0.4
0.5
-18 -14 -10 -6 -2 +2 +6 +10 +14 +18
Likelihood ratio (10x)
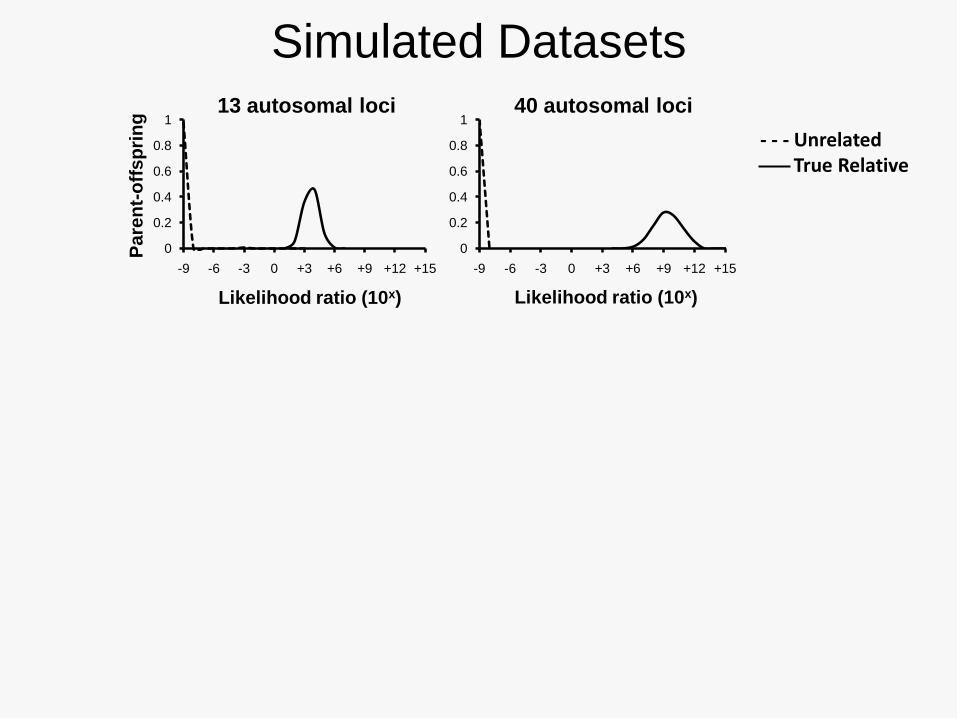
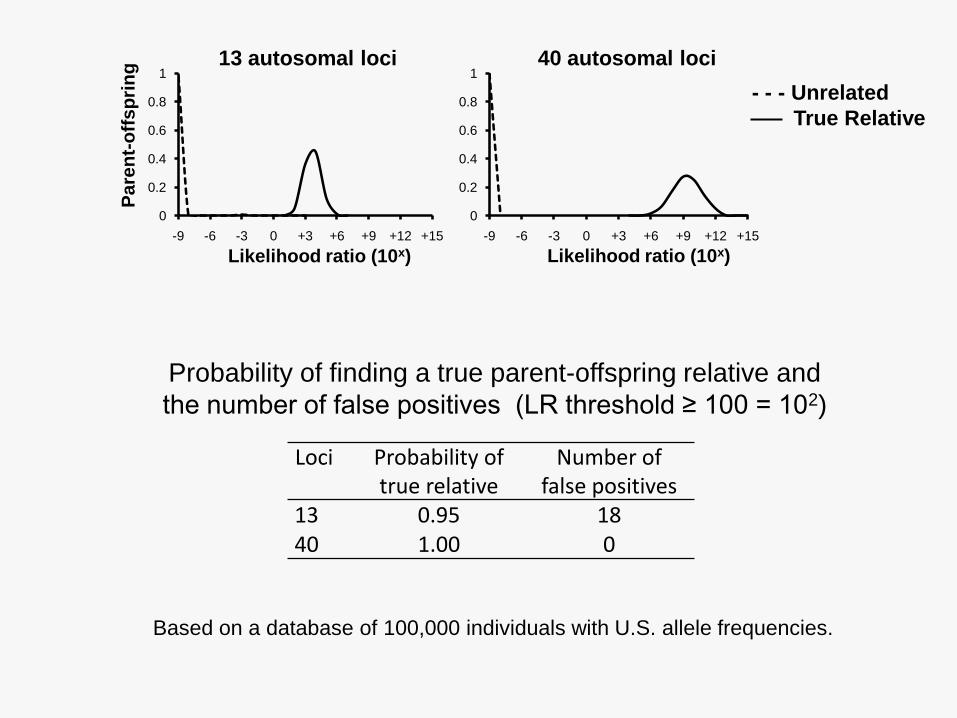
13 autosomal loci 40 autosomal loci
Pa
ren
t-o
ffs
pri
ng
Fu
ll s
ibli
ng
sH
alf
sib
lin
gs
- - - UnrelatedTrue Relative
Simulated Datasets
Likelihood ratio (10x) Likelihood ratio (10x)
0
0.1
0.2
0.3
-18 -14 -10 -6 -2 +2 +6 +10 +14 +18
0
0.1
0.2
0.3
-18 -14 -10 -6 -2 +2 +6 +10 +14 +18
0
0.2
0.4
0.6
0.8
1
-9 -6 -3 0 +3 +6 +9 +12 +15
0
0.2
0.4
0.6
0.8
1
-9 -6 -3 0 +3 +6 +9 +12 +15
0
0.1
0.2
0.3
0.4
0.5
-18 -14 -10 -6 -2 +2 +6 +10 +14 +18
Likelihood ratio (10x)
0
0.1
0.2
0.3
0.4
0.5
-18 -14 -10 -6 -2 +2 +6 +10 +14 +18
Likelihood ratio (10x)
13 autosomal loci 40 autosomal loci
Pa
ren
t-o
ffs
pri
ng
Fu
ll s
iblin
gs
Half
sib
lin
gs
- - - Unrelated
True Relative
Likelihood ratio (10x) Likelihood ratio (10x)
Loci Probability of true relative
Number of false positives
13 0.95 1840 1.00 0
Probability of finding a true parent-offspring relative and
the number of false positives (LR threshold ≥ 100 = 102)
Based on a database of 100,000 individuals with U.S. allele frequencies.
0
0.1
0.2
0.3
-18 -14 -10 -6 -2 +2 +6 +10 +14 +18
0
0.1
0.2
0.3
-18 -14 -10 -6 -2 +2 +6 +10 +14 +18
-9 -6 -3 0 +3 +6 +9 +12 +15-9 -6 -3 0 +3 +6 +9 +12 +15
0
0.1
0.2
0.3
0.4
0.5
-18 -14 -10 -6 -2 +2 +6 +10 +14 +18
Likelihood ratio (10x)
0
0.1
0.2
0.3
0.4
0.5
-18 -14 -10 -6 -2 +2 +6 +10 +14 +18
Likelihood ratio (10x)
13 autosomal loci 40 autosomal loci
Pare
nt
Fu
ll s
ibli
ng
sH
alf
sib
lin
gs
- - - Unrelated
True Relative
Likelihood ratio (10x) Likelihood ratio (10x)
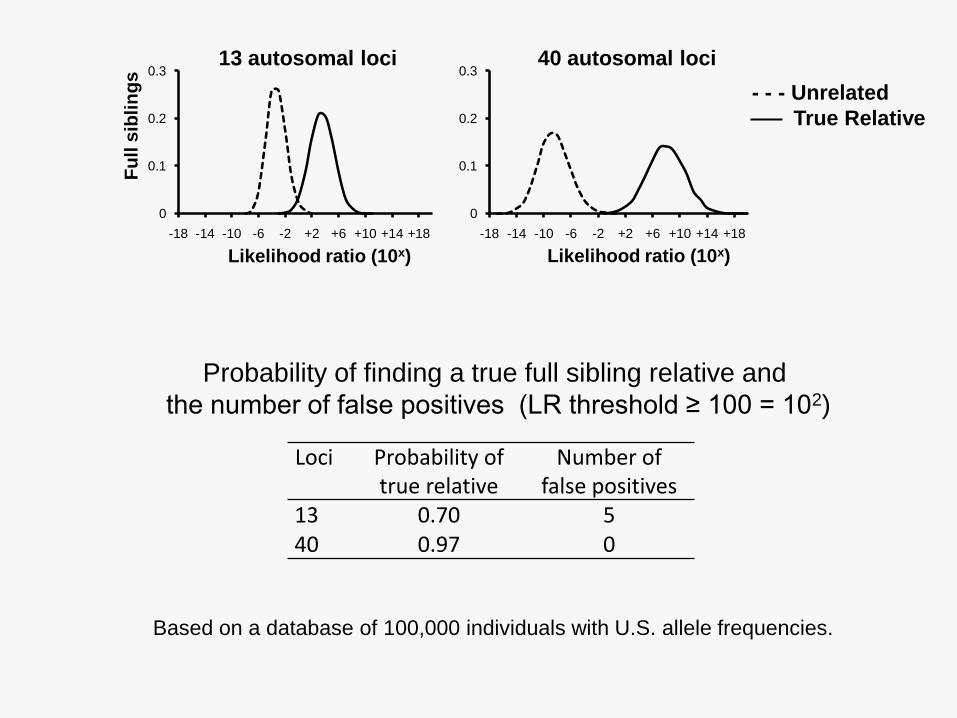
Loci Probability of true relative
Number of false positives
13 0.70 540 0.97 0
Probability of finding a true full sibling relative and
the number of false positives (LR threshold ≥ 100 = 102)
Based on a database of 100,000 individuals with U.S. allele frequencies.
-18 -14 -10 -6 -2 +2 +6 +10 +14 +18-18 -14 -10 -6 -2 +2 +6 +10 +14 +18
0
0.1
0.2
0.3
0.4
0.5
-18 -14 -10 -6 -2 +2 +6 +10 +14 +18
Likelihood ratio (10x)
0
0.1
0.2
0.3
0.4
0.5
-18 -14 -10 -6 -2 +2 +6 +10 +14 +18
Likelihood ratio (10x)
13 autosomal loci 40 autosomal loci
Ha
lf s
ibli
ng
s
- - - Unrelated
True Relative
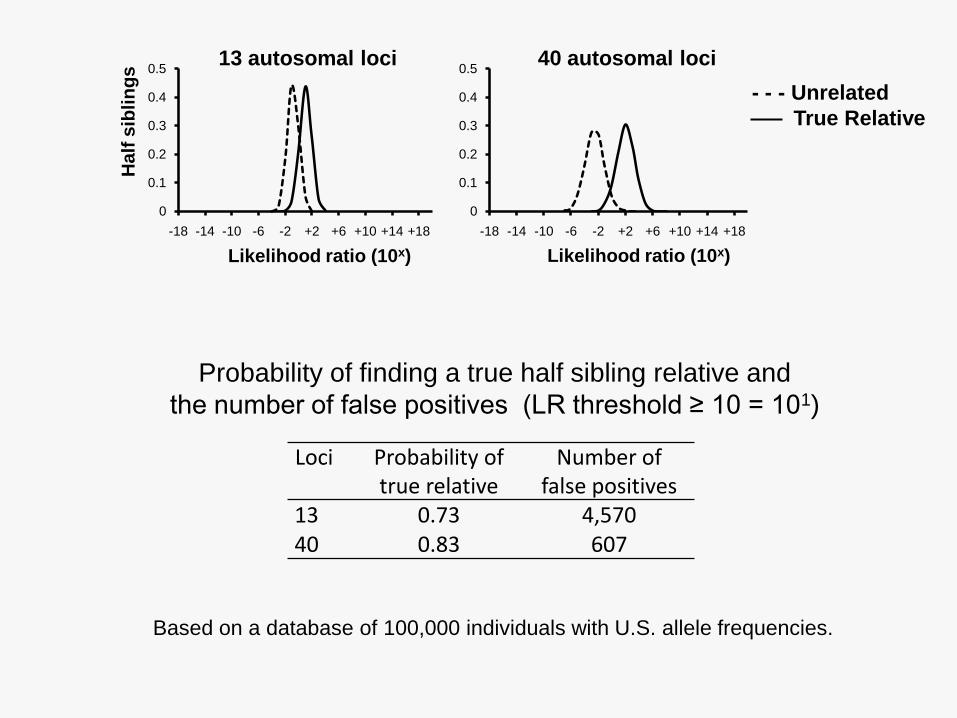
Loci Probability of true relative
Number of false positives
13 0.73 4,57040 0.83 607
Probability of finding a true half sibling relative and
the number of false positives (LR threshold ≥ 10 = 101)
Likelihood ratio (10x) Likelihood ratio (10x)
Based on a database of 100,000 individuals with U.S. allele frequencies.
Immigration:
Kinship Analysis as a DNA Biometric
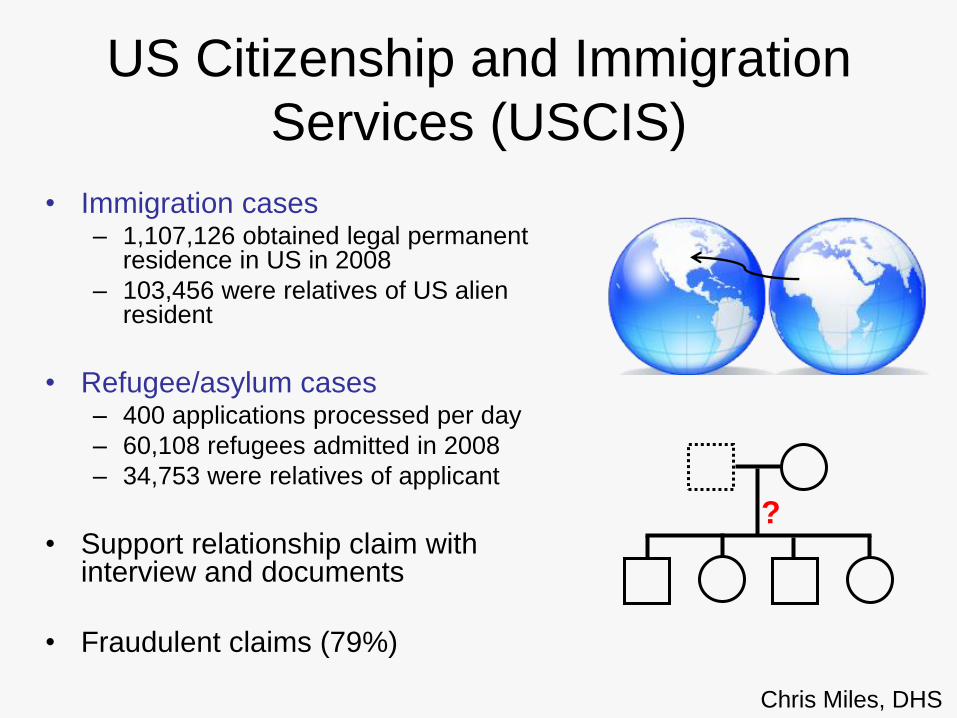
US Citizenship and Immigration
Services (USCIS)
• Immigration cases– 1,107,126 obtained legal permanent
residence in US in 2008
– 103,456 were relatives of US alien resident
• Refugee/asylum cases– 400 applications processed per day
– 60,108 refugees admitted in 2008
– 34,753 were relatives of applicant
• Support relationship claim with interview and documents
• Fraudulent claims (79%)
?
Chris Miles, DHS

Current: Optional DNA Testing for Immigration
• DNA may be used if interview and documents are insufficient
• Number of cases:~ One dozen accredited labs in US
~ 3,500/yr for small lab, ~10,000/yr large lab
• Time: Minimum two-day lab analysis; up to six months to coordinate with embassy
• Cost: $600-$1500 for private lab testing– Applicant pays (usually US resident, “anchor”)
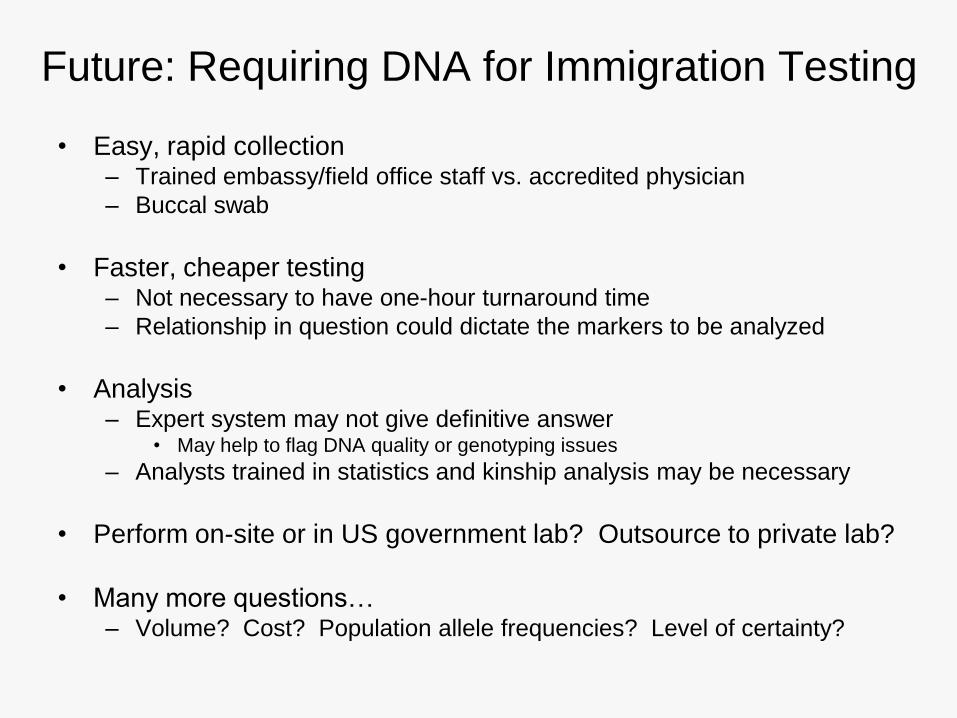
Future: Requiring DNA for Immigration Testing
• Easy, rapid collection– Trained embassy/field office staff vs. accredited physician
– Buccal swab
• Faster, cheaper testing– Not necessary to have one-hour turnaround time
– Relationship in question could dictate the markers to be analyzed
• Analysis– Expert system may not give definitive answer
• May help to flag DNA quality or genotyping issues
– Analysts trained in statistics and kinship analysis may be necessary
• Perform on-site or in US government lab? Outsource to private lab?
• Many more questions…– Volume? Cost? Population allele frequencies? Level of certainty?
Analysis Software

Expert Systems
• Programs that interpret data as a human expert would
• Expert systems for forensic typing (NDIS-approved)– FSS-I3 (FSS/Promega)
– GeneMapper ID-X (Applied Biosystems)
– TrueAllele (CyberGenetics)
• Expert systems for kinship analysis– No program has been designated as an expert
system for automated kinship determination
NIJ Expert System Test (NEST) Project, http://forensics.marshall.edu/NEST/default.html
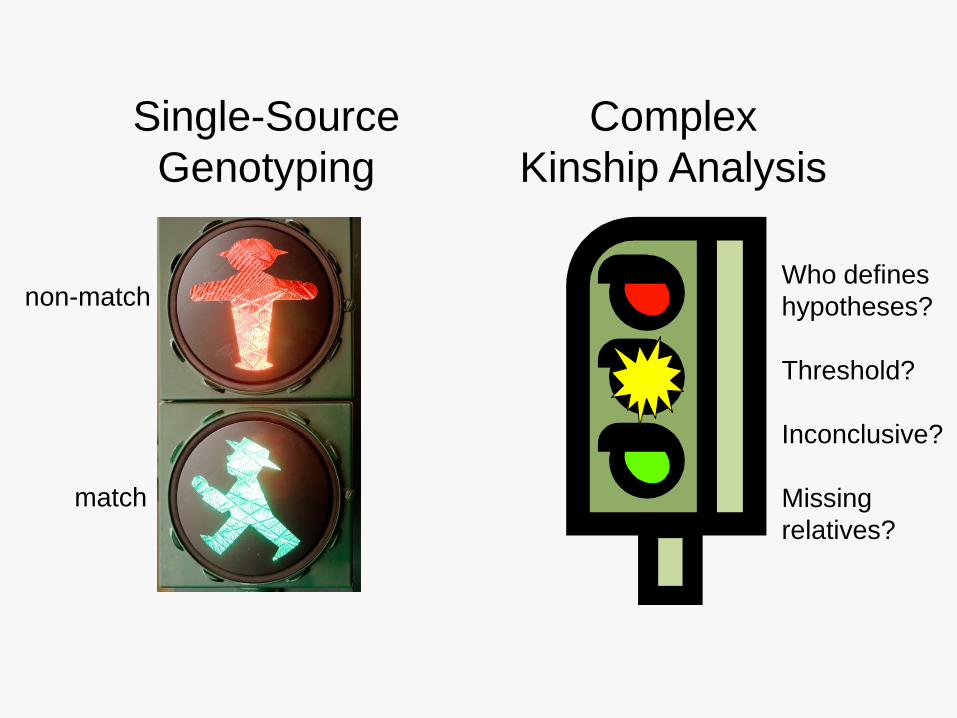
Single-Source
Genotyping
Complex
Kinship Analysis
match
non-matchWho defines
hypotheses?
Threshold?
Inconclusive?
Missing
relatives?

Kinship Analysis Software
• Public/commercial availability1. GeneMarker® HID v1.90 (SoftGenetics)
2. DNA-VIEW™ v29.11 (Charles Brenner)
3. LISA (Future Technologies Inc.)
4. KIn CALc v3.1 (CA DOJ)
• Restricted availability5. CODIS 6.0 (FBI)
• Coming soon6. FSS-ibd (Forensic Science Service)

(1) GeneMarker® HID
• Fragment analysis program, primarily
• Kinship module
– Draw pedigree tree (show inheritance conflicts)
– LR approach
– Pairwise analysis only
• Databases of allele frequencies, loci
– Autosomal STRs, Y-STRs
– No mitochondrial DNA
SoftGenetics: http://www.softgenetics.com/

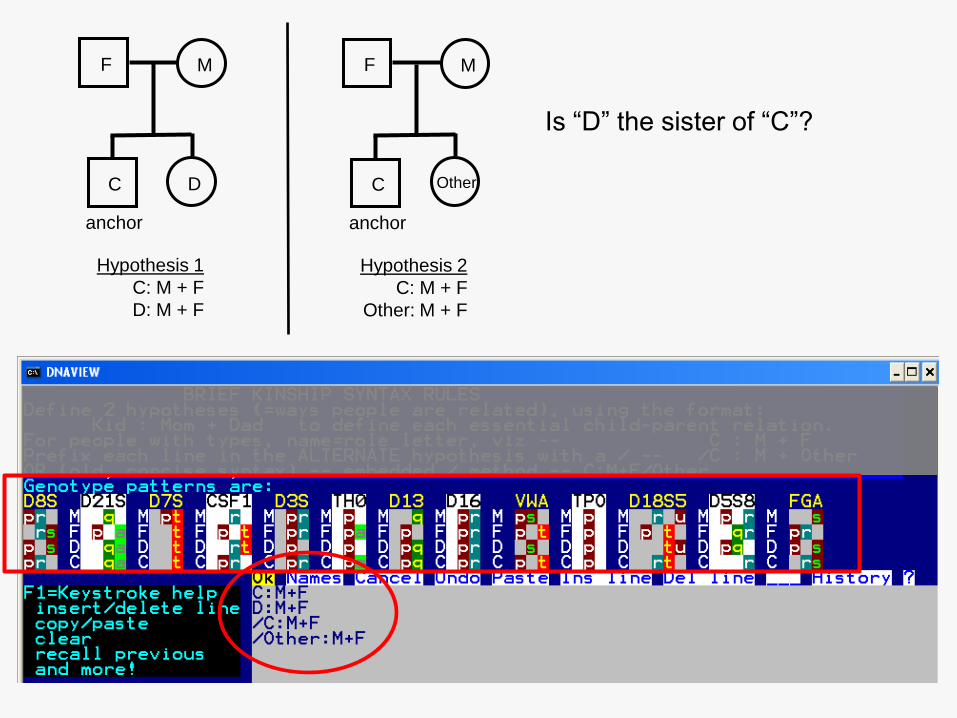
(2) DNA-VIEW™
• DOS, command-line interface
• Kinship modules– Paternity and complex kinship analyses
– Pedigree simulations
– Define relationships (pedigree tree) with symbols
– Use up to 10 relatives in analysis
– LR approach
• Databases of allele frequencies, loci– Autosomal STRs or Y-STRs
– No mitochondrial DNA for kinship
– Mutation considered
Dr. Charles Brenner: http://dna-view.com/
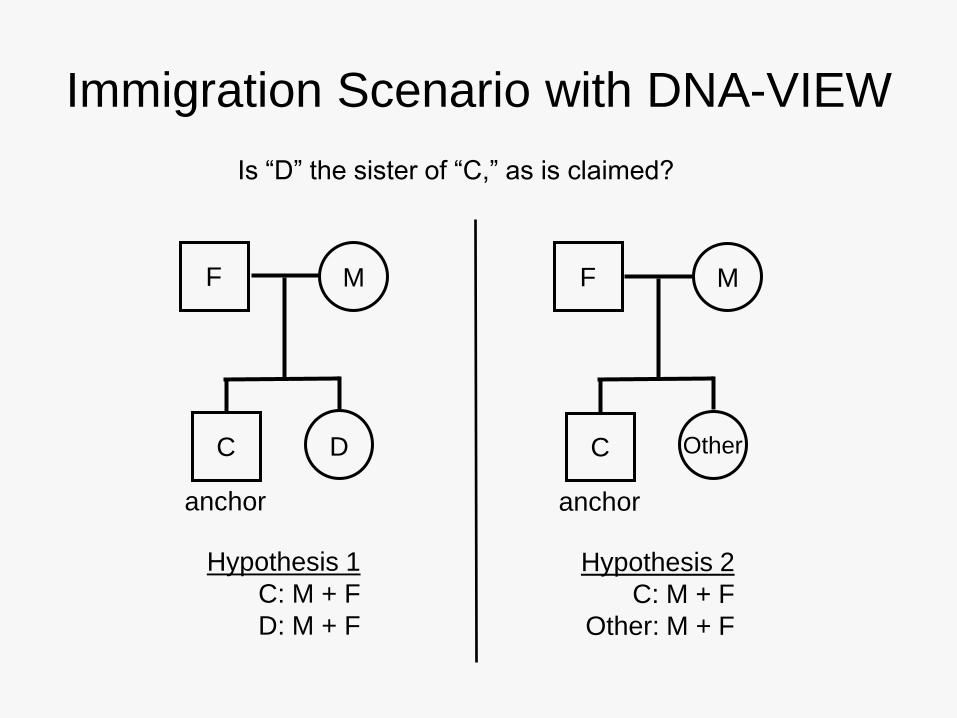
Immigration Scenario with DNA-VIEW
Is “D” the sister of “C,” as is claimed?
anchor
MF
DC
Hypothesis 1
C: M + F
D: M + F
anchor
MF
OtherC
Hypothesis 2
C: M + F
Other: M + F
anchor
MF
DC
Hypothesis 1
C: M + F
D: M + F
anchor
MF
OtherC
Hypothesis 2
C: M + F
Other: M + F
Is “D” the sister of “C”?

anchor
MF
DC
Hypothesis 1
C: M + F
D: M + F
anchor
MF
OtherC
Hypothesis 2
C: M + F
Other: M + F
Is “D” the sister of “C”?

(3) LISA
• Laboratory Information Systems
Application
• Originally developed for AFDIL
• Graphical interface for DNA-VIEW™
• Uses Progeny® to draw pedigree trees
• Autosomal STRs, Y-STRs, mtDNA
Future Technologies Inc.: http://www.ftechi.com/
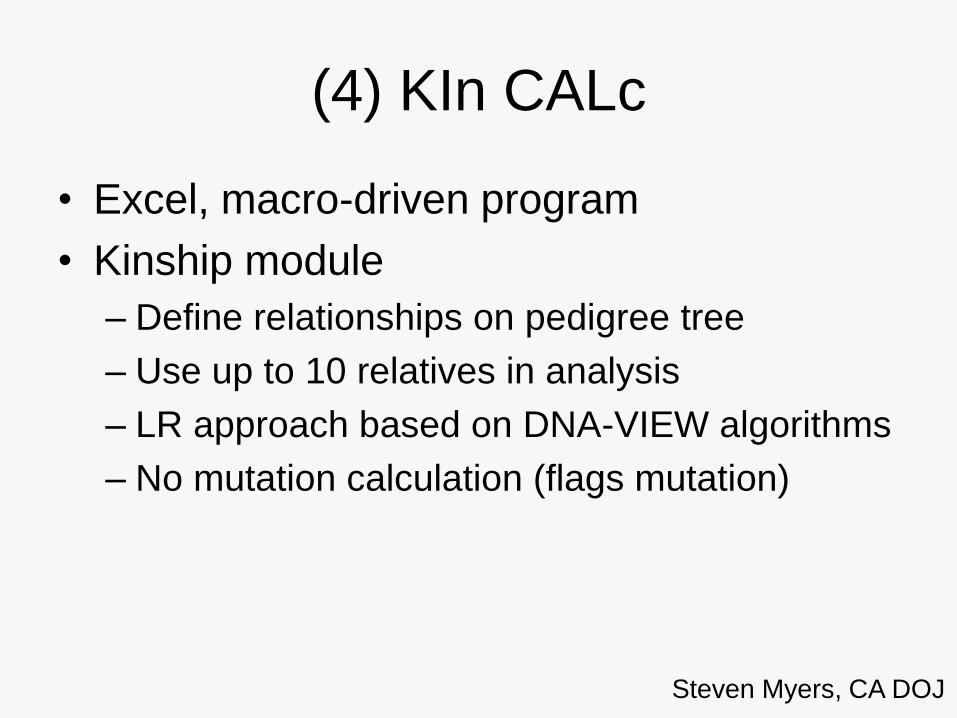
(4) KIn CALc
• Excel, macro-driven program
• Kinship module
– Define relationships on pedigree tree
– Use up to 10 relatives in analysis
– LR approach based on DNA-VIEW algorithms
– No mutation calculation (flags mutation)
Steven Myers, CA DOJ

KIn CALc
MF
DC
DNA-VIEW
pedigree
example…
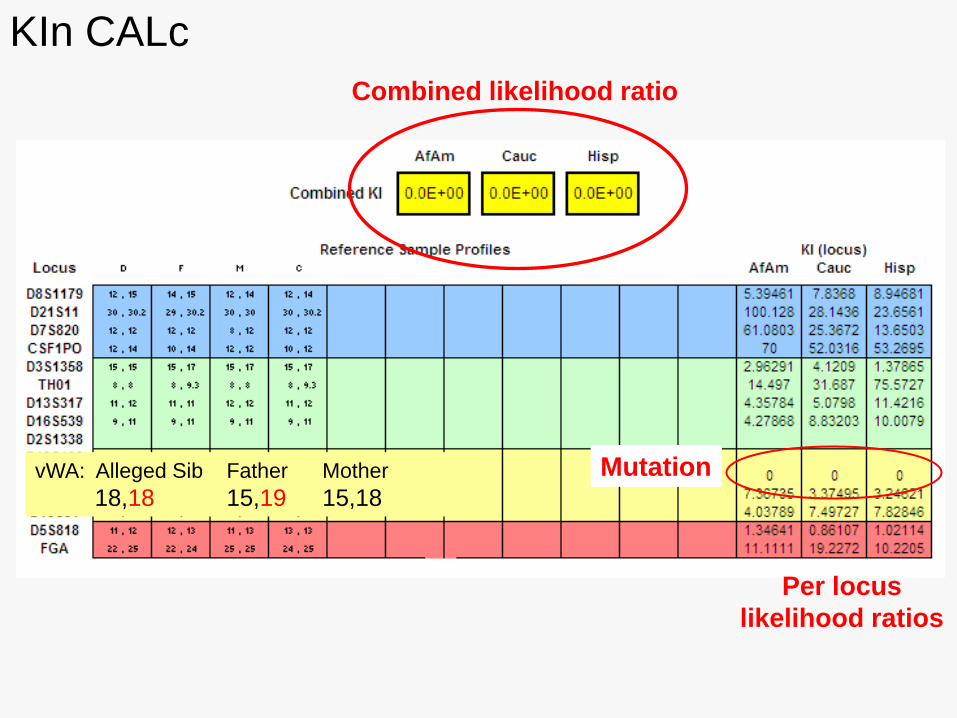
KIn CALc
Mutation
Combined likelihood ratio
Per locus
likelihood ratios
vWA: Alleged Sib Father Mother
18,18 15,19 15,18
(5) CODIS 6.0
• FBI-developed program for missing persons and unidentified human remains identification
• Kinship module
– Draw pedigree tree to define relationships
• Joint Pedigree LR
– Ranks putative relatives
• Database of allele frequencies, loci
– Autosomal STRs, Y-STRs, mtDNA
– Metadata in v. 7.0
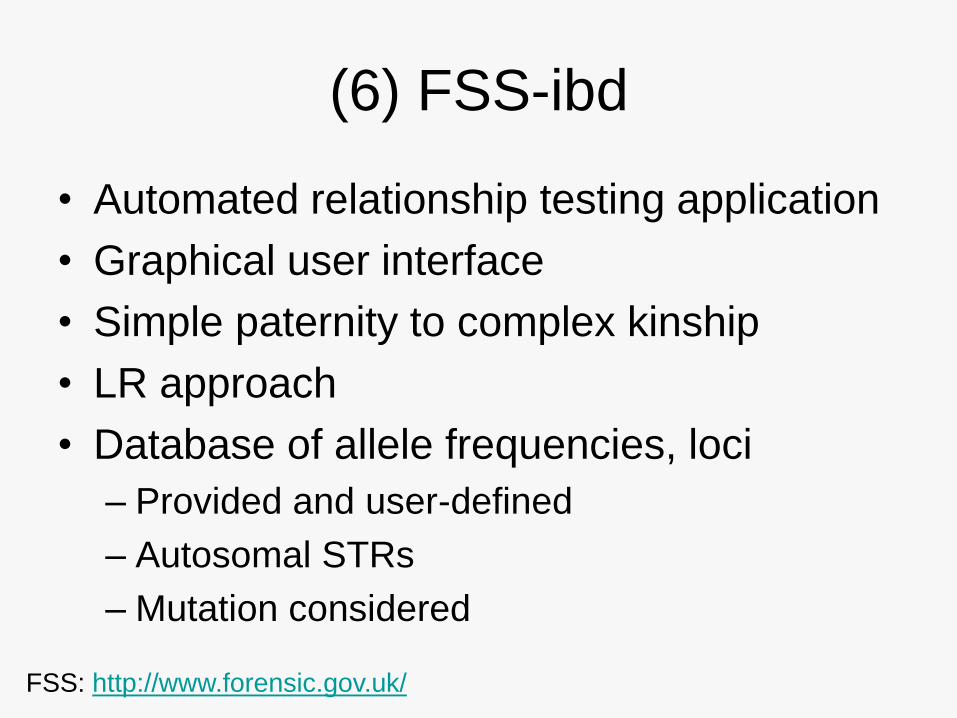
(6) FSS-ibd
• Automated relationship testing application
• Graphical user interface
• Simple paternity to complex kinship
• LR approach
• Database of allele frequencies, loci
– Provided and user-defined
– Autosomal STRs
– Mutation considered
FSS: http://www.forensic.gov.uk/

FSS-ibd
Maguire, C.N., Woodward, M. (2008) DNA-based kinship analysis, Profiles in DNA 11 (1) 4-6.
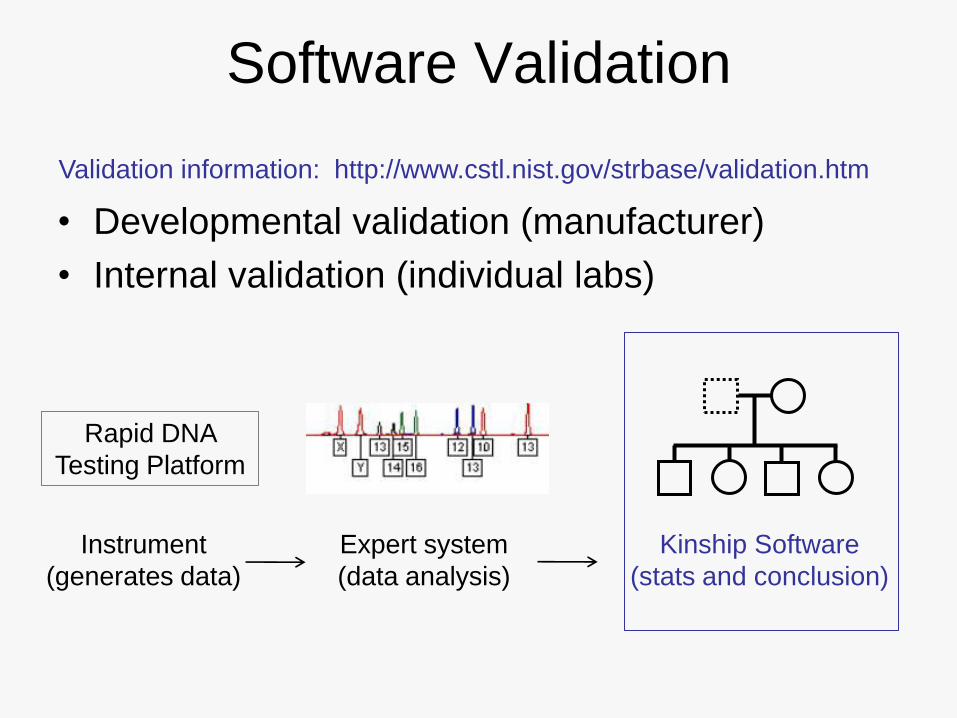
Software Validation
• Developmental validation (manufacturer)
• Internal validation (individual labs)
Instrument
(generates data)
Expert system
(data analysis)
Kinship Software
(stats and conclusion)
Rapid DNA
Testing Platform
Validation information: http://www.cstl.nist.gov/strbase/validation.htm

Internal Validation Considerations for Kinship Software
• Who should recommend validation guidelines for DNA Biometrics and kinship analysis?– For forensic typing: Scientific Working Group on DNA Analysis Methods
– For paternity testing: AABB
• Define case examples to test software– Paternity trios, deficient cases, complex kinship, false relationships
– How many cases are enough?
– Real data, simulated, or both?
• Technical considerations specific to testing– Marker systems, allele frequency data, mutation, LR threshold, etc.
• How do you know your answer is correct?– Compare to hand-calculated answer or to another kinship program?
Drábek J, Validation of software for calculating the likelihood ratio for parentage
and kinship, FSI:Genetics 3 (2009) 112–118

Conclusions
• DNA is a powerful tool to confirm or refute alleged familial relationships– Important to define specific kinship questions
• Simulations with appropriate allele frequency databases can model expected LR values for specific relationships
• Software must be “fit for purpose”
• Can there be an expert system for kinship analysis?
• What are the validation parameters? Who should define validation guidelines?
Thank you for your attention
Acknowledgments:
Dr. Peter Vallone
Erica Butts
Funding:
NRC – Postdoctoral Fellowship to
Kristen Lewis
FBI – Evaluation of Forensic DNA
Typing as a Biometric Tool
NIJ – Interagency Agreement with the
Office of Law Enforcement Standards
Contact:
301-975-5205
301-975-4872