‘the role of brm, brg-1, snail 1 and snail 2 in the
TRANSCRIPT
‘The Role of Brm, Brg-1, Snail 1 and Snail 2 in the
Progression of Non-Melanoma Skin Cancer’
Dr Vanessa L Bock
MBBS, MM(Inf&Im), BMedSc
Department of Dermatology
Faculty of Medicine
The University of Sydney
A thesis submitted in accordance with the requirements for the
degree of Master of Medicine by Research
2008
ii
Table of Contents Page
Statement xi
Acknowledgements xii
Summary xiii
Chapter 1 Introduction 1
1.1.1 Skin cancer overview 1
1.1.2 Definition 1
1.1.3 Clinical Features 2
1.1.4 Epidemiology 4
1.1.5 Histopathology 5
1.1.6 Treatment 10
1.1.7 Aetiology 11
1.1.8 Genetic changes in skin cancer 11
1.1.9 UV-induced immunosuppression 13
1.2 Brm and Brg-1 14
1.2.1 Chromatin 14
1.2.2 Chromatin-remodelling complexes 15
1.2.3 Mechanism of action of the SWI/SNF chromatin remodelling complex 19
1.2.4 Functions of chromatin-remodelling complexes 21
1.2.5 Associations with cancer 22
1.3 Previous Findings 23
1.3.1 RNA isolation and probe synthesis for array hybridisation 23
1.3.2 Array hybridization and real-time RT-PCR confirmation 24
1.3.3 Brm messenger RNA is down-regulated in SCC compared to AK and normal skin 25

iii
1.4 Snail 1 and 2 27
1.4.1 Definition 27
1.4.2 Functions of Snail 1 and Snail 2 27
1.4.3 Associations with cancer 29
1.5 Aims of this project 29
Chapter 2 Materials and Methods 31
2.1 Ethical approval 31
2.2 Patients 31
2.3 Specimens 32
2.4 Diagnosis 33
2.5 Establishing the Specificity and Sensitivity of Antibodies 33
2.6 Molecular Techniques 34
2.6.1 Cell Culture 34
2.6.2 Chamber Slides 34
2.6.3 Plasmid Construction 35
2.6.4 Identification of positive clones 36
2.6.5 Maxi-preps of plasmids 36
2.6.6 Purification of plasmids 36
2.6.7 Transfection of cell lines 37
2.6.8 Fixation of chamber slides 38
2.7 Double-label Immunohistochemistry 38
2.7.1 Primary antibody sensitivities and specificities 41
2.7.2 Secondary antibody sensitivities and specificities 42
2.7.3 Tissue sections 42
2.7.4 Tissue fixation 42
iv
2.7.5 Endogenous horseradish peroxidase block 42
2.7.6 Blocking 43
2.7.7 Primary antibody incubation 43
2.7.8 Secondary antibody incubation 43
2.7.9 Streptavidin - alkaline phosphatase 44
2.7.10 Alkaline phosphatase reaction 44
2.7.11 Horseradish peroxidase reaction 44
2.7.12 Dehydration and clearing of slides 45
2.7.13 Mounting of slides 45
2.8 Image capture and processing 45
2.8.1 Image capture 45
2.8.2 Image analysis 45
2.9 Statistical Analysis 46
Chapter 3 Results 47
3.1 Patient demographics 47
3.2 Clinical and histological features 47
3.3 Primary antibody specificity 50
3.4 Brm and Brg-1 in skin specimens 55
3.5 Snail 1 and Snail 2 expression 67
3.6 p53 expression 71
Chapter 4 Discussion 74
4.1 Skin specimens 74
4.2 Selection of specific antibodies 76
4.3 Tumour expression of Brm and Brg-1 80
4.4 Tumour expression of Snail 1 and Snail 2 83
v
4.5 Tumour expression of p53 85
4.6 Future directions 87
4.7 Conclusion 88
Appendix 1 – Information for Participants 90
Appendix 2 – Consent Form 92
Appendix 3 – Participant Questionnaire 93
Appendix 4 - Final Immunohistochemistry Protocol 95
Appendix 5 - Solutions 96
Appendix 6 - Reagents 97
Chapter 5 References 98

vi
Statement
This thesis contains no material that has been accepted for the award of any degree or diploma at
any University. It contains no material published by any other person, except where due reference
is made.

vii
Acknowledgements
I wish to express my sincere gratitude to my supervisors, Professor Gary Halliday and Doctor
Guy Lyons, who have given me the opportunity to undertake this project. They have provided me
with much guidance and immeasurable support throughout all periods of this project. As a result,
I have gained a wealth of skills and knowledge far exceeding my expectations, and for this I am
grateful.
I would also like to express my gratitude to a number of clinicians whose help aided the
collection of tumour specimens. In particular I would like to thank the plastic surgeon Mr Ken
Lee, who went out of his way to help. I would also like to thank Associate Professor Stephen Lee
and Dr Rhonda Kwong who actively sought suitable specimens from patients attending their
clinics. I express my gratitude also to Clinical Professor Richard Scolyer who undertook the
histopathological examination of every specimen.
I would also like to thank all of the patients who willingly took part in this project. Without their
voluntary cooperation, this project would not have been possible.
During this project, I had the opportunity to work with many talented and helpful scientists in the
Department. In particular, I wish to mention members of the group working on the Brm project.
This includes Dr Fergal Moloney, Dr Matthew Bugeja and Dr Jane Huang. I would like to thank
them all for much advice, assistance and above all friendship over the period of this project.
Finally, I would like to thank my loving partner Peter whose support and patience has been
unwavering throughout this time.
viii
Summary
Non-melanoma skin cancer (NMSC) is the most common human cancer worldwide. Squamous
cell carcinoma (SCC) and basal cell carcinoma (BCC) make up almost all NMSC. SCC usually
arises from actinic keratosis (AK) as a result of exposure to sunlight. SCC and AK provide a
useful clinical model to investigate changes involved in the progression of NMSC.
This project examines the expression of Brm, Brg-1, Snail 1 and Snail 2 in the progression of
NMSC. Brm and Brg-1 are subunits of the SWI/SNF chromatin-remodelling complex which is
involved in regulating the access of cell machinery to DNA by altering the structure of chromatin.
It has been suggested that loss of this function is involved in carcinogenesis as the cell is unable
to access to DNA normally in order to repair mutations or activate apoptosis. The loss of Brm or
Brg-1 has been described in several human cancers. Snail 1 and Snail 2 are zinc-finger
transcription factors that are known for their role in epithelial to mesenchymal transition (EMT),
a process vital to embryological development. Increased expression of these factors leads to a
loss of cell-cell adhesion and a migratory phenotype and has been described in some human
cancers. In this project, double-label immunohistochemistry was used to determine the relative
expression of these proteins in human SCC, BCC, AK and normal skin.
The expression of Snail was unable to be determined due to poor specificity of the antibodies
used. The expression of both Brm and Brg-1 proteins was found to be dramatically and
consistently decreased in SCC and BCC when compared to normal skin and AK. This loss of
Brm and Brg-1 occured as the tumour progressed from benign AK to malignant SCC. This
finding suggests that the loss of either Brm or Brg-1 constitutes a key step in carcinogenesis. The
results of this study identify Brm and Brg-1 as putative tumour suppressors involved in the
progression of non-melanoma skin cancer from benign to malignant.
1
Chapter 1 Introduction
1.1.1 Skin cancer overview
Non-melanoma skin cancer is the most common human cancer worldwide. In Australia, non-
melanoma skin cancers are three times more prevalent than all other carcinomas combined. Non-
melanoma skin cancer is predominantly made up of basal cell carcinoma (BCC) and squamous
cell carcinoma (SCC).
SCCs now represent approximately 30% of non-melanoma skin cancers in Australia. With an
ageing population, the incidence of non-melanoma skin cancer is rising (Veness 2006).
According to the “Cancer in Australia, 2001” report by the Australian Institute of Health and
Welfare, there were 389 deaths from non-melanoma skin cancer in 2001. SCC is also an
aggressive skin cancer with the potential for local invasion and metastatic spread. Of all non-
melanoma skin cancers, SCCs are responsible for the majority of mortality, usually as a result of
metastatic progression (Clayman, Lee et al. 2005; Veness 2006).
1.1.2 Definition
SCC is a malignant tumour arising from keratinocytes in the epidermis, skin appendages and
other stratified squamous mucosa. The majority of SCCs develop in fair skinned individuals as a
result of ultraviolet (UV) radiation exposure. SCCs usually develop in benign epidermal lesions,
most commonly in actinic keratoses (AK) also known as solar keratoses (SK) or ‘sun spots’
(Mittelbronn, Mullins et al. 1998; Czarnecki, Meehan et al. 2002; Wolff, Johnson et al. 2005).
AKs are discrete, scaly lesions which occur on habitually sun-exposed skin. A small proportion
of AKs progress to become invasive SCC. One study has determined that approximately 10% of
AKs progress to become SCCs after approximately two years (Fuchs and Marmur 2007). This
2
fact, together with shared genetic abnormalities suggest that AKs represent an early stage in the
development of SCC.
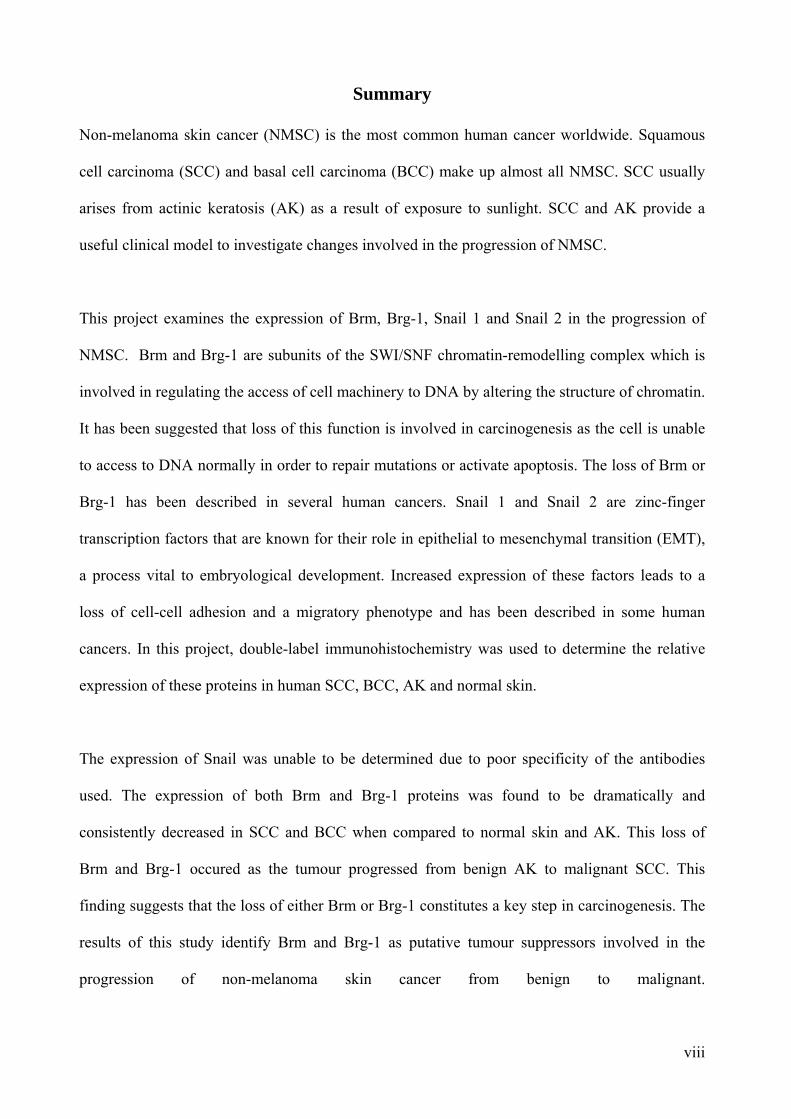
1.1.3 Clinical Features
SCC typically presents in patients over 55 years old on sun-exposed skin and is more common in
individuals with fair skin. They present as slowly evolving keratotic or eroded plaques which
may have a nodular component, often with poorly defined margins. These lesions may be
ulcerated, develop a thick crust, and are sometimes inflamed and secondarily infected (Figures
1.1 and 1.2). Well-differentiated SCCs show signs of keratinisation and are firm upon palpation.
Poorly-differentiated SCCs display less keratinisation and consequently appear more fleshy and
granulomatous, being less firm to palpation (Wolff, Johnson et al. 2005).
Figure 1.1 SCC of the lower lip.
3
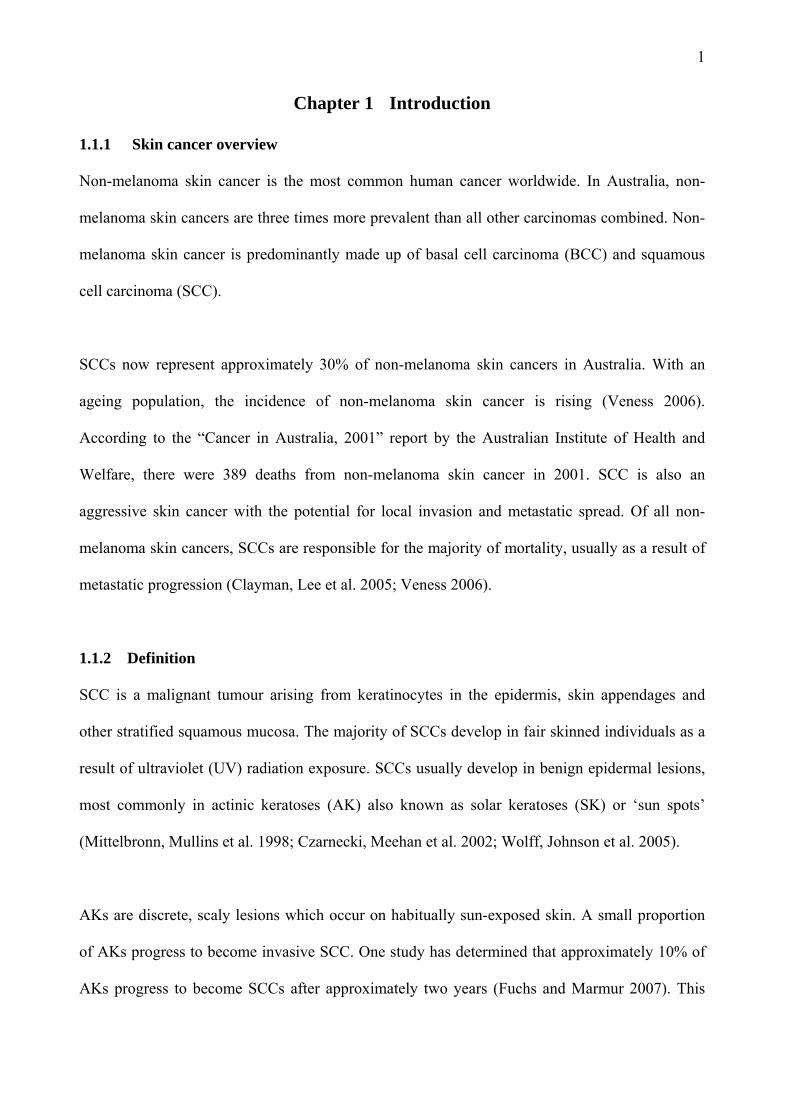
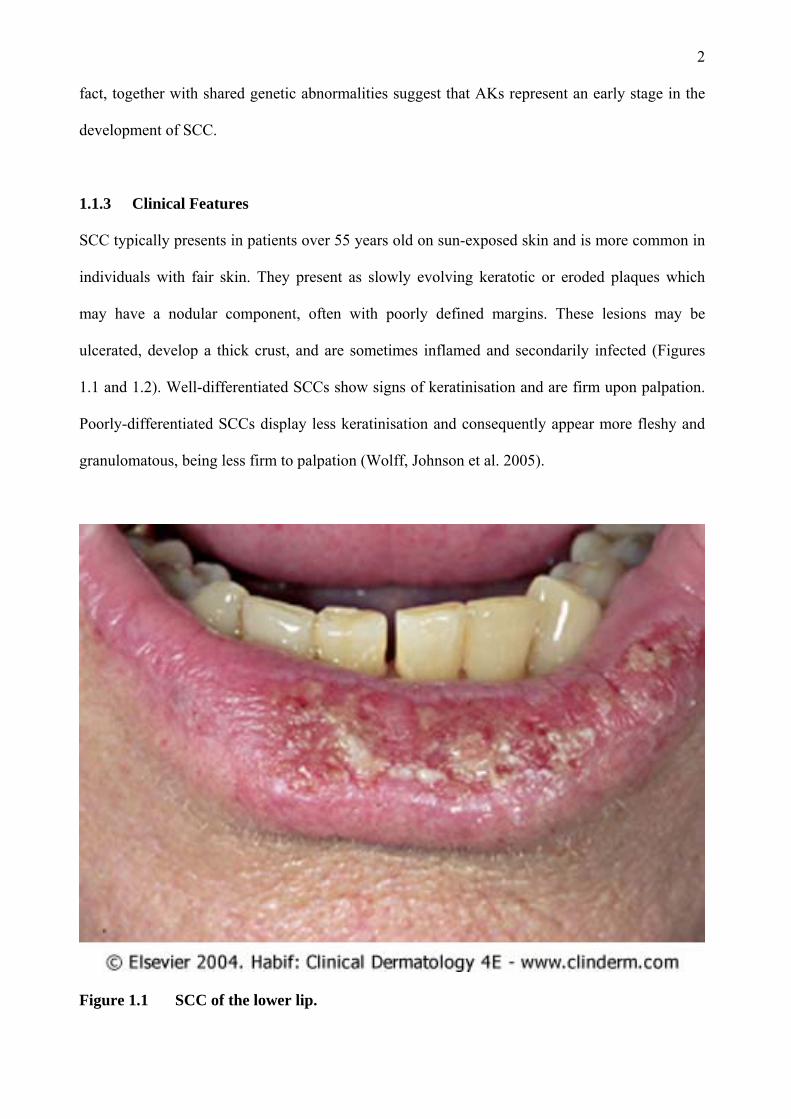
Figure 1.2 Keratotic SCC of the lower lip.
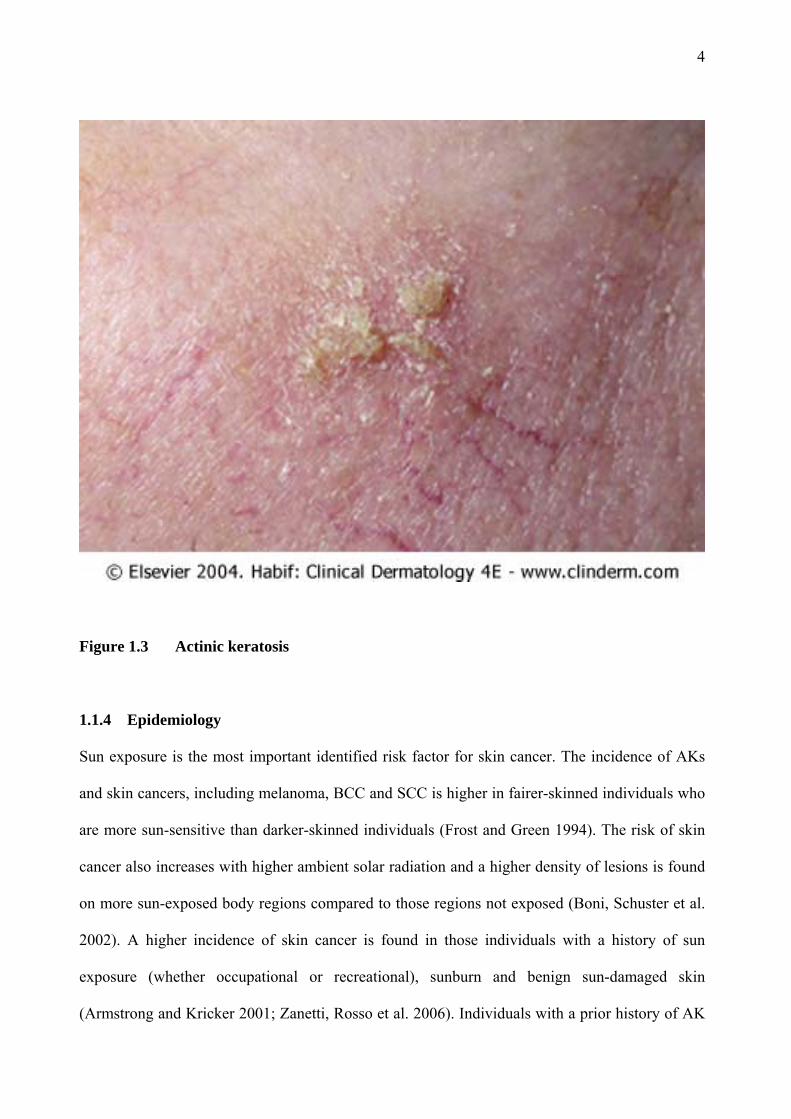
AKs present as single or multiple discrete dry, rough and adherent scaly lesions on the sun-
exposed skin of middle-aged individuals (Figure 1.3). They are more common in fairer-skinned
individuals. The adherent scale is removed only with difficulty and pain. The lesions may be
skin-coloured, yellow-brown or red-tinged. They are readily felt on palpation as rough lesions,
similar to sandpaper (Wolff, Johnson et al. 2005). AKs may become clinically tender and
inflamed as they progress to become SCCs (Berhane, Halliday et al. 2002).
4
Figure 1.3 Actinic keratosis
1.1.4 Epidemiology
Sun exposure is the most important identified risk factor for skin cancer. The incidence of AKs
and skin cancers, including melanoma, BCC and SCC is higher in fairer-skinned individuals who
are more sun-sensitive than darker-skinned individuals (Frost and Green 1994). The risk of skin
cancer also increases with higher ambient solar radiation and a higher density of lesions is found
on more sun-exposed body regions compared to those regions not exposed (Boni, Schuster et al.
2002). A higher incidence of skin cancer is found in those individuals with a history of sun
exposure (whether occupational or recreational), sunburn and benign sun-damaged skin
(Armstrong and Kricker 2001; Zanetti, Rosso et al. 2006). Individuals with a prior history of AK
5
have a much higher risk of developing subsequent lesions than individuals with no history of
such lesions (Frost and Green 1994; Raasch and Buettner 2002).
National cancer registries do not routinely collect data on non-melanoma skin cancer. However,
the incidence of non-melanoma skin cancer in Australia has been estimated by national surveys.
The 2002 national survey which sampled over 57,000 people found an age-standardised rate of
1170 non-melanoma skin cancers per 100,000 people per year, of which 387 were SCC. The
estimated total number of SCC in Australia for 2002 was 374,000. The incidence rate for both
BCC and SCC had risen when compared to data from 1985 (Staples, Elwood et al. 2006).
1.1.5 Histopathology
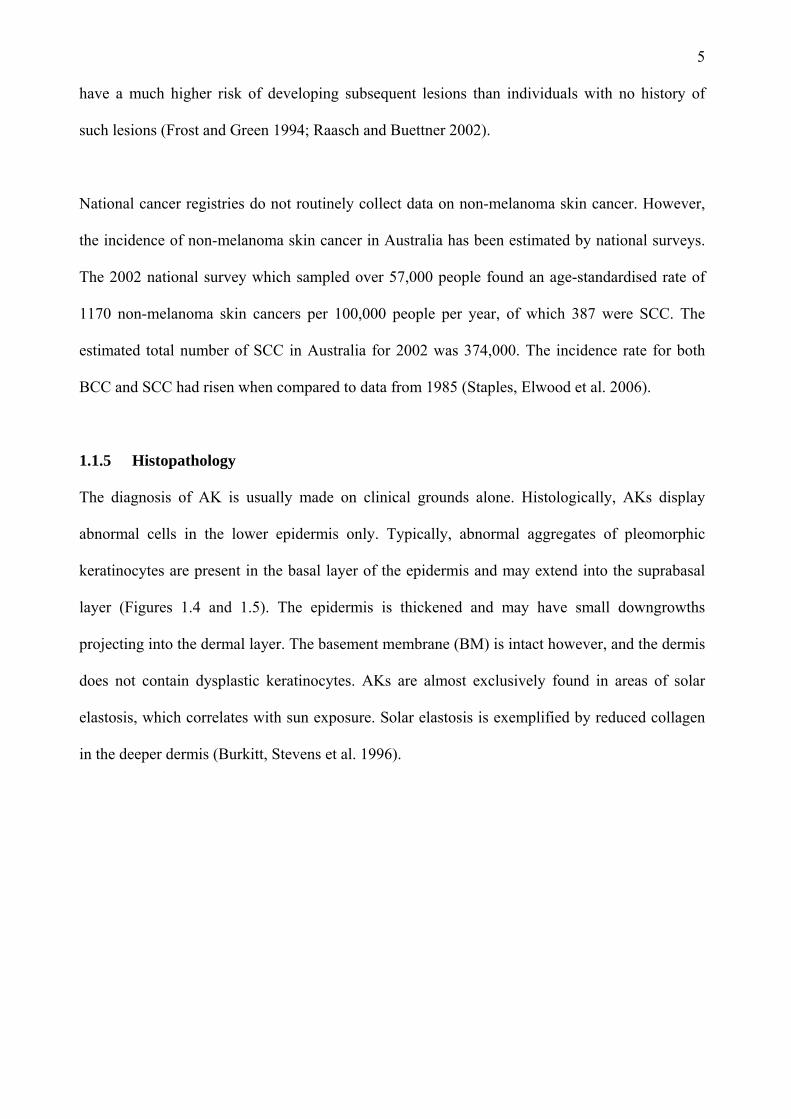
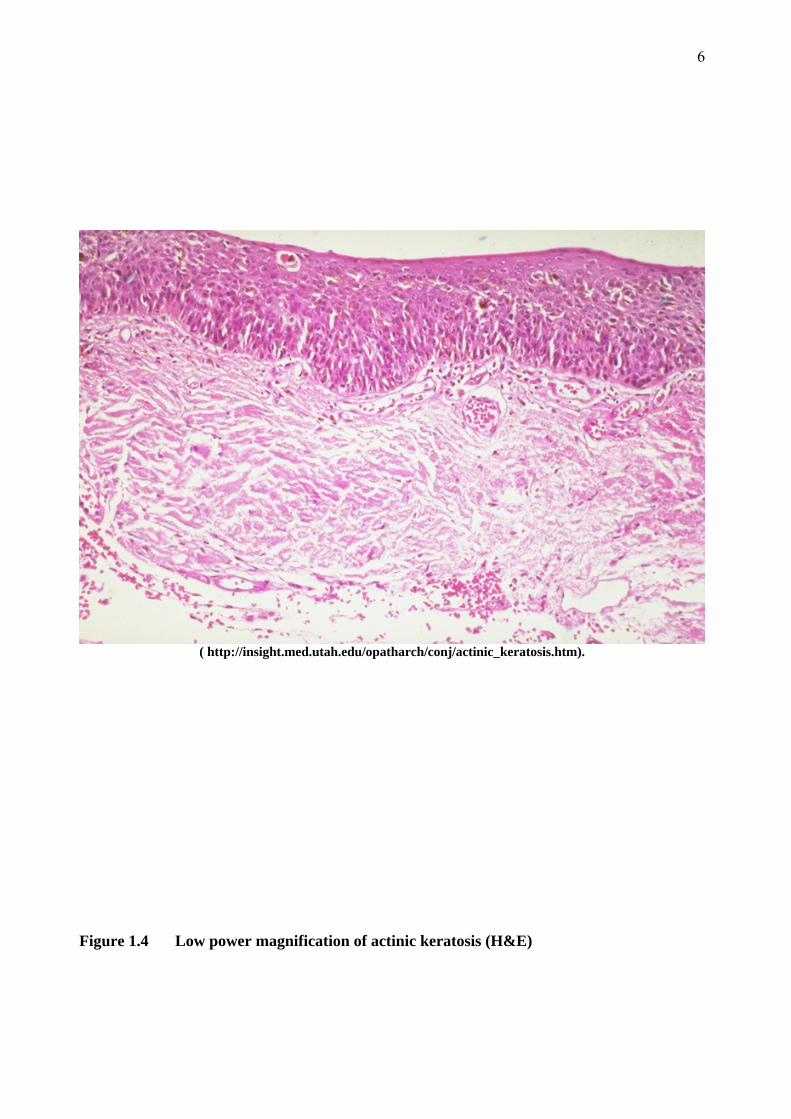
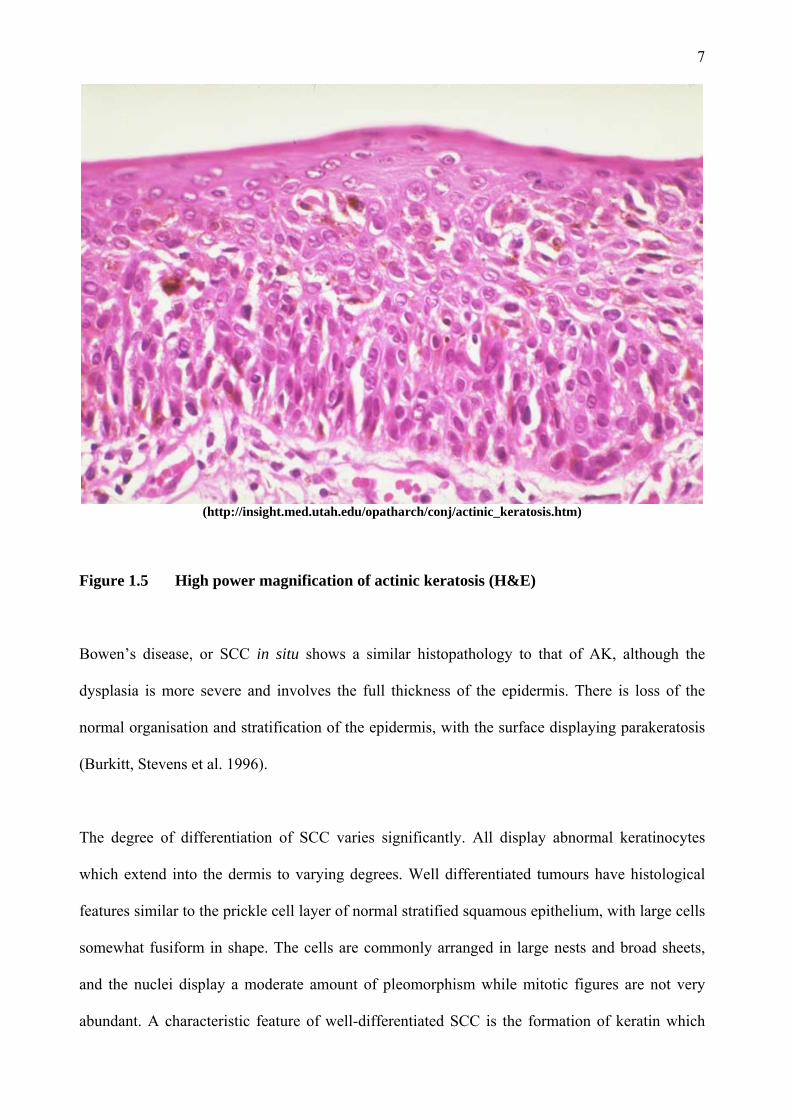
The diagnosis of AK is usually made on clinical grounds alone. Histologically, AKs display
abnormal cells in the lower epidermis only. Typically, abnormal aggregates of pleomorphic
keratinocytes are present in the basal layer of the epidermis and may extend into the suprabasal
layer (Figures 1.4 and 1.5). The epidermis is thickened and may have small downgrowths
projecting into the dermal layer. The basement membrane (BM) is intact however, and the dermis
does not contain dysplastic keratinocytes. AKs are almost exclusively found in areas of solar
elastosis, which correlates with sun exposure. Solar elastosis is exemplified by reduced collagen
in the deeper dermis (Burkitt, Stevens et al. 1996).
6
( http://insight.med.utah.edu/opatharch/conj/actinic_keratosis.htm).
Figure 1.4 Low power magnification of actinic keratosis (H&E)
7
(http://insight.med.utah.edu/opatharch/conj/actinic_keratosis.htm)
Figure 1.5 High power magnification of actinic keratosis (H&E)
Bowen’s disease, or SCC in situ shows a similar histopathology to that of AK, although the
dysplasia is more severe and involves the full thickness of the epidermis. There is loss of the
normal organisation and stratification of the epidermis, with the surface displaying parakeratosis
(Burkitt, Stevens et al. 1996).
The degree of differentiation of SCC varies significantly. All display abnormal keratinocytes
which extend into the dermis to varying degrees. Well differentiated tumours have histological
features similar to the prickle cell layer of normal stratified squamous epithelium, with large cells
somewhat fusiform in shape. The cells are commonly arranged in large nests and broad sheets,
and the nuclei display a moderate amount of pleomorphism while mitotic figures are not very
abundant. A characteristic feature of well-differentiated SCC is the formation of keratin which
8
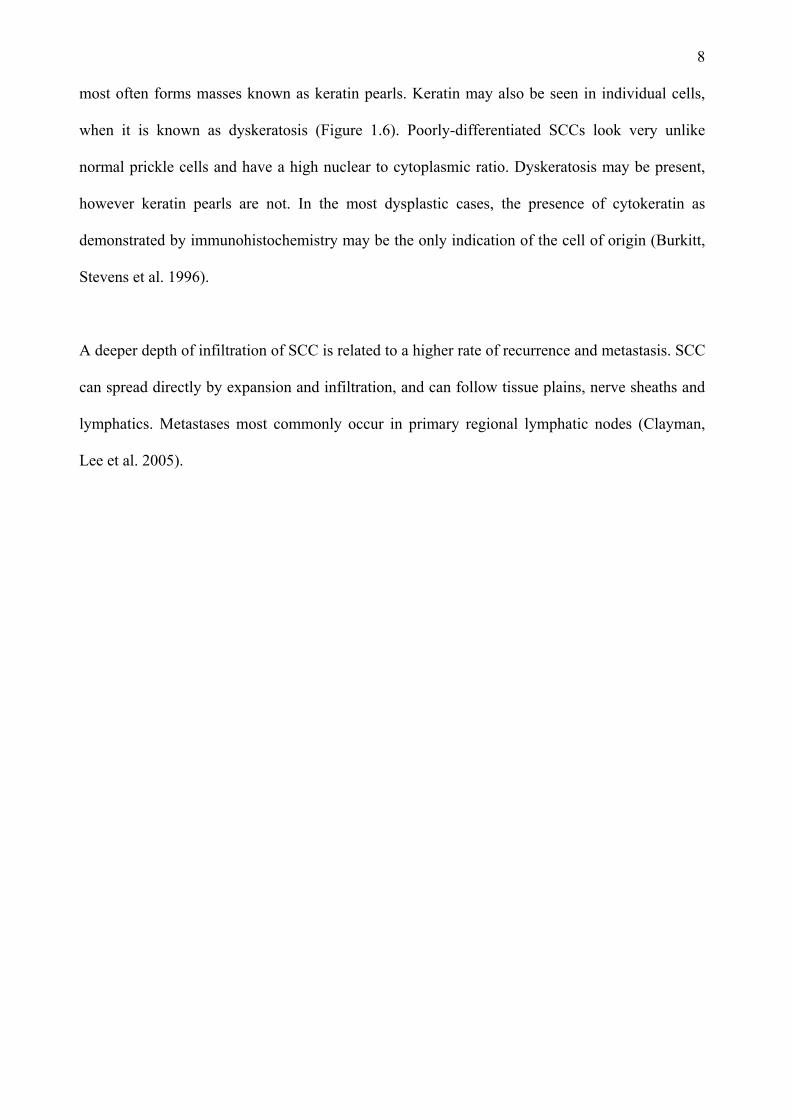
most often forms masses known as keratin pearls. Keratin may also be seen in individual cells,
when it is known as dyskeratosis (Figure 1.6). Poorly-differentiated SCCs look very unlike
normal prickle cells and have a high nuclear to cytoplasmic ratio. Dyskeratosis may be present,
however keratin pearls are not. In the most dysplastic cases, the presence of cytokeratin as
demonstrated by immunohistochemistry may be the only indication of the cell of origin (Burkitt,
Stevens et al. 1996).
A deeper depth of infiltration of SCC is related to a higher rate of recurrence and metastasis. SCC
can spread directly by expansion and infiltration, and can follow tissue plains, nerve sheaths and
lymphatics. Metastases most commonly occur in primary regional lymphatic nodes (Clayman,
Lee et al. 2005).
9
(http://www.pathologyatlas.ro/Squamous%20Cell%20Carcinoma.html)
Figure 1.6 Squamous cell carcinoma (H&E)
10
1.1.6 Treatment
Prevention by avoidance of modifiable risk factors is particularly important. The most readily
avoidable risk factor is exposure to UV radiation. Protective measures against sun-exposure
include the use of sunscreen lotions, sun protective clothing, wide-brimmed hats and the
provision of shade structures in schools, work places and public places. In addition to this, public
health campaigning aims to educate the public and encourage a change of behaviour and attitudes
regarding sun exposure. In Australia the ‘Slip! Slop! Slap!’ campaign, which has been in progress
for more than 30 years, has had an impact in changing the behaviour of the public and reducing
the levels of sun exposure (Marks 1999; Montague, Borland et al. 2001).
Given the malignant potential for AKs, treatment of such lesions is always recommended
(Butani, Arbesfeld et al. 2005). Many therapies are available for the treatment of AK. The most
common is cryotherapy which involves the topical application of liquid nitrogen. Cryotherapy is
a very effective therapy, although application may be painful and damaging to surrounding skin.
Other common and effective alternatives for discrete lesions include curettage and
electrodesiccation. For treatment of multiple lesions, dermabrasion, chemical peels, laser
resurfacing, topical therapies and photodynamic therapy may be useful. Topical therapies include
diclofenac, tretinoin, 5-fluorouracil and imiquimod. Imiquimod is a cytokine-inducer and a
modifier of innate and acquired immune responses (Vidal 2006). Both systemic and topical
retinoids have shown success in the prevention of AKs and SCCs in organ transplant patients
(Neuhaus and Tope 2005).
Surgical excision is the treatment of choice for squamous cell carcinoma. This allows the
pathologist to confirm the diagnosis, determine the histological grade and depth of invasion, and
determine the completeness of excision. Curettage and cautery may be used for squamous cell
carcinoma in situ (Bowen’s disease) (Alam and Ratner 2001; Rudolph and Zelac 2004).

11
Radiotherapy is used for larger lesions in the head and neck regions, and for more elderly
individuals or those with contraindications for surgery (Finizio, Vidali et al. 2002). In the case of
disseminated disease, surgery, radiotherapy and chemotherapy may be employed either alone or
in combination for treatment and/or palliation (Kharatishvili, Tiuliandin et al. 2005)
1.1.7 Aetiology
Exposure to UV radiation from the sun is the most important identified risk factor for the
development of SCC (Kricker, Armstrong et al. 1993) (Kricker, Armstrong et al. 1995). The UV
spectrum is made up of the UVA (320-400 nm), UVB (290-320 nm) and UVC (<290 nm)
wavebands. UVC radiation is absorbed by the ozone layer and does not reach the Earth’s surface
so that sunlight to which tumours are exposed is a mixture of UVA and UVB. UV radiation
causes mutations in DNA. In particular, UVB causes characteristic G:C to A:T mutations. These
occur only in response to UVB and can be regarded as indicative of UVB-induced damage. In
contrast, UVA induces a high frequency of A:T to C:G mutations. These mutations are
characteristic for UVA-induced damage and only rarely occur as a consequence of UVB
exposure (Drobetsky, Turcotte et al. 1995) (Robert, Muel et al. 1996).
These characteristic UV-induced mutations have been found in the tumour suppressor gene p53,
not only in a high frequency of skin cancers, but also in precancerous lesions and sun-exposed
normal skin (Ling, Chadwick et al. 2001). Thus, UV-induced p53 mutations are considered to be
early events in skin carcinogenesis.
1.1.8 Genetic changes in skin cancer
The p53 gene, also known as the guardian of the genome, is important in the regulation of the
cell-cycle. It achieves this by mediating cell-cycle arrest. The p53 gene product enables abnormal
cells to be removed by apoptosis, or programmed cell death. This prevents abnormal cells from
12
proliferating. When mutations in p53 lead to loss of p53 protein, abnormal cells are able to
survive and proliferate (Resnick-Silverman and Manfredi 2006).
Another tumour suppressor gene implicated in the development of SCC is p16. The p16 protein is
a major inhibitor of cyclin D kinase. The p16 protein prevents phosphorylation of the
retinoblastoma gene (Rb) product and therefore acts as a negative regulator of the cell cycle. This
protein is frequently inactivated in human tumours including non-melanoma skin cancer. In AKs
and SCCs, progressive up-regulation of p16 protein expression is found with increasing
invasiveness and metastatic potential. The p16 mutations in AK and SCC are also characteristic
of UV-induced mutations (Hussein 2005).
In non-melanoma skin cancer the Ras oncogene is found to be frequently mutated (Mercurio
2003; Vitale-Cross, Amornphimoltham et al. 2004). These activating mutations are the result of
aberrant repair of UV-induced pyrimidine dimers (Alam and Ratner 2001).The Ras oncogene
codes for a G-protein that transduces intracellular signaling. Activating mutations in the Ras
oncogene cause an increased rate of hydrolysis which leads to inappropriately promoted cell
growth and survival. SCCs have been shown to frequently have mutations in the Ras oncogene
(Alam and Ratner 2001). Mutations of the Ras oncogene have also been demonstrated in AKs
and thus are likely to represent an early genetic mutation in the development of SCC.
Another oncogene implicated in SCC development is the bcl-2 oncogene. This gene was
discovered as a translocated locus in a B cell leukaemia and is located on chromosome 18q. The
protein product of bcl-2 is involved in the inhibition of apoptosis. Translocation of the bcl-2 gene
from chromosome 18 to chromosome 14 leads to overexpression of the protein product. In
normal sun-exposed skin, bcl-2 protein expression is down-regulated leading to apoptosis. In
13
AKs and SCCs however, bcl-2 protein expression is up-regulated, with the greatest degree of up-
regulation seen in more invasive SCCs (Hussein 2005).
More recently, the nuclear factor NF-κB has been implicated in the development of SCC. The
NF-κB family of proteins are widely expressed throughout the body and play a role in promoting
cell proliferation and protection against apoptosis. This is achieved by subunits of NF-κB
entering the nucleus and activating target genes. Although intuitively it would seem that
activation of NF-κB should lead to increased cell proliferation and resistance to apoptosis and
thus to cancer, this appears not to be the case in skin. Some studies have found that inhibition of
NF-κB in the presence of activated Ras protein leads to cell proliferation and cancer (Dajee,
Lazarov et al. 2003).
1.1.9 UV-induced immunosuppression
UV radiation, in addition to inducing genetic mutations, plays a role in the development of skin
cancers by a direct immunosuppressive effect on the skin (Halliday, Bestak et al. 1998;
Hanneman, Cooper et al. 2006). The immune system provides some protection against the
development of skin malignancies (Woods, Malley et al. 2005). AKs and SCCs are associated
with an inflammatory lymphoid infiltrate. This association is stronger for regressing tumours, and
CD4+ T cells are the predominant lymphocyte present. This suggests that regression of skin
tumours is likely to be immune mediated and that CD4+ T cells play an important role (Halliday,
Patel et al. 1995).
Immunosuppressed patients, particularly organ transplant patients, have a higher risk of AK and
SCC (Durando and Reichel 2005; Moloney, Comber et al. 2006). SCCs arise more frequently, are
more aggressive and more likely to recur or metastasise than SCCs developing in
14
immunocompetent individuals (Harwood, Proby et al. 2006). This highlights the important role
that the immune system plays in preventing and controlling SCC.
1.2 Brm and Brg-1
1.2.1 Chromatin
In eukaryotic nuclei, DNA is assembled into a nucleoprotein structure termed chromatin.
Chromatin is made up of repeating nucleosomes which consist of DNA which is wound around a
core histone octamer. This core histone octamer consists of two copies of 4 different histones,
H2A, H2B, H3 and H4. 147 base pairs of DNA are wrapped around this roughly cylindrical
octamer. A linker histone, such as H1 and H5, interacts with the nucleosomal core and adjoining
linker DNA (Smith and Peterson 2005).
The nucleosomes are arranged into long linear arrays with a width of approximately 10 nm.
These linear arrays are compacted into chromatin fibres by both intra-nucleosomal and inter
nucleosomal interactions. These interactions are mediated and stabilised by the association of the
N-terminal domains of histones with neighbouring nucleosomes.
Any cellular process which requires access to DNA such as transcription, replication or DNA
repair, needs to function in the context of chromatin. The histone-DNA complexes known as
nucleosomes form a potent obstacle to any of these processes. In order to gain access to DNA,
cells employ two main cellular machineries: histone acetylases and chromatin remodelling
complexes. Histone acetylases add acetyl groups to the N-terminal tails of histones that protrude
out of the nucleosome core. Different modifications are associated with distinct events such as
transcriptional activation, silencing and histone deposition. It is likely that this is achieved by the
loss of positive charge modifying interactions between the histone tails and DNA (Smith and
15
Peterson 2005). This reaction can be reversed by histone deacetylases, which have a negative
effect on transcription (Muchardt and Yaniv 2001).
1.2.2 Chromatin-remodelling complexes
Chromatin-remodelling complexes alter chromatin fibre structure by disrupting or mobilising
nucleosomes in an energy-dependent fashion. These complexes harness the energy of ATP
hydrolysis to achieve this. Depending on the organism, these chromatin-remodelling enzymes can
range from a single catalytic subunit to large multi-subunit complexes.
The chromatin-remodelling complex SWI/SNF was originally identified in yeast as positive
regulators of the HO gene (mating type switch or SWI) and the SUC2 gene (sucrose non-
fermenting or SNF). Three SWI genes were originally identified: SWI1, SWI2 and SWI3. Three
SNF genes were also identified: SNF2, SNF5 and SNF6. It was subsequently discovered that
SWI2 and SNF2 were in fact the same gene, and that all five products of these genes functioned
together in a complex to regulate transcription. This complex is conserved from yeast to humans.
Chromatin-remodelling complexes have been subdivided into three major subfamilies:
SWI2/SNF2, Mi-2/CHD and ISWI families. These subdivisions are based on sequence homology
and their remodelling activities (Boyer, Logie et al. 2000). Within each chromatin-remodelling
complex is a helicase-like subunit of the SWI2/SNF2 family of Snf2 ATPases. These complexes
are large proteins that contain a number of domains including the helicase-like ATPase domain,
bromodomains, chromodomains, plecton homology domains, SANT domains and AT hook
regions. These domains may play a role in stabilising the interaction between the chromatin-
remodelling complex and histones and/or DNA. For instance, it is known that bromodomains
interact with acetylated lysines (Yang 2004). The AT hook domain is also believed to be involved
in binding to AT-rich regions of DNA (Aravind and Landsman 1998).
16
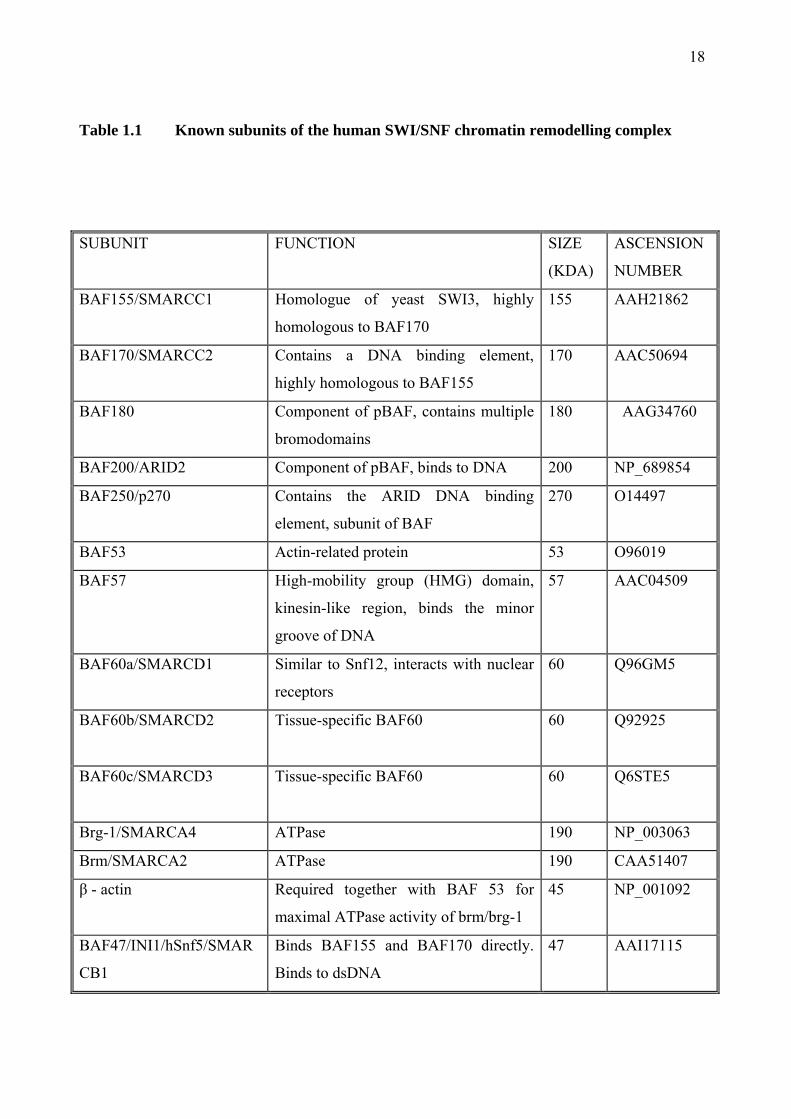
The human SWI/SNF complex is large multi-subunit complex approximately 2 MDa in size. The
exact subunit composition of the SWI/SNF complex varies, although it contains at least 9 or more
subunits in humans. All the known subunits of human SWI/SNF are listed in Table 1.1. In
humans there are two major subfamilies of the SWI/SNF complex. These include BAF (brg-1 or
hBrm-associated factor) and pBAF (polybromo-associated factor). These two subfamilies are
similar in their subunit composition, sharing 8 subunits (BRG1, BAF170, BAF155, BAF60a,
BAF57, BAF53, actin, and BAF47). However, BAF contains BAF250, whilst pBAF contains
BAF180 (also known as polybromo) and BAF200 (Yan, Cui et al. 2005). An important difference
between these two subfamilies is that only pBAF is capable of facilitating ligand-dependent
transcriptional activation by nuclear receptors in vitro. In all SWI/SNF complexes, there is an
ATPase subunit which is either Brm (brahma) or Brg-1 (brahma-related gene 1). These ATPase
subunits are mutually exclusive. Both Brm and Brg-1 contain a bromodomain, which is a motif
found in several transcription factors. There is a high degree of homology between the Brm and
Brg-1 genes, with 86% similar and 75% identical. The Brm gene is made up to 5758 bases of
which 4770 code for an 180 kDa protein (Muchardt and Yaniv 1993).
The Brm and Brg-1 proteins employ the energy of ATP hydrolysis to weaken the interaction
between histone core particles and DNA. This results in either localised disruption of the DNA-
histone contacts or mobilisation of the nucleosomes on the chromatin fibre (Figure 1.7). This
facilitates the binding of transcription factors to specific sites on DNA and thus mediates either
activation or repression of expression, depending on the transcription factor. Thus these
molecules regulate the expression of many genes.
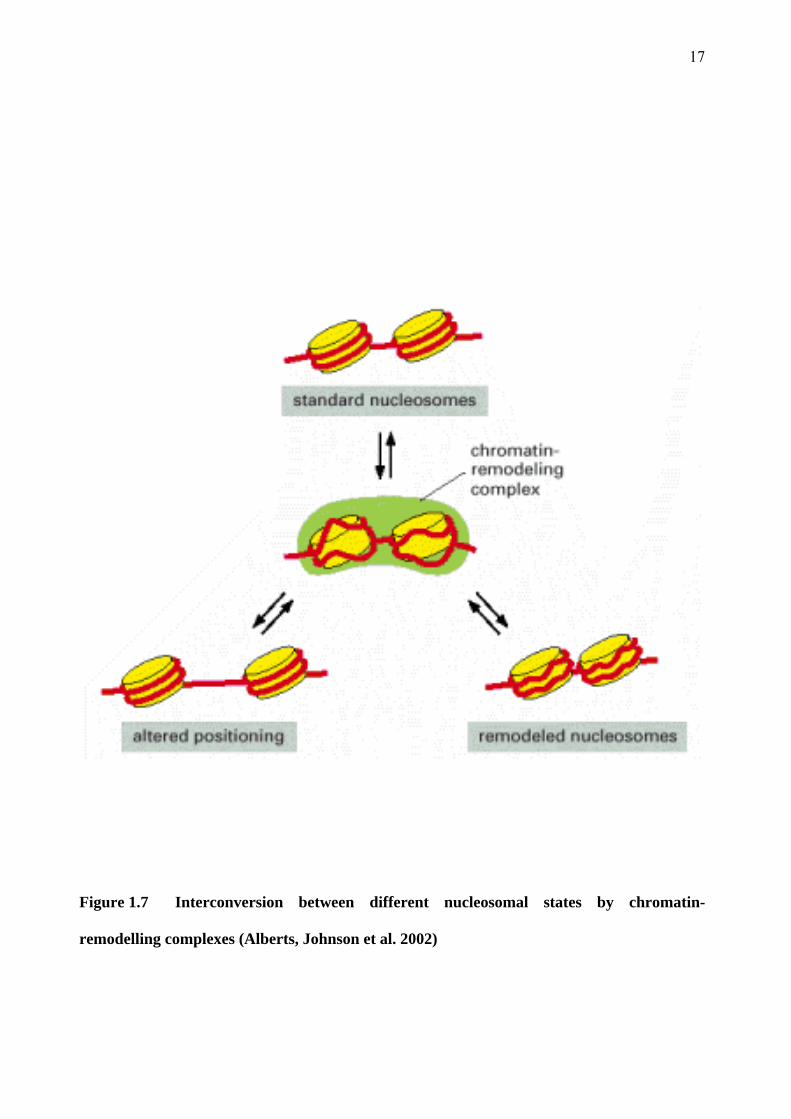
17
Figure 1.7 Interconversion between different nucleosomal states by chromatin-
remodelling complexes (Alberts, Johnson et al. 2002)
18
Table 1.1 Known subunits of the human SWI/SNF chromatin remodelling complex
SUBUNIT FUNCTION SIZE
(KDA)
ASCENSION
NUMBER
BAF155/SMARCC1 Homologue of yeast SWI3, highly
homologous to BAF170
155 AAH21862
BAF170/SMARCC2 Contains a DNA binding element,
highly homologous to BAF155
170 AAC50694
BAF180 Component of pBAF, contains multiple
bromodomains
180 AAG34760
BAF200/ARID2 Component of pBAF, binds to DNA 200 NP_689854
BAF250/p270 Contains the ARID DNA binding
element, subunit of BAF
270 O14497
BAF53 Actin-related protein 53 O96019
BAF57 High-mobility group (HMG) domain,
kinesin-like region, binds the minor
groove of DNA
57 AAC04509
BAF60a/SMARCD1 Similar to Snf12, interacts with nuclear
receptors
60 Q96GM5
BAF60b/SMARCD2 Tissue-specific BAF60 60 Q92925
BAF60c/SMARCD3 Tissue-specific BAF60 60 Q6STE5
Brg-1/SMARCA4 ATPase 190 NP_003063
Brm/SMARCA2 ATPase 190 CAA51407
β - actin Required together with BAF 53 for
maximal ATPase activity of brm/brg-1
45 NP_001092
BAF47/INI1/hSnf5/SMAR
CB1
Binds BAF155 and BAF170 directly.
Binds to dsDNA
47 AAI17115
19
1.2.3 Mechanism of action of the SWI/SNF chromatin remodelling complex
Although the exact mechanism by which SWI/SNF remodels chromatin is yet to be completely
elucidated, two possible mechanisms have been proposed. One mechanism involves the twisting
of DNA over nucleosomes in a cork screw-like motion. This mechanism is sometimes referred to
as ‘twist defect diffusion’. Remodelling activity would apply torsional force to DNA and alter its
twist on the surface of the nucleosome histone core. Although this mechanism is a common
characteristic of some chromatin remodelling, experiments using branched DNA, DNA nicks or
beads attached to certain positions within nucleosomes indicate that this is unlikely to be a major
mechanism by which SWI/SNF mobilises nucleosomes (Owen-Hughes 2003).
Current evidence supports the other major class of mechanism which involves the formation of a
loop or bulge of DNA on the surface of the histone octamer. The DNA at the edge of
nucleosomes has been found to be more loosely associated with the core histone octamer than
DNA at the centre of the nucleosomes (Polach and Widom 1995). Disassociation of DNA at this
site in conjunction with association at a different site down stream would result in the formation
of a loop of DNA extending out from the nucleosome. Such loops could then propagate around
the core histone octamer in a manner very similar to the mechanism employed by RNA
polymerases (see Figure 1.8)(Studitsky, Walter et al. 2004).
In order to determine the step size of nucleosomes movement by SWI/SNF, experiments were
carried out in which the temperature and ATP concentration were lowered to slow down
remodelling so that changes in nucleosomes positioning due to hydrolysis of one or several ATPs
could be mapped. These experiments determined that SWI/SNF first displaces DNA from the
core histone surface and then repositions DNA approximately 52 base pairs from its original
position in a manner consistent with the loop or bulge mechanism (Zofall, Persinger et al. 2006).

20
Figure 1.8 Model for nucleosome mobilisation by the SWI/SNF chromatin remodelling
complex using the bulge mechanism. (A) DNA (black line) is wound around the core histone
protein octamer (blue). (B) The SWI/SNF complex (red) binds to DNA. (C) The SWI/SNF
complex induces the formation of a loop or bulge of DNA approximately 52 base pairs in
length. (D-E) The loop of DNA is propagated around the core histone octamer with no net
change in energy. (F) The loop of DNA is released resulting in a nucleosome which has been
mobilised by approximately 52 base pairs along the DNA strand.
21
1.2.4 Functions of chromatin-remodelling complexes
In human cells, chromatin-remodelling complexes have been found to play important roles in cell
differentiation, development and tumour suppression (Huang, Sloan et al. 2003). For example,
SWI/SNF has been found to be necessary for the development of bone by osteoblast
differentiation (Young, Pratap et al. 2005) and also for the development of neural tissue (Seo,
Richardson et al. 2005).
When the expression of Brm and Brg-1 proteins are examined in a variety of normal tissues, they
are found to have differences in the tissues in which they are normally expressed. Brg-1 is found
in tissues that are constantly undergoing proliferation or self-renewal. In contrast, Brm is
expressed in tissues not routinely undergoing proliferation such as brain, liver, fibromuscular
stroma and epithelial cells (Reisman, Sciarrotta et al. 2005).
Evidence suggests that the SWI/SNF complex is linked to control of cell proliferation. It is likely
that this link is due to the large number of genes transcriptionally regulated by the SWI/SNF
complex. The most well documented link between the SWI/SNF complex and regulators of the
cell cycle concerns the interaction between Brm or Brg-1 and the Retinoblastoma protein (Rb).
The Rb protein is one of the major cell cycle regulators that control the transition of the cell cycle
from G1 to S phase as well as progression through S phase. Both Brm and Brg-1 have been found
to interact with the tumour suppressor Rb gene product. A major target of the Rb gene is the
transcription factor E2F1 which induces transition into the S-phase of the cell cycle. However, to
mediate complete G1 cycle arrest, Rb requires the presence of Brm/Brg-1. This is achieved by a
direct interaction between Rb and Brm/Brg-1 (Strobeck, Knudsen et al. 2000; Liu, Luo et al.
2004). E2F is a family of transcription factors that play an important role in the regulation of the
cell cycle among other functions. Among members of the E2F family, E2F1 is unique in that it is
able to trigger apoptosis and it is also involved in the cellular response to DNA damage (Liu, Luo
22
et al. 2004). Chromatin-remodeling complexes are also necessary for the induction of p21 kinase
inhibitor, and this is also thought to be mediated by interaction with Rb (Nagl, Zweitzig et al.
2006). The Brm protein has also been found to be down-regulated by the Ras oncogene
(Muchardt, Bourachot et al. 1998).
1.2.5 Associations with cancer
Evidence suggests that Brm and Brg-1 can function as tumour suppressors in their own right.
Many human tumour cell lines have mutations in either Brg-1 or Brm. In many cases, re-
introduction of Brg-1 into Brg-1 deficient cell lines was sufficient to induce growth arrest (Wong,
Shanahan et al. 2000). In human non-small cell lung cancers, Brm and Brg-1 are lost in
approximately 30% of cases as detected by Western blot analysis (Reisman, Sciarrotta et al.
2003). Analysis of non-small cell lung cancers by immunohistochemistry for Brm and Brg-1
proteins showed concomitant loss in 10% of tumours. This loss also correlated with a statistically
significant poorer clinical course with decreased survival rates (Reisman, Sciarrotta et al. 2003;
Fukuoka, Fujii et al. 2004). Mutations of Brg-1 have also been discovered in other human cancer
cell lines, including breast, lung, prostate and pancreatic cancers (Wong, Shanahan et al. 2000).
Protein expression of Brm has been found to be reduced in 67% of human gastric cancer
specimens when examined by immunohistochemistry. Brm loss in these cases was also
associated with a less differentiated tumour (Yamamichi, Inada et al. 2007).
The BRCA1 tumour suppressor protein, which is mutated in approximately 90% of familial
breast cancers, has been found to be associated with the SWI/SNF complex. Brg-1 has also been
found to interact directly with BRCA1 protein (Bochar, Wang et al. 2000). The BRCA1 protein is
involved in DNA repair and has been shown to be a co-activator of p53-mediated transcription.
This function is inhibited by Brg-1 which is mutated in its ATP-binding site. Thus, it is possible
23
that the SWI/SNF complex partially controls the cell cycle through the p53 pathway (Muchardt
and Yaniv 2001).
To date, mutations in Brm or Brg-1 have not been described in human skin cancers. It is one of
the aims of this project to determine if these proteins are lost with the progression of AK to SCC.
1.3 Previous Findings
Previous work undertaken in the Dermatology Research Laboratories at the University of Sydney
by Dr Alexandra Jones under Professor Gary Halliday and Professor Ross Barnetson identified
the gene Brm as potentially playing a role in the progression of NMSC from benign AK to
malignant SCC. The results of this study have not yet been published. This study detected
changes in gene regulation using microarray gene chips, and down-regulation of Brm was
confirmed by reverse-transcriptase PCR (RT-PCR). A brief description of the materials, methods
and findings of this study will be given below.
1.3.1 RNA isolation and probe synthesis for array hybridisation
4mm punch biopsy specimens of human normal skin, AKs and SCCs were collected from
patients recruited via the Dermatology Clinic at Royal Prince Alfred Hospital, Camperdown. The
AK specimens were bisected, one half being used for histological analysis and the remainder
used for the study. An independent pathologist analysed the specimens histologically.
Total RNA was extracted from the specimens. The total RNA was prepared using the acid
phenol-guanidine method (Chomczynski and Sacchi 1987). The integrity of the total RNA was
confirmed by running a small amount on a denaturing formaldehyde/agarose/ethidium bromide
gel. Prior to Array hybridization, 2-3 µg of total RNA was treated with DNase I, reverse-
transcribed and ubiquitin primers used for real time PCR.
24
Finally, 2 µg of RNA was converted into 32p-labelled first strand cDNA largely according to the
manufacturers instructions (Clontech #PT 3140-1) with the exception that the enzyme Superscript
IITMRT was used (Gibco #11904018). Probes were hybridized to the array membranes at a final
concentration of 1-2 x 10⁶ CPM/ml for approximately 15 hours in ExpressHybTM Hybridisation
Solution (Clontech #636831) at 68°C.
1.3.2 Array hybridization and real-time RT-PCR confirmation
Two nylon membrane based cDNA arrays were used: The Clontech AtlasTM Human Cancer 1.2
Array (Clontech # 7852-1) and Human 1.2I Array (Clontech #7850-1). Each array is composed of
1176 human cDNA sequences, with 470 cDNA sequences common to both arrays. Arrays were
scanned using the Molecular Dynamics PhosphorImager and analysed by Image QuaNT.
Background values were determined over 6 measurements and the average was subtracted from
all data values including housekeeping gene values. Prior to analysis, all spots were checked for
the effects of blooming or membrane contamination. All data was normalized to Ubiquitin,
GAPDH and 23 kDA highly basic protein. A change in expression of equal to or greater than 3-
fold of any gene was taken as significant.
Genes identified to be up or down-regulated by cDNA array analysis were quantified by real-time
RT-PCR in order to confirm the results. In addition, glyceraldehyde-3-phosphate dehydrogenase
(G3PDH) was included in the real-time PCR assay as a house-keeping gene. Total RNA was
extracted as described above. 1 µg of total RNA was used in the synthesis of cDNA. Reverse
transcription was primed with the oligo-dT, utilizing SuperScriptTMIII RNase H enzyme
according to the manufacturers instructions (Invitrogen 18080-044). Real-time PCR reactions of
25 µl were performed with SYBR Green I dye (50x) using a modification of published protocols
(Yin, Shackel et al. 2001). The PCR reactions required optimization with SYBR Green to ensure
that only the target genes were amplified. Optimisation primarily consisted of alterations to the
25
annealing temperature to increase the stringency of the reaction for each gene. The sequences of
the gene specific primers for amplification using SYBR Geen I were commercially available
from the manufacturer of the AtlasTM human cancer arrays (Clontech) and were synthesised by
Proligo Australia Pty Ltd. No-template controls and no-RT controls were included in each
reaction and no amplification was observed with these controls. A set of cDNA standards was
included in each real-time PCR reaction.
After completion of each PCR amplification, the data was analysed with Sequence detector
software (version 1.7 – supplied by PE Applied Biosystems). The threshold cycle (CT) was
calculated as the cycle number at which the increase in the intensity of fluorescence of the
reporter dye crossed a baseline. Quantification of the samples could then be calculated from the
CT by interpolation from the standard curve. The data values were normalised to G3PDH yielding
a normalised ratio, which enabled a comparison of the cDNA levels of each particular gene
between different samples.
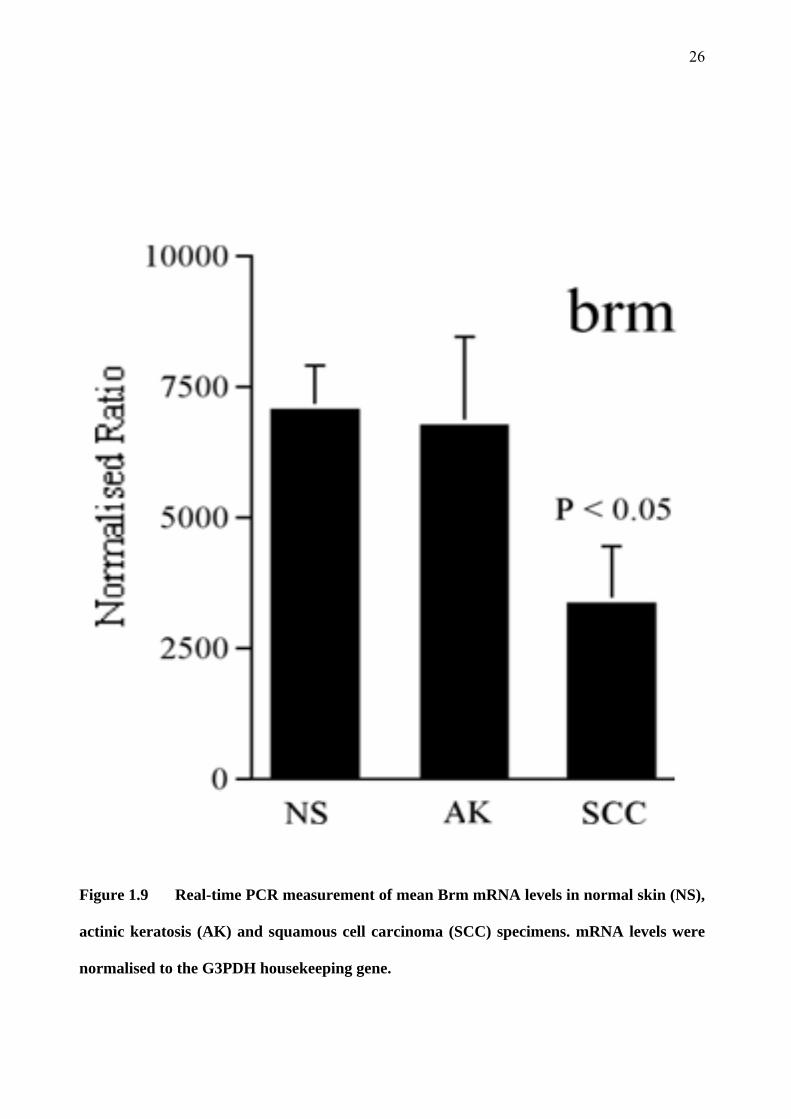
1.3.3 Brm messenger RNA is down-regulated in SCC compared to AK and normal skin
Brm was identified by the cDNA array as being down-regulated in SCC when compared to AK or
normal skin samples. This result was confirmed by real-time PCR (see Figure 1.9) and was
statistically significant, with a P value of less than 0.05. This preliminary finding lead to this
project, which aims to determine if Brm and its associated gene Brg-1 are down-regulated at the
protein level in human SCC, AK and normal skin specimens.
26
Figure 1.9 Real-time PCR measurement of mean Brm mRNA levels in normal skin (NS),
actinic keratosis (AK) and squamous cell carcinoma (SCC) specimens. mRNA levels were
normalised to the G3PDH housekeeping gene.
27
1.4 Snail 1 and 2
1.4.1 Definition
The Snail superfamily proteins are zinc-finger transcription factors. They were first described in
Drosophilia melanogaster where they were shown to be necessary for the formation of mesoderm
(Boulay, Dennefeld et al. 1987). Snail genes encode transcription factors of the zinc-finger type.
They are composed of a highly-conserved carboxy-terminal region which contains several zinc
fingers and a more variable amino-terminal region. The zinc fingers function as sequence-specific
DNA-binding motifs. Upon binding, Snail acts as a transcriptional repressor (Martinez-Estrada,
Culleres et al. 2006).
1.4.2 Functions of Snail 1 and Snail 2
In humans, there are three snail genes: Snail 1 and Snail 2, previously known as Snail and Slug
respectively, and Snail 3. Snail genes are best known for their involvement in epithelial to
mesenchymal transition (EMT) (Barrallo-Gimeno and Nieto 2005; Zhang, Wang et al. 2005;
Dhasarathy, Kajita et al. 2007). EMT is a co-coordinated program of loss of cell adhesion,
repression of E-cadherin expression, and increased cell mobility. This is essential for numerous
developmental processes including formation of the neural tube and mesoderm during normal
embryonic development. However, further studies postulate some additional roles for Snail.
There is evidence to suggest that Snail, by down-regulating E-cadherin transcription enables and
regulates the adhesion and migration of cells (Batlle, Sancho et al. 2000; Bolos, Peinado et al.
2003). It has even been shown to play a role in the migration of cells in situations where full
EMT is not required (Leroy and Mostov 2007). Snail also has a function in protecting cells from
death, both by direct apoptosis and by loss of survival factors (Vega, Morales et al. 2004).
The first discovered function of Snail was its role in EMT. Snail is initially expressed in the
prospective mesoderm where it acts as a repressor, inhibiting the expression of neuroectodermal
28
genes. Thus, by inhibiting alternative fates, Snail induces mesoderm formation (Nieto 2002).
Snail carries out this function in a wide array of organisms including insects, fish and mammals.
Snail also plays a role in the development of the neural crest, during which the mesoderm and
neural tube must delaminate and migrate. The triggering of EMT leads to conversion of epithelial
cells into mesenchymal cells which are then able to migrate through the extracellular matrix. This
conversion of epithelial cells into mesenchymal cells is achieved through the direct repression of
E-cadherin. In addition to this effect on E-cadherin, Snail also down-regulates other epithelial
markers such as desmoplakin, Muc-1 (an epithelial mucin) and cytokeratin-18; and up-regulates
mesenchymal markers such as vimectin and fibronectin (Nieto 2002).
An EMT-independent function of Snail is the protection of cells from induced death. One
example of this is the Snail-mediated survival of epithelial cells at the medial edge of the
developing palate. This occurs in the pathological situation of cleft palate, where the two palatal
shelves do not develop properly and do not fuse in the midline (Martinez-Alvarez, Blanco et al.
2004). Snail 1-expressing cells are also able to survive being deprived of survival factors, are
resistant to direct apoptotic stimuli and are resistant to DNA damage (Kajita, McClinic et al.
2004). In certain human leukaemias, a chromosomal translocation leads to the swapping of the
repression domain of hepatic leukaemic factor for the E2A-positive transactivation domain. This
leads to the activation of Snail 2, which then represses the apoptosis activator EGL-1 and renders
the anti-apoptosis protein Bcl-2 active. This leads to cell survival and leukaemia (Inukai, Inoue et
al. 1999).
Evidence suggests that Snail genes also regulate cell-adhesion and migration. Snail 2 expression
is up-regulated in keratinocytes at wound edges during re-epithelialisation. Up-regulation of Snail
2 also leads to increased cell spreading and desmosomal disruption in keratinocytes grown in
vitro (Savagner, Kusewitt et al. 2005).
29
1.4.3 Associations with cancer
The normal functions of Snail thus include the regulation of cell movement and cell survival.
These functions are essential for normal embryological development; however in the adult they
can have a role in tumour progression. The loss of normal epithelial differentiation processes is
critical both to the formation of tumours from normal epithelium and to the progression of those
tumours to invasive, metastatic carcinomas. When cells within tumours undergo a frank loss of
epithelial differentiation characteristics, they undergo an EMT, resulting in a loss of cell-cell
contact and a gain of invasiveness. This allows tumour cells to delaminate from the primary
tumour and intravasate into blood vessels or lymphatics. Snail 1 and 2 cause epithelial cells to
down-regulate terminal differentiation genes and to undergo an EMT, and their mRNA levels
have been shown to be up-regulated in certain cancers, including SCC (Barrallo-Gimeno and
Nieto 2005; Higashikawa, Yoneda et al. 2007). Indeed, various analyses of biopsies taken from
other sarcomas and epithelial tumours including breast tumours (Blanco, Moreno-Bueno et al.
2002), gastric cancers (Rosivatz, Becker et al. 2002), hepatocellular carcinomas (Sugimachi,
Tanaka et al. 2003), colon cancers (Palmer, Larriba et al. 2004), thyroid cancers (Hardy, Vicente-
Duenas et al. 2007) and synovial sarcomas (Saito, Oda et al. 2004) have found that the level of
Snail expression correlates with reduced E-cadherin expression, less differentiated tumours and
increased invasiveness.
1.5 Aims of this project
Although genetic abnormalities involved at the early stages of tumorigenesis have been described
for skin cancer, little is known about the changes that occur in the later transition of AK into
SCC. Recent research by our group has identified Brm as a gene that is down regulated in the
transition from benign AK into malignant SCC. We hypothesise that Brm is a tumour suppressor
gene involved in the photocarcinogenesis of SCC. It is predicted that there will be a decrease in
the protein product of the Brm gene in SCC compared to AK and normal skin as detected by

30
immunohistochemistry. This is a novel observation because there has been no published data to
date identifying Brm as being involved in this stage of malignant transformation. The aim of my
project is to study Brm and Brg-1 protein expression in normal human skin as well as AK and
SCC specimens.
This project will also determine whether Snail 1 and Snail 2 proteins are up-regulated in SCC
compared to normal skin and AK. It will also be determined whether there is an increased
expression of Snail 1 and Snail 2 in moderately or poorly differentiated SCC when compared to
well-differentiated SCC. We hypothesise that increased expression of Snail 1 and Snail 2 will be
associated with a loss of epithelial differentiation and a gain of invasiveness. This may represent
a crucial event with regards to malignant conversion and gain of metastatic potential.
31
Chapter 2 Materials and Methods
2.1 Ethical approval
Ethical approval for this study was obtained from the Human Ethics Review Committee of the
Sydney South West Area Health Service (Royal Prince Alfred Hospital Zone). Patients freely
volunteered to take part in this study. The study was explained to each patient, and each patient
received a patient information sheet (Appendix 1). Informed written consent was obtained for
each patient (see Appendix 2 for an example of the consent form).
2.2 Patients
Fresh specimens of AK, SCC, BCC and normal skin were collected from patients attending the
dermatology clinics at Royal Prince Alfred Hospital (RPAH). Specimens were also collected
from the operating theatre of plastic surgeon Mr Ken Lee also at RPAH.
A short interview was conducted with each patient, during which a medical history was taken.
The patient’s age, sex and Fitzpatrick skin type were documented (Fitzpatrick 1988). Lesion
characteristics such as size, site and clinical appearance were also documented. Each patient
completed a written questionnaire regarding racial background, occupational/recreational sun
exposure, family history of skin cancer and skin protection habits (Appendix 3).
Patients who were immunosuppressed by either medication or illness were excluded from the
study. Lesions that were too small, had been previously treated with cryotherapy, topical
imiquimod, or photodynamic therapy were excluded, as were any lesions from which a biopsy
had been previously taken.
32
2.3 Specimens
Samples of SCC were excised either in the dermatology clinics or the operating theatre as per
routine clinical treatment. Excision specimens were wrapped in saline-soaked gauze and placed
on ice. Specimens were immediately taken to the Pathology Department of RPAH where a
trained pathologist familiar with the project selected a central portion of the tumour to be used for
the project. This portion of the tumour was removed with a 3-4 mm punch biopsy tool. The
remainder of the specimen was placed in formalin and processed as usual. The central study
specimen was immediately returned to the laboratory where it was orientated in OCT in a 10 x 10
x 5 mm cryomold. The sample was then snap frozen in liquid nitrogen and stored at –70ºC in the
Dermatology Research Laboratory at the University of Sydney until processing.
In contrast to SCC, the standard therapy for AK is cryotherapy with liquid nitrogen rather than
excision. For this study, patients volunteered to have their AK excised with a 4-6 mm punch
biopsy set. The specimen was then wrapped in saline-soaked gauze and taken immediately to the
Pathology Department were it was bisected by a trained pathologist familiar with the study. One
half of the specimen was snap frozen and stored as per SCC specimens, the other half was placed
in formalin for routine histopathology to confirm the diagnosis.
All patients having a specimen excised were offered the opportunity to provide a sample of
normal skin towards the study. These samples were taken either from sun-exposed areas of skin
(dorsal forearm) or non-sun-exposed areas (buttock or upper inner arm). These specimens were
excised using a 3-4 mm punch biopsy set and were wrapped in saline-soaked gauze, snap-frozen
and stored as per SCC specimens.
33
2.4 Diagnosis
Diagnosis of lesions was based on both clinical and histological features. Only lesions with
typical clinical and histological features of SCC and AK were included in this study. During
collection, some lesions were classified as BCC and these were also included.
All lesions were clinically assessed either by a dermatologist, dermatology registrar or plastic
surgeon prior to excision. The clinical features of SCC and AK are described in section 1.1.3.
Each SCC and AK specimen was examined and reported histologically using the formalin-fixed,
paraffin-embedded haematoxylin and eosin-stained sections prepared by the Anatomical
Pathology department of RPAH. These specimens were all examined by a single trained dermato-
pathologist (Dr Richard Scolyer) for consistency. The degree of differentiation of each lesion was
also noted (poorly, moderately or well-differentiated).
2.5 Establishing the Specificity and Sensitivity of Antibodies
A particular challenge for this project was to establish the sensitivity and specificity of the
primary antibodies used to detect the proteins of interest. The Brm and Brg-1 genes are very
similar with a high degree of homology (75% identical and 86% similar). As a result, many
commercially available antibodies for Brm have been found to cross react with Brg-1 and vice
versa (Reisman, Sciarrotta et al. 2005). Similarly, there is a high degree of homology between
Snail 1 and Snail 2 (Hemavathy, Ashraf et al. 2000; Manzanares, Locascio et al. 2001; Bolos,
Peinado et al. 2003). For this reason, and for scientific rigor, the sensitivity and specificity of all
primary antibodies were tested.
34
In order to verify the specificity of the primary antibodies, it was necessary to transfect human
cell lines known to be negative for the proteins of interest with genes coding for those proteins.
The wild type and transfected cell lines were then stained with the primary antibodies to establish
whether they were sensitive (staining of transfected cells) and specific (no staining of the wild
type cells or those transfected with the other related genes).
The cell lines chosen were SW13 (human adrenal carcinoma) for Brm and Brg-1, and HN13
(human tongue SCC) for Snail 1 and Snail 2. Data from our research laboratory as well as others
has shown that mRNA levels for Brm and Brg-1 in SW13 cells is either zero or almost zero when
compared to the housekeeping gene GAPDH (Zhao, Wang et al. 1998). Similar findings have
also been previously published (Strobeck, Reisman et al. 2002; Yamamichi-Nishina, Ito et al.
2003). Similarly, the human cell line HN13 was chosen as Snail 1 and Snail 2 mRNA levels were
found to be very low in this particular cell line (Lyons, personal communication).
2.6 Molecular Techniques
2.6.1 Cell Culture
Human cell lines were cultured in Dulbecco’s Modified Eagle Medium (Sigma-Aldrich, St.
Louis, USA) supplemented with 10% foetal calf serum and 100 µg/ml penicillin/streptomycin in
25 cm2 tissue culture flasks. These cultures were maintained in incubators at 37°C with 5% CO2.
Cell lines were subdivided on a weekly basis or as required.
2.6.2 Chamber Slides
Transfected and non-transfected human cell lines were grown in BD Falcon culture slides (BD
Biosciences, Franklin Lakes, USA) as per the cell culture conditions. Each culture slide contained
4 partitioned chambers in which cells were grown. Chamber slides were used for
immunohistochemical staining of transfected and non-transfected human cell lines.
35
2.6.3 Plasmid Construction
Plasmids containing the human Brm and Brg-1 genes were constructed using restriction digestion
and ligation reactions. The Brm coding segment of a Brm-Flag/ENTR-FL plasmid was excised
using Xba I and HindIII restriction enzymes. The Brg-1 coding segment of a Brg-1-Flag/ENTR-
FL plasmid was excised using the NdeI restriction enzyme. These restriction digests provided the
DNA inserts for two new plasmids. The vector plasmid CEFL2 was cleaved at the corresponding
restriction sites.
Using the Brm-Flag and Brg-1-Flag inserts and the cleaved CEFL2 destination vector, a T4 DNA
ligase reaction was performed. The resulting plasmids were used to transform Top Ten competent
E.coli bacteria. The E.coli were subjected to heat shock at 42°C for 1 min and then grown in SOB
medium with MgCl2 in an orbital shaker at 37°C for 30 min. After 30 min, the E.coli were plated
onto LB and ampicillin plates and placed in an incubator at 37°C overnight.
The next day, single colonies were picked out and placed in terrific broth (TB) containing 100
µg/ml ampicillin. These clones were then grown overnight at 37°C in an orbital shaker.
In order to identify positive clones, plasmid minipreps were prepared for the selected colonies
using Promega PureYield Spin Columns (Promega, Fitchburg, USA). 1.5 ml of each culture was
placed into a microcentrifuge tube and centrifuged at 5200 g for 2 min. The supernatant was
removed and the cells were resuspended by vortexing in 500µl of STETL buffer. The tubes were
placed in a heating block at 100°C for 1 min, the solution then becoming a gelatinous precipitate.
The tubes were centrifuged at maximum speed for 15 min. A toothpick was then used to remove
the precipitate. 25 µl of 5M NaCl and 500 µl of iPrOH were added to the remaining supernatant
and the DNA was allowed to precipitate for 5 min at room temperature. The tubes were
36
microcentrifuged at maximum speed for 5 min and then the supernatant was aspirated away. The
remaining DNA pellet was dissolved in 100 µl of TE buffer containing 10 µl/ml RNAse and
incubated at 37°C for 10 min.
The Snail 1 and Snail 2 expression plasmids used were constructed by Dr Guy Lyons using
methods very similar to those described above.
2.6.4 Identification of positive clones
The subsequent DNA was subjected to restriction digestion with the restriction enzyme XhoI and
then run on a 1% agarose gel at 60V for 2 hours. Positive clones were identified by the predicted
banding pattern. For clones successfully transfected with the Brm expression plasmid, the
expected fragment sizes were 5738 and 5293 bp. For clones successfully transfected with the
Brg-1 expression plasmid, the expected fragment sizes were 8783 and 2308 bp. For clones
transfected with the CEFL2 plasmid, the expected fragment sizes were 5741 and 272 bp.
2.6.5 Maxi-preps of plasmids
Clones determined to be positive for the desired plasmid were identified as above. Approximately
100 µl of the mini-prep culture was inoculated into 500 ml of Terrific Broth with 100 µg/ml of
ampicillin and incubated at 37°C in an orbital shaker overnight. These maxi-preps were then
purified the next day to recover the plasmids produced.
2.6.6 Purification of plasmids
Plasmids were purified using Promega PureYield Spin Columns. Plasmid-containing E. coli
maxi-preps were grown overnight as described above. The cells were pelleted by centrifuging at
3,602 g for 15 minutes. The cell pellets were resuspended in 12 ml of Cell Resuspension
Solution. 12 ml of Cell Lysis Solution was added, the tubes were mixed by inverting 5 times and
37
incubated at room temperature for 3 minutes. 20 ml of Neutralisation Solution was added and the
tubes were again mixed by inverting 5 times. The tubes were incubated for another 3 minutes at
room temperature. The tubes were centrifuged at 3,602 g for 3 min to coagulate the precipitate.
The contents of the tube were filtered through three layers of Rediwipe cloth into 50 ml tubes.
The filtrate was poured into a blue Clearing column which had been placed in a clean 50 ml tube.
The column and tube were spun at 3,602 g for 5 minutes. The resulting filtrate was poured into a
white Binding column which had been placed in a clean 50 ml tube. This tube was spun at 3,602
g for 10 minutes. 5 ml of Endotoxin Removal Wash was added to the column which was then
spun at 3,602 g for 5 minutes. The tube was emptied and 20 ml of Column Wash was added. The
tubes were spun again at 3,602 g for 10 minutes. The white Binding Column was placed into a
clean 50 ml tube and 1 ml of distilled water was added to the column. The column was spun at
3,602 g for 5 minutes. The eluate was transferred to a clean 2 ml microcentrifuge tube and 50 µl
of 5M NaCl and 1100 µl of ethanol were added to precipitate the DNA. The tube was spun at full
speed in a microcentrifuge for 5 min, the supernatant was discarded and the pellets were washed
with 75% ethanol and allowed to dry. The pellets were resuspended in 200 µl of TE buffer and
the absorbance at 260 nm measured for a 1:100 dilution. Using this concentration measurement,
TE buffer was added to achieve a final plasmid concentration of 1 mg/ml
2.6.7 Transfection of cell lines
Cell lines were subdivided one day prior to transfection so that they would be at least 90%
confluent at the time of transfection. Transfections were carried out in 10 cm diameter tissue
culture Petri dishes. Cells were washed with 10 ml of serum-free medium per plate. For each
Petri dish, 2 µg (2 µl) of a reporter plasmid, CEFL2-EGFP and 615 µl of serum-free medium was
mixed with 8 µg (8 µl) of either the Brm-Flag-CEFL2, Brg-1-Flag-CEFL2, Snail 1-CEFL2 or
Snail 2-CEFL2 plasmid. To each mix, 25 µl of Lipofectamine 2000 (Invitrogen, Carlsbad, USA)
38
and 600 µl of serum-free medium was added. The resulting 1250 µl mix was then incubated at
room temperature for 20 minutes. After 20 minutes, a further 1250 µl of serum-free medium was
added to each mix and the total volume was then added to the cell culture dishes being
transfected. The dishes were placed in an incubator at 37°C with 5% CO2. After four hours, the
medium was replaced with normal serum-containing medium as per usual cell culture methods.
The transfected cell lines were monitored daily for fluorescence using an inverted fluorescent
microscope. 48 hours after transfection, cells were collected from the plates by using the enzyme
trypsin and subdivided at a ratio of 1:10 into BD Falcon Culture slides and allowed to adhere
overnight. Maximum fluorescence was achieved 72 hours after transfection. At this time, the
medium was removed and replaced with PBS. The cells were then photographed using a digital
camera attached to the inverted fluorescent microscope.
2.6.8 Fixation of chamber slides
After photographs of the cells were taken, the slides were fixed with cold acetone (-20°C) for 10
min. The acetone was then removed and the slides allowed to air dry at room temperature
overnight. Slides not immediately used were wrapped in foil, back-to-back, and stored at -70°C
until required.
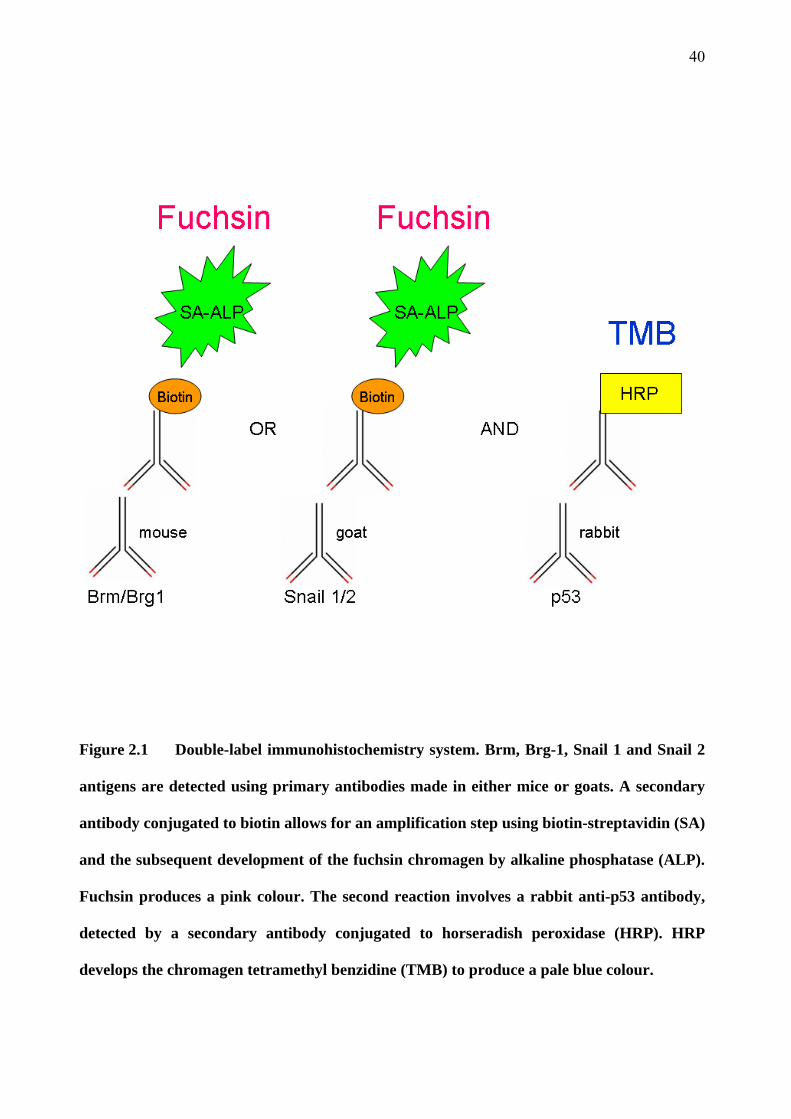
2.7 Double-label Immunohistochemistry
Double-label immunohistochemistry is a technique whereby two antigens may be detected
concurrently within a single tissue section. Two different immunohistochemical reactions were
utilised which did not cross react with each other (Figure 2.1). Each reaction used a different
enzyme to develop a chromagen, producing a different colour for each reaction. This technique
allowed the two colours produced to be discriminated from each other and from a third colour

39
that resulted from the two chromagens mixed. The mixed colour indicated areas of co-
localisation. The final immunohistochemistry protocol used was adapted from that used by van
der Loos (van der Loos 1999). The immunohistochemistry methods are described in detail in the
following sections. For a summary of the final immunohistochemistry protocol used in the
staining of specimens, see Appendix 4. See Appendix 5 for the protocol used to prepare various
solutions that were used for immunohistochemical staining in this project.
40
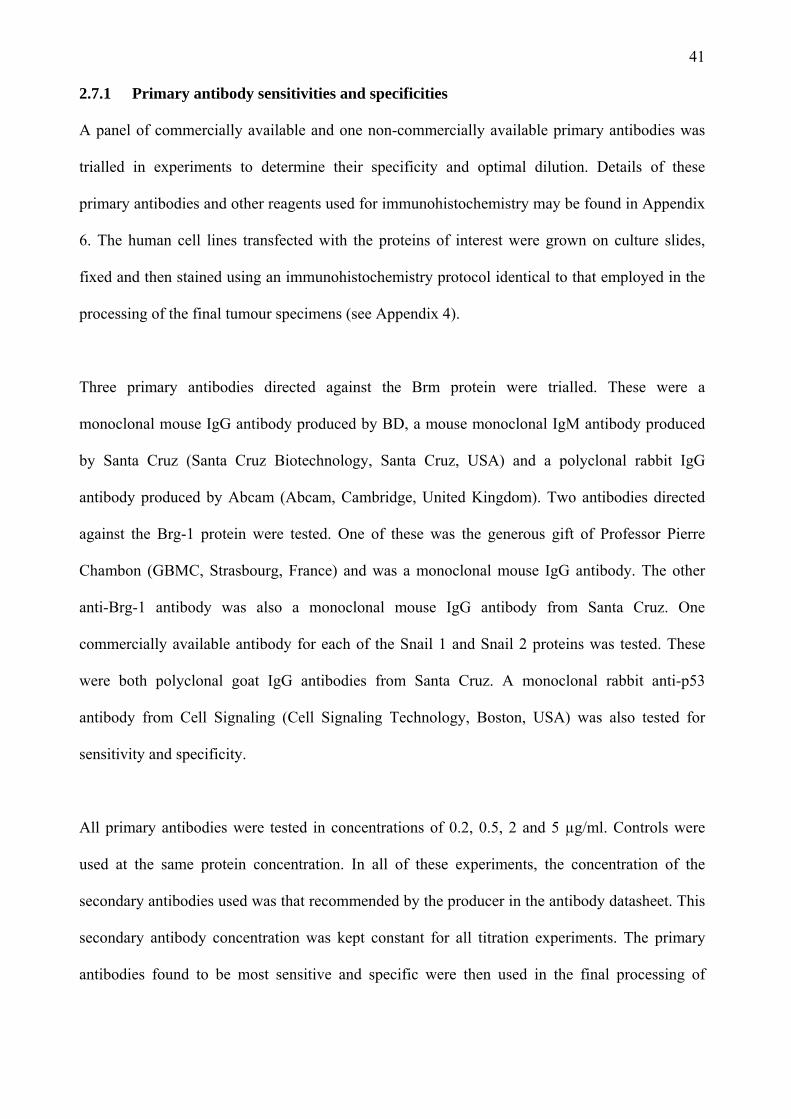
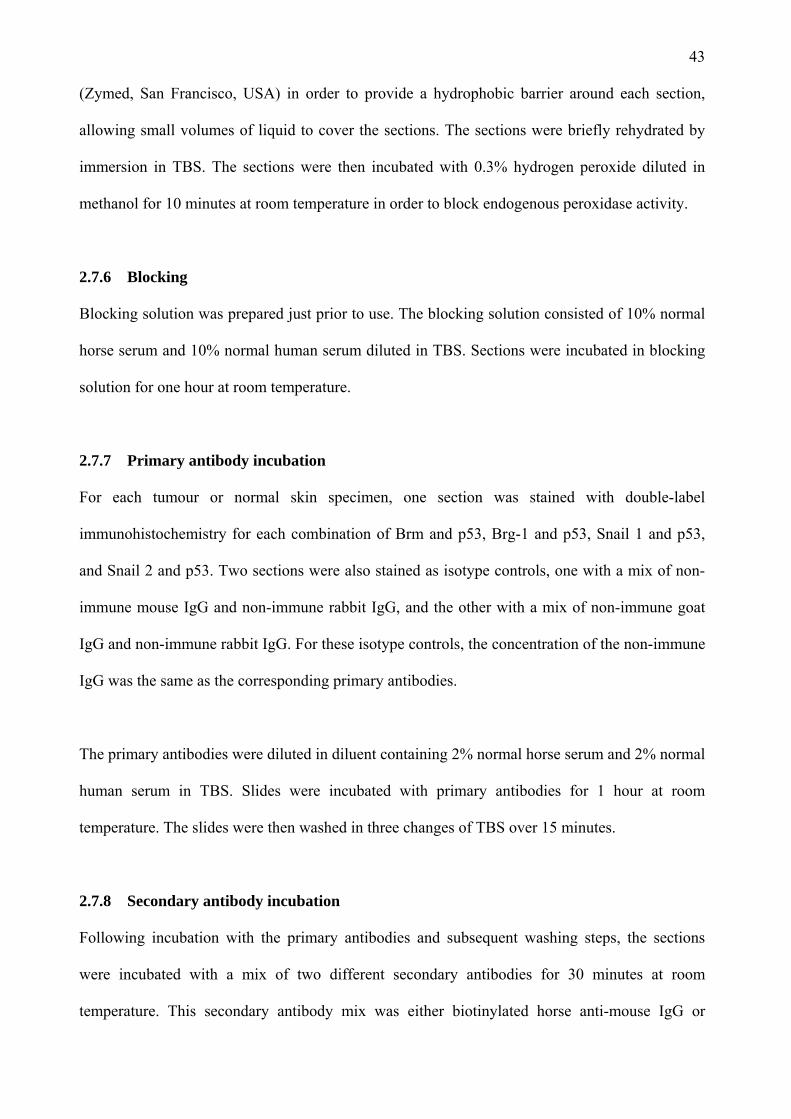
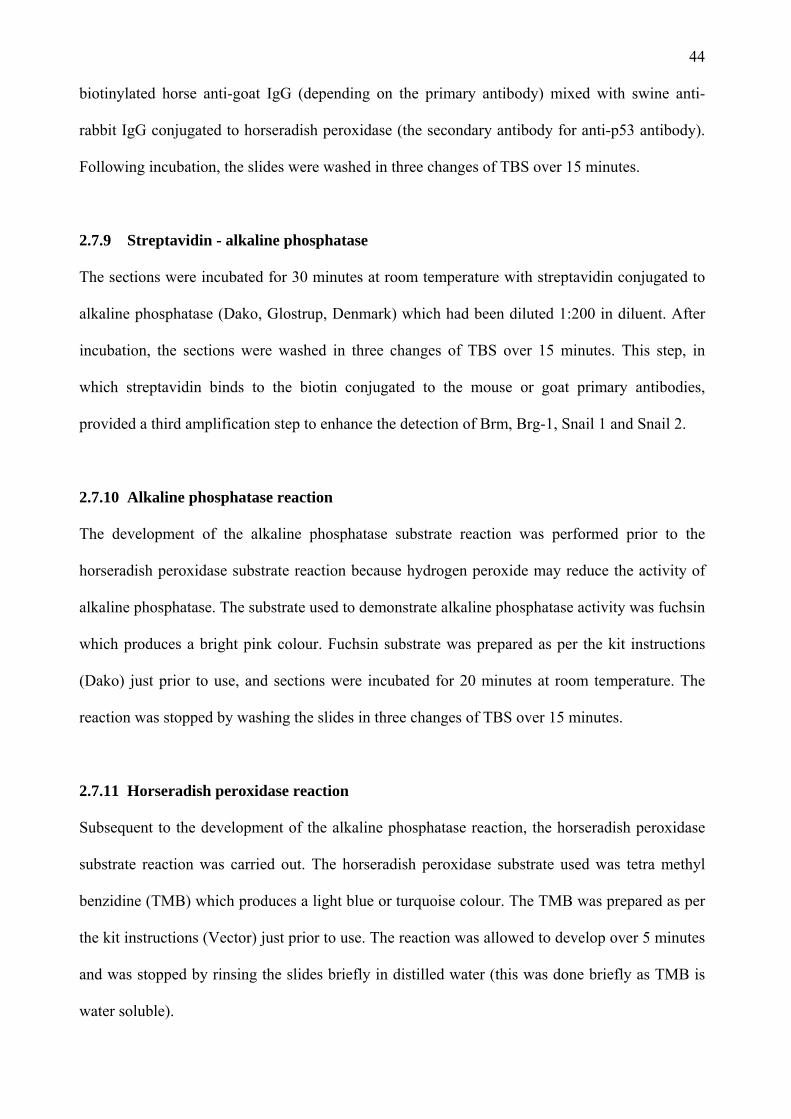
Figure 2.1 Double-label immunohistochemistry system. Brm, Brg-1, Snail 1 and Snail 2
antigens are detected using primary antibodies made in either mice or goats. A secondary
antibody conjugated to biotin allows for an amplification step using biotin-streptavidin (SA)
and the subsequent development of the fuchsin chromagen by alkaline phosphatase (ALP).
Fuchsin produces a pink colour. The second reaction involves a rabbit anti-p53 antibody,
detected by a secondary antibody conjugated to horseradish peroxidase (HRP). HRP
develops the chromagen tetramethyl benzidine (TMB) to produce a pale blue colour.
41
2.7.1 Primary antibody sensitivities and specificities
A panel of commercially available and one non-commercially available primary antibodies was
trialled in experiments to determine their specificity and optimal dilution. Details of these
primary antibodies and other reagents used for immunohistochemistry may be found in Appendix
6. The human cell lines transfected with the proteins of interest were grown on culture slides,
fixed and then stained using an immunohistochemistry protocol identical to that employed in the
processing of the final tumour specimens (see Appendix 4).
Three primary antibodies directed against the Brm protein were trialled. These were a
monoclonal mouse IgG antibody produced by BD, a mouse monoclonal IgM antibody produced
by Santa Cruz (Santa Cruz Biotechnology, Santa Cruz, USA) and a polyclonal rabbit IgG
antibody produced by Abcam (Abcam, Cambridge, United Kingdom). Two antibodies directed
against the Brg-1 protein were tested. One of these was the generous gift of Professor Pierre
Chambon (GBMC, Strasbourg, France) and was a monoclonal mouse IgG antibody. The other
anti-Brg-1 antibody was also a monoclonal mouse IgG antibody from Santa Cruz. One
commercially available antibody for each of the Snail 1 and Snail 2 proteins was tested. These
were both polyclonal goat IgG antibodies from Santa Cruz. A monoclonal rabbit anti-p53
antibody from Cell Signaling (Cell Signaling Technology, Boston, USA) was also tested for
sensitivity and specificity.
All primary antibodies were tested in concentrations of 0.2, 0.5, 2 and 5 µg/ml. Controls were
used at the same protein concentration. In all of these experiments, the concentration of the
secondary antibodies used was that recommended by the producer in the antibody datasheet. This
secondary antibody concentration was kept constant for all titration experiments. The primary
antibodies found to be most sensitive and specific were then used in the final processing of

42
specimens. See Appendix 6 for the details and dilution factors of the various antibodies and
chromagens used in the processing of specimens.
2.7.2 Secondary antibody sensitivities and specificities
All secondary antibodies used were tested for specificity by observing for staining when
immunohistochemistry was performed using the secondary antibody with the alternative primary
antibody from a different animal species and observing for any positive staining. These
experiments were performed on transfected cell lines known to be positive for the antigen against
which the primary antibody was directed. For all the secondary antibodies used in this project, no
non-specific staining was observed.
2.7.3 Tissue sections
Frozen sections were cut on a cryostat by a single person in the Department of Pathology at the
University of Sydney. The resulting 8 µm thick sections were thaw-mounted onto Superfrost Plus
glass slides (Menzel-Gläser, Braunschweig, Germany) and allowed to air-dry overnight at 4°C.
The slides were then placed back-to-back and wrapped in foil for storage in a -70°C freezer until
required.
2.7.4 Tissue fixation
Sections were fixed by immersion in cold acetone (-20°C) for ten minutes and then air-dried.
After fixation, slides not to be used immediately were placed back-to-back and wrapped in foil.
The slides were then stored at –70°C until required.
2.7.5 Endogenous horseradish peroxidase block
On the day of staining, slides were removed from the –70°C freezer, unwrapped from the foil
wrapping and allowed to thaw to room temperature. The sections were ringed using a pap pen
43
(Zymed, San Francisco, USA) in order to provide a hydrophobic barrier around each section,
allowing small volumes of liquid to cover the sections. The sections were briefly rehydrated by
immersion in TBS. The sections were then incubated with 0.3% hydrogen peroxide diluted in
methanol for 10 minutes at room temperature in order to block endogenous peroxidase activity.
2.7.6 Blocking
Blocking solution was prepared just prior to use. The blocking solution consisted of 10% normal
horse serum and 10% normal human serum diluted in TBS. Sections were incubated in blocking
solution for one hour at room temperature.
2.7.7 Primary antibody incubation
For each tumour or normal skin specimen, one section was stained with double-label
immunohistochemistry for each combination of Brm and p53, Brg-1 and p53, Snail 1 and p53,
and Snail 2 and p53. Two sections were also stained as isotype controls, one with a mix of non-
immune mouse IgG and non-immune rabbit IgG, and the other with a mix of non-immune goat
IgG and non-immune rabbit IgG. For these isotype controls, the concentration of the non-immune
IgG was the same as the corresponding primary antibodies.
The primary antibodies were diluted in diluent containing 2% normal horse serum and 2% normal
human serum in TBS. Slides were incubated with primary antibodies for 1 hour at room
temperature. The slides were then washed in three changes of TBS over 15 minutes.
2.7.8 Secondary antibody incubation
Following incubation with the primary antibodies and subsequent washing steps, the sections
were incubated with a mix of two different secondary antibodies for 30 minutes at room
temperature. This secondary antibody mix was either biotinylated horse anti-mouse IgG or
44
biotinylated horse anti-goat IgG (depending on the primary antibody) mixed with swine anti-
rabbit IgG conjugated to horseradish peroxidase (the secondary antibody for anti-p53 antibody).
Following incubation, the slides were washed in three changes of TBS over 15 minutes.
2.7.9 Streptavidin - alkaline phosphatase
The sections were incubated for 30 minutes at room temperature with streptavidin conjugated to
alkaline phosphatase (Dako, Glostrup, Denmark) which had been diluted 1:200 in diluent. After
incubation, the sections were washed in three changes of TBS over 15 minutes. This step, in
which streptavidin binds to the biotin conjugated to the mouse or goat primary antibodies,
provided a third amplification step to enhance the detection of Brm, Brg-1, Snail 1 and Snail 2.
2.7.10 Alkaline phosphatase reaction
The development of the alkaline phosphatase substrate reaction was performed prior to the
horseradish peroxidase substrate reaction because hydrogen peroxide may reduce the activity of
alkaline phosphatase. The substrate used to demonstrate alkaline phosphatase activity was fuchsin
which produces a bright pink colour. Fuchsin substrate was prepared as per the kit instructions
(Dako) just prior to use, and sections were incubated for 20 minutes at room temperature. The
reaction was stopped by washing the slides in three changes of TBS over 15 minutes.
2.7.11 Horseradish peroxidase reaction
Subsequent to the development of the alkaline phosphatase reaction, the horseradish peroxidase
substrate reaction was carried out. The horseradish peroxidase substrate used was tetra methyl
benzidine (TMB) which produces a light blue or turquoise colour. The TMB was prepared as per
the kit instructions (Vector) just prior to use. The reaction was allowed to develop over 5 minutes
and was stopped by rinsing the slides briefly in distilled water (this was done briefly as TMB is
water soluble).
45
2.7.12 Dehydration and clearing of slides
Following a brief rinse in distilled water, the slides were dehydrated through grades of ethanol to
absolute ethanol and then cleared in two changes of xylene. The dehydration steps through
ethanol were done quickly as fuchsin is slightly soluble in ethanol. Once cleared in xylene, the
slides were allowed to air-dry at room temperature whilst protected from light by aluminium foil.
2.7.13 Mounting of slides
Once dry, the slides were mounted with DPX (an organic mounting medium) and a coverslip was
applied. As TMB fades with prolonged exposure to light, the slides were stored in a light-
impenetrable box at 4°C until photomicrographs were taken.
2.8 Image capture and processing
2.8.1 Image capture
Stained sections were examined using a light microscope (Olympus BH-2, Olympus Optical Co.
Ltd, Japan) using a 40x objective. All images were taken under the same conditions in terms of
light source intensity, exposure times, condenser setting, etc. All image capture was done in the
minimal number of sessions to minimize any variability that would affect the final image
analysis. Image files were captured using a digital camera and saved in .tif format at the highest
resolution possible.
2.8.2 Image analysis
Image analysis was performed using the ImageJ software from NIH (Collins 2007). The
epidermis was outlined freehand and the area of the epidermis was calculated in pixels. Using a
plugin of ImageJ (Plugins Segmentation Colour based thresholding), colour-based
thresholding was applied to the image. This plugin was available as part of the ‘MBF ImageJ for
Microscopy Collection by Tony Collins’. Two colour-based thresholds were applied, one
46
selecting for fuchsin colour alone (pale to medium pink), and another for areas of mixed fuchsin
and TMB (giving a deeper purple colour). The pixels falling within the threshold were selected,
whilst those pixels remaining outside of the threshold range were removed. The number of
selected pixels within the epidermis was then used to calculate the percentage of epidermal area
stained. A table of the selected pixels distributed by intensity value was exported to an excel
spreadsheet.
The colour-based thresholds were defined by specified values within the red, blue and green
channels. The same thresholds were then applied to each image from all specimen groups. This
method minimises human-introduced variability and error.
This method was applied to each tumour or normal skin section three times for each staining
combination. The three separate measurements were taken from different sections of the
epidermis. The mean value of the three measurements, expressed as a percentage of epidermal
area was used as the final value in subsequent analyses.
2.9 Statistical Analysis
Data were analysed using the statistical analysis package SPSS (SPSS Inc. Chicago, Illinois).
Data distribution was assessed using the independent samples t-test and the ANOVA test. For
data that did not show an approximately normal distribution, the Mann Whitney U test was used
(for example, to compare the ages of patients in different specimen groups). A P value of less
than 0.05 was regarded as significant.

47
Chapter 3 Results
3.1 Patient demographics
The age of patients ranged from 49 to 81 years in the SCC group (median 73 years), 60 to 85
years in the AK group (median 68 years) and 51 to 81 years in the normal skin group (median 75
years). There was no significant difference between the groups with respect to age (P < 0.05;
Mann-Whitney U test). The proportion of males to females was similar in the three main groups
with 10 males / 1 female in the SCC group, 10 males / no females in the AK group and 10 males /
no females in the normal skin group. The BCC group had a higher proportion of women than the
SCC, AK and NS groups, with 3 males and 3 females. All patients identified themselves as
Caucasian. The Fitzpatrick skin type varied from type I to IV. However, 63% of patients were of
Fitzpatrick skin type I, whilst only one patient had Fitzpatrick skin type IV.
3.2 Clinical and histological features
The lesions were all distributed on sun-exposed sites in all but one case (a BCC on the abdomen)
(Tables 3.1, 3.2, 3.3 and 3.4). Most SCC specimens were located on the head, with one SCC
collected from each of the lower leg, chest and back. The majority of AKs were collected from
the dorsal forearm and hand, with one AK collected from the face and one from the lower leg. All
normal skin specimens were collected from patients who were already having either an AK or a
suspected SCC excised. Half of the normal skin specimens were taken from habitually sun-
exposed regions (dorsal forearm) and the other half were collected from sites rarely exposed to
sunlight (either the buttock or the inner side of the proximal upper arm). The majority of normal
skin specimens were taken from patients who were donating AKs to the study. One normal skin
specimen was collected from a patient who also had a SCC excised for the study.
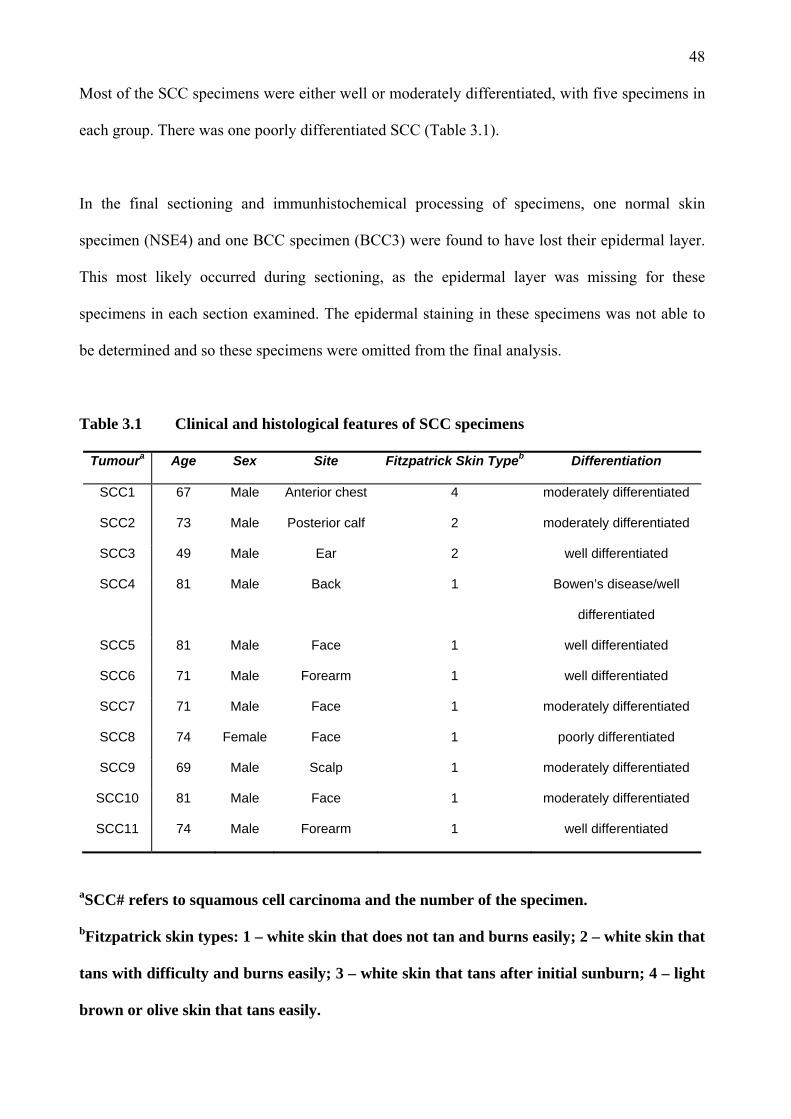
48
Most of the SCC specimens were either well or moderately differentiated, with five specimens in
each group. There was one poorly differentiated SCC (Table 3.1).
In the final sectioning and immunhistochemical processing of specimens, one normal skin
specimen (NSE4) and one BCC specimen (BCC3) were found to have lost their epidermal layer.
This most likely occurred during sectioning, as the epidermal layer was missing for these
specimens in each section examined. The epidermal staining in these specimens was not able to
be determined and so these specimens were omitted from the final analysis.
Table 3.1 Clinical and histological features of SCC specimens
Tumoura Age Sex Site Fitzpatrick Skin Typeb Differentiation
SCC1 67 Male Anterior chest 4 moderately differentiated
SCC2 73 Male Posterior calf 2 moderately differentiated
SCC3 49 Male Ear 2 well differentiated
SCC4 81 Male Back 1 Bowen’s disease/well
differentiated
SCC5 81 Male Face 1 well differentiated
SCC6 71 Male Forearm 1 well differentiated
SCC7 71 Male Face 1 moderately differentiated
SCC8 74 Female Face 1 poorly differentiated
SCC9 69 Male Scalp 1 moderately differentiated
SCC10 81 Male Face 1 moderately differentiated
SCC11 74 Male Forearm 1 well differentiated
aSCC# refers to squamous cell carcinoma and the number of the specimen.
bFitzpatrick skin types: 1 – white skin that does not tan and burns easily; 2 – white skin that
tans with difficulty and burns easily; 3 – white skin that tans after initial sunburn; 4 – light
brown or olive skin that tans easily.
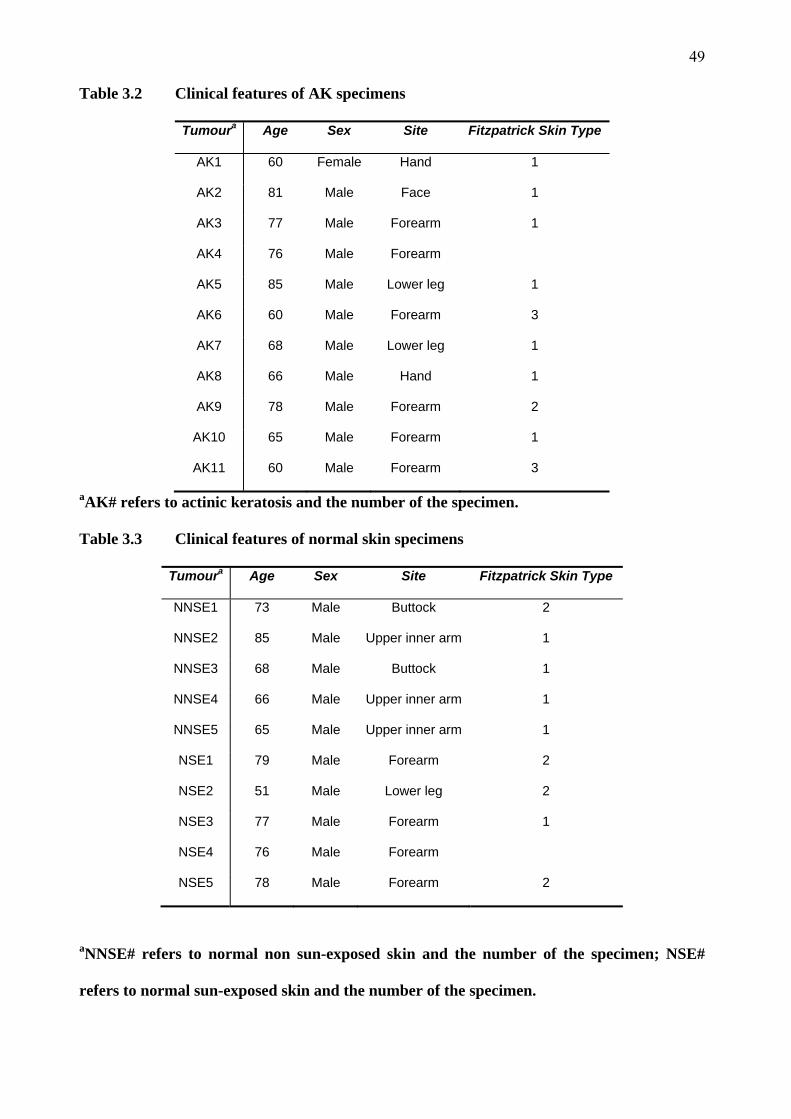
49
Table 3.2 Clinical features of AK specimens
Tumoura Age Sex Site Fitzpatrick Skin Type
AK1 60 Female Hand 1
AK2 81 Male Face 1
AK3 77 Male Forearm 1
AK4 76 Male Forearm
AK5 85 Male Lower leg 1
AK6 60 Male Forearm 3
AK7 68 Male Lower leg 1
AK8 66 Male Hand 1
AK9 78 Male Forearm 2
AK10 65 Male Forearm 1
AK11 60 Male Forearm 3
aAK# refers to actinic keratosis and the number of the specimen.
Table 3.3 Clinical features of normal skin specimens
Tumoura Age Sex Site Fitzpatrick Skin Type
NNSE1 73 Male Buttock 2
NNSE2 85 Male Upper inner arm 1
NNSE3 68 Male Buttock 1
NNSE4 66 Male Upper inner arm 1
NNSE5 65 Male Upper inner arm 1
NSE1 79 Male Forearm 2
NSE2 51 Male Lower leg 2
NSE3 77 Male Forearm 1
NSE4 76 Male Forearm
NSE5 78 Male Forearm 2
aNNSE# refers to normal non sun-exposed skin and the number of the specimen; NSE#
refers to normal sun-exposed skin and the number of the specimen.
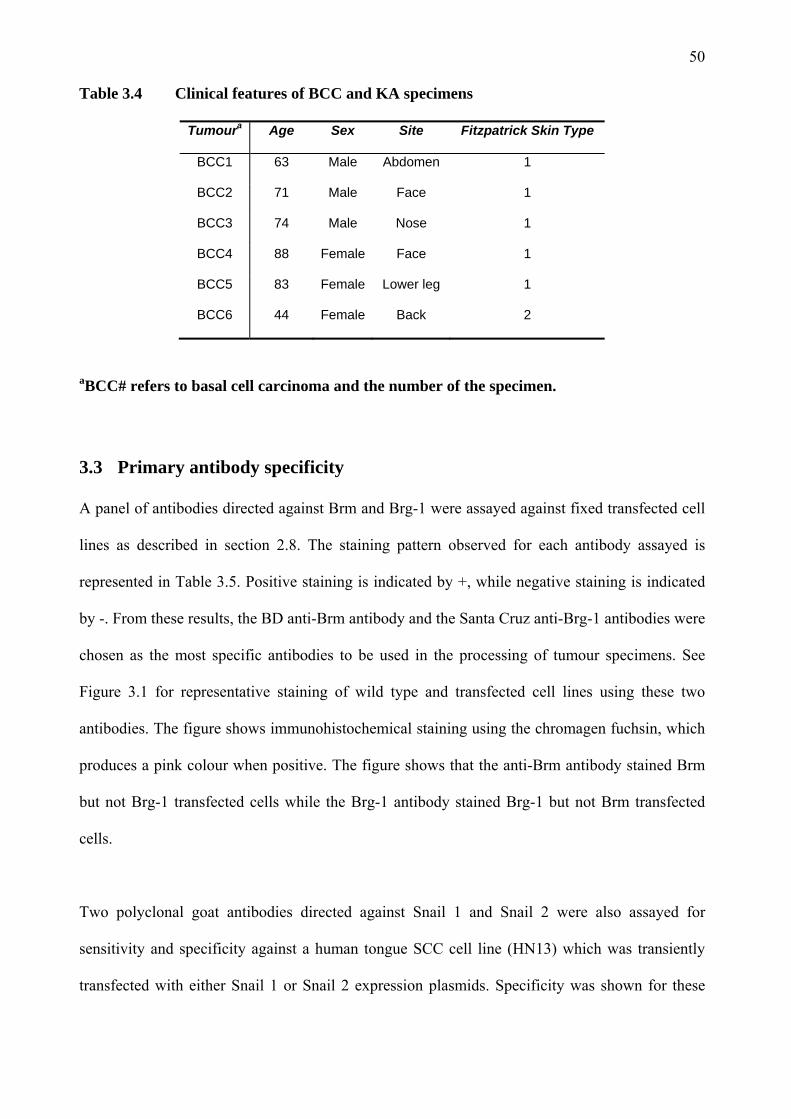
50
Table 3.4 Clinical features of BCC and KA specimens
Tumoura Age Sex Site Fitzpatrick Skin Type
BCC1 63 Male Abdomen 1
BCC2 71 Male Face 1
BCC3 74 Male Nose 1
BCC4 88 Female Face 1
BCC5 83 Female Lower leg 1
BCC6 44 Female Back 2
aBCC# refers to basal cell carcinoma and the number of the specimen.
3.3 Primary antibody specificity
A panel of antibodies directed against Brm and Brg-1 were assayed against fixed transfected cell
lines as described in section 2.8. The staining pattern observed for each antibody assayed is
represented in Table 3.5. Positive staining is indicated by +, while negative staining is indicated
by -. From these results, the BD anti-Brm antibody and the Santa Cruz anti-Brg-1 antibodies were
chosen as the most specific antibodies to be used in the processing of tumour specimens. See
Figure 3.1 for representative staining of wild type and transfected cell lines using these two
antibodies. The figure shows immunohistochemical staining using the chromagen fuchsin, which
produces a pink colour when positive. The figure shows that the anti-Brm antibody stained Brm
but not Brg-1 transfected cells while the Brg-1 antibody stained Brg-1 but not Brm transfected
cells.
Two polyclonal goat antibodies directed against Snail 1 and Snail 2 were also assayed for
sensitivity and specificity against a human tongue SCC cell line (HN13) which was transiently
transfected with either Snail 1 or Snail 2 expression plasmids. Specificity was shown for these

51
two antibodies using immunofluorescence. See Figure 3.2 for representative immunofluorescent
staining with these two primary antibodies. Positive staining is seen as green fluorescence.
A rabbit anti-p53 monoclonal antibody was tested for sensitivity and specificity by performing
immunohistochemical staining of the HaCaT keratinocyte and SCC9 human cell lines. These cell
lines were chosen because SCC9 has been previously determined to have little or no protein
expression of p53, while HaCaT cells over express p53 (St John, Sauter et al. 2000). The primary
antibody was found to be specific, with positive staining of HaCaT cells and no staining of SCC9
cells observed. The pattern of p53 staining observed was nuclear.
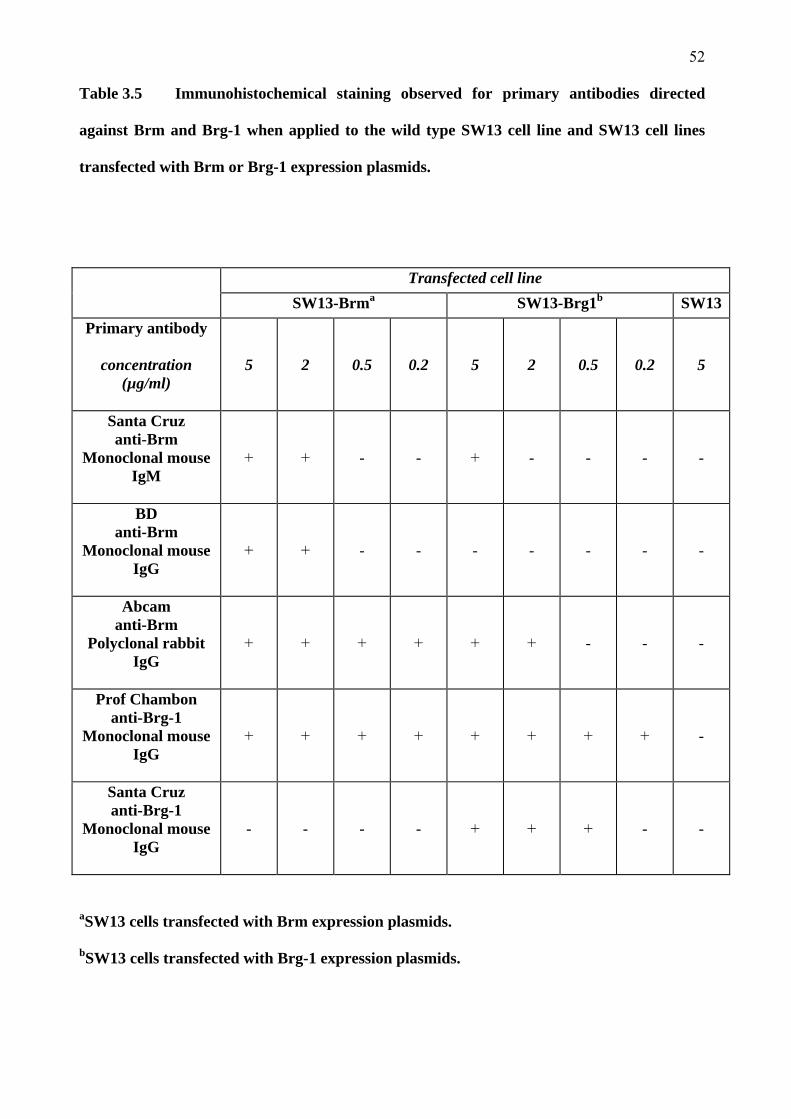
52
Table 3.5 Immunohistochemical staining observed for primary antibodies directed
against Brm and Brg-1 when applied to the wild type SW13 cell line and SW13 cell lines
transfected with Brm or Brg-1 expression plasmids.
Transfected cell line SW13-Brma SW13-Brg1b SW13
Primary antibody
concentration (µg/ml)
5
2
0.5
0.2
5
2
0.5
0.2
5
Santa Cruz anti-Brm
Monoclonal mouse IgM
+
+
-
-
+
-
-
-
-
BD anti-Brm
Monoclonal mouse IgG
+
+
-
-
-
-
-
-
-
Abcam anti-Brm
Polyclonal rabbit IgG
+
+
+
+
+
+
-
-
-
Prof Chambon anti-Brg-1
Monoclonal mouse IgG
+
+
+
+
+
+
+
+
-
Santa Cruz anti-Brg-1
Monoclonal mouse IgG
-
-
-
-
+
+
+
-
-
aSW13 cells transfected with Brm expression plasmids.
bSW13 cells transfected with Brg-1 expression plasmids.
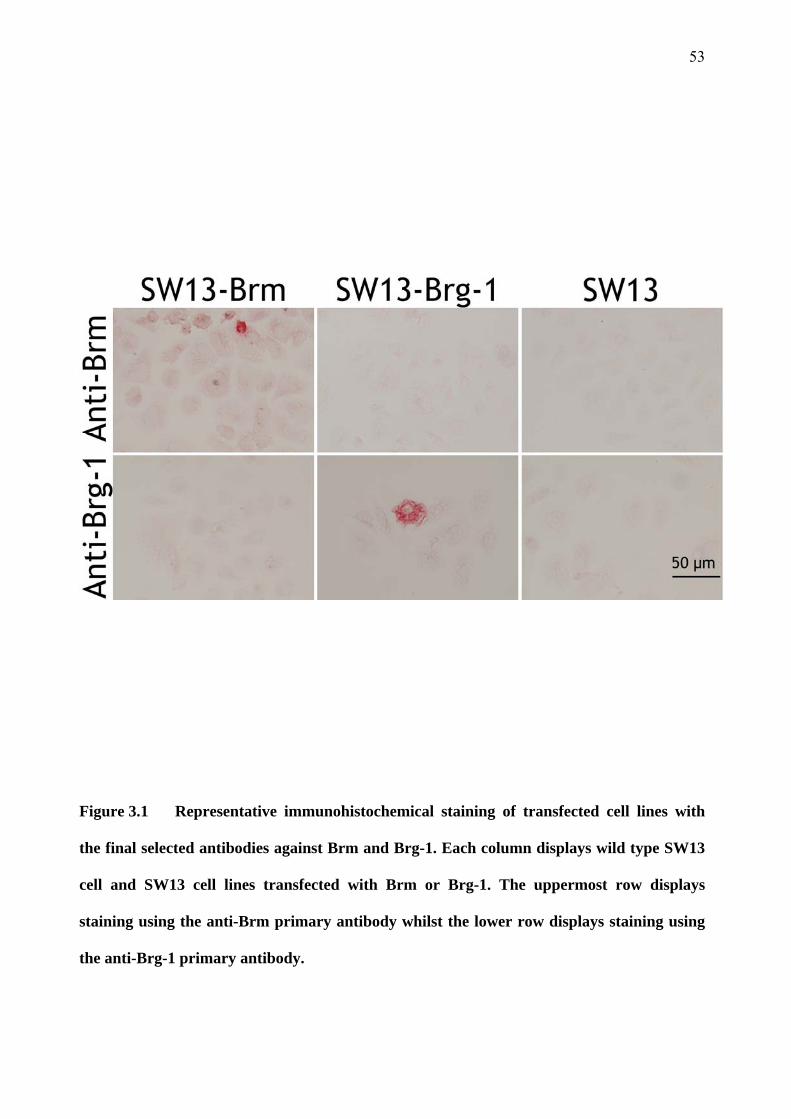
53
Figure 3.1 Representative immunohistochemical staining of transfected cell lines with
the final selected antibodies against Brm and Brg-1. Each column displays wild type SW13
cell and SW13 cell lines transfected with Brm or Brg-1. The uppermost row displays
staining using the anti-Brm primary antibody whilst the lower row displays staining using
the anti-Brg-1 primary antibody.
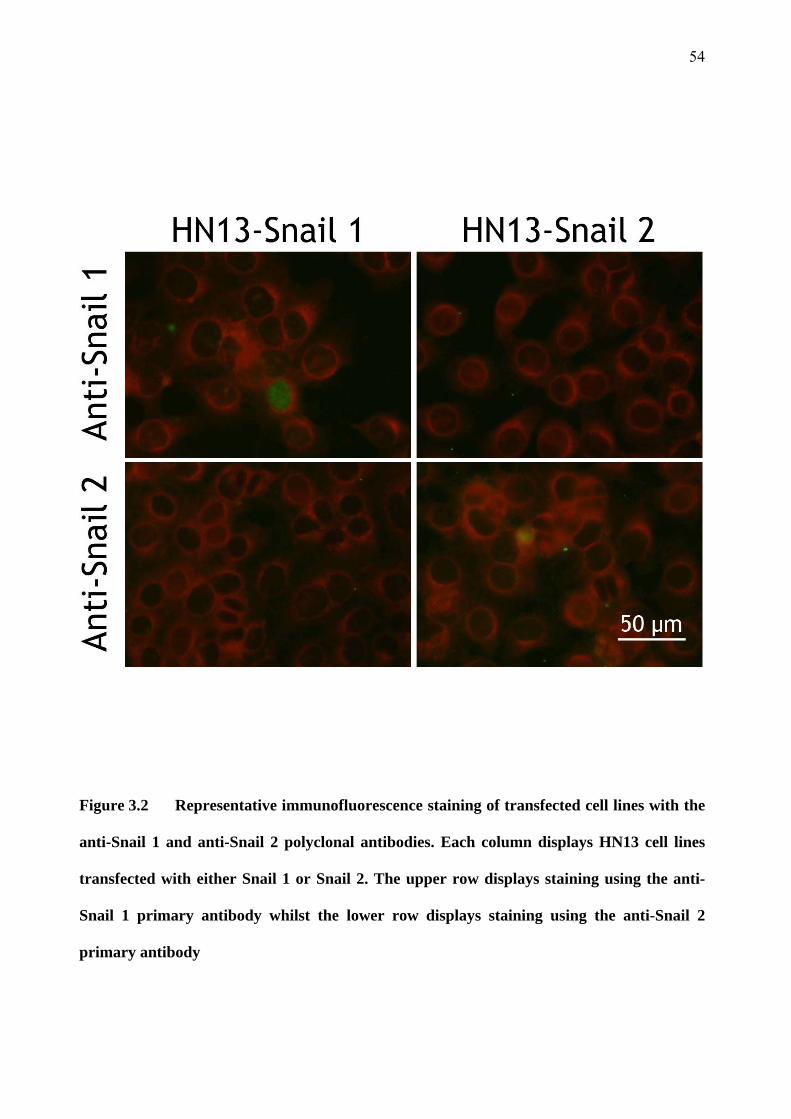
54
Figure 3.2 Representative immunofluorescence staining of transfected cell lines with the
anti-Snail 1 and anti-Snail 2 polyclonal antibodies. Each column displays HN13 cell lines
transfected with either Snail 1 or Snail 2. The upper row displays staining using the anti-
Snail 1 primary antibody whilst the lower row displays staining using the anti-Snail 2
primary antibody
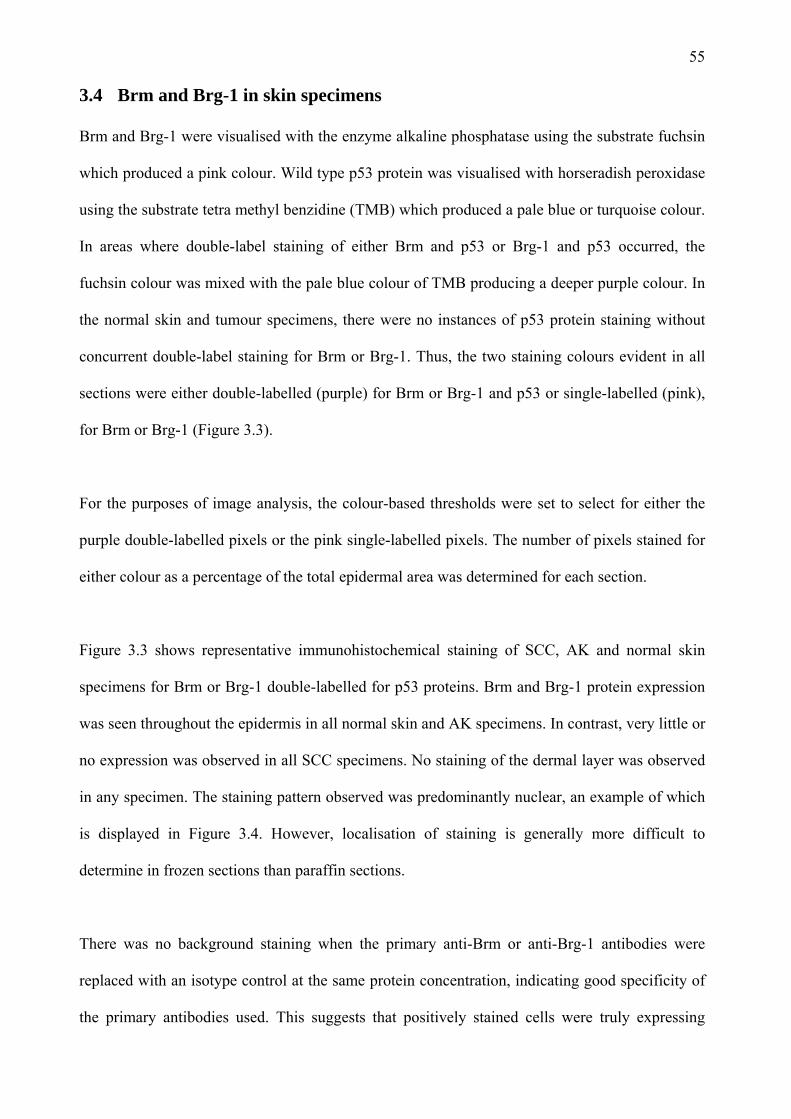
55
3.4 Brm and Brg-1 in skin specimens
Brm and Brg-1 were visualised with the enzyme alkaline phosphatase using the substrate fuchsin
which produced a pink colour. Wild type p53 protein was visualised with horseradish peroxidase
using the substrate tetra methyl benzidine (TMB) which produced a pale blue or turquoise colour.
In areas where double-label staining of either Brm and p53 or Brg-1 and p53 occurred, the
fuchsin colour was mixed with the pale blue colour of TMB producing a deeper purple colour. In
the normal skin and tumour specimens, there were no instances of p53 protein staining without
concurrent double-label staining for Brm or Brg-1. Thus, the two staining colours evident in all
sections were either double-labelled (purple) for Brm or Brg-1 and p53 or single-labelled (pink),
for Brm or Brg-1 (Figure 3.3).
For the purposes of image analysis, the colour-based thresholds were set to select for either the
purple double-labelled pixels or the pink single-labelled pixels. The number of pixels stained for
either colour as a percentage of the total epidermal area was determined for each section.
Figure 3.3 shows representative immunohistochemical staining of SCC, AK and normal skin
specimens for Brm or Brg-1 double-labelled for p53 proteins. Brm and Brg-1 protein expression
was seen throughout the epidermis in all normal skin and AK specimens. In contrast, very little or
no expression was observed in all SCC specimens. No staining of the dermal layer was observed
in any specimen. The staining pattern observed was predominantly nuclear, an example of which
is displayed in Figure 3.4. However, localisation of staining is generally more difficult to
determine in frozen sections than paraffin sections.
There was no background staining when the primary anti-Brm or anti-Brg-1 antibodies were
replaced with an isotype control at the same protein concentration, indicating good specificity of
the primary antibodies used. This suggests that positively stained cells were truly expressing
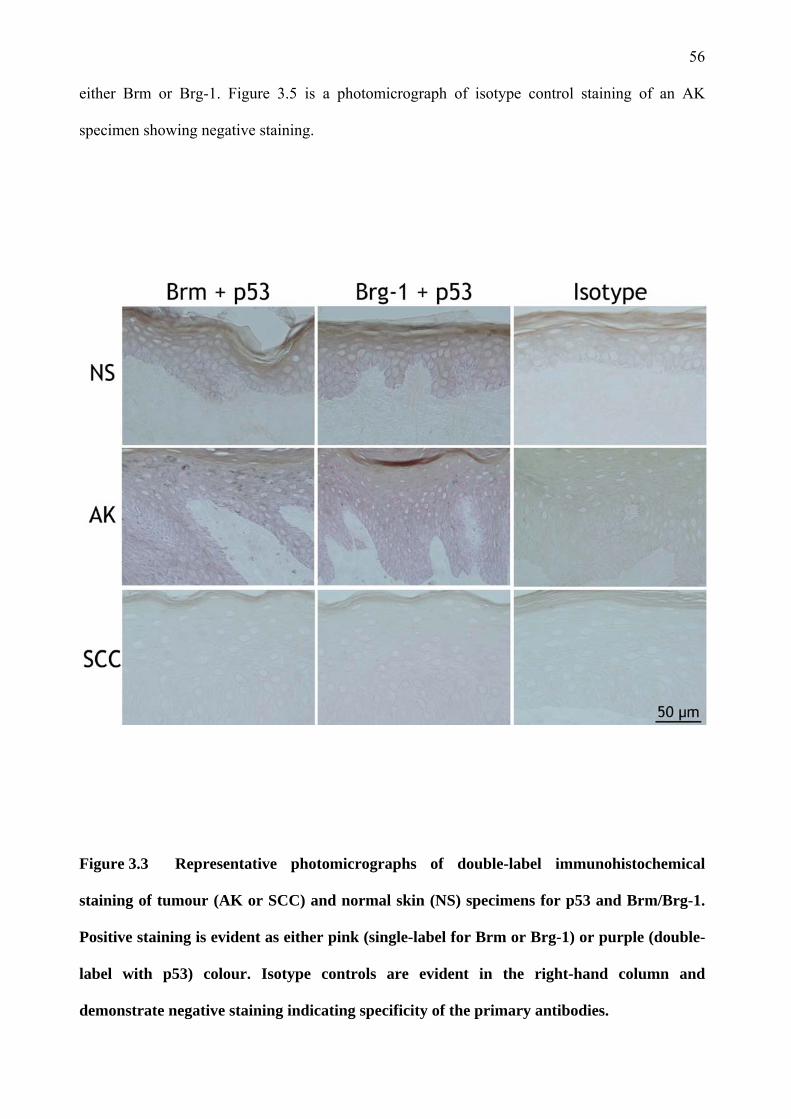
56
either Brm or Brg-1. Figure 3.5 is a photomicrograph of isotype control staining of an AK
specimen showing negative staining.
Figure 3.3 Representative photomicrographs of double-label immunohistochemical
staining of tumour (AK or SCC) and normal skin (NS) specimens for p53 and Brm/Brg-1.
Positive staining is evident as either pink (single-label for Brm or Brg-1) or purple (double-
label with p53) colour. Isotype controls are evident in the right-hand column and
demonstrate negative staining indicating specificity of the primary antibodies.
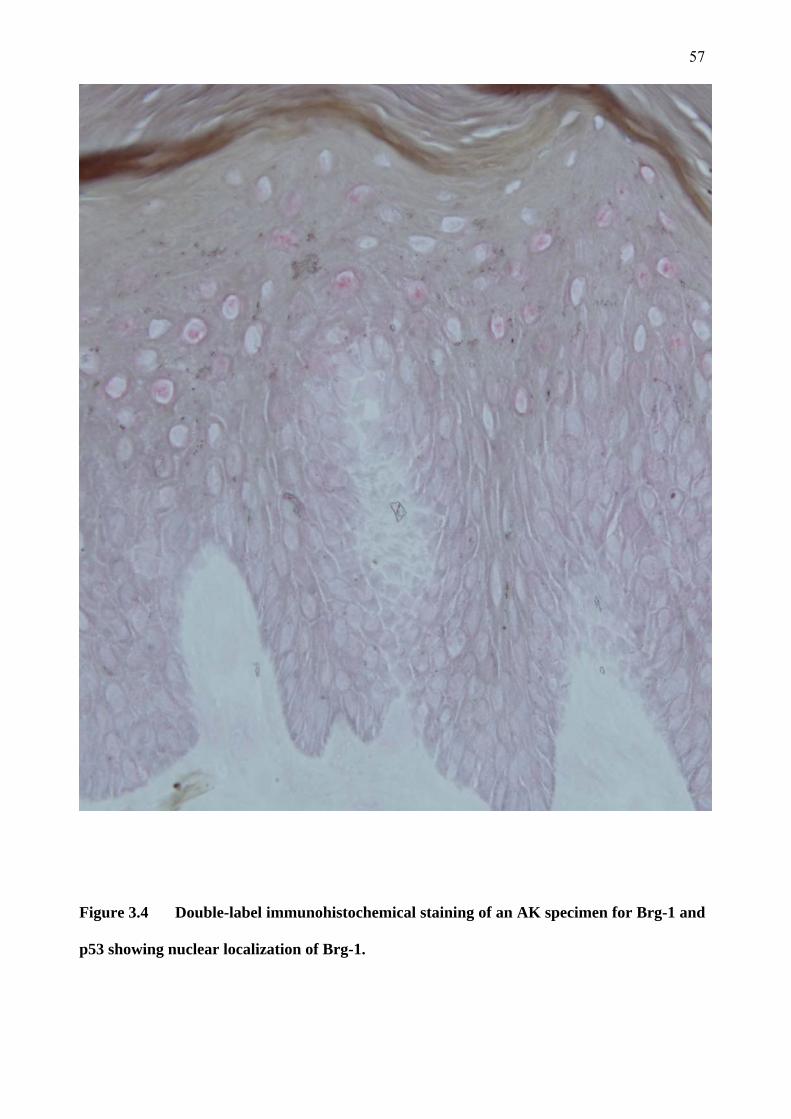
57
Figure 3.4 Double-label immunohistochemical staining of an AK specimen for Brg-1 and
p53 showing nuclear localization of Brg-1.
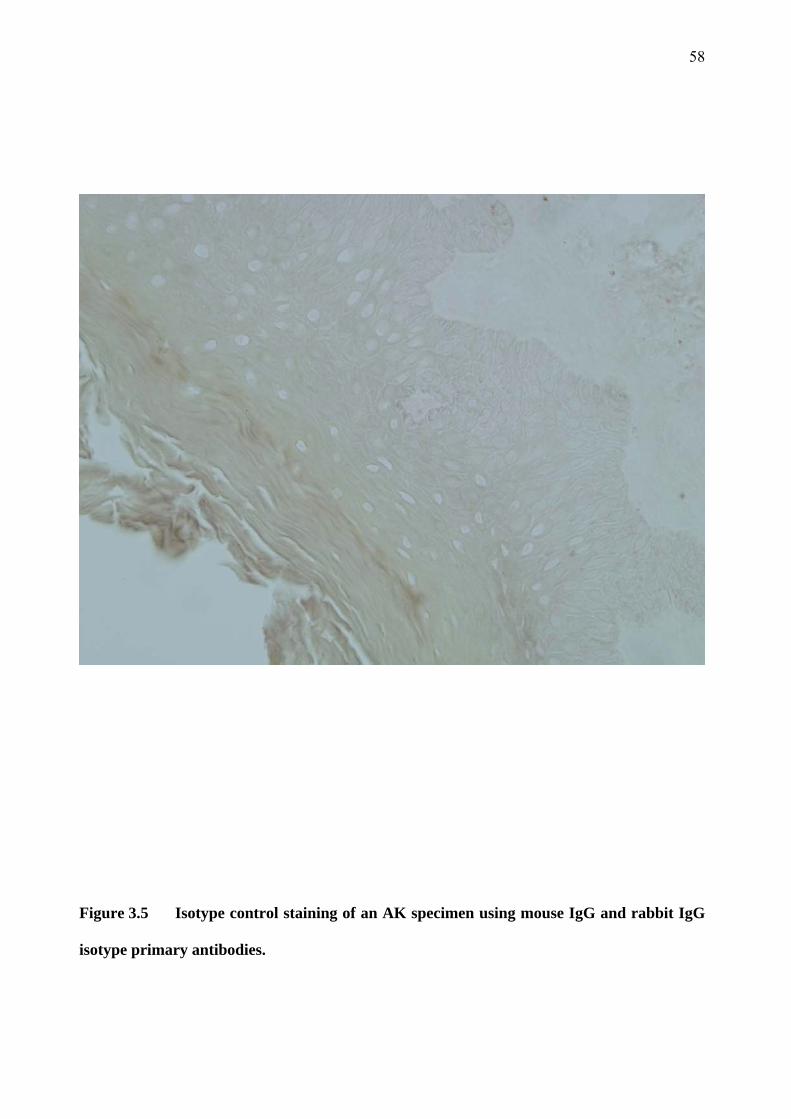
58
Figure 3.5 Isotype control staining of an AK specimen using mouse IgG and rabbit IgG
isotype primary antibodies.

59
Brm protein expression was found to be relatively high in all normal skin and AK specimens. The
proportion of the epidermal area staining positive for Brm ranged from 51-70% in normal skin
specimens and 57-74% in AK specimens. However, this expression was drastically reduced in all
SCC specimens. The epidermal area staining positive for Brm ranged from 0 to 10% in SCC
specimens. Figure 3.6 displays the Brm expression of each tumour specimen expressed as a
percentage of the epidermal area. There was little variation between samples within a group.
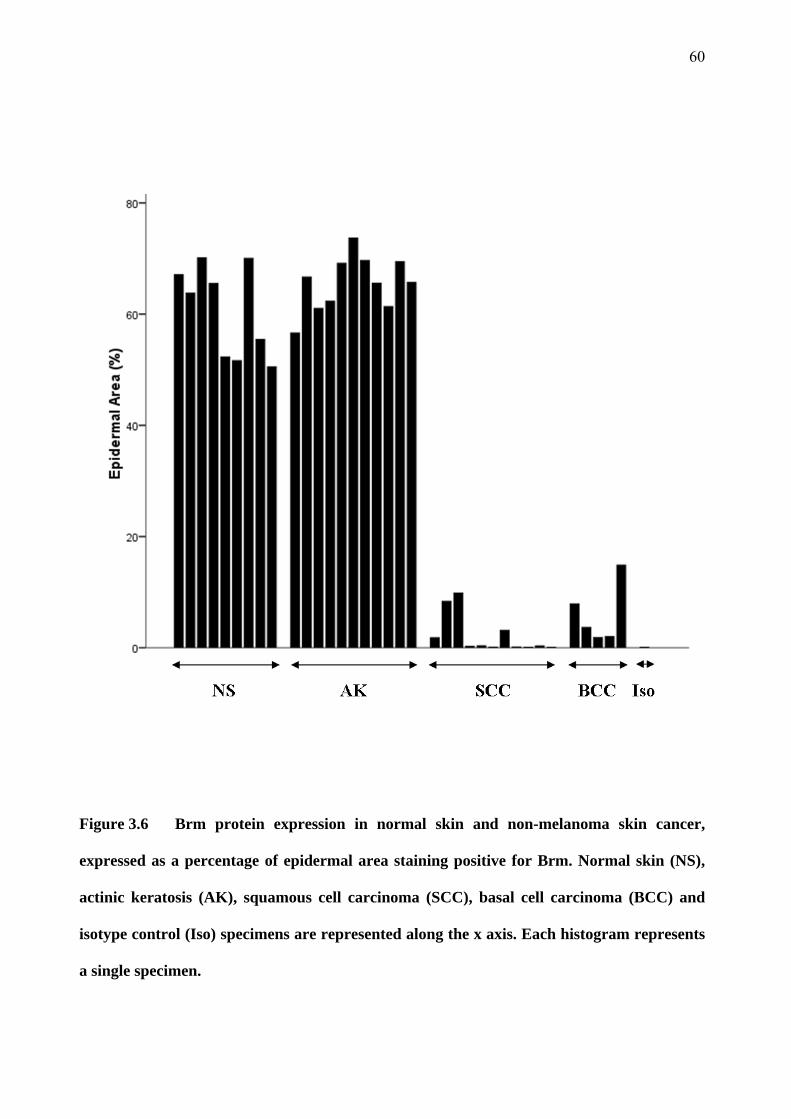
60
Figure 3.6 Brm protein expression in normal skin and non-melanoma skin cancer,
expressed as a percentage of epidermal area staining positive for Brm. Normal skin (NS),
actinic keratosis (AK), squamous cell carcinoma (SCC), basal cell carcinoma (BCC) and
isotype control (Iso) specimens are represented along the x axis. Each histogram represents
a single specimen.

61
The mean expression of Brm protein in each specimen group is displayed in Figure 3.7. The total
area of epidermis staining positive for Brm was high at 60.7% in the normal skin and 65.6% in
the AK group. There was no statistically significant difference between these two groups. The
mean expression of Brm in SCC specimens was very low in comparison, at only 2.2% (P < 0.001
compared to normal skin). The Brm expression was also significantly lower in BCC specimens at
6.1%, and this was also highly statistically significant when compared to both the normal skin
and AK specimen groups (P < 0.001). The Brm staining in isotype controls was very low at 0.1%
which indicates good specificity of the primary anti-Brm antibody used.
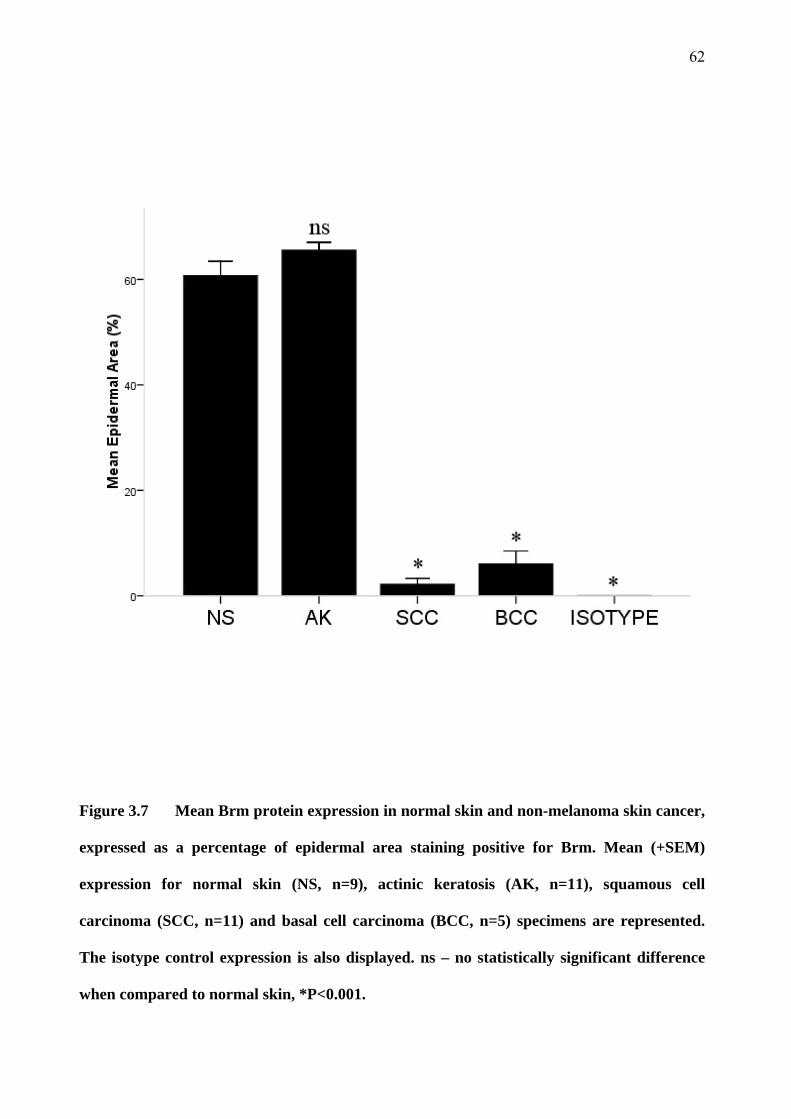
62
Figure 3.7 Mean Brm protein expression in normal skin and non-melanoma skin cancer,
expressed as a percentage of epidermal area staining positive for Brm. Mean (+SEM)
expression for normal skin (NS, n=9), actinic keratosis (AK, n=11), squamous cell
carcinoma (SCC, n=11) and basal cell carcinoma (BCC, n=5) specimens are represented.
The isotype control expression is also displayed. ns – no statistically significant difference
when compared to normal skin, *P<0.001.

63
Figure 3.8 shows a similar pattern of Brg-1 expression to that seen for Brm expression in the
tumour specimens. The expression of Brg-1 in normal skin and AK specimens was consistently
much higher than that seen in SCC and BCC specimens. The range of Brg-1 expression was 45-
71% of the epidermal area in normal skin and 49-74% in AK specimens. For SCC and BCC
specimens, the range was much lower at 0-12% and 3-19% respectively.
Brg-1 expression was somewhat more variable in normal skin and AK specimens than Brm
expression. Regardless of this, there was still relatively little variation between specimens within
each group.
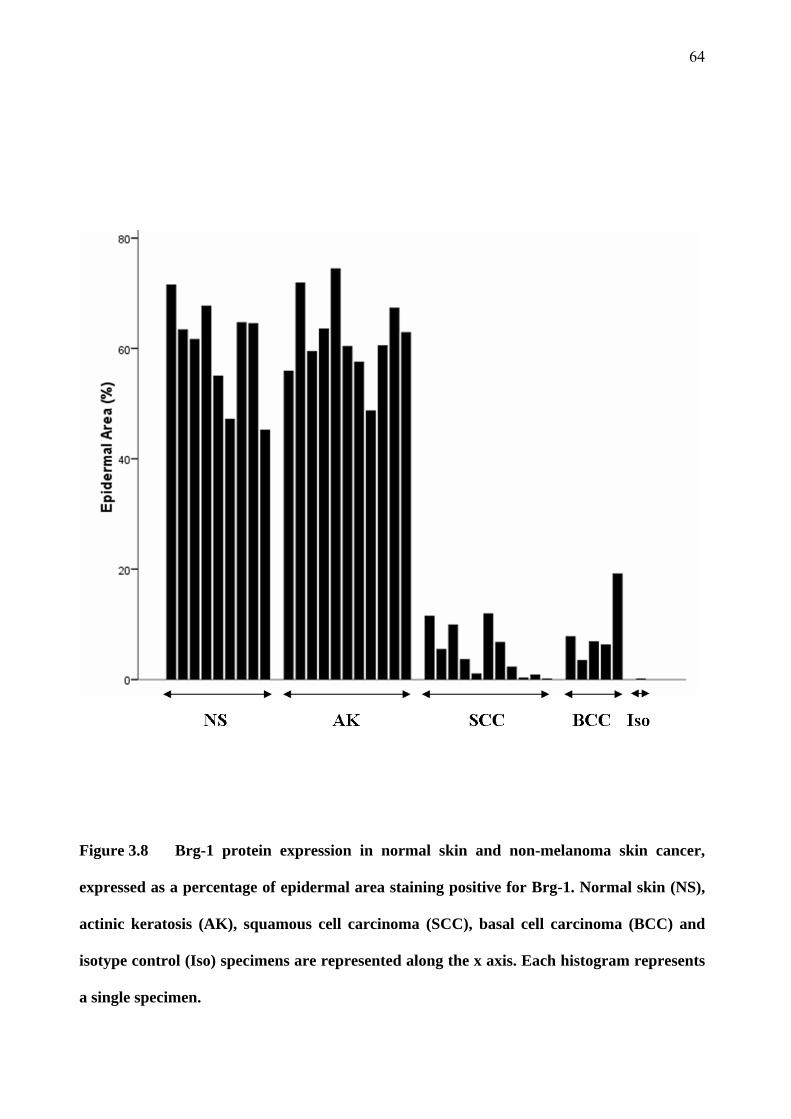
64
Figure 3.8 Brg-1 protein expression in normal skin and non-melanoma skin cancer,
expressed as a percentage of epidermal area staining positive for Brg-1. Normal skin (NS),
actinic keratosis (AK), squamous cell carcinoma (SCC), basal cell carcinoma (BCC) and
isotype control (Iso) specimens are represented along the x axis. Each histogram represents
a single specimen.

65
The mean Brg-1 expression was high in both normal skin and AK specimens at 60.1% and 62.0%
of epidermal area respectively (Figure 3.8). There was no statistically significant difference
between these two specimen groups. The mean expression was much lower in SCC and BCC
specimens at 4.9% and 8.7% respectively, and these values were significantly lower than the
levels seen in normal skin and AK (P < 0.001). The isotype control showed very low levels of
staining at only 0.1% of the epidermal area, indicating good specificity of the primary anti-Brg-1
antibody used.
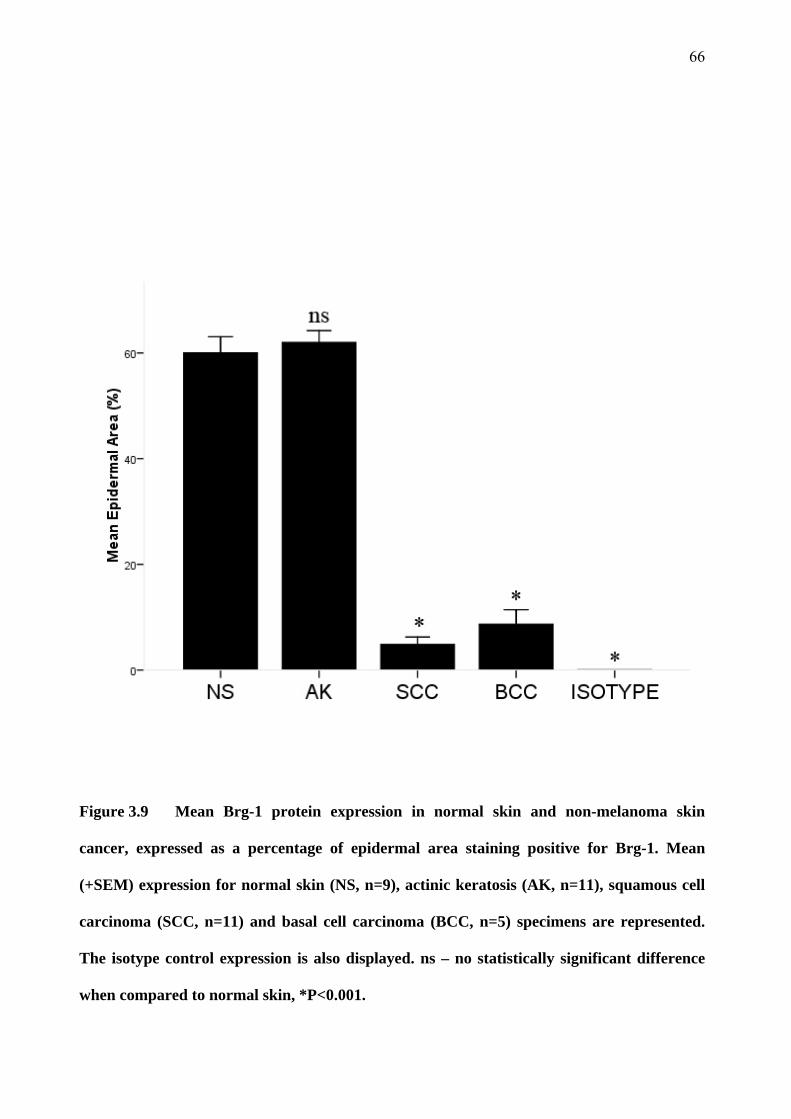
66
Figure 3.9 Mean Brg-1 protein expression in normal skin and non-melanoma skin
cancer, expressed as a percentage of epidermal area staining positive for Brg-1. Mean
(+SEM) expression for normal skin (NS, n=9), actinic keratosis (AK, n=11), squamous cell
carcinoma (SCC, n=11) and basal cell carcinoma (BCC, n=5) specimens are represented.
The isotype control expression is also displayed. ns – no statistically significant difference
when compared to normal skin, *P<0.001.

67
3.5 Snail 1 and Snail 2 expression
The staining for Snail 1 and Snail 2 was very weak making the quantitation inaccurate. The mean
expression of Snail 1 protein in normal skin, AK, SCC and BCC specimens is displayed in Figure
3.10. Due to some background staining evident with the isotype control, the colour-based
thresholds used were selected to minimize the number of pixels within the isotype controls being
selected as staining positively. These thresholds typically selected for pixels within a specified
colour range that had a higher intensity value compared to those thresholds employed to select for
Brm or Brg-1. One major drawback of this method was that melanin containing cells, typically
within the basal epidermis, were included by this threshold. As a result, falsely elevated values
were found for those specimens with melanin-containing cells. This is reflected in Figure 3.10 as
higher values for normal skin and AK specimens. Although the values for all specimens are
typically low (less than 10% of epidermal area) higher values were observed in normal skin
specimens, with relatively lower readings in AK specimens. The mean values for SCC and BCC
specimens were very low, consistent with the fact that these tumours are almost completely
devoid of melanin-containing cells.
The mean expression of Snail 1 as a proportion of epidermal area was 5.8% in normal skin versus
1.4% in AK specimens. There was no statistically significant difference between these two means
(P > 0.05). The mean expression of Snail 1 in SCC specimens was 0.3%, which was significantly
lower than the mean expression in normal skin (P = 0.04). The mean Snail 1 expression in BCC
specimens was 0.5%, which was not significantly different from the mean normal skin expression
(P>0.05).
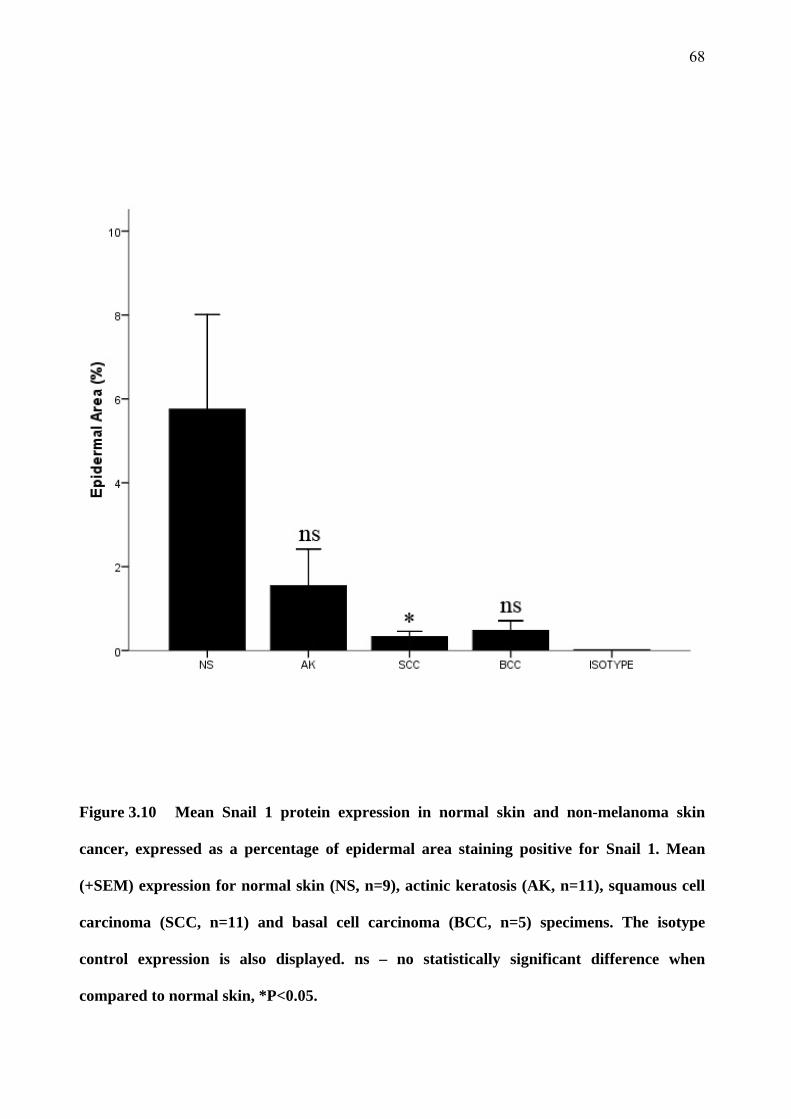
68
Figure 3.10 Mean Snail 1 protein expression in normal skin and non-melanoma skin
cancer, expressed as a percentage of epidermal area staining positive for Snail 1. Mean
(+SEM) expression for normal skin (NS, n=9), actinic keratosis (AK, n=11), squamous cell
carcinoma (SCC, n=11) and basal cell carcinoma (BCC, n=5) specimens. The isotype
control expression is also displayed. ns – no statistically significant difference when
compared to normal skin, *P<0.05.

69
The mean expression of Snail-2 protein in normal skin, AK, SCC and BCC specimens is
displayed in Figure 3.11. The mean values are similar to those found for Snail-1 protein. The
mean expression was 6.3% in normal skin and 2.2% in AK specimens. There was no statistically
significant difference between these values (P>0.05). The mean Snail 2 expression in SCC and
BCC specimens was 0.8% and 0.2% respectively which was not significantly different to normal
skin specimens (P>0.05). However, it is likely that these means reflect the presence of melanin-
containing cells rather than true expression of Snail-2. This is borne out by the higher values seen
in normal skin and AK specimens. The lowest values were observed in SCC and BCC specimens
which are typically devoid of melanin-containing cells. The weak degree of staining when
compared to isotype control values makes this data unreliable.
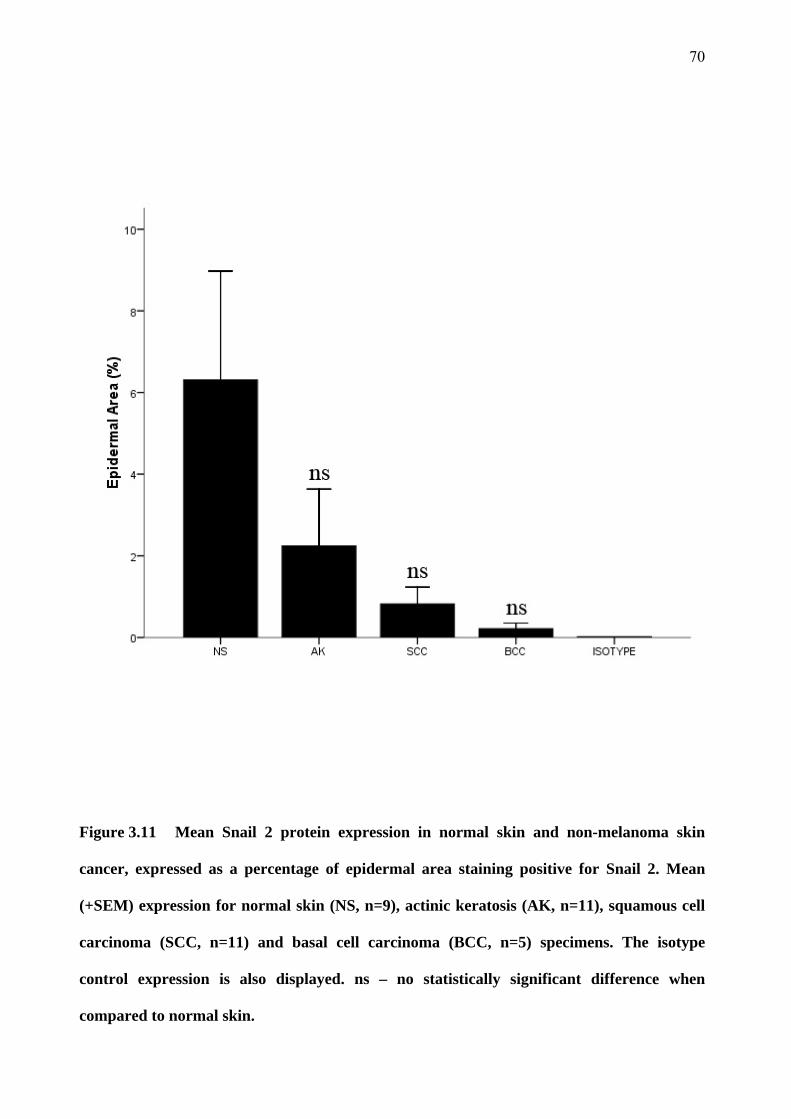
70
Figure 3.11 Mean Snail 2 protein expression in normal skin and non-melanoma skin
cancer, expressed as a percentage of epidermal area staining positive for Snail 2. Mean
(+SEM) expression for normal skin (NS, n=9), actinic keratosis (AK, n=11), squamous cell
carcinoma (SCC, n=11) and basal cell carcinoma (BCC, n=5) specimens. The isotype
control expression is also displayed. ns – no statistically significant difference when
compared to normal skin.

71
3.6 p53 expression
Figure 3.12 displays the expression of p53 as a proportion of epidermal area in each specimen.
From this graph, it is apparent that the expression of p53 is higher in normal skin specimens than
other groups, although this group does show wide variability in the expression of p53. Expression
of p53 is seen in AK specimens, although at significantly lower levels than that seen in normal
skin specimens. Almost no p53 expression was detected in SCC and BCC specimens and this
very low level of expression was similar to that seen in the isotype control.
In this project, the expression of p53 protein was greatest in normal skin, with highly significant
reductions in expression seen in AK and near zero expression in SCC specimens. Figure 3.13
displays the mean p53 expression for each specimen group. Normal non-sun exposed skin had a
mean expression of 23.4% of the epidermal area, while sun-exposed normal skin had a slightly
lower mean expression of 20.0%, although there was no statistically significant difference
between these two groups. The mean p53 expression of all normal skin specimens together was
21.9% of the epidermal area. The expression of p53 in AK specimens was much lower than all
normal skin specimen groups at just 2.1% of the epidermal area, which was highly statistically
significant (P < 0.001). The expression of p53 in SCC specimens was even lower at 0.02% and
similar to that of the isotype control. There was again a highly statistically significant difference
between both the normal skin and AK groups and the SCC group (P < 0.001).
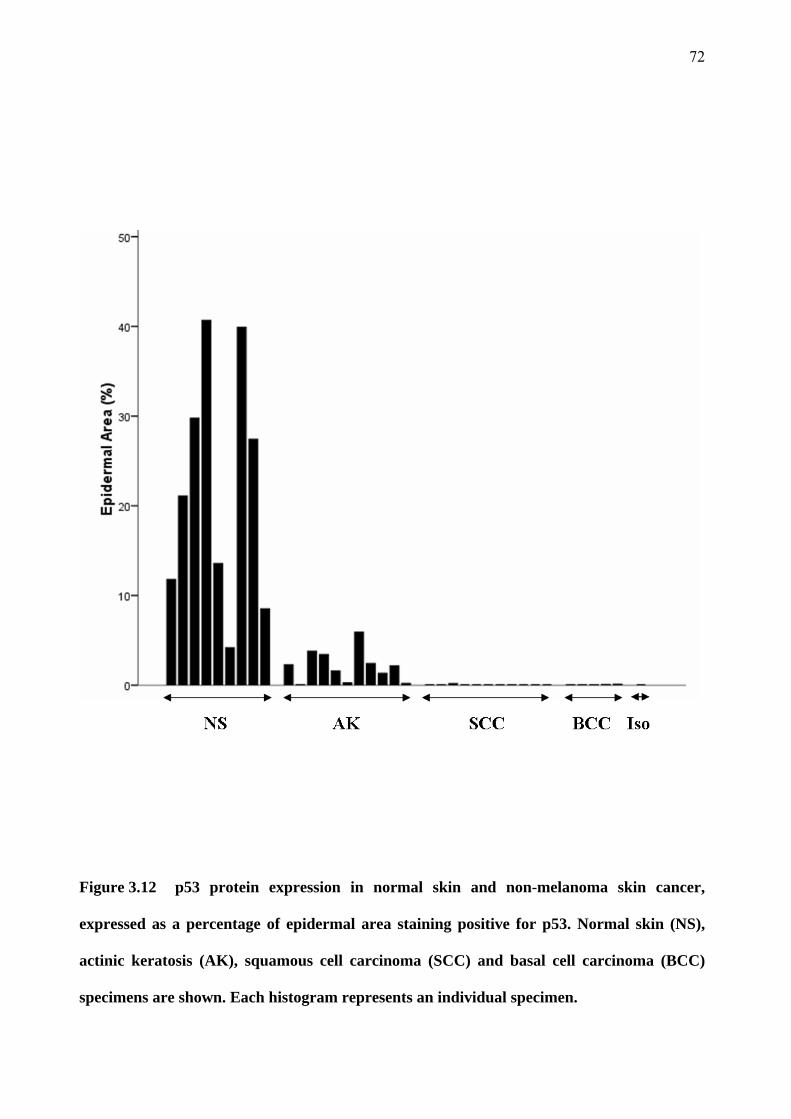
72
Figure 3.12 p53 protein expression in normal skin and non-melanoma skin cancer,
expressed as a percentage of epidermal area staining positive for p53. Normal skin (NS),
actinic keratosis (AK), squamous cell carcinoma (SCC) and basal cell carcinoma (BCC)
specimens are shown. Each histogram represents an individual specimen.
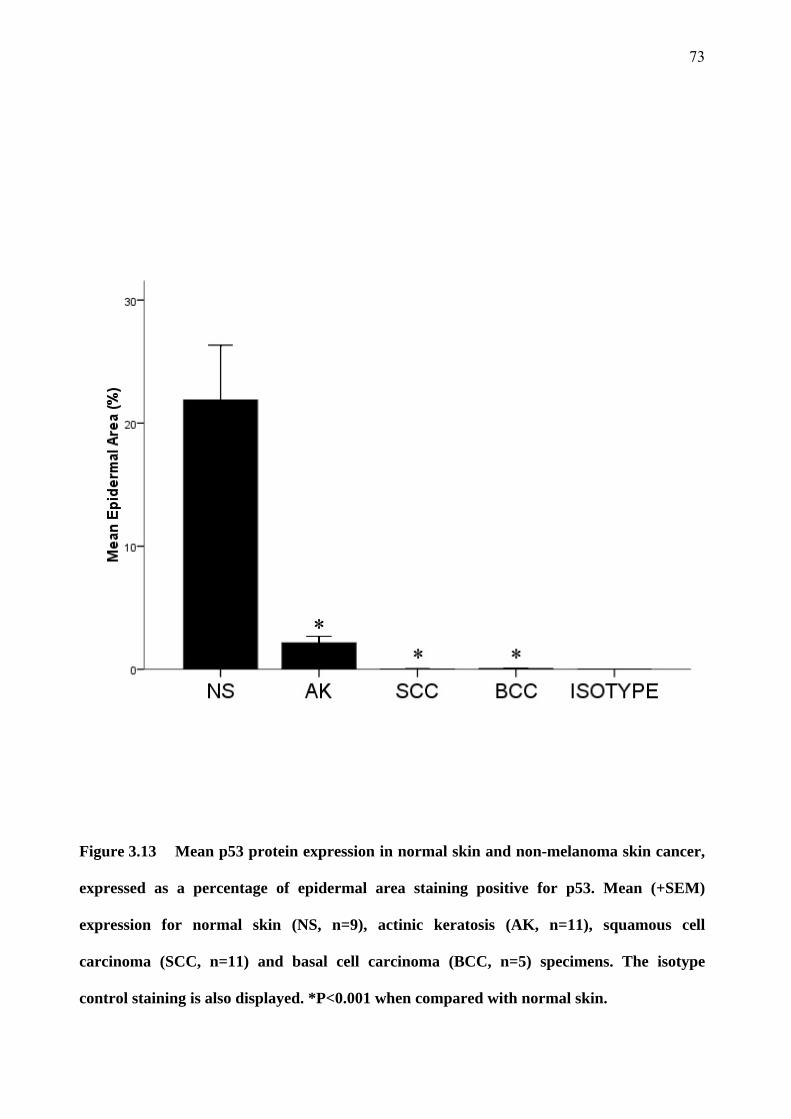
73
Figure 3.13 Mean p53 protein expression in normal skin and non-melanoma skin cancer,
expressed as a percentage of epidermal area staining positive for p53. Mean (+SEM)
expression for normal skin (NS, n=9), actinic keratosis (AK, n=11), squamous cell
carcinoma (SCC, n=11) and basal cell carcinoma (BCC, n=5) specimens. The isotype
control staining is also displayed. *P<0.001 when compared with normal skin.
74
Chapter 4 Discussion
The hypothetical model of tumour progression proposed for my studies is that as tumours lose
expression of Brm or Brg-1, they progress from a benign phenotype to a malignant one.
Conversely, as tumours increase the expression of Snail 1 and Snail 2, malignant conversion and
gain of invasiveness occurs. To further characterise the role of Brm, Brg-1, Snail 1 and Snail 2 in
tumorigenesis, this research project examined the expression of these proteins in the normal
skin/AK/SCC model of tumour progression. Double-label immunohistochemistry was used to
determine the level of protein expression of Brm, Brg-1, Snail 1 and Snail 2 in human cutaneous
SCC, precancerous AK lesions and normal skin. The tumour suppressor protein p53 was the other
protein assayed for as it is down-regulated early in skin carcinogenesis. To my knowledge, no
other study has used immunohistochemistry to compare the expression of these proteins in a
cutaneous tumour with its precancerous lesion.
4.1 Skin specimens
The AK and SCC specimens collected were representative of typical AK and SCC lesions, in
both histological and clinical features. All lesions were assessed prior to surgical removal from
the patient by a specialist dermatologist or plastic surgeon, who felt that the clinical features of
these lesions were consistent with that of either an AK or an SCC. Ten normal skin samples
(taken from either habitually sun-exposed or non-sun-exposed regions), eleven AK, and eleven
SCC were collected. This number of specimens was collected to ensure that the results were
representative of these specimen/tumour types. The majority of lesions in the AK and SCC
groups (more than 90%) were collected from men. This is consistent with previous
epidemiological studies which have found a higher prevalence of these lesions in men than
women (English, Armstrong et al. 1998). The exact reason for the higher prevalence of NMSC in
men compared to women is not known, however it is thought that either genetic or behavioural
factors are involved (Raasch and Buettner 2002). The behavioural factors may include a higher
75
occupational or recreational exposure to UV radiation, and/or a greater tendency to present with
NMSC for medical review. The SCC and AK specimens were distributed over habitually sun-
exposed sites in all cases. Only one BCC specimen was collected from an area not usually
exposed to sunlight (the abdomen). This finding is in keeping with previous observations and is
consistent with exposure to sunlight being a major causative agent (Black and Douglas 1973;
Black and Chan 1976).
SCC specimens were collected from various habitually sun-exposed areas around the body, while
AK specimens were predominantly collected from the forearms or hands of patients. This bias in
the distribution of AK specimens to sites such as the forearm and hand reflects the ease of
collecting specimens from these sites rather than the true distribution of such lesions. It would be
expected, however, that similar pathological mechanisms are at play at all of these habitually sun-
exposed sites.
All patients in this study identified themselves as Caucasian. The Fitzpatrick skin type varied
from type I to IV. However, 63% of patients were of Fitzpatrick skin type I, whilst only one
patient had Fitzpatrick skin type IV. This is consistent with the finding that people with paler skin
types more prone to sunburn have higher rates of skin cancer (Fitzpatrick and Sober 1985).
All control normal skin specimens were collected from patients who also had another skin cancer
lesion removed for the study. This minimises the impact of differences in the population
characteristics between the different tumour and control groups.
Any patients who were immunosuppressed, either by illness or medication, were excluded from
this study. Immunosuppression, particularly in organ-transplant patients, is a strong risk factor for
the development of both AK and SCC (Moloney, Comber et al. 2006). Although the exact
76
mechanism responsible is not known, it is likely that there is impairment of the local immune
response to AK and SCC leads to an increased susceptibility to these lesions. This study aimed to
determine whether Brm, Brg-1, Snail 1 or Snail 2 proteins were altered during skin cancer
progression. Immunosuppressed patients were excluded in order to avoid any confounding factors
involved in the increased incidence of non-melanoma skin cancer in this patient group, as the
tumours may have an altered development. The study of this patient group would be a worthwhile
further investigation.
The histopathology of the collected lesions was assessed by a single experienced dermato-
pathologist. All but one SCC was either well or moderately-differentiated, with a single SCC
specimen reported as poorly-differentiated. The relative lack of poorly-differentiated SCC
specimens in this study may have under-estimated the role of differentiation in the protein
expression of the molecules studied.
4.2 Selection of specific antibodies
The immunohistochemical methods in this study have previously been used to determine the
protein expression of various molecules in human non-melanoma skin cancer. Frozen sections
were used to detect Brm, Brg-1, Snail 1, Snail 2 and p53 protein expression and have the
advantage over paraffin-embedded sections of providing a strong antigenic signal, without the
need for antigen retrieval steps. This is presumed to be due to the fact that the process of
formalin-fixation and paraffin-embedding leads to denaturing of antigenic epitopes.
Alternatively, formalin-fixed and paraffin-embedded tissue sections provide better preservation
of tissue architecture and avoid the need for a researcher to collect specimens freshly. The
antibodies used in this study were recommended in frozen sections and their reactivity on
paraffin-embedded sections was unknown.
77
The primary and secondary antibody dilutions were chosen after experiments determining the
optimal concentrations for detection of the antigen and avoidance of non-specific binding
(specificity). Isotype controls were used at the same protein concentration as the corresponding
primary antibodies in each immunohistochemical staining. These isotype controls were employed
to determine the specificity of the primary antibodies. All isotype controls were negative in the
final staining of specimens.
The Brm and Brg-1 proteins share many epitopes due to the similarity of the molecules. In
addition, the Snail 1 and Snail 2 proteins also share similarities in their protein structure being
approximately 70% homologous (Hemavathy, Ashraf et al. 2000). Indeed, cross-reactivity of
anti-Brm antibodies with Brg-1 protein and vice versa has hampered previous studies using
immunohistochemistry to assay for these molecules (Reisman, Sciarrotta et al. 2005). Thus, it
was vitally important in this study to test the specificity of the primary antibodies available to us
and to select antibodies for specificity and sensitivity. This was the most time-consuming aspect
of this project. This was achieved by the construction and use of expression plasmids for each
protein to transfect human cell lines known to have little or no normal expression of these
proteins. In order to confirm effective transfection, cells were co-transfected with a reporter
plasmid. This reporter plasmid caused transfected cells to express EGFP and therefore fluoresce
green when viewed under a fluorescent microscope. When examined with an inverted fluorescent
microscope, effective transfection of cells was visible as cells fluorescing green. These cells were
then grown on chamber slides, fixed when expression was maximal and stained using different
dilutions of the various antibodies. This process was applied to a panel of different primary
antibodies from which the most sensitive and specific antibodies were chosen to use in the final
processing of specimens. The final primary antibodies used were found to have no cross-
reactivity with the other proteins at that concentration and resulted in positive (although at times
weak) staining of the cells expressing that specific protein.
78
Techniques for double-label immunohistochemistry have been described. Various combinations
of enzymes and chromagens have been used, each having particular advantages and
disadvantages. In this study, two different enzyme systems were used to develop two chromagen
substrates within a single frozen section. The chromagen fuchsin was developed with alkaline
phosphatase and tetra methyl benzidine (TMB) was developed with horseradish peroxidase to
produce pink and turquoise colours respectively. When these two colours co-localised, a deeper
purple colour was produced. One great benefit of this colour combination is the excellent contrast
achieved between the three colours, the two colours separately and mixed together (van der Loos
1999). This contrast allowed the colours to be separated and analysed according to colour using
an image analysis program. A disadvantage of this colour combination is that TMB does not
localise within tissue sections as well as some other chromagens and may diffuse slightly.
Another disadvantage is that TMB is a light sensitive chromogen which fades with exposure to
light (van der Loos 1999). This issue was dealt with in this study by storing the stained sections
in a light-impenetrable box, and taking photomicrograph images of each section within a defined
and short time period after the completion of staining to give little time for substrate diffusion or
degradation. This minimised the differences in the degree of exposure to light and the time
between staining and final image capture for each section examined.
Another technique that could have been used for this study is immunofluorescence.
Immunofluorescence is a technique which demonstrates the presence of antigens within a section
by the use of antibodies labelled with a fluorescent dye rather than an enzyme. The resulting
section is examined using a fluorescence microscope, which uses light to excite the fluorescent
dye that then emits a coloured fluorescent signal. A disadvantage of this technique is that the
fluorescent signal fades upon irradiation, necessitating rapid image capture. Immunofluorescence
was trialled in this project; indeed the antibody specificity of the Snail 1 and Snail 2 antibodies
was confirmed using the immunofluorescence technique. However, when human skin sections
79
were examined using a fluorescent microscope, it was found that there was significant
autofluorescence of the tissue sections. Autofluorescence of human skin has been described
previously, and habitually sun-exposed skin sites seem to demonstrate more autofluorescence
than non-sun-exposed skin (Na, Stender et al. 2001). This autofluorescence problem rendered the
technique unsuitable for this study. Thus, immunohistochemistry was the preferred technique to
visualise the proteins of interest within the specimens.
The grading of the intensity and localisation of immunohistochemical staining varies from study
to study. Previous studies have employed an observer to grade the degree of staining from no
staining to +, ++ or +++ (Sun, Tawfik et al. 2007). This technique carries a risk of observer
variation and subjectiveness. In this study, image analysis was performed using colour-based
thresholds which were predetermined to select for positively stained pixels. Once these thresholds
were determined, the same numerical thresholds were applied to the analysis of every section,
thus removing any observer bias.
In order to minimise variables between the stained specimens in this project, a number of
measures were taken. All tumour specimens were stained in one staining run using the same
reagents and antibody cocktails under the same conditions. In addition to this, all specimens were
stored together in identical light-impenetrable boxes at the same temperature. The specimens
were all examined using the same light microscope under fixed and reproducible settings. All
photomicrographs of the specimens were taken using the same magnification and using the same
settings in terms of exposure, contrast, etc. In addition to these measures, two sections of each
specimen were stained using isotype control antibodies during the final staining run, rather than a
single isotype control for the whole staining run.
80
4.3 Tumour expression of Brm and Brg-1
The area of epidermis staining positive for Brm was found to be significantly greater in the
normal skin and AK groups than in the SCC group (P<0.001). In normal skin specimens, Brm
and Brg-1 protein expression was found throughout the epidermis. This is in contrast to one study
which found that Brg-1 expression in normal human skin was confined to the suprabasal
epidermis, with the basal epidermis showing no expression of Brg-1. This same study reported
Brm expression throughout the epidermis, although the primary antibody used was cross-reactive
with Brg-1 (Reisman, Sciarrotta et al. 2005). That study utilised the same monoclonal mouse
anti-Brm antibody as was used in the final stages of this project. In that study, the authors
determined that the anti-Brm antibody was cross reactive with both Brm and Brg-1 using
transient transfections of H522 cell lines which were then trypsinised, pelleted, mixed with FFP
and thrombin and then formalin-fixed and paraffin-embedded. The difference between the
staining patterns observed in that study and this project may reflect either differences as a result
of tissue processing (antigenic retrieval of paraffin embedded tissue was used in that study) or
differences in the staining conditions (primary antibody incubation was carried out at 37°C
compared to room temperature in this project). It is possible that the difference in processing and
staining conditions may have altered the tertiary structure of the Brg-1 molecule and thus
revealed an epitope that was able to be recognised by the anti-Brm antibody, whereas this epitope
remained masked in this project. Interestingly enough, the authors mentioned in that study that
transfections of the SW13 cell line were also carried out and subsequently stained using the same
antibodies to determine the specificity of the primary antibodies, however the results were not
presented.
The pattern of staining for both Brm and Brg-1 was predominantly nuclear, although there was
some cytoplasmic staining also. However, localisation of antigenic signal is generally poorer in
frozen sections than paraffin sections (Shi, Cote et al. 1997). Certain areas of contiguous staining
81
made it unfeasible to count individual positive cells. Thus, the degree of staining was determined
by using image analysis to calculate the area of the epidermis staining positive for the desired
antigen, expressed as a percentage of the total epidermal area.
In other studies, the protein expression of Brm and Brg-1 as determined by
immunohistochemistry was found to be significantly lower in various human cancer specimens
when compared to normal tissue. This includes a loss of Brm and Brg-1 protein expression in
approximately 10% of non-small cell lung cancers as detected by immunohistochemistry and
30% of these tumours when protein expression was determined by Western blot analysis
(Reisman, Sciarrotta et al. 2003). Patients with this subset of tumours also followed a
significantly poorer clinical course with decreased survival rates (Reisman, Sciarrotta et al. 2003;
Fukuoka, Fujii et al. 2004). Immunohistochemical staining of a series of human gastric
carcinomas for Brm protein expression found that the expression was reduced in 67% of cases.
This subset of tumours was also significantly less well differentiated histologically (Yamamichi,
Inada et al. 2007). Strikingly, my data shows loss of both Brm and Brg-1 in all SCC and BCC
specimens studied compared to normal skin and AK. Thus loss of these molecules appears to be a
general feature of SCC and BCC, rather than being limited to a particular subset.
In this project, the protein expression of both Brm and Brg-1 was found to be similar in both
normal human skin specimens and AK specimens, with no statistically significant difference
between these values. At the level of individual specimens, all AK values were within the normal
range. In contrast, the protein expression of both Brm and Brg-1 were dramatically reduced in all
SCC and BCC specimens, and this reduction was highly statistically significant (P<0.001). The
measured background staining of isotype controls was close to zero, indicating good specificity
of the antibodies used. This lack of background staining allowed colour-based thresholds to be
used for image analysis that were both sensitive and specific for true positive staining. We can be
82
confident then that the levels of staining measured truly reflect the protein expression of Brm and
Brg-1 within the tissue sections.
The dramatic reduction in Brm and Brg-1 protein expression from both normal skin and AK
specimens to the level seen in SCC specimens suggests that loss of these proteins is associated
with the progression of non-melanoma skin cancer from benign to malignant. This reduction was
highly statistically significant with a P value of less than 0.001. Interestingly enough, the Brm
and Brg-1 protein expression was also low in BCC specimens. Unlike SCC, BCC tends to
develop de novo in the skin, not arising from a pre-existing premalignant lesion such as an AK.
Protein expression of both Brm and Brg-1 were also strikingly consistent between specimens
within each specimen group. This evidence strongly suggests a role for Brm and Brg-1 as
putative tumour suppressors involved in the progression of non-melanoma skin cancer from
benign to malignant.
The mechanism by which loss of Brm and Brg-1 contributes to carcinogenesis is not well
understood. Dynamic chromatin remodelling underlies most, if not all cellular processes
involving DNA. This includes gene expression, DNA repair, replication and apoptosis. The
SWI/SNF chromatin-remodelling complex is also required for the normal function of a number of
transcription factors and steroid receptors. In addition to this, Brm and Brg-1 play a role in
differentiation. In mice, a lack of Brg-1 expression is associated with early embryonic lethality
(Bultman, Gebuhr et al. 2000). In contrast to this, mice lacking Brm expression develop normally
but grow significantly larger than their littermates (Reyes, Barra et al. 1998). This suggests that
Brm may moderate differentiation and growth but is not required for normal organogenesis. A
loss or reduction in the expression of either Brm or Brg-1 would be supposed to interfere with
many of these processes and may underlie the mechanism by which a loss of these proteins is
associated with malignant conversion.

83
Brm and Brg-1 may also contribute to carcinogenesis through their interactions with oncogenes
and tumour suppressors. In particular, Brm and Brg-1 both directly interact with the
Retinoblastoma (Rb) tumour suppressor. Without the presence of either Brm or Brg-1, Rb is
unable to mediate cell cycle arrest (Strobeck, Knudsen et al. 2000; Liu, Luo et al. 2004). In
addition to this, Brm protein has been found to be down-regulated by the Ras oncogene
(Muchardt, Bourachot et al. 1998). These mechanisms may contribute to the role of Brm and Brg-
1 loss in carcinogenesis.
Further research is necessary to determine the exact mechanism whereby loss of Brm and Brg-1
contributes to carcinogenesis. The results of this project are unable to illuminate this area further.
However, it is clear from these results that loss of Brm and Brg-1 is playing a role in human
NMSC development.
4.4 Tumour expression of Snail 1 and Snail 2
Numerous studies have found an increase in the expression of Snail 1 and/or Snail 2 in human
head and neck SCC (Barrallo-Gimeno and Nieto 2005), synovial sarcomas (Saito, Oda et al.
2004), breast cancer (Blanco, Moreno-Bueno et al. 2002), gastric cancer (Rosivatz, Becker et al.
2002), hepatocellular carcinoma (Sugimachi, Tanaka et al. 2003), thyroid cancer (Hardy,
Vicente-Duenas et al. 2007) and colon cancer (Palmer, Larriba et al. 2004).
A role for Snail 2 in the development of cutaneous SCC was also suggested by one in vivo study
that found that Snail 2 knockout mice have a lower skin tumour burden and fewer aggressive skin
tumours compared to wild type mice as a result of UV radiation (Newkirk, Parent et al. 2007).
In this project, it was not possible to determine the protein expression of the transcription factors
Snail 1 and Snail 2 in the tumour specimens. The primary antibodies used in this project were
able to detect Snail 1 and Snail 2 expression in transfected cell lines when the antibodies were
84
used at the same protein concentration as for the tumour specimens. The goat IgG isotype control
showed very low levels of staining in these cell lines. However, significant background staining
was noticed when isotype control staining of tissue specimens was performed relative to the
specific antibodies. The reason for this is not clear. The specificity of the primary antibodies was
determined using immnunofluorescence. However, for the final staining of the human specimens,
immunohistochemistry was used in order to avoid the problems caused by autofluorescence of
human skin specimens. It is possible that some difference between the two techniques or cell
types was responsible for the high level of background staining observed with the
immunohistochemistry technique. However, it is more likely that Snail 1 and Snail 2 were not
expressed at high enough levels to be detected above background staining. The resulting
background staining made determination of significant positive staining in the specimens
difficult. In order to try and differentiate true positive staining from non-significant background
staining, the image analysis thresholds used to select out pixels based on colour and intensity
were deliberately set so as to minimise the number of selected pixels within the isotype control
sections. Unfortunately, these thresholds also selected pixels present within the section that
represented melanin-containing cells. Thus, the results for Snail 1 and Snail 2 expression depicted
in Figure 3.9 and Figure 3.10 most likely reflect the amount of melanin-containing cells within
the section, rather than the true expression of Snail 1 or Snail 2 protein.
It is probable that the endogenous expression of Snail 1 and Snail 2 within the tumour specimens
is significantly lower than that of cells transfected with expression plasmids for these proteins.
This may explain the inability to detect Snail 1 and Snail 2 protein within tissue sections with the
primary antibodies used.
There was only one poorly-differentiated SCC specimen in this project. It is possible that Snail 1
and/or Snail 2 expression may be increased only poorly-differentiated tumours and not well-
85
differentiated or moderately-differentiated tumours. The relative lack of poorly-differentiated
specimens in this project may have made any increased expression of Snail 1 or Snail 2 in poorly-
differentiated tumours undetectable.
In this project, it was not possible to comment on the role of Snail 1 and Snail 2 in non-melanoma
skin cancer progression or development.
4.5 Tumour expression of p53
The p53 protein was also studied as it is well characterised to be mutated early in skin
carcinogenesis. Therefore it was useful to study this protein in relation to Brm and Brg-1. The
tumour suppressor p53 gene is highly conserved between vertebrates. It functions primarily as a
transcription factor inducing the expression of multiple genes in response to genotoxic stress. The
p53 protein is also known as the ‘guardian of the genome’ as it enables G1 cell cycle arrest for
DNA repair or apoptosis after injury to the genome by ultraviolet radiation, for example. The
p533 protein functions as a tumour suppressor in its wild type form. The mutant form of p53
however, has caused more consternation. Unlike wild type p53 which is rapidly degraded, mutant
p53 appears to accumulate within the cell. Mutation of p53 generally leads to inactivation of the
protein product. Studies aimed at detecting mutant p53 have found higher levels of expression of
p53 protein in cancerous and precancerous cutaneous lesions and that mutations of p53 have
varying effects on the cell depending on whether these mutations confer a loss of function or gain
of function effect (Caulin, Nguyen et al. 2007).
Mutation of the p53 gene is the most common mutation in human cancers and is mutated in
approximately 50% of all human cancers (Hollstein, Sidransky et al. 1991).
86
The primary antibody used in this project was directed against both wild type and mutant p53.
The expression of p53 was predominantly nuclear and seen throughout the epidermis in normal
skin specimens. The expression of p53 in AK specimens was on average much lower than that
seen in normal skin, but when detected was still predominantly nuclear. The localisation within
the epidermis of p53 was highly variable. Virtually no p53 expression was seen in SCC and BCC
specimens.
Previous studies have found that p53 expression as determined by immunohistochemistry is
greater in SCC and BCC specimens with lower levels of expression displayed by normal skin and
AK (Gusterson, Anbazhagan et al. 1991; Batinac, Zamolo et al. 2004). However, this finding is
not consistent with those of other studies that found higher levels of p53 expression in AK
specimens than SCC or BCC specimens (Onodera, Nakamura et al. 1996). These studies
employed primary antibodies directed against both wild type and mutant p53 and it was assumed
that the p53 detected was mutant and thus present due to a greatly increased half life. One study
examined a total of 316 cases including normal skin, Bowen’s disease (well differentiated SCC or
SCC in-situ), SCC and BCC specimens (Liang, Ohtsuki et al. 1999). The expression of p53 in the
tumour nest itself, surrounding dysplastic tissue and adjacent morphologically normal skin was
determined by immunohistochemistry. Higher levels of p53 expression were seen in SCC and
BCC tumour nests with 74% of cases positive for p53 in total. 49% of dysplastic tissue
surrounding these tumours and 30% of morphologically normal skin adjacent to the tumours were
found to express p53. However, in this study, the cells staining positively for p53 were arranged
around the periphery of the tumour nests with a relative lack of p53 expression in the centre of
the tumour.
In this project, the portion of SCC and BCC tumours used for immunohistochemistry were taken
from the centre of the tumour only. It is possible that this central sampling selected for an area of
87
the tumour with low or absent expression of p53. This would result in low levels of p53 staining
for SCC and BCC specimens in this project. In addition to this, sun-exposed normal skin
specimens used in this project were taken from patients also donating an AK, SCC or BCC
specimen. These sun-exposed normal skin areas were located near to (but not continuous with)
these specimens and were almost always in areas of solar elastosis (sun-damaged skin). This may
have resulted in higher levels of p53 staining than would otherwise be seen in sun-exposed
normal skin which did not demonstrate changes of solar elastosis. In this project, there was no
statistically significant difference between sun-exposed and non sun-exposed normal skin
specimens in terms of p53 expression, but this may reflect the relatively high variability of p53
expression and the small number of normal skin specimens studied.
The overall pattern of p53 expression seen in this project, with the highest levels of expression
seen in normal skin specimens and the lowest level seen in the non-melanoma skin cancers (SCC
and BCC specimen groups) indicates that p53 protein is lost earlier in carcinogenesis than Brm or
Brg-1.
4.6 Future directions
This project looked at the expression of the proteins Brm, Brg-1, Snail 1, Snail 2 and p53 in
normal human skin, premalignant and malignant cutaneous lesions. Further studies to determine
the cause of the reduced Brm and Brg-1 protein expression observed would expand on this
finding. Such studies could examine whether reduced expression was due to epigenetic silencing
or mutations within these genes. It would be interesting to look for epigenetic silencing and
mutations within the same specimens examined in this project and correlate these findings with
the level of protein expression.

88
In vitro models could also be utilised to further elucidate the role of these proteins. For instance,
the generation of keratinocyte cell lines with either high or low expression of these proteins could
be used in organotypic cultures such as engineered human skin. Such cultures could then be
subjected to carcinogenic stimuli such as ultraviolet radiation and the effects observed.
Engineered human skin using normal human keratinocytes could also be subjected to ultraviolet
radiation with the subsequent determination of Brm or Brg-1 gene mutations or protein
expression.
Animal models would allow greater investigation of the role of Brm and Brg-1. The use of in
vivo models such as Brm or Brg-1 knockout mice could be used to determine whether exposure
to carcinogens such as ultraviolet radiation leads to increased carcinogenesis in such knockout
animals when compared to controls.
New antibodies directed against Snail 1 and Snail 2 with improved specificity could be utilised in
human normal skin, AK, SCC and BCC specimens to determine the expression of these proteins
in these specimens as this was not able to be accomplished in this project.
4.7 Conclusion
This project aimed to determine the role of Brm, Brg-1, Snail 1 and Snail 2 in the progression of
non-melanoma skin cancer from benign to malignant. Due to technical difficulties, no
conclusions regarding the role of Snail 1 and Snail 2 proteins were able to be drawn from this
project. However, the results of this project demonstrate a highly statistically significant
reduction in the expression of both Brm and Brg-1 proteins from benign normal skin and AK
specimens to very low levels in malignant SCC and BCC specimens. In contrast to this the
expression of p53 protein is lost relatively early in NMSC development.
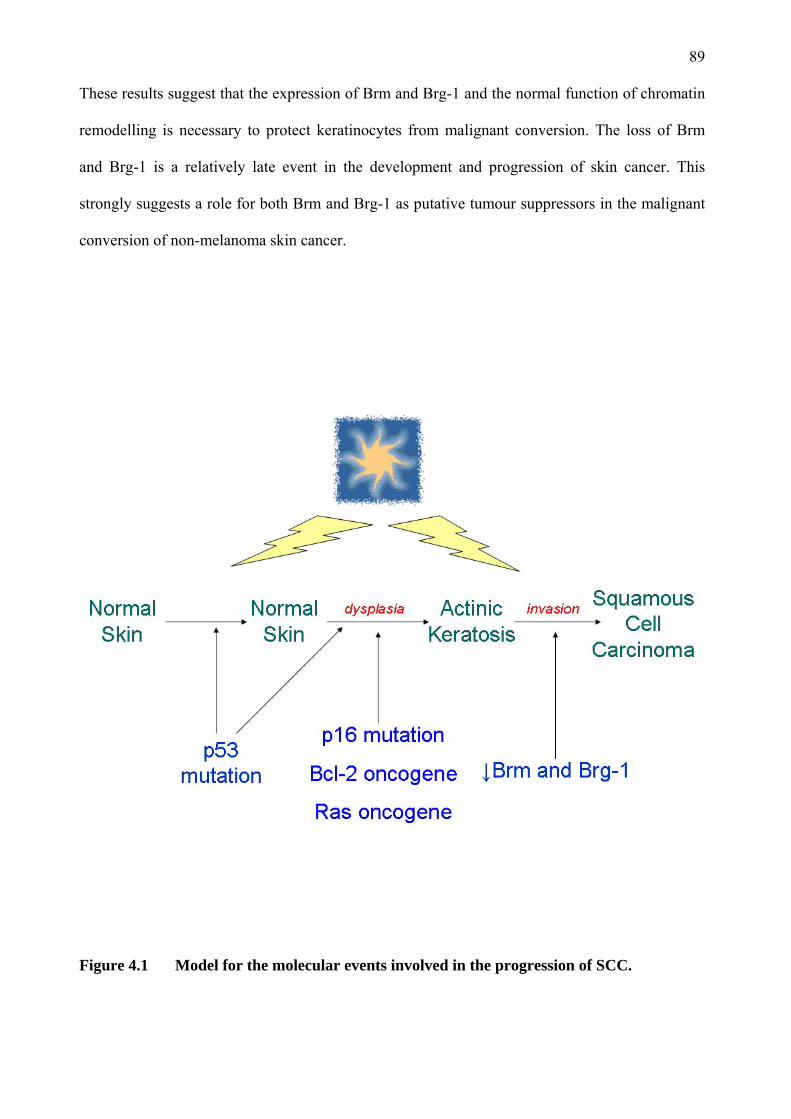
89
These results suggest that the expression of Brm and Brg-1 and the normal function of chromatin
remodelling is necessary to protect keratinocytes from malignant conversion. The loss of Brm
and Brg-1 is a relatively late event in the development and progression of skin cancer. This
strongly suggests a role for both Brm and Brg-1 as putative tumour suppressors in the malignant
conversion of non-melanoma skin cancer.
Figure 4.1 Model for the molecular events involved in the progression of SCC.

90
Appendix 1 – Information for Participants
Introduction
You are invited to take part in a research study into the mechanisms by which skin tumours
develop. The objective is to investigate whether the molecules brm or brg-1 are involved in
development of skin cancers by comparing normal skin tissue with skin cancers.
The study is being conducted by Professor Gary Halliday, a scientist, Dr Guy Lyons, a scientist
and Dr Vanessa Bock, a research student, from the Department of Dermatology.
Study Procedures
If you agree to participate in this study, you will be asked to sign the Participant Consent From.
You will then have your solar keratosis or squamous cell carcinomas removed as planned. Part of
the tissue removed will be sent for routing pathology testing to confirm the diagnosis. The
remainder of the tissue (which would otherwise be discarded) will be used for the research
project.
Risks
Participation in this study will not alter the risks associated with the removal of your solar
keratosis or squamous cell carcinomas, which you are undergoing as part of your clinical care.
Benefits
While we intend that this research study furthers medical knowledge and may improve treatment
of skin cancer in the future, it may not be of direct benefit to you.
Costs
Participation in this study will not cost you anything, nor will you be paid.

91
Voluntary Participation
Participation in this study is entirely voluntary. You do not have to take part in it. If you do take
part, you can withdraw without having to give a reason at any time up until your tissue is taken to
the research laboratories. After this time it will not be possible to withdraw your tissue from this
study as it will not be identified with your name, and therefore it will not be possible to determine
which tissue is yours.
Whatever your decision, please be assured that it will not affect your medical treatment or your
relationship with the staff who are caring for you. Of the people treating you, only the doctor
treating you will be aware of your participation or non-participation.
Confidentiality
All the information collected from you for the study will be treated confidentially, and only the
researchers named above will have access to it. The study results may be presented at a
conference or in a scientific publication, but individual participants will not be identifiable in
such a presentation.
Further Information
When you have read this information, your doctor will discuss it with you further and answer any
questions you may have. If you would like to know more at any stage, please feel free to contact
Professor Gary Halliday on 95156762.
This information sheet is for you to keep.
Ethics Approval
This study has been approved by the Ethics Review Committee (RPAH Zone) of the Sydney
South West Area Health Service. Any person with concerns or complaints about the conduct of
this study should contact the Secretary on 02 9515 6766 and quote protocol number X05-0233.

92
Appendix 2 – Consent Form
RESEARCH STUDY INTO THE ROLE OF BRM IN SKIN TUMOUR PROGRESSION
FROM BENIGN TO MALIGNANT
PARTICIPENT CONSENT FORM
I, …………………………………………………………………………………………….[nome]
of
…………………………………………………………………………………………….[address]
have read and understood the Information for Participants on the above named research study and
have discussed the study with ………………………………………………………………………
I have been made aware of the procedures involved in the study, including any known or
expected inconvenience, risk, discomfort or potential side effect and of their implications as far as
they are currently known by the researchers.
I freely choose to participate in this study and understand that I can withdraw at any time until the
skin to be used for research is sent to the research laboratory.
I also understand that the research study is strictly confidential.
I hereby agree to participate in this research study.
NAME: ………………………………………………………………
SIGNATURE: ………………………………………………………………
DATE: ………………………………………………………………
NAME OF WITNESS: ………………………………………………………………
SIGNATURE OF WITNESS: ………………………………………………………………

93
Appendix 3 – Participant Questionnaire
Thank you for choosing to participate in this research project looking at skin cancers. It would
be very helpful if you could take a minute to complete this questionnaire. All information will
remain de-identified and confidential.
How long have you noticed this skin lesion to be present?
______________________________________________________________________________
Has this lesion ever been treated with cryotherapy (liquid nitrogen spray), Aldara (Imiquimod)
cream or photodynamic therapy?
□ No
□ Yes – please specify which and how long ago _______________________________________
How would you describe your skin type? (please circle the option which best describes you)
□ Never tan, burn very easily
□ Tan with some difficulty, burn very easily
□ Tan after initial sunburn
□ Olive skin, tans easily
□ Brown skin, tans easily
□ Black skin, becomes darker after sun exposure
Do you have a family history of skin caner or melanoma?
□ No
□ Yes – please specify family member and tumour type if known
Eg: mother – melanoma; father – SCC
________________________________________________________________________

94
How would you describe your racial background?
Eg: Caucasian, Asian, Aboriginal/Torres Strait Islander, Indian, Negro, etc.
________________________________________________________________________
What is/has been your occupation?
______________________________________________________________________________
Does your work/activities involve sun exposure?
□ Yes
□ No
What skin care products do you use? How frequently do you use these?
_________________________________ ___________________________________
_________________________________ ___________________________________
_________________________________ ___________________________________
_________________________________ ___________________________________
How often do you use sunscreen?
□ Every day
□ Every few days
□ Approximately weekly
□ Only occasionally
□ Never
Thank you again for taking this time to complete this questionnaire. Your participation will
assist in the research of skin cancers.
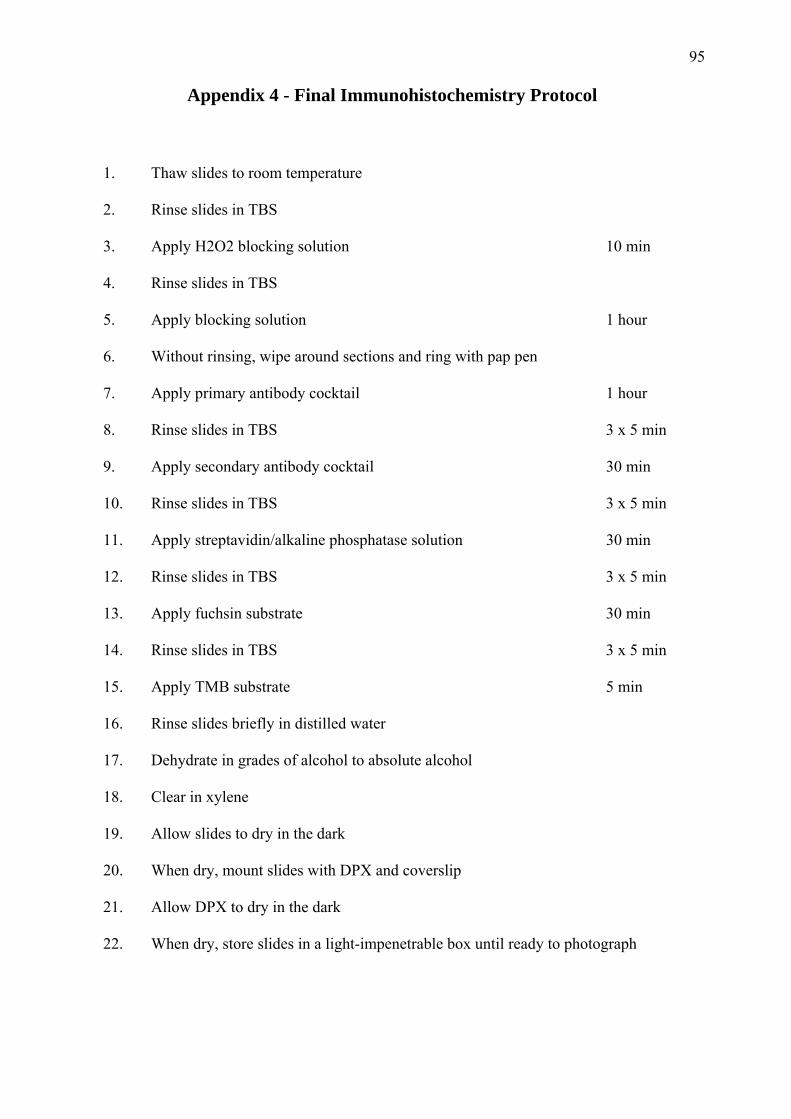
95
Appendix 4 - Final Immunohistochemistry Protocol
1. Thaw slides to room temperature
2. Rinse slides in TBS
3. Apply H2O2 blocking solution 10 min
4. Rinse slides in TBS
5. Apply blocking solution 1 hour
6. Without rinsing, wipe around sections and ring with pap pen
7. Apply primary antibody cocktail 1 hour
8. Rinse slides in TBS 3 x 5 min
9. Apply secondary antibody cocktail 30 min
10. Rinse slides in TBS 3 x 5 min
11. Apply streptavidin/alkaline phosphatase solution 30 min
12. Rinse slides in TBS 3 x 5 min
13. Apply fuchsin substrate 30 min
14. Rinse slides in TBS 3 x 5 min
15. Apply TMB substrate 5 min
16. Rinse slides briefly in distilled water
17. Dehydrate in grades of alcohol to absolute alcohol
18. Clear in xylene
19. Allow slides to dry in the dark
20. When dry, mount slides with DPX and coverslip
21. Allow DPX to dry in the dark
22. When dry, store slides in a light-impenetrable box until ready to photograph
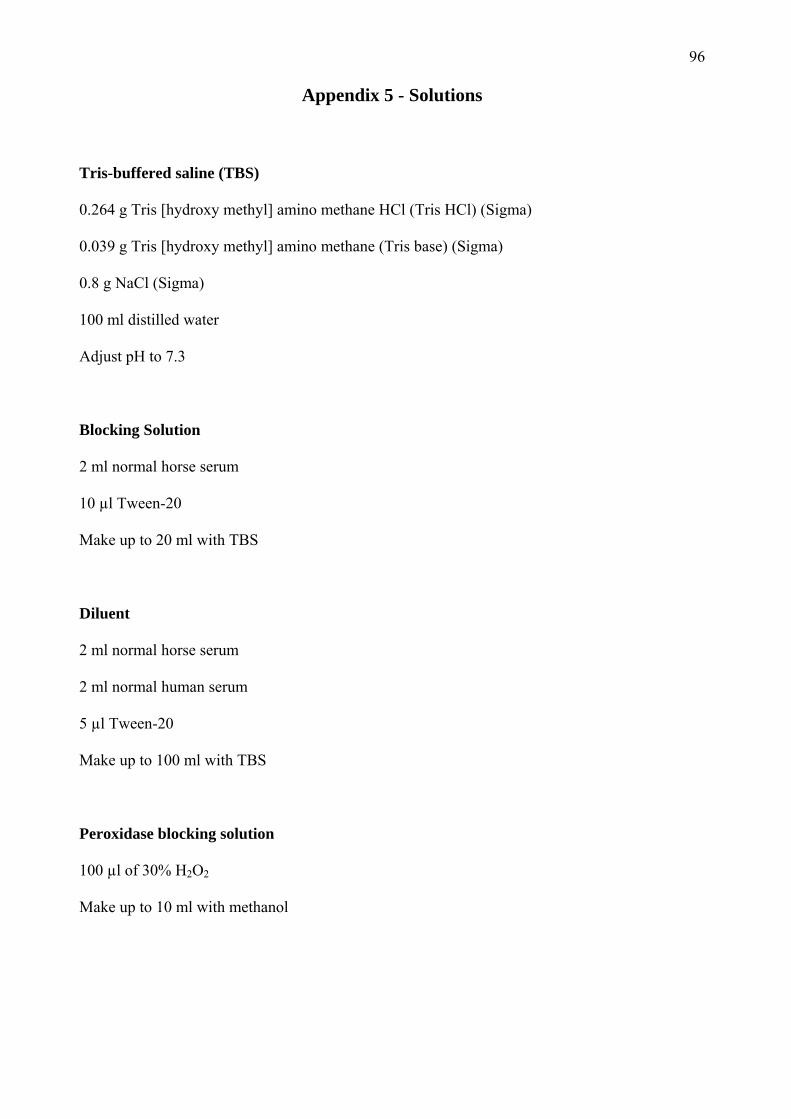
96
Appendix 5 - Solutions
Tris-buffered saline (TBS)
0.264 g Tris [hydroxy methyl] amino methane HCl (Tris HCl) (Sigma)
0.039 g Tris [hydroxy methyl] amino methane (Tris base) (Sigma)
0.8 g NaCl (Sigma)
100 ml distilled water
Adjust pH to 7.3
Blocking Solution
2 ml normal horse serum
10 µl Tween-20
Make up to 20 ml with TBS
Diluent
2 ml normal horse serum
2 ml normal human serum
5 µl Tween-20
Make up to 100 ml with TBS
Peroxidase blocking solution
100 µl of 30% H2O2
Make up to 10 ml with methanol
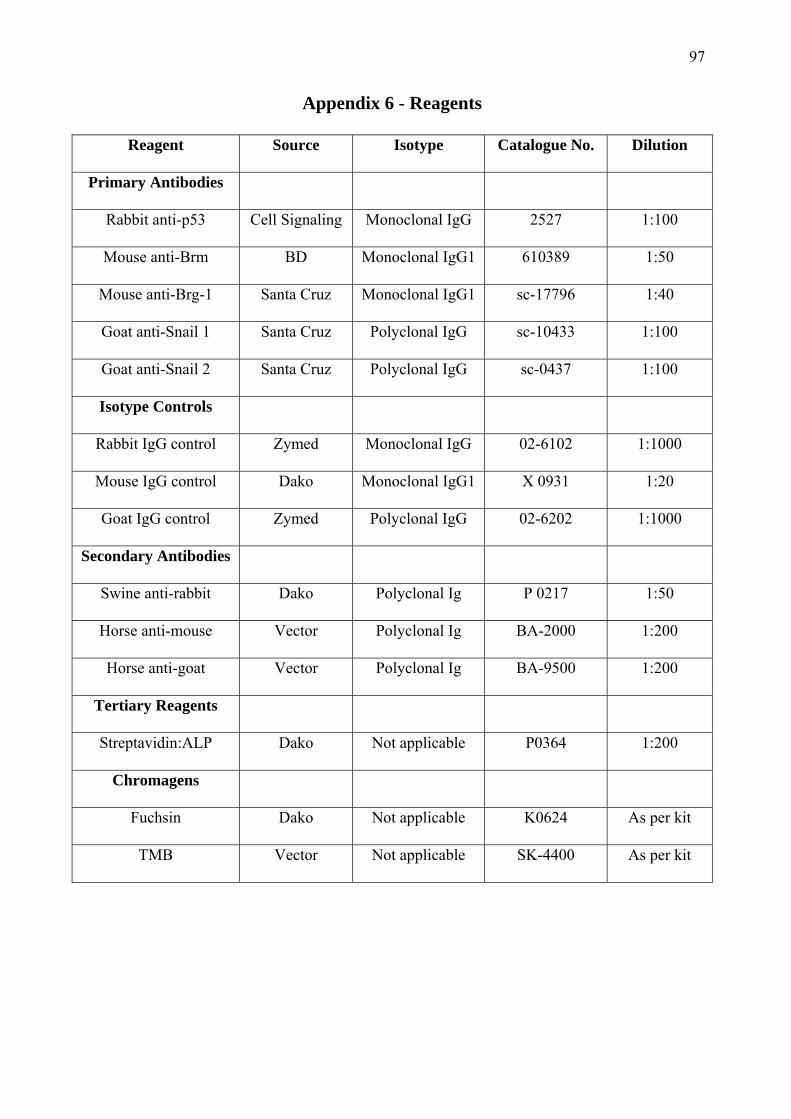
97
Appendix 6 - Reagents
Reagent Source Isotype Catalogue No. Dilution
Primary Antibodies
Rabbit anti-p53 Cell Signaling Monoclonal IgG 2527 1:100
Mouse anti-Brm BD Monoclonal IgG1 610389 1:50
Mouse anti-Brg-1 Santa Cruz Monoclonal IgG1 sc-17796 1:40
Goat anti-Snail 1 Santa Cruz Polyclonal IgG sc-10433 1:100
Goat anti-Snail 2 Santa Cruz Polyclonal IgG sc-0437 1:100
Isotype Controls
Rabbit IgG control Zymed Monoclonal IgG 02-6102 1:1000
Mouse IgG control Dako Monoclonal IgG1 X 0931 1:20
Goat IgG control Zymed Polyclonal IgG 02-6202 1:1000
Secondary Antibodies
Swine anti-rabbit Dako Polyclonal Ig P 0217 1:50
Horse anti-mouse Vector Polyclonal Ig BA-2000 1:200
Horse anti-goat Vector Polyclonal Ig BA-9500 1:200
Tertiary Reagents
Streptavidin:ALP Dako Not applicable P0364 1:200
Chromagens
Fuchsin Dako Not applicable K0624 As per kit
TMB Vector Not applicable SK-4400 As per kit
98
Chapter 5 References
Alam, M. and D. Ratner (2001). "Cutaneous squamous-cell carcinoma." N Engl J Med 344(13):
975-83.
Alberts, B., A. Johnson, et al. (2002). Molecular Biology of the Cell, Garland Science.
Aravind, L. and D. Landsman (1998). "AT-hook motifs identified in a wide variety of DNA-
binding proteins." Nucleic Acids Res 26(19): 4413-21.
Armstrong, B. K. and A. Kricker (2001). "The epidemiology of UV induced skin cancer." J
Photochem Photobiol B 63(1-3): 8-18.
Barrallo-Gimeno, A. and A. Nieto (2005). "The Snail genes as inducers of cell movement and
survival: implications in development and cancer." Development 132: 3151-3161.
Barrallo-Gimeno, A. and M. A. Nieto (2005). "The Snail genes as inducers of cell movement and
survival: implications in development and cancer." Development 132(14): 3151-61.
Batinac, T., G. Zamolo, et al. (2004). "p53 protein expression and cell proliferation in non-
neoplastic and neoplastic proliferative skin diseases." Tumori 90(1): 120-7.
Batlle, E., E. Sancho, et al. (2000). "The transcription factor snail is a repressor of E-cadherin
gene expression in epithelial tumour cells." Nat Cell Biol 2(2): 84-9.
Berhane, T., G. M. Halliday, et al. (2002). "Inflammation is associated with progression of actinic
keratoses to squamous cell carcinomas in humans." Br J Dermatol 146(5): 810-5.
Black, H. S. and J. T. Chan (1976). "Etiologic related studies of ultraviolet light-mediated
carcinogenesis." Oncology 33(3): 119-22.
Black, H. S. and D. R. Douglas (1973). "Formation of a carcinogen of natural origin in the
etiology of ultraviolet light-induced carcinogenesis." Cancer Res 33(9): 2094-6.
Blanco, M. J., G. Moreno-Bueno, et al. (2002). "Correlation of Snail expression with histological
grade and lymph node status in breast carcinomas." Oncogene 21(20): 3241-6.
Bochar, D. A., L. Wang, et al. (2000). "BRCA1 is associated with a human SWI/SNF-related
complex: linking chromatin remodeling to breast cancer." Cell 102(2): 257-65.
99
Bolos, V., H. Peinado, et al. (2003). "The transcription factor Slug represses E-cadherin
expression and induces epithelial to mesenchymal transitions: a comparison with Snail
and E47 repressors." J Cell Sci 116(Pt 3): 499-511.
Boni, R., C. Schuster, et al. (2002). "Epidemiology of skin cancer." Neuro Endocrinol Lett 23
Suppl 2: 48-51.
Boulay, J. L., C. Dennefeld, et al. (1987). "The Drosophila developmental gene snail encodes a
protein with nucleic acid binding fingers." Nature 330(6146): 395-8.
Boyer, L. A., C. Logie, et al. (2000). "Functional delineation of three groups of the ATP-
dependent family of chromatin remodeling enzymes." J Biol Chem 275(25): 18864-70.
Bultman, S., T. Gebuhr, et al. (2000). "A Brg1 null mutation in the mouse reveals functional
differences among mammalian SWI/SNF complexes." Mol Cell 6(6): 1287-95.
Burkitt, H. G., A. Stevens, et al. (1996). Wheater's Basic Histopathology. New York, Churchill
Livingstone.
Butani, A., D. M. Arbesfeld, et al. (2005). "Premalignant and early squamous cell carcinoma."
Clin Plast Surg 32(2): 223-35.
Caulin, C., T. Nguyen, et al. (2007). "An inducible mouse model for skin cancer reveals distinct
roles for gain- and loss-of-function p53 mutations." J Clin Invest 117(7): 1893-901.
Chomczynski, P. and N. Sacchi (1987). "Single-step method of RNA isolation by acid
guanidinium thiocyanate-phenol-chloroform extraction." Anal Biochem 162(1): 156-9.
Clayman, G. L., J. J. Lee, et al. (2005). "Mortality risk from squamous cell skin cancer." J Clin
Oncol 23(4): 759-65.
Collins, T. J. (2007). "ImageJ for microscopy." Biotechniques 43(1 Suppl): 25-30.
Czarnecki, D., C. J. Meehan, et al. (2002). "The majority of cutaneous squamous cell carcinomas
arise in actinic keratoses." J Cutan Med Surg 6(3): 207-9.
Dajee, M., M. Lazarov, et al. (2003). "NF-kappaB blockade and oncogenic Ras trigger invasive
human epidermal neoplasia." Nature 421(6923): 639-43.
100
Dhasarathy, A., M. Kajita, et al. (2007). "The transcription factor snail mediates epithelial to
mesenchymal transitions by repression of estrogen receptor-alpha." Mol Endocrinol
21(12): 2907-18.
Drobetsky, E. A., J. Turcotte, et al. (1995). "A role for ultraviolet A in solar mutagenesis." Proc
Natl Acad Sci U S A 92(6): 2350-4.
Durando, B. and J. Reichel (2005). "The relative effects of different systemic
immunosuppressives on skin cancer development in organ transplant patients." Dermatol
Ther 18(1): 1-11.
English, D. R., B. K. Armstrong, et al. (1998). "Demographic characteristics, pigmentary and
cutaneous risk factors for squamous cell carcinoma of the skin: a case-control study." Int J
Cancer 76(5): 628-34.
Finizio, L., C. Vidali, et al. (2002). "What is the current role of radiation therapy in the treatment
of skin carcinomas?" Tumori 88(1): 48-52.
Fitzpatrick, T. B. (1988). "The validity and practicality of sun-reactive skin types I through VI."
Arch Dermatol 124(6): 869-71.
Fitzpatrick, T. B. and A. J. Sober (1985). "Sunlight and skin cancer." N Engl J Med 313(13): 818-
20.
Frost, C. A. and A. C. Green (1994). "Epidemiology of solar keratoses." Br J Dermatol 131(4):
455-64.
Fuchs, A. and E. Marmur (2007). "The kinetics of skin cancer: progression of actinic keratosis to
squamous cell carcinoma." Dermatol Surg 33(9): 1099-101.
Fukuoka, J., T. Fujii, et al. (2004). "Chromatin remodeling factors and BRM/BRG1 expression as
prognostic indicators in non-small cell lung cancer." Clin Cancer Res 10(13): 4314-24.
Gusterson, B. A., R. Anbazhagan, et al. (1991). "Expression of p53 in premalignant and
malignant squamous epithelium." Oncogene 6(10): 1785-9.
101
Halliday, G. M., R. Bestak, et al. (1998). "UVA-induced immunosuppression." Mutat Res 422(1):
139-45.
Halliday, G. M., A. Patel, et al. (1995). "Spontaneous regression of human
melanoma/nonmelanoma skin cancer: association with infiltrating CD4+ T cells." World J
Surg 19(3): 352-8.
Hanneman, K. K., K. D. Cooper, et al. (2006). "Ultraviolet immunosuppression: mechanisms and
consequences." Dermatol Clin 24(1): 19-25.
Hardy, R. G., C. Vicente-Duenas, et al. (2007). "Snail family transcription factors are implicated
in thyroid carcinogenesis." Am J Pathol 171(3): 1037-46.
Harwood, C. A., C. M. Proby, et al. (2006). "Clinicopathologic features of skin cancer in organ
transplant recipients: a retrospective case-control series." J Am Acad Dermatol 54(2):
290-300.
Hemavathy, K., S. I. Ashraf, et al. (2000). "Snail/slug family of repressors: slowly going into the
fast lane of development and cancer." Gene 257(1): 1-12.
Higashikawa, K., S. Yoneda, et al. (2007). "Snail-induced down-regulation of DeltaNp63alpha
acquires invasive phenotype of human squamous cell carcinoma." Cancer Res 67(19):
9207-13.
Hollstein, M., D. Sidransky, et al. (1991). "p53 mutations in human cancers." Science 253(5015):
49-53.
Huang, C., E. A. Sloan, et al. (2003). "Chromatin remodeling and human disease." Curr Opin
Genet Dev 13(3): 246-52.
Hussein, M. R. (2005). "Ultraviolet radiation and skin cancer: molecular mechanisms." J Cutan
Pathol 32(3): 191-205.
Inukai, T., A. Inoue, et al. (1999). "SLUG, a ces-1-related zinc finger transcription factor gene
with antiapoptotic activity, is a downstream target of the E2A-HLF oncoprotein." Mol
Cell 4(3): 343-52.
102
Kajita, M., K. N. McClinic, et al. (2004). "Aberrant expression of the transcription factors snail
and slug alters the response to genotoxic stress." Mol Cell Biol 24(17): 7559-66.
Kharatishvili, T. K., S. A. Tiuliandin, et al. (2005). "[Range of combined treatment of locally
advanced skin cancer]." Vopr Onkol 51(3): 385-7.
Kricker, A., B. K. Armstrong, et al. (1995). "A dose-response curve for sun exposure and basal
cell carcinoma." Int J Cancer 60(4): 482-8.
Kricker, A., B. K. Armstrong, et al. (1993). "Measurement of skin cancer incidence." Health Rep
5(1): 63-6.
Leroy, P. and K. E. Mostov (2007). "Slug is required for cell survival during partial epithelial-
mesenchymal transition of HGF-induced tubulogenesis." Mol Biol Cell 18(5): 1943-52.
Liang, S. B., Y. Ohtsuki, et al. (1999). "Sun-exposure- and aging-dependent p53 protein
accumulation results in growth advantage for tumour cells in carcinogenesis of
nonmelanocytic skin cancer." Virchows Arch 434(3): 193-9.
Ling, G., C. A. Chadwick, et al. (2001). "Epidermal p53 response and repair of thymine dimers in
human skin after a single dose of ultraviolet radiation: effects of photoprotection." Acta
Derm Venereol 81(2): 81-6.
Liu, K., Y. Luo, et al. (2004). "TopBP1 recruits Brg1/Brm to repress E2F1-induced apoptosis, a
novel pRb-independent and E2F1-specific control for cell survival." Genes &
Development 18(6): 673-86.
Manzanares, M., A. Locascio, et al. (2001). "The increasing complexity of the Snail gene
superfamily in metazoan evolution." Trends Genet 17(4): 178-81.
Marks, R. (1999). "Two decades of the public health approach to skin cancer control in Australia:
why, how and where are we now?" Australas J Dermatol 40(1): 1-5.
Martinez-Alvarez, C., M. J. Blanco, et al. (2004). "Snail family members and cell survival in
physiological and pathological cleft palates." Dev Biol 265(1): 207-18.
103
Martinez-Estrada, O. M., A. Culleres, et al. (2006). "The transcription factors Slug and Snail act
as repressors of Claudin-1 expression in epithelial cells." Biochem J 394(Pt 2): 449-57.
Mercurio, A. M. (2003). "Invasive skin carcinoma--Ras and alpha6beta4 integrin lead the way."
Cancer Cell 3(3): 201-2.
Mittelbronn, M. A., D. L. Mullins, et al. (1998). "Frequency of pre-existing actinic keratosis in
cutaneous squamous cell carcinoma." Int J Dermatol 37(9): 677-81.
Moloney, F. J., H. Comber, et al. (2006). "A population-based study of skin cancer incidence and
prevalence in renal transplant recipients." Br J Dermatol 154(3): 498-504.
Montague, M., R. Borland, et al. (2001). "Slip! Slop! Slap! and SunSmart, 1980-2000: Skin
cancer control and 20 years of population-based campaigning." Health Educ Behav 28(3):
290-305.
Muchardt, C., B. Bourachot, et al. (1998). "ras transformation is associated with decreased
expression of the brm/SNF2alpha ATPase from the mammalian SWI-SNF complex."
Embo J 17(1): 223-31.
Muchardt, C. and M. Yaniv (1993). "A human homologue of Saccharomyces cerevisiae
SNF2/SWI2 and Drosophila brm genes potentiates transcriptional activation by the
glucocorticoid receptor." Embo J 12(11): 4279-90.
Muchardt, C. and M. Yaniv (2001). "When the SWI/SNF complex remodels...the cell cycle."
Oncogene 20(24): 3067-75.
Na, R., I. M. Stender, et al. (2001). "Autofluorescence of human skin is age-related after
correction for skin pigmentation and redness." Journal of Investigative Dermatology
116(4): 536-40.
Nagl, N. G., Jr., D. R. Zweitzig, et al. (2006). "The c-myc gene is a direct target of mammalian
SWI/SNF-related complexes during differentiation-associated cell cycle arrest." Cancer
Res 66(3): 1289-93.
104
Neuhaus, I. M. and W. D. Tope (2005). "Practical retinoid chemoprophylaxis in solid organ
transplant recipients." Dermatol Ther 18(1): 28-33.
Newkirk, K. M., A. E. Parent, et al. (2007). "Snai2 expression enhances ultraviolet radiation-
induced skin carcinogenesis." Am J Pathol 171(5): 1629-39.
Nieto, M. A. (2002). "The snail superfamily of zinc-finger transcription factors." Nat Rev Mol
Cell Biol 3(3): 155-66.
Onodera, H., S. Nakamura, et al. (1996). "Cell proliferation and p53 protein expressions in
cutaneous epithelial neoplasms." Am J Dermatopathol 18(6): 580-8.
Owen-Hughes, T. (2003). "Colworth memorial lecture. Pathways for remodelling chromatin."
Biochem Soc Trans 31(Pt 5): 893-905.
Palmer, H. G., M. J. Larriba, et al. (2004). "The transcription factor SNAIL represses vitamin D
receptor expression and responsiveness in human colon cancer." Nat Med 10(9): 917-9.
Polach, K. J. and J. Widom (1995). "Mechanism of protein access to specific DNA sequences in
chromatin: a dynamic equilibrium model for gene regulation." J Mol Biol 254(2): 130-49.
Raasch, B. A. and P. G. Buettner (2002). "Multiple nonmelanoma skin cancer in an exposed
Australian population." Int J Dermatol 41(10): 652-8.
Reisman, D. N., J. Sciarrotta, et al. (2005). "The expression of the SWI/SNF ATPase subunits
BRG1 and BRM in normal human tissues." Appl Immunohistochem Mol Morphol 13(1):
66-74.
Reisman, D. N., J. Sciarrotta, et al. (2003). "Loss of BRG1/BRM in human lung cancer cell lines
and primary lung cancers: correlation with poor prognosis." Cancer Res 63(3): 560-6.
Resnick-Silverman, L. and J. J. Manfredi (2006). "Gene-specific mechanisms of p53
transcriptional control and prospects for cancer therapy." J Cell Biochem.
Reyes, J. C., J. Barra, et al. (1998). "Altered control of cellular proliferation in the absence of
mammalian brahma (SNF2alpha)." Embo J 17(23): 6979-91.
105
Robert, C., B. Muel, et al. (1996). "Cell survival and shuttle vector mutagenesis induced by
ultraviolet A and ultraviolet B radiation in a human cell line." J Invest Dermatol 106(4):
721-8.
Rosivatz, E., I. Becker, et al. (2002). "Differential expression of the epithelial-mesenchymal
transition regulators snail, SIP1, and twist in gastric cancer." Am J Pathol 161(5): 1881-
91.
Rudolph, R. and D. E. Zelac (2004). "Squamous cell carcinoma of the skin." Plast Reconstr Surg
114(6): 82e-94e.
Saito, T., Y. Oda, et al. (2004). "E-cadherin mutation and Snail overexpression as alternative
mechanisms of E-cadherin inactivation in synovial sarcoma." Oncogene 23(53): 8629-38.
Savagner, P., D. F. Kusewitt, et al. (2005). "Developmental transcription factor slug is required
for effective re-epithelialization by adult keratinocytes." J Cell Physiol 202(3): 858-66.
Seo, S., G. A. Richardson, et al. (2005). "The SWI/SNF chromatin remodeling protein Brg1 is
required for vertebrate neurogenesis and mediates transactivation of Ngn and NeuroD."
Development 132(1): 105-15.
Shi, S. R., R. J. Cote, et al. (1997). "Antigen retrieval immunohistochemistry: past, present, and
future." Journal of Histochemistry & Cytochemistry 45(3): 327-43.
Smith, C. L. and C. L. Peterson (2005). "ATP-dependent chromatin remodeling." Current Topics
in Developmental Biology 65: 115-48.
St John, L. S., E. R. Sauter, et al. (2000). "Endogenous p53 gene status predicts the response of
human squamous cell carcinomas to wild-type p53." Cancer Gene Ther 7(5): 749-56.
Staples, M. P., M. Elwood, et al. (2006). "Non-melanoma skin cancer in Australia: the 2002
national survey and trends since 1985." Med J Aust 184(1): 6-10.
Strobeck, M. W., K. E. Knudsen, et al. (2000). "BRG-1 is required for RB-mediated cell cycle
arrest." Proc Natl Acad Sci U S A 97(14): 7748-53.
106
Strobeck, M. W., D. N. Reisman, et al. (2002). "Compensation of BRG-1 function by Brm:
insight into the role of the core SWI-SNF subunits in retinoblastoma tumor suppressor
signaling." J Biol Chem 277(7): 4782-9.
Studitsky, V. M., W. Walter, et al. (2004). "Chromatin remodeling by RNA polymerases." Trends
Biochem Sci 29(3): 127-35.
Sugimachi, K., S. Tanaka, et al. (2003). "Transcriptional repressor snail and progression of
human hepatocellular carcinoma." Clin Cancer Res 9(7): 2657-64.
Sun, A., O. Tawfik, et al. (2007). "Aberrant expression of SWI/SNF catalytic subunits
BRG1/BRM is associated with tumor development and increased invasiveness in prostate
cancers." Prostate 67(2): 203-13.
van der Loos, C. M. (1999). Immunoenzyme Multiple Staining Methods. New York.
Vega, S., A. V. Morales, et al. (2004). "Snail blocks the cell cycle and confers resistance to cell
death." Genes Dev 18(10): 1131-43.
Veness, M. J. (2006). "Defining patients with high-risk cutaneous squamous cell carcinoma."
Australas J Dermatol 47(1): 28-33.
Vidal, D. (2006). "Topical imiquimod: mechanism of action and clinical applications." Mini Rev
Med Chem 6(5): 499-503.
Vitale-Cross, L., P. Amornphimoltham, et al. (2004). "Conditional expression of K-ras in an
epithelial compartment that includes the stem cells is sufficient to promote squamous cell
carcinogenesis." Cancer Res 64(24): 8804-7.
Wolff, K., R. A. Johnson, et al. (2005). Fitzpatrick's Color Atlas & Synopsis of Clinical
Dermatology USA, McGraw-Hill.
Wong, A. K., F. Shanahan, et al. (2000). "BRG1, a component of the SWI-SNF complex, is
mutated in multiple human tumor cell lines." Cancer Res 60(21): 6171-7.
Woods, G. M., R. C. Malley, et al. (2005). "The skin immune system and the challenge of tumour
immunosurveillance." Eur J Dermatol 15(2): 63-9.
107
Yamamichi-Nishina, M., T. Ito, et al. (2003). "SW13 cells can transition between two distinct
subtypes by switching expression of BRG1 and Brm genes at the post-transcriptional
level." J Biol Chem 278(9): 7422-30.
Yamamichi, N., K. Inada, et al. (2007). "Frequent loss of Brm expression in gastric cancer
correlates with histologic features and differentiation state." Cancer Res 67(22): 10727-
35.
Yan, Z., K. Cui, et al. (2005). "PBAF chromatin-remodeling complex requires a novel specificity
subunit, BAF200, to regulate expression of selective interferon-responsive genes." Genes
Dev 19(14): 1662-7.
Yang, X. J. (2004). "Lysine acetylation and the bromodomain: a new partnership for signaling."
Bioessays 26(10): 1076-87.
Yin, J. L., N. A. Shackel, et al. (2001). "Real-time reverse transcriptase-polymerase chain
reaction (RT-PCR) for measurement of cytokine and growth factor mRNA expression
with fluorogenic probes or SYBR Green I." Immunol Cell Biol 79(3): 213-21.
Young, D. W., J. Pratap, et al. (2005). "SWI/SNF chromatin remodeling complex is obligatory
for BMP2-induced, Runx2-dependent skeletal gene expression that controls osteoblast
differentiation." J Cell Biochem 94(4): 720-30.
Zanetti, R., S. Rosso, et al. (2006). "Comparison of risk patterns in carcinoma and melanoma of
the skin in men: a multi-centre case-case-control study." Br J Cancer 94(5): 743-51.
Zhang, A. L., Q. S. Wang, et al. (2005). "[Effect of transcriptional factor snail on epithelial-
mesenchymal transition and tumor metastasis]." Ai Zheng 24(11): 1301-5.
Zhao, K., W. Wang, et al. (1998). "Rapid and phosphoinositol-dependent binding of the
SWI/SNF-like BAF complex to chromatin after T lymphocyte receptor signaling." Cell
95(5): 625-36.
Zofall, M., J. Persinger, et al. (2006). "Chromatin remodeling by ISW2 and SWI/SNF requires
DNA translocation inside the nucleosome." Nat Struct Mol Biol 13(4): 339-46.

108