the role of beverages in the australian diet · 2 the role of beverages in the australian diet...
TRANSCRIPT

The role of beverages in the Australian dietA secondary analysis of the Australian Health Survey:
National Nutrition and Physical Activity Survey (2011-12)

THE ROLE OF BEVERAGES IN THE AUSTRALIAN DIET2
Snapshot of key findings
What are Australians consuming?
y Across the population, the most commonly
consumed non-dairy, non-alcoholic beverages were
water, followed by sugar-sweetened soft drinks and
fruit juice.
y In general, women consume more non-dairy, non-
alcoholic beverages than men, though men consume
more sugar-sweetened beverages than women.
y Across the population, teenagers, especially males,
are the highest consumers of sugar-sweetened
beverages.
y Among adult consumers, the average daily volume
of sugar-sweetened beverages consumed was similar
to low-kJ beverages (~670mL for males and ~485mL
for females).
y Among children, both the percentage consuming and
mean intakes of soft drinks/flavoured water appear
to have decreased between 1995 and 2011-12.
y Among children, both the percentage consuming
and mean intake of fruit and vegetable juices/drinks
appear to have decreased between 1995 and 2011-12.
Contribution to energy intake
y The contribution of beverages to total energy intake
is relatively low across the population – 4% of adults’
and 6% of children’s intake.
y The contribution of sugar-sweetened beverages to
total energy intake increased with age to a peak in
14–18 year olds, before declining through adulthood.
y Overall, soft drinks contributed <2% to the total
energy intakes of Australian adults and children.
y Discretionary foods and drinks contribute
significantly to the total energy intake of the
population – 36% for adults and 42% for children.
y ADULTS: Choices contributing the most to total
dietary energy from the discretionary food and drink
category are: confectionery & chocolates (18% of total
discretionary kilojoules), sweet biscuits & cakes (13%)
and alcoholic beverages (13%), followed by burgers/
pizza/tacos (7%), sweet & savoury pies & pastries
(6%) and fried potatoes & crisps (5%). Soft drinks
provide 4% of discretionary kilojoules, ranked 7th.
y CHILDREN: Choices contributing the most to total
dietary energy from the discretionary food and drink
category: are confectionery & chocolates (17% of
total discretionary kilojoules), sweet biscuits & cakes
(16%) and fried potatoes & crisps (11%), followed by
burgers/pizza/tacos (10%), savoury biscuits (6%) and
sweet & savoury pies & pastries (5%). Soft drinks
provide 4% of discretionary kilojoules, ranked 7th.
y Among discretionary beverages, alcoholic beverages
were the highest contributor to total energy intake at
5.3% for adults, followed by soft drinks at 1.7%.
The Australian Health Survey 2011–2012 is
the largest and most comprehensive health survey ever conducted
in Australia

A SECONDARY ANALYSIS OF THE AUSTRALIAN HEALTH SURVEY: NATIONAL NUTRITION AND PHYSICAL ACTIVITY SURVEY (2011-12) 3
Socio-economic factors
y In adults, consumption of non-dairy, non-
alcoholic beverages was greater in people with
higher household income, largely due to greater
water intake.
y Sugar-sweetened beverage consumption was higher,
and fruit juice intake was lower, in people with lower
ranking of socio-economic status.
y Intake of sugar-sweetened beverages was lower
among those living in major cities compared to
those in regional centres and more remote areas.
Nutrient contributions
y Beverages contribute appreciably to total sugars
intake, with soft drinks being the major contributor
(7.7% of total sugars intake for children, 7.1% of total
sugars intake for adults).
y Fruit juices and fruit drinks provide about 60% of the
Vitamin C intake of consumers of these beverages.
y For all age groups of children (consumers and non-
consumers), fruit juice contributed 12–15% to total
Vitamin C intake
y On a population basis, the contribution of beverages
(not including coffee or tea) to caffeine intake is low,
though it averages about one-fifth of the caffeine
intake among consumers of these beverages
Association with weight status
y In adults, there was no clear relationship between
weight status and the proportion consuming
sugar-sweetened beverages, or the total
consumption of these beverages.
y Consumption of sugar-sweetened beverages
increased with weight status in girls, but not boys.
y Consumption of low-kJ sweetened beverages
increased with weight status in adults.
Association with lifestyle patterns
y Beverage consumption is strongly associated with
lifestyle pattern, which considers dietary quality and
physical activity/sedentary behaviour.
y Adults and children with the least healthy lifestyle
pattern reported in the survey consume 4–6 times
more sugar-sweetened beverages than those with
the most healthy lifestyle pattern.

THE ROLE OF BEVERAGES IN THE AUSTRALIAN DIET4
Introduction Australians have access to a wide variety of beverages
to quench their thirst and provide enjoyment.
To understand the role of non-dairy, non-alcoholic
beverages in the diet of Australians, a secondary
analysis of the National Nutrition and Physical Activity
Survey (2011-12) (part of the Australian Health Survey)
was commissioned by the Australian Beverages
Council and conducted by the CSIRO Food and
Nutrition Flagship.
The secondary analysis examined beverage consumption
levels and patterns and the relationships between
beverage intake and nutritional status, lifestyle
behaviour and other factors related to health.
This report aims to provide health professionals,
health organisations, policy makers and the beverage
industry with an accurate and contemporary
understanding of the role of beverages in the
diet of Australian children and adults.

A SECONDARY ANALYSIS OF THE AUSTRALIAN HEALTH SURVEY: NATIONAL NUTRITION AND PHYSICAL ACTIVITY SURVEY (2011-12) 5
The Australian Health Survey and secondary analysisThe Australian Health Survey 2011–2013 was conducted by the Australian Bureau of Statistics and includes the
National Nutrition and Physical Activity Survey (2011-12) (NNPAS). It is the largest and most comprehensive
health survey ever conducted in Australia.
The Survey includes data on: Dietary behaviour and intake
Physical activity and sedentary behaviour; and
Health measurements, such as weight status.
Data collection:
y 2011–2012
Survey sample:
y 12,153 adults and children aged 2 years and over
from across Australia
Survey methods:
y 24-hour multiple-pass dietary recall
y Data collected during face-to-face interview
y Data gathered for all days, and across four
seasons of the year
y Height and weight were collected for 85% of
the sample
y Assessment of physical activity and sedentary
behaviour was included
Secondary analysis of the National Nutrition and Physical Activity Survey
Conducted by:
y CSIRO Food and Nutrition Flagship
Methodological considerations:
y The analysis focussed on dietary intake
measured on a single day for each individual
subject. The mean intake results for a single
day represent the population mean intake.
The terminology ‘on the day of the survey’
is employed when reporting a result which
changes according to the number of days of
intake measurement.
y Under-reporting of energy intake in the survey
data (and therefore food intake) is estimated to
be up to 17% for males and 21% for females.
y Results are population weighted to provide a
true estimate of population intake.

THE ROLE OF BEVERAGES IN THE AUSTRALIAN DIET6
Beverage categories
Key DefinitionsBeverages are consumed by some
sections of the population but not others.
In this report, specific beverages are
considered in terms of their impact on
the sub-section of the population that
consumed the beverage on the day of
the survey and on the whole population.
Population
All survey subjects
(consumers + non-consumers).
Consumers
Survey subjects who reported
consumption of a specific non-dairy,
non-alcoholic beverage in any amount
on the day of the 24-hour recall.
For example, survey subjects who
consumed fruit drink within the 24-hour
recall are referred to as ‘fruit drink’
consumers.
Note: To assess the contribution of beverages to ‘Discretionary Choices’, the analysis included all discretionary beverages – alcoholic beverages as well as sugar-sweetened beverages – along with other discretionary foods like cakes, chocolates and confectionary (categorisation guided by the recent ABS classification1).
Sweetened beverages
Sugar- sweetened beverages
• Fruit drink• Cordials• Flavoured water• Energy drinks• Soft drinks • Iced tea• Sports drinks
Low-kJ sweetened beverages
• Fruit drink• Cordials• Flavoured water• Energy drinks • Soft drinks
Fruit juice (with no
added sugar)
All unsweetened
water
Tap water
Rain water
Bottled water
Bore water
Sparkling and still
water
All non-dairy, non-alcoholic beverages
FIGURE 1: Relationship between the beverage categories
Australians consume a diverse array of beverages.
The focus of the secondary analysis was on
non-dairy, non-alcoholic beverages, which included
the following:
Water
including tap water, rain water, bore water,
bottled water, sparkling and still water
Fruit juice (with no added sugar)
Sweetened beverages
Sugar-sweetened beverages (SSBs)
including soft drinks, fruit drinks, cordials,
sports drinks, energy drinks, flavoured water
and iced tea
Low-kilojoule (low-kJ) sweetened beverages
including soft drinks, fruit drinks, cordials,
energy drinks, flavoured water and iced tea
This analysis excludes milk, milk-based drinks, meal
replacements, vegetable juices, tea, coffee, beer, wine
and spirits, including premixed alcoholic drinks.

A SECONDARY ANALYSIS OF THE AUSTRALIAN HEALTH SURVEY: NATIONAL NUTRITION AND PHYSICAL ACTIVITY SURVEY (2011-12) 7
Australians’ beverage intakeWhat is the population consuming?On the day of the survey, almost
all Australians reported consuming
non-dairy, non-alcoholic beverages.
The percentage of adult consumers
(95%) was lower than children (99%),
although tea, coffee, milk and
alcoholic drinks were excluded from
this analysis.
The overall pattern of consumption
of beverages was similar for
adults and children with the most
commonly consumed beverage
being water, followed by sugar-
sweetened soft drinks and fruit juice
(Table 1).
Water was consumed by 92% of children and 86% of adults on the day of the survey.
Consumption of other beverages There were a number of beverage
types which were infrequently
consumed by adults and children
including sports drinks, low-kJ
sweetened cordials and flavoured
water, energy drinks, iced tea and
flavoured water – where less than
3% of the population reported to
consume each of these beverages.
Figure 2: Percentage of the population consuming non-dairy, non-alcoholic beverages on the day of the survey for children 2-18 years and adults 19+ years
Non-dairy, non-alcoholic beverage categories
70
80
90
FIGURE 2
TABLE 2
FIGURE 3
FIGURE 4
0
Tap
wat
er
Soft
drin
ks
Uns
wee
tend
edfr
uit j
uice
Frui
t jui
ce
(no
adde
d su
gar)
Cor
dial
Rai
n w
ater
Bot
tled
wat
er
Low
-kJ
soft
drin
ks
Spor
ts d
rinks
Low
-kJ
cord
ials
Flav
oure
d w
ater
Spar
klin
g an
dst
ill w
ater
Ener
gy d
rinks
Iced
tea
Low
-kJ
flavo
ured
wat
er
Bor
e w
ater
Low
-kJ
ener
gy d
rinks
10
20
30
40
50
60
Per
cent
age
of th
e po
pula
tion
cons
umin
g (%
)M
ean
inta
ke (m
Ls)
Age group (years)
Mea
n in
take
(mLs
)
2-18 years
19+ years
89%82%
12%10%
>% of women consumewater and Low-KJ sweetenedbeverages than men.
11%6%
More adults consume low-kjsweetened beverages than children. Peak in proportion consuming occurred in older age groups (31-50 years)
36%25%
>% of men consumesugar-sweetened beveragesthan women.
20%
11%
Young children (2-8 years)highest prevalence of fruit drink and cordial consumption
200400600
800
10001200
1400
1600
200400
600
800
1000
1200
1400
1.2 cans
6.1 glasses
0.6 cans
4.9 glasses
2-3 4-8 9-13 14-18 19-30 31-50 51-70 70+ 2-3 4-8 9-13 14-18 19-30 31-50 51-70 70+
Age group (years)Water Sugar-sweetened beverages
Low-kJ sweetened beverages Fruit juice (no added sugar)
Water Sugar-sweetened beverages
Low-kJ sweetened beverages Fruit juice (no added sugar)
2-30%
10%
20%
30%
40%
50%
60%
70%
80%
90%
100%
Iced Tea
Flavou=red Water
Energy Drink
Sports Drink
Cordial
Fruit Drink
Soft Drink
4-8 9-13 14-18 19-30 31-50 51-70 70+
AGE GROUP (YEARS)
CONT
RIBU
TION
TO TO
TAL
SSBS
(%)
Table 1: The top six non-dairy, non-alcoholic beverages consumed across the population on the day of the survey for children and adults
FIGURE 8
TABLE 1
01
2
3
4
5
6
7
Con
trib
utio
n to
tota
l ene
rgyi
ntak
e (%
)
Age group (years)
Beverage categories
Fruit juiceSugar-sweetened beverages
2-3 4-8 9-13 14-18 19-30 31-50 51-70 71+
1400
FIGURE 6
0
Non-dairy, non-alcoholic
beverages
Fruit juice(no added sugar)
Sugar-sweetened beverages
Low-kJdrinks
Water
200
400
600
800
1000
1200
Mea
n in
take
(mL)
Lowest 20%Second quintileThird quintileFourth quintileHighest quintile
Water
Fruit juice(no added sugar)
Low-kJ Drinks
Sugar-sweetened soft drinks
Fruit drinks
Cordial
Children (2-18 yrs)
92% 86%
25% 19%
23% 15%
17% 8%
10% 5%
6% 11%
Adults (19+ yrs)
Less than 3% of the population consumed sports drinks, low-kJ sweetened cordials and flavoured water, energy drinks, iced tea, flavoured, sparkling and still water, and bore water.

THE ROLE OF BEVERAGES IN THE AUSTRALIAN DIET8
Table 2: Age and gender differences at a population level
89%82%
12%10%
The proportion of women consuming water and
low-kJ sweetened beverages was higher than
men (89% vs 82% and 12% vs 10% respectively for
water and low-kJ sweetened beverages).
36%25% A greater proportion of men consume
sugar-sweetened beverages than women
(36% compared to 25%).
Young children (2-8 years) had the highest
prevalence of fruit drink and cordial consumption
(20% and 11% respectively), and this steadily
decreased with age.
The proportion of Australians consuming
sugar-sweetened soft drinks peaks in 14–18 year
olds (43% for males and 32% for females) before
declining in the older adult years (19 years and
over) (23% for males and 14% for females).
23% 14%43% 32%
More adults consume low-kJ sweetened
beverages than children (11% compared to 6%).
A peak in the proportion consuming occurred in
older age groups (31-50 years).
6% 11%
20% 11%
What we drink changes by life-stage

A SECONDARY ANALYSIS OF THE AUSTRALIAN HEALTH SURVEY: NATIONAL NUTRITION AND PHYSICAL ACTIVITY SURVEY (2011-12) 9
Figure 3: Mean consumption of non-dairy, non-alcoholic beverages across the population, by age and gender
The mean total intake of non-dairy,
non-alcoholic beverages across
the Australian population was
approximately 1200mL for children
and 1400mL for adults, with mean
intake being higher in males than
females. The major contributor to
intake was water, in particular tap
water, in both males and females,
followed by sugar-sweetened
beverages, with fruit juice and
low-kJ sweetened beverages
making relative minor contributions
(Figure 3).
Population consumption: male subgroups Although mean consumption
of sugar-sweetened beverages
at the population level was less
than 125mL (one-third of a can)
on the day of the survey, specific
subgroups reported higher intakes
(Figure 3). For example, on average
across the population, adolescent
males aged 14–18 years reported a
mean intake of 435mL (1.2 cans).
This group and men in the 19–30
year age group consumed about
150mL (0.4 can) or more sugar-
sweetened beverage than any other
age/gender subgroup on the day of
the survey.
Mean intake of beverages across the population
Mea
n in
take
(mL)
Age group (years)
Mea
n in
take
(mL)
200
400
600
800
1000
1200
1400
1600
200
400
600
800
1000
1200
1400
1.2 cans
6.1 glasses
0.6 cans
4.9 glasses
2-3 4-8 9-13 14-18 19-30 31-50 51-70 70+ 2-3 4-8 9-13 14-18 19-30 31-50 51-70 70+
Age group (years)
Water Sugar-sweetened beverages
Low-kJ sweetened beverages Fruit juice (no added sugar)
Water Sugar-sweetened beverages
Low-kJ sweetened beverages Fruit juice (no added sugar)
Mea
n in
take
(mL)
Age group (years)
Mea
n in
take
(mL)
200
400
600
800
1000
1200
1400
1600
200
400
600
800
1000
1200
1400
1.2 cans
6.1 glasses
0.6 cans
4.9 glasses
2-3 4-8 9-13 14-18 19-30 31-50 51-70 70+ 2-3 4-8 9-13 14-18 19-30 31-50 51-70 70+
Age group (years)
Water Sugar-sweetened beverages
Low-kJ sweetened beverages Fruit juice (no added sugar)
Water Sugar-sweetened beverages
Low-kJ sweetened beverages Fruit juice (no added sugar)
The mean population intake of sugar-sweetened beverages was one-third of a can, though adolescent males reported a higher intake of 1.2 cans on the day of the survey.
0.3 cans
Total population
1.2 cans
Adolescent males
Mea
n in
take
(mL)
Age group (years)
Mea
n in
take
(mL)
200
400
600
800
1000
1200
1400
1600
200
400
600
800
1000
1200
1400
1.2 cans
6.1 glasses
0.6 cans
4.9 glasses
2-3 4-8 9-13 14-18 19-30 31-50 51-70 70+ 2-3 4-8 9-13 14-18 19-30 31-50 51-70 70+
Age group (years)
Water Sugar-sweetened beverages
Low-kJ sweetened beverages Fruit juice (no added sugar)
Water Sugar-sweetened beverages
Low-kJ sweetened beverages Fruit juice (no added sugar)

THE ROLE OF BEVERAGES IN THE AUSTRALIAN DIET10
2-3
0%
10%
20%
30%
40%
50%
60%
70%
80%
90%
100%
4-8 9-13 14-18 19-30 31-50 51-70 70+
Soft drinkFruit drinkCordial
Sports drinkEnergy drinkFlavoured waterIced tea
Con
trib
utio
n to
tota
l SSB
s (%
)
Age group (years)
Population consumption: Sugar-sweetened beveragesAmongst Australians, the
contribution of specific beverages
to sugar-sweetened beverages
consumption (as a percentage) by
age group is depicted in Figure 4.
The combination of soft drinks and
fruit drinks comprises 60–75% of
all sugar-sweetened beverages for
most age groups. Cordial makes a
significant contribution in young
children but declines considerably
in the teenage years being replaced
by a variety of sugar-sweetened
beverages, such as soft drinks, iced
tea, flavoured water, sports drinks
and energy drinks. On average,
sports and energy drinks make up
a small proportion of total sugar-
sweetened beverages consumption
across all age groups of the
population.
Figure 4: Contribution of specific beverages to total sugar-sweetened beverages consumption, by age
Soft drinks and fruit drinks contribute up to 60-75% of the total consumption
of sugar-sweetened beverages for most
age groups.

A SECONDARY ANALYSIS OF THE AUSTRALIAN HEALTH SURVEY: NATIONAL NUTRITION AND PHYSICAL ACTIVITY SURVEY (2011-12) 11
Consumers only: Mean intakes of all beveragesThe mean intake of all beverages
for consumers only was similar to
the mean intake in the population
for non-dairy, non-alcoholic
beverages (Children: 1146mL
population, 1283mL consumers;
Adults: 1392mL population, 1597mL
consumers) because almost
everybody consumed a beverage.
Adult consumers had a higher
intake of beverages than children
and males a higher mean intake
than females.
Adults The mean daily amount consumed
by adult consumers (19+years):
1. Water – mean intake of 1300mL
2. Sugar-sweetened beverages –
584mL
3. Low-kJ beverages – 579mL
4. Fruit juice (no added sugar) –
313mL
Children and Teenagers
The mean daily amount consumed
by children consumers (2-18 years):
1. Water – 971mL
2. Sugar-sweetened beverages –
476mL
3. Low-kJ beverages – 380mL
4. Fruit juice – 302mL
Among consumers, the mean intake
of beverages across gender and age
sub-groups shows water, sugar-
sweetened beverages and low-kJ
beverages tended to increase with
age, peaking in the 19-30 year age
group before declining in later adult
years (Figure 5).
Figure 5: Mean intake (mL) of non-dairy, non-alcoholic beverages at the major level (consumers only), by age group and gender
Among adult consumers, the mean daily volume of sugar-sweetened beverages consumed was similar to low-kJ beverages (~670mL for males and ~485mL for females).
200
400
600
800
1000
1200
1400
1600
1800
SSB: 1.4 cansLow-kJ: 1.3 cans
5.4 glasses
2-3 4-8 9-13 14-18 19-30 31-50 51-70 71+
200
400
600
800
1000
1200
1400
1600
1800
SSB & low-kJ: 2.0 cans
6.7 glasses
2-3 4-8 9-13 14-18 19-30 31-50 51-70 71+
M
ean
inta
ke (m
L) c
onsu
mer
s on
ly
Mea
n in
take
(mL)
con
sum
ers
only
Age group (years)
Age group (years)
Consumption of fruit juice also
increased with age group however
the peak intake among consumers
occurred earlier, in the 14-18 year
age group.
Within the sugar-sweetened
beverage category, both adult and
children consumers reported having
sports drinks in the highest mean
volumes (675mL and 585mL) on the
day of the survey. However, as only
1.2% of adults and 1.5% of children
consumed sports drinks on the day
of the survey, the mean intake for
the overall population was much
lower (~8mL).
Mea
n in
take
(mL)
Age group (years)
Mea
n in
take
(mL)
200
400
600
800
1000
1200
1400
1600
200
400
600
800
1000
1200
1400
1.2 cans
6.1 glasses
0.6 cans
4.9 glasses
2-3 4-8 9-13 14-18 19-30 31-50 51-70 70+ 2-3 4-8 9-13 14-18 19-30 31-50 51-70 70+
Age group (years)
Water Sugar-sweetened beverages
Low-kJ sweetened beverages Fruit juice (no added sugar)
Water Sugar-sweetened beverages
Low-kJ sweetened beverages Fruit juice (no added sugar)

THE ROLE OF BEVERAGES IN THE AUSTRALIAN DIET12
Effect of socio-economic status and remoteness on beverage consumption across the population
Lower socio-economic status is associated with lower consumption of water and fruit juice and higher consumption of sugar-sweetened beverages.
As illustrated in Figure 6, mean
daily sugar-sweetened beverage
consumption decreased in a
stepwise manner with increasing
socio-economic status. That is, the
lower socio-economic households
tended to consume the most sugar-
sweetened beverages. In contrast,
mean fruit juice intake increased
with increasing socio-economic
status. Water consumption
increased with increasing
household income – highest intake
in the fourth quintile of socio-
economic status.
Effect of seasons and day of the week on beverage choice
y Consumption of non-dairy, non-alcoholic beverages was
highest in summer (1504mL) and lowest in winter (1169mL).
Water accounted for most of the difference.
y More adults (35% vs 29%) and children (53% vs 45%)
consumed sugar-sweetened beverages on weekend days
compared to weekdays.
y Adults’ consumption of water (difference: 62mL) and
low-kJ sweetened beverages (difference: 23mL) was lower
on weekend days.
Figure 6: Mean population intake of beverages by socio-economic status
City vs rural livingMean daily intake of sugar-
sweetened beverages was lower,
by around 40mL among those
living in major cities compared to
those in regional centres and more
remote areas. The reverse was true
for fruit juice and low-kJ sweetened
beverages, where people living in
major cities reported slightly higher
intakes (5mL and 6mL respectively)
than those in inner regional or other
regions of Australia.
FIGURE 8
TABLE 1
01
2
3
4
5
6
7
Con
trib
utio
n to
tota
l ene
rgyi
ntak
e (%
)
Age group (years)
Beverage categories
Fruit juiceSugar-sweetened beverages
2-3 4-8 9-13 14-18 19-30 31-50 51-70 71+
1400
FIGURE 6
0
Non-dairy, non-alcoholic
beverages
Fruit juice(no added sugar)
Sugar-sweetened beverages
Low-kJdrinks
Water
200
400
600
800
1000
1200
Mea
n in
take
(mL)
Lowest 20%Second quintileThird quintileFourth quintileHighest quintile
Water
Fruit juice(no added sugar)
Low-kJ Drinks
Sugar-sweetened soft drinks
Fruit drinks
Cordial
Children (2-18 yrs)
92% 86%
25% 19%
23% 15%
17% 8%
10% 5%
6% 11%
Adults (19+ yrs)

A SECONDARY ANALYSIS OF THE AUSTRALIAN HEALTH SURVEY: NATIONAL NUTRITION AND PHYSICAL ACTIVITY SURVEY (2011-12) 13
How have consumption patterns changed over time?Direct comparisons between the Australian Health Survey and the few previous national nutrition surveys are not
straightforward; there are important differences in the population structure, the sampling, data collection and
classification of beverages. Nevertheless, general comparisons of unadjusted estimates can be made between the
2011-12 Australian National Nutrition and Physical Activity Survey (NNPAS) and the 1995 National Nutrition Survey.
Key trends - what’s INCREASED over timeChildren
Water % of children consuming – marginal increase
1995 83%-88%*
2011-12 88%-95%
Adults
Water% of adults consuming
– marginal increase Mean intakes
– substantial increase
1995 80% 852mL
2011-12 86% 1123mL
*Range, as data reported for specific age groups
Key trends - what’s DECREASED over timeChildren
Soft drinks/ flavoured waters
% of children consuming – appreciable decrease
Mean intakes – appreciable decrease
1995 26%-58%* 58-417.5mL*
2011-12 6%-45%* 12-242.5mL*
Fruit and vegetable juices/drinks
% of children consuming – appreciable decrease
Mean intakes – appreciable decrease
1995 55%-81.5%* 278mL-313mL*
2011-12 35%-44%* 114mL-138.5mL*
Adults
Soft drinks/ flavoured waters
% of adults consuming – small decrease
Mean intakes – small decrease
1995 31% 180mL
2011-12 29% 160mL
Fruit and vegetable juices/drinks
% of adults consuming – appreciable decrease
Decrease consistent with % adults consuming
1995 36% 124mL
2011-12 24% 85mL
*Range, as data reported for specific age groups Note: To compare beverage intakes with the 1995 National Nutrition Survey, fruit and vegetable juices/drinks were combined together as a category (which is different from the rest of the Report which separates out fruit juice from fruit drinks and excludes vegetable juices/drinks). In 1995, cordial was included in the fruit and vegetable juices/drinks but was reported as a separate category in 2011/12. This change in categorisation is likely to account for some, but not all of the apparent decrease in fruit and vegetable juices/drinks intake.
New drinksSports drinks and energy drinks emerged as separate categories in the
recent surveys (2007, 2011–12) though intake remains low – less than
one percent of total beverage consumption, across the population.
THE ROLE OF BEVERAGES IN THE AUSTRALIAN DIET14
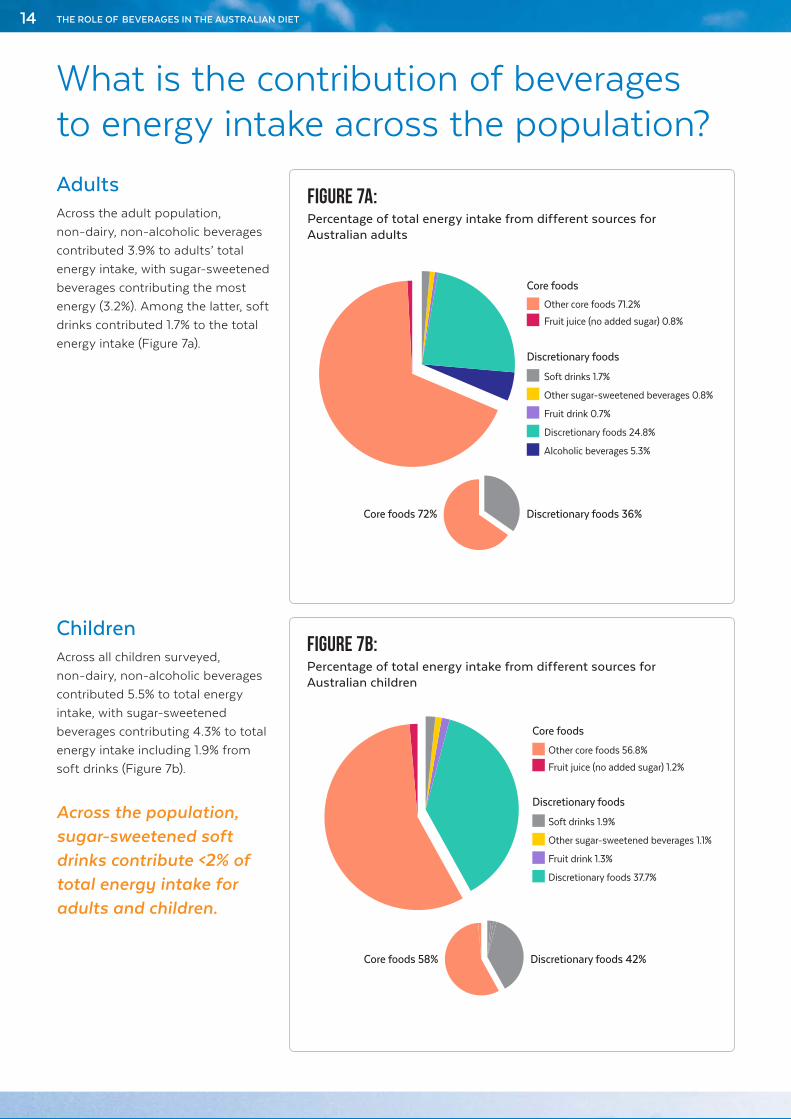
AdultsAcross the adult population,
non-dairy, non-alcoholic beverages
contributed 3.9% to adults’ total
energy intake, with sugar-sweetened
beverages contributing the most
energy (3.2%). Among the latter, soft
drinks contributed 1.7% to the total
energy intake (Figure 7a).
ChildrenAcross all children surveyed,
non-dairy, non-alcoholic beverages
contributed 5.5% to total energy
intake, with sugar-sweetened
beverages contributing 4.3% to total
energy intake including 1.9% from
soft drinks (Figure 7b).
What is the contribution of beverages to energy intake across the population?
Across the population, sugar-sweetened soft drinks contribute <2% of total energy intake for adults and children.
Figure 7A: Percentage of total energy intake from different sources for Australian adults
Discretionary foods 36%Core foods 72%
Discretionary foods 42%Core foods 58%
Other core foods 71.2%
Fruit juice (no added sugar) 0.8%
Core foods
Core foods
Discretionary foods
Discretionary foods
Soft drinks 1.7%
Other sugar-sweetened beverages 0.8%
Fruit drink 0.7%
Discretionary foods 24.8%
Alcoholic beverages 5.3%
Other core foods 56.8%
Fruit juice (no added sugar) 1.2%
Soft drinks 1.9%
Other sugar-sweetened beverages 1.1%
Fruit drink 1.3%
Discretionary foods 37.7%
Figure 7B: Percentage of total energy intake from different sources for Australian children
Discretionary foods 36%Core foods 72%
Discretionary foods 42%Core foods 58%
Other core foods 71.2%
Fruit juice (no added sugar) 0.8%
Core foods
Core foods
Discretionary foods
Discretionary foods
Soft drinks 1.7%
Other sugar-sweetened beverages 0.8%
Fruit drink 0.7%
Discretionary foods 24.8%
Alcoholic beverages 5.3%
Other core foods 56.8%
Fruit juice (no added sugar) 1.2%
Soft drinks 1.9%
Other sugar-sweetened beverages 1.1%
Fruit drink 1.3%
Discretionary foods 37.7%

A SECONDARY ANALYSIS OF THE AUSTRALIAN HEALTH SURVEY: NATIONAL NUTRITION AND PHYSICAL ACTIVITY SURVEY (2011-12) 15
Contribution of beverages to energy intake by life-stageAdolescentsContribution of non-dairy, non-
alcoholic beverages to total energy
intake was highest in 14–18 year olds
– 8.2% in males and 5.7% in females.
This was largely attributable to a
peak in the consumption of sugar-
sweetened soft drinks.
Children and adultsIn contrast, the contribution of
fruit juice (with no added sugar) to
energy intake generally falls across
the childhood and adult years.
Fruit juice contributes less than 1%
of total energy on average to the
Australian population.
Older adultsThe lowest contributions to total
energy intake from sugar-sweetened
beverages were in the two oldest
age brackets, 51-70 years and 71+
(1.9% and 1.6% respectively).
Figure 8: Contribution of sugar-sweetened beverages and fruit juice (with no added sugar) to total energy intake by age group
0
1
2
3
4
5
6
7
Con
trib
utio
n to
tota
l ene
rgyi
ntak
e (%
)
Age group (years)
Fruit juice
Sugar-sweetened beverages
2-3 4-8 9-13 14-18 19-30 31-50 51-70 71+
THE ROLE OF BEVERAGES IN THE AUSTRALIAN DIET16
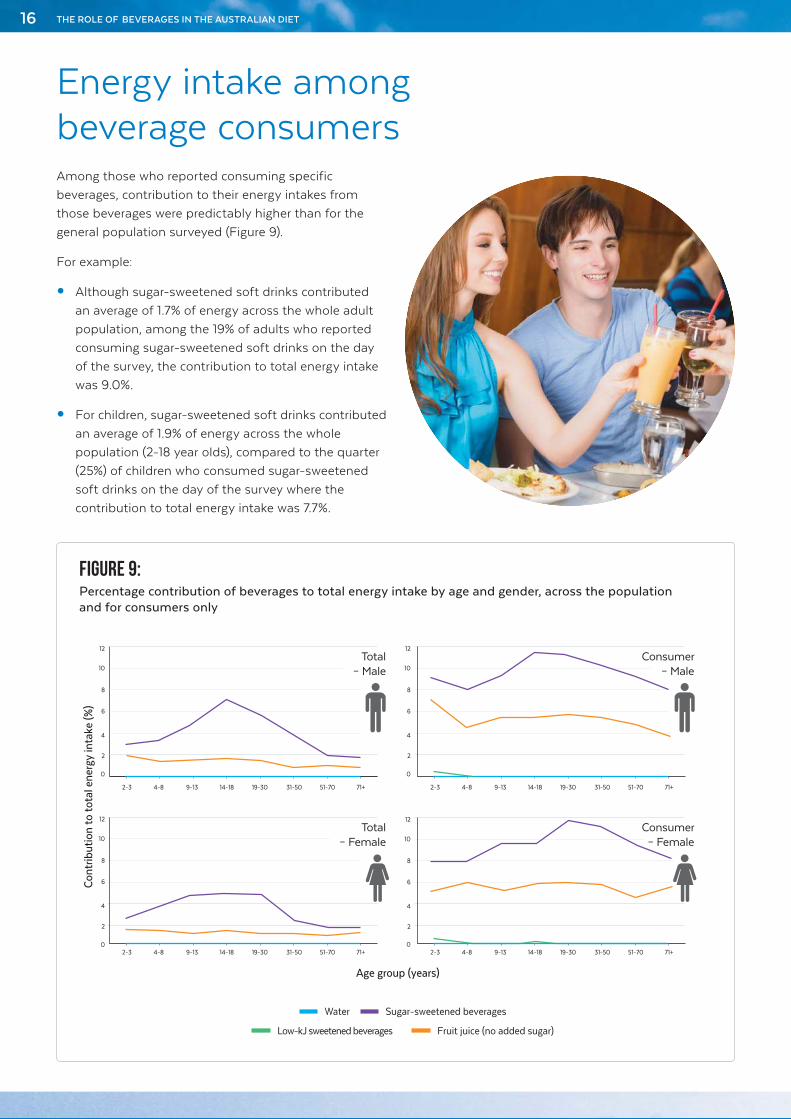
Energy intake among beverage consumersAmong those who reported consuming specific
beverages, contribution to their energy intakes from
those beverages were predictably higher than for the
general population surveyed (Figure 9).
For example:
y Although sugar-sweetened soft drinks contributed
an average of 1.7% of energy across the whole adult
population, among the 19% of adults who reported
consuming sugar-sweetened soft drinks on the day
of the survey, the contribution to total energy intake
was 9.0%.
y For children, sugar-sweetened soft drinks contributed
an average of 1.9% of energy across the whole
population (2-18 year olds), compared to the quarter
(25%) of children who consumed sugar-sweetened
soft drinks on the day of the survey where the
contribution to total energy intake was 7.7%.
FIGURE 5
200
400
600
800
1000
1200
1400
1600
1800
SSB: 1.4 cansLow-kJ: 1.3 cans
5.4 glasses
2-3 4-8 9-13 14-18 19-30 31-50 51-70 71+
WaterSugar-sweetened beveragesLow-kJ sweetened beveragesFruit juice (no added sugar)
200
400
600
800
1000
1200
1400
1600
1800
SSB & low-kJ: 2.0 cans
6.7 glasses
2-3 4-8 9-13 14-18 19-30 31-50 51-70 71+
M
ean
inta
ke (m
Ls) c
onsu
mer
s on
ly
Mea
n in
take
(mLs
) con
sum
ers
only
Age group (years) Age group (years)
FIGURE 9
0
2-3 4-8 9-13 14-18 19-30 31-50 51-70 71+
2
4
6
8
10
12
0
2
4
6
8
10
12
0
2
4
6
8
10
12
2-3 4-8 9-13 14-18 19-30 31-50 51-70 71+
Con
trib
utio
n to
tota
l ene
rgy
inta
ke (%
)
2-3 4-8 9-13 14-18 19-30 31-50 51-70 71+
2
0
4
6
8
10
12
2-3 4-8 9-13 14-18 19-30 31-50 51-70 71+
Age group (years)
Total– Male
Consumer– Male
Consumer– Female
Total– Female
Figure 9: Percentage contribution of beverages to total energy intake by age and gender, across the population and for consumers only
Mea
n in
take
(mL)
Age group (years)
Mea
n in
take
(mL)
200
400
600
800
1000
1200
1400
1600
200
400
600
800
1000
1200
1400
1.2 cans
6.1 glasses
0.6 cans
4.9 glasses
2-3 4-8 9-13 14-18 19-30 31-50 51-70 70+ 2-3 4-8 9-13 14-18 19-30 31-50 51-70 70+
Age group (years)
Water Sugar-sweetened beverages
Low-kJ sweetened beverages Fruit juice (no added sugar)
Water Sugar-sweetened beverages
Low-kJ sweetened beverages Fruit juice (no added sugar)

A SECONDARY ANALYSIS OF THE AUSTRALIAN HEALTH SURVEY: NATIONAL NUTRITION AND PHYSICAL ACTIVITY SURVEY (2011-12) 17
The contribution of beverages to discretionary choicesThere is a key public health focus on discretionary
choices as this group of foods and drinks contribute
significantly to Australians’ total energy intake – 36%
of kilojoules in adults (19+ years) and 42% in children
(2-18 years). Generally, this percentage is higher in males
than females.
The Australian Bureau of Statistics segmented
non-alcoholic, non-dairy beverages into 2 categories1:
y Discretionary beverages: The majority of beverages
e.g. soft drink, fruit juice drink, sports and energy
drinks and flavoured water.
y Non-discretionary beverages: Fruit juice (with no
added sugar) and water.
Discretionary foods contributed a large proportion of total energy intake in adults (36%) and children (42%).
What are “discretionary choices”?The Australian Dietary Guidelines describe discretionary foods as:
Foods and drinks not necessary to provide the nutrients the
body needs, but that may add variety. Discretionary choices are
high in kilojoules, saturated fats, added sugars and/or salt or
alcohol. They can be included sometimes in small amounts by
those who are physically active, but are not a necessary part of
the diet2.
Discretionary choices include: most sweet biscuits, cakes, desserts and pastries; processed meats and
sausages; ice-cream and other ice confections; confectionary and chocolate; savoury pastries and pies;
commercial burgers; commercially fried foods; potato chips, crisps and other fatty and/or salty snack foods;
cream, butter and spreads which are high in saturated fats; sugar-sweetened soft drinks and cordials, sports
and energy drinks and alcoholic drinks2.

THE ROLE OF BEVERAGES IN THE AUSTRALIAN DIET18
What are the largest contributors to total energy from discretionary choices for adults?This section explores the energy
contribution of specific discretionary
foods and beverages (based on
ABS categorisation) to the total
discretionary food energy intake.
This is not the same as assessing
the percentage contribution of
these foods to the total energy
intake of the whole diet (which
includes both Core Foods and
Discretionary Foods).
Discretionary foods were categorised
into commonly consumed groups
consistent with the ABS hierarchy of
food classification (generally at the
3-digit level), except for the sugar-
sweetened beverages which were
separated into the beverage types
described throughout this report.
The foods contributing the most to total energy intake from the discretionary food group were confectionery & chocolates, followed by sweet biscuits & cakes and alcohol in adults.
Figure 10: Contribution of specific discretionary food categories to the total discretionary food energy intake in adults
Confectionery & chocolates 17%
Sweet biscuits & cakes 16%
Fried potatoes & crisps 11%
Burgers/pizzas/tacos 10%
Savoury biscuits 6%
Sweet & savoury pies & pastries 5%
Soft drinks 4%
Fruit drink 3%
Other beverages 3%
Other discretionary foods 25%
Confectionery & chocolates 18%
Sweet biscuits & cakes 13%
Alcoholic beverages 13%
Burgers/pizzas/tacos 7%
Sweet & savoury pies & pastries 6%
Fried potatoes & crisps 5%
Soft drinks 4%
Other beverages 4%
Savoury biscuits 3%
Other discretionary foods 27%
4%
4%4%
3%3%
3%
10%
7%
6%
6%
5%
5%
11%
13%
16%
13%
17%
18%
25%
27%
Adults1. Confectionery & chocolates (18%)
2. Sweet biscuits & cakes (13%)
3. Alcoholic beverages (13%)
4. Burgers/pizzas/tacos (7%)
5. Sweet & savoury pies
& pastries (6%)
6. Fried potatoes & crisps (5%)
7. Soft drinks (4%)
8. Other beverages (4%)

A SECONDARY ANALYSIS OF THE AUSTRALIAN HEALTH SURVEY: NATIONAL NUTRITION AND PHYSICAL ACTIVITY SURVEY (2011-12) 19
What are the largest contributors to total energy from discretionary choices for children?
Children 1. Confectionery & chocolates (17%)
2. Sweet biscuits & cakes (16%)
3. Fried potatoes & crisps (11%)
4. Burgers/pizzas/tacos (10%)
5. Savoury biscuits (6%)
6. Sweet & savoury pies
& pastries (5%)
7. Soft drinks (4%)
8. Fruit drink (3%)
The foods contributing the most to total energy intake from the discretionary food group were confectionery & chocolates, followed by sweet biscuits & cakes and fried potatoes & crisps in children.
Confectionery & chocolates 17%
Sweet biscuits & cakes 16%
Fried potatoes & crisps 11%
Burgers/pizzas/tacos 10%
Savoury biscuits 6%
Sweet & savoury pies & pastries 5%
Soft drinks 4%
Fruit drink 3%
Other beverages 3%
Other discretionary foods 25%
Confectionery & chocolates 18%
Sweet biscuits & cakes 13%
Alcoholic beverages 13%
Burgers/pizzas/tacos 7%
Sweet & savoury pies & pastries 6%
Fried potatoes & crisps 5%
Soft drinks 4%
Other beverages 4%
Savoury biscuits 3%
Other discretionary foods 27%
4%
4%4%
3%3%
3%
10%
7%
6%
6%
5%
5%
11%
13%
16%
13%
17%
18%
25%
27%
Figure 11: Contribution of specific discretionary food categories to the total discretionary food energy intake in children
Food and beverage choices by genderThere were some noteworthy
differences by gender. For example,
females aged 14–18 years tended
to consume a greater percentage of
energy from sweet biscuits & cakes
and confectionery & chocolates
(12% and 9% of energy) compared
to males of the same age group
who consumed more energy from
burgers/pizzas/tacos and soft
drinks (14.7% and 9.3%).

THE ROLE OF BEVERAGES IN THE AUSTRALIAN DIET20
Figure 12: Contributions of sugar-sweetened and alcoholic beverages to total energy intakes across the population, by age2
7%
4%
4%
6%
5%
7%13%
18%
13%
3%
ADULTS (FIGURE 10)
CHILDREN (FIGURE 11)
FIGURE 12
6%
3%
17%
16%
3%
10%11%
5%4%
6%
3%
25%
Confectionery & Chocolates 18%
Sweet Biscuits 13%
Alcoholic Beverages 13%
Burgers/Pizzas/Tacos 7%
Fried Potatoes & Crisps 5%
Pastries 6%
Soft drinks 4%
Missing Slice 3%
Other Beverages 4%
Missing Slice 7%
Confectionery & Chocolates 17%
Sweet Biscuits 16%
Alcohilic Beverages 11%
Burgers/Pizzas/Tacos 10%
Fried Potatoes & Crisps 6%
Pastries 5%
Soft drinks 4%
Missing Slice 3%
Missing Slice 16%
Missing Slice 17%
02-3 4-8 9-13 14-18 19-30 31-50 51-70 71+
1
2
3
4
5
6
7
Con
trib
utio
n to
to
tal e
nerg
y in
take
(%)
Age group (years)
Discretionary beverages by life stageSugar-sweetened beverages and
alcoholic drinks are categorised
as discretionary beverage choices.
Figure 12 shows the individual
contributions of sugar-sweetened
and alcoholic beverages2 to total
energy intakes across the population
in all age groups.
Children and adolescentsAs would be expected, across
the population, sugar-sweetened
beverages are preferred by children
with peak contribution to total
energy (5.7%) occurring in the
14–18 year age group.
AdultsAlcoholic beverages are preferred
by the adult population, with
peak contribution to total energy
(6.6%) occurring in the 51–70 year
age group.
Among discretionary beverages, alcoholic beverages were the highest contributor to total energy intake across the adult population: 5.3% followed by 1.7% contributed by soft drinks.

A SECONDARY ANALYSIS OF THE AUSTRALIAN HEALTH SURVEY: NATIONAL NUTRITION AND PHYSICAL ACTIVITY SURVEY (2011-12) 21
Beverages and weight statusAs the Australian Health Survey
was cross-sectional in design, any
association between beverage
consumption and weight status
needs to be interpreted cautiously.
It is not clear whether consumption
is a result of weight status, occurred
prior to achieving weight status
and is a cause of it, or is causally
unrelated to weight status. As with
all cross-sectional studies, the
associations cannot be assigned
as cause and effect.
Across the population, total
consumption of non-dairy, non-
alcoholic beverages in adults was
consistent across all weight status
groups, with an average of about
1400mL consumed on the day of
the survey. The majority of this
was water (around 1.1L) which was
consumed consistently across
weight status groups. In male
children, water consumption
increased slightly with weight
status though the pattern for
female children was less clear.
Sugar-sweetened beveragesAdults
In adults, there was no association
between the proportion that
consumed sugar-sweetened
beverages and weight status, and
the highest prevalence occurred in
the underweight category. However,
gender differences were evident.
Total consumption of sugar-
sweetened beverages reflected the
prevalence data and was highest
in underweight adults (Figure 14).
Note that the number of subjects
in the survey who were underweight
was 35 for men and 81 for women.
Similar mean daily intakes were
reported for normal, overweight
and obese adults.
FIGURE 14
FIGURE 13
Underweight
57%
Normal weight
40%
Overweight
35%
Obese
34%
Underweight
29%
Normal weight
24%
Overweight
25%
Obese
27%
0
Fruit juice Sugar-sweetenedbeverages
Low-kJ sweetenedbeverages
Fruit juice Sugar-sweetenedbeverages
Low-kJ sweetenedbeverages
50
100
150
200
250
300
350
350
Mea
n in
take
(mL)
Mea
n in
take
(mL)
FIGURE 15
0
50
100
150
200
250
300
Underweight
Normal weight
Overweight
Obese
Underweight
Normal weight
Overweight
Obese
Figure 13: Percentage of Australian adults reporting consumption of sugar-sweetened beverages on the day of the survey
FIGURE 14
FIGURE 13
Underweight
57%
Normal weight
40%
Overweight
35%
Obese
34%
Underweight
29%
Normal weight
24%
Overweight
25%
Obese
27%
0
Fruit juice Sugar-sweetenedbeverages
Low-kJ sweetenedbeverages
Fruit juice Sugar-sweetenedbeverages
Low-kJ sweetenedbeverages
50
100
150
200
250
300
350
350
Mea
n in
take
(mL)
Mea
n in
take
(mL)
FIGURE 15
0
50
100
150
200
250
300
Underweight
Normal weight
Overweight
Obese
Underweight
Normal weight
Overweight
Obese
Figure 14: Mean daily consumption of beverages for adults by weight status

THE ROLE OF BEVERAGES IN THE AUSTRALIAN DIET22
Sugar-sweetened beveragesChildren
In girls, both the proportion
who consumed and the total
consumption of sugar-sweetened
beverages showed a clear stepwise
increase with increasing weight
status (Figure 15). However, neither
association was evident in boys.
Fruit juiceThe percentage of women and the
percentage of men consuming fruit
juice on the day of the survey was
about the same for each category
of weight status. There was also no
statistical evidence to support a
difference in prevalence of fruit juice
consumption across weight status
categories in children, either male
or female.
The mean total daily intake of fruit
juice did not differ by weight status
category for children or adults.
Low-kJ sweetened beveragesThe proportion of the adult
population that reported consuming
low-kJ sweetened beverages
increased with increasing weight
status. The trends were similar in
both genders.
There was a stepwise increase
in total consumption of low-
kJ sweetened beverages with
increasing weight status in adults
(Figure 14).
The percentage of male children
consuming low-kJ sweetened
beverages increased with increasing
weight status but this was not
evident in girls.
Beverages and weight status
TABLE 4 (OPTION A)
TABLE 4 (OPTION B)
TABLE 5
FIGURE 17
Underweight
UNDERWEIGHT
3%
Normal weight
7%
Overweight
11%
Obese
17%
3%
CARBOHYDRATES
CHILDREN (2-18 YRS)
ADULTS (19+ YRS)
TOTAL SUGARS
NORMAL WEIGHT
7%
OVERWEIGHT
11%
OBESE
17%
Sugar Sweetended Beverages (SSBs)
(Including Soft Drinks)
5.9%
Fruit Juice(With No
Added Sugar)
2.2%
Sugar Sweetended Beverages (SSBs)
(Including Soft Drinks)
5.2%
Fruit Juice(With No
Added Sugar)
1.5%
Sugar Sweetended Beverages (SSBs)
(Including Soft Drinks)
5.2%
Fruit Juice(With No
Added Sugar)
1.5%
Sugar Sweetended Beverages (SSBs)
(Including Soft Drinks)
16.5%
Fruit Juice(With No
Added Sugar)
4.6%
0
2-3 4-8 9-13 14-18 19-30 31-50 51-70 71+
10
20
30
40
0
2-3 4-8 9-13 14-18 19-30 31-50 51-70 71+
10
20
30
40
Con
trib
utio
n to
sug
ars
inta
ke (%
)
0
2-3 4-8 9-13 14-18 19-30 31-50 51-70 71+
10
20
30
40
0
2-3 4-8 9-13 14-18 19-30 31-50 51-70 71+
10
20
30
40
Age group (years)
Total– Male
Consumer– Male
Consumer– Female
Total– Female
Figure 16: Percentage of Australian adults reporting consumption of low-kJ sweetened beverages on survey day
FIGURE 14
FIGURE 13
Underweight
57%
Normal weight
40%
Overweight
35%
Obese
34%
Underweight
29%
Normal weight
24%
Overweight
25%
Obese
27%
0
Fruit juice Sugar-sweetenedbeverages
Low-kJ sweetenedbeverages
Fruit juice Sugar-sweetenedbeverages
Low-kJ sweetenedbeverages
50
100
150
200
250
300
350
350
Mea
n in
take
(mL)
Mea
n in
take
(mL)
FIGURE 15
0
50
100
150
200
250
300
Underweight
Normal weight
Overweight
Obese
Underweight
Normal weight
Overweight
Obese
Figure 15: Mean daily consumption of beverages in female children by weight status, across the population

A SECONDARY ANALYSIS OF THE AUSTRALIAN HEALTH SURVEY: NATIONAL NUTRITION AND PHYSICAL ACTIVITY SURVEY (2011-12) 23
Carbohydrate and total sugars Across the whole population, non-
dairy, non-alcoholic beverages
contributed 9% to total carbohydrate
intake. This was higher in children
(11%) compared to adults (8%).
The contribution of beverages across
the population, to total sugars
intake was 21% in children and 16%
in adults. Across the population
as a whole this equated to almost
17%, the greatest contributors to
total sugars intake being soft drinks
(7.2%), fruit juice (3.5%), fruit drink
(3.1%) and cordial (1.9%).
The variation in the contribution of
beverages to total carbohydrate and
sugars intake by age and gender
followed a similar pattern to the
contribution of beverages to total
energy intake, with sugar-sweetened
beverages peaking in the 14–18 year
age group.
Contribution of beverages to key nutrients
Children (2-18 years)
Adults (19+ years)
Carbohydrates Total sugars
Carbohydrates Total sugars
Sugar-sweetened beverages
(including soft drinks)
5.9%
Fruit juice(with no
added sugar)
2.2%
5.2%
Sugar-sweetened beverages
(including soft drinks)
1.5%
Fruit juice(with no
added sugar)
12.7%
Sugar-sweetened beverages
(including soft drinks)
3.1%
Fruit juice(with no
added sugar)
Sugar-sweetened beverages
(including soft drinks)
16.5%
Fruit juice(with no
added sugar)
4.6%
TABLE 3: Contribution of beverages to carbohydrate and sugars intake by most common beverage type across the total population
Across the Australian population, sugar-sweetened beverages contributed 17% of the total sugar intake.
THE ROLE OF BEVERAGES IN THE AUSTRALIAN DIET24
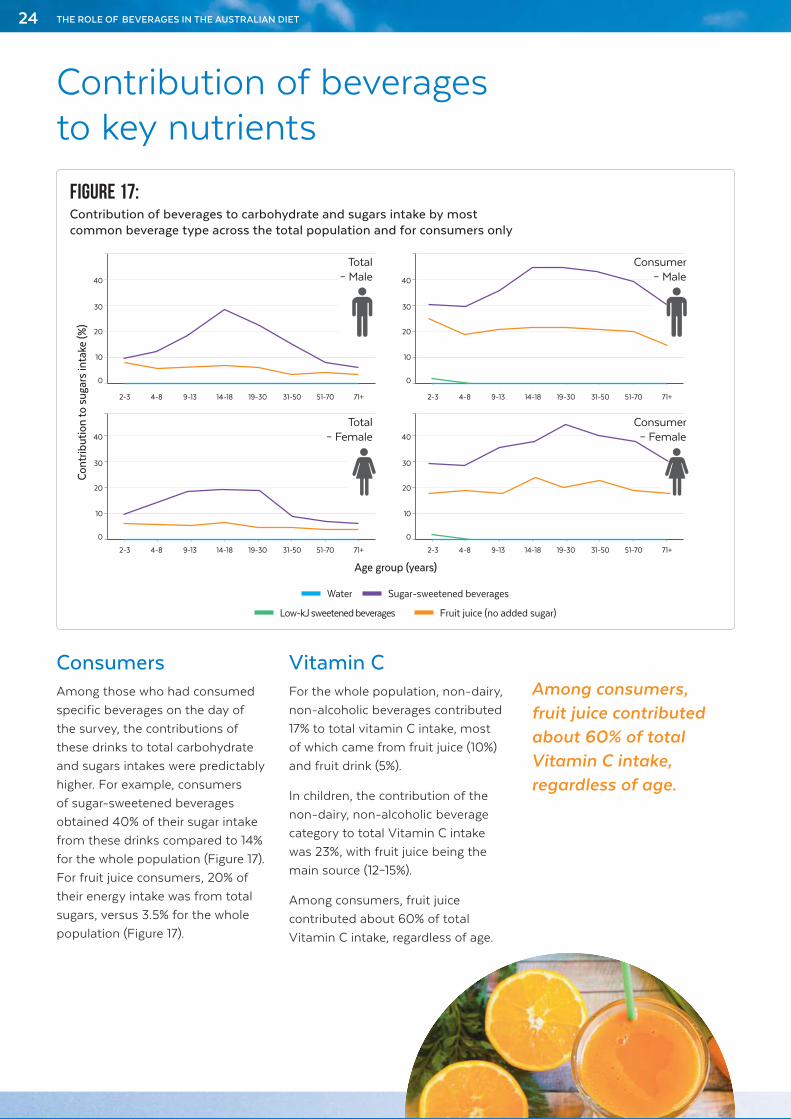
Vitamin CFor the whole population, non-dairy,
non-alcoholic beverages contributed
17% to total vitamin C intake, most
of which came from fruit juice (10%)
and fruit drink (5%).
In children, the contribution of the
non-dairy, non-alcoholic beverage
category to total Vitamin C intake
was 23%, with fruit juice being the
main source (12–15%).
Among consumers, fruit juice
contributed about 60% of total
Vitamin C intake, regardless of age.
Among consumers, fruit juice contributed about 60% of total Vitamin C intake, regardless of age.
ConsumersAmong those who had consumed
specific beverages on the day of
the survey, the contributions of
these drinks to total carbohydrate
and sugars intakes were predictably
higher. For example, consumers
of sugar-sweetened beverages
obtained 40% of their sugar intake
from these drinks compared to 14%
for the whole population (Figure 17).
For fruit juice consumers, 20% of
their energy intake was from total
sugars, versus 3.5% for the whole
population (Figure 17).
Contribution of beverages to key nutrients
TABLE 4 (OPTION A)
TABLE 4 (OPTION B)
TABLE 5
FIGURE 17
Underweight
UNDERWEIGHT
3%
Normal weight
7%
Overweight
11%
Obese
17%
3%
CARBOHYDRATES
CHILDREN (2-18 YRS)
ADULTS (19+ YRS)
TOTAL SUGARS
NORMAL WEIGHT
7%
OVERWEIGHT
11%
OBESE
17%
Sugar Sweetended Beverages (SSBs)
(Including Soft Drinks)
5.9%
Fruit Juice(With No
Added Sugar)
2.2%
Sugar Sweetended Beverages (SSBs)
(Including Soft Drinks)
5.2%
Fruit Juice(With No
Added Sugar)
1.5%
Sugar Sweetended Beverages (SSBs)
(Including Soft Drinks)
5.2%
Fruit Juice(With No
Added Sugar)
1.5%
Sugar Sweetended Beverages (SSBs)
(Including Soft Drinks)
16.5%
Fruit Juice(With No
Added Sugar)
4.6%
0
2-3 4-8 9-13 14-18 19-30 31-50 51-70 71+
10
20
30
40
0
2-3 4-8 9-13 14-18 19-30 31-50 51-70 71+
10
20
30
40
Con
trib
utio
n to
sug
ars
inta
ke (%
)
0
2-3 4-8 9-13 14-18 19-30 31-50 51-70 71+
10
20
30
40
0
2-3 4-8 9-13 14-18 19-30 31-50 51-70 71+
10
20
30
40
Age group (years)
Total– Male
Consumer– Male
Consumer– Female
Total– Female
figure 17: Contribution of beverages to carbohydrate and sugars intake by most common beverage type across the total population and for consumers only
Mea
n in
take
(mL)
Age group (years)
Mea
n in
take
(mL)
200
400
600
800
1000
1200
1400
1600
200
400
600
800
1000
1200
1400
1.2 cans
6.1 glasses
0.6 cans
4.9 glasses
2-3 4-8 9-13 14-18 19-30 31-50 51-70 70+ 2-3 4-8 9-13 14-18 19-30 31-50 51-70 70+
Age group (years)
Water Sugar-sweetened beverages
Low-kJ sweetened beverages Fruit juice (no added sugar)
Water Sugar-sweetened beverages
Low-kJ sweetened beverages Fruit juice (no added sugar)

A SECONDARY ANALYSIS OF THE AUSTRALIAN HEALTH SURVEY: NATIONAL NUTRITION AND PHYSICAL ACTIVITY SURVEY (2011-12) 25
Across the population, energy drinks contributed 1% and 3% of the total caffeine intake for 14–18 year olds and 19–30 year olds, respectively.
Con
trib
utio
n to
tota
l ca
ffei
ne in
take
(%)
Age group (years)
FIGURE 16
0
2-3 4-8 9-13 14-18 19-30 31-50 51-70 71+
2
46
81012
1416
1820
Soft drinks
Diet soft drinksEnergy drinks
FIGURE 17
0
Non-dairy, non-alcoholic
beverages
Fruit juice Sugar-sweetened beverages
Unsweetenedwater
200
400
600
800
1000
1200
1400
Mea
n in
take
(ms)
Beverage category
1600LowMediumHigh
Discretionary foods 36%Core foods 72% Discretionary foods 42%Core foods 58%
Other core foods 71.2% Fruit juice (no added sugar) 0.8%
Core foods Core foods
Discretionary foods Discretionary foodsSoft drinks 1.7%
Other sugar-sweetened beverages 0.8%
Fruit drink 0.7%
Discretionary foods 24.8%
Alcoholic beverages 5.3%
Other core foods 56.8%Fruit juice (no added sugar) 1.2%
Soft drinks 1.9%
Other sugar-sweetened beverages 1.1%
Fruit drink 1.3%
Discretionary foods 37.7%
Figure 18: Contribution of beverages to total caffeine intake (as a mean percentage of total intake) by age group, across the population
CaffeineAcross the total adult population,
non-dairy, non-alcoholic beverages
contributed 10% of the total caffeine
intake, the major contributors being
sugar-sweetened soft drinks (5%)
and low-kJ sweetened drinks (4%).
Sugar-sweetened soft drinks
and low-kJ sweetened drinks
contributed about 10% and 2%,
respectively, to children’s total
caffeine intake. The 14–18 year old
age group had the highest caffeine
intake from non-alcoholic, non-
dairy beverages (22% of the total)
largely driven by the high soft
drink consumption of this group
(Figure 18).
Energy drinks contributed less than
1% to total caffeine intake in all age
groups except 14–18 and 19–30 year
olds, where they contributed 1% and
3% respectively. Other age groups
were getting almost all their caffeine
from other foods or beverages not
included in this analysis.
Among those who consumed
sugar-sweetened beverages, the
contribution of this beverage group
to total caffeine intake was 23%
in children and 20% in adults.
The contribution was highest
among 9-13, 14-18 and 19-30 year
age groups. Among those who
consumed low kJ beverages, these
contributed 39% of the total caffeine
intake in children and 36% in adults.
Contribution of beverages to caffeine intake

THE ROLE OF BEVERAGES IN THE AUSTRALIAN DIET26
In general, consumers of sugar-sweetened beverages reported a dietary pattern that was higher in discretionary foods (not including beverages) and lower in vegetables than non-consumers of these beverages.
Adults and children with the least healthy lifestyle pattern consumed 4–6 times more sugar-sweetened beverages than those with the most healthy lifestyle pattern.
Diet quality The secondary analysis considered associations between beverage consumption and diet quality, which was measured using a composite index to estimate individuals’ compliance with the Australian Dietary Guidelines in their entirety4.
In adults, there was a stepwise increase in total consumption of non-dairy, non-alcoholic beverages with increasing diet quality, due primarily to water consumption which forms part of the diet quality index (Figure 17). Conversely, sugar-sweetened beverage consumption decreased with increasing diet quality – sugar-sweetened beverages were also an element of the diet quality index. Adults with dietary intake falling in the lowest tertile of diet quality consumed about five times as much sugar-sweetened beverages as those with dietary intake falling in the highest tertile of diet quality (Figure 17). These opposing trends were also observed in children.
Adults who consumed fruit juice on the day of the survey, reported a lower mean percentage of energy from discretionary foods (33.3%) and a higher mean diet quality score (48.1 of a possible 100), than non-consumers of fruit juice (36.3% energy from discretionary foods and
42.6 mean dietary quality score).
Beverages, diet quality, activity and lifestyle pattern
Physical activity and sedentary behaviourAdults reporting low levels of
physical activity in the survey had
the lowest intakes of non-dairy,
non-alcoholic beverages. This was
due almost entirely to differences in
water intake as intakes of fruit juice,
sugar-sweetened beverages and
low-kJ sweetened beverages did not
differ greatly with physical activity.
There were similar findings in
children. Water consumption
increased in a stepwise manner
with the level of physical activity in
all age groups of children, except
for 14–18 year olds. In this age
group, sugar-sweetened beverage
consumption increased by level of
physical activity.
Sugar-sweetened beverage intake
also increased with degree of
sedentary behaviour in children.
Con
trib
utio
n to
tota
l ca
ffei
ne in
take
(%)
Age group (years)
FIGURE 16
0
2-3 4-8 9-13 14-18 19-30 31-50 51-70 71+
2
46
81012
1416
1820
Soft drinks
Diet soft drinksEnergy drinks
FIGURE 17
0
Non-dairy, non-alcoholic
beverages
Fruit juice Sugar-sweetened beverages
Unsweetenedwater
200
400
600
800
1000
1200
1400
Mea
n in
take
(ms)
Beverage category
1600LowMediumHigh
Discretionary foods 36%Core foods 72% Discretionary foods 42%Core foods 58%
Other core foods 71.2% Fruit juice (no added sugar) 0.8%
Core foods Core foods
Discretionary foods Discretionary foodsSoft drinks 1.7%
Other sugar-sweetened beverages 0.8%
Fruit drink 0.7%
Discretionary foods 24.8%
Alcoholic beverages 5.3%
Other core foods 56.8%Fruit juice (no added sugar) 1.2%
Soft drinks 1.9%
Other sugar-sweetened beverages 1.1%
Fruit drink 1.3%
Discretionary foods 37.7%
Figure 17: Mean beverage consumption by diet quality tertile in adults
This difference was particularly
pronounced in 14–18 year olds;
those who were most sedentary
consumed about 1.5 times as much
sugar-sweetened beverages as
those who were least sedentary.
Lifestyle patternSugar-sweetened beverage intake
was strongly associated with
‘lifestyle pattern’ which considered
dietary quality and physical activity
or sedentary behaviour.

A SECONDARY ANALYSIS OF THE AUSTRALIAN HEALTH SURVEY: NATIONAL NUTRITION AND PHYSICAL ACTIVITY SURVEY (2011-12) 27
This secondary analysis of the Australian Health
Survey provides a valuable insight into the role
of beverages in the diets of Australian adults and
children. Since the last adult national nutrition survey,
conducted in 1995, the food supply has changed
greatly to meet changing consumer needs. How these
changes in the food supply have impacted beverage
consumption behaviour over time was an important
part of the research.
Water remains the drink of choice across the
population, being the most commonly consumed
beverage by adults (86%) and children (92%) on the day
of the survey. This finding was consistent with that of
the secondary analysis of the 2007 Australian National
Children’s Nutrition and Physical Activity Survey5.
One of the most interesting aspects of this research
was the insight into how beverage choice evolves
with age. Fruit juice, fruit drink and cordial are most
commonly consumed by young children, though
this steadily decreases with age as sugar-sweetened
soft drinks become the beverage of choice among
adolescents, especially males. Consumption of these
beverages peaks in the 14–18 year old age bracket
and then gradually declines in early adulthood. By
comparison, consumption of low kJ drinks peaks in the
31-50 year age group before declining in older adults.
Beverage choice has also been changing over time
as indicated by some notable shifts in consumption
between the national dietary surveys. Among children,
both the percentage consuming sugar-sweetened
beverages and the mean intake of these drinks have
fallen since 1995. This is consistent with findings that
the mean energy contribution from sugar-sweetened
beverages dropped by more than two percent of
total energy across the population between the 1995
and 2007 national surveys6. This finding is further
supported through evidence of falling sales of sugar-
sweetened soft drinks over the same period7.
From a public health perspective, the marked increase
in alcohol consumption that occurs in the late teenage
years and early adulthood is noteworthy. The overall
impact of the uptake of alcoholic beverages is an
increase in total discretionary beverage consumption,
which peaks quite late in adulthood (51-70 years)
at over eight percent of overall dietary energy.
This highlights the need for public health messages
related to different beverages to be targeted at
different age groups.
Australian Beverages Council perspectiveMore generally, the high contribution of discretionary
foods and drinks to the energy intake of Australians –
36% in adults and 42% in children - is a major public
health challenge. Key targets within the discretionary
foods category contributing most to energy intake
include confectionary and chocolates, sweet biscuits
and cakes, alcoholic beverages (in adults) and fried
potatoes and crisps (in children). Non-alcoholic, non-
dairy beverages, as a general category, made a smaller
contribution to energy than these foods.
Although the contribution of sugar-sweetened
beverages to discretionary food intake is low across
the population, it is high in those who consumed
these drinks in the measurement period. High sugar-
sweetened beverage consumption may also serve as a
marker of poor diet quality and least healthy lifestyle
patterns, and is associated with low physical activity or
high sedentary behaviour.
Together, these findings highlight the importance of
targeted initiatives to improve beverage choice within
the context of a healthier diet with fewer discretionary
foods and a healthier, more active lifestyle.
THE ROLE OF BEVERAGES IN THE AUSTRALIAN DIET28
For further information, please contact
the Australian Beverages Council Ltd
www.australianbeverages.org
References1. Discretionary Foods. 4363.0.55.001 - Australian
Health Survey: Users’ Guide, 2011-13 http://www.abs.gov.au/ausstats/[email protected]/Lookup/4363.0.55.001Chapter65062011-13 (accessed 21st July 2015)
2. Eat For Health Australian Dietary Guidelines Summary 2013 https://www.eatforhealth.gov.au/sites/default/files/files/the_guidelines/n55a_australian_dietary_guidelines_summary_book.pdf (accessed 21st July 2015).
3. Drawn from Table 45 from: Hendrie G, Baird D, Syrette J, Barnes M, Riley M. Consumption of non-dairy, non-alcoholic beverages in the Australian population: A secondary analysis of the Australian National Nutrition and Physical Activity Survey (NNPAS) 2011-12: Comprehensive Results. 2015: 135.
4. Golley RK, Hendrie GA, McNaughton SA. Scores on the dietary guideline index for children and adolescents are associated with nutrient intake and socio-economic position but not adiposity. J Nutr 2011; 141: 1340–7.
5. Mortensen A. The role of beverages in the diet of Australian children. Analysis and summary report commissioned by the Australian Beverages Council. Australia, 2010: 1–15.
6. Clifton PM, Chan L, Moss C, Miller MD, Cobiac L. Beverage intake and obesity in Australian children. Nutrition & Metabolism 2011, 8:87.
7. Levy GS, Shrapnel WS. Quenching Australia’s thirst: A trend analysis of water-based beverage sales from 1997 to 2011. Nutr Diet 2014; 71: 193-200.