the role of age and gender in education expansion
TRANSCRIPT

The Role of Age and Gender in Education Expansion
Within- and Between–group Specific Trends in Education (In)equality
Petra Sauer
WU Vienna University of Economics and Business
Paper prepared for the IARIW-ICIER Conference
New Delhi, India, November 23-25, 2017
Session 3B: Education
Time: Thursday, November 23, 2017 [Afternoon]

The Role of Age and Gender in Education Expansion
Within- and Between-group Specific Trends in Education (In)equality
Petra Sauer∗
Abstract
Using the IIASA/VID dataset of populations by age, sex and level of education, Icalculate education Gini coefficients and decompose the overall degree of educational in-equality into age, sex and within-group components. I analyze the relative relevance ofthese components for inequality reduction and investigate the distributional outcomes ofeducation expansion. I find that, on average, equalization between males and females,younger and older cohorts as well as within these subgroups of the population has signif-icantly contributed to declining educational inequality over the observed sample periodaround the globe. But the relative role of these components fluctuates in the process ofeducation expansion. First, as improvements are initiated by enhancing the educationalopportunities of the youth, the gap between cohorts widens in transition phases but van-ishes thereafter. Second, gaps between sexes have been reduced but are predicted to widenagain if either males or females are the first to enter higher education levels. To a lesserextent, this is also true for gaps within population subgroups which can be due to theethnic background or the social and economic status of people.
Keywords: Education, Inequality, Age DistributionJEL codes: I24,I25
∗Institute for Macroeconomics and INEQ Research Institute Economics of Inequality (WU Vienna Universityof Economics and Business), WIC Wittgenstein Centre for Demography and Global Human Capital (IIASA,VID, WU)
1

1 Introduction
“... an overall trend of education expansion, accompanied by a reduction of inequalityin the distribution of education has taken place ..., however, ... huge differences acrosscountries still persist.” (Sauer & Zagler, 2014) Diverseness in the distributional outcomesof education expansion result from the extent to which policies are able to enlarge thegroup of people who participate in education. This is done by improving the educa-tional opportunities of women as well as of people from disadvantaged socio-economicbackgrounds. In both respects, providing for enhanced schooling prospects of the youthsecures educational outcomes of future generations. Consequently, differential educationexpansion trajectories result from differential magnitudes of human capital accumulationand equalization among the youth as well as between men and women.
In order to examine comparative distributional implications of education expansion,I decompose overall education inequality into age, gender and within-group components.Using a matrix algebra approach, Silber (1989) shows how to decompose the Gini indexinto three components, a within- and a between-group component, and a residual term.I adapt his method so that it can be applied to aggregate education data instead ofindividual income data. Doing so enables me to separate inequalities which are due toinequality across age groups as well as between males and females from disparities withinthese groups for 171 countries over the time span from 1970 to 2010 in 5-year intervals.Moreover, I provide an intuitive interpretation of the residual term which relates to thedegree of within-group inequality. Analyzing these new indicators provides novel insightsinto comparative education expansion trajectories around the globe.
The remainder of this papers is structured as follows. Section 2 surveys existing workon the distribution of educational attainment. Thereafter, I use matrix algebra to derivethe education Gini coefficient as a measure of between-category inequality and describeits decomposition in Section 3. I present the data I use in Section 4 and discuss theresults of my decomposition analysis in Section 5. In Section 6, I test for non-linearityin the relationship between average educational attainment and the obtained inequalitycomponents. Finally, Section 7 concludes.
2 Measuring Education Inequality - An Overview
Two measures have been used primarily in order to investigate the distributional dimen-sion of education.1 The standard deviation of schooling was used to explore the impact ofthe distribution of education on income growth and poverty reduction (e.g. Birdsall andLondono, 1997; Lopez et al., 1998) as well as income inequality (e.g. Lam and Levison,1991; Inter-American Development Bank, 1999). Furthermore, similar to the concept ofincome inequality, standard deviations were applied to test for the existence of an Edu-cation Kuznuts Curve, i.e. an inverted U-shape relation between the distribution and theaverage level of schooling. By relating the standard deviation to average years of schoolingof 140 countries in 2000, Fan et al. (2002), confirmed the findings of Londono (1990) and
1Fan et al. (2002) also calculate Theil indices of educational attainment and Castello & Domenech (2002)additionally report the distribution of education by quintiles.
2

Ram (1990) that educational inequality first increases as the average level of schoolingrises, and, after reaching a peak, starts to decline.
However, the standard deviation is only a measure of absolute dispersion and it doesnot provide a consistent picture of the distribution of education, especially for countrieswith very low and high levels of average schooling. As a measure of relative inequality,the education Gini coefficient is therefore seen as a more consistent and robust measureof the distribution of education. Some earlier studies (e.g. Maas and Criel 1982, Rosthal1978 and Sheret 1988) used schooling enrollment figures or education finance data forcalculating education Gini coefficients for small samples of mostly developing countries.These data bases do not accurately reflect the existent stock of human capital, though.Enrollment ratios are flow variables that add to future stock of human capital. Even ifthey constitute an indicator of access to education or equality of opportunity, they donot capture the degree of inequality in educational outcomes. Due to the availabilityof datasets which, by reporting attainment figures for various education levels, providea more appropriate picture of the actual distribution of education, more recent studiescalculate the education Gini based on educational attainment of the concerned population.
Like in its application to income inequality, the education Gini coefficient is a measureof mean standardized deviations between all possible pairs of persons and lies in a rangebetween zero and one. A value of zero indicates a perfectly equally distributed educationstructure, with the opposite being true for a value of one. The former case corresponds toa situation in which the whole population attains the same education level, irrespectiveof which. In the latter case, one person completes for example tertiary education, whilethe rest of the population does not attain any formal schooling. Lopez et al. (1998) werethe first to derive Gini coefficients for 12 countries from attainment data. Fan et al.(2001) provide a detailed description of the underlying methodology, calculate EducationGini’s for 85 industrialized and developing countries for the period from 1960 to 1990and relate them to average educational attainment, educational gender-gaps and realGDP per capita. They further extend the sample to 140 countries from 1960 to 2000in their subsequent work (see Fan et al. 2002). Thereafter, their approach has beenutilized for deriving a consistent indicator of the distribution of education, that can berelated to income distribution (e.g. Checchi, 2000) and income growth (e.g. Castello &Domenech, 2002 and Sauer & Zagler, 2014 ). Non-conforming with earlier results, plottingGini Coefficients against average educational attainment does not support an educationKuznets curve but reveals a strong negative relation between the degree of inequality andthe average level of educational attainment.
Crespo-Cuaresma et al. (2013) integrated the demographic dimension into the analysisof education inequality. They have constructed a dataset of education Gini measures byage group and gender for 175 countries from 1960 to 2010 in 5-year intervals based onthe first version of the IIASA/VID2 global dataset of populations by age and sex aswell as four levels of education.3 Investigating differential trends of education inequalitywithin population subgroups, they show that education is more equally distributed among
2International Institute for Applied Systems Analysis/Vienna Institute of Demography3Benaabdelaali et al. (2012) also computed education Gini coefficients by age group based on the Barro-Lee
2010 education dataset.
3
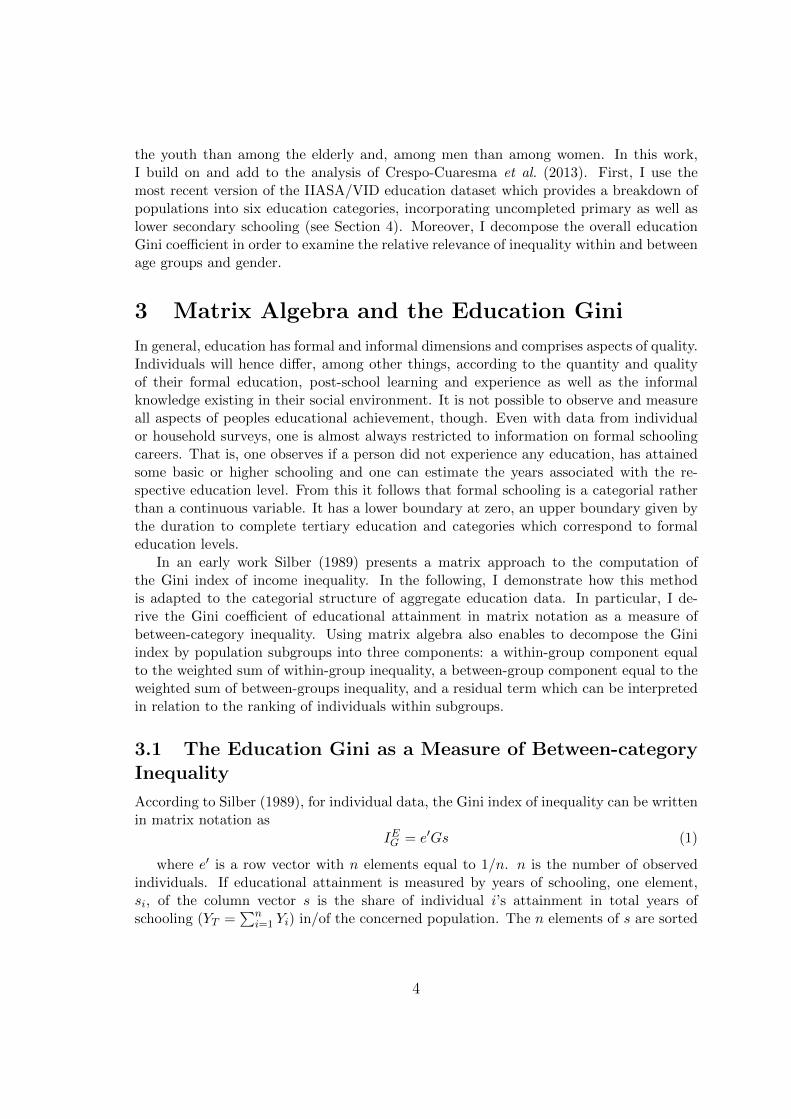
the youth than among the elderly and, among men than among women. In this work,I build on and add to the analysis of Crespo-Cuaresma et al. (2013). First, I use themost recent version of the IIASA/VID education dataset which provides a breakdown ofpopulations into six education categories, incorporating uncompleted primary as well aslower secondary schooling (see Section 4). Moreover, I decompose the overall educationGini coefficient in order to examine the relative relevance of inequality within and betweenage groups and gender.
3 Matrix Algebra and the Education Gini
In general, education has formal and informal dimensions and comprises aspects of quality.Individuals will hence differ, among other things, according to the quantity and qualityof their formal education, post-school learning and experience as well as the informalknowledge existing in their social environment. It is not possible to observe and measureall aspects of peoples educational achievement, though. Even with data from individualor household surveys, one is almost always restricted to information on formal schoolingcareers. That is, one observes if a person did not experience any education, has attainedsome basic or higher schooling and one can estimate the years associated with the re-spective education level. From this it follows that formal schooling is a categorial ratherthan a continuous variable. It has a lower boundary at zero, an upper boundary given bythe duration to complete tertiary education and categories which correspond to formaleducation levels.
In an early work Silber (1989) presents a matrix approach to the computation ofthe Gini index of income inequality. In the following, I demonstrate how this methodis adapted to the categorial structure of aggregate education data. In particular, I de-rive the Gini coefficient of educational attainment in matrix notation as a measure ofbetween-category inequality. Using matrix algebra also enables to decompose the Giniindex by population subgroups into three components: a within-group component equalto the weighted sum of within-group inequality, a between-group component equal to theweighted sum of between-groups inequality, and a residual term which can be interpretedin relation to the ranking of individuals within subgroups.
3.1 The Education Gini as a Measure of Between-categoryInequality
According to Silber (1989), for individual data, the Gini index of inequality can be writtenin matrix notation as
IEG = e′Gs (1)
where e′ is a row vector with n elements equal to 1/n. n is the number of observedindividuals. If educational attainment is measured by years of schooling, one element,si, of the column vector s is the share of individual i’s attainment in total years ofschooling (YT =
∑ni=1 Yi) in/of the concerned population. The n elements of s are sorted
4

in descending order according to individual ranks in the education distribution, so that
s1 ≥ s2 ≥ ... ≥ si ≥ ... ≥ sn (2)
The linear operator, introduced by Silber (1989), is the G-matrix; which is an n × nmatrix with upper-diagonal elements gij when j > i equal to -1, lower-diagonal elementswhen i > j equal to 1 and diagonal elements when i = j equal to 0.
If the available information is limited to the formal duration it takes to completean education level, individual variation within these categories vanishes. In order todemonstrate that the education Gini is thus reduced to a measure of between-categoryinequality, I partition the relevant vectors as well as the G-matrix. The quantity ofsubvectors of e and s is given by the number of categories, c. The amount of subvectorelements, in turn, depends on the number of individuals, nh, for which h is the highesteducation level attained. The partitioned matrix G consists of c2 submatrices and thushas the following form
G(n1, n1) . . . G(n1, nq) . . . G(n1, nc)...
. . ....
G(np, n1). . .
......
. . ....
G(nc, n1) . . . . . . . . . G(nc, nc)
(3)
The main-diagonal submatrices of dimension nh×nh capture within-category inequal-ity, with zeros in their main diagonal, -1 in their upper right and 1 in the lower left triangle.Submatrices, G(np, nq), for which q > p, consist of identical elements equal to -1. If p > q,the elements are equal to 1. Summing over partitioned elements, the education Gini canthus be written as consisting of a within- and between-category component,
IEG =c∑
h=1
e′(nh)G(nh, nh)s(nh) +c∑
p=1
[ c∑q 6=p
e′(np)G(np, nq)s(nq)]
= IEW + IEB (4)
If no information about within-category variation is available, the within compo-nent is redundant, the overall Gini index reduces to its between-category component,i.e. IEG = IEB , and the degree of inequality is generally underestimated. Further inspec-tion of IEB enables to show how the between-category measure of education inequality canbe computed using population shares and category averages of years of schooling.
Defining the share of category h in total years of schooling, s.h =∑nh
i=1 Yih/YT , as wellas the mean individual share of years in category h, sh = s.h/nh, the between-categorycontribution of one pq-element for which q > p can be written as
e′(np)G(np, nq)s(nq) = −(npn
)nq sq (5)
In turn, the contribution of an element with p > q looks like
e′(nq)G(nq, np)s(np) =(nqn
)npsp (6)
5

So that overall between-category inequality can be written as the weighted average ofits individual pq-contributions, IEpq, with weights equal to the two concerning categories’population and years-of-schooling shares respectively:4
IEB =c∑
p=1
c∑q>p
np + nqn
(npsp + nq sq)IEpq
=c∑
p=1
c∑q>p
(nqn
)npsp −
(npn
)nq sq (7)
Both variants of Equation (7) use the mean of schooling years in each category inconjunction with population shares. They can thus be easily calculated based on aggregatedata of educational attainment. Rearranging the second part of Equation (7) enables toobtain the familiar version of the education Gini index as a weighted sum of differencesin category-specific years of schooling (see Section 2):
IEG = IEB =1
Y
c∑p=1
c∑q>p
(Yq − Yp)pppq (8)
where Y = YT /n is the mean of years of schooling in the concerned population,Yh = (
∑nhi=1 Yi/nh)/YT is the average duration it takes to complete education category h
and ph = nh/n is the corresponding population share.
3.2 Population Subgroups
In contrast to education categories, individuals from different sub-groups of the popu-lation cannot be ordered definitely, resulting in overlapping partitions of the educationdistribution. Nevertheless, the matrix approach provides an intuitive and straight forwardmethod to decompose the education Gini index into population-subgroup contributions.
Following Silber (1989), I define an additional partitioned vector, v, which is orderedfirst, by subgroup averages of education attainment shares and, second, by individualattainment shares within subgroups. Thus,
v1 ≥ ... ≥ vj ≥ ... ≥ vg (9)
andv1,j ≥ v2,j ≥ ... ≥ vnj ,j ∀j (10)
where vi,j is the education attainment share of individual i in group j and vj is thegroups’ mean attainment share. The number of subvectors depends on the number ofgroups g, and the quantity of elements, nj , varies according to the group’s populationsize. If also e and G are partitioned by population subgroup and defined just as inSection 3.1, a modified inequality index, e′Gv, can be decomposed into a within-groupand a between-group component,
g∑j=1
e′(nj)G(nj , nj)v(nj) +
g∑a=1
[ g∑b 6=a
e′(na)G(na, nb)v(nb)]
= IEW + IEB (11)
4See Appendix A
6

Rewriting the within-group elements in terms of group attainment and populationshares enables to obtain the within-group component as a weighted average of within-group inequality, with weights equal to the groups’ population and attainment shares(v.j) respectively. Thus,
IEW =
g∑j=1
njnv.jI
EGj (12)
where within-group inequality, IEGj , is the between-category Gini index of subgroup j.Beyond that, in a similar manner as in Section 3.1, the between-group component of theeducation Gini can be shown to be equal to a weighted average of pairwise contributions,IEab, with weights equal to the two groups’ joint population and attainment shares:
IEB =
g∑a=1
g∑b>a
na + nbn
(nava + nbvb)IEab
=
g∑a=1
g∑b>a
(nbn
)nava −
(nan
)nbvb (13)
Defining mean years of schooling in subgroup j as Yj =∑nj
i=1 Yij/nj , the second partof Equation (13) can be rearranged in order to obtain the between-group contribution asa weighted sum of differences in subgroups’ mean years of schooling:
IEB =1
Y
g∑a=1
g∑b>a
(Ya − Yb)papb (14)
Finally, the difference between the inequality measures obtained from using the defi-nitely ordered versus the reordered attainment share vectors, e′Gd = e′(s − v) = e′Gs −e′Gv, builds the third component of the Gini index decomposition. This factor can beinterpreted as the intensity of modifications necessary to rank individuals according totheir groups’ educational attainment, or, as the degree to which groups are overlapping.
4 Data
Applying the demographic method of multistate back and forward projection, researchersat the International Institute for Applied Systems Analysis (IIASA) and the Vienna Insti-tute of Demography (VID) have constructed population data by four levels of educationalattainment, 21 five-year age groups and sex for 120 countries (KC et al., 2010 and Lutz &KC, 2011). More recently, the dataset has been updated and extended to cover 171 coun-tries. Most importantly, the new version enables to assess the full educational attainmentdistribution over six educational categories which are based on UNESCO’s InternationalStandard Classification of Education (ISCED 1997) levels and are thus consistent overtime and across countries. For the base year 2010, Bauer et al. (2012) use census data ifavailable, survey data otherwise. They apply a set of standardization procedures in orderto harmonize national education levels. KC et al. (2013) adopt demographic techniques
7
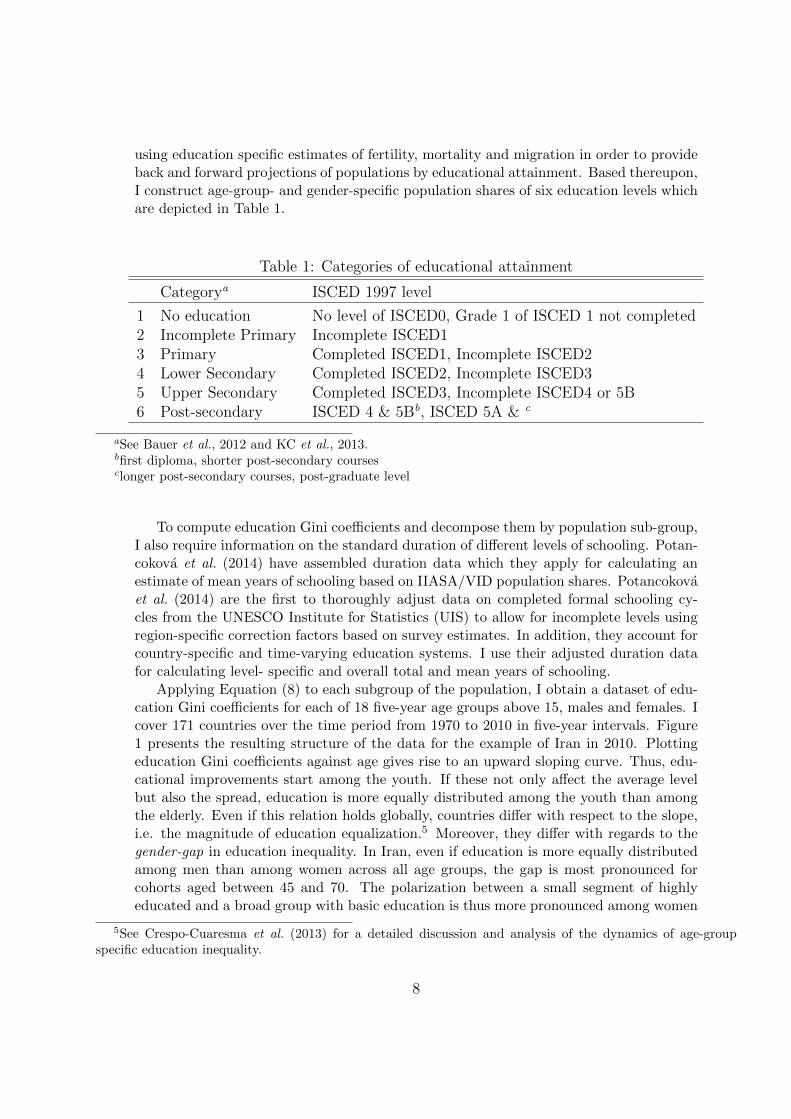
using education specific estimates of fertility, mortality and migration in order to provideback and forward projections of populations by educational attainment. Based thereupon,I construct age-group- and gender-specific population shares of six education levels whichare depicted in Table 1.
Table 1: Categories of educational attainment
Categorya ISCED 1997 level
1 No education No level of ISCED0, Grade 1 of ISCED 1 not completed2 Incomplete Primary Incomplete ISCED13 Primary Completed ISCED1, Incomplete ISCED24 Lower Secondary Completed ISCED2, Incomplete ISCED35 Upper Secondary Completed ISCED3, Incomplete ISCED4 or 5B6 Post-secondary ISCED 4 & 5Bb, ISCED 5A & c
aSee Bauer et al., 2012 and KC et al., 2013.bfirst diploma, shorter post-secondary coursesclonger post-secondary courses, post-graduate level
To compute education Gini coefficients and decompose them by population sub-group,I also require information on the standard duration of different levels of schooling. Potan-cokova et al. (2014) have assembled duration data which they apply for calculating anestimate of mean years of schooling based on IIASA/VID population shares. Potancokovaet al. (2014) are the first to thoroughly adjust data on completed formal schooling cy-cles from the UNESCO Institute for Statistics (UIS) to allow for incomplete levels usingregion-specific correction factors based on survey estimates. In addition, they account forcountry-specific and time-varying education systems. I use their adjusted duration datafor calculating level- specific and overall total and mean years of schooling.
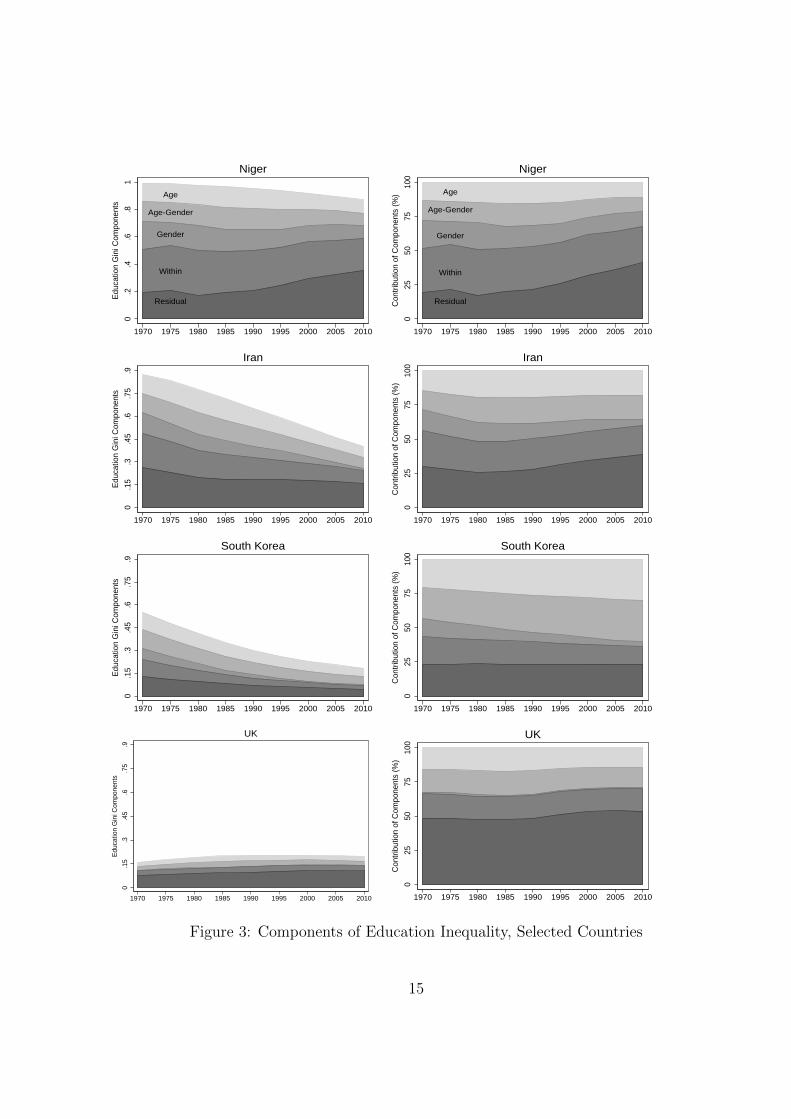
Applying Equation (8) to each subgroup of the population, I obtain a dataset of edu-cation Gini coefficients for each of 18 five-year age groups above 15, males and females. Icover 171 countries over the time period from 1970 to 2010 in five-year intervals. Figure1 presents the resulting structure of the data for the example of Iran in 2010. Plottingeducation Gini coefficients against age gives rise to an upward sloping curve. Thus, edu-cational improvements start among the youth. If these not only affect the average levelbut also the spread, education is more equally distributed among the youth than amongthe elderly. Even if this relation holds globally, countries differ with respect to the slope,i.e. the magnitude of education equalization.5 Moreover, they differ with regards to thegender-gap in education inequality. In Iran, even if education is more equally distributedamong men than among women across all age groups, the gap is most pronounced forcohorts aged between 45 and 70. The polarization between a small segment of highlyeducated and a broad group with basic education is thus more pronounced among women
5See Crespo-Cuaresma et al. (2013) for a detailed discussion and analysis of the dynamics of age-groupspecific education inequality.
8

0.0
0.1
0.2
0.3
0.4
0.5
0.6
0.7
0.8
0.9
1.0
Iran 2010
Age Groups
Edu
catio
n G
ini C
oeffi
cien
t
malesfemalesboth sexes
15−19 25−29 35−39 45−49 55−59 65−69 75−79 85−89 95+
Figure 1: Education Gini Coefficients Across Age and Gender
than among men. At the age of 20, the education Gini indices of males and females areequal to 0.2. However, stronger segmentation in the access to tertiary education amongwomen can explain the slightly higher degree of inequality in subsequent cohorts.
In order to ascertain to measure the degree of inequality in completed educationalattainment, I restrict my analysis to cohorts aged 25 and over. The finer the grouping,the more homogeneous groups are. This increases the relative importance of between-versus within-group variation. Considering this impact on the Gini index decomposition,I construct three broader age groups for people aged 25 to 44, 45 to 64 as well as 65 andover. I thus obtain 6 subgroups of the population which I use to examine the relevanceof age, gender and within-group differences for the degree of inequality in educationalattainment.
5 Decomposing Education Inequality
Globally, the education Gini coefficient of the population aged 25 and over averages at 0.44.With values greater than 0.6, the most unequal distributions of educational attainmentcome upon in South Asian (SA) and Sub-Sahara African (SSA) countries. On the otherhand, high income (HI) OECD as well as Central Asian and Eastern European (CAEE)countries show values below 0.3, on average. Despite their relatively low level, the latter
9

region was able to reduce the education Gini by 2.5% each year between 1970 and 2010.6
The general trend towards more equal education distributions was also pronounced inEast Asia and the Pacific (EAP) and in Middle Eastern and North African (MENA)countries; high-dynamic regions in the medium spectrum of global education inequality.The decline over time is not only relatively sluggish in Latin American and Carribbean(LAC) and high income OECD countries, but also in Sub-Saharan Africa. In South Asiatoo, the education Gini decreased only by 0.8% a year (see Table 2). Applying Equations(8), (12) and (14), I decompose the education Gini coefficient of the total population aged25 and over of 171 countries from 1970 to 2010 into five components as follows,
IEG = IEage + IEage/sex + IEsex + IEwithin + IEresidual (15)
where IEage captures the contribution of gender-specific differentials within age-groups
while IEage/sex compares the educational attainment of different sexes and cohorts. IEsexis the component of the education Gini which is due to differentials between males andfemales of the identical age groups. The extent of inequality within population subgroups,in turn, is given by IEwithin. Finally, IEresidual is the residual component.
I analyze the variation of components across countries and over time by calculatingits relative contribution (Contr) to the overall education Gini in Table 2. I also testwhether these contributions exhibit significant region-specific trends over time and relateto the total level of inequality (see Figure 2). Moreover, I calculate the ratio betweeneach components’ time trend and that of the total Gini, estimated from fixed effectsregressions of the respective factors against time, to evaluate the relative contribution ofcomponents to the declining trend of education inequality over time (∆Contr). In general,I find components to play differential and varying roles in the process towards more equaleducation distributions. The vast majority of components exhibit a significant decreasingtrend over time which corresponds to the secular decline of the total Gini index. Therespective ratios in Table 2 are thus positive while zeros indicate insignificance.
Differentials across age groups of same sexes are intimately connected to processesof educational improvements. The contribution of the age component is thus lowest inthe high-inequality countries of South Asia (12%) and Sub-Saharan Africa (14%) whereyounger cohorts tend to be as similarly low educated as their predecessors. Its relativeimportance increases slightly to a maximum impact of 22% in CAEE countries as theoverall Gini decreases. Higher educational attainment of the youth compared to that ofthe elderly is thus an important factor contributing to low levels of education inequality.Declining differences between cohorts also play a signigicant role in the reduction of overallinequality. Besides in CAEE, the impact is, however, relatively large in North Africa andthe Middle East. In these two regions, the relative contribution of age is significantlydecreasing over time. This is due to the attainment share of young cohorts to stronglydecrease relative to the two older groups, indicating increasingly stagnant education levels
6The group of CAEE countries consists, however, of countries in Eastern Europe (e.g. Latvia and Ukraine),in Central Asia (e.g. Armenia and Kazakhstan) as well as of countries in South-Eastern Europe (e.g. Albania,Macedonia and Turkey). While education inequality is historically relatively low in the former two groups ofcountries, the latter group showed relatively high levels of education inequality in the 1970s and 1980s and wasable to reduce it significantly thereafter.
10

020
4060
80
Age
Com
pone
nt
0 .2 .4 .6 .8 1
020
4060
80
Gen
der
Com
pone
nt
0 .2 .4 .6 .8 1
020
4060
80
With
in C
ompo
nent
0 .2 .4 .6 .8 1Education Gini 25+
020
4060
80
Res
idua
l Com
pone
nt
0 .2 .4 .6 .8 1Education Gini 25+
Figure 2: Contribution of Components (%) & Overall Inequality
of successive generations. While this is true for both sexes in CAEE, the education shareof young females is still increasing relative to their counterparts in the Middle East andNorth Africa. Yet, the development of young males predominates. In countries of EAP,SA and SSA, on the other hand, the two opposing processes cancel each other out. Whilethe education share of female cohorts is increasingly higher than that of their predecessors,males aged 25 to 44 continuously lose compared to the older groups. Gaps between middleand old groups exist in LAC and in high income OECD countries, where convergence ofage groups dominates since 1990.
Lower trend shares coincide with no significant development of the age contributionover time in high income OECD countries as well as in SA and SSA. Further inspec-tion of these regions reveals a structural break in the age-component time-trend, beingsignificantly positive before 1990 and negative thereafter.7 The gender and time-specificpatterns of the age component highlight the varying role of the distribution of educa-tion between cohorts in the process of education expansion, with an increasing divide ifyounger generations become higher educated than the older and a narrowing gap as thesecohorts age. Beyond that, these findings indicate that before including females, educationexpansion started among young males.
7For 33% of total observations, the 5-year difference in the age component is positive. 90% of these obser-vations are before 1990.
11

As opposed to the gender-specific age component, the contribution of the factor whichcompares age groups across sexes does not reveal any link to the overall education Gini. Ingeneral, the contribution of differences between age groups as well as sexes is larger thanthat of the pure age component. This applies also to the component’s share in decliningoverall inequality8 and is especially true for South Asia and Sub-Saharan Africa. Thedivide in educational attainment is thus larger, comparing, for example, males and femalesaged 30 and 50 respectively, than comparing females of the concerning age groups. InNiger, the country with the largest degree of education inequality, the time-average shareof women aged 65 and over in total educational attainment is not only lower than thatof younger women, but also significantly lower than that of males in each age group. Incontrast, the education share of women in the youngest age group is higher than that ofmales in the two older cohorts. There is thus an additional factor of gender to age-groupinequalities. The two age-related component contributions exhibit the same trend overtime in CAEE, LAC, EAP and MENA. In general, this implies that cohort effects apply toboth sexes equally. However, in MENA and EAP, young women increased their educationshare relative to older male cohorts at least until the 1990, while young males lose relativeto older females over the whole time span. This holds even more in Sub-Saharan Africaand South Asia, resulting in an insignificant trend of the respective contribution overtime.
Closing the divide between males and females of the same cohorts has significantlycontributed to declining education inequality around the globe. Not only do I observea positive relation between the total Gini index and the relative contribution of the sexcomponent, but also a decreasing trend of the component as well as its contribution overtime for all world regions. In MENA, SA and EAP, this is mainly due to continuouslyincreasing education shares of women aged 25 to 64. In some Eastern Asian countries, e.g.Hongkong, the education share of young females is even higher than that of young males.In contrast, the education gap between males and females is increasing in the middleage group in some Sub-Saharan African countries. Education gender gaps are negligiblein high income OECD countries. Compared to its low overall education Gini, CAEEshows a relatively high contribution of gender inequality which stems from relatively largedifferentials in South Eastern Europe. On the other hand, overall education inequalitycan be relatively large even if gender differences are marginal. Many Latin Americancountries exceed a total Gini value of 0.4 but the education shares of both sexes evolvealmost simultaneously in all age groups. From this it follows that differential institutionsare a relevant factor in shaping social inequalities.
Educational divides within subgroups of the population arise from segmentation alongvarious social lines, including ethnicity, geography and divisions between individuals fromdifferent socio-economic backgrounds, among other things. The distribution of educationwithin population subgroups thus plays a significant role in shaping the overall level ofinequality. Besides the degree of within-group inequality, the within-group componentdepends on the each group’s share in the population as well as in total educational attain-ment. The within-group component is thus generally larger for females than for males; and
8I only find a structural break in the time trend of the age-sex component in LAC countries, which issignificantly increasing before 1990 and decreasing thereafter.
12
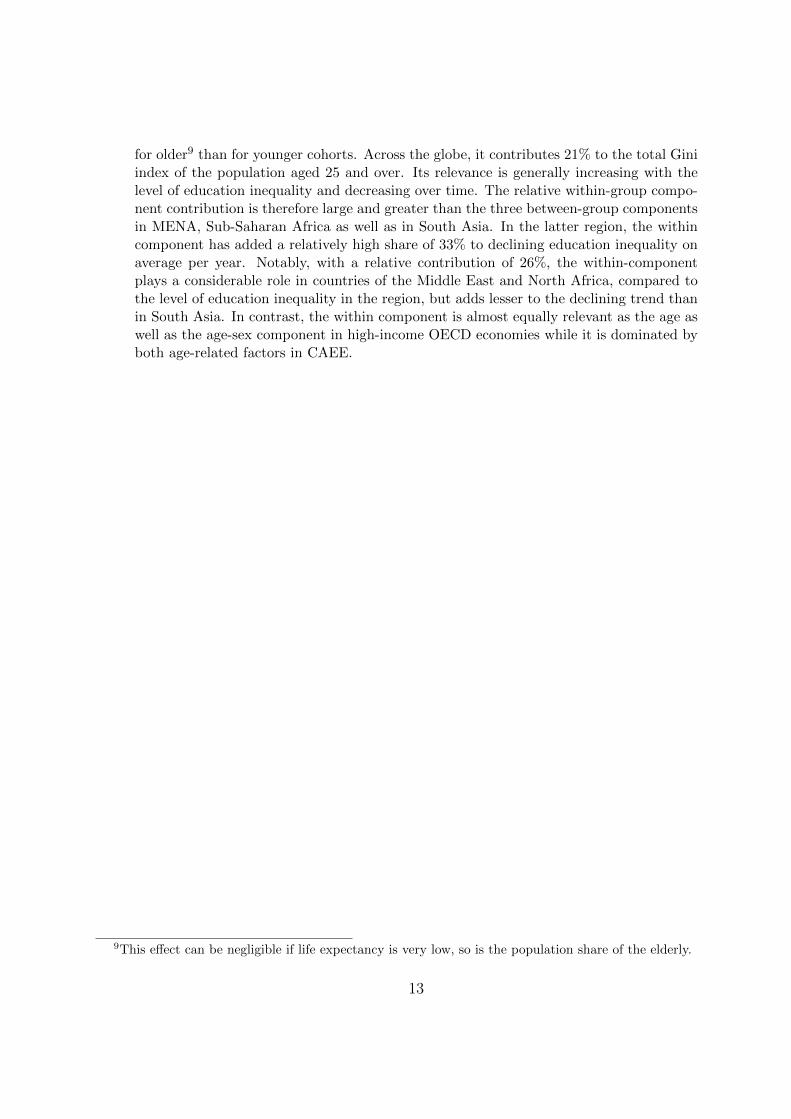
for older9 than for younger cohorts. Across the globe, it contributes 21% to the total Giniindex of the population aged 25 and over. Its relevance is generally increasing with thelevel of education inequality and decreasing over time. The relative within-group compo-nent contribution is therefore large and greater than the three between-group componentsin MENA, Sub-Saharan Africa as well as in South Asia. In the latter region, the withincomponent has added a relatively high share of 33% to declining education inequality onaverage per year. Notably, with a relative contribution of 26%, the within-componentplays a considerable role in countries of the Middle East and North Africa, compared tothe level of education inequality in the region, but adds lesser to the declining trend thanin South Asia. In contrast, the within component is almost equally relevant as the age aswell as the age-sex component in high-income OECD economies while it is dominated byboth age-related factors in CAEE.
9This effect can be negligible if life expectancy is very low, so is the population share of the elderly.
13

Table 2: Education Gini Components by Region
Region Comp Contr Trenda ∆Contrb Comp Contr Trend ∆Contr
HI OECD IEGc 0.207 ⇓ -0.002 Sex 3.55 ⇓ 10.47
Age 16.46 None 14.86 Within 16.59 ⇓ 20.39Age/Sex 17.66 ⇓ 21.14 Resid 45.75 ⇑ 33.14
CAE IEG 0.270 ⇓ -0.007 Sex 5.02 ⇓ 10.89Age 22.45 ⇓ 24.67 Within 15.87 ⇓ 18.66Age/Sex 22.74 ⇓ 26.98 Resid 33.90 ⇑ 18.80
LAC IEG 0.386 ⇓ -0.005 Sex 2.61 ⇓ 4.43Age 14.34 ⇑ 9.75 Within 20.93 ⇓ 25.85Age/Sex 14.28 ⇑ 10.71 Resid 47.84 None 49.27
EAP IEG 0.419 ⇓ -0.007 Sex 6.50 ⇓ 19.13Age 16.95 None 16.04 Within 21.23 ⇓ 25.57Age/Sex 18.15 None 19.95 Resid 37.18 ⇓ 19.31
SA IEG 0.734 ⇓ -0.006 Sex 13.46 ⇓ 37.5Age 11.99 ⇑ 3.27 Within 24.27 ⇓ 33.16Age/Sex 15.63 None 18.34 Resid 34.64 ⇑ 0
MENA IEG 0.565 ⇓ -0.01 Sex 10.53 ⇓ 26.3Age 15.3 ⇓ 18.58 Within 25.81 ⇓ 27.78Age/Sex 15.61 ⇓ 18.87 Resid 32.75 ⇑ 8.46
SSA IEG 0.684 ⇓ -0.007 Sex 13.17 ⇓ 33.1Age 14.15 None 16.00 Within 23.94 ⇓ 26.88Age/Sex 16.49 ⇓ 21.73 Resid 32.25 ⇑ 0
aStatistically significant time trend from a fixed effects regression of component contributions (%) againsttime.
bTime trend of component relative to region specific trend of IEG , estimated from a fixed effects regression.A value equal to zero indicates insignificance.
cEducation of the total population 25+, Contr is equal to the Gini value while Trend and ∆Contr correspondto the time trend of the overall Gini.
14
Residual
Within
Gender
Age-Gender
Age
0.2
.4.6
.81
Edu
catio
n G
ini C
ompo
nent
s
1970 1975 1980 1985 1990 1995 2000 2005 2010
Niger
Residual
Within
Gender
Age-Gender
Age
025
5075
100
Con
trib
utio
n of
Com
pone
nts
(%)
1970 1975 1980 1985 1990 1995 2000 2005 2010
Niger
0.1
5.3
.45
.6.7
5.9
Edu
catio
n G
ini C
ompo
nent
s
1970 1975 1980 1985 1990 1995 2000 2005 2010
Iran
025
5075
100
Con
trib
utio
n of
Com
pone
nts
(%)
1970 1975 1980 1985 1990 1995 2000 2005 2010
Iran
0.1
5.3
.45
.6.7
5.9
Edu
catio
n G
ini C
ompo
nent
s
1970 1975 1980 1985 1990 1995 2000 2005 2010
South Korea
025
5075
100
Con
trib
utio
n of
Com
pone
nts
(%)
1970 1975 1980 1985 1990 1995 2000 2005 2010
South Korea
0.1
5.3
.45
.6.7
5.9
Edu
catio
n G
ini C
ompo
nent
s
1970 1975 1980 1985 1990 1995 2000 2005 2010
UK
025
5075
100
Con
trib
utio
n of
Com
pone
nts
(%)
1970 1975 1980 1985 1990 1995 2000 2005 2010
UK
Figure 3: Components of Education Inequality, Selected Countries
15

The within-group component compares individuals of one group while the betweencomponent compares population groups by their average educational attainment. Theresidual component, in turn, interacts with both factors. First, the lower between-groupinequality, the more are subgroups of the population overlapping. Or, the more permu-tations are necessary to rank individuals first, by the average educational attainment oftheir group and second, by the relative position within their group. Therefore, the rel-ative contribution of the residual component is not only declining in the overall level ofeducation inequality as well as increasing over time, but also strongly decreasing withthe relative contribution of the between-group component (see Figure 4). Even if theresidual component explains a large part of education inequality in each world region, itscontribution of slightly above 30% is relatively low in SA and SSA, where it did not addto the declining trend in the total Gini. Compared to the overall degree of inequality,countries in the Middle East and North Africa stand out with their low level of residualcontribution. This is due to outliers in the Middle East,10 characterized by untypical lowbetween-group-inequality contribution in conjunction with particularly high within-groupinequality.11 On the other hand, the residual component adds above 45% to educationinequality in high income OECD and LAC countries.
The negative relation is still present when the relative contribution of the between-group component is related to the level of the residual component. It is weaker, though,as the variation of the residual substantially increases with declining relevance of between-group inequality. This is due to countries differing with respect to the relevance of within-group inequality. Comparing individuals from different groups solely by group averagesabstracts from comparisons of outliers not represented by their group’s mean attainment.The more polarized groups are, i.e. the greater the spread within groups, the morerelevant these comparisons become. Hence, the higher the residual component. Evenif I do not observe any relation between the respective relative contributions, I find thelevel of the residual component to increase with rising relative relevance of within-groupinequality. This relation is even stronger if I exclude MENA countries with particularlyhigh within-group contributions but low shares of between-group components.
To sum up, the analyzed components of education inequality exhibit differential rolesacross regions and vary over time in the process of education improvements. Even if thesample period I observe is dominated by equalizing processes between cohorts, differingtrends between males and females as well as over time indicate that the gap between agegroups fluctuates in conjunction with the level of educational attainment. This is also truefor differences between sexes. My findings indicate that education expansion processeshave predominantly started among young males before including females. Yet, closingthe gap between sexes of equal age groups has significantly contributed to the decliningtrend of overall education inequality. The contribution of within-group inequality, inturn, is relatively large but decreasing over time. Beyond that, polarization within groupsimpairs between-group comparisons, resulting in larger residual components of educationinequality.
10Especially Quatar and the United Arab Emirates.11The low mean residual contribution in CAEE countries is driven by South-eastern countries.
16

020
4060
80
Res
idua
l Con
trib
utio
n
0 20 40 60 80Between Contribution
020
4060
80
10 20 30 40 50Within Contribution
0.1
.2.3
.4.5
Res
idua
l Com
pone
nt
0 20 40 60 80Between Contribution
0.1
.2.3
.4.5
10 20 30 40 50Within Contribution
Figure 4: Between - Within & Residual Component
6 Distributional Impacts of Education Expansion
Convergence of educational attainment within and between age groups as well as sexeshas accounted for declining inequality in the distribution of education. However, to whatextent have education expansion processes around the globe contributed to this trend?Moreover, in how far have components of education inequality have been affected differ-ently?
Previous work on the distribution of education found evidence for a strong negativerelation between the degree of education inequality and average educational attainment,mostly measured by mean years of schooling in the concerning population. Yet, Sauer& Zagler (2012) observed that even if this relation holds across countries, it need notbe strictly negative within countries over time. Also my findings in Section 5 suggest anon-linear relation between education inequality and average attainment which is drivenby the dynamics of between- and within-group inequality. I test whether a non-linearrelation between each component and average educational attainment exists in a panelregression framework. Beyond that, I investigate the distributional impacts of variationsin the formal duration of schooling cycles. A simple model which aims to explain the levelas well as the relative contribution of each component can be written as,
Compi,t = αi + β1Yi,t + β2Y2i,t + β3dur
Pi,t + β4dur
Ci,t + β5dur
Si,t + λt + εi,t (16)
17

Table 3: Regression Results: Level of Components
IEG IEage IEage/sex IEsex IEwithin IEresidual
Y -0.107*** -0.014*** -0.014*** -0.031*** -0.030*** -0.016***(0.002) (0.001) (0.001) (0.001) (0.001) (0.002)
Y 2 0.003*** 0.000*** 0.000*** 0.002*** 0.001*** -0.000***(0.000) (0.000) (0.000) (0.000) (0.000) (0.000)
durP 0.152*** 0.037* 0.097*** 0.033 0.018 -0.032(0.038) (0.020) (0.022) (0.023) (0.015) (0.040)
durC -0.152*** -0.052** -0.077*** -0.034 -0.039** 0.051(0.041) (0.022) (0.024) (0.025) (0.016) (0.044)
durS 0.040** 0.018* 0.036*** 0.025** 0.018** -0.057***(0.019) (0.010) (0.011) (0.012) (0.007) (0.020)
Obs 1,539 1,539 1,539 1,539 1,539 1,539N 171 171 171 171 171 171T 9 9 9 9 9 9
* p < 0.1; ** p < 0.05; *** p < 0.01
where Compi,t is the concerning component of education inequality or its relativecontribution. Yi,t is a measure of mean years of schooling in the population aged 25+and its square accounts for the presumed non-linearity in the relation of interest. durPi,t,
durCi,t and durSi,t are the formal durations necessary to complete primary, compulsory andupper secondary education respectively. This data is taken from UIS (see Section 4) andmeasured as an average over the years each of 16 cohorts above 25 went to school tocomplete the concerning education level. Thereby, the time lag between the educationpolicy and educational outcomes is accounted for. I include country- (αi) and time-specific(λt) intercepts. Finally, εi,t captures the time varying component of the error term. Iestimate the parameters in 16 using the fixed-effects estimator as the expected value ofthe time-invariant country-specific effects conditional on the explanatory variables cannotbe assumed to be zero. The results are provided in Tables 3 and 4.
The estimated relationship between average educational attainment and overall educa-tional inequality as well as its components hints at a U-shape. The total education Gini ofthe population aged 25+ is predicted to significantly decrease in the process of educationexpansion until eight years of schooling, but increases thereafter. This non-linear relationis slightly less pronounced for the two age components, but even stronger for the genderas well as the within-group component. The residual component, on the other hand, isincreasingly negative related to mean years of schooling.
Looking at relative contributions of education inequality components reveals a some-what different picture. Most importantly, I find evidence for an education Kuznets curve,
18

Table 4: Regression Results: Contribution of Components
IEG IEage IEage/sex IEsex IEwithin IEresidual
Y -0.107*** 1.302*** 2.007*** -2.562*** -0.771*** 0.023(0.002) (0.161) (0.159) (0.125) (0.084) (0.316)
Y 2 0.003*** -0.064*** -0.071*** 0.141*** 0.009** -0.017(0.000) (0.009) (0.009) (0.007) (0.005) (0.018)
durP 0.152*** 14.478*** 20.661*** 1.843 -5.532*** -31.451***(0.038) (3.856) (3.792) (2.994) (2.001) (7.549)
durC -0.152*** -19.674*** -20.684*** 3.784 2.549 34.025***(0.041) (4.214) (4.144) (3.272) (2.187) (8.250)
durS 0.040** 9.457*** 10.685*** -0.259 0.803 -20.686***(0.019) (1.936) (1.904) (1.503) (1.005) (3.791)
Obs 1,539 1,539 1,539 1,539 1,539 1,539N 171 171 171 171 171 171T 9 9 9 9 9 9
* p < 0.1; ** p < 0.05; *** p < 0.01
i.e. an inverted U-shape relation between the relative contribution of both age relatedcomponents and mean years of schooling. Thus, as education expands, relative differen-tials between age groups first increase but vanish if educational attainment of successiveyoung cohorts stagnates. In contrast, the relative relevance of inequality between sexesas well as within groups increases with higher average educational attainment. While theturning point is not yet observable for the within-group component, it is relatively lowat 5 years of schooling for the gender component. This result, on the one hand, supportsthe previous finding that education expansion processes have started among young menand, on the other hand, reveals the tendency of women to attain higher education lev-els than men not only in high income OECD economies but also some countries of EastAsia, Eastern Europe and Latin America. In general, these results provide indication forinequality to change in waves with educational attainment. As long as specific groupswithin societies are the first to benefit from improvements, inequality will first rise butdecrease as larger parts of the population take part in education and remain constantuntil the next impulse for advancements.
Variations in the formal duration of schooling can have large distributional effects.Depending on the education level in which changes take place, particular populationgroups benefit from such policies. Holding the duration of higher levels constant, anincrease in the duration of primary education significantly widens the gaps between agegroups, thereby increasing the relative contribution of both age components. This effectis, however, almost entirely compensated by an expansion of compulsory education viarising the formal duration of lower secondary schooling. In contrast, a longer duration of
19

primary education significantly contributes to reduce the relative contribution of within-group inequality. Finally, an increase in the formal duration of upper secondary educationsignificantly increases the relative relevance of the gap between the youth and the elderly.This is also true for the corresponding levels of age-related components. Beyond that, alonger duration of higher education levels tends to benefit the sex or other group of thepopulation which is relatively high represented.
7 Conclusions
Investigating the trends of education inequality between as well as within population sub-groups sheds light into the distributional implications of different education expansiontrajectories. The analyzed components exhibit differential roles across regions and varyover time as societies become educated. In general, as long as specific groups within so-cieties are the first to benefit from improvements, inequality will first rise but decreaseas larger parts of the population take part in education; and remain constant until thenext impulse for advancements. This is especially true for divides between age groups,which increase as younger generations become higher educated and decrease as these co-horts age. However, I find evidence on gender specific developments which indicate thateducation expansion processes have predominantly started among young males before in-cluding females. Yet, closing the gap between sexes of equal age groups has significantlycontributed to the declining trend of overall education inequality throughout the observedsample period. Indeed, young women are already higher educated than their male coun-terparts in some middle and highly educated countries. Inequality in the distributionof education within population subgroups accounts for a large part in overall educationinequality. Thus, even its relevance is decreasing over time, the ethnic background or thesocial and economic status of people continues to determine the educational prospects ofpeople. Beyond that, the larger the polarization within groups, the less meaningful aregroup comparisons, resulting in an underestimation of between-group inequality. Cross-regional variations in the roles of divides between sexes as well as within population groupsindicate that differential institutions are a relevant factor in shaping social inequalities.
My findings involve some suggestions for education policies, which are able to affectthe distributional implications of education expansion. As long as societies are segmentedalong various lines, policies benefit particular groups. For example, I find increasing theformal duration of lower education levels to exert equalizing effects while longer durationsof higher levels tend to widen educational gaps between both sexes and socio-economicgroups. From this it follows that a comprehensive understanding of the distribution ofeducation between and within various population groups in conjunction with the identi-fication of target groups should help to improve the distributional effects of policies.
Not only can the new indicators of between- and within-group inequality in educa-tional attainment provide novel insights into comparative education expansion trajecto-ries around the globe, but also into the macro-economic consequences and broader societaleffects of education inequality. For example, the age component measures the extent ofeducation expansion and can be used to examine the consequences for economic growth.Relating my measures of gender inequality in educational attainment to democratization,
20

female labor force participation or fertility can contribute to the understanding of therole of women in development processes. Moreover, they can be used to analyze whetherclosing education gender gaps have contributed to narrowing gender wage gaps at theaggregate level.
References
Barro, Robert J., & Lee, Jong-Wha. 2010. A New Dataset of Educational Attain-ment in the World, 1950-2010. NBER Working Paper 15902.
Bauer, Ramon, Potancokova, Michaela, Goujon, Anne, & KC, Samir. 2012.Populations for 171 Countries by Age, Sex, and Level of Education around 2010: Har-monized Estimates of the Baseline Data for the Wittgenstein Centre Projections. IIASAInterim Report IR-12-016.
Benaabdelaali, Wail, Hanchane, Said, & Kamal, Abdelhak. 2012. Chapter 13Educational Inequality in the World, 1950-2010: Estimates from a New Dataset. In:Bishop, John A., & Salas, Rafael (eds), Inequality, Mobility and Segregation: Es-says in Honor of Jacques Silber (Research on Economic Inequality, Volume 20. EmeraldGroup Publishing Limited.
Birdsall, Nancy, & Londono, Juan Luis. 1997. Asset Inequality Matters: An As-sessment of the World Bank’s Approach to Poverty Reduction. American EconomicReview, 87(2), 32–37.
Castello, Amparo, & Domenech, Rafael. 2002. Human Capital Inequality andEconomic Growth: Some New Evidence. The Economic Journal, 1128, C187–C200.
Checchi, Daniele. 2000. Does Educational Achievement Help to Explain Income In-equality? Working Paper n.11.2000, Universita degli Studi di Milano.
Crespo-Cuaresma, Jesus, Sauer, Petra, & KC, Samir. 2013. Gini Coefficientsof Educationals Attainment: Age Group Specific Trends in Educational (In)equality.WWWforEurope Working Paper no 6.
Fan, Xibo, Thomas, Vinod, & Wang, Yan. 2001. Measuring Education Inequality:Gini Coefficients of Education. World Bank Working Paper 2525.
Fan, Xibo, Thomas, Vinod, & Wang, Yan. 2002. A New Dataset on Inequality inEducation: Gini an Theil Indices of Schooling for 140 Countries, 1960-2000. Mimeo,The World Bank.
Inter-American Development Bank. 1999. Facing up to Inequality in Latin Amer-ica: Economic and Social Progress in Latin America, 1998-99 Report. Johns HopkinsUniversity Press.
21

KC, Samir, Barakat, Bilal, Goujon, Anne, Skirbekk, Vegard, Sanderson,Warren, & Lutz, Wolfgang. 2010. Projection of populations by level of educationalattainment, age, and sex for 120 countries for 2005-2050. Demographic Research, 22,383–472.
KC, Samir, Potancokova, Michaela, Bauer, Ramon, Goujon, Anne, &Striessnig, Erich. 2013. Summary of Data, Assumptions and Methods for NewWittgenstein Centre for Demography and Global Human Capital (WIC) PopulationProjections by Age, Sex and Level of Education for 195 Countries to 2100. IIASAInterim Report IR-13-018.
Lam, David, & Levison, Deborah. 1991. Declining Inequality in Schooling in Braziland its Effects on Inequality in Earnings. Journal of Development Economics, 37(1-2),199–225.
Londono, Juan Luis. 1990. Kuznetsian Tales with Attention to Human Capital.
Lopez, Ramon, Thomas, Vinod, & Wang, Yan. 1998. Addressing the EducationPuzzle: The Distribution of Education and Economic Reform. World Bank WorkingPaper 2031.
Lutz, Wolfang, & KC, Samir. 2011. Global Human Capital: Integrating Educationand Population. Science, 333, 587–592.
Maas, Jacob, & Criel, Ceert. 1982. Distribution of Primary School Enrollments inEastern Africa. Wold Bank Staff Working Paper 511.
Potancokova, Michaela, KC, Samir, & Goujon, Anne. 2014. Global Estimates ofMean Years of Schlooling: A New Methodology. IIASA Interim Report IR-14-005.
Ram, Rati. 1990. Educational Expansion and Schooling Inequality: International Evi-dence and Some Implications. The Review of Economics and Statistics, 72(2), 266–274.
Rosthal, Richard A. 1978. Measures of Disparity: A Note.
Sauer, Petra, & Zagler, Martin. 2012. Economic Growth and the Quantity andDistribution of Education: A Survey. Journal of Economic Surveys, 26(5), 933–951.
Sauer, Petra, & Zagler, Martin. 2014. (In)equality in Education and EconomicDevelopment. Review of Income and Wealth, 60, 353–79.
Sheret, Michael. 1988. Equality Trends and Comparisons for the Education Systemof Papua New Guinea. Studies in Educational Evaluation, 14(1), 91–112.
Silber, Jacques. 1989. Factor Components, Population Subgroups and the Computationof the Gini Index of Inequality. The Review of Economics and Statistics, 71(1), 107–115.
22

A Between-group Inequality
The contribution of inequality between any two categories or groups p, q can be writtenas follows (Silber, 1989),
IEBpq = −(nqn
)npsp +
(npn
)nq sq
=np + nq
n(npsp + nq sq)I
Epq (17)
where
IEpq =nq
np + nq
npspnpsp + nq sq
− npnp + nq
nq sqnq sp + nq sq
(18)
23