the road to namas - center for clean air policyccap.org/assets/the-road-to-namas_ccap.pdf · by...
TRANSCRIPT

The Road To NaMas
G lo b a l Sto r i e S o f S u cc e SS f u l c l i m at e ac t i o n S

abouT CCaPSince 1985, CCAP has been a recognized world leader in climate
and air quality policy and is the only independent, non-profit think
tank working exclusively on those issues at the local, national, and
international levels. Headquartered in Washington, D.C., CCAP
helps policymakers around the world to develop, promote and
implement innovative, market-based solutions to major climate, air
quality and energy problems that balance both environmental and
economic interests.
The Road To NaMasGlobal StorieS of SucceSSful climate actionS

aCkNowledgeMeNTsThese success stories were researched as part of the Center for Clean
Air Policy’s Mitigation Action Implementation Network (MAIN) program.
The primary authors of this report are Leila Yim Surratt, Tim Williams,
and Stacey Davis of CCAP. Significant contributions were provided
by Catherine Leining, Justine Sefton, Sonia Florian, Tomas Wyns, Julie
Cerqueira, Barry Elkinton, Kelly Clonts, and Michael Turner. A special
thanks to Brad Johnson, Ubaldo Inclan, Chuck Kooshian, Ignacio
Santelices, Anmol Vanamali, and Steve Winkelman for their input and
editorial assistance. This report was edited by Lisa Palmer and produced
by Star Dodd and Katy Nally.
This work was made possible by the generous support for the MAIN
program from Germany International Climate Initiative, Environment
Canada, the Kingdom of Denmark and other funders. CCAP is solely
responsible for the content of this report.
Table of CoNTeNTs4
6
8
14
20
26 32
38
44
50
56 62
MaP of suCCess sToRies
iNTRoduCTioN
baNgladeshDhaka’s Integrated Municipal Solid Waste Program
ChileTaking Initiative on Energy Efficiency
ChiNaExpanding Access to Energy Efficiency Finance Through the Use of Credit Guarantees
ColoMbiaReducing Traffic Congestion in Bogotá Through Bus Rapid Transit and Non-Motorized Transport
geRMaNy & ThailaNdAccelerating Renewable Energy Deployment with Feed-in-Tariffs
MexiCoPromoting Sustainable Growth in the Residential Sector
siNgaPoReImproving Building Efficiency with the Green Mark Scheme
swedeNDriving Industrial Energy Efficiency Through Energy Tax Rebates
ThailaNdRevolving and ESCO Funds for Renewable Energy and Energy Efficiency Finance
uNiTed sTaTesSmartWay Program Reduces Emissions from Freight Transport

p56
p20
p44
p8
p50
p32
p26
p14
p62
p38
UNITED STATES
MEXICO
COLOMBIA
CHILE
BRAZIL
NAMIBIA
SPAIN
BELGIUM
SWITZERLAND
GERMANY
SWEDEN
BULGARIA
PORTUGAL
SINGAPORE
MALAYSIABANGLADESH
INDIA
JAPANSOUTH KOREA
AUSTRALIA
THAILAND
CHINA
MaP of suCCess sToRies
4 the road to namas GLOBAL STORIES OF SUCCESSFUL CLIMATE ACTIONS 5
seCToRs
renewable enerGy
waSte
induStrial enerGy efficiency
buildinG enerGy efficiency
tranSport
In this publication
daRk blue
lighT blue
Read more stories online at www.ccap.org/road-to-namas

GLOBAL STORIES OF SUCCESSFUL CLIMATE ACTIONS 76 the road to namas
be designed to make the most of international financial support by spurring private sector investment. As a result of this work, we believe that NAMAs will be evaluated based on several core elements, including:
• The anticipated effectiveness of the NAMA, including the expected level of ambition in reducing greenhouse gas emissions, but also the expected sustainable development outcomes and plans to monitor, report and verify the actual results.
• The ability of the country to implement the NAMA, including strong leadership that has committed itself to the action, but also sufficient staff capacity and good planning.
• The size of the expected impact relative to the contributing country’s financial investment. The impact can be particularly high where funds are used to mitigate risks and overcome barriers that ripen conditions for private sector investments. Other considerations include careful budgeting that demonstrates funds will be managed and used effectively, commitment of a domestic financial contribution to the NAMA, and avoiding actions that are already supported as Clean Development Mechanism projects and where emissions reduced could be double counted.
In addition to thinking through the different design elements of a NAMA, a key aspect of our work has been harvesting and sharing the best examples of NAMA-like mitigation actions from around the world, with the idea that the NAMA framework can foster replication of the best examples. It is often the case that other countries faced similar policy, market, technical or financial barriers and have found successful solutions. One focus has been to identify and share examples where financing structures were used effectively to leverage donor funds by attracting private sector investment.
This body of work has helped our developing country partners identify and develop NAMAs, some of which are now entering the point where they can be considered for financial support. At the same time, our work has assisted the readiness of contributing countries preparing to invest in NAMAs.
exaMPles of suCCessful CliMaTe aCTioNs
The ten stories showcased in this book include examples from around the world where countries have implemented NAMA-like policies that have successfully reduced greenhouse gas emissions while contributing to measurable sustainable development outcomes. In conducting the research for this book, mitigation actions in both developed and developing countries were considered, specifically those within the five sectors: renewable energy, industrial energy efficiency, building energy efficiency, transport, and waste. The programs outlined in this book are particularly relevant for developing countries, utilize effective financial mechanisms that leveraged donor funds, and ultimately serve as good examples for a potential NAMA.
The stories in this book represent only a portion of the success stories we found from around the world. We encourage you to visit our website (www.ccap.org) to search through our more extensive database of climate action success stories.
We hope these success stories inspire policy makers to consider and identify new opportunities for reducing emissions in the context of sustainable development.
The UNFCCC Bali Action Plan (2007) called on developing countries to consider taking enhanced action on climate change mitigation through nationally appropriate mitigation actions (NAMAs). Central to the NAMA concept is that the actions should be in the context of sustainable development, and will be supported and enabled by international financing, technology, and capacity building.
At the UNFCCC conferences in Copenhagen in 2009 and Cancún in 2010, developed countries committed to mobilize USD 100 billion per year by 2020 to help developing countries reduce greenhouse gas emissions and adapt to the consequences of climate change. And also in 2010, the UNFCCC established the Green Climate Fund as a mechanism to deliver climate finance. While the Green Climate Fund is conceivably several years away from being fully operational, support for NAMA implementation is already starting to emerge through bilateral funding sources and multilateral institutions, and developing countries are now starting down the road to NAMAs.
The NAMA framework presents a critical opportunity to achieve broad-based emissions reductions in developing countries that lead to clear shifts in the emissions trajectory below business-as-usual levels. Rather than selling the lowest cost emission reduction opportunities to compliance buyers in developed countries (as in the case of the Clean Development Mechanism), through NAMAs, developing countries can take advantage of the available low cost opportunities to support achievement of their own voluntary pledges. Further, in undertaking NAMAs, developing countries will build experience in implementing mitigation actions and gain a better sense of the emissions reductions that are achievable in different sectors, informing their future deliberations on the scale of action that could be committed under a future climate agreement.
The UNFCCC opted not to create a formal definition for NAMAs, leaving the door wide open for developing countries to advance climate actions that are appropriate for their national circumstances. At the same time, this high level of flexibility creates some uncertainty over what might qualify as a NAMA and the parameters for accessing international support.
In this context, CCAP launched the Mitigation Action Implementation Network (MAIN) program in 2011 with initial funding from the German International Climate Initiative and with additional funding from Environment Canada and the Kingdom of Denmark. MAIN is increasing the capacity of developing countries in Latin America and Asia to design and develop ambitious NAMAs that can leverage contributing-country funds to achieve both greenhouse gas reduction and sustainable development goals. CCAP provides direct support to governments on the design of NAMAs and, through regional and global dialogues, engages policymakers and climate negotiators from both developing and contributing countries to build a shared understanding of NAMA opportunities and best practices.
As part of the MAIN program, CCAP has been working to educate stakeholders on the different components of a NAMA; how NAMAs might be evaluated; how monitoring, reporting, and verification can be used to build domestic political support while also demonstrating the action is taking place as planned and achieving progress in reducing greenhouse gas emissions; and on how NAMAs can
iNTRoduCTioN

9banGladeShbanGladeSh
wasTe
the bangladesh capital city develops an integrated municipal solid waste program
beyoNd wasTe
By some estimates, Bangladesh’s densely populated capital, Dhaka, is projected to generate more than 5,000 tons of waste each day by 2015—a 47 percent rise from its 2004 baseline of 3,400 tons per day.1,2 Rapid urban population growth and rising incomes have accelerated waste production, exceeding the government’s capacity to adequately manage the waste. Insufficient tax revenue, lax enforcement of the existing waste regulatory framework, and weak inter-agency coordination have further eroded the city’s waste management capacity. Dhaka has experienced a number of adverse impacts including high prevalence of disease, contaminated ground water and poor air quality. The waste sector in Bangladesh is also a significant contributor to greenhouse gas emissions because it generates methane, which is twenty-five times more potent as a greenhouse gas than carbon dioxide (CO
2).3 Excluding carbon
dioxide, this sector produced 17 million metric tons of CO2-equivalent in 2005, or 27
percent of the nation’s total non-CO2 emissions.4 By 2020, waste related emissions are
projected to increase by 22 percent, to 20 million metric tons.5
With financial and technical assistance from the Japan International Cooperation Agency, Dhaka designed a Solid Waste Master Plan in 2005 that set out to transform the municipal solid waste management system by 2015. The Plan sought to develop a participatory waste management program, build government capacity to collect and transport waste, modernize and expand disposal sites, and improve administration and financial management.
TRaNsfoRMiNg ThRough CooRdiNaTioN
The Master Plan manages municipal solid waste throughout its lifecycle and encourages public and private sector participation as cross-cutting themes.
waste Reduction: A National 3R (Reduce, Reuse, Recycle) Strategy was passed in 2010 establishing a 3R Wing at the Ministry of Environment and Forests to implement waste prevention activities, and an inter-ministerial committee to coordinate activities across ministries. To stimulate private sector investment in waste recycling and treatment plants, the strategy calls for the government to provide tax holidays, soft loans, and land to site the facilities. It also calls for research and development of resource-efficient products and processes that minimize chemical and energy waste. The strategy proposes public grants for educational and research institutions; and tax incentives, green industrial parks, and business incubators for industry.
dhaka’s integrated municipal Solid waste program
10 the road to namas 11banGladeSh
administration and financial Management: Each component of Dhaka’s solid waste management system was implemented by separate government offices. Without an overlaying regulatory framework or unifying authority, harmonizing plans and operations proved challenging. Therefore, a Waste Management Department was created to oversee waste operations. The Waste Management Department ultimately became responsible for coordinating the community-based collection efforts and overseeing the Landfill Management Unit. Another administrative challenge was insufficient tax revenue, which weakened the government’s capacity to support solid waste management. In response, The Plan created and implemented an integrated solid waste management cost accounting system, generating monthly cost figures to help the government better plan its waste expenditures and revenue stream to make the system financially sustainable.
wiNNiNg The wasTe baTTle
Implementation of the solid waste management system was successful despite significant delays in a number of areas including: establishing the Waste Management Department; securing sufficient government funding for the development of the Amin Bazar landfill; managing service providers under various departments; and overcoming a central government requirement to remove waste containers from main roads and collect and transport waste at night.10 The two semi-aerobic sanitary landfills, Matuail and Amin Bazar, are now in operation and managing 2,700 to 3,000 tons of waste per day.11
The Matuail landfill received Clean Development Mechanism (CDM) approval for methane recovery and utilization, and was projected to reduce 99,000 tons of CO
2-equivalent per year, directly and indirectly, in 2012.12 The city’s composting
facility was the first ever to receive CDM approval, and was projected to reduce 177,000 tons of CO
2-equivalent per year upon completion. The facility is also
expected to create up to 1,000 new jobs.13 Both CDM projects were financed by a Dutch corporation. The community-based approach to waste collection engaged residents to expand and improve services and improved the working conditions of service providers, thereby reducing occupational health hazards. Increased rates of collection and disposal have improved water and air quality, and expansion of the solid waste management system created opportunities for employment.
The Clean Dhaka Master Plan budgeted USD 44 million for development and capital costs, and USD 7.3 million per year for operations and maintenance (estimate for 2015).14,15 The Japanese government funded much of Dhaka’s waste management fleet—the Environmental Grant Aid Program donated 100 vehicles, valued at USD 5 million.16 The Japanese government also cancelled the debt incurred by Bangladesh for the purchase of 27 container carriers through the Debt Cancellation Fund. The Debt Cancellation Fund also financed the construction of the Matuail and Amin Bazar landfills. The Japan International Cooperation Agency provided technical support for designing and implementing the program.
The integrated solid waste management plan has spurred the development of a much needed waste-related regulatory framework, inspired replication across the country, and led to innovative measures of managing waste. Public and private infrastructure and services have continued to be expanded. Two wards are now receiving private collection and transportation services, and new landfill sites are being planned under the Dhaka Metropolitan Development Plan. The Dhaka model is being replicated in five other metropolitan cities across Bangladesh, financed by the Asian Development Bank’s Urban Public and Environmental Health Sector Development project. The six major cities established a secretariat to facilitate sharing of best practices through conferences, to prepare technical guidelines and to provide input to national solid waste management strategies and policies.
Regarding implementation efforts thus far, the government has established a tax holiday for all waste recycling and treatment plants for up to 10 years, reduced excise and import duties on relevant equipment, and eliminated sales tax on compost.6 Additionally, Dhaka implemented source separation of organic waste to reduce the amount of total waste that must be processed, and built a large scale commercial composting facility to convert 700 tons per day of organic waste to compost. Existing policies, such as a 2002 ban on polythene bags, have further supported waste reduction efforts.
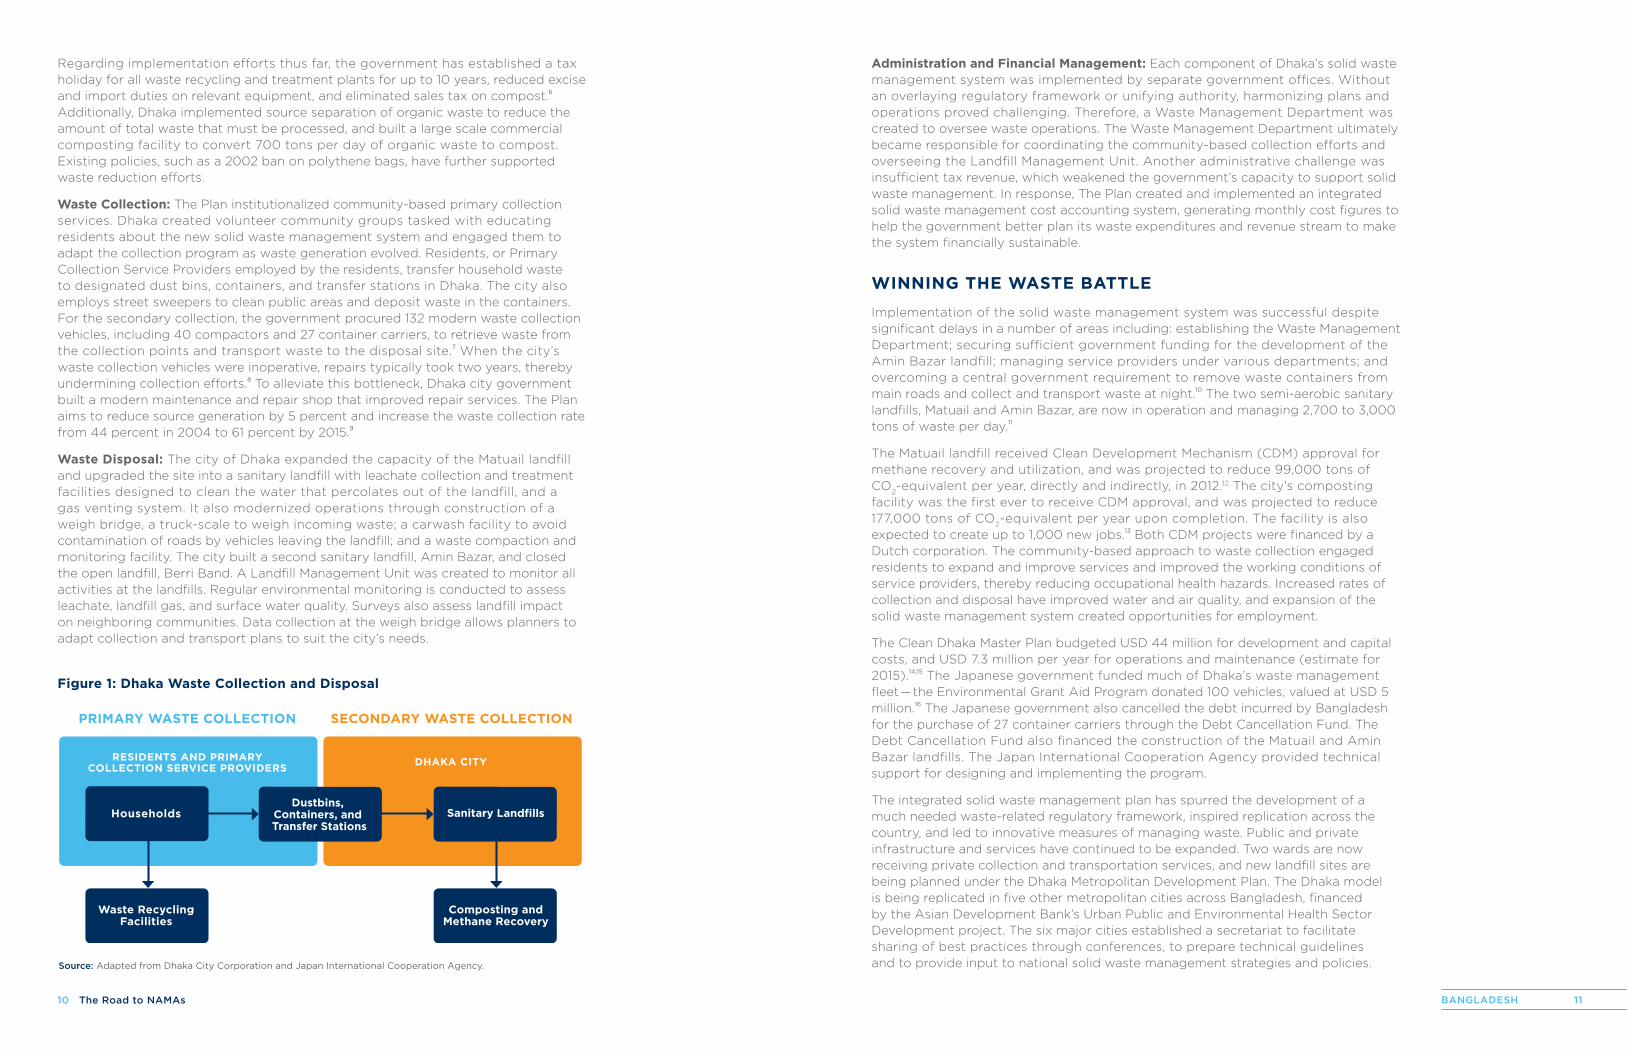
waste Collection: The Plan institutionalized community-based primary collection services. Dhaka created volunteer community groups tasked with educating residents about the new solid waste management system and engaged them to adapt the collection program as waste generation evolved. Residents, or Primary Collection Service Providers employed by the residents, transfer household waste to designated dust bins, containers, and transfer stations in Dhaka. The city also employs street sweepers to clean public areas and deposit waste in the containers. For the secondary collection, the government procured 132 modern waste collection vehicles, including 40 compactors and 27 container carriers, to retrieve waste from the collection points and transport waste to the disposal site.7 When the city’s waste collection vehicles were inoperative, repairs typically took two years, thereby undermining collection efforts.8 To alleviate this bottleneck, Dhaka city government built a modern maintenance and repair shop that improved repair services. The Plan aims to reduce source generation by 5 percent and increase the waste collection rate from 44 percent in 2004 to 61 percent by 2015.9
waste disposal: The city of Dhaka expanded the capacity of the Matuail landfill and upgraded the site into a sanitary landfill with leachate collection and treatment facilities designed to clean the water that percolates out of the landfill, and a gas venting system. It also modernized operations through construction of a weigh bridge, a truck-scale to weigh incoming waste; a carwash facility to avoid contamination of roads by vehicles leaving the landfill; and a waste compaction and monitoring facility. The city built a second sanitary landfill, Amin Bazar, and closed the open landfill, Berri Band. A Landfill Management Unit was created to monitor all activities at the landfills. Regular environmental monitoring is conducted to assess leachate, landfill gas, and surface water quality. Surveys also assess landfill impact on neighboring communities. Data collection at the weigh bridge allows planners to adapt collection and transport plans to suit the city’s needs.
figure 1: dhaka waste Collection and disposal
Composting andMethane Recovery
Waste RecyclingFacilities
Sanitary LandfillsDustbins,
Containers, and Transfer Stations
Households
DHAKA CITYRESIDENTS AND PRIMARYCOLLECTION SERVICE PROVIDERS
PRIMARY WASTE COLLECTION SECONDARY WASTE COLLECTION
Source: Adapted from Dhaka City Corporation and Japan International Cooperation Agency.

12 the road to namas 13banGladeSh
RefeReNCes
Yousuf, Tariq Bin. 2011. “Clean Dhaka Master Plan: An Experience of ODA in Municipal Solid Waste Management.” International Solid Waste Association—Publications. Web. September 2012. <http://www.iswa.org/en/76/publications.html>
Dhaka City Corporation and Japan International Cooperation Agency. October 2007. “Implementation of Clean Dhaka Master Plan: Progress Report 1.” Web. September 2012. <http://www.dhakacity.org/cleandhaka/Documents/progress1.pdf>
Dhaka City Corporation and Japan International Cooperation Agency. 2005. “Clean Dhaka Master Plan: Final Report.” Web. September 2012. <http://www.dhakacity.org/cleandhaka/Documents/CleanDhakaMasterPlanMain.pdf>
eNdNoTes
1 Dhaka City. 2005. “State of the Environment 2005.” Web. September 2012. <http://www.rrcap.unep.org/pub/soe/dhaka-soe-05/3-4dhaka-noise.pdf>
2 Yousuf, Tariq Bin. 2011. “Clean Dhaka Master Plan: An Experience of ODA in Municipal Solid Waste Management.” International Solid Waste Association - Publications. Web. September 2012. <http://www.iswa.org/en/76/publications.html>
3 Intergovernmental Panel on Climate Change. 2007. “Working Group I Fourth Assessment Report: The Physical Science Basis. Chapter 2.” IPCC Working Group I. Web. September 2012. <https://www.ipcc-wg1.unibe.ch/publications/wg1-ar4/wg1-ar4.html>
4 Excludes emissions from land-use, land-use change and forestry.
5 U.S. Environmental Protection Agency. 2011. “Emissions and Projections of Non-CO
2Greenhouse Gases from Developing
Countries: 1990-2030.” Web. August 21, 2012. <http://www.epa.gov/climatechange/EPAactivities/economics/nonco2projections.html>
6 Hasnat, Abu and Maqsood Sinha. “Public-Private Partnership and Decentralized Composting Approach in Dhaka, Bangladesh.” Waste Concern presentation at IPLA Global Forum 2012 on Empowering Municipalities in Building Zero Waste Society—A Vision for the Post-Rio-20 Sustainable Urban Development. Seoul, Republic of Korea, September 5-6, 2012. Web. September 2012. <http://www.uncrd.or.jp/env/ipla/doc/120905Sinha-Waste%20Concern-Bangladesh.pdf>
7 Yousuf, 2011, op cit.
8 Ibid.
9 Dhaka City Corporation and Japan International Cooperation Agency. 2005. “Clean Dhaka Master Plan: Final Report.” Web. September 2012. <http://www.dhakacity.org/cleandhaka/Documents/CleanDhakaMasterPlanMain.pdf>
10 Dhaka City Corporation and Japan International Cooperation Agency. October 2007. “Implementation of Clean Dhaka Master Plan: Progress Report 1.” Web. September 2012. <http://www.dhakacity.org/cleandhaka/Documents/progress1.pdf>
11 Communication from DCC dated May 31, 2012.
12 Government of Bangladesh. 2004. “CDM Project Design Document: Landfill Gas Extraction and Utilization at the Matuail landfill site Dhaka, Bangladesh.” Web. September 2012. <http://cdm.unfccc.int/Projects/projsearch.html>
13 Government of Bangladesh. 2004. “CDM Project Design Document: Composting of Organic Waste in Dhaka.” Web. September 2012. <http://cdm.unfccc.int/Projects/projsearch.html>
14 Currency exchange rate of Bangladesh Taka 81.5 = USD 1 converted on August 22, 2012.
15 Dhaka City Corporation and Japan International Cooperation Agency, 2005, op cit.
16 Currency exchange rate of Japan Yen 78.0 = USD 1 converted on September 30, 2012.
17 Alam, Helemul. “Power from garbage: Govt-run plant to generate 50MWelectricity using garbage of Dhaka city.” The Daily Star, August 8, 2012. Web. September 2012. <http://www.bangladeshnews24.com/thedailystar/2012/08/18/power-from-garbage-govt-run-plant-to-generate-50mw-electricity-using-garbage-of-dhaka-city-11555.htm>
figure references
figure 1: dhaka waste Collection and disposalAdapted from Dhaka City Corporation and Japan International Cooperation Agency.
Dhaka is building on its success by initiating a waste-to-energy project on a “build, own, operate, transfer” basis. A private firm will build an incineration plant and an anaerobic digestion plant on two landfill sites in Dhaka. The power plants will initially have a generating capacity of 10 megawatts and will process 1,000 tons of waste per day, with plans to scale up each facility to 50 megawatts at a processing rate of 5,000 tons of waste per day within three years.17

15chilech ile
chile accelerates its energy efficiency efforts
effeCTive leadeRshiP
As a nation with only modest fossil fuel resources, Chile has carved out a reputation as one of Latin America’s strongest actors on energy efficiency. In 2005, in response to earlier shortages of natural gas imports and droughts which limited hydropower generation, Chile redefined its energy strategy, stressing energy efficiency as a core national priority and establishing a National Energy Efficiency Program.1 Since then, the importance of energy efficiency in Chile has grown substantially, which has been reflected in the federal budget. From 2006 to 2009, the annual budget of the National Energy Efficiency Program increased from USD 1 million to more than USD 34 million.2
Chile reformed its institutional framework for energy efficiency over the last decade and in November 2010 it established the Chilean Energy Efficiency Agency to take over the implementation of energy efficiency policies and initiatives. The Chilean Energy Efficiency Agency is structured as an independent, nonprofit organization which draws on resources from the public as well as private sectors to support the competitiveness and sustainable development of Chile.3 In its role as a public-private institution, it also coordinates and informs the actions of relevant stakeholders at the local, national, and global levels. In 2012, Chile featured energy efficiency as the first component of its National Energy Strategy for 2012 to 2020, which has set an ambitious goal to reduce 2020 projected energy demand by 12 percent through improved energy efficiency.4
a RaNge of eNeRgy effiCieNCy MeasuRes
Since the outset of its energy efficiency efforts in 2005, Chile has initiated a number of significant programs, including:
Chilean energy efficiency standards and labeling Program: This program established a regulatory and labeling framework for electrical products sold in the country. The aim is to provide consumers with clear information about the efficiency of a range of appliances and equipment, and to offer a metric for product comparison. Following the lead of other Latin American countries which have implemented labeling practices, the program requires International Organization for Standardization test procedures to be used. Labeling is mandatory for incandescent and compact fluorescent light bulbs, as well as certain appliances such as refrigerators, microwaves, air conditioning units, and televisions.5
taking initiative on energy efficiency
iNdusTRial eNeRgy effiCieNCy
buildiNg eNeRgy effiCieNCy

16 the road to namas 17chile
conservation. This outreach complemented Chile’s other efforts and helped to reduce the nation’s energy intensity while sustaining economic growth. In 2008, net energy demand in the grid serving 93 percent of the population declined by 1.2 percent despite economic growth of 3.2 percent.22
Over the next decade, Chile plans to continue pursuing energy efficiency successes by introducing stronger regulations and new financial mechanisms to expand credit access. The country is developing regulations on minimum energy performance standards for appliances. Chile is also looking to expand credit access for energy efficiency measures by partnering with the Global Environment Facility to implement a partial credit guarantee program. This program will overcome financial barriers by reducing the risk of lending to energy service companies through guaranteeing payments in the event of a loan default.
light up good energy: Through this initiative, Chile purchased and distributed compact fluorescent light bulbs (CFLs) to residents within the most vulnerable 40 percent of the population. Purchases were made through the state procurement agency, ChileCompra.6 The CFLs, which are up to five times more efficient than traditional incandescent bulbs, allow families to save up to 25 percent on their monthly electricity bills.7 The program commenced in 2008 with the distribution of 1.5 million CFLs, and was extended in 2009 through early 2010 with the distribution of an additional 1.4 million CFLs. Over its duration, Light up Good Energy resulted in the distribution of 2.9 million CFLs at a total cost of USD 8.8 million.8
subsidy on electric Motors: Chile’s industrial and mining sectors account for about 38 percent of primary energy consumption in the country.9 These sectors, particularly the mining industry, are heavily dependent on small motors to generate on-site power for various tasks. In 2009, Chile initiated a program to encourage the replacement of traditional motors with higher-efficiency motors, which are up to 12 percent more energy efficient.10 The program, which ran through 2010 and had a total budget of USD 2.5 million, subsidized the purchase of efficient electric motors at a rate which attempted to match their cost with the cost of purchasing a standard motor.11,12 The subsidy, which was available to efficient motors ranging from 1 to 10 horsepower, resulted in the replacement of over 5,000 motors in 2009 and 2010.13,14
Pre-investment in energy efficiency: In 2006, Chile launched a program to facilitate the implementation of energy efficiency measures in the private sector, particularly small and medium sized enterprises. It works towards this goal by providing technical and financial assistance to these firms to help them minimize their energy consumption. Financial assistance is provided through a direct subsidy for consulting services, which are used to assess potential energy savings, create implementation plans, and conduct financial analyses for energy efficiency measures. Companies with annual net sales up to USD 33 million are eligible for support, with the condition that services are carried out by an accredited consultant. The program covers up to 70 percent of the total consultation costs, up to a maximum of USD 10,000.15 From the launch of this program through December 2009, 154 contracts were approved, of which 110 had completed their final report.16
energy efficiency Credit line: In 2008, a new credit line was introduced with resources provided by the Chilean Economic Development Agency and the German development bank KfW, with a goal to finance energy efficiency measures in businesses. The credit line is available to a variety of sectors and can be used to finance a range of projects, including procurement of machinery and equipment, construction, and engineering and assembly services.17 Credit is disbursed through commercial banks with a maximum of USD 1 million, provided at a preferential fixed interest rate with payment terms of two to 12 years and grace periods of up to 18 months.18 Chile’s energy efficiency credit line supports companies, production cooperatives, and associations with annual net sales up to USD 33 million.19
eNeRgy effiCieNCy gaiNs
Chile has received international praise for its efforts to improve energy efficiency. In 2010, the Alliance to Save Energy, a leading nonprofit organization that promotes energy efficiency worldwide, honored Chile with its EE Visionary Award, which showcases the world’s best practices in energy efficiency policy and implementation.20
From 2005 to 2011, Chile consistently reduced its energy intensity, achieving a reduction of over 10 percent, as shown in Figure 1.21 Chile’s achievements were possible because of the high level of support for energy efficiency from the public as well as political leaders. Several public education and awareness campaigns by the Chilean government highlighted the importance of energy efficiency and
1990 1991 1992 1993 1994 1995 1996 1997 1998 1999 2000 2001 2002 2003 2004 2005 2006 2007 2008 2009 2010 2011
0.160
0.150
0.140
0.130
0.120
0.1 10
0.100
0.1
56
0.1
48
0.1
43
0.1
37
0.1
39
0.1
36
0.1
40 0.1
48
0.1
48
0.1
59
0.1
53
0.1
45
0.1
47
0.1
43
0.1
44
0.1
40
0.1
36
0.1
31
0.1
30
0.1
30
0.1
24
0.1
25
figure 1: Chile energy intensity 1990–2011
Source: Enerdata. “Global Energy Statistical Yearbook 2012.”
*US dollars at constant exchange rate, price and purchasing power parities of the year 2005
kto
e p
er
un
it o
f G
dp
(u
Sd
20
05
*)

18 the road to namas 19chile
RefeReNCes
Chilean Energy Efficiency Agency. “About Program.” Web. September 2012. <http://www.acee.cl/576/propertyvalue-13094.html>
International Energy Agency. 2009. “Chile Energy Policy Review: 2009.” Web. September 2012. <http://www.iea.org/textbase/nppdf/free/2009/chile2009.pdf>
Lutz, Wolfgang et al. July 2011. “The National Energy Efficiency Standards and Labeling Program of Chile.” CLASP and LBNL. Web. September 2012. <http://www.scribd.com/doc/92222448/National-EE-S-L-Program-of-Chile-Review>
eNdNoTes
1 Chilean Energy Efficiency Agency. “About Program.” Web. September 2012. <http://www.acee.cl/576/propertyvalue-13094.html>
2 International Energy Agency. 2009. “Chile Energy Policy Review: 2009.” Web. September 2012. <http://www.iea.org/textbase/nppdf/free/2009/chile2009.pdf>
3 Mellado, Pamela M. “Public Buildings Energy Efficiency Program (PEEEP) National Agency for Energy Efficicency.” Chilean Energy Efficiency Agency. Web. September 2012. <http://www.jiko-bmu.de/files/basisinformationen/application/pdf/11-pamela_mellado,_chile.pdf>
4 Ministry of Energy, Chile. February 2012. “National Energy Strategy 2012-2020.” Web. September 2012. <http://pds.kallman.com/shows/iftenergy_2012/pdfs/Energy-for-the-Future-Chile’s-National-Energy-Strategy-2012-2030-English.pdf>
5 Lutz, Wolfgang et al. July 2011. “The National Energy Efficiency Standards and Labeling Program of Chile.” CLASP and LBNL. Web. September 2012. <http://www.scribd.com/doc/92222448/National-EE-S-L-Program-of-Chile-Review>
6 Ibid.
7 Ibid.
8 Institute of Energy Economics, Japan. “Compendium of Energy Efficiency Policies of APEC Economies.” Web. September 2012. <http://www.ieej.or.jp/aperc/CEEP/Chile.pdf>
9 Asia-Pacific Economic Cooperation. April 14, 2009. “Peer Review on Energy Efficiency in Chile – Final Report.” Web. September 2012. <http://www.ieej.or.jp/aperc/PREE/PREE_Chile.pdf>
10 Institute of Energy Economics, Japan, op cit.
11 Lutz, Wolfgang et al, 2005, op cit.
12 Cancino, Paola Andrea Martínez. April 2010. “Análisis del Recambio de Refrigeradores Energéticamente Eficientes como Medida de Eficiencia Energética y Propuestas de Implementación.” Universidad de Chile. Web. September 2012. <http://www.tesis.uchile.cl/tesis/uchile/2010/cf-martinez_pc/pdfAmont/cf-martinez_pc.pdf>
13 Chilean Energy Efficiency Agency. “Incentivo a la introducción de motores eléctricos eficientes en la industria: ‘Usa motores eficientes’.” Web. September 2012. <http://www.acee.cl/576/article-58878.html>
14 Institute of Energy Economics, Japan, op cit.
15 Chilean Energy Efficiency Agency. “Programa de Preinversión en Eficiencia Energética.” Web. September 2012. <http://www.acee.cl/576/article-59194.html>
16 Global Environment Fund. October 2010. “Request for CEO endorsement/approval. GEFSEC Project ID: 4176.” Web. October 2012. <http://www.thegef.org/gef/sites/thegef.org/files/documents/document/11-04-2010-ID4176%20Council%20doument.pdf>
17 Chilean Energy Efficiency Agency. “Crédito CORFO Eficiencia Energética.” Web. October 2012. <http://www.acee.cl/576/article-59200.html>
18 Global Environment Fund, 2010, op cit.
19 Ibid.
20 Alliance to Save Energy. May 6, 2010. “International Energy Efficiency ‘Visionaries’ from Four Continents to Be Honored May 11 at EE Global Forum.” Alliance to Save Energy. Web. October 2012. <http://ase.org/news/international-energy-efficiency-%E2%80%98visionaries%E2%80%99-four-continents-be-honored-may-11-ee-global-forum>
21 Enerdata. “Global Energy Statistical Yearbook 2012.” Web. October 2012. <http://yearbook.enerdata.net/#/energy-intensity-GDP-by-region.html>
22 Maxwell, Amanda. 2010. “At the EE Global Forum, ASE Prize Highlights Chile’s Efficiency Achievements.” Switchboard, May 13, 2010. Web. October 2012. <http://switchboard.nrdc.org/blogs/amaxwell/at_the_ee_global_forum_ase_pri.html>
figure references
figure 1: Chile energy intensity 1990–2011Enerdata. “Global Energy Statistical Yearbook 2012.” Web. October 2012. <http://yearbook.enerdata.net/#/energy-intensity-GDP-by-region.html>
iNdusTRial eNeRgy effiCieNCy
Due to its rapid economic growth, China’s burgeoning energy demand has created significant challenges to its energy security and sustainable development. In the face of this dual challenge, leaders have emphasized energy efficiency as a top priority for the country. From 1980 to 2000, China reduced its energy intensity, as measured by energy use per unit of gross domestic product, by an average rate of about 5 percent per year.1 It achieved these results mainly through subsidies and regulations geared toward its substantial industrial sector.2 However, by the early 2000s this trend had reversed due to a number of factors, including: rising domestic energy consumption; a rapid increase in the production and export of energy-intensive goods; and an expansion in construction.
China worked to increase private sector investment in energy efficiency, but had limited success because financial institutions lacked experience in dealing with energy efficiency projects. Lending decisions were based mostly on the value of
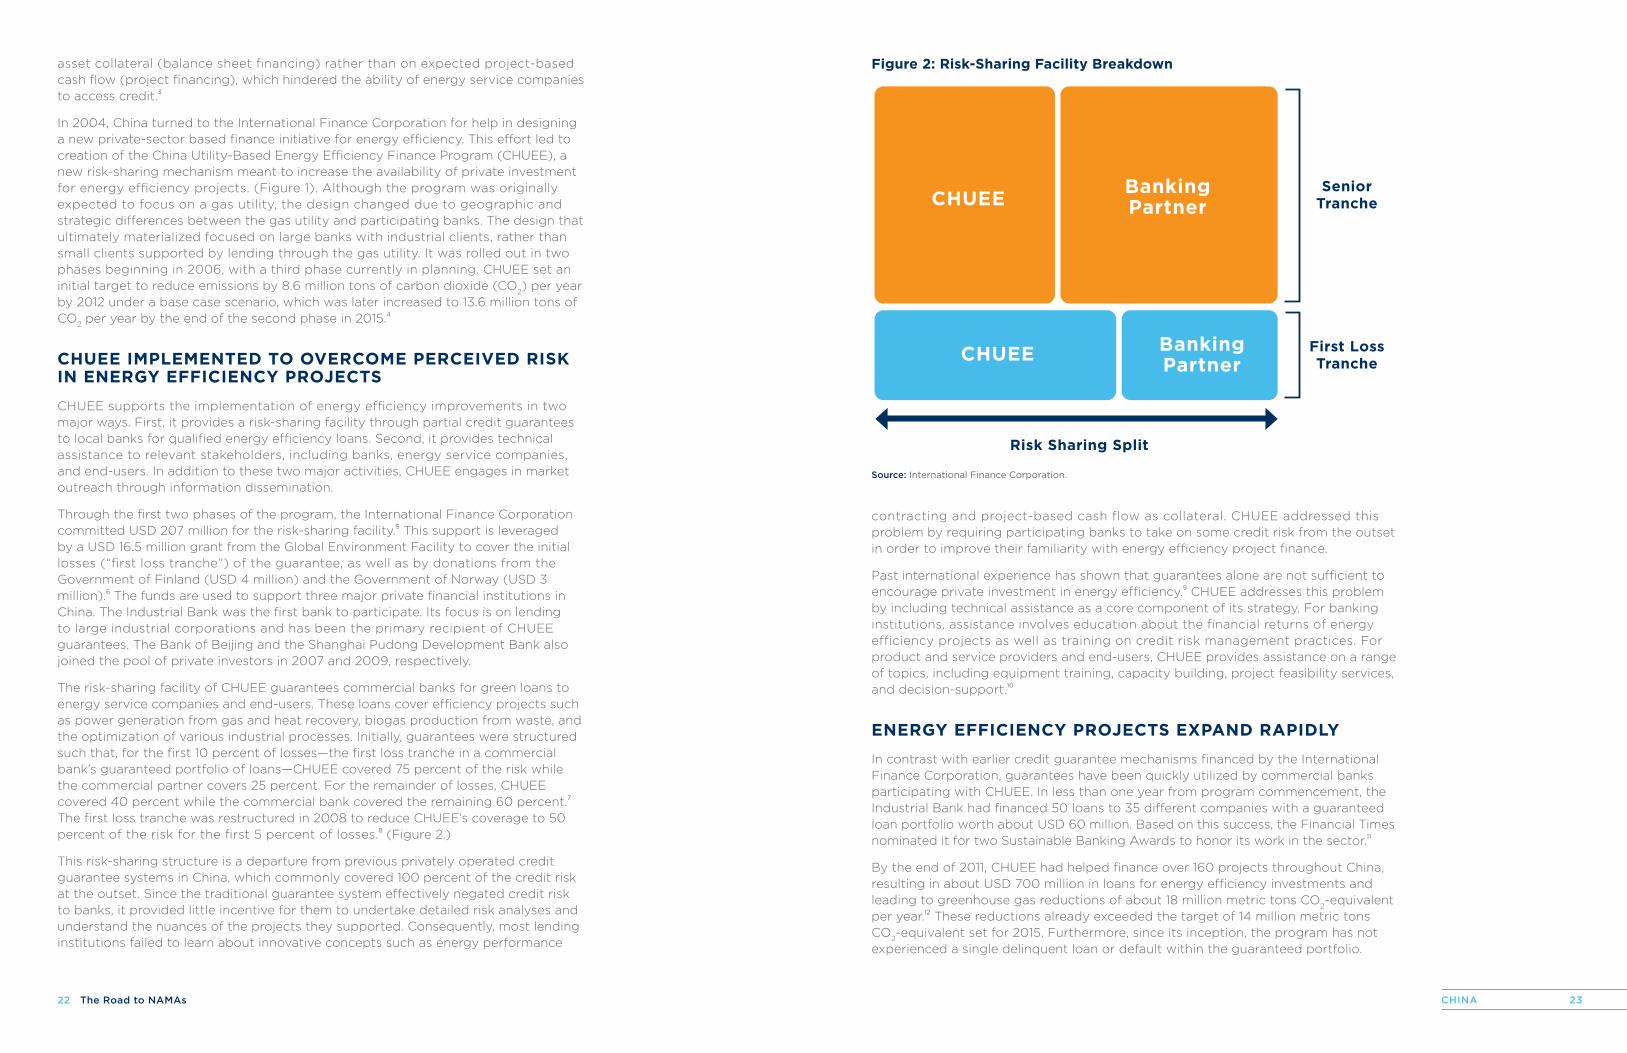
figure 1: Chuee Program design
ESCOs,Utilities,Vendors
Banks
CHUEE
IndustrialEnergy Users
Equipment andEngineering Services
TechnicalAssistance
TechnicalAssistance
Loan Guarantees andTechnical Assistance
Loans
Loans
CorporateAgreements
Source: Independent Evaluation Group, World Bank.
21chinachinaexpanding access to energy efficiency finance through the use of credit Guarantees
china develops a market for energy efficiency
gReeN loaNs To iNdusTRial ClieNTs
22 the road to namas 23china
asset collateral (balance sheet financing) rather than on expected project-based cash flow (project financing), which hindered the ability of energy service companies to access credit.3
In 2004, China turned to the International Finance Corporation for help in designing a new private-sector based finance initiative for energy efficiency. This effort led to creation of the China Utility-Based Energy Efficiency Finance Program (CHUEE), a new risk-sharing mechanism meant to increase the availability of private investment for energy efficiency projects. (Figure 1). Although the program was originally expected to focus on a gas utility, the design changed due to geographic and strategic differences between the gas utility and participating banks. The design that ultimately materialized focused on large banks with industrial clients, rather than small clients supported by lending through the gas utility. It was rolled out in two phases beginning in 2006, with a third phase currently in planning. CHUEE set an initial target to reduce emissions by 8.6 million tons of carbon dioxide (CO
2) per year
by 2012 under a base case scenario, which was later increased to 13.6 million tons of CO
2 per year by the end of the second phase in 2015.4
Chuee iMPleMeNTed To oveRCoMe PeRCeived Risk iN eNeRgy effiCieNCy PRojeCTs
CHUEE supports the implementation of energy efficiency improvements in two major ways. First, it provides a risk-sharing facility through partial credit guarantees to local banks for qualified energy efficiency loans. Second, it provides technical assistance to relevant stakeholders, including banks, energy service companies, and end-users. In addition to these two major activities, CHUEE engages in market outreach through information dissemination.
Through the first two phases of the program, the International Finance Corporation committed USD 207 million for the risk-sharing facility.5 This support is leveraged by a USD 16.5 million grant from the Global Environment Facility to cover the initial losses (“first loss tranche”) of the guarantee, as well as by donations from the Government of Finland (USD 4 million) and the Government of Norway (USD 3 million).6 The funds are used to support three major private financial institutions in China. The Industrial Bank was the first bank to participate. Its focus is on lending to large industrial corporations and has been the primary recipient of CHUEE guarantees. The Bank of Beijing and the Shanghai Pudong Development Bank also joined the pool of private investors in 2007 and 2009, respectively.
The risk-sharing facility of CHUEE guarantees commercial banks for green loans to energy service companies and end-users. These loans cover efficiency projects such as power generation from gas and heat recovery, biogas production from waste, and the optimization of various industrial processes. Initially, guarantees were structured such that, for the first 10 percent of losses—the first loss tranche in a commercial bank’s guaranteed portfolio of loans—CHUEE covered 75 percent of the risk while the commercial partner covers 25 percent. For the remainder of losses, CHUEE covered 40 percent while the commercial bank covered the remaining 60 percent.7 The first loss tranche was restructured in 2008 to reduce CHUEE’s coverage to 50 percent of the risk for the first 5 percent of losses.8 (Figure 2.)
This risk-sharing structure is a departure from previous privately operated credit guarantee systems in China, which commonly covered 100 percent of the credit risk at the outset. Since the traditional guarantee system effectively negated credit risk to banks, it provided little incentive for them to undertake detailed risk analyses and understand the nuances of the projects they supported. Consequently, most lending institutions failed to learn about innovative concepts such as energy performance
contracting and project-based cash flow as collateral. CHUEE addressed this problem by requiring participating banks to take on some credit risk from the outset in order to improve their familiarity with energy efficiency project finance.
Past international experience has shown that guarantees alone are not sufficient to encourage private investment in energy efficiency.9 CHUEE addresses this problem by including technical assistance as a core component of its strategy. For banking institutions, assistance involves education about the financial returns of energy efficiency projects as well as training on credit risk management practices. For product and service providers and end-users, CHUEE provides assistance on a range of topics, including equipment training, capacity building, project feasibility services, and decision-support.10
eNeRgy effiCieNCy PRojeCTs exPaNd RaPidly
In contrast with earlier credit guarantee mechanisms financed by the International Finance Corporation, guarantees have been quickly utilized by commercial banks participating with CHUEE. In less than one year from program commencement, the Industrial Bank had financed 50 loans to 35 different companies with a guaranteed loan portfolio worth about USD 60 million. Based on this success, the Financial Times nominated it for two Sustainable Banking Awards to honor its work in the sector.11
By the end of 2011, CHUEE had helped finance over 160 projects throughout China, resulting in about USD 700 million in loans for energy efficiency investments and leading to greenhouse gas reductions of about 18 million metric tons CO
2-equivalent
per year.12 These reductions already exceeded the target of 14 million metric tons CO
2-equivalent set for 2015. Furthermore, since its inception, the program has not
experienced a single delinquent loan or default within the guaranteed portfolio.
figure 2: Risk-sharing facility breakdown
Source: International Finance Corporation.
SeniorTranche
First LossTranche
Risk Sharing Split
CHUEEBankingPartner
CHUEE BankingPartner

24 the road to namas 25china
In addition to the CHUEE program, other government policies supporting energy efficiency measures also contributed to the rapid uptake of energy efficiency projects in China. For example, China’s state-owned banks provide direct loans for energy efficiency projects to large state-owned enterprises and public banks were banned from lending to the steel and cement industry unless the loans were for energy efficiency projects.13 These policies led to a surge of lending by the public sector banks for energy efficiency.
Despite the success of CHUEE, the program has received some criticism for failing to accommodate small to medium-sized enterprises, as had originally been intended. Although the program envisioned that over half of the loans would be in the USD 200,000 range, by 2010 these loans only accounted for about 10 percent of the total, and the actual average loan size was USD 5.7 million.14 Small to medium-sized enterprises continue to present challenges to private investors due to higher transaction costs and higher risks compared to larger firms. However, the newest phase of CHUEE is addressing this problem by developing innovative mechanisms geared towards local financial institutions with larger shares of small to medium-sized clients. These mechanisms may involve non-traditional financial partners, such as large energy service companies or property developers, which could play a role in sharing first loss risks.
CHUEE has been a valuable program to help private banks develop the institutional capacity for energy efficiency lending. In particular, a World Bank study found that private banks involved in the program became much more likely to accept project-finance based collateral than non-participating banks. Furthermore, loans with CHUEE backing had longer maturities on average than loans without backing.15 The CHUEE model has since been replicated in the Philippines, and there are new efforts to expand the mechanism to promote water savings in addition to energy efficiency.16
RefeReNCes
International Finance Corporation. “China Utility-Based Energy Efficiency Finance Program (CHUEE): Frequently Asked Questions.” Web. October 2012. <http://www1.ifc.org/wps/wcm/connect/regprojects_ext_content/ifc_external_corporate_site/home_chuee/about+us/faqs/faqs?RSF>
Independent Evaluation Group, World Bank. 2010. “Assessing the Impact of IFC’s China Utility-based Energy Efficiency Finance Program.” Web. October 2012. <https://openknowledge.worldbank.org/bitstream/handle/10986/2480/555490PUB0Ener1EPI1992912801PUBLIC1.pdf?sequence=1>
eNdNoTes
1 Wang Can and Lu Xuedu. “Mitigation potentials in China and perspectives on cooperation opportunities.” Tsinghua University presentation, Dialogue on Future International Actions to Address Global Climate Change and Clean Development Mechanism . Paris, France, April 19-22, 2006. Web. October 2012. <http://www.ccap.org/docs/resources/266/Can_Xuedu-China_Mitigation_potential_and_cooperation_opportunities-Joint_Dialogue.pdf>
2 Independent Evaluation Group, World Bank. 2010. “Assessing the Impact of IFC’s China Utility-based Energy Efficiency Finance Program.” Web. October 2012. <https://openknowledge.worldbank.org/bitstream/handle/10986/2480/555490PUB0Ener1EPI1992912801PUBLIC1.pdf?sequence=1>
3 Ellis, Jennifer. May 2010. “Energy Service Companies (ESCOs) in Developing Countries.” International Institute for Sustainable Development. Web. October 2012. <http://www.iisd.org/pdf/2009/bali_2_copenhagen_escos.pdf>
4 Independent Evaluation Group, World Bank, 2010, op cit.
5 Ibid.
6 International Finance Corporation. “Cooperation Agreement on CHUEE II with Norad Signed in Beijing.” Web. October 2012. <http://www1.ifc.org/wps/wcm/connect/regprojects_ext_content/ifc_external_corporate_site/home_chuee/news/events/event7>
7 Institute for Industrial Productivity. “China Utility-Based Energy Efficiency Finance Program (CHUEE).” Web. October 2012. <http://www.iipnetwork.org/sites/iipnetwork.org/files/file_attachments/resources/IIP-11.%20FinanceCaseStudyA.pdf>
8 Independent Evaluation Group, World Bank, 2010, op cit.
9 Ibid.
10 International Finance Corporation. “China Utility-Based Energy Efficiency Finance Program (CHUEE): Frequently Asked Questions.” Web. October 2012. <http://www1.ifc.org/wps/wcm/connect/regprojects_ext_content/ifc_external_corporate_site/home_chuee/about+us/faqs/faqs?RSF>
11 International Finance Corporation. “China Utility-based Energy Efficiency Finance Program (CHUEE): One Finance Solution to Climate Change.” Web. October 2012. <http://www.nengyuanguanli.com/uploadFiles/files/201001/UPFI201001060932485776.pdf>
12 International Finance Corporation. “China Utility-based EnergyEfficiency Finance Program (CHUEE).”Web. October 2012. <http://www1.ifc.org/wps/wcm/connect/0f680e004a9ad992af9fff9e0dc67fc6/Chuee+brochure-English-A4.pdf?MOD=AJPERES>
13 Independent Evaluation Group, World Bank, 2010, op cit.
14 Ibid.
15 Ibid.
16 Ibid.
figure references
figure 1: Chuee Program designIndependent Evaluation Group, World Bank. 2010. “Assessing the Impact of IFC’s China Utility-based Energy Efficiency Finance Program.” Web. October 2012. <https://openknowledge.worldbank.org/bitstream/handle/10986/2480/555490PUB0Ener1EPI1992912801PUBLIC1.pdf?sequence=1>
figure 2: Risk-sharing facility breakdownInternational Finance Corporation. “China Utility-based Energy Efficiency Finance Program (CHUEE): One Finance Solution to Climate Change.” Web. October 2012. <http://www.nengyuanguanli.com/uploadFiles/files/201001/UPFI201001060932485776.pdf>

27colombiacolombia
TRaNsPoRT
rapid transit and routes for human-powered transportation are key to addressing traffic congestion in bogotá, colombia
sTeeRiNg CleaR of CoNgesTioN
Bogotá’s bus rapid transit system and network of non-motorized transport infrastructure has become the exemplar for nations grappling with congested roadways, growing urban populations, and rising transport-related greenhouse gas emissions. Centered around the TransMilenio Bus Rapid Transit, the city’s multimodal transit system and innovative policies have made inroads in reducing traffic congestion, accidents, crime, and air pollution. For example, before TransMilenio, commutes averaged 1.5 hours in each direction, with private vehicles accounting for less than one-fifth of trips yet occupying 95 percent of roads.1 Now, average commute times in Bogotá have been cut by 20 minutes, air quality has improved by 40 percent, and accidents have decreased by 79 percent.2,3 While problems still exist, such as crime and traffic congestion, Bogotá remains a commonly cited success story of comprehensive transportation planning.
In the early 1990’s, Bogotá Mayor Antanas Mockus initiated a Citizen Culture campaign with the intention of changing public behavior towards community and civility. Using unorthodox techniques such as mimes, Mockus was able alter how residents viewed the relationship between motor vehicles and pedestrians, thereby laying the foundation for investment in a pioneering public transport system. The subsequent administration, led by Mayor Enrique Peñalosa, responded to the transit crisis with a Mobility Strategy that prioritized public transit and non-motorized transport modes, reduced private vehicle use, and induced a
behavioral shift towards the use of alternative transport options. The national government has since built upon Bogotá’s success by expanding comprehensively planned transit systems to eight other cities. Colombia is also considering implementing a Sustainable Urban Development Nationally Appropriate Mitigation Action (NAMA) to focus real estate development
reducing traffic congestion in bogotá through bus rapid transit and non-motorized transport
TransMilenio station and express lanes

28 the road to namas 29colombia
through local fuel taxes (46 percent), national government grants (20 percent), a World Bank loan (6 percent) and other local funds (28 percent).6 Phase II cost USD 545 million (USD 13 million per km) and was financed through the national government (66 percent) and a local fuel surcharge (34 percent).7 Unlike many public transport systems, the TransMilenio does not receive any operational subsidies. Bogotá is also moving forward with its first metro rail system; funding has been approved by the World Bank and detailed engineering studies have begun.
Finally, Bogotá implemented an education campaign to generate awareness and demand for the new system. Partially funded by a private bank, the city held community and business meetings, advertisements and events, and offered three weeks of free service on the TransMilenio.
easiNg The CoMMuTe, ReduCiNg gReeNhouse gases
The Mobility Strategy has successfully shifted residents to non-motorized and public transportation. At a cost of USD 147,000 per km, the bicycle routes are utilized by 200,000 to 285,000 people per day, quadrupling bike ridership since their inception.8,9 In addition, over one million riders are estimated to use the temporary bike paths each weekend.10 Car restrictions coupled with easy access to transport alternatives have caused 9 percent of car owners to shift to public transport. Before the TransMilenio, buses traveled at average speeds of 17 km per hour, with some corridors below five km per hour. Bogotá’s policies increased average bus speed to 26 km per hour, reducing the average commute time by 32 percent (20 minutes). Of Bogotá’s 8.5 million residents, the TransMilenio moves 47,000 passengers per hour per direction, or over 1.5 million riders each day.11,12
One of the most significant challenges in implementing the Bus Rapid Transit system was resistance from existing bus operators who feared loss of business and hesitated to use new processes such as awarding concessions through open bidding. They were also concerned about financial risks from investments in a new fleet and government capacity to build planned infrastructure and eliminate current operators. These challenges were overcome by prioritizing existing operators in the bidding process, establishing a fund to offset negative impacts to the operators, and including these companies in a dialogue with the city during the planning and implementation phases.13
around high-quality transit systems supported by pedestrian-accessible land use. The NAMA would create a framework to overcome financial and procedural barriers to transit-oriented development with pilot launches in two Colombian cities and national policy and capacity-building to expand sustainable urban development in cities across Colombia.
huMaN PoweRed aNd CaR-fRee
Bogotá implemented four notable projects to promote non-motorized mobility. The city built a 344 km city-wide network of bicycle routes for daily commuting. On Sundays and holidays, the government also closes 121 km of roads to create temporary bike paths for recreational use from 7 am to 2 pm. A citizen ballot consultation on vehicle use lead to the establishment of an annual Car Free Day the first Thursday of every February, during which private vehicle use is prohibited across the city. Walking is an important mode of transportation for many—especially the urban poor—thus the city created a 17 km pedestrian corridor that connects low-income neighborhoods with commercial and business districts.
To reduce the use of private vehicles, Bogotá created a roadway restriction based on license plate numbers. Vehicles with license plates ending in odd numbers are prohibited from using roadways on odd-numbered days, and those with plates ending in even numbers are prohibited from using roadways on even-numbered days. The restriction is in effect during morning and evening weekday commuting hours.4
The keystone of Bogotá’s Mobility Strategy is the TransMilenio Bus Rapid Transit system. The TransMilenio operates 87 km of trunk corridors that receive passengers from an integrated feeder system. The system increased efficiency through pre-boarding automated fare collection, free transfers, raised platforms for quick boarding and exiting, high occupancy vehicles (160 to 260 passengers), segregated bus lanes, and express routes. A single fare cross-subsidizes the poor, who often live on the city periphery. All buses comply with Euro II emission standards and are equipped with GPS that allows a centralized management system to respond in real-time to contingencies and re-route buses to meet demand. Pedestrian and bike pathways are integrated into the system, with free bike parking available at many terminals.
TransMilenio is a public-private partnership. The government entity TransMilenio S.A. is comprised of technical experts and was created specifically to plan, manage, and control the Bus Rapid Transit system. A consolidated management structure allows companies to compete through an open bidding process for concessions to supply and operate the bus fleet and the fare collection and validation system. Infrastructure costs are paid for by the city and national government, and operational costs are assumed by the private sector. The government retains control over the operation schedule, thereby shifting demand risk to the private sector.
Phase I of the TransMilenio became operational in 2001. Phase II came on-line in 2006, and became the first transportation project to receive approval as a Clean Development Mechanism. To meet monitoring, reporting and verification requirements, a special unit under the supervision of TransMilenio S.A. collects, reports, and stores all data. Passenger surveys supply information on prior transport mode, fuel type, and fuel efficiency to determine emissions abatement through modal shifts.
Ultimately, Bogotá expects to build a total of 388 km of corridors at a cost of USD 5 million per km.5 Phase I and II are complete and Phase III, which will extend the corridors an additional 36 km, is currently under construction. Phase I of the TransMilenio cost USD 240 million (USD 5.9 million per km) and was financed
Temporary weekend bike Paths

30 the road to namas 31colombia
eNdNoTes
1 Martinez, Astrid. “Energy Efficiency in Massive Public Transport Systems —Transmilenio: A Study Case.” Presentation at the UN Forum on Energy Efficiency and Energy Security, December 18, 2007. Web. August 2012. <http://www.un.org/esa/sustdev/sdissues/energy/op/forum_dec07/presentations/S51_ortiz.pdf>
2 Center for Clean Air Policy. January 2012. “Case Study: Colombia’s Bus Rapid Transit Development and Expansion.” Web. August 2012. <http://www.ccap.org/docs/resources/1080/Colombia-case%20study-final.pdf>
3 United Nations Development Program. “Bogotá, Colombia Bus Rapid Transit Project—TransMilenio Case Study.” Web. August 2012. <http://www.ncppp.org/undp/bogota.html>
4 City Government of Bogotá, Colombia. Pico y Placa website. Web. July 25, 2012. <http://www.movilidadbogota.gov.co/?sec=410>
5 United Nations Framework Convention on Climate Change. October 3, 2012. “Clean Development Mechanism Project Design Document—Bogotá, Colombia: TransMilenio Phase II to IV v5.4.” Web. October 2012. <http://cdm.unfccc.int/Projects/DB/DNV-CUK1159192623.07/view >
6 U.S. Department of Transportation. 2006. “Applicability of Bogotá’s TransMilenio BRT System to the United States.” Web. October 2012. <http://www.fta.dot.gov/documents/Bogota_Report_Final_Report_May_2006.pdf>
7 Ibid.
8 NYC Global Partners. May 4, 2011. “Best Practice: Largest Bicycle Path Network.” Web. September 2012. <http://www.nyc.gov/html/unccp/gprb/downloads/pdf/Bogota_CycleRoute.pdf>
9 City Government of Bogotá, Colombia. Web. July 30, 2012. <http://www.movilidadbogota.gov.co/?sec=71>
10 City Government of Bogotá. Web. July 26, 2012. <http://www.bogota.gov.co/portel/libreria/php/frame_detalle_scv.php?h_id=24777>
11 Penalosa, Enrique. “Equity and Mobility.” New Statesman. February 23, 2012. Web. August 2012. <http://www.newstatesman.com/transport/2012/02/mobility-cars-city-bus-cities>
12 City Government of Bogotá, Colombia. Transmilenio website. Web. July 26, 2012. <http://www.transmilenio.gov.co/WebSite/Contenido.aspx?ID=TransmilenioSA_TransmilenioEnCifras_EstadisticasGenerales>
13 Center for Clean Air Policy, 2012, op cit.
14 TransMilenio, S.A. February 2012. “Informe de Gestión 2011.” Web. August 2012. <http://www.transmilenio.gov.co/AdmContenidoUpload/administrador.contenido/Documents/Informe%20de%20Gesti%C3%B3n%202011.pdf>
15 Center for Clean Air Policy. January 14, 2010. “Transportation NAMAs: A Proposed Framework.” Web. August 2012. <http://ccap.org/docs/resources/924/CCAP_Transport_NAMA.pdf>
16 Rosenthal, Elisabeth. “Buses May Aid Climate Battle in Poor Cities.” New York Times, July 9, 2009. Web. August 2012. <http://www.nytimes.com/2009/07/10/world/americas/10degrees.html?_r=2>
17 United Nations Development Program, op cit.
18 Ibid.
19 The World Bank. 2010. “From Chaos to Order: Implementing High-Capacity Urban Transport Systems in Colombia.” Web. August 2012. <http://siteresources.worldbank.org/NEWS/Resources/Colombia_mass_transit_4-23-10.pdf>
figure references
figure 1: benefits achieved by bogotá’s Mobility strategyAdapted from the United Nations Development Program, the World Bank, and the City Government of Bogotá, Colombia.
The TransMilenio’s impact on emissions has been significant: from 2001 to 2010, the Bus Rapid Transit system abated 1.9 million metric tons of CO
2-equivalent, with
an annual average of 144,000 tons under Phase I alone (2001-2005) and 236,000 tons under Phases I and II combined (2006-2010).14 This greenhouse gas estimate is likely conservative due to multiplier effects from transit-oriented development that enhance non-motorized transport and reduce trip lengths.15 Moving forward, Colombia is pursuing a national sustainable urban development policy and NAMA to further amplify these benefits.
By 2009, Bogotá was able to decommission 7,000 small private buses from its roads, reducing the use of bus fuel by more than 59 percent.16 According to the United Nations Development Program, the system has reduced air pollutants by 40 percent; and decreased fatalities by 92 percent, injuries by 75 percent, and collisions by 79 percent along its trunk lines.17 Robberies at traffic stops have also been reduced by 83 percent.18 The Bus Rapid Transit system has successfully formalized a portion of the transport sector by awarding contracts for the operation of the TransMilenio fleet and related services to select, legal companies; and integrating bus operators and drivers from the informal sector into the new system. This has resulted in shorter work days for bus drivers, from 14 to 8 hours; the provision of social security benefits for employees; and securing tax contributions from bus operators.19 Other co-benefits include temporary jobs created by infrastructure development, a 15 to 20 percent increase in property values along the main trunk route, improved health outcomes from clean air and exercise, and overall improved quality of life.
RefeReNCes
Hidalgo, Dario and Graftieaux, Pierre. “A Critical Look at Major Bus Improvements in Latin America and Asia: Case Study TransMilenio, Bogotá, Colombia.” World Bank. Web. August 2012. <http://siteresources.worldbank.org/INTURBANTRANSPORT/Resources/Hidalgo-Graftieaux-BOGOTA.pdf>
Deutsche Gesellschaft für Internationale Zusammenarbeit (GIZ). May 2007. “The CDM in the Transport Sector—Sustainable Transport: A Sourcebook for Policy-makers in Developing Cities.” Web. August 2012. <https://www.giz.de/Themen/en/SID-9DEECDB1-4ECE4077/dokumente/en-cdm-transport-sector-2007.pdf>
Center for Clean Air Policy. January 2012. “Case Study: Colombia’s Bus Rapid Transit Development and Expansion.” Web. August 2012. <http://www.ccap.org/docs/resources/1080/Colombia-case%20study-final.pdf>
Pico y Placa website. <http://www.movilidadbogota.gov.co/?sec=410>
TransMilenio website. <http://www.transmilenio.gov.co/WebSite/Default.aspx>
figure 1: benefits achieved by bogotá’s Mobility strategy
benefitS achieved by boGotá’S mobility StrateGy
• commute times reduced by 32%
• bus driver work days shortened by 6 hours
• air quality improved by 40%
• GhGs reduced by 2 million tonnes co2-equivalent
• bus fuel use reduced by 59%
• collisions along trunk lines decreased by 79%
• fatalities along trunk lines decreased by 92%
• injuries along trunk lines decreased by 75%
• robberies at traffic stops decreased by 83%
• property values along trunk lines increased by 15-20%
• improved health outcomes from reduced pollution and exercise
• overall improved quality of life for residents
Source: Adapted from the United Nations Development Program, the World Bank, and the City Government of Bogotá, Colombia.
33Germany & thailand
Germany &thailand
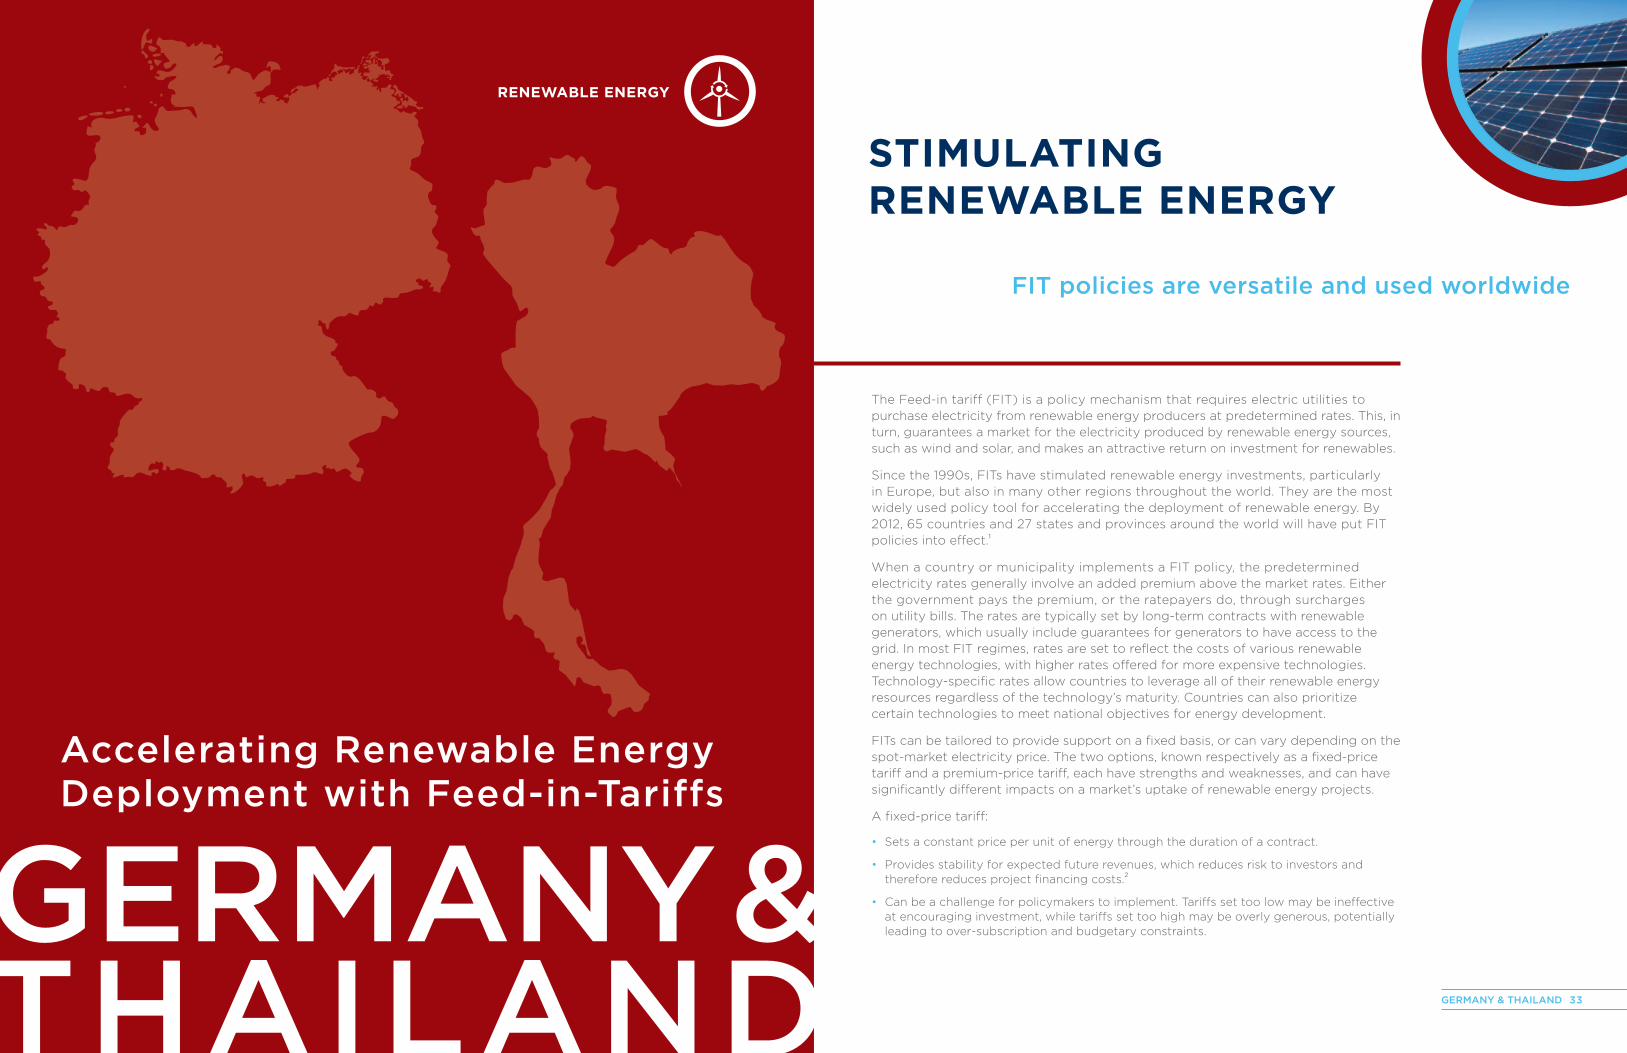
The Feed-in tariff (FIT) is a policy mechanism that requires electric utilities to purchase electricity from renewable energy producers at predetermined rates. This, in turn, guarantees a market for the electricity produced by renewable energy sources, such as wind and solar, and makes an attractive return on investment for renewables.
Since the 1990s, FITs have stimulated renewable energy investments, particularly in Europe, but also in many other regions throughout the world. They are the most widely used policy tool for accelerating the deployment of renewable energy. By 2012, 65 countries and 27 states and provinces around the world will have put FIT policies into effect.1
When a country or municipality implements a FIT policy, the predetermined electricity rates generally involve an added premium above the market rates. Either the government pays the premium, or the ratepayers do, through surcharges on utility bills. The rates are typically set by long-term contracts with renewable generators, which usually include guarantees for generators to have access to the grid. In most FIT regimes, rates are set to reflect the costs of various renewable energy technologies, with higher rates offered for more expensive technologies. Technology-specific rates allow countries to leverage all of their renewable energy resources regardless of the technology’s maturity. Countries can also prioritize certain technologies to meet national objectives for energy development.
FITs can be tailored to provide support on a fixed basis, or can vary depending on the spot-market electricity price. The two options, known respectively as a fixed-price tariff and a premium-price tariff, each have strengths and weaknesses, and can have significantly different impacts on a market’s uptake of renewable energy projects.
A fixed-price tariff:
• Sets a constant price per unit of energy through the duration of a contract.
• Provides stability for expected future revenues, which reduces risk to investors and therefore reduces project financing costs.2
• Can be a challenge for policymakers to implement. Tariffs set too low may be ineffective at encouraging investment, while tariffs set too high may be overly generous, potentially leading to over-subscription and budgetary constraints.
accelerating renewable energy deployment with feed-in-tariffs
ReNewable eNeRgy
fit policies are versatile and used worldwide
sTiMulaTiNg ReNewable eNeRgy

34 the road to namas 35Germany & thailand
reached 91 TWh. (Figure 1). FITs have helped overcome many barriers to renewable energy deployment in Germany, including:7
• A distorted ‘playing field’ due to existing infrastructure and support measures for conventional sources of energy;
• High initial capital costs for renewable technologies;
• Lack of legal framework for independent power producers;
• Difficulty in gaining access to the grid;
• Perceived technology performance uncertainty and risk.
Due to strong growth in electricity generated from renewable sources, the cost of the policy increased from under USD 5 billion in 2004 to approximately USD 20 billion in 2011.8 In 2008, an average German household paid a surcharge of about 5 percent of their total electricity bill. However, the surcharge is expected to decline over the next two decades due to declining costs of renewable technologies coupled with rising prices for conventional energy.9
In 2006, energy producers supported by the German FIT system generated revenue totaling over USD 17 billion, which represented over 60 percent of total domestic renewable energy revenue. From 2004 to 2008, the number of jobs in the German renewable energy industry increased 75 percent, from about 160,000 in 2004 to 280,000 in 2008.10 Furthermore, shifts in electricity generation resulting from the FIT helped reduce greenhouse gas emissions by approximately 70 million metric tons in 2011.11
As the cost of renewable technologies like solar and wind continues to decline, Germany is lowering its FIT rates for new contracts according to a schedule which accounts for their improved competitiveness and declining costs. Due to the rapid uptake of solar power, Germany has further scaled back support in this area. It recently added a maximum size limit of 10 megawatts (MW); changed eligibility such
that only 90 percent of electricity from commercial-scale producers can receive the FIT; and set an overall 52 gigawatt (GW) cap on FIT support for solar power.12,13 Germany also added a new FIT option, which allows renewable energy producers to sell electricity at market prices and receive a variable adder premium in place of a fixed-price tariff. The new option is designed to help renewable energy producers become comfortable with electricity markets and ultimately increase their participation in the wholesale marketplace.
ThailaNd offeRs suPPoRT To sMall PRoduCeRs of ReNewable eNeRgy
A key component of Thailand’s strategy involves incentivizing and removing barriers to renewable generation by small power producers with generation capacities up to 90 MW.14 Thailand supports renewable and non-conventional energy producers with fixed adder rates for electricity generation.15 Energy producers are categorized as Very Small Power Producers with capacities less than 10 MW, and Small Power
A premium-price tariff:
• Sets a price equal to the spot-market electricity price plus an additional premium, known as an ‘adder’.
• Has two basic options for the adder: a fixed adder or a variable adder that depends on the spot-price. A fixed adder is easier to implement; the FIT payments are simply the sum of the spot-market electricity price and the adder. However, fixed adder FITs do not address instability in spot-prices and can result in large swings in project revenue if the market is volatile. A variable adder provides a larger subsidy when the spot-price is low, and tapers off the subsidy when the spot-price increases. Although more complex to implement, this method can create stable investment conditions while ensuring that renewable projects are profitable.
FITs are feasible in a range of political and institutional contexts, and a large number of them have been put into effect around the world. Two countries that showcase the success of FITs in very different circumstances are Germany and Thailand:
germany employs fixed-price tariffs for a range of technologies. FITS are central to its goal of obtaining 35 percent of its electricity from renewable sources by 2020.
Thailand uses a fixed adder tariff to encourage small renewable energy producers. Thailand’s FIT policies support its target to increase the share of renewable energy from about 9 percent of total energy consumption in 2011 to 25 percent in 2021.
In both cases, the goal of the FIT is to remove barriers to investment by improving the competitiveness and cash flow certainty of renewable energy projects. Each country’s approach is discussed in greater detail below.
geRMaNy PioNeeRs NaTioNal fiT PoliCy
Germany implemented the first national FIT policy in Europe in 1991, allowing renewable energy producers to sell their electricity to utilities at a fixed percentage of the retail electricity price. This system was effective at deploying coastal wind and hydropower electricity, but failed to encourage investment in more cutting-edge technologies such as solar generation. To address this problem, Germany shifted to a model based on the actual costs of renewable energy generation rather than a market-based rate. This cost-based framework offers a competitive advantage to a variety of renewable technologies with varying generation capacities, and remains one of the most important elements of successful FIT policies.3
In the German system, rates are set in 20-year contracts to cover the cost of renewable energy production plus a profit of 5 to 7 percent for developers.4 Although utilities pay the developers directly for their power, they pass on the costs of the tariffs to their electricity customers via a surcharge on electricity bills. Therefore, the program remains independent of government budgets and subsidies.
The FIT program in Germany has resulted in a sharp increase in the production of renewable energy, which grew from 3 percent of total energy production in 1990 to 20 percent by the first half of 2011.5 Electricity generation from projects supported by FITs grew from approximately 38.5 terawatt hours (TWh) in 2004 to about 75 TWh in 2009—about 79 percent of all renewable electricity generated that year.6 In 2011 this figure
figure 1: sample Rates under germany fiT Program as of october 2012 (usd/kwh)*
*Rates vary by size of installation. Cited rates do not include special bonuses for project-specific attributes. Conversion rate: 1 EUR = 1.3 USD; from oanda.com on 10/22/2012
Source: Lang, Matthias and U. Mutschler.
hydro 0.04-0.17
biomaSS 0.08-0.19
wind 0.05-0.20
Solar 0.17-0.24
Ge
rm
an
y f
it p
ro
Gr
am
Renewable energy deployment with feed-in-Tariffs

36 the road to namas 37Germany & thailand
RefeReNCes
Couture, T. D., Cory, K., Kreycik, C., & Williams, E. 2010. “A Policymaker’s Guide to Feed-in Tariff Policy Design [Technical Report No. NREL/TP-6A2-44849].” U.S. National Renewable Energy Laboratory.
Fulton, Mark and Reid Capalino. September 2012. “The German Feed-in-Tariff: Recent Policy Changes.” DB Research, Deutsche Bank. <http://www.dbresearch.com/PROD/DBR_INTERNET_EN-PROD/PROD0000000000294376/The+German+Feed-in+Tariff%3A+Recent+Policy+Changes.pdf>
Tongsopit, Sopitsuda and Chris Greacen. “Thailand’s Renewable Energy Policy: FiTs and Opportunities for International Support.” WRI-ADB Workshop on Feed-in Tariffs. Manila, Phillippines, February 21-23, 2012. <http://pdf.wri.org/wri_fair_fit_workshop_presentation_thailand_tongsopit_greacen.pdf>
eNdNoTes
1 Renewable Energy Policy Network for the 21st Century. 2012. “Renewables 2012 Global Status Report. Paris, France: REN21.” Web. October 2012. <http://www.ren21.net/>
2 Cory, Karlynn, Toby Couture and Claire Kreycik. March 2009. “Feed-in Tariff Policy: Design, Implementation, and RPS Policy Interactions.” U.S. National Renewable Energy Laboratory.
3 Couture, T. D., Cory, K., Kreycik, C., & Williams, E. 2010. “A Policymaker’s Guide to Feed-in Tariff Policy Design (Technical Report No. NREL/TP-6A2-44849).” U.S. National Renewable Energy Laboratory.
4 Stokes, Bruce. “What, Exactly, Is a Feed-In Tariff?” National Journal, April 25, 2009. Web. October 2012. <http://www.nationaljournal.com/njmagazine/nj_20090425_3763.php>
5 EU Climate Policy Tracker 2011. Web. October 2012. <http://www.climatepolicytracker.eu/>
6 Bundesministerium fur Umwelt, Naturschutz und Reaktorsicherheit (BMU). 2009. “Electricity from Renewable Energy Sources: What does it cost?” Web. October 2012. <https://www.bmu.de/english/renewable_energy/downloads/publ/36865.php>
7 World Future Council. 2007. “Feed-In Tariffs: Boosting Energy for our Future. A guide to one of the world’s best environmental policies.” Hamburg, Germany: WFC. Web. October 2012. <www.hermannscheer.de/en/images/stories/pdf/WFC_Feed-in_Tariffs_jun07.pdf>
8 Bundesministerium fur Umwelt, Naturschutz und Reaktorsicherheit (BMU). July 2012. “Development of renewable energy sources in Germany 2011.” 2012 Graphics and tables based on statistical data from the Working Group on Renewable Energy-Statistics (AGEE-Stat). Web. October 2012. <http://www.erneuerbare-energien.de/files/english/pdf/application/pdf/ee_in_deutschland_graf_tab_en.pdf>
9 Bundesministerium fur Umwelt, Naturschutz und Reaktorsicherheit (BMU), 2009, op cit.
10 Motl, B. 2011. “Reconciling German-Style Feed-In Tariffs with PURPA.” Wisconsin International Law Journal, 28(4), 742–767.
11 Bundesministerium fur Umwelt, Naturschutz und Reaktorsicherheit (BMU), 2012, op cit.
12 Lang, Matthias and U. Mutschler. “German Feed-in Tariffs 2012.” German Energy Blog. Web. October 19, 2012. <http://www.germanenergyblog.de/?page_id=8617>
13 Fulton, Mark and Reid Capalino. September 2012. “The German Feed-in-Tariff: Recent Policy Changes.” DB Research, Deutsche Bank.Web. October 2012. <http://www.dbresearch.com/PROD/DBR_INTERNET_EN-PROD/PROD0000000000294376/The+German+Feed-in+Tariff%3A+Recent+Policy+Changes.pdf>
14 Ruangrong, P. 2008. “Thailand’s Approach to Promoting Clean Energy in the Electricity Sector.” Paper presented at the Forum on Clean Energy, Good Governance and Regulation, Singapore, March 16-18, 2008. Web. October 2012. <http://electricitygovernance.wri.org/files/egi/Thailand.pdf>
15 Ibid.
16 Tongsopit, Sopitsuda and Chris Greacen. 2012. “Thailand’s Renewable Energy Policy: FiTs and Opportunities for International Support.” WRI-ADB Workshop on Feed-in Tariffs. Manila, Phillippines, February 21-23, 2012. Web. October 2012. <http://pdf.wri.org/wri_fair_fit_workshop_presentation_thailand_tongsopit_greacen.pdf>
17 Palang Thai. 2010. “Feed-in Tariffs and South-South Policy/Technology Transfer: The Evolution and Implementation of Very Small Power Producer (VSPP/SPP).” Regulations in Thailand and Tanzania. Presentation at the Monterey Institute for International Studies, Monterey, California, US, May 8, 2010. Web. October 2012. <http://www.palangthai.org/en/vspp>
18 Wongkot Wongsapai, Assistant Professor, Faculty of Engineering, Department of Mechanical Engineering, Chiang Mai University, personal communication to Catherine Leining on July 3, 2012.
19 Department of Alternative Energy Development and Efficiency, Thailand Ministry of Energy. 2012. “The Renewable and Alternative Energy Development Plan for 25 Percent in 10 Years (AEDP 2012-2021).” Web. September 2012. <http://www.dede.go.th/dede/images/stories/dede_aedp_2012_2021.pdf>
20 Gipe, Paul. “Thailand: 4,300 MW of Renewables with Feed-in Tariffs.” Renewable Energy World, December 7, 2010. Web. September 2012. <http://www.renewableenergyworld.com/rea/news/article/2010/12/thailand-4300-mw-of-renewables-with-feed-in-tariffs>
figure references
figure 1: sample Rates under germany fiT Program as of october 2012 (usd/kwh)Lang, Matthias and U. Mutschler. “German Feed-in Tariffs 2012.” German Energy Blog. Web. October 19, 2012. <http://www.germanenergyblog.de/?page_id=8617>
figure 2: sample Rates under Thailand fiT program as of october 2012 (usd/kwh)Osborne, Christopher. “Thailand’s renewable energy adder rates.” AsianPower, August 8, 2012. Web. October 2012. <http://asian-power.com/power-utility/commentary/thailand%E2%80%99s-renewable-energy-adder-rates>
Producers with capacities from 10 to 90 MW. Very small power producers benefit from streamlined regulations, and may receive higher adder rates if their capacity is below a certain threshold.16 Projects above 10 MW are supported by long-term (5-25 year) power purchase agreements with the Thai government. In these agreements, the government carries the market risk while the producers carry the operating and fuel price risks. Like the German FIT program, the costs are borne mainly by ratepayers, who pay a surcharge on their electricity bills to support the programs.
Tariff rates are set in relation to the ‘avoided cost’ of power, which is the marginal cost to the state electricity provider of producing or purchasing power at market rates. Tariffs apply for 7 to 10 years after the commercial operation date, and unique adder rates apply for renewable generation according to technology and capacity.17 Additionally, projects receive special adders if they have certain characteristics, such as replacing diesel and being located in specific provinces. The special adder for projects in three southern provinces reflects relative investment risks in those provinces.
To complement its FIT policies, Thailand offers a number of other modes of support to small power producers as well. Additional support measures include soft loans and investment subsidies for selected types of renewable energy (e.g. biogas from pig farms, tapioca starch factories, palm oil factories, rubber factories, ethanol factories, other agro-industry factories, municipal waste, and micro-hydro), as well as technical assistance. The available package of incentives has
been widely successful in developing small-scale renewable energy throughout the country. As of December 2011 there were 67 small renewable energy projects under some form of proposal, development or implementation, with a potential capacity of nearly 2.5 GW, and 1,890 very small renewable energy projects under some form of proposal, development or implementation, with a potential capacity of 6 GW.
18
From 2012 to 2020, small and very small producers are projected to account for 9.5 GW (with 5 GW from co-generation and 4.5 GW from renewable energy) of energy supply growth. To put this growth in context, in 2011 Thailand’s total installed power generation capacity was approximately 32.4 GW. In support of the national renewable energy targets, the government has announced plans for policy adjustments, including transitioning from the adder for renewable generation to a fixed-price feed-in tariff system, preparing for development of a Smart Grid transmission system, amending laws and regulations which disadvantage renewable energy development, and promoting research and public education on renewable energy generation.
19
Thailand’s efforts in FIT policy reflect the general direction of the region. Other developing Asian nations, such as China, Malaysia, and the Philippines, have also already established or are in the process of implementing FITs for renewable energy.
20
figure 2: sample Rates under Thailand fiT Program as of october 2012 (usd/kwh)**
**Adder rate only – actual payment includes spot-market electricity price plus adder. Adders vary by size of installation. Cited rates do not include special bonuses for project-specific attributes. Conversion rate: 30.5 THB = 1 USD; from oanda.com on 10/22/2012
Source: Osborne, Christopher.
thailand fit proGram
hydro biomaSS wind Solar
0.03-0.05 0.01-0.02 0.11-0.15 0.21

39mexicomexico
buildiNg eNeRgy effiCieNCy
mexico initiates finance programs to support eco-homes
gReeN buildiNg booM
Mexico’s green building programs are thriving, the result of a range of policies implemented to promote energy efficiency and align growth in residential housing with sustainable development goals. These policies focus on financing and energy efficiency in the low- to medium-income housing sub-sector, which will account for the majority of greenfield developments in the coming decades.
A new law enacted in 2012 prompted the most recent actions. In its General Law on Climate Change, Mexico defined a goal for reducing its greenhouse gas emissions to 30 percent below a business as usual scenario by 2030 and 50 percent below 2000 levels by 2050.1 To achieve these goals, the Law expanded the use of economic, regulatory and administrative tools and instruments, including: economic and fiscal incentives, a climate change fund, a national climate change program, and an emissions trading system, among others. As housing currently accounts for 16.5 percent of all energy consumed in the country, Mexico’s energy efficiency initiatives for residential buildings are integral to these goals.2
Mexico’s population is growing. Based on current demographic trends, Mexico will need to construct 800,000 to 1 million new homes per year over the next decade to meet the rising demand. Over 7 million new homes are projected to be constructed by 2020, which will result in an additional 33 million tons of CO
2 per year if no actions
are taken to improve building efficiency.3
In the last decade, Mexico built support for financing ecologically-friendly “eco-homes.” Mexico initiated two finance programs to support eco-homes for working class citizens during the 2000s that are still in use today. The Green Mortgage program encourages residential property developers to build homes that employ certain energy-saving features such as solar heating, thermal isolation, high-efficiency air conditioning, and other sustainable technologies. The second is a federal subsidy program called This is Your House, which provides assistance to low-income buyers of sustainable new and used homes, as well as for retrofits to existing properties. Together, these programs contribute to Mexico’s national plan to promote sustainable housing development.
promoting Sustainable Growth in the residential Sector

40 the road to namas 41mexico
components.13 Mexico plans to establish three labels of energy efficiency—Ecocasa 1, Ecocasa 2, and Passive House—with increasingly strict emissions requirements. New houses that meet these labels of energy efficiency will be solicited for NAMA support from international donors. For the most cost-effective improvements, the benchmarks will be based on a “whole-house” model rather than on specific individual eco-technologies, which occurred in previous programs. Additionally, the program will take into account variables such as local climatic variations and building type to ensure the benchmarks are applied fairly across the nation. According to the government of Mexico, a 40 m2 house certified as a passive house can reduce CO
2
emissions by over 70 tons over the lifetime of the house.14 Officials estimate that the program could result in an additional 2 million tons CO
2 avoided per year, and up to
27 million tons of CO2 by 2020 under an optimistic scenario. (Figure 1.)15,16
In August 2012, the Clean Technology Fund and Inter-American Development Bank awarded USD 99 million in loans to Mexico to implement the Eco-casa program, a plan to significantly scale up low-carbon housing in Mexico.17 The plan aims to facilitate the development of eco-homes through two avenues. First, it will provide financial support to developers through the federal mortgage society in Mexico. Second, the program will increase the supply of mortgages by providing financial and technical assistance to local financial institutions.18 Other donors have decided to leverage their resources in the effort as well. For example, the German Development Bank KfW is anticipated to commit an additional EUR 80 million in concessional loans for the development of low-carbon housing projects in Mexico.19 Overall, the program will likely support the development of as many as 27,000 low-carbon homes and 800 passive homes over a seven year implementation period.20
fiNaNCiNg gReeN
Mexico’s Green Mortgage program is administered by the Mexican National Fund for Workers’ Dwelling (INFONAVIT), a public-private partnership institution which supports Mexico’s private sector workers. Employees of the private firms registered with the Fund contribute 5 percent of their salaries. In return, they have access to affordable mortgages. In this capacity, it originates about 70 percent of the value of all mortgages in the country. Through the Green Mortgage program, the Fund provides an extension of credit, up to USD 1,250 on top of the original mortgage, for workers to purchase new homes valued at less than USD 40,000 that incorporate energy-saving technologies into their designs.4 The program assumes that cost savings from lower utility bills can support the larger mortgages. Furthermore, by offering attractive mortgages to buyers of these homes, the program increases the demand for eco-homes, encouraging their further construction.
Mexico has also created a program to subsidize the purchase of eco-homes for citizens who earn less than five times the minimum wage.5 Through partnerships with private lending institutions, the This is Your House program enhances the buying power of citizens by subsidizing costs including down payments for new and used homes, construction costs, and sustainable improvements on existing properties. Borrowers who obtain financing from participating private sector lenders may be eligible for subsidies that cover up to 70 percent of the investment costs, depending on the type of investment.6 Funds are disbursed to housing developers, who then lower the mortgage debt incurred by home buyers. To be eligible, borrowers must possess a savings account with at least 4 percent of the project value.7 This requirement is beneficial in two ways. First, it encourages private savings and may increase reserves in local banks, leading to reduced borrowing costs. Second, it reduces credit risk to private lenders and increases their openness to lending.
sTRiviNg foR susTaiNable housiNg NaTioNwide
Through August 2012, the Green Mortgage program resulted in more than 900,000 credit extensions.8 These credit extensions have led to an average savings of USD 17 per month on utility bills, and an average net savings of USD 11 per month after accounting for higher mortgage payments. The reduced energy use due to the Green Mortgage program translates to about 700,000 tons of CO
2 emissions avoided per
year.9 In August 2012, the program won the UN-HABITAT World Habitat Award, which is given each year to the world’s best projects that promote sustainable living and improved quality of life for residents.10 Likewise, This is Your House has achieved remarkable success in developing the eco-home market throughout Mexico. In 2011, the government delivered nearly 166,000 subsidies through This is Your House with a total value of about USD 420 million.11
Over the next decade, Mexico plans to scale up the Green Mortgage and This is Your House programs significantly as part of its special program on climate change and broader environmental goals. These programs will expand to cover a wider range of mortgage seekers and will have more ambitious energy efficiency targets. Already, INFONAVIT has required all new mortgages to comply with the standards for its Green Mortgage program since 2011. Additionally, the National Housing Commission has launched a sustainability housing working group to coordinate public initiatives among federal institutions and find synergies in topics including monitoring and evaluation, training and capacity building, and sustainable pilot projects.12
The ultimate goal of these efforts is the establishment of a nation-wide sustainability plan that can be classified as a Nationally Appropriate Mitigation Action (NAMA). As such, energy performance benchmarks for all new houses in the country are core
2012 2013 2014 2015 2016 2017 2018 2019 2020
30
20
10
0
100% Passive House
100% Eco Casa 2
Extend CurrentActivities
No Action
MtC
O2e
100% Eco Casa 1
Source: SEMARNAT.
figure 1: emissions from Newly built houses in select Mitigation scenarios

42 the road to namas 43mexico
RefeReNCes
Energy and Climate Partnership of America. 2012. “INFONAVIT –Achievements on the Residential Green Mortgage Program.” Energy Efficiency Working Group Workshop, March 21-22, 2012. Web. October 2012. <http://www.ecpamericas.org/data/files/Initiatives/energy_efficiency_working_group/eewg_mexico_workshop/infonavit.pdf>
World Habitat Awards. 2012. “Previous Winners and Finalists –2012.” Web. October 2012. <http://www.worldhabitatawards.org/winners-and-finalists/project-details.cfm?lang=00&theProjectID=9DA03455-15C5-F4C0-99170E7D631F50E9>
Inter-American Development Bank. “CTF–IDB “ECOCASA” PROGRAM: Mexico Energy Efficiency Program, Part II.” Web. October 2012. <http://www.climateinvestmentfunds.org/cif/sites/climateinvestmentfunds.org/files/PID_Mexico%20ECOCASA%20Program.pdf>
eNdNoTes
1 SEMARNAT, Mexico. Official Magazine, June 12, 2012
2 ProMexico. “Ecological Homes, a Green Mortgage.” Web. October 2012. <http://negocios.promexico.gob.mx/english/09-2009/art05.html>
3 SEMARNAT, Mexico. ”Supported NAMA for Sustainable Housing in Mexico – Mitigation Actions and Financing Packages.” Web. October 2012. <http://www.conavi.gob.mx/documentos/publicaciones/4_Supported_NAMA_for_Sustainable_Housing_in_Mexico.pdf>
4 World Habitat Awards. 2012. “Previous Winners and Finalists – 2012.” Web. October 2012. <http://www.worldhabitatawards.org/winners-and-finalists/project-details.cfm?lang=00&theProjectID=9DA03455-15C5-F4C0-99170E7D631F50E9>
5 CONAVI, Mexico. “Esta es tu Casa.” Web. October 2012. <http://www.conavi.gob.mx/programas-estrategicos/ tu-casa>
6 Elias, Christopher and Travis Ritchie. May 1, 2008. “Housing Microfinance in Latin America: Opportunities in Mexico.” UCLA-School of Public Affairs. Web. October 2012. <http://164.67.121.27/files/pp/APP/08_Microfinance.pdf>
7 Ibid.
8 World Habitat Awards, 2012, op cit.
9 Ibid.
10 Ibid.
11 Inter-American Development Bank. “CTF–IDB “ECOCASA” PROGRAM: Mexico Energy Efficiency Program, Part II.” Web. October 2012. <http://www.climateinvestmentfunds.org/cif/sites/climateinvestmentfunds.org/files/PID_Mexico%20ECOCASA%20Program.pdf >
12 Ibid.
13 SEMARNAT, Mexico. “Housing NAMA Summary.” Web. October 2012. <http://www.conavi.gob.mx/documentos/publicaciones/3_Supported_NAMA_for_Sustainable_Housing_in_Mexico_Summary.pdf>
14 SEMERNAT, Mexico, op cit. (note 3)
15 SEMERNAT, Mexico, op cit. (note 13)
16 Butzengeiger, Sonja. “NAMA Design Concept for Energy-Efficiency Measures in the Mexican Residential Building Sector.” Perspectives GmbH: Thomson Reuters presentation at UNEP-WB-UNFCCC Workshop, March 14, 2011. Web. October 2012. <http://www.slideserve.com/gitel/nama-design-concept-for-energy-efficiency-measures-in-the-mexican-residential-building-sector>
17 Climate Investment Funds. “Approved by Mail: CTF-IDB “Ecocasa” Program (Mexico Energy Efficiency Program Part II) (IDB).” CIF Memorandum, August 16, 2012. Web. October 2012. <http://www.climateinvestmentfunds.org/cif/sites/climateinvestmentfunds.org/files/Approved_by_mail_CTF_IDB_Ecocasa_Program_Mexico_Energy_Efficiency_Program_Part%20II_(IDB).pdf>
18 Inter-American Development Bank, op cit.
19 Ibid.
20 Harnisch, Jochen. “Emerging Channels for International NAMA Implementation Support.” KfW. International Workshop on NAMA Finance. Helsinki, October 4, 2012. Web. October 2012. <http://www.nefco.org/sites/nefco.viestinta.org/files/HARNISCHpresentationNAMA_WS_4Oct12.pdf>
figure references
figure 1: emissions from Newly built houses in select Mitigation scenariosSEMARNAT, Mexico. ”Supported NAMA for Sustainable Housing in Mexico - Mitigation Actions and Financing Packages.” Web. October 2012. <http://www.conavi.gob.mx/documentos/publicaciones/4_Supported_NAMA_for_Sustainable_Housing_in_Mexico.pdf>

45SinGaporeSinGapore
Green buildings lead emissions reduction strategy
siNgaPoRe fiNds suCCess
Singapore is a small and densely populated city-state. With limited fossil and renewable energy sources, energy efficiency forms a core part of Singapore’s energy and climate strategy. Singapore pledged to reduce its greenhouse gas emissions by 16 percent below business as usual levels in 2020, under the UN Framework Convention on Climate Change. The reductions focus on the building sector, which is expected to contribute 13.8 per cent of 2020 emission levels, due to increasing demand for commercial space and more intensive use of space.1 In 2009, Singapore set a goal to improve its energy intensity by 35 percent from 2005 levels by 2030.2
gReeN buildiNg CeRTifiCaTioN aT CoRe of MasTeR PlaN
In response to Singapore’s economy-wide emission reduction goals, the Building and Construction Authority set a national target of greening least 80 percent of the country’s buildings by 2030. To meet this target, Singapore’s 2nd Green Building Master Plan, a roadmap to achieve sustainability, initiated six “strategic thrusts.” These were designed to demonstrate public sector leadership and spur the private sector towards green buildings, promote research and development into green building technologies, build industry capability and impose mandatory minimum environmental standards.3
The Green Mark Scheme is the central pillar of the plan. First launched in 2005, the Green Mark Scheme rates the environmental impact and performance of buildings based on internationally-recognized best practices. It covers new and existing buildings (residential and non-residential), as well as public parks, office interiors and infrastructure. Four levels of certification include Green Mark Certified, Gold, Gold Plus and Platinum. Buildings are certified to one of these levels based on five categories for assessment of their energy and water efficiency, environmental protection, indoor environmental quality and other innovative features that contribute to building performance.
The Green Mark program awards points for incorporating specified design features or practices listed under each of the five categories, with a greater weighting towards energy efficiency, and the total score determines the certification level awarded. A Platinum building can achieve more than 30 percent energy savings compared to a building that is merely code compliant, for example. Certified
improving building efficiency with the Green mark Scheme
buildiNg eNeRgy effiCieNCy

46 the road to namas 47SinGapore
Singapore is home to South-East Asia’s first Zero Energy Building, which was retrofitted from an existing building and serves as a test-bed center for green building technologies.9 The country also collaborates with international partners such as the United Nations Environment Program to promote and build capacity for sustainable buildings policy development in Asia through the Building and Construction Authority Center for Sustainable Buildings.10
eCoNoMiC beNefiTs iNflueNCe develoPeRs
Singapore is making steady progress on its target of 80 percent Green Mark buildings. In May 2012, one-sixth of Singapore’s total building stock earned a green designation. (Figure 2.) Approximately 10 percent of those achieved a Platinum rating.
While the government has supported the Green Mark Scheme, building owners and developers embrace it too, because it offers a number of economic benefits. The modest increase in design and construction costs for a Green Mark-compliant building are offset by energy and water savings. Increased building costs range from a less than one percent premium for Green Mark Certified to up to 8 percent premium for Platinum levels. The average payback period is relatively short, ranging from two to eight years, because of the significant energy and water cost savings due to reduced consumption.11 The Green Mark Scheme helps differentiate the buildings in the real estate market, enhancing corporate image and increasing leasing and resale value of buildings.
A recent study by the National University of Singapore found that green buildings save approximately 10 percent in operating expenses, and green commercial buildings increase in market value by about two percent. The average savings from 23 buildings (comprising office, retail, hotel, and mixed-used developments) sampled after retrofitting was about 17 per cent of the total building’s energy consumption, compared to before retrofitting.12
In addition to the economic benefits, Green Mark buildings offer reduced environmental impact and improved building quality for healthy and productive homes and workplaces. More detailed analysis on the impact of the Green Mark Scheme is underway.
buildings are required to be re-assessed every three years to maintain their Green Mark status, and minimum standards are regularly reviewed and tightened.4
Participation in the Green Mark Scheme is voluntary for existing buildings in the private sector. However, a 2008 regulation requires all new buildings and all existing buildings undergoing major retrofitting to meet at least the minimum Green Mark standards, which are 28 percent higher than 2005 building codes.5 The public sector is held to higher requirements. All new public buildings must achieve Platinum rating, and all existing buildings with a minimum air conditioned floor area must achieve Gold Plus rating by 2020. Achievement of higher Green Mark ratings is also a land-sales condition in key growth areas.6
To reduce the costs for private sector building owners and developers and to promote green buildings, the government has set aside about USD 102 million worth of cash incentives for the private sector and USD 46 million for green building research and development to be used for a number of programs as described in Figure 1.7
Job training is also part of Singapore’s path to emissions reductions. Within the next 10 years, the Building and Construction Authority is planning to train 20,000 green specialists through the Building and Construction Authority Academy as it strengthens the industry’s capability in the design of green building systems as well as the downstream construction and maintenance of green buildings.8
figure 2: Progress Toward 80% green buildings Target
Source: Anggadjaja, Edward.
FY05 FY06 FY07 FY08 FY09 FY10 MAY 2012
1300
1100
900
700
500
300
100
17 33
127239
427
737
1181
16%
of
To
tal
Bu
ild
ing
Sto
ck
NU
MB
ER
OF
GR
EE
N B
UIL
DIN
G P
RO
JE
CT
S (
CU
MU
LA
TIV
E)
iNCeNTive amount purpoSe
Green mark incentive Scheme for new buildings
uSd 15.7 million
Rewards new developments that achieve a Gold rating or higher by co-funding up to USD 2.4 million of the cost for private developers and owners. It also offers an incentive of up to USD 78,000 for architects and
engineers involved in public or private developments.
Green mark incentive Scheme for existing buildings
uSd 78.7 millionCo-funds up to 35 percent of the retrofitting costs
for energy efficiency improvements, or up to USD 1.2 million, whichever is lower.
building retrofit energy efficiency
financing pilot SchemeuSd 3.9 million
The Building and Construction Authority will share the risk of any loan default with participating financial institutions that provide loans to building owners and
energy services companies to carry out green retrofits.
Green mark Gross floor area incentive Scheme
n/aGrants additional floor area (space at a premium
in Singapore) for developments attaining Gold Plus or Platinum rating.
Green mark incentive Scheme for design prototype
uSd 3.9 millionEncourages the design of breakthrough prototypes that can achieve results exceeding Platinum through
adoption of an early collaborative design process.
research fund for the built environment
uSd 39.3 million
Provides funding support for academia and industry to undertake green building and sustainability related
research projects. To date, USD 14.2 million has been committed to support more than 30 research projects.
Grant call for r&d proposals in Green building
technologiesuSd 7.1 million
Fosters public-private collaboration in green building research. The Grant Call has been awarded to nine research projects in the area of energy efficiency
and building materials.
figure 1: government incentives to Promote green buildings in singapore
Source: Adapted from the Building and Construction Authority, Singapore, and the National Climate Change Secretariat, Singapore.

48 the road to namas 49SinGapore
RefeReNCes
National Climate Change Secretariat, Singapore. 2012. “Climate Change and Singapore: Challenges, Opportunities and Partnerships (National Climate Change Strategy 2012).” <http://app.nccs.gov.sg/data/resources/docs/Documents/NCCS-2012.pdf>
World Green Building Council. 2011. “World Green Building Council Government Leadership Awards: Excellence in City Policy for Green Building.” <http://www.worldgbc.org/site2/files/1913/2313/3069/WorldGBC_Government_Leadership_Award_Publication.pdf>
Building and Construction Authority, Singapore. 2009. “2nd Green Building Masterplan.” <http://www.bca.gov.sg/GreenMark/others/gbmp2.pdf>
eNdNoTes
Note: currencies were converted to US dollars on July 10, 2012 at the exchange rate of 1 USD = 1.27 SGD.
1 National Climate Change Secretariat, Singapore. 2012. “Climate Change and Singapore: Challenges, Opportunities and Partnerships (National Climate Change Strategy 2012).” Web. June 2012. <http://app.nccs.gov.sg/data/resources/docs/Documents/NCCS-2012.pdf>
2 Ministry of Environment and Water Resources, Singapore. 2009. “A Lively and Liveable Singapore: Strategies for Sustainable Growth (Singapore Sustainable Development Blueprint).” Web. June 2012. <http://app.mewr.gov.sg/data/ImgCont/1292/sustainbleblueprint_forweb.pdf>
3 Building and Construction Authority, Singapore. 2009. “2nd Green Building Masterplan.” Web. June 2012. <http://www.bca.gov.sg/GreenMark/others/gbmp2.pdf>
4 Ibid.
5 Ibid.
6 Ibid.
7 Ibid.
8 Ibid.
9 Building and Construction Authority, Singapore. “Sustainable Built Environment.” Web. June 2012. <http://www.bca.gov.sg/sustain/sustain.html>
10 Building and Construction Authority, Singapore, 2009, op cit.
11 Ibid.
12 Tan, Mindy. “Green buildings make value proposition.” The Business Times, November 29, 2011. Web. June 2012. <http://www.eco-business.com/news/green-buildings-make-value-propositions/>
13 World Green Building Council. 2011. “World Green Building Council Government Leadership Awards: Excellence in City Policy for Green Building.” <http://www.worldgbc.org/site2/files/1913/2313/3069/WorldGBC_Government_Leadership_Award_Publication.pdf>
14 Shankari, Uma. “Green buildings in Singapore: Adding the green touch with technology.” The Business Times, April 26, 2011. Web. June 2012. <http://www.eco-business.com/news/green-buildings-in-singapore-adding-the-green-touch-with-technology/>
figure references
figure 1: government incentives to Promote green buildings in singaporeAdapted from the Building and Construction Authority, Singapore, and the National Climate Change Secretariat, Singapore.
figure 2: Progress Toward 80% green buildings TargetAnggadjaja, Edward. “Singapore’s Green Building Story: Innovative, Scalable & Replicable Innovative, Scalable & Replicable.” Singapore Building and Construction Authority presentation at the Asia Clean Energy Forum, June 8, 2012. Web. June 2012. <http://www.scribd.com/doc/97619115/Edward-Anggadjaja-Singapore%E2%80%99s-Green-Building-Story-Innovative-Scalable-Replicable>
In December 2011, Singapore firmly established its status at the forefront of sustainable building design and construction. The World Green Building Council Government Leadership Awards recognized Singapore’s Building and Construction Authority with a Regional Leadership Award for its exceptional Green Building Master Plan, including the flagship Green Mark Scheme.13 A strong regulatory framework, robust market incentives and a culture of corporate responsibility all contributed to Singapore’s success, as well as the government taking an active role in promoting research and development of green technologies.14
Singapore’s green building journey serves as one of the success stories for countries striving towards a sustainable built environment. The Aspen Institute’s Energy and Environment Awards recognized Singapore’s approach as innovative, scalable and replicable.
51SwedenSweden
Sweden’s rebate program encourages voluntary energy efficiency improvements
Payoff foR effiCieNCy
No Swedish industries paid tax on their electricity use in 2003. A year later, they all did, to comply with the European Union’s industrial tax directive of EUR 0.5 per megawatt hour (MWh).1 In order to protect industry competitiveness, in 2005 the Swedish Energy Agency launched a program that exempts energy-intensive industries from paying the energy tax if they adopt energy efficiency measures.
Sweden targeted the rebate program to the industrial sector because it accounts for about one-third of the energy used in Sweden. Three energy-intensive sectors—paper and pulp, iron and steel, and the chemical industry—dominate industrial energy consumption and represent 75 percent of total industrial energy use. Similarly, one-third of total Swedish carbon emissions come directly from industry; the largest emitters are the iron and steel, and the mineral sectors (dominated by the cement sector) with almost half of emissions.2
The tax rebate program, called the Program for Energy Efficiency, imposed many requirements on industry participants based on qualitative targets rather than quantitative measurements for electricity savings. Almost 100 percent of participating firms complied with its demands, and the Program for Energy Efficiency has been a success, resulting in nearly a 4 percent reduction in total electricity used by participating companies.3
eNeRgy- aNd CaRboN-iNTeNsive iNdusTRies shaRe besT PRaCTiCes
Participation in the rebate program was targeted to energy or carbon intensive companies whose energy purchases amount to at least 3 percent of production and/or whose taxes on carbon emissions and sulfur amount to at least 0.5 percent of its added value. Thus, participating companies belong to the pulp and paper, mining, iron and steel, non-metal minerals and industrial chemicals sectors. In some cases, food processing industries, saw mills and engineering industries also qualify as energy-intensive. A corporation could choose to have the entire corporation, or just its energy-intensive, independently-run subsidiary, participate in the program.
The program period started when a company enrolled, and was a five-year agreement. During this time, participating companies were eligible for a complete rebate on the EUR 0.5 per megawatt hour tax for electricity use, provided they complied with the requirements of the program.
driving industrial energy efficiency through energy tax rebates
iNdusTRial eNeRgy effiCieNCy

52 the road to namas 53Sweden
By improving their efficiency in electricity use, the companies participating in the tax-rebate efficiency program helped mitigate the environmental and climate effects of their activities. The companies reported average electricity savings of just under 1 TWh per year, which would result in reducing 0.5-1 million metric tons CO
2 emissions
per year (considering 1 MWh of electricity from a coal fired power station to be equivalent to a CO
2 emission of 0.5-1 ton).8
The Program for Energy Efficiency was successful in overcoming several challenges to realizing greater industrial energy efficiency. Participants developed a network and disseminated good practices, helping to build expertise and lower investment risk, which had previously been a key barrier. By involving tax money, the rebate program made energy issues a management task, which gave it higher priority in companies. Moreover, several firms educated all employees in energy issues due to the energy management system. The program imposed specific requirements and clear deadlines, which proved essential in preventing energy efficiency issues from being put aside for other strategic or more acute ones. Finally, the energy review and analysis introduced by the Program for Energy Efficiency made it easier for companies to plan, implement, follow-up and review their energy efficiency progress. Notwithstanding its success, the tax exemption under the voluntary agreement is scheduled to end at the end of 2012 due to a new EU directive on energy taxation.
During the first two years a participating company was required to:
• Implement and obtain certification for a standardized energy management system;
• Carry out energy auditing and analysis, in order to identify both its electricity consumption needs, as well as measures to improve efficiency;
• Document and report its identified electricity savings measures to the Swedish Energy Agency, and implement those measures with a straight payback period of less than three years;
• Adopt procedures for energy efficient procurement and project planning;
• Evaluate the impact of alternative choices for energy requirements as soon as possible.
During the next three years the company was required to:
• Implement the actions in the list submitted to the Swedish Energy Agency;
• Assess the impacts of its energy-efficient planning and purchasing routines.4,5
To ensure effective implementation of the Program for Energy Efficiency, the Swedish Energy Agency provided information and guidance in the form of manuals on energy mapping and analysis, life-cycle costing, and procurement. It also integrated all participants in a network with the aim of sharing best practices.
CleaR goals led To eNeRgy-saviNgs aNd eMissioNs ReduCTioNs
While approximately 1,200 companies were eligible for Program for Energy Efficiency membership, the Swedish Energy Agency expected only the largest 100 companies to enroll because participation involved additional expenses for the firms, such as certification for the energy management system, which costs about USD 10,000. The Program for Energy Efficiency opened for applications in January 2005, and by the end of 2006, 117 companies with over 240 separate production sites had joined in. The participants used about 30 terawatt hours (TWh) of electricity per year (both purchased and self-produced), representing 55 percent of industrial electricity demand and 20 percent of all electricity consumed in Sweden.6,7 When a second five-year program period was launched in 2009, with no significant modifications compared to the first one, most of the initial participants extended their agreements.
During the first five-year phase of the Program for Energy Efficiency, electricity savings surpassed expectations. Instead of the expected annual electricity savings of 0.5 TWh, participating companies reported estimated savings from the investments in energy efficiency between 0.689 and 1.015 TWh (1 TWh per year represents three to 4 percent of the total electricity used by the companies). They also made investments totaling USD 102 million in more than 1,200 electricity efficiency measures, and carried out over 350 other measures to increase energy performance (for example by replacing fossil fuels with renewable energy sources). The tax exemptions have led to USD 19 million per year in savings for the enterprises. In addition, savings from using at least 1 TWh per year less electricity translate into annual cost savings of about USD 71 million.
During the first two years of running the Program for Energy Efficiency, half of the electricity efficiency improvements were in production processes, and the rest in auxiliary systems. Improvement measures included speed control, adjustment of processes, changing to more energy efficient products, and shutting down unnecessary equipment. The greatest energy savings were made in the pulp and paper industry (about 64 percent of the total), but this is also the sector that uses the most electricity (about 22 TWh per year). Electrical efficiency improvements varied by sector. (Figure 1.)
figure 1: electrical efficiency improvements varied by sector (2007)
Source: Swedish Energy Agency.
7.6
7.1
6.6
5.9
2.5
2.1
1.9
1 2 3 4 5 6 7 8
ELECTRICAL EFFICIENCY IMPROVEMENTS (%)
Sawmills & Manufacturingof Wood Materials
Foodstuffs and Drinks
Mines and Ore Processing
Other Industries
Steel & Metals Production
Pulp and Paper
Chemical
SE
CT
OR

54 the road to namas 55Sweden
RefeReNCes
Stenqvist, C., & Nilsson, L. J. 2011. “Energy efficiency in energy-intensive industries: an evaluation of the Swedish voluntary agreement Program for Energy Efficiency. Energy Efficiency [doi:10.1007/s12053-011-9131-9].” <http://lup.lub.lu.se/luur/download?func=downloadFile&recordOId=2026521&fileOId=2026522>
Sustainable Energy Technology at Work. “Program for energy efficiency in energy intensive industry (PFE).” SETatWork Database. <http://www.setatwork.eu/database/products/R178.htm>
eNdNoTes
Note: currencies were converted to US dollars on July 9, 2012 at the exchange rate of 1 USD = 7.02 SEK.
1 Stenqvist, C., & Nilsson, L. J. 2009. “Process and impact evaluation of PFE—a Swedish tax rebate program for industrial energy efficiency.” Presented at the ECEEE 2009 Summer study. Act! Innovate! Deliver! Reducing energy demand sustainably. Web. June 2012. <http://www.eceee.org/conference_proceedings/eceee/2009/Panel_5/5.269/paper>
2 Johansson, B., Modig, G., & Nilsson, L. J. 2007. “Policy instruments and industrial responses—experiences from Sweden.” Presented at the ECEEE 2007 Summer Study. Saving energy - just do it! Web. June 2012. <http://euiclimatepolicybibliography.net/2012/07/17/policy-instruments-and-industrial-responses-experiences- from-sweden/>
3 Stenqvist, C., & Nilsson, L. J. 2011. “Energy efficiency in energy-intensive industries: an evaluation of the Swedish voluntary agreement Program for Energy Efficiency. Energy Efficiency [doi:10.1007/s12053-011-9131-9].”
4 Sustainable Energy Technology at Work. “Program for energy efficiency in energy intensive industry (PFE).” SETatWork Database. Web. July 5, 2012. <http://www.setatwork.eu/database/products/R178.htm>
5 Stenqvist, C., & Nilsson, L. J., 2011, op cit.
6 Swedish Energy Agency (SEA). 2007. “Two years with PFE. The first published results from the Swedish LTA programme for improving energy efficiency in industry.”
7 Stenqvist, C., & Nilsson, L. J., 2011, op cit.
8 Sustainable Energy Technology at Work, op cit.
figure references
figure 1: electrical efficiency improvements varied by sector (2007)Swedish Energy Agency (SEA). 2007. “Two years with PFE. The first published results from the Swedish LTA programme for improving energy efficiency in industry.”

57thailandthailand
the growing might of financing boosts renewable energy and energy efficiency
fuNdiNg The fuTuRe
The demand for energy is growing worldwide and this is especially true for Thailand. By closely examining the energy efficiency and renewable energy sectors, the government developed financial mechanisms to support growth in energy demand while achieving mitigation targets.
Between 1990 and 2010, Thailand’s gross domestic product grew at an average rate of 4.5 percent annually, and its energy demand grew nearly as fast at 4.4 percent.1 The Ministry of Energy projects that energy demand will increase nearly 40 percent over the next decade, reaching 100 million metric tons of oil equivalent per year by 2021.2 The rapid growth in energy demand is leading to increased greenhouse gas emissions, with CO
2 emissions due to energy consumption totaling
about 278 million metric tons in 2010.3 In addition to growth in greenhouse gas emissions, domestic energy security is a concern as well. As of 2009, Thailand was importing 60 percent of its total energy supply to meet its demand.4 Thus, the government has made the management of energy demand a top objective.
To manage the emissions implications of projected growth in energy demand, the government of Thailand has made energy efficiency and renewable energy policy a key part of its climate change mitigation strategy. Thai leaders recognized that project financing was one of the key barriers to increased uptake of energy efficiency and renewable energy opportunities. As a result, the government developed a strategy for raising and disseminating the necessary funding through public-private partnerships.
fuNdiNg aNd iNCeNTives bRiNg soluTioNs
Thailand’s Energy Conservation Program started 20 years ago, under the Energy Conservation Promotion Act. This master plan for energy efficiency and renewable energy development was implemented in three stages: Phase I (1995-1999), Phase II (2000-2004), and Phase III (2005-2011). The Act applied mandatory energy efficiency and conservation measures to large commercial and industrial facilities and created voluntary initiatives for small- and medium-sized enterprises. During Phase III, Thailand revised its Energy Conservation program and moved toward longer-term strategic planning for energy efficiency and renewable energy.
Notably, the Act established an Energy Conservation Promotion Fund (ENCON Fund) which originated from an initial capital outlay from the existing Oil Fund and
iNdusTRial eNeRgy effiCieNCy
buildiNg eNeRgy effiCieNCy
ReNewable eNeRgy
revolving and eSco funds for renewable energy and energy efficiency finance

58 the road to namas 59thailand
With access to the Revolving Fund, local banks were able to provide low-interest rate loans which covered up to 100 percent of project costs, with a maximum of THB 50 million (approximately USD 1.6 million) per project.10,11 Project developers and ESCOs were eligible for a fixed interest rate loan of zero percent to 4 percent (compared to the market rate of 9 percent), for up to a seven-year period. The local banks were responsible for evaluating loan applications, based on the balance sheets, future cash flows, and savings from the projects. The banks also required land, building(s), or equipment owned by the applicants to serve as collateral for loans. Furthermore, project proponents were required to submit feasibility studies when applying for loans. These requirements lowered the risk that applicants might default on their loans, and because of that, very few applications were rejected.
The total budgeted size of the Revolving Fund was approximately USD 235 million over five funding phases.12 Funding was available for energy efficiency projects and some types of renewable energy projects, with eligible investments including: equipment and installation costs; consultation costs; civil works, piping, or necessary components; and other associated costs such as removal of existing equipment, transportation, and taxes.13,14 The participating banks managed the loans and reported to the government authority, the Ministry of Energy’s Department of Alternative Energy Development and Efficiency, which ensured that all projects achieved real energy savings, monitored the banks’ performance and measured the program’s energy savings.15 This approach minimized government involvement in the financing process and helped to leverage bank finance. The cost to the government was the time value of money associated with providing zero or low-interest loans to the commercial banks, and participating banks, not the government, carried the risk of participants defaulting on their loans.16
With the success of the program in building the banks’ understanding and capacity to finance energy efficiency and renewable energy, in 2011, Thailand began to phase out the Revolving Fund. Recent lending data from the banks suggests that they have become sufficiently familiar with lending practices and are able to provide financing without government support.
The esCo fund provides capital and technical assistance for clean energy, renewable energy, energy efficiency and building retrofit projects. It was organized into two phases (2008-2010 and 2011-2012), each funded by an ENCON grant at a value of USD 16.3 million.17 The project is sponsored by the Department of Alternative Energy Development and Efficiency and the fund is managed by the government-appointed, non-profit Energy Conservation Foundation of Thailand and Energy for Environment Foundation. Projects are monitored during development, construction and operation.
The primary targets are: small and medium enterprises, including the energy-intensive service and industrial sectors; energy service companies as co-investors, project developers, or technical partners; and domestic and international investors in energy efficiency and renewable energy sectors. The secondary targets are financial institutions providing project loans and credit guarantee agencies. Forms of support include:
• Equity investment – The ESCO Fund can invest between 10-50 percent of a project, up to a maximum of USD 1.6 million for a period of five to seven years. Investors can exit by selling back shares to the entrepreneur, find new strategic partners, or list in Thailand’s stock market.
• ESCO venture capital – The ESCO fund can invest up to 30 percent of registered capital, with a maximum of USD 1.6 million. The investment period matures in 5 to 7 years, and investors can exit by selling back shares to the entrepreneur, find new strategic partners, or list in Thailand’s stock market.
is sustained primarily by a small levy from the sale of specified fossil fuels.5,6 The Fund is unusual in that it taxes energy consumption specifically for the purpose of funding energy solutions. The Fund is used to support projects under the Act by government agencies, state enterprises, non-governmental organizations, individuals and businesses.7 The Fund has been disbursed through a number of different mechanisms, including grants, subsidies, tax incentives, a feed-in premium for renewable energy, the Revolving Fund and the Energy Services Company (ESCO) Fund. The following discussion focuses on the two financing programs supported by the Fund: the Energy Efficiency Revolving Fund and ESCO Fund. Figure 1 illustrates the differences between these funds.
The energy efficiency Revolving fund was launched in 2003 and provided a line of credit to local banks, which were then able to provide low-interest loans to developers for energy efficiency and renewable energy projects.8 Local banks were eligible to receive credit lines from the Revolving Fund in the range of USD 2.5 million to USD 10 million to finance energy efficiency and renewable energy projects. During the pilot phase, the Revolving Fund provided local banks with zero percent interest to spur projects. As the financing volume grew, the interest rate was subsequently set at 0.5 percent to cover administrative costs. Local banks were obligated to repay to the Revolving Fund within 10 years.9
figure 1: overview of the Revolving fund and esCo fund
Source: Adapted from Asia-Pacific Economic Cooperation.
Energy Efficiency/Renewable Energy
Projects
Energy Efficiency/Renewable Energy
Projects
CommercialBanks
Non-profitFoundations
Investors
1. Fixed-rate loansup to THB 50 million;interest rate <4%
FORMS OF SUPPORT
1. Equity Investment2. ESCO Venture Capital 3. Equipment Leasing 4. Carbon Credit Trading 5. Technical Assistance 6. Credit Guarantee
Facility
FORMS OF SUPPORT
Revolving Fund
ESCOFund
Energy Conservation Promotion Fund
60 the road to namas 61thailand
RefeReNCes
Asia-Pacific Economic Cooperation. 2011. “Peer Review on Energy Efficiency in Thailand: Final Report.” <http://www.ieej.or.jp/aperc/PREE/PREE_Thailand.pdf>
Chotichanathawewong, Q. and N. Thongplew. 2012. “Development Trajectories, Emission Profile, and Policy Actions: Thailand.” ADBI Working Paper 352. Tokyo: Asian Development Bank Institute. <http://www.adbi.org/working-paper/2012/04/12/5045.dev.trajectories.emission.thailand/>
Energy Futures Australia and DMG Thailand. 2005. “Thailand’s Energy Efficiency Revolving Fund: A Case Study (prepared for the APEC Energy Working Group).” <http://efa.solsticetrial.com/admin/Library/David/Published percent20Reports/2005/ThailandsEnergyEfficiencyRevolvingFund.pdf>
• Equipment leasing – provides eligible businesses for equipment leasing up to 100 percent of the equipment cost, up to a maximum of USD 0.3 million per project, with a payback of less than 5 years. The associated interest rate is 4 percent per year.
• Carbon credit trading - The ESCO Fund supports project owners in developing Clean Development Mechanism documents, and in accessing the carbon credit market through bundling small projects.
• Technical assistance – up to approximately USD 3,250 per project.
• Credit guarantee facility – Co-financed with other financial institutions, the guarantee of commercial bank loans to project owners up to USD 0.3 million and for no more than five years; owners pay a fee to the guarantor at 1.75 percent per annum of the guarantee amount. 18,19,20
uNPReCedeNTed suCCess
Thirteen public and commercial banks have participated in the energy efficiency Revolving fund, which has resulted in 294 projects, with a total investment of approximately USD 519 million (USD 235 million from the fund and USD 284 million from commercial banks). The total financial savings due to the projects is estimated to be about USD 177 million per year. The expected energy savings will be around 320 thousand tons of oil equivalent (Ktoe) per year, leading to GHG emissions reductions of about 1 million tons CO
2-equivalent annually.21
The esCo fund has successfully engaged commercial banks, energy service companies, and investors in Thailand’s energy efficiency and renewable energy development to an unprecedented level. Under the ESCO Fund from 2009 to 2010, USD 17 million of government funding was invested in 39 energy efficiency and renewable energy projects, with a total investment of approximately USD 166 million.22 In the second phase from September 2010 to January 2012, these energy efficiency and renewable energy projects were projected to create energy savings of 24 Ktoe per year and financial savings of USD 30 million per year.23
Both funds have helped raise the profile of and reduce finance barriers to energy efficiency and renewable energy projects. The ESCO Fund will continue to operate as a finance delivery mechanism under the government’s new 10-Year Alternative Energy Development Plan (2012-2021) with a target to increase the share of renewable energy from 9 percent in 2011 to 25 percent in 2021, and 20-Year Energy Efficiency Development Plan with a target to reduce energy intensity by 25 percent in 2030 relative to 2005, which is equivalent to reducing final energy consumption by 20 percent in 2030, or about 30,000 Ktoe.24,25
eNdNoTes
Note: currencies were converted to US dollars on October 17, 2012 at the exchange rate of 1 USD = 30.73 THB.
1 Ministry of Energy, Thailand. “Thailand 20-Year Energy Efficiency Development Plan (2011 - 2030).” Web. July 2012. <http://www.eppo.go.th/encon/ee-20yrs/EEDP_Eng.pdf>
2 Department of Alternative Energy Development and Efficiency, Ministry of Energy, Thailand. 2012. “The Renewable and Alternative Energy Development Plan for 25 Percent in 10 Years (AEDP 2012-2021).” Web. July 2012. <http://www.dede.go.th/dede/images/stories/dede_aedp_2012_2021.pdf>
3 U.S. Energy Information Agency. “International Energy Statistics.” Web. July 2012. <http://www.eia.gov/cfapps/ipdbproject/iedindex3.cfm?tid=90&pid=44&aid=8>
4 International Energy Agency. 2011. “2009 Energy Balance for Thailand.” Web. July 2012. <http://www.iea.org/stats/balancetable.asp?COUNTRY_CODE=TH>
5 International Energy Agency. “IEA/IRENA Global Renewable Energy Policies and Measures Database.” Web. July 2012. <http://www.iea.org/textbase/pm/Default.aspx?mode=re&id=4359&action=detail>
6 These include gasoline, diesel, fuel oil, and kerosene.
7 Asia-Pacific Economic Cooperation. 2011. “Peer Review on Energy Efficiency in Thailand: Final Report.” Web. July 2012. <http://www.ieej.or.jp/aperc/PREE/PREE_Thailand.pdf>
8 United Nations Environment Program and Frankfurt School of Finance and Management. 2012. “Case Study: The Thai Energy Efficiency Revolving Fund.” Web. September 2012. <http://fs-unep-centre.org/sites/default/files/publications/ fs-unepthaieerffinal2012_0.pdf>
9 Ibid.
10 Note that all currency conversions to US dollars were calculated in October 2012 using the exchange rate of THB 30.729 = 1 USD (10/17/2012 - www.oanda.com).
11 United Nations Environment Program and Frankfurt School of Finance and Management, 2012, op cit.
12 Ibid.
13 Chotichanathawewong, Q. and N. Thongplew. 2012. “Development Trajectories, Emission Profile, and Policy Actions: Thailand.” ADBI Working Paper 352. Tokyo: Asian Development Bank Institute. Web. July 2012. <http://www.adbi.org/working-paper/2012/04/12/5045.dev.trajectories.emission.thailand/>
14 Asia-Pacific Economic Cooperation, 2011, op cit.
15 Institute for Industrial Productivity. “Thailand TH-8: Energy Efficiency Revolving Fund (EERF).” Industrial Efficiency Policy Database. Web. June 2012. <http://iepd.iipnetwork.org/policy/energy-efficiency-revolving-fund-eerf>
16 Energy Futures Australia and DMG Thailand. 2005. “Thailand’s Energy Efficiency Revolving Fund: A Case Study (prepared for the APEC Energy Working Group).” Web. July 2012. <http://efa.solsticetrial.com/admin/Library/David/Published%20Reports/2005/ThailandsEnergyEfficiencyRevolvingFund.pdf>
17 Energy for Environment Foundation (EforE). “Investment Promotion in Energy Efficiency and Renewable Energy Projects under ESCO Fund.” Web. July 2012. <http://www.efe.or.th/datacenter/ckupload/files/ESCO_Fund_ENG_Completed percent20Version_final_291111 percent20[Compatibility percent20Mode].pdf>
18 Institute for Industrial Productivity, op cit.
19 Energy for Environment Foundation (EforE), op cit.
20 The Energy Conservation Foundation of Thailand. “ESCO Fund Investment Guidelines.” Web. June 2012. <http://www.ecft.org/home/index.php?option=com_content&view=article&id=67 percent3Aesco-fund&lang=en>
21 United Nations Environment Program and Frankfurt School of Finance and Management, 2012, op cit.
22 Chotichanathawewong, Q. and N. Thongplew, 2012, op cit.
23 Updated data supplied by Wongkot Wongsapai, Assistant Professor, Faculty of Engineering, Department of Mechanical Engineering, Chiang Mai University, personal communication to Catherine Leining on 2 July 2012.
24 Department of Alternative Energy Development and Efficiency, Ministry of Energy, Thailand, 2012, op cit.
25 Ministry of Energy, Thailand, op cit.
figure Section
figure 1: overview of the Revolving fund and esCo fundAdapted from: Asia-Pacific Economic Cooperation. 2011. “Peer Review on Energy Efficiency in Thailand: Final Report.” Web. July 2012. <http://www.ieej.or.jp/aperc/PREE/PREE_Thailand.pdf>

63united StateS
united StateS of
america
TRaNsPoRT
with collaborative strategy, united States reduces emissions from freight transport
sMaRT TaCTiCs
The freight and shipping industry, comprised of trucks, rail, marine, and air freight, is a major driver of economic growth in the United States. The trucking industry alone employs nearly 9 million people and annually generates USD 660 billion in revenue, or around 5 percent of U.S. gross domestic product.1 However, freight and shipping also contributes significantly to greenhouse gas emissions and air pollution. It is anticipated that truck and railroad transport in the U.S. will consume over 45 billion gallons of diesel fuel in 2012, adding over 450 million metric tons of carbon dioxide to the atmosphere, representing about 20 percent of carbon dioxide emissions from the transportation sector in the United States. Additionally, the freight and shipping industry is responsible for 50 percent of the nitrogen oxide and 30 percent of the particulate matter emissions from the transportation sector.2 These emissions, coming from dispersed sources with multiple owners, make them challenging to control and mitigate.
In 2001, the U.S. Environmental Protection Agency (EPA) began designing a voluntary collaborative program that could achieve both environmental and economic benefits within the freight industry. The EPA SmartWay Transport program, officially launched in 2004, is EPA’s flagship program for reducing emissions from the freight and shipping industry. The program uses an innovative approach to deepen collaboration between the freight industry and government to reduce air pollution, improve fuel efficiency and energy security, and strengthen the freight sector.
buildiNg a TRaNsPoRT PaRTNeRshiP
The core component of the SmartWay program is the SmartWay Transport Partnership, a voluntary program that fosters collaborative activities between the EPA and participating companies in the freight industry. All shipping, carrying, railroad, and logistics firms are welcome to join the program. Companies participating in the partnership must annually measure their environmental performance using the EPA’s online fleet database tool, called FLEET, which records information such as fuel usage, fleet composition, and mileage.3 The database then uses this information to score each company on metrics of fuel efficiency and environmental performance.
Smartway program reduces emissions from freight transport

64 the road to namas 65united StateS
These reductions have saved 55 million barrels of oil, or roughly the equivalent of keeping three million cars off U.S. roads for an entire year.7 The reductions in nitrogen oxide and particulate matter help improve air quality and reduce the risk for respiratory illness, especially in pollution hotspots near truck stops, shipping ports, and borders. Major companies in the shipping industry have embraced participation in SmartWay because of the proven fuel savings and branding opportunities presented by the program. As of 2012, over 2,900 companies have joined the program, including the 100 largest trucking firms in the country and the largest railroads.8 Other participants include major logistics firms and large corporations with significant shipping needs such as Walmart, Exxon-Mobil, and Coca-Cola. In addition to these large firms, SmartWay has also been able to attract smaller companies. Twenty-five percent of SmartWay partners have fleets of 20 vehicles or less.9
This success has not gone unnoticed internationally. Through its international outreach efforts, the EPA has worked with other countries to develop similar programs. Recently, the EPA worked with Mexico’s Ministry of Environment and Natural Resources to design a program based upon the SmartWay model. These efforts ultimately resulted in the implementation of the Transporte Limpio program in 2011, which uses many of the same tools and mechanisms as the SmartWay program. In addition to Mexico, programs based upon the SmartWay model have been implemented in Canada, the European Union, and Victoria, Australia.
The EPA posts these efficiency ratings on its website, and ranks companies according to their performance. This public list allows companies to see where they stand against other players in the industry. To help a company improve its performance, the EPA uses the company’s FLEET information to identify inefficiencies in their operations, equipment, and supply chains. The EPA then recommends strategies to improve overall company fuel efficiency. Often this includes recommendations that help companies improve their logistics so that they ship more efficiently and minimize miles travelled.4 Other strategies promoted by the EPA include technological initiatives, such as implementing engine idling reduction technologies, improving aerodynamics, using low resistance tires, and optimizing cargo weights. The EPA also educates drivers on more efficient driving strategies such as reducing cruising speeds below 65 miles per hour (105 km per hour). Companies that achieve superior results are allowed to display the SmartWay logo on their equipment and promotional materials. The EPA also gives annual awards to top performers.
CoMPleMeNTaRy CoMPoNeNTs
SmartWay also includes a number of other mechanisms that complement the objectives of the partnership. One of these programs is the testing and verification system for trucks and trailers. New models of trucks and trailers that meet certain guidelines for fuel efficiency are given permission to use the SmartWay logo. This element of the program is designed to both provide purchasers more information on efficient equipment and encourage technological innovation among manufacturers.
To help freight companies purchase more fuel efficient models or retrofit existing equipment, the SmartWay program contains a financing mechanism that offers low-interest loans with flexible terms. These loans are particularly targeted at small businesses that might not have the upfront capital to invest in efficiency technologies that will lead to long-term savings. Since 2008, the SmartWay Finance program has awarded almost USD 47 million to support development of loan programs to reduce fuel costs and emissions. These finance schemes are an innovative way for federal dollars to leverage significant additional resources. For example, through the SmartWay Clean Diesel Finance Program, a modest investment of federal funds can leverage private investment for the purchase of fuel-saving and emission reduction technologies for trucks.
Finally, the SmartWay program includes an international outreach component. This initiative provides guidance and resources to other countries interested in developing freight and shipping sustainability programs that draw lessons from SmartWay.
Model of suCCess
The SmartWay program distinctly benefits both government and private industry. As a result of the program, emissions of greenhouse gases and other harmful pollutants have been reduced, and businesses have saved money in the process. The program has helped the shipping industry save 6.5 billion dollars in fuel costs.5
Between 2004 and 2012, the SmartWay program achieved significant environmental results, including:6
• 23.6 million metric tons of carbon dioxide reductions;
• 478,000 tons of nitrogen oxide reductions;
• 22,000 tons of particulate matter reductions.
figure 1: Costs and fuel savings of smartway verified Technologies
trailer Side fairings$1,450–$2,500 Saves 7%
trailer mounted Gap reducers$700–$1,100 Saves 2%
Smartway approved tractor cap$1,300 differential cost Saves 5%
2010 engine$9,000 Plus Model Year Escalator– more than 2007 compliant engine
85% less pm than 2006my 85% less no
x than 2009my
diesel exhaust fluid $.01 cost per mileBurn 2 gallons DEF per 100 gallons of diesel
(cost per Gallon = $3.00)
aero mirror & bumper$325 differential cost Saves 2%
trailer boat tail$2,000–$3,000 Saves 5%
low rolling resistance tires$2,500 Trailer (2%)$3,000 Tractor (2%)Saves 4%
idle reduction equipment$6,000-$15,000Saves 8%
fuel tank Side fairings$1,700-$2,100Saves 1%
Source: Polovick, Buddy.

66 the road to namas 67united StateS
RefeReNCes
U.S. Environmental Protection Agency. June 3, 2010. “Designing and Implementing a Freight Sustainability Program: Tools, Best Practices, and Lessons Learned.” SmartWay Transport Partnership Workshop Course Book. Web. August 2012. <http://www.epa.gov/smartway/documents/international/event-2008/smartway-international-workbook.pdf>
U.S. Environmental Protection Agency. “SmartWay Program Highlights [EPA-420-F-12-057]” SmartWay Publications. Web. August 2012. <http://www.epa.gov/smartway/documents/publications/overview-docs/420f12057.pdf>
eNdNoTes
1 U.S. Environmental Protection Agency. “SmartWay Program Highlights [EPA-420-F-12-057].” SmartWay Publications. Web. August 2012. <http://www.epa.gov/smartway/documents/publications/overview-docs/420f12057.pdf>
2 U.S. Environmental Protection Agency. June 3, 2010. “Designing and Implementing a Freight Sustainability Program: Tools, Best Practices, and Lessons Learned.” SmartWay Transport Partnership Workshop Course Book. Web. August 2012. <http://www.epa.gov/smartway/documents/international/event-2008/smartway-international-workbook.pdf>
3 U.S. Environmental Protection Agency. “SmartWay Transport Partnership.” Web. October 2012. <http://www.epa.gov/smartway/partnership/index.htm>
4 The program does not address policy issues such as expanding freight rail infrastructure to facilitate mode shift from truck to rail.
5 U.S. Environmental Protection Agency, op cit. (note 1)
6 Ibid.
7 Ibid.
8 Polovick, Buddy. May 9, 2011. “SmartWay Transport Partnership.” UN CSD 19 Learning Center. U.S. EPA Presentation. Web. August 2012. <http://www.un.org/esa/dsd/csd/csd_pdfs/csd-19/learningcentre/presentations/May%209%20pm/1%20and%203%20-Buddy%20Polovick%20-%20SmartWay%20Learning%20Center%20Draft.pdf>
9 U.S. Environmental Protection Agency. 2011. “SmartWay and Small Business [EPA420-F-11-034].” SmartWay Publications. Web. August 2012. <http://www.epa.gov/smartway/documents/partnership/trucks/partnership/420f11034.pdf>
figure references
figure 1: Costs and fuel savings of smartway verified TechnologiesPolovick, Buddy. May 9, 2011. “SmartWay Transport Partnership.” UN CSD 19 Learning Center. U.S. EPA Presentation. Web. August 2012. <http://www.un.org/esa/dsd/csd/csd_pdfs/csd-19/learningcentre/presentations/May%209%20pm/1%20and%203%20-Buddy%20Polovick%20-%20SmartWay%20Learning%20Center%20Draft.pdf>


750 First Street, NE, Suite 940 Washington, DC 20002
p +1.202.408.9260 f +1.202.408.8896
www.ccap.org