the rising tide that failed to lift all boats - university of limerick
TRANSCRIPT
Kent Academic RepositoryFull text document (pdf)
Copyright & reuse
Content in the Kent Academic Repository is made available for research purposes. Unless otherwise stated all
content is protected by copyright and in the absence of an open licence (eg Creative Commons), permissions
for further reuse of content should be sought from the publisher, author or other copyright holder.
Versions of research
The version in the Kent Academic Repository may differ from the final published version.
Users are advised to check http://kar.kent.ac.uk for the status of the paper. Users should always cite the
published version of record.
Enquiries
For any further enquiries regarding the licence status of this document, please contact:
If you believe this document infringes copyright then please contact the KAR admin team with the take-down
information provided at http://kar.kent.ac.uk/contact.html
Citation for published version
Secker, Andrew D. and Davies, Matthew N. and Freitas, Alex A. and Timmis, Jon and Clark,Edward and Flower, Darren R. (2009) An artificial immune system for clustering amino acidsin the context of protein function classification. Journal of Mathematical Modelling and Algorithms,8 . pp. 103-123. ISSN 1570-1166.
DOI
https://doi.org/10.1007/s10852-009-9107-3
Link to record in KAR
https://kar.kent.ac.uk/24125/
Document Version
UNSPECIFIED
J Math Model Algor (2009) 8:103–123DOI 10.1007/s10852-009-9107-3
An Artificial Immune System for Clustering AminoAcids in the Context of Protein Function Classification
A. Secker · M. N. Davies · A. A. Freitas ·
J. Timmis · E. Clark · D. R. Flower
Received: 15 October 2008 / Accepted: 20 January 2009 / Published online: 25 February 2009© Springer Science + Business Media B.V. 2009
Abstract This paper addresses the classification task of data mining (a form ofsupervised learning) in the context of an important bioinformatics problem, namelythe prediction of protein functions. This problem is cast as a hierarchical classificationproblem. The protein functions to be predicted correspond to classes that are ar-ranged in a hierarchical structure (this takes the form of a class tree). The main con-tribution of this paper is to propose a new Artificial Immune System that creates anew representation for proteins, in order to maximize the predictive accuracy of ahierarchical classification algorithm applied to the corresponding protein functionprediction problem.
Keywords Artificial immune systems · Optimisation · Bioinformatics ·
Classification · Clustering
Mathematics Subject Classifications (2000) 68T20 · 68W05
1 Introduction
This paper addresses classification within data mining in the context of bioinfor-matics, more precisely the prediction of protein function. In essence, a proteinconsists of a linear sequence of amino acids, and predicting the function of a
A. Secker · A. A. Freitas (B)Computing Laboratory and Centre for BioMedical Informatics,University of Kent, Canterbury, CT2 7NF, UKe-mail: [email protected]
M. N. Davies · D. R. FlowerThe Jenner Institute, University of Oxford, Compton, Newbury, Berkshire, RG20 7NN, UK
J. Timmis · E. ClarkDepartments of Computer Science and Electronics, University of York, York, YO10 5DD, UK
104 J Math Model Algor (2009) 8:103–123
protein, based on information derived from its sequence of amino acids, remainsa subject of interest in bioinformatics. The problem is important because, althoughthe structure and function of a protein can in theory be determined by experimentalbiological techniques, such techniques are in general very time consuming andexpensive. For instance, crystallography can be used to determine a protein’s three-dimensional structure, which greatly helps in determining its function, but this is avery slow technique (some proteins take months or even a year to be crystallized),and some proteins cannot be crystallized at all. This is particularly the case fortransmembrane proteins. Computational prediction of protein function is in generalless reliable than a biological experimentation, of course, but it is much faster andcheaper, and so it can provide useful clues for biologists to perform slow, expensiveresearch in a more selective manner (investigating potential functions suggested bycomputational predictions, instead of investigating a much larger number of potentialfunctions).
The main contribution of this paper is to propose a new Artificial Immune System(AIS) – a variant of opt-aiNet (a well-known AIS) – that creates a new representationfor proteins, in order to maximize the predictive accuracy of a classification algorithmapplied to the corresponding protein function prediction problem.
In this context, this paper proposes an AIS that evolves clusters of amino acidsoptimized for a given type of protein. The evolved clusters are then used to definethe protein representation that will be used by the classification algorithm. In thewords of machine learning and data mining, the AIS algorithm solves a clustering(unsupervised learning) problem, consisting of finding the optimal clustering ofamino acids for the type of protein whose data is being mined, and the result ofthe AIS is then used to solve a classification (supervised learning problem).
The AIS proposed in this paper differs from the original opt-aiNet in threesignificant ways, namely: (a) it uses a novel immune cell representation suitable forthe target problem; (b) it uses a different type of mutation, again suitable for thetarget problem; (c) and it uses a new fitness function, which is very different fromand much more complex than the one used by opt-aiNet.
The proposed AIS is evaluated on a challenging real-world protein functionprediction problem: the classification of GPCRs (G-protein-coupled receptors) intotheir functional classes. GPCRs constitute a large and diverse group of proteinsthat perform many important physiological functions [4–6]. The GPCR classificationproblem which is addressed is especially challenging because it involves a largenumber of classes organized in a hierarchy—being an instance of the so-calledhierarchical classification problem—as will be explained later.
The remainder of this paper is organized as follows. Section 2 describes how theproblem of predicting GPCR functions is cast into a classification problem. Thissection also provides some background on bioinformatics, in order to make the papermore understandable to readers without a biology background. Section 3 describedthe proposed AIS for clustering amino acids. Section 4 reports computational results,and Section 5 concludes the paper.
J Math Model Algor (2009) 8:103–123 105
2 Casting Protein Function Prediction as a Classification Problem in Machine
Learning/Data Mining
2.1 G-Protein Coupled Receptor (GPCR) Classification
Proteins are large molecules comprised of a long chain of amino acids that performa wide range of vital functions in living organisms. A protein consists of a linearsequence of amino acids—each of which can be represented by a single letter. Forinstance, the sub-sequence “AVC...” corresponds to (A)lanine, (V)aline, (C)ysteine.There are 20 standard amino acids, each represented as a different letter and theorder with which these amino acids are chained together is known as the protein’sprimary sequence. These long chains fold into complex structures allowing them toperform functions. In its folded shape the protein may present a certain conformationon its surface that may allow it to bind to another protein or catalyse a particularreaction.
GPCR proteins are transmembrane proteins, meaning that they fold themselvessuch that some parts of the protein are found inside a cell, while other parts areexternal. GPCRs are bound by a variety of different molecules (ligands) foundoutside the cell. The binding activates the GPCR, which in turn binds a G-proteininside the cell, often changing the behaviour of that cell. The GPCR superfamilyis a large and diverse multigene superfamily of integral membrane proteins thatperform many important physiological functions [4–6]. GPCRs control and/or affectphysiological processes as diverse as neurotransmission, cellular metabolism, secre-tion, cellular differentiation and inflammatory responses [7]. They also affect taste,smell and vision. Malfunctions in GPCR expression can result in ulcers, allergies,carcinomas and migraine attacks. Mutations in GPCR-coding genes have been linkedto over 30 human diseases including retinitis pigmentosa, hypo- and hyperthyroidism,nephrogenic diabetes insipidus as well as several fertility disorders [8]. The receptorsbinding endogenous peptides have an import role in mediating the effects of awide variety of neurotransmitters, hormones and paracrine signals. The receptorsthat bind biogenic amines, e.g. norepinephrine, dopamine, and serotonin, are verycommonly modulated by drugs. Pathological conditions, including Parkinson’s dis-ease, schizophrenia, drug addiction, and mood disorders are examples of whereimbalances in the levels of biogenic amines cause altered brain functions. Indeed,GPCR proteins are a common target for therapeutic drugs and approximately 50%of all marketed drugs are targeted towards one of the receptors [9].
The most widely used classification for the superfamily was introduced in the firstversion of the GPCR database (GPCRdb) [10]. The classification system dividesthe GPCRs into six families, designated A–F. These were derived from the use ofcharacteristic “fingerprints”, unique compositions of similar regions when a primarysequence is compared with another [11, 12]. The classes can further be divided intosub-families and sub-sub families based upon the function of the GPCR protein andthe specific ligand that it binds.

106 J Math Model Algor (2009) 8:103–123
2.2 Representing Proteins by Local Descriptors of Amino Acid Sequences
Given a protein’s sequence of amino acids, one can try to determine its functionvia either biological experiments or computational prediction methods. The formerproduce in general more precise results, but are much more time consuming andexpensive. Hence, the latter is often used in practice, and it can provide valuableinformation for the more cost-effective use of biological experiments. This work ad-dresses the computational prediction of protein function, by casting this problem as aclassification (supervised learning) problem in machine learning/data mining, whereprotein functions are classes and attributes derived from the protein’s sequence ofamino acids are the predictor attributes.
The length of the primary sequence varies widely across different proteins. Sincethe vast majority of classification algorithms can cope only with datasets where allexamples (records or data items) have the same length, it is necessary to convertall proteins (examples) to the same fixed number of attributes, using an attributerepresentation at higher level of abstraction than the full sequence of amino acids.
This paper is concerned with finding an optimum representation for a protein. Inour experience with classifying GPCRs, a number of different representations havebeen used. For example, previously, we have published work which uses five“z-values” to represent a protein sequence [13, 14]. In this case, 26 separate physic-ochemical properties are reduced to five empirical ‘z’ values [15, 16]. One set ofz-values has been determined for each of the 20 amino acids. Each amino acidin the sequence under scrutiny can then be transformed into its respective set ofz-values. Once this has happened for every protein in the sequence, it was found thattaking the mean of each z-value over the sequence resulted in a representation thatwas very competitive in terms of accuracy. As the mean is taken over each z-valueindividually, the entire protein sequence (usually many hundreds of amino acids) isreduced to just five attributes. More recent work, however, has shown that the useof local descriptors can produce superior results in the shape of higher classificationaccuracy.
2.3 Creating Attributes Using Local Descriptors
Local descriptors [1, 2] are a commonly used method to classify protein families. Thehigh-level representation used here involves the attribute creation technique definedin [2], which is based on summarising the protein’s entire sequence of amino acidsby a fixed number of local descriptors (attributes). As there is greater structural thansequential homology with the GPCR superfamily, alignment-free approaches havebeen more effective at classification than techniques based upon sequence similarity[13, 17].
A method of creating a fixed-length representation for a protein using localdescriptors is described below. Cui et al. [1] divided the 20 amino acids into threefunctional clusters: hydrophobic (amino acids C, V, L, I, M, F, W), neutral (aminoacids G, A, S, T, P, H, Y), and polar (amino acids R, K, E, D, Q, N), as suggested byChothia and Finkelstein [3]. (The term “hydrophobic” means “with fear of water”,so a hydrophobic amino acid tends to be buried within a protein, rather than inits surface exposed to water; the term “polar” has the opposite meaning.) It isthen possible to substitute the amino acids in the sequence for the cluster in which

J Math Model Algor (2009) 8:103–123 107
that amino acid belongs. Assuming H = hydrophobic, N = neutral and P = polar,the protein sequence CVGRK would be converted to HHNPP. The position orvariation of these identifiers within a sequence is the basis of three local descriptors:composition (C), transition (T), and distribution (D) as follows:
• C is the proportion of amino acids with a particular property (drawn from aparticular cluster such as the hydrophobic one). As an example, given the clusterH, we can determine C(H) over the example sequence of HHNPP as 0.4 as twoof five positions in the sequence are of value H.
• T is the frequency with which amino acids with one property are followed byamino acids with a different property. Thus to compute T(N) over the examplesequence, we can see there is a transition between H and N from positions twoto three, then a transition from N to P between positions three and four. In thiscase T(N) = 2/4 = 0.5 as there are four places where a transition may occur. Anytransitions between H and P are ignored here as neither of these clusters are thesubject.
• D measures the chain length within which the first, 25%, 50%, 75% and 100%occurrences of the particular property are located.
Given that the amino acids are divided into three clusters in this instance,the calculation of the C, T and D descriptors generates 21 attributes in total (threefor C, three for T and 15 for D). While this technique is valid if applied over thewhole amino acid sequence, Tong et al. [2] split the amino acid sequences intoten overlapping regions (Fig. 1), hypothesising that these regions will capture thedifferent characteristics of the different places along the protein. For sequencesA–D and E–F there may be cases where the sequence cannot be divided so thatall elements have the same length. In this case each subsequence may be extendedby one residue if required. Each descriptor—C, T, and D—is calculated over the tensubsequences.
The number of attributes created with this technique therefore generalises to70n, where n is the number of amino acid clusters. In the case of the three clustersof amino acids used by Cui et al., proteins are now represented by 210 numerical
Fig. 1 The ten descriptor regions (A–J) for a hypothetical protein sequence of 16 amino acids.Adapted from Tong et al. [2]

108 J Math Model Algor (2009) 8:103–123
descriptors, which can be offered to any of the plethora of well understood, welldocumented classification algorithms.
2.4 Motivation for Optimisation
In the case of [2], the three clusters as defined in [1] were used, no explicit explanationwas included to justify the use of this particular clustering scheme. While there existsa truly enormous number of ways to partition the 20 amino acids, it seems clear thatsome will be more useful than others. The effectiveness of the techniques using localdescriptors is dependent largely on the underlying amino acid grouping chosen as thebasis of the descriptors. The accuracy of the technique can therefore be improved byusing the “correct” grouping. However, in general it is not possible to determine, apriori, which amino acid clustering will result in the optimal performance for a givenprotein dataset. Sensibly, a biologically grounded grouping scheme would be usedover one created at random. As an illustration, Table 1 shows a selection of candidategroupings identified in previous work [18]. The interested reader is directed towardsthis reference for a short literature review of papers that suggest groupings alongwith a great deal more information about the biological basis of such groupings.Each of the groupings in this table is as valid as any other as there is no way to tella priori which group will yield the optimal accuracy when the prediction task withrepresentation based on the generated attributes is attempted.
While a grounded grouping is likely to do well, its performance is unlikely tobe optimal. There are numerous other variables that will have bearing on the finalperformance of the representation. For example, the best set of groupings may notbe just hydrophobicity for example, it may be a combination of hydrophobicity and
Table 1 Candidate sets of amino acid groupings from Li et al. 2003 [19] and Cannata et al. 2002 [20]taken from [18]
Grouping No. of groups Reference
CMFILVWY AGTSNQDEHRKP 2 Li et al. [19]
CMFILVWY AGTSP NQDEHRK 3 Li et al. [19]
CMFWY ILV AGTS NQDEHRKP 4 Li et al. [19]
FWYH MILV CATSP G NQDERK 5 Li et al. [19]
FWYH MILV CATS P G NQDERK 6 Li et al. [19]
CFYWMLIV GPATSNHQEDRK 2 Li et al. [19]
CFYWMLIV GPATS NHQEDRK 3 Li et al. [19]
CFYW MLIV GPATS NHQEDRK 4 Li et al. [19]
CFYW MLIV G PATS NHQEDRK 5 Li et al. [19]
CFYW MLIV G P ATS NHQEDRK 6 Li et al. [19]
ARNDCQEGHKPST ILMFWVY 2 Cannata et al. [20]
ARNDQEGHKPST C ILMFWVY 3 Cannata et al. [20]
ARNDQEGHKPST C ILMFVY W 4 Cannata et al. [20]
AGPST RNDQEHK C ILMFVY 4 Cannata et al. [20]
AGPST RNDQEK H C ILMFVY W 6 Cannata et al. [20]
A RK N D C Q E G H IV LM F P ST W Y 16 Cannata et al. [20]
AS RK N D C Q E G H IV LM F P T W Y 16 Cannata et al. [20]
A R K N D C Q E G H IV LM FY P ST W 16 Cannata et al. [20]
AST R K N D C Q E G H IV LM F P W Y 16 Cannata et al. [20]
A R K N D C QE G H IV LM F P ST W Y 16 Cannata et al. [20]

J Math Model Algor (2009) 8:103–123 109
size. Likewise there may be a combination of more than two physical chemical orelectrical properties that could combine to create the best sets of groupings for aparticular application. However, trying to determine accurate groupings of aminoacids is extremely difficult due to the large number of possible groupings of 20objects. The number of permutations may be determined by the Stirling numberwhere S(n,k) represents the number of ways to partition a set on n object into kgroups. If k = 2 or k = 5 then the number of possible permutations are 524,287 and749,206,090,500 respectively [21]. It is therefore intractable to evaluate every singlepotential grouping.
In addition, the classifier used may have certain biases that can be exploited duringthe clustering procedure. For example some representations define 16 differentgroupings [20], which would result in 1,120 attributes being created. It is possible thata particular classifier does not cope well with a large number of attributes and as suchthis particular grouping may be incompatible with the, presumably otherwise good,classification algorithm. The keys to the success or failure of the technique describedthus far are:
1. The number of clusters used, and2. The specific amino acids that are included in each cluster.
Hence, in principle we can use a data-driven approach to evolve an amino acidclustering that approaches optimality with respect to both the data being mined andthe classification algorithm applied to that data. The advantage of using such anoptimiser is that a classifier may be used to gauge the quality of a solution or solutionsat each stage in the optimisation process. Thus the optimisation of the representation(groupings) is guided by the output of the classification algorithm that will be usedin the final testing stage. Therefore, the representation is able to exploit any biasin that classifier to improve prediction quality. The system described in this paperwill, therefore, optimise amino acid groupings in a data driven manner such thatclassification accuracy is maximised when the groups are used to create predictorattributes and the resultant data representation is tested using a classifier.
2.5 Hierarchical Classification of G-Protein-Coupled Receptors (GPCRs)
The method of optimising clusters for a local descriptor-based attribute constructiontechnique, as proposed in this paper, is generic to any protein dataset where itis sensible to represent the data using the local descriptors representation, but itshould be pointed out that the GPCR dataset used in this study is hierarchical innature. As described in Section 2.1. While the task of this paper is to consider theoptimisation of a protein representation, this representation must be assessed usinga classifier. As such it is worth briefly outlining the particularities of hierarchical dataand hierarchical classification.
Some data can be naturally organised as a hierarchy of classes. The classificationof data in such a hierarchy poses some unique challenges to data miners, such asthe large number of classes to be predicted. Most classifiers deal with flat data sets,i.e., data for which a single level of classes may be assigned to an example. In ahierarchical dataset an example may be assigned to one class at a number of levels ofspecialisation. The most general level being near the root of the tree and becomingmore specialised as the tree’s branches are traversed. In the hierarchy of GPCR

110 J Math Model Algor (2009) 8:103–123
Fig. 2 Example of a hierarchical dataset (A) and how that hierarchy may be reflected in a tree ofclassifiers (B) ready for a top-down approach to classification
proteins, each class has exactly one parent—i.e. the data is structured like a tree.The class structure of a typical flat dataset will contain, for example, classes A, Band C which are all equally different from each other. However, in a hierarchy someclasses may be more alike than others. Given the class tree in Fig. 2a, Classes A andB are equally dissimilar, but these classes may subdivide such that classes A.1 andA.2 are more alike than A.1 and B.1 as A.1 and A.2 share a common parent class.
There are a range of strategies available for predicting hierarchical classes [22].The simplest is to flatten the dataset to one single level so that no superclassesor subclasses are present, then use one of the standard classification algorithms topredict the class. However, this strategy has two major drawbacks.
1. It does not take advantage of the information implicit in the class structure.2. It will often require a single classifier to distinguish between a huge number of
classes.
The top-down approach to classification on the other hand tackles both of theseissues by constructing a tree of classifiers, thus converting the hierarchical classifica-tion into a number of flat classification problems that may be solved independentlyby running a flat classifier for each. The class structure is reflected by the structure ofthe classifiers while each classifier needs only to distinguish between a vastly reducednumber of classes. Further explanation is reserved until Section 4.2.
3 The Proposed Artificial Immune System for Amino Acid Clustering
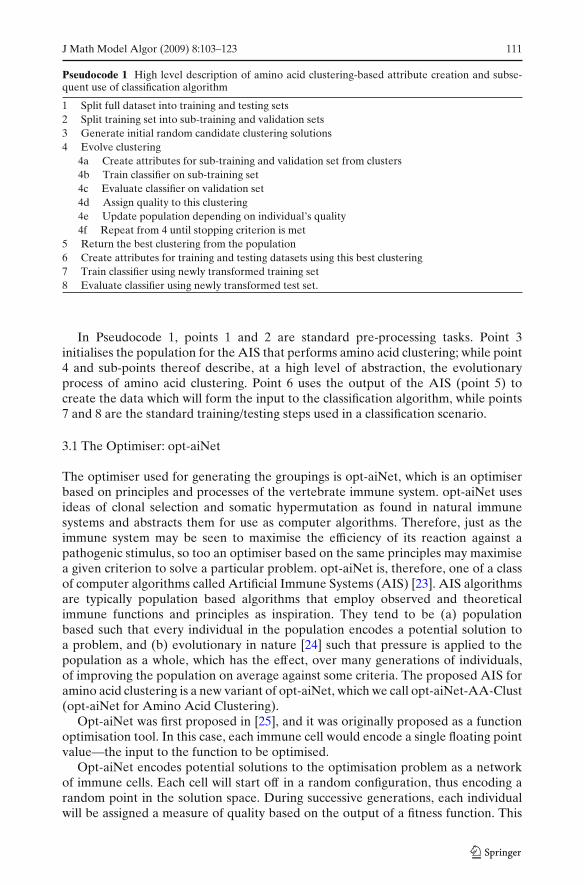
Pseudocode 1 shows the most general view of the process of attribute creationbased on amino acid clustering (performed by an AIS) and subsequent use of aclassification algorithm. Note that this process of attribute creation (or construction)based on clustering should not be confused with attribute selection. The goal ofattribute selection is essentially to choose a subset of relevant attributes, out of allavailable attributes. This work rather involves attribute construction, where the goalis to create new attributes (new descriptors of amino acid sequences correspondingto higher-level information about proteins) based on the original sequence of aminoacids (corresponding to lower-level information about proteins). The actual processof attribute creation is performed by using a clustering algorithm that groups togethersimilar amino acids, and the result of this clustering is then used to produce a new setof predictor attributes for the classification algorithm.
J Math Model Algor (2009) 8:103–123 111
Pseudocode 1 High level description of amino acid clustering-based attribute creation and subse-quent use of classification algorithm
1 Split full dataset into training and testing sets
2 Split training set into sub-training and validation sets
3 Generate initial random candidate clustering solutions
4 Evolve clustering
4a Create attributes for sub-training and validation set from clusters
4b Train classifier on sub-training set
4c Evaluate classifier on validation set
4d Assign quality to this clustering
4e Update population depending on individual’s quality
4f Repeat from 4 until stopping criterion is met
5 Return the best clustering from the population
6 Create attributes for training and testing datasets using this best clustering
7 Train classifier using newly transformed training set
8 Evaluate classifier using newly transformed test set.
In Pseudocode 1, points 1 and 2 are standard pre-processing tasks. Point 3initialises the population for the AIS that performs amino acid clustering; while point4 and sub-points thereof describe, at a high level of abstraction, the evolutionaryprocess of amino acid clustering. Point 6 uses the output of the AIS (point 5) tocreate the data which will form the input to the classification algorithm, while points7 and 8 are the standard training/testing steps used in a classification scenario.
3.1 The Optimiser: opt-aiNet
The optimiser used for generating the groupings is opt-aiNet, which is an optimiserbased on principles and processes of the vertebrate immune system. opt-aiNet usesideas of clonal selection and somatic hypermutation as found in natural immunesystems and abstracts them for use as computer algorithms. Therefore, just as theimmune system may be seen to maximise the efficiency of its reaction against apathogenic stimulus, so too an optimiser based on the same principles may maximisea given criterion to solve a particular problem. opt-aiNet is, therefore, one of a classof computer algorithms called Artificial Immune Systems (AIS) [23]. AIS algorithmsare typically population based algorithms that employ observed and theoreticalimmune functions and principles as inspiration. They tend to be (a) populationbased such that every individual in the population encodes a potential solution toa problem, and (b) evolutionary in nature [24] such that pressure is applied to thepopulation as a whole, which has the effect, over many generations of individuals,of improving the population on average against some criteria. The proposed AIS foramino acid clustering is a new variant of opt-aiNet, which we call opt-aiNet-AA-Clust(opt-aiNet for Amino Acid Clustering).
Opt-aiNet was first proposed in [25], and it was originally proposed as a functionoptimisation tool. In this case, each immune cell would encode a single floating pointvalue—the input to the function to be optimised.
Opt-aiNet encodes potential solutions to the optimisation problem as a networkof immune cells. Each cell will start off in a random configuration, thus encoding arandom point in the solution space. During successive generations, each individualwill be assigned a measure of quality based on the output of a fitness function. This
112 J Math Model Algor (2009) 8:103–123
function will take the point in the solution space encoded by an individual and returnthe quality of that point. The algorithm then uses the immune processes of somatichypermutation and clonal expansion to impart dynamics on the population. Allmembers of the population will, at this time, create clones, but the number of clonesproduced will vary in proportion to the measured fitness of the parent. This has theeffect of, over time, increasing the average quality of the population compared withthis objective fitness function. Finally, two other mechanisms are called upon at eachiteration, these are network suppression and the introduction of randomly generatedcells. The former will ensure a population that represents the solution efficiently ascells encoding the same or similar areas of space will be removed, while the latter willensue the population cannot get stuck on a local optimum as it will maintain diversityin the population.
Several modifications were required to allow the opt-aiNet algorithm to work inour scenario of amino acid clustering. These included the changing of the individualrepresentation from a real value to a string of symbols to represent clusters, thechanging of the mutation procedure (to mutate a symbol rather than a real-valuednumber), the changing of the fitness evaluation from a straightforward mathematicalfunction to a much more complex system for creating and evaluating the attributesproduced by the clustering results and some minor procedural changes such asthe termination function. In the case of the original opt-aiNet, the algorithm willterminate when there has been no improvement above a threshold in the populationbetween successive iterations. In this case, it is possible that many iterations couldpass before an improvement is found and thus the system terminates after a givennumber of iterations. These changes are explained in more detail below.
3.1.1 Individual (Immune Cell) Representation
The algorithm uses the clonal selection principle found in immunology to drive theoptimisation process. The basis of the algorithm is a population of individuals whicheach encode a potential solution to the problem; in this case therefore each individualencodes a grouping scheme for the 20 amino acids. Each individual (immune cell)encodes a candidate solution to the problem of clustering the 20 amino acids. Moreprecisely, each individual consists of a vector with 20 elements, < c1, . . . , c20 >, wherethe ith element, ci = 1, . . . , 20, indicates the id of the cluster to which the ith aminoacid is assigned since there are 20 amino acids. To consider a simple hypotheticalexample, if the first five elements of a vector were 3, 1, 2, 1, 3, this would mean thatthe second and fourth amino acids would be assigned to the same cluster (arbitrarilydenoted as cluster 1); the first and fifth amino acids would be assigned to anothercluster (denoted as cluster 3); and the third amino acid would be assigned to yetanother cluster (denoted as cluster 2); and so on, for all the 20 amino acids. The actualvalue of the group identifier is insignificant. It is used only to identify the group.Different individuals can produce different numbers of clusters, varying from onesingle cluster (all positions in the vector have the same value) to 20 different clusters(all vector positions have different values). The layout of an immune cell is shownin Fig. 3. In this case only five positions are shown corresponding with the exampleabove, whereas in the algorithm all 20 amino acids will be represented.

J Math Model Algor (2009) 8:103–123 113
Fig. 3 Immune cell encoding. The top of the figure shows the actual information encoded by eachimmune cell while the bottom shows how that encoding may be interpreted to define groups foramino acids
3.1.2 The Algorithm’s Pseudocode and Search Operators
The opt-aiNet-AA-Clust algorithm proceeds as shown in Pseudocode 2, which is amore detailed description of points 4a–4f from Pseudocode 1.
The algorithm is initialised by generating a population of immune cells suchthat the representation of each immune cell is in a random configuration. That is,amino acids are randomly assigned to clusters. Next, the quality of each immune cell(the accuracy of the attributes defined by interpreting the clusters defined by thatindividual) is assessed (see Section 3.1.3). Each immune cell is then cloned (copies ofthat cell are produced) mimicking the clonal expansion stage of an immune reaction.
These clones are mutated with a rate inversely proportional to their parent’s (andtherefore their) quality. More precisely, point 2c of pseudocode 2 is implemented bythe following formula (applied to each clone i):
Num_mut_AA (i) = k ∗ (1 − parent (i) . f itness) ∗ length (i)
Pseudocode 2 opt-aiNet (adapted from [25])
Input
nt = network affinity threshold
nc = number of clones
s = population size
Output:
N =set of immune cells in the last iteration (cell with highest fitness is the solution returned
to user)
Begin
1. Create an initial random set of immune cells, N, such that|N| = s
2. repeat{
2a. Determine fitness of each immune cell member of N
2b. Generate nc clones for all elements of N
2c. Mutate attributes of each clone based on the fitness of its parent (P)
2d. Determine the fitness of all new clones
2e. For each P, determine the offspring with the highest fitness (Ch).
2f. If fitness(Ch) > fitness(P) then replace P with offspring Ch in N
2g. Determine the affinity between each pair of cells in N and, for each pair of cells with an
affinity less than a pre-specified threshold (nt), remove the lowest affinity cell in that pair
from N // network interactions
2h. Introduce new, randomly generated, immune cells into Nsuch that|N| = s.
}Until (a stopping condition has been met)
End

114 J Math Model Algor (2009) 8:103–123
where Num_mut_AA(i) is the number of amino acids whose cluster indices will bemutated in the clone i, parent(i).fitness is the fitness value of the parent immune cellfrom which the clone i has been generated, and length(i) is the number of aminoacids in clone i (20 in our case). The constant k was empirically set to 4, based onpreliminary experiments. Once the number of positions (amino acids’ cluster indices)to be mutated has been decided by the above formula, the choices of the actualpositions to be mutated are random. The actual value (cluster index) that a positionis mutated into is, again, randomly generated—but it is guaranteed to be in the validrange of the cluster indices, of course.
The mutation scheme used in this algorithm is somewhat different to the originalopt-aiNet. In the latter, the single value encoded by each immune cell will beincremented or decremented with a magnitude based on its fitness. However, asthe representation has changed, so must the mutation scheme and a point mutationin this context is a change in the value of one position in the immune cell’s vector(Fig. 4). This has the effect of:
1. Switching an amino acid from one cluster to another; or2. Taking the amino acid out of a cluster with others and placing it in a cluster on
its own, creating a new group; or3. Taking an amino acid out of a group in which it was the sole occupant, and
placing it in an existing group, thus removing that group; or4. Taking an amino acid out of a group in which it is the sole occupant and placing
it in a new group on its own. In this case, the mutation has had no effect on theobserved groupings.
The better the solution encoded by an immune cell the fewer positions are mutated.This has the effect of drastically changing poorly performing clustering schemes inthe hope that a better solution may be found, while at the same time not destroyingsolutions that are already good. These newly mutated clones are then assessed forquality once again and, for each parent, its best (highest fitness) clone is determined.If the fitness of that clone is higher than the fitness of its parent, the former replacesthe latter in the population.
Next, for all cells in the population, cells who are badly performing (with lowfitness) and have low “affinity” with another cell are discarded. Affinity is actuallya measure of distance, but we keep the term affinity here to be consistent with themajority of the AIS literature. Affinity is calculated by the well-known Euclideandistance [23]. The discarded cells are replaced in the population with an equalnumber of randomly configured immune cells, in order to keep the population sizeconstant across all the iterations of the algorithm. This injection of randomness intothe population discourages the population converging prematurely on a single localoptimum.
Fig. 4 A point mutation at the first element removes the corresponding amino acid from group 3and places it in group 1
J Math Model Algor (2009) 8:103–123 115
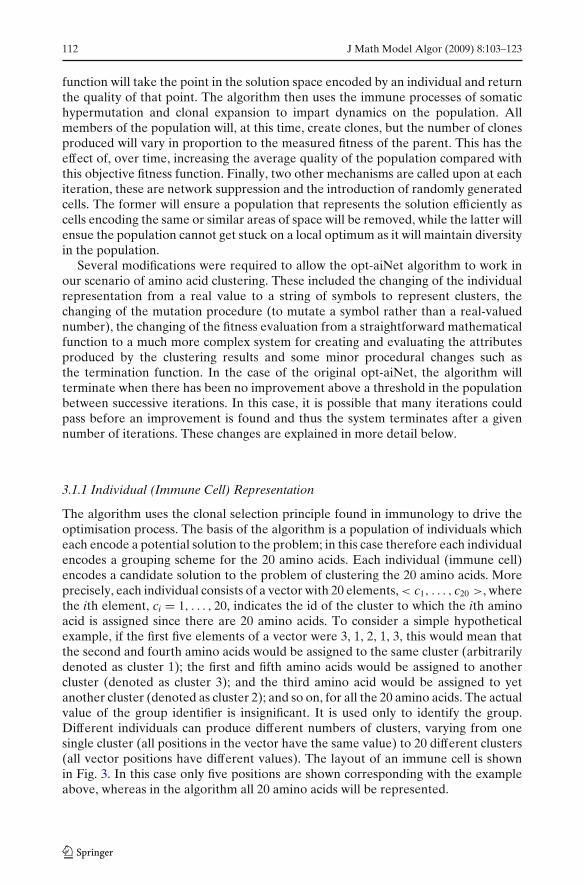
Fig. 5 Division of dataset fortraining and testing
3.1.3 Fitness Function
The original opt-aiNet used a single mathematical function as a measure of qualitywhereas the assessment of quality for each immune cell in this scenario is not asstraightforward. Several stages must be gone through to assess the quality of therepresentation as encoded by a single immune cell. As each immune cell encodesa different set of clusters, it is important to note here that the above-describedentire process of creating the new training set from the encoded clustering and thentraining/evaluating the classifier must be repeated every time a fitness evaluationis requested. For each immune cell, the defined clusters must firstly be translatedfrom the immune cell feature vector, as shown in Fig. 3. All protein sequencesof a training set are transformed using the defined clusters and the method setout in Section 2.3. This produces an entire dataset consisting of elements with 70n
predictor attributes (where n is the number of clusters as defined by the particularimmune cell). This dataset must then be split into two further sets—sub-trainingand validation, as shown in Fig. 5. In these tests, the split of the training examplesbetween the sub-training and validation datasets is fixed at 80%/20%. The chosenclassification algorithm is now trained on the sub-training set and evaluated usingthe validation set. The fitness of the cell is the percentage predictive accuracy outputfrom the classifier on that validation set. As all fitness evaluations take place usingthe same classifier, the changing fitness values are reflective of the representationdefined by the cell.
Note how this predictive accuracy is measured on the validation set, rather thanthe test set. The optimiser cannot have access to the test set until the test stage of thealgorithm. If the fitness was determined using this test set then the reported accuracywould be artificially inflated as the optimisation would have taken place using thetest data for guidance.
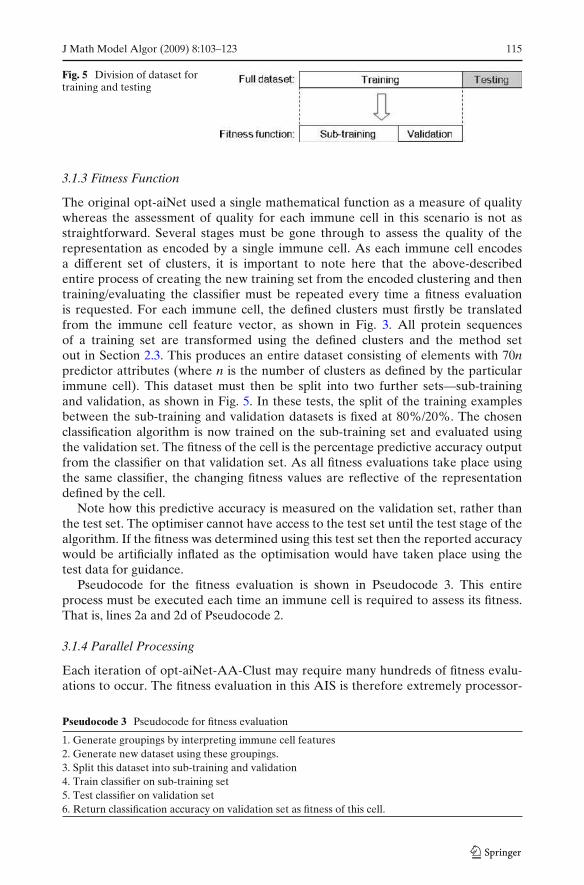
Pseudocode for the fitness evaluation is shown in Pseudocode 3. This entireprocess must be executed each time an immune cell is required to assess its fitness.That is, lines 2a and 2d of Pseudocode 2.
3.1.4 Parallel Processing
Each iteration of opt-aiNet-AA-Clust may require many hundreds of fitness evalu-ations to occur. The fitness evaluation in this AIS is therefore extremely processor-
Pseudocode 3 Pseudocode for fitness evaluation
1. Generate groupings by interpreting immune cell features
2. Generate new dataset using these groupings.
3. Split this dataset into sub-training and validation
4. Train classifier on sub-training set
5. Test classifier on validation set
6. Return classification accuracy on validation set as fitness of this cell.

116 J Math Model Algor (2009) 8:103–123
intensive and as such the assessment of immune cell fitness was distributed over acluster of 30 computers. As the proportion of the time taken to perform the fitnessevaluation was the overwhelming majority of the time taken to complete a run of thealgorithm, the fitness procedure was the obvious point for parallelisation. It provedfairly straightforward to parallelise the fitness function in this case. Each node in thecluster acted as a server with the main algorithm as a client. Although it will changefrom run to run, during a single run of the algorithm the training set will not change.Therefore, as each node in the cluster has its own copy of the training partition ofthe data set, each fitness evaluation becomes entirely atomic in nature. In this case,the algorithm can proceed until it reaches line 4a in Pseudocode 1. At this pointlines 4a–4d would usually be executed once for each member of the population, oneafter another. Instead multiple fitness evaluations can occur simultaneously. At line4a, the main thread of control will distribute the feature vector of each member ofthe population to a node in the cluster of servers and then pause. As every nodehas its own copy of the training and validation set it can create the groups fromthe feature vector and process the training set to create the dataset unique to thatindividual cell. From then on each server can apply the converted data to a pre-selected classification algorithm (each node will use the same algorithm of course).Once the server has trained the algorithm on the converted dataset and tested on thesame, the percentage accuracy may be returned. This accuracy is then associated withthe original immune cell as that cell’s current fitness. The main algorithm will remainpaused until all evaluations are complete. The main algorithm can then resume andcontinue as if the fitness evaluations had taken place in the normal, serial manner.
It can be seen therefore that if the number of members of the population is keptlower than the number of nodes (n) in the computing cluster, all fitness evaluationswill complete in the time of the slowest fitness evaluation. If the number of membersof the population (p) is n + 1 < p < 2n the fitness evaluation must take place in tworounds with n evaluations in the first and p − n taking place in the second. The totaltime will be the sums of the slowest evaluation in round 1 and the slowest evaluationin round 2. As such, it was decided to keep the number of cells in the populationlower than the number of nodes in the cluster to keep the evaluation time to theminimum possible. Preliminary tests showed that a small number of cells was quitesufficient to maintain an acceptable level of optimisation performance. As such, only20 cells were used as this resulted in up to ten redundant nodes in the cluster atany one time. This was done as a precaution as, if at any time p exceeded n theevaluation time for every fitness evaluation doubles and the run would not completein an acceptable amount of time. It was found that executing these fitness evaluationsin parallel was the only way to ensure the algorithm completed a reasonable numberof iterations in a reasonable amount of time.
4 Computational Results
4.1 Test Protocol
The new variant of opt-aiNet proposed in Section 3—opt-aiNet-AA-Clust—wasimplemented by modifying the original opt-aiNet’s code kindly obtained fromAndrews [26], which formed part of [27]. The WEKA data mining toolkit [28] was
J Math Model Algor (2009) 8:103–123 117
used to provide the classification algorithm used in the fitness function, many ofthe algorithms used in the selective top-down classifier and a number of auxiliaryfunctions regarding data manipulation. Some algorithms from [29] were also usedin the selective top down classifier. The dataset used for training and testing wasour own comprehensive dataset of GPCR sequences. This dataset, called the GDSdataset, originally contained 8,354 protein sequences (examples) in 108 classes, butclasses with fewer than ten examples were discarded—since: (a) in general such rareclasses cannot be reliably predicted and (b) when diving the dataset into ten foldsfor a cross-validation procedure, it ensures we can include at least one example ofeach class in each fold. Once examples of these classes had been removed, this left8,222 protein sequences in the dataset. The dataset contains five classes (A–E) at thefamily level (the first level), 40 classes at the sub-family level and 108 classes at thesub-sub-family level (the third level). This dataset is described in more detail in [13].
This full dataset was divided up into ten folds and the data was sampled such thateach fold contained at least one example of every class. All tests were therefore,run ten times, once for each fold. Each training set was split into sub-training andvalidation folds for the optimiser in the ratio 80%/20% (as shown in Fig. 5) and foreach of the training sets used by the optimiser, the number of training examples wasreduced to half size by random sampling. It was found that this reduced trainingset size is significantly quicker to process by the rather processor intensive fitnessfunction whilst having no noticeable impact on the quality of the final result. Toclarify, for each fold, the optimiser created the groupings using a reduced trainingset, these groupings were used to create the protein representations for the fulltraining and testing sets. The full training set was used to train the classifier and thefull test set was used to test the classifier and therefore determine the quality of therepresentations.
For each opt-aiNet-AA-Clust run, the algorithm runs for 40 generations, usinga population size of 20 individuals. While the algorithm was allowed to formclusters using any combination of amino acids, a limit of five clusters per individualwas enforced. Because of the way the clustering is used to produce the predictorattributes, a large number of clusters per individual results in a very large numberof predictor attributes, and so the classifier becomes too slow to train and test in areasonable amount of time. Thus, it was decided that five clusters struck a reasonablebalance between the algorithm’s flexibility and constraining the time taken duringevaluation of the representation.
Ideally, the opt-aiNet-AA-Clust’s fitness function would use a classification algo-rithm to predict classes in all three hierarchical levels of GPCR function. However,this is prohibitively slow with each individual evaluation likely to take many hours.Clearly a faster solution must be found. It was decided that just one classifier shouldbe used in the fitness function. As 1-Nearest Neighbour (1-NN) has appeared to bethe more accurate than other classifiers on this type of data in preliminary tests, it waschosen here. As only one classifier is to be used, it was decided that for the purpose offitness computation the fitness function classifier will distinguish between classes onlyat the top level of the hierarchy (GPCR families A–E). Table 2 shows the parametersused for each run of opt-aiNet-AA-Clust.
To assess the effectiveness of the proposed algorithm, an experiment was un-dertaken to compare the accuracy of a classifier when attributes are evolved bythe algorithm against a baseline. As stated above, the dataset used was our GDS

118 J Math Model Algor (2009) 8:103–123
Table 2 opt-aiNet-AA-Clust parameters
Population size (s) 20
Number of clones for each immune cell during clonal selection (nc) 20
Suppression threshold for network cell affinities (nt) 0.5
Number of algorithm iterations 40
Maximum number of clusters that can be produced by each immune cell 5
dataset. In the case of the baseline, attributes were generated from raw proteinsequences by the approach of Tong et al. [2], as described earlier. In other words,the experiments compare the performance of a given hierarchical classificationmethod in two different scenarios, using two different types of predictor attributes:the attributes created by using our proposed opt-aiNet-AA-Clust and the baselineattributes proposed by Tong et al.. Hence, what is ultimately being compared is theeffectiveness of two different protein representations: one of them automaticallyevolved by opt-aiNet-AA-Clust and the other proposed in [2] using the author’sdomain knowledge about proteins and amino acid properties.
4.2 Test Algorithm
Both protein representations were tested using the same classification algorithm.This was our selective top down classifier, previously described in [13] and [14].The selective top down technique is an improvement on the standard top downtechnique which works as follows. Given, for example, the class tree in Fig. 2a, atree of classifiers is built to reflect the structure of the classes, as shown in Fig. 2b.Thus a tree of classifiers is generated such that the output of one classifier constitutesthe input for another. The number of layers of classifiers will be equal to the numberof levels represented by the class attribute. As practically any standard, well knownclassifier can be used at each node the process of building a hierarchal classifier isgreatly simplified. No special classifier must be written to perform the classification(other than the scaffolding required to support a classifier tree). Rather, commonwell understood classifiers can be used and as such, informed choices can be madeabout which to use.
The manner in which the top-down approach works takes advantage of thehypothesis that some characteristics of the data may be important to discern betweentwo classes at one node of the class tree while being irrelevant at another. Forexample, certain attribute values may be equal in classes A.1 and A.2 (making thisattribute useless to discern between the two) but yield 100% accuracy when used tochoose between B.1 and B.2.
The top-down approach to classification exploits this as all classifiers are trainedusing only examples (data instances) of the class they are required to classifybetween. Despite this variation of the training data at each node in the class tree,in the standard top-down approach the same classification algorithm is used ineach node of the class tree. Intuitively, this is unlikely to lead to a maximizationof classification accuracy. It is natural to hypothesise that different classifiers maybe more suited to different nodes in the class tree. Each type of classifier has itsown bias and we hypothesise it is possible to maximise the classification accuracy ofthe top-down approach by using different classification algorithms in the classifierhierarchy. These classifiers are selected in a data-driven manner using the training

J Math Model Algor (2009) 8:103–123 119
set. We call this the selective top-down approach and it has been successfully appliedto the classification GPCR classification problem previously [13, 14] – using a verydifferent protein representation and no optimisation of amino acid groupings.
The selective top-down approach proceeds as follows. A tree of classifiers isproduced with a structure identical to the standard top-down approach. However,at each node the training data for that node is split into a sub-training and validationset. A number of different classifiers are then trained using this sub-training set andtested using the validation set. The classifier which yields the highest classificationaccuracy in the validation set is selected as the classifier for this node in theclass tree. The sub-training and validation sets are then merged to produce theoriginal training set again, and the selected classifier is then re-trained. The followingclassifiers were used in the selective top down algorithm, where all were the standardimplementations from Weka [28] or the Weka Class Algorithm package [29]:
1. Naïve Bayes2. Bayesian network3. SMO (a support vector machine [30])4. One nearest neighbours (using Euclidean distance)5. PART (a decision list [31])6. J48 (an implementation of C4.5)7. Naïve Bayes tree (a decision tree with a naïve Bayes classifier at each node)8. AIRS2 (a classifier based on the Artificial Immune System paradigm [32])9. Conjunctive rule learner
Note that this selective approach effectively produces a hybrid hierarchical classifica-tion system, since different nodes in the class tree each use potentially different typesof classifiers. It should be emphasised that the actual classifier used for testing theprotein representation is not under scrutiny here, it is the optimised representationoutput by opt-aiNet-AA-Clust we are assessing and we use the selective top downclassifier to aid us in doing this.
4.3 Results
opt-aiNet-AA-Clust was evaluated by running a ten-fold cross-validation proce-dure—a standard procedure for evaluating predictive accuracy in data mining [28].Each iteration (fold) of the cross-validation procedure took about 6 days, so thatthe entire cross-validation procedure took about 2 months. The results are shownin Table 3 where the predictive accuracy at all three levels of the class hierarchy isshown for each of the ten folds. This table also shows the mean predictive accuracyover these ten folds, the mean accuracies for the baseline and finally the statisticalsignificance of the difference between the accuracies of the evolved representationand the baseline (attributes created using the grouping scheme of Tong et al. [2], andpredictive accuracy ascertained using the same top-down classifier). This has beencomputed using Student’s t-test with two-tails. This test was used for two reasons.Firstly the number of runs is fairly small and this test is designed to be used forsmall numbers of observations, while secondly it can be used to compare two sets ofresults where there are different numbers of observations for each. In this case, tenobservations for the evolved attributes and 100 for the baseline.

120 J Math Model Algor (2009) 8:103–123
Table 3 Output from classifier on test set
1st level (%) 2nd level (%) 3rd level (%)
Classifier using evolved attributes Fold 1 95.87 82.54 69.54
Fold 2 96.96 82.95 75.49
Fold 3 97.69 82.80 72.63
Fold 4 96.23 82.07 73.26
Fold 5 96.59 83.78 74.91
Fold 6 97.57 84.60 74.11
Fold 7 97.08 84.39 73.58
Fold 8 96.23 84.49 70.51
Fold 9 98.18 81.73 72.47
Fold 10 96.72 82.03 71.01
Mean 96.91 83.14 72.75
Std. dev. 0.732 1.095 1.927
Classifier using baseline attributes 96.97 82.72 70.46
P value result of Student’s t-test 0.775 0.280 0.003
It can be seen from the table that the difference in the predictive accuracy of thetwo approaches on the first (most general) and second class levels are statisticallynegligible—the t-tests produced high p values. On the other hand, at the third classlevel the attributes evolved by opt-aiNet-AA-Clust led to a very significant improve-ment in predictive accuracy over the baseline attributes, statistically significant atthe 1% level. This is especially interesting as the fitness function only dealt with thetop level of the hierarchy. It would, therefore, be expected that accuracy would bemaximised on this level. Instead it is at the third (most specific) level that appearsto have benefited most from the evolved representation. It should be noted thatthe third class level represents the most challenging classification scenario, since itinvolves many classes and typically a smaller number of examples per class (makinggeneralization more difficult), as compared with the first two levels. In addition,classes at the third level are often more informative to biologist users, since theyspecify a protein’s function more precisely.
The reasons for this unexpected result are unclear. It is possible that the optimiseris overfitting to the training data. Overfitting refers to the construction of a classi-fication model that is too tailored to the training set, resulting in a relatively lowgeneralization ability and reduced predictive accuracy in the test set (unseen duringtraining) [28].
It should be stressed that, although the automatically evolved clusters of aminoacids have led to an improvement for the particular dataset of GPCR proteins used inour experiments, there is no guarantee that the same evolved amino acid clusters willbe optimal for predicting other types of protein functions. However, the proposedalgorithm is generic enough to be easily applicable to other types of proteins, offeringus an automated approach for trying to find a near-optimal cluster of amino acidstailored to the type of protein whose functions have to be predicted.
During the optimisation stage of the process, the fitness of the population wasrecorded during every iteration. Figures for the number of groups representedby the individuals in the population were also recorded. Upon initialisation, thevast majority of the individuals in the populations contained the maximum of fivegroups. It was found that the tiny number of individuals representing four groups

J Math Model Algor (2009) 8:103–123 121
quickly gained another group. Almost without exception this occurred within thefirst few iterations so that all members of the population represented five groups.This result mirrored those previously observed using this technique. In [18] it wasfound that the optimum number of groups on this dataset was around 12 and whenany individuals were deliberately initialised with fewer than this, the number ofgroups that individual represented would quickly increase. It is thought, therefore,that allowing an unlimited number of groups would result in better accuracy onthe test set. However, this is impractical as, firstly, the optimiser will have a hugelyincreased solution space to search which would require an increase in time taken tooptimise. Secondly, increase in the number of groups defined by the fittest individualwould result in a huge number of attributes being created for the data, which can beimpractical when using the selective top-down technique for classification.
5 Conclusions
Previous experience has shown that the protein representation generated by thelocal descriptors method results in highly competitive predictive accuracies whenattempting to classify GPCR proteins. The local descriptors technique, as currentlypublished in the literature, divides amino acids into three clusters, leading to aspecific set of predictor attributes. When evaluating this published representation,we found no clear reason why these three clusters were used. It was thereforehypothesised that predictive accuracy could be improved over this “one size fits all”set of clusters by assigning amino acids to clusters in a data driven manner. In thisspirit, this paper proposed a new variant of opt-aiNet, called opt-aiNet-AA-Clust,that optimizes the clustering of amino acids for the type of protein being mined andfor the type of classification algorithm being used.
When compared against the original local descriptors-based representation, whichwas not optimized for the data nor for the classification algorithm, it was found that asignificant increase in predictive accuracy was observed at the third level of the classhierarchy, which is the most informative (most specialized) type of protein functionfor the user. However, it was interesting to note that the accuracy at the top level ofthe hierarchy did not differ significantly between the evolved representation and thebaseline. This was unexpected, as the classification accuracy at the top level of theclass hierarchy is used in the optimiser’s fitness function to guide the optimisationprocess.
One future direction would be to let the AIS algorithm have free reign to decidethe number of clusters. It is thought that allowing an unlimited number of clusterscould result in better predictive accuracy. In these tests we manually enforced amaximum of five groups on the optimised groupings. However, other experiments[18] have shown that the optimum number is probably nearer 12. However, inthe experiments reported here this was impractical as, firstly, the AIS would havea hugely increased solution space to search, which would require an increase intime taken to solve the clustering problem. Secondly, an increase in the number ofclusters defined by the solution returned by the AIS would result in a huge numberof attributes being created for the data, which can be impractical when using ahierarchical classification algorithm. More computing power will have to be sourcedbefore this can begin, but such an investigation has the prospect of yielding some very
122 J Math Model Algor (2009) 8:103–123
interesting results and, if the final representation was combined with an attributeselection algorithm, for example, the predictive accuracy could be enhanced withlittle impact in terms of time when making classifications.
Acknowledgements The authors should like to gratefully acknowledge funding under the Engi-neering and Physical Sciences Research Council grant EP/D501377/1—A Synergistic Integration ofNatural and Artificial Immunology for the Prediction of Hierarchical Protein Functions. The authorsare also grateful to the systems research group at the University of Kent for allowing the use of thepi-cluster of computers, Engineering and Physical Sciences Research Council grant EP/C516966/1—TUNA: Theory Underpinning Nanotech Assemblers (Feasibility Study).
References
1. Cui, J., et al.: Computer prediction of allergen proteins from sequence-derived protein structuraland physicochemical properties. Mol. Immunol. 44, 514–20 (2007)
2. Tong, J.C., Tammi, M.T.: Prediction of protein allergenicity using local descriptions of aminoacid sequence. Front. Biosci. 13, 6072–6078 (2008)
3. Chothia, C., Finkelstein, A.V.: The classification and origins of protein folding patterns. Ann.Rev. Biochem. 59, 1007–1035 (1990)
4. Christopoulos, A., Kenakin, T.: G protein-coupled receptor allosterism and complexing.Pharmacol. Rev. 54, 323–374 (2002)
5. Gether, U., et al.: Structural basis for activation of G-protein-coupled receptors. Pharm. Toxicol.91, 304–312 (2002)
6. Bissantz, C.: Conformational changes of G protein-coupled receptors during their activation byagonist binding. J. Recept. Signal Transduct. Res. 23, 123–153 (2003)
7. Hebert, T.E., Bouvier, M.: Structural and functional aspects of G protein-coupled receptoroligomerization. Biochemical Cell Biology 76, 1–11 (1998)
8. Schoneberg, T., et al.: Mutant G-protein-coupled receptors as a cause of human diseases.Pharmacol. Ther. 104, 173–206 (2004)
9. Klabunde, T., Hessler, G.: Drug design strategies for targeting G-protein coupled receptors.ChemBioChem 3, 928–944 (2002)
10. Kolakowski Jr., L.F.: Gcrdb: A G-protein-coupled receptor database. Recept. Channels 2,1–7 (1994)
11. Attwood, T.K., Findlay, J.B.: Design of a discriminating fingerprint for G-protein-coupledreceptors. Protein Eng. 6, 167–176 (1993)
12. Attwood, T.K., Findlay, J.B.: Fingerprinting G-protein-coupled receptors. Protein Eng. 7,195–203 (1994)
13. Davies, M.N., et al.: On the hierarchical classification of G protein-coupled receptors.Bioinformatics 23(23), 3113–3118 (2007)
14. Secker, A., et al.: An experimental comparison of classification algorithms for the hierarchicalprediction of protein function. Expert Update (Magazine of the British Computer Society’sSpecialist Group on AI), Special Issue on the 3rd UK KDD (Knowledge Discovery and DataMining) Symposium 9(3), 17–22 (2007)
15. Sandberg, M., et al.: New chemical descriptors relevant for the design of biologically activepeptides. A Multivariate Characterization of 87 Amino Acids. J. Med. Chem. 41(14), 2481–2491(1998)
16. Guan, P., et al.: Analysis of peptide-protein binding using amino acid descriptors: Predictionand experimental verification for human histocompatibility complex Hla-A0201. J. Med. Chem.48(23), 7418–7425 (2005)
17. Davies, M.N., et al.: Proteomic applications of automated GPCR classification. Proteomics 7(16),2800–2814 (2007)
18. Davies, M.N., et al.: Optimizing amino acid groupings for GPCR classification. Bioinformatics24(18), 1980–1986 (2008)
19. Li, T., et al.: Reduction of protein sequence complexity by residue grouping. Protein Eng. 16(5),323–330 (2003)
20. Cannata, N., et al.: Simplifying amino acid alphabets by means of a branch and bound algorithmand substitution matrices. Bioinformatics 18(8), 1102–1108 (2002)
J Math Model Algor (2009) 8:103–123 123
21. Luthra, A., et al.: A method for computing the inter-residue interaction potentials for reducedamino acid alphabet. Biosciences 32, 883–889 (2007)
22. Freitas, A.A., de Carvalho, A.C.P.L.F.: A tutorial on hierarchical classification with applicationsin bioinformatics. In: Taniar, D. (ed.) Research and Trends in Data Mining Technologies andApplications, pp. 175–208. Idea Group (2007)
23. de Castro, L.N., Timmis, J.: Artificial Immune Systems: A New Computational IntelligenceApproach. Springer, New York (2002)
24. Freitas, A.A.: Data Mining and Knowledge Discovery with Evolutionary Algorithms. Springer,New York (2002)
25. de Castro, L.N., Timmis, J.: An artificial immune network for multimodal optimisation. In:Proceedings of: 2002 congress on evolutionary computation (CEC 2002). Part of the 2002 IEEEworld congress on computational intelligence, pp. 699–704 (2002)
26. Andrews, P.: Opt-Ainet source code in Java. Accessed October 2007 (2005)27. Andrews, P.S., Timmis, J.: On diversity and artificial immune systems: Incorporating a diversity
operator into Ainet. In: Proceedings of: International workshop on natural and artificial immunesystems (NAIS), pp. 293–306 (2005)
28. Witten, I.H., Frank, E.: Data Mining: Practical Machine Learning Tools and Techniques. MorganKaufmann, San Francisco (2005)
29. Brownlee, J.: Weka classification algorithms. Version 1.6. Accessed February 2007 (2006)30. Keerthi, S.S., et al.: Improvements to Platt’s SMO algorithm for SVM classifier design. Neural
Comput. 13(3), 637–649 (2001)31. Frank, E., Witten, I.H.: Generating accurate rule sets without global optimization. In: Proceed-
ings of: Fifteenth international conference on machine learning (1998)32. Watkins, A., Timmis, J.: Artificial immune recognition system (AIRS): Revisions and refine-
ments. In: Proceedings of: 1st International conference on artificial immune systems (ICARIS2002), pp. 173–181 (2002)