the rise of the engineer: inventing the professional
TRANSCRIPT

The Rise of the Engineer: Inventing the Professional
Inventor During the Industrial Revolution∗
W. Walker Hanlon
Northwestern University, NBER, CEPR
January 27, 2022
Abstract
Why was the Industrial Revolution successful at generating sustained growth?Some have argued that there was a fundamental change in the way that newtechnology was developed during this period, but evidence for this argumentremains largely anecdotal. This paper provides direct quantitative evidenceshowing that how innovation and design work was done changed fundamen-tally during the Industrial Revolution. This change was characterized by theprofessionalization of innovation and design work through the emergence ofthe engineering profession. I also propose a theory describing how this changecould have acted as one mechanism behind the transition to modern economicgrowth.Keywords: Industrial Revolution, innovation, engineering, economic growth
∗I thank Brian Beach, Asaf Bernstein, James Feigenbaum, James Fenske, Michela Giorcelli,Daniel Gross, Philip Hoffman, Anton Howes, Morgan Kelly, David Mitch, Joel Mokyr, Petra Moser,Alessandro Nuvolari, Kevin O’Rourke, Santiago Perez, Michael Peters, Sarah Quincy, Vasily Ru-sanov, Mike Waugh, Chenzi Xu, Ariell Zimran and seminar participants at NYU Stern, Northwesternand the Virtual Economic History Seminar for helpful comments. I am grateful to Sean Bottom-ley, Stephen Billington, Carl Hallmann, Petra Moser, Alessandro Nuvolari, Lukas Rosenberg, andEmre Yavuz for their willingness to share data with me. Jessica Moses, Rachel Norsby and LiliyaShumylyak provided excellent research assistance. Funding for this project was provided by the NYUStern Center for Global Economy and Business and by National Science Foundation CAREER GrantNo. 1552692.

Technological progress played the central role in the Industrial Revolution. Much
of the research on innovation during this event has focused on the factors that led to
the burst of inventive activity that took place in Britain in second half of the 18th
century. Yet, as Joel Mokyr has pointed out, short bursts of technological progress
have occurred many times in history. “The true miracle” he argues, “is not that the
classical Industrial Revolution happened, but that it did not peter out like so many
earlier waves of innovation” (Mokyr, 2004, p. 15).
Why was technological progress sustained? Some have argued that the explana-
tion for this miracle of sustained technological progress is that the system through
which new technology was developed changed in a fundamental way during the In-
dustrial Revolution. Alfred North Whitehead, for example, believed that, “The great
invention of the nineteenth century was the invention of the method of invention.”1
Did such a change in the process of innovation take place during the Industrial Rev-
olution? And if it did, what did the change look like?
This paper provides evidence showing that an important change took place in the
way that innovation and design work was done in Britain, that the timing of this
change corresponds closely to the onset of the Industrial Revolution, and that this
change was a specifically British phenomenon. The change I highlight was the profes-
sionalization of invention and design work through the emergence of the engineering
profession. Engineering work, ranging from the invention of new mechanical devices
to the design of new types of infrastructure, had been done before the emergence
of professional engineers. However, historical evidence suggests that how engineering
work was done changed in a fundamental way in the last quarter of the eighteenth cen-
tury. Watson (1989), in his history of the Society of Civil Engineers, describes how (p.
1), “When John Smeaton described himself as a civil engineer for the first time...he
identified a new profession” which combined “The craftsman’s fund of knowledge,
based on natural genius and practical experience...with the assimilation of scientific
principles.”
Such a change could have important implications for our understanding of this
seminal event in economic history. However, current evidence on this change re-
mains largely anecdotal. The primary contribution of this paper is to provide direct
1Whitehead (1925), p. 96.
1

quantitative evidence documenting the changes in the innovation process that took
place in Britain during the Industrial Revolution as well as a theory describing how
this change could have acted as a mechanism through which the British economy
transitioned into modern economic growth.
My empirical analysis begins with a brief examination of the characteristics that
defined the new professional engineers that emerged during my study period. This is
done using both historical evidence – how contemporary engineers saw their own pro-
fession – as well as through a quantitative text-analysis approach using biographical
information from the Oxford Dictionary of National Biography (ODNB). This analy-
sis shows that activities such as “design,” “invent,” and “patent” were core functions
of early engineers, while engineers were also involved in activities related to the im-
plementation of new designs and ancillary activities such as consulting, reporting,
and surveying. Notably, these defining characteristics changed very little across the
study period and they are similar regardless of whether I identify engineers using the
judgment of historians or on individual’s own self-reported occupations.
Next, I document the emergence of professional engineers and the impact of this
group on the development of new inventions and designs in Britain during the In-
dustrial Revolution. The engineering profession that emerged during this period was
diverse, ranging from civil engineers such as John Smeaton and James Brindley to me-
chanical engineers such as Henry Maudslay and Joseph Bramah, with many engineers,
such as James Watt and Marc Isambard Brunel, making contributions across multiple
branches of engineering. To account for this, I use several empirical approaches to
study different aspects of the emerging engineering profession.
First, I examine biographical information from the ODNB, which has the advan-
tage of covering all types of engineering. The ODNB data reveal a dramatic increase
in the share of engineers among the noteworthy Britons beginning in the third quarter
of the eighteenth century. By the middle of the nineteenth century, engineers made
up around 20% of all noteworthy individuals associated with science or technology,
and over 2% of all of those who merited an ODNB biography.
Second, I study patent data. This analysis is of particular interest because it
reflects exactly the type of reproducible inventions thought to have been central to
driving economic growth. Confirming the patterns observed in the biographical data,
2

British patent data show the growing importance of engineers to invention in Britain
during the Industrial Revolution. Engineers were almost completely absent from the
patent record prior to 1760, but they appeared in growing numbers after that point.
By 1800-10, they accounted for around 10% of all patents, a share that rose steadily
to 20% by the 1840s and then just under 30% by the 1860s. This rising importance of
engineers, which closely corresponds to the timing of the acceleration of productivity
growth in Britain, has not, to my knowledge, been systematically documented in
existing work.2
The patent data also show that engineers were fundamentally different from other
common types of inventors, particularly manufacturer-inventors, the other major
group of patent holders. Most importantly, I document that engineers were more
productive, generating more patents per decade than any other type of inventor, and
patents of higher quality based on several available patent quality indicators. Engi-
neers also operated differently than other types of inventors. For example, they were
more likely to work with coinventors, a feature that may help explain their greater
productivity. In addition, individual engineers patented across a substantially broader
set of technology categories than any other type of inventor. Even within the career
of individual inventors, I provide evidence that once someone began to describe their
occupation as engineer they also began to operate differently, by working with more
coinventors, and they became more productive. These patterns indicate that engi-
neers represented a new type of inventor, rather than simply a relabeling of some
existing type.
Third, I conduct an international comparison, contrasting the patterns observed
in British patent data to data on French patents from 1791-1843. As in the British
analysis, I find that individuals describing themselves as engineers in the French
patent data were more productive than other types of patent holders, produced higher
quality inventions, and operated across a broader set of technology categories. This
provides further evidence that engineers were fundamentally different than other types
of inventors, even in France. However, I also show that French innovation system
did not exhibit the same changes that took place in Britain. In particular, there
was no take off in the number of engineers patenting in France commensurate with
2This claim is discussed in detail in Section 1.
3

the pattern observed in the U.K. Instead, the French innovation system remained
relatively stable from 1791-1843: dominated by manufacturer-inventors, a structure
that was similar the British innovation system in the mid-18th century. Moreover,
many of the engineers that were active in France were of British origin. Thus, the at
least before the middle of the nineteenth century, the rise of the engineer appears to
be a uniquely British phenomenon.
Fourth, I examine the professionalization of civil engineering that occurred in
parallel with the shifts in other types of engineering work. Using a combination
of historical evidence and data covering major infrastructure projects undertaken in
Britain after 1500, I provide evidence that the way civil engineering work was done
changed in the second half of the eighteenth century. As Skempton (1996, p. vii) de-
scribes, “Works of engineering had been executed before 1760, some of considerable
magnitude, but they could not provide sufficient employment to support a body of
men trained in work of this kind...” However, “The state of civil engineering changed
decisively in the 1760s... Engineers forming a small but distinguished group were now
fully employed in consulting, designing, giving evidence to Parliament and directing
works...” (Skempton et al., 2002, p. xxiv). Supporting this historical narrative, I
provide evidence showing that, prior to 1750, most major civil engineering projects
were overseen by engineers without substantial prior training or experience. After
1750 major civil engineering projects were increasingly overseen by experienced engi-
neers that headed established firms and undertook numerous major projects. They
also trained the next generation of civil engineers, most of whom had gained extensive
experience working for established firms before being awarded major projects of their
own. Thus, we can trace out the professionalization of civil engineering work occur-
ring in parallel with the arrival of engineers as important producers of mechanical
inventions documented in the patent data.
Together, these mutually-reinforcing strands of empirical analysis highlight the
fundamental changes that took place in the way invention and design work was done
in Britain during the Industrial Revolution. These changes were characterized by
the emergence of a new profession, engineering, where design and invention were
among the core occupational functions. These changes began in roughly the third
quarter of the eighteenth century, just as the Industrial Revolution was taking off,
4

and accelerated through at least the middle of the nineteenth century. Moreover, the
emergence of professional engineers as a key group of inventors appears to have been
a largely British phenomenon, which may help explain why Britain pulled ahead of
other European countries during this period. These empirical findings can help us
better understanding how the innovation system changed during this seminal event
in economic history.
Finally, I provide a simple theoretical model that describes how the changes doc-
umented in my empirical analysis could have contributed to the take-off into modern
economic growth. The core of the model takes Adam Smith’s insight that specializa-
tion can increase productivity and applies it to productivity in the development of new
inventions and designs, by a new group of specialists: professional engineers. This
idea is then embedded into a standard endogenous growth model following Romer
(1990). The model shows how a change in the way new innovations were developed
may act as the mechanism through which an economy transitions from a slow “pre-
modern” growth regime into rapid “modern” economic growth. In addition, the model
shows how my findings fit together with existing theories of the Industrial Revolution,
such as those emphasizing the role of institutions (North & Thomas, 1973; Acemoglu
et al., 2005) or the importance of upper-tail human capital (Mokyr, 2005, 2009). In
particular, the model describes how these factors, highlighted in existing work, could
have initiated the emergence of engineering in the late eighteenth century, and how
that emergence could have acted as the mechanism that pushed the economy onto a
new, more rapid, growth trajectory.
1 Related literature
Naturally, this paper is closely related to the enormous literature focused on un-
derstanding the Industrial Revolution. Two strands within this broad literature are
particularly related. One existing set of papers uses biographical sources to look at
the careers of important inventors or innovators (Allen, 2009b; Meisenzahl & Mokyr,
2012; Howes, 2017; Khan, 2018). A second closely related set of work uses patent data
to examine the British innovation system during the Industrial Revolution. Impor-
tant contributions to this literature include Dutton (1984), MacLeod (1988), Sullivan
5

(1989), Sullivan (1990), and Bottomley (2014), as well as a number of other papers
discussed later.
Surprisingly, with few exceptions, existing work has generally failed to document
the emergence and growing contribution of the engineering profession during the
Industrial Revolution.3 One exception is Nuvolari et al. (2021), which finds that
what they define as macroinventions were more likely to be produced by engineers.
However, Nuvolari et al. (2021) does not document the emergence of engineering, nor,
without individually-linked patent data, are they able to study differences between
engineers and other inventors in terms of output, average patent quality, coinventors,
etc.4
This study also goes substantially beyond previous work using patent data by (1)
identifying the emergence of engineers as an important group of inventors of patented
technologies, (2) bringing together a wide range of additional data to show that this
emergence was not confined to patented inventions, (3) comparing patterns observed
in Britain to another country to show that this emergence was a specifically British
phenomenon, and (4) providing a theoretical model that describes how the empirical
patterns I identify could have contributed to the economy’s transition into modern
economic growth.
This study has implications for two lines of recent work related to the Industrial
Revolution. One of these is a set of recent studies highlighting the importance of
upper-tail knowledge during this period (Mokyr, 2005; Squicciarini & Voigtlander,
2015).5 My results provide clear support for the argument that upper-tail knowledge
mattered for technological progress during this period. Another long-standing debate
3The “quasi-professional” inventors discussed by Dutton (Ch. 6) are closely related to the en-gineers I focus on. However, without closely examining occupation data, Dutton did not make theconnection to the emerging engineering profession. MacLeod (1988) did review inventor occupa-tions, but surprisingly, she failed to identify the rise of the engineering profession documented here,which leads her to conclude that the era of the professional inventor did not begin until well intothe nineteenth century.
4Another closely related study is MacLeod & Nuvolari (2009), which focuses on the mechanicalengineering industry (essentially machine and tool making). Despite including the term engineering,this sector should not be confused with the engineers I study, who worked across a wide range ofindustrial sectors and technology types.
5Mokyr (2005), for example, argues that “what mattered above all was the level of sophisticationof a small and pivotal elite of engineers, mechanics and chemists.”
6

has to do with the importance of scientific knowledge in the Industrial Revolution.6
As discussed in the next section, engineers clearly saw themselves as a key link be-
tween scientific insights and practical application. While I do not examine the role of
engineers in applying scientific insights to technology development in this paper due
to space constraints, I provide support for this important role in a companion paper,
Hanlon (2022). That paper uses patent data linked to scientific articles, shows that
engineers provided a key bridge between science and technology development in the
early nineteenth century.
This paper is also related to existing work emphasizing the importance of en-
gineers in more recent time periods. The closest paper in this vein is Maloney &
Valencia Caicedo (2017), which highlights the contribution of engineers to growth
during the Second Industrial Revolution, roughly one century after the main focus
of my study. The key difference here is that I study the emergence of engineers and
their contribution during the key decades of the Industrial Revolution.
Finally, my theoretical framework is related to existing theories describing the
transition from pre-modern to modern economic growth, most notably Unified Growth
Theory (Galor & Weil, 2000; Galor, 2011).7 What differentiates my theory from
existing work is a focus on how a change in the innovation process, and specifically the
emergence of a group specializing in invention and design work, could have provided
a mechanism through which the transition to modern economic growth occurred.
Naturally, I am not claiming that this was the only mechanism at work; there is
plenty of evidence that other factors, such as the accumulation of human capital and
a beneficial institutional environment, mattered. However, when coupled with my
empirical results, my theory suggests that changes in the inventive process may have
also been important.
6This debate stretches back to work by Landes (1969), Rosenberg (1974), and Mokyr (2002) andincludes recent papers by Squicciarini & Voigtlander (2015), Khan (2018), Kelly & O Grada (2020),and a recent book by Jacob (2014).
7Other related work includes Jones (2001), Hansen & Prescott (2002), and Peretto (2015).
7

2 Defining an Engineer
What defined an engineer during the study period? Because the development of
engineering education lagged the emergence of the engineering profession, engineers
were not defined by a particular educational qualification, as they might be today. Nor
were engineers defined by working in a specific type of industry or technology. As my
later results show, engineers were in fact uniquely broad in the range of technologies
they worked on. Here, I offer two approaches to defining an engineer, focusing both
on the specific functions that the occupation involved as well as how it related to
other occupations. I begin by looking at how contemporary engineers described their
own occupation as it was emerging. I then augment this view using a data-driven
approach based on applying text-analysis to descriptions of the lives of engineers in
the ODNB.
Contemporary descriptions of engineers and engineering reveal a group that thought
of themselves as a unique profession, lying between working mechanics and scientists,
one that drew on a combination of mechanical skills and scientific or mathematical
knowledge and applied these to invention and design activities ranging from new me-
chanical devices to major infrastructure projects. For example, James Watt, perhaps
the most famous of the engineers in my study period, wrote in 1781 that an engi-
neer “requires invention, discriminating judgement in Mechanical matters, boldness
of enterprise and perseverance...”8 Watt would also write to another friend that an
engineer one needed to know drawing, geometry, algebra, arithmetic, and the ele-
ments of mechanics.9 Rees’ Cyclopaedia of 1819 defined Engineer as “in its general
sense...applied to a contriver or maker of any kind of useful engines or machines,”
together with a separately defined Civil Engineer, “an order or profession of persons
highly respectable for their talents and scientific attainments...as the canals, docks,
harbours, light houses, etc. amply and honorably testify.”10 At the first meeting
of what would become the Institution of Civil Engineers in 1818, Henry Robinson
Palmer stated that, “An Engineer is a mediator between the Philosopher and the
8Letter from James Watt to Mrs. Campbell, 15 September 1781. Quoted from Musson &Robinson (1969).
9See Jacob (2014), p. 29 and p. 30, footnote 24.10Rees (1819), Vol. XIII.
8

working Mechanic; and like an interpreter between two foreigners must understand
the language of both.”11. While disparate, these statements reveal some of the defin-
ing features of the new profession, as seen by those witnessing its emergence.
This historical evidence can be augment using a more quantitative approach that
allows me to identify the functional activities of working engineers during the Indus-
trial Revolution. This is done using biographical data from the ODNB covering all
engineers born before 1850 (439 in total), as well as two natural comparison groups:
manufacturers (349 biographies) and those non-engineers classified as involved in sci-
ence or technology (1547 biographies).12 Naturally, we should keep in mind that these
biographies cover only a select sample of the most successful engineers, manufactur-
ers, scientists and inventors. However, this upper-tail group is likely to have played
a particularly important role in technology development, so they are a primary focus
of this paper.
As discussed in detail in Appendix C, I use natural language processing methods
to parse the ODNB biographies to identify all verb stems (similar to the approach
used by Michaels et al. (2019)). I then apply a regression approach to identify those
verbs that had the strongest association with engineers, compared to other types of
inventors. These verb stems reflect the types of activities that individuals undertook
during their lifetime. Table 1 presents the twenty verb stems most strongly associated
with engineers.13 For all of these, the association is statistically significant at the 99%
level after adjusting for multiple hypothesis testing (sharpened p-values below 0.01).
The presence of verbs such as “design”, “invent” and “patent” indicate the important
role of inventive activities to the engineering profession; out of all the verbs, the one
most closely associated with engineers is “design”. There are also terms indicating
the role that engineers played in implementing their new designs and inventions,
words such as “build,” “erect,” “employ,” “lay,” and “supervise.” Other important
11Quoted from ICE (1928), p. 2.12Within the ODNB, these are the two natural comparison groups. Most engineers were classified
as part of those involved in science and technology, so it is natural to compare to that group.Manufacturers were the other major group of inventors during the study period, as the patent datawill show. I exclude military engineers from the engineers group. I also include iron masters asmanufacturers. Of those individuals classified as working in science or technology, I do not includemanufacturers, artists/engravers, alchemists, or fossil collectors.
13See Appendix C for additional results and alternative specifications.
9

Table 1: Top twenty verb stems associated with engineers
Verb t-stat Verb t-stat Verb t-stat Verb t-statdesign 14.61 employ 6.74 complete 5.10 advise 4.40build 11.53 report 6.23 open 5.01 supply 4.36construct 9.58 erect 6.10 supervise 4.87 connect 4.24consult 8.16 survey 5.59 improve 4.83 propose 4.11patent 6.74 drive 5.27 lay 4.56 invent 4.01
This table presents the 20 words most strongly associated with engineers as well as estimatedt-statistics from OLS regressions based on robust standard errors. Engineers are comparedto manufacturers and non-engineers categorized as involved in science or technology in theODNB. All of the coefficients associated with these verbs have sharpened p-values below0.001. N=789,230 (2335 biographies x 338 verbs).
roles played by engineers are indicated by the presence of “consult,” “report,” and
“survey.” These terms give us a sense of the types of activities or functions that set
engineers apart from other highly successful individuals.
The words least associated with engineers can also be informative. When com-
pared to manufacturers, the five verbs most associated with that group, relative to
engineers, are “sell,” “expand,” “produce,” “manufacture,” and “buy.” For non-
engineers involved in science and technology, the verbs most associated with that
group, relative to engineers, are “publish,” “graduate,” “write,” “study,” and “col-
lect.” The contrast between these terms and the words in Table 1 highlights the
defining differences, in terms of activities, between these various groups.
Three other results emerge from my analysis of these textual data.14 First, split-
ting the sample by time period, I find no evidence that the verbs associated with
engineers changed substantially over time. Most importantly, design and invention
remained core functions of the occupation throughout the study period. Second, us-
ing data where I have matched patentees to ODNB biographies, I find that the results
are very similar regardless of whether I identify engineers based on the labels applied
by historians in the ODNB or the self-reported occupations from the patent data.15
14See Appendix C for additional details and results.15Of those with engineer as their modal occupation in the patent data who match to the ODNB,
84% are also classified as engineers in the ODNB data. Of those classified as engineers in the ODNBthat also appear in the patent data, 71% appear as engineers in at least one patent.
10

Third, also using the linked patent-ODNB data, I find that the results are very sim-
ilar if I focus on patent holders as the comparison group. Thus, the core functions
of engineers appear to be similar regardless of whether we are relying on the patent
data or the ODNB to identify who qualifies as an engineer, or whether engineers are
compared only to other patent holders, or to other individuals in the ODNB.
To summarize, both the descriptions that contemporary engineers provide about
their own occupation and the quantitative analysis of biographical descriptions from
modern historians indicate that engineering was an occupation where design and in-
ventive activity were core functions, together with associated activities such as over-
seeing construction, consulting, surveying, etc. As inventors and designers, engineers
filled a gap between scientists and working mechanics and provided a bridge between
theoretical insights and practical applications (see Hanlon (2022) for more evidence on
the role that engineers played in bridging science and technology). Next, I document
the rise of this new occupation.
3 Rise of the Engineer: Evidence from Biographical Data
This section uses information from the ODNB to provide an initial view of the rising
importance of engineers in Britain during the Industrial Revolution. This analysis
provides a valuable complement to the more extensive analysis of patent data coming
next, because the ODNB covers successful individuals regardless of whether they
obtained a patent. Figure 1 plots the share of engineers found in the ODNB relative
to all ODNB biographies (left axis) or relative to all individuals classified as either
in ‘science and technology’ or ‘manufacturing and trade’ (right axis). We can see
that, up to the cohort born from 1725-49, engineers account for a very small share
of ODNB biographies. However, starting with the cohort born in 1750-74, there is
a dramatic rise in the share of engineer biographies, which accounted for over 2%
of all biographies by the cohorts born in the first half of the nineteenth century. A
similar increase in apparent when we compare engineers to all individuals classified as
working either in science and technology (which includes most engineers) or relative
to those working in manufacturing and trade (which also includes some engineers).
By the first half of the nineteenth century, engineers accounted for over 20% of all
11

notable individuals associated with science or technology.
Figure 1: Share of engineers in ODNB biographies, 1650-1849
Data collected from the ODNB.
Note that the time-scale here is based on the year of birth, so it is not strictly
comparable to some of the graphs I will present later, which are based on patent filing
dates. However, as we will see, the rise of the engineer shown in Figure 1 will also be
reflected in the patent data, despite the fact that these two analysis rely on alterna-
tive ways of identifying who is an engineer. A similar rise is also found when studying
Google Ngrams, which show a sharp rise in the appearance of the term “engineer”
after 1740 (see Appendix B). These patterns are also consistent with existing his-
torical evidence. As Christine MacLeod has carefully documented (MacLeod, 2007)
engineers experienced a rising stature beginning in the 1760s and 1770s. This con-
trasts with the rather poor reputation of “the engineer” (often denoting a maker of
engines, rather than engineer as we understand it today) in the first half of the 18th
century. In 1744, for example, J.T. Desaguliers warned the readers of his Course
in Experimental Philosophy about being “over run with Engineers and Projectors”
who “draw in Numerous People into ruinous and unpracticable schemes.”16 This
poor reputation had been overturned by the early 19th century, as symbolized by the
16Desaguliers (1744), p. 415.
12

erection of a colossal statue of James Watt in Westminster Abbey in 1834. What
had changed? MacLeod (2007) argues (p. 59) that “the strongest case for revising
the inventor’s reputation as an untrustworthy ‘projector’ stemmed from the country’s
growing awareness of major technological achievements.”
4 Rise of the Engineer: Evidence from British Patent Data
This section analyzes the emergence of engineers as a key group of inventors, drawing
on information available from British patent data. I begin by describing the data
before turning to the analysis.
4.1 Patent data
Patent data provide a unique window into the development of technology during
the Industrial Revolution, including details on thousands of individual inventors and
inventions. Of course, not all innovations were patented (Moser, 2012), and not
all patents were for useful innovations (MacLeod et al., 2003). For this reason, it
is important that the patent data analysis is complemented with results from the
biographical data, discussed above, as well as evidence on civil engineering, in Section
6. However, many of the most important inventions of the Industrial Revolution, as
well as thousands of other useful, if less famous, ideas, can be found in patent filings.
The patent data used in this study include the full listing of patents filed from
1700-1851, with details including inventor name, inventor occupation, patent title,
and inventor address.17 The core of this data set was digitized from the two-volume
Titles of Patents of Invention, Chronologically Arranged, produced by the British
Patent Office (BPO) and published in 1854.18 I focus mainly on the information
about inventor occupations, while also using the names to track the output of each
inventor. Excluding patents communicated from abroad, this data set includes 12,622
patent-inventor observations covering 11,243 patents.
One reason to focus primarily on the 1700-1849 period is that patent laws were
17Because I often estimate results by decade, I end my main dataset in 1849.18Woodcroft (1854b).
13

largely stable during that period.19 In 1852, there was an important patent reform
act that lowered the cost of patenting substantially, leading the number of patents
filed annually to increase from several hundred to several thousand (see Appendix
Figure 5). Thus, while I have digitized additional data for the 1850s and 1860s, and
I will use them in some of the analysis, it makes sense to focus my main results on
the 1700-1849 period.20
The most important step in preparing the data for analysis was linking patents
associated with the same individual. Because making these links as accurate as
possible is important for this study, this was done using a careful manual linking
procedure, described in detail in Appendix D.2. For each of the patent-inventor
observations from 1700-1849, I match up patents filed by the same inventor using
inventor name, year of patent, inventor address, patent subject matter (based on
the patent title), and in some cases additional biographical information. Because I
link manually using a fairly rich set of linking information, the chance that patents
are incorrectly linked to a common inventor is low, though it is possible that I have
failed to link some patents by the same inventor because insufficient information to
form a conclusive link was available. However, there is no reason to expect that
missing links are common or systematic across inventor types. This matching process
identifies 8,328 unique inventors active during 1700-1849. Appendix Table 17 lists
the most prolific patent filers during that period.
The raw patent data include over 2,000 unique occupation strings. Several of
these, such as “gentleman”, “esquire”, and “engineer” appear regularly. Many oth-
ers, particularly those reflecting specific manufacturing trades (e.g., “Britannia-ware
manufacturer”, “Candle-wick maker”) appear irregularly. To make this set of occu-
pation strings manageable, I have cleaned them and grouped them into broad sets of
related occupations. Table 2 provides counts of the occupation groupings used in the
analysis for 1700-1849, while examples of specific occupations falling into each group
19Dutton (1984).20Patent data for years after 1851 were digitized from the Chronological Index of Patents prepared
by the British Patent Office. A second reason to focus primarily on the 1700-1849 period is that,before the 1852 patent law change occupations were provided for most patent entries, but after 1852the share of patents with missing inventor occupation data is substantial (around 20%).
14

are available in Appendix D.4.21
Table 2: Broad occupation categories used in the main analysis, 1700-1849
Industry Patents Industry PatentsAg/Food/Drinks 269 Merchants 635Chemical Manuf. 474 Mining & Metals 759Construction 410 Misc. Manuf. 1562Engineers 1726 Textile Manuf. 957Esquire 754 Prof. services 635Gentry 1745 Other 833Machinery & Tools 1068 Unknown 795
Data cover 1700-1849. Excludes communicated patents.
Comparing the names and occupations listed in the patent data reveals that the
occupations associated with specific inventors were sometimes not constant across
all of their patents. This typically reflected changes in occupation over the career
trajectory of an inventor. An example is provided by the engineer Joseph Bramah,
famous as a lock and tool maker. Bramah was trained as a carpenter and worked
installing waterclosets before he turned his attention to developing new inventions.22
He first appears in the patent records, in 1778 (patent 1177) as a cabinet maker
(consistent with constructing waterclosets). He appears as a cabinet maker again
in 1783 and 1784 and then as an engine maker in 1785, 1790 and 1793. Only in
1795 does he begin appearing in the patent record as an engineer (a hydraulic press,
21Given my focus on engineers, a couple of additional points about that occupation grouping arewarranted. First, some inventors listing “engineer” as an occupation also list another occupation.This is not very common, but typically when it occurs the other occupation is some type of manufac-turing. Individuals who list engineer together with a second occupation are counted as engineers inmy analysis. Second, civil and other types of engineers (e.g. “consulting engineers”) are also countedas engineers for the purposes of my analysis. Third, I exclude from the engineers category thosedescribed as “engine makers” as well as mining engineers (which includes “coal viewers”). Thereis some question about whether these should be treated as engineers or instead classified with, re-spectively, the machinery manufacturers and miners so, in the Appendix, I also consider robustnessresults including these groups as engineers. Ultimately, this makes little difference because neitherengine makers nor mining engineers are common. Military engineers are also excluded from theengineers category. They are treated the same as other military officers.
22See his ODNB biography.
15

his most important invention according to his ODNB biography). Thereafter his
interests broaden and he appears in the patent record eleven more times, always
as an engineer, with inventions ranging from a beer engine, a planing machine, a
paper-making machine, a banknote numbering machine, and a fountain pen. This
progression from manufacturer-inventor to engineer was a common pattern in the
early days of engineering.
To deal with these changing occupations, when analyzing data at the patent level,
I generally assign patents to the occupation group based on the occupation that
appears in that patent’s entry. When an analysis is conducted at the level of individual
inventors rather than patents (such as when looking at patents per inventor), it is
necessary to identify a unique occupation for each inventor. In those cases, I typically
use the modal occupation that appears across the patents that the inventor filed.23
In robustness exercises, I consider alternative approaches. In some of the analysis I
also exploit changes in an inventor’s occupation over time to study whether inventors
begin to behave differently once they start describing themselves as engineers.
I also use data that provide comprehensive categorizations of the technology type
represented by each patent, constructed by the British Patent Office.24 The BPO
index categorizes each patent into one, and occasionally more than one, out of 147
technology categories.25 To my knowledge this is the first use of the full digitized
BPO categorization data for the period before 1852. As a check on the results ob-
tained using the BPO classifications, I also replicate my analysis using an alternative
classification from Billington & Hanna (2018) generated by applying machine learning
to the patent titles.
This study also uses several patent quality measures. During my study period,
standard patent quality measures such as patent citations are not available. Instead,
I use four alternative approaches to measuring patent quality. The first is based
on the payment of patent renewal fees. The fees I study were introduced by the
23If an inventor does not have a unique modal occupation, then that inventor is excluded from theanalysis. However, this results in the exclusion of just 362 out of the over eight thousand inventorsin my analysis.
24These categorizations were published as the Subject Matter Index of Patents of Invention in1854 (Woodcroft, 1854a).
25Appendix Table 20 provides a listing of the top ten technology categories, by patents filed, inthe three 50-year periods from 1700-1849.
16

1852 patent reform, so this measure is available only for patents in the 1850s and
1860s.26 The second set of quality measures that I use, based on references to patents
in contemporary or modern publications, are from Nuvolari & Tartari (2011) and
Nuvolari et al. (2021). This is the only quality indicator that is available across the full
study period. The third quality measure is based on exhibits in the Great Exhibition
of 1851, which has previously been used by Petra Moser to study innovation patterns
(Moser, 2005, 2012). This measure is constructed by manually linking patent holders
to Moser’s database of exhibits of patented inventions in the Great Exhibition.27 A
fourth measure of patent quality is constructed by matching patent holders with at
least two patents to the individual profiles of famous Britons in the ODNB.
4.2 Analysis of the British patent data
Figure 2 describes the rising importance of engineers as inventors of patented tech-
nologies. Specifically, the figure shows, by decade, the share of patents with at least
one inventor in a particular occupation group (top panel), and the number of patents
with at least one inventor in each occupation group (bottom panel, log scale).28 The
rise of the Engineer, starting in the 1760s and 1770s, is apparent. By 1800-10, 10%
of patents had at least one engineer inventor. This rose to 20% by the 1840s. By
the 1860s, engineers accounted for over 29% of patents for which an occupation was
reported. No other group shows a similar pattern of growth across the study period.
In the bottom panel we can see that patents by all types of inventors were growing
during this period, but no other group experienced growth similar to the rate that we
see for engineers after 1760. By the 1860s engineers produced far more patents than
any other occupation group.29
26These data come from Hanlon (2015). See that paper for further details on the source andconstruction of the renewals data.
27See Appendix E.6 for further details on the exhibition data.28The shares in the top panel are relative to all patents for which an occupation is reported. This
makes very little difference before the 1850s, but it matters for the last two decades because therewas a large increase in patents that did not list an occupation after the 1852 patent reform.
29For a sense of the individuals that listed their occupation as “engineer”, Appendix D.5 providesa list of the top-five engineer patent filers in each decade. Prior to the 1760s, very few engineersappear in the patent data and even the top patenting engineers were generally obscure, with theexception of John Kay in the 1730s. However, this had changed by the 1780s, when we see the listtopped by James Watt and William Playfair (inventor of the bar chart and pie graph, among other
17

Figure 2: Number of patent observations by occupation category, 1700-1849
Occupation groups are based on the occupations listed in the entry for each patent. Excludes
communicated patents. Note that patents with multiple inventors may be counted in more
than one category, so the shares may sum to more than one.
things), followed by Joseph Bramah and Richard Trevithick in the 1790s and the first decade of the19th-century, Marc Isambard Brunel and Bryan Donkin in the 1810s, etc.
18

Three broad types inventors, described by MacLeod (1988, p. 78-9), can be dis-
cerned in Figure 2. First, there are the amateur inventors, for whom invention was
“an amusing diversion that might one day open up a lucrative sideline.” Many of the
gentlemen in Figure 2 probably fall into this group. The second group were the pro-
fessional inventors, for whom “inventing was not a hobby but a livelihood. Typically,
he obtained a large number of patents across a wide field of industries...” We will
see that engineers fit this description quite closely. The third group MacLeod called
the businessman, “those who were ready to engage in manufacturing or trade...while
they sometimes obtained more than one patent, these usually related only to their
own branch of business.” This group, which I will call manufacturer-inventors, were
the most common type of inventor outside of engineers. In the remainder of the anal-
ysis I will make a special point to study the differences between engineers and these
manufacturer-inventors.
In Appendix E.1, I compare the pattern of patents by engineers to other groups
thought have made an important contribution to innovation during the Industrial
Revolution, such as watchmakers, millwrights, instrument makers, and machinists,
or those that may have been related to engineers such as “engine makers” or mining
engineers.30 The main take-away from that analysis is that none of these groups are
large compared to engineers, at least after 1760, and none of them experienced the
type of explosive growth in patenting that engineers exhibited.
4.2.1 Differences in productivity, quality, and coinventors in Britain
In this subsection, I look at whether engineers were different from other types of
inventors. Specifically, I study how many patented inventions individuals produced,
the quality of their inventions, and whether they worked in teams with other inventors.
Productivity: Table 3 describes the average number of patents per inventor for inven-
tors in each occupation group, where occupations are based on the modal occupation
30On watchmakers, see Kelly & O Grada (2016). The role of millwrights is emphasized by Mokyret al. (2020). Kelly & O Grada (2020) highlight the role of instrument makers. Kelly et al. (2020)discuss the importance of artisanal mechanical skills such as those possessed by machinists andmachine makers.
19

listed across each individual’s patents. We can see that Engineers generated far more
patents per inventor than those in any other occupation group.
Table 3: Average patents per inventor in each occupation group, 1700-1849
Occupation Avg. patents Occupation Avg. patentsgroup per inventor group per inventorAg/Food/Drinks 1.258 Merchants 1.246Chemical Manuf. 1.586 Mining & Metals 1.436Construction 1.188 Misc. Manuf. 1.372Engineers 2.069 Textile Manuf. 1.463Esquire 1.727 Prof. services 1.349Gentry 1.571 Other 1.265Machinery & Tools 1.473 Unknown 1.152
Inventor occupations groups are based on each inventor’s modal occupation. Those without
a unique modal occupation group are excluded. Communicated patents are not included.
Data cover 1700-1849, the years when matched data are available.
Table 4 verifies that the difference between engineers and other types of inven-
tors is statistically significant and present in various sub-periods. The first column
presents results looking across the full sample period. The estimates show that, in-
deed, engineers produced significantly more patents than other types of inventors.
Moreover, magnitude of the coefficient on engineers, 0.689, is very large relative to
the average number of patents per inventor, which is 1.52 across the full sample. For
comparison, I also estimate results for manufacturer-inventors, a group that includes
the Machinery & Tools, Metals & Mining, Chemicals, Textiles, and Misc. Manu-
facturing occupation groups. Unlike engineers, manufacturer-inventors are not more
productive than other types of inventors.
We may worry that this difference is simply because engineers were operating in
technology areas where patenting was more common.31 In Column 2, I include con-
trols for the modal technology category that each inventor was working in. This has
very little impact on my estimates, which indicates that differences in the propensity
to patent across technology categories is not behind the higher productivity of engi-
31As Moser (2005) has shown, patenting rates can vary substantially across sectors.
20

neers relative to other types of inventors. It is also useful to look at how these patterns
look in various sub-periods of the sample. The results in Columns 3-6 show that I also
obtain clear results within each twenty-year period from 1770-1849 (as shown above,
there are few engineers before 1770 so I do not include results for that period). In
contrast to engineers, those with manufacturing occupations did not generate more
patents than the average inventor in any sub-period.
Table 4: Number of patents per inventor regressions
DV: Number of patents per inventorAll All 1770- 1790- 1810- 1830-
years years 1789 1809 1829 1849(1) (2) (3) (4) (5) (6)
Engineer 0.689*** 0.616*** 1.023** 0.802*** 0.339*** 0.448***(0.0865) (0.0903) (0.468) (0.237) (0.131) (0.0921)
Manufacturer 0.0618* 0.0272 0.0136 -0.0240 -0.0285 -0.00298(0.0325) (0.0368) (0.0579) (0.0585) (0.0580) (0.0529)
Tech. cat. FEs Yes Yes Yes Yes YesObservations 7,966 7,966 652 1,209 1,802 4,215R-squared 0.018 0.044 0.187 0.121 0.061 0.055
*** p<0.01, ** p<0.05, * p<0.1. OLS regressions with robust standard errors in parenthesis. The unit
of observation is an inventor. Data cover 1700-1849. The outcome variable is the number of patents per
inventor across all years (Column 1-2) or with 20-year periods (Columns 3-6). The explanatory variable is
an indicator for whether the inventor’s modal occupation is engineer. Inventors without a unique modal
occupation are not included. The regression in Column 2 controls for the modal technology category for
each inventor looking across all of that inventor’s patents by including a full set of technology category fixed
effects. In Columns 3-6, I control for the modal technology category for each inventor within each period.
In all of these, if there is a tie for the modal category then one is selected randomly. Data cover 1700-1849,
when matched data are available.
While the results in Table 4 identify engineers using the modal occupation ap-
pearing in an individual’s patents, and excluding those without a unique modal oc-
cupation, there are other reasonable alternative ways to classify engineers. I explore
several of these in Appendix E.2 and find that all of the alternatives I consider show
that engineers patented substantially more inventions than other types of inventors.
At this point it is worth considering whether the decision not to include engine
21

builders or mining engineers as part of the engineers category has any bearing on
the results I obtain. To examine this, in Appendix E.3, I present additional results
following the approach used in Table 4 but classifying these groups as part of the
engineers category. The results are effectively identical to those presented in Table
4, which signals that the decision of whether or not to classify engine builders and
mining engineers in the engineers category has no impact on my overall results.
Patent quality: Next, I provide evidence showing that, in addition to producing more
patents, engineers also produced higher quality patents and achieved greater overall
career success. In Column 1-2 of Table 5, I measure patent quality using the pay-
ment of renewal fees to keep patents in force after, respectively, three or seven years.
Renewals were expensive: £50 at three years and £100 at seven years, compared to
the initial patent application fee of £25.32 As a result, only 18% of patents were
renewed at year three and just 6.3% at year seven. The results in Columns 1-2 show
that patents with at least one engineer inventor were substantially more likely to be
renewed. The effects are large in magnitude compared to the sample averages and
strongly statistically significant. While patents by manufacturer-inventors were also
more likely to be renewed, they were substantially less likely to be renewed than
patents by engineers. Additional results using the patent renewal data are presented
in Appendix E.4.
In Column 3 and 4 of Table 5, I consider a second measure of patent quality
based on references in contemporary or modern sources. Column 3 uses the WRI
(for Woodford Reference Index) compiled by Nuvolari & Tartari (2011), which is
based only on contemporary sources. Column 4 uses the BCI (for Bibliographic
Composite Index) from Nuvolari et al. (2021). The BCI augments the WRI with
references in modern sources. In both cases the indexes have been standardized. The
results suggest that patents with at least one engineer inventor were of higher quality
than other patents. These patterns are particularly strong in the BCI index, which
Nuvolari et al. (2021) argue is the more reliable measure. In contrast to the results in
Columns 1-2, these measures suggest that manufacturer-inventors generated lower-
32For comparison, average annual nominal earnings for a worker in full time employment in 1851were about £33. See measuringworth.com.
22

quality patents than the average. More complete results obtained using the patent
quality indices are available in Appendix E.5.
In Column 5, I use exhibiting in the Great Exhibition of 1851 as an indicator of
quality. The sample is the set of all inventors who patented from 1830-1849 and the
outcome variable is an indicator for whether a patent holder subsequently appeared
as an exhibitor or inventor in the Great Exhibition. The regression estimates reflect
how the probability of being in the Great Exhibition varies by occupation group.
The results show that engineer patent holders were substantially more likely to exhibit
patented inventions in the Great Exhibition than other patent holders. Further details
and additional results using the Exhibition data can be found in Appendix E.6.
Finally, in Column 6, I look at an indicator of the overall career success of patent
holders, as indicated by their inclusion among the noteworthy individuals in the
ODNB. For each of the 2,053 inventors with two or more patents, I manually search
for each individual in the ODNB. Engineers, identified based on the occupations listed
in the patent data, made up 15.5% of the group that I attempted to match to the
ODNB database, but they account for 26.9% of those found in ODNB, and 34.2%
of those matched who were born after 1780, an indication that engineers were more
likely to achieve substantial career success than other types of inventors.
Column 6 of Table 5 provides further evidence on this pattern. The regression
presented in that column is run over all inventors searched for in the ODNB database
(those with two or more patents) and the outcome is an indicator for whether an
individual is found in the ODNB. The explanatory variable is the modal occupation of
each inventor. These results indicate that engineer inventors were about 8 percentage
points more likely to appear in the ODNB than other inventors with at least two
patents, while manufacturer-inventors were less likely to be noteworthy enough for
inclusion. These are large differences given the sample average rate of inclusion is
12.8%.33 Further ODNB results are available in Appendix E.7.
Overall, the results in Table 5, together with the more complete regression results
available in the associated appendices, shows that, across a range of different quality
indicators, engineers generated higher quality patents and had greater overall career
33This sample mean differs from the 11.9% of inventors with 2+ patents found in the ODNBbecause it includes only inventors with a unique modal occupation.
23

Table 5: Patent quality regressions
Patent renewals Reference indices Great ODNBYear Year WRI BCI Exhibition Biography
Three Seven(1) (2) (3) (4) (5) (6)
Engineer 0.0462*** 0.0200*** 0.0400 0.231*** 0.0441*** 0.0808***(0.00899) (0.00637) (0.0307) (0.0434) (0.0131) (0.0262)
Manufacturer 0.0140* 0.00870* -0.0486* -0.104*** 0.0159* -0.0374**(0.00772) (0.00520) (0.0253) (0.0307) (0.00835) (0.0149)
*See table notes for details on fixed effects included in different specifications.
Observations 54,742 41,215 18,473 18,473 4,469 1,987R-squared 0.020 0.015 0.134 0.058 0.003 0.013
Testing difference between engineer and manufacturer coefficientsF-statistic 10.0 2.37 7.42 55.9 4.18 20.92P value 0.002 0.124 0.007 0.000 0.041 0.000
*** p<0.01, ** p<0.05, * p<0.1. OLS regressions. Results in Column 1 use data on renewals paid at year three
for patents filed from 1856-1869. Results in Column 2 use data on renewals paid at year seven for patents filed
from 1853-1866. In Column 1-2, patents that are classified into multiple technology categories appear more than
once. To deal with this, standard errors are clustered by patent. The regressions in Columns 1-2 included both
year and technology category fixed effects. Results in Column 3 use the (standardized) WRI index from Nuvolari &
Tartari (2011) as the outcome variable. Results in Column 4 use the (standardized) BCI index from Nuvolari et al.
(2021). The data in Columns 3-4 cover 1700-1849. Patents that fall into multiple technology categories appear more
than once in these data. To deal with this, standard errors are clustered by patent. Results in Column 3-4 also
include year and technology category fixed effects. In Column 5, the sample is composed of all individuals who filed
patents from 1830-1849 and the outcome variable is whether they match to a patented invention exhibited in the
Great Exhibition of 1851. Since the Exhibition analysis is based on matching individual inventors, the explanatory
variable in Column 5 is the modal industry of the inventor. In Column 6, the sample includes all inventors with two
or more patents and the outcome variable is whether the inventor appears in the ODNB. The explanatory variables
are based on the modal occupation of each inventor.
success than other types of inventors. This is true relative to all inventors or to
manufacturing-inventors in particular. Next, I consider other ways in which engineers
differed from other inventors.
Coinventor teams: One reason that engineers may have been more productive is that,
24

because invention and design was central to their profession, they may have been
better able to form coinventor teams. Coinventor teams may have been beneficial
either because they brought together individuals with complementary technical skills,
or because they helped inventors partner with those who were more able to fund or
commercialize inventions.34 Across the study period, coinvention was generally rising,
a pattern that has also been documented in more recent periods (Jones, 2009).
Table 6 presents regression results where the unit of observation is the patent,
the outcome variable is whether the patent has more than one inventor (10.7% of all
patents), and the key dependent variable is whether one of the inventors is an engineer.
Column 1 presents baseline results using OLS regressions while Columns 2 and 3 add
in decade and technology category fixed effects respectively. Columns 4-6 follow the
same format, but using Probit regressions.35 These results show that patents by
engineers involved significantly more co-inventors than patents filed by other types
of inventors. The results are strongly statistically significant as well as large relative
to the average rate of multi-inventor patents of 0.107 across the full sample. Thus,
these findings indicate that engineers went about the process of invention in a way
that differed markedly from other inventors.
Summary: The results in this subsection show that engineers generated more patents
than other inventors, that on average these patents were of higher quality than those
produced by other inventors, and that they worked with more coinventors. One
may wonder at this point whether these differences were due mainly to the selection
of more productive individuals into engineering. To address this issue, in the next
section I consider how the behavior of individuals change when they begin to think
of themselves as engineers rather than manufacturer-inventors.
34It is not possible to clearly differentiate these alternative motivations. However, in AppendixE.8 I explore the composition of these coinventor teams. This analysis indicates that engineersoften coinvented with manufacturers or gentlemen, which may reflect the formation of partnershipsbetween inventors and those who were well-placed to commercialize a new invention, or those whocould contribute financing or political connections to a project, though it could also reflect differenttypes of skills useful in the invention process.
35Note that in Columns 3 and 6 the number of observations increases because patents listedin more than one technology appear more than once, and to account for this standard errors areclustered by patent.
25

Table 6: Patenting with coinventors
DV: Indicator variable for patents with multiple inventors
OLS regressions Probit (marginal effects)
(1) (2) (3) (4) (5) (6)
Engineer 0.0663*** 0.0582*** 0.0441*** 0.0663*** 0.0550*** 0.0446***(0.00974) (0.00984) (0.00841) (0.0097) (0.0094) (0.0087)
Decade FEs Yes Yes Yes YesTech. Cat. FEs Yes YesObservations 11,243 11,243 15,679 11,243 11,243 15,185R-squared 0.006 0.013 0.087
*** p<0.01, ** p<0.05, * p<0.1. Data cover 1700-1849. In Columns 1-2 and 4-5 the unit of observation
is a patent and robust standard errors are used. In Columns 3 and 6 the unit of observation is a patent-
by-technology-category, so patents listed in multiple technology categories may appear more than once.
To account for that, standard errors are clustered by patent. The explanatory variable is an indicator for
whether one or more of the inventors is listed as an engineer in the patent entry.
4.2.2 Changes upon becoming an Engineer
As the description of Joseph Bramah’s career in Section 4.1 illustrates, when engi-
neering was still a relatively new profession a number of engineers first appear in the
patent data as manufacturer-inventors or other types, and then eventually began to
think of themselves instead as engineers. Using these occupation switchers, I can
study whether the behavior and output of an inventor changes when they begin to
describe themselves as an engineer.
To undertake this analysis, I begin by focusing on only those inventors with two
or more patents (around 1900 inventors). For each inventor, I construct a dataset
that covers all years from their first to their last patent and indicates the number
of patents they filed in each intervening year. There are 380 inventors with multiple
patents that list themselves as engineers in at least one patent. For these, I identify
the first year that they list their occupation as engineer and generate an indicator
variable that takes the value of one for that year and all subsequent years until the
last patent that they filed. I then run regressions looking at how outcomes for each of
26

these inventors changes after they began describing themselves as an engineer, with
individual fixed effects included so that identification is driven entirely by changes
within inventors over time. Specifically, I study how becoming an engineer is related
to whether an inventor works with coinventors (their behavior) and how many patents
they produce per year (their productivity).36
The results are presented in Table 7. The first three columns of this table focus on
one observable measure of the behavior of inventors: the share of their patents filed
with at least one coinventor. The results in the first column show that individuals
began working with more other inventors once they became engineers. To ensure that
this wasn’t just due to becoming more experienced as inventors, the second column
includes a control for the number of years since each inventor’s first patent. In the
third column, I drop observations from the first year in which an inventor listed their
occupation as engineer. This changes the sample, since it eliminates those who did not
have patents in years after they first list their occupation as an engineer (about 18%
of engineers), but we still see evidence that inventors worked with more coinventors
after becoming engineers.
In Column 4-6, I look at the output of inventors, specifically the number of inven-
tions they produced per year, between the first and last year that they patented.37
The results in the first column shows that individuals generated about 0.25 more
patents per year after they started describing themselves as engineers. This is a large
increase relative to the sample average of 0.32 patents per year. Column 5 shows
that this is not due to a general increase in patenting as inventors’ careers progressed.
In Column 6, I drop from the sample the first year in which an individual described
themselves as an engineer. This is done because to become an engineer the individual
must appear in the patent database, which causes a direct link between becoming
an engineer and generating a patent. Dropping this ensures that this mechanical
effect is not behind my results. I still observe clear effects in Column 6 despite the
fact that these results are likely to be biased toward zero (the true magnitude of the
36Unfortunately, it is not possible to also assess how patent quality changes when inventors becomeengineers, since the only quality measures available across the full study period, the reference-basedindexes, are too noisy to generate clear results given the sample size used in this analysis.
37Note that the sample size is larger in Columns 4-6 than in Column 1-3 because the sample inColumn 4-6 includes inventors who never had a multi-inventor patent.
27

change should lie between the estimates in Columns 5 and 6). Additional results, in
Appendix E.9, show that even stronger effects are estimated if quadratic controls for
time since first patent are included.
Table 7: Within-inventor regressions
DV: Share of patents DV: Patents per yearwith multiple inventors
(1) (2) (3) (4) (5) (6)
Engineer 0.0513** 0.0620*** 0.0915*** 0.252*** 0.266*** 0.0686**(0.0229) (0.0235) (0.0305) (0.0334) (0.0335) (0.0328)
Years since -0.000928 -0.000755 -0.00123*** -0.000624first patent (0.000605) (0.000587) (0.000458) (0.000431)
Individual FE Yes Yes Yes Yes Yes YesDropping first Yes Yesyear as Eng.Observations 5,333 5,333 5,152 18,787 18,787 18,641R-squared 0.547 0.548 0.552 0.234 0.234 0.233
*** p<0.01, ** p<0.05, * p<0.1. Standard errors are clustered by individual. The Engineer variable is an
indicator for each individual that takes a value of one starting from the first year in which an individual
listed their occupation as engineer in a patent, and zero otherwise.
The fact that the same individuals begin to behave differently, and produce more,
once they begin describing themselves as an engineer indicates that the broad differ-
ences between engineers and other inventors documented above are not merely due
to the selection of more productivity individuals into the engineering profession. In-
stead, these results suggest that once an individual began to think of themselves as
an engineer, their behavior changed in a way that led to increased inventive output.
4.2.3 Differences in technology type and scope in Britain
In the next stage of the analysis, I bring in the British Patent Office technology
categorizations and use them to study differences between engineers and other in-
ventors in terms of the types of technologies that they worked on. It is useful to
28

begin by discussing some of the technology categories in which engineers were partic-
ularly active. As detailed in Appendix E.10 engineers accounted for a high fraction of
patents in key Industrial Revolution technology categories, including mechanical tools
for boring, drilling, and punching, steam engines, boilers, railways and rolling stock,
gas manufacturer and use, as well as advances related to civil engineering (arches,
bridges, tunnels, embankments, etc.). However, engineers patented across a wide
range of different technology types.
Table 8 presents the average number of technology categories patented in by in-
ventors falling into each occupation group. Clearly engineers worked across a broader
set of technology categories than any other type of inventor. This was not due to the
fact that many patents by engineers were filed later in our study period. Regression
results in Appendix E.11 show that not only did engineers work on significantly more
technology types when looking across the full sample period, but the same is true in
every two-decade sub-period from 1770 forward (we know from above that there were
few engineers before 1770). In contrast, inventors holding manufacturing occupations
consistently patented in fewer technology categories, most likely those closely related
to their manufacturing activities.
Thus, engineers were not merely generating more inventions of the same type.
Instead, they were producing both more inventions and inventions that spanned a
wider set of different technologies. In this, they appear to have been fundamentally
different than other types of inventors.38 It is worth noting that engineers typically
did not produce patents in more technology types per patent filed. Rather, their
diversity on technology categories covered was closely tied to the fact that they were
producing more patents overall. However, this does not detract from the fact that
they were able to patent in a broader set of technologies, because it may be that their
greater overall productivity was possible exactly because they possessed the ability
to pursue promising ideas across a broader range of technology types.
One might wonder about the extent to which the technology category results are
38It is important to note that these results do not contradict the idea, emphasized in recent work byJones (2009), that inventors become more specialized as knowledge advances. Rather, the growth ofspecialized inventors (engineers) should be interpreted as the first step in this specialization process.Moreover, the fact that engineers were more likely to work in coinventor teams is also consistentwith what we would expect given the results in Jones (2009).
29

dependent on the specific features of the BPO classifications. To allay this concern,
Appendix E.12 shows that equivalent results are obtained using a very different set
of patent classifications generated by Billington & Hanna (2018).
Table 8: Average number of technology categories per inventor, by occupation type
Occupation Avg. number of Occupation Avg. number ofgroup tech. categories group tech. categories
per inventor per inventorAgric., food/drink makers 1.548 Merchant 1.483Chemical manuf. 1.740 Metals and mining 1.589Construction 1.470 Misc. manuf. 1.462Engineering 2.459 Textile Manuf. 1.388Esquire 1.897 Prof. services 1.605Gentry 1.822 Other occ. 1.490Machinery and tool manuf. 1.547 Unknown 1.519
Based on the modal occupation group of each inventor. Inventors without a unique modal occupation group
are not included. Excludes patents that are communications. Data cover 1700-1849.
4.2.4 Background of engineers
Using patent data that has been manually matched to ODNB biographies (discussed
in more detail in Appendix E.13), it is possible to extract biographical information
on the background of patenting inventors. Briefly, the most common educational
background for engineers (as identified by the patent occupations) was an appren-
ticeship. Prominent engineers apprenticed in a wide variety of older occupations,
such as millwrights, watchmakers, carpenters, merchants, land surveyors and civil
engineers, shipbuilders, coal viewers, etc. Of these, the most common for engineers
was carpenter or joiner. In later years, some engineers also apprenticed at famous en-
gineering firms. The wide range of different apprenticeship backgrounds emphasizes
the broad set of paths that led into engineering as well as the fact that engineering
was not merely a relabeling of an older occupation such as millwright. Engineers were
also more likely than other types of inventors to have a purely working background
30

(beyond basic primary schooling). A number of prominent engineers fell into this
group, such as the famous railway engineer George Stephenson. Engineers were less
likely than other inventors, particularly gentlemen and other professionals, to have
formal higher education. This suggests that what higher education they did have was
probably primarily due to self-study, a feature that appears regularly throughout the
ODNB biographies. One implication of this fact is that it would be a mistake to clas-
sify this important group of inventors based on their formal educational background.
5 International comparison: Engineering in France
This section compares the changes in the British innovation system to France, a
natural comparison country, during the same period. Specifically, I focus compare
patterns observed in patent data, using data on French patents.
5.1 French patent data
I study French patents, following the work of Hallmann et al. (2021), using data that
span the inception of the system in 1791 to 1843, just before a major patent reform
was undertaken in 1844. Similar to the British patent data, the 11,804 patents filed
in France during this period include the patentee name and, in most cases, patentee
occupation and location, patent title, and technology category. I clean and prepare the
French patent data using essentially the same procedures applied to the British data,
including standardizing occupation information and conducting a laborious manual
matching of patents to identify unique individuals.39 Starting with 14,161 patent-
inventor observations, this matching procedure identifies 10,559 individual inventors
(filing 1.35 patents per inventor on average).
Three differences in the French data are worth noting. First, patentees in France
could apply for protection over 5, 10, or 15 years, with higher fees for a longer duration.
This feature is useful because it provides an indicator of expected patent quality.
Second, the occupations appearing in the French data differ from those found in
39Individual matches in the French patent data are particularly reliable because there were fewcommon surnames and the data often included multiple first and middle names.
31

Britain, with almost no one described as a “Gentleman” or “Esquire”.40 Thus, if one
is concerned about how the presence of many gentlemen in the British data affect
the results, this issue will not be present in the French data. Third, the French
system distinguished between patents of invention of new technologies, improvement
to existing technologies, and importation of technologies discovered abroad. All three
types are included in my analysis.
5.2 Analysis of French patent data
A first question to ask is whether engineers (ingenieure) in France differed from other
inventors, as they did in Britain. This issue is examined in Table 9. Column 1
shows that engineers filed more patents per person than other types of inventors,
while manufacturer-inventors filed fewer patents.41 As I will discuss later, some of
the engineers that patented in the French data were based in Britain. To ensure that
these British inventors are not driving the results, Column 2 presents results in which
any inventor declaring an address in the U.K. in any of their patents is excluded.
Columns 3-4 conduct a similar exercise looking at the average length of the patent
term applied for by different types of inventors. This is interesting because it may be
an indicator of the ex ante assessment of the quality of an invention, though it should
be considered with caution because it may also be influenced by factors such as credit
constraints. The results in Column 3 (all inventors) and Column 4 (excluding British
inventors) indicate that engineers applied for significantly longer patent terms than
other types of inventors, suggesting that they may have been producing higher-quality
innovations. Columns 5-6 of Table 9 show that engineers in France also filed patents
across a wider range of technology categories than other types of inventors.
Thus, my analysis of the French patent data confirms the main patterns found in
the British patent data: engineers were more productive, in terms of the number of
patents they produced, there is evidence suggesting that they also produced higher
40However, a number of inventors described themselves as either working in government (e.g.,mayor) or as a member of the military. These are probably the most comparable occupations to the“gentleman” category found in the British data given that the military and public service were twoof the primary occupations for the British upper classes.
41As in the the British patent analysis, the manufacturer-inventor category includes those workingin machinery and tools, metals and mining, chemicals, textiles, and misc. manufacturing.
32

quality patents, and they also patented across a broader set of technology categories.
Moreover, not only were engineers more productive than the average non-engineer
inventor, they were also more productive than every other occupation group (see
Appendix Table 39).
Table 9: Differences between engineers and other patentees in France
Patents per Avg. length of Tech. categoriesperson patent term per person
All Excluding All Excluding All Excludinginventors UK-based inventors UK-based inventors UK-based
Engineer 0.965*** 0.838*** 1.156*** 1.045*** 0.690*** 0.594***(0.147) (0.137) (0.204) (0.218) (0.108) (0.0993)
Manuf. -0.0589*** -0.0589*** -1.195*** -1.047*** -0.0954*** -0.0949***(0.0179) (0.0181) (0.0736) (0.0740) (0.0201) (0.0212)
Observations 10,556 9,980 10,541 9,967 10,557 9,981R-squared 0.032 0.025 0.031 0.026 0.011 0.008
Robust standard errors in parenthesis. Occupations are based on the modal occupation of
each inventor. Inventors without a unique modal occupation group are not included.
Next, I ask: did the French innovation system undergo the same changes docu-
mented in the British innovation system? In particular, do we observe a similar emer-
gence of engineers as an important group of inventors in France? Figure 3 presents
the key patterns, comparing the share of patents filed by engineers in Britain and
France relative to all inventors (left panel) or those inventors who reported an occu-
pation (right panel). Unlike Britain, we can see that France did not experience a rise
of patents by engineers in the first few decades of the nineteenth century. Instead,
the types of inventors that patented in France remained essentially stable throughout
1790-1843 period and dominated by manufacturer-inventors (see Appendix Figure 8),
similar to the patterns observed in Britain before the emergence of engineering. This
contrast may help explain why it was Britain, rather than France, that emerged as
the technology leader during this period.
The fact that we do not observe the emergence of engineers as an important
part of the French innovation system before the mid-1840s may be surprising given
the well-established system of engineering education that existed in France at this
time. However, as discussed in Appendix H, the French system was largely directed
33

by the government and focused on producing engineers skilled at designing public
infrastructure, mainly for military purposes. In contrast, the engineering profession
that developed in Britain did so with very little government intervention, resulting in a
profession with more of a focus on developing economically-valuable new technologies.
British engineers may have also benefited from the availability of skilled craftsmen
in Britain, which made it easier to implement new inventions (Kelly et al., 2014).
These differences can help explain why it was in Britain, rather than France, where
engineers emerged as a major part of the innovation system.
A final aspect of interest in the French patent data is the contribution of foreign
inventors, particularly the British. Of the inventors with an address listed in the
French data, 92% had a modal location in France. The next largest group by far was
the British, accounting for 5.8%, followed by the U.S. (0.5%) and all of the various
German territories (0.47%). While British inventors accounted for just 5.8% of all
French inventors, they accounted for 11.7% of all engineers, and 13.8% of patents by
engineers, in France. Moreover, within the group of British inventors that reported
an occupation, 37.4% were engineers. Since engineers accounted a lower fraction
of all British patentees during this period, this tells us that engineers were much
more likely than other British inventors to also patent their inventions abroad. This
provides yet another indicator that engineers differed in important ways from other
types of British inventors.
6 The Professionalization of Civil Engineering
Civil engineering work is perhaps the most closely associated with the engineering
profession, and it was the first to develop many of the features of a profession, such
as dedicated professional societies. This section reviews available historical evidence
on the development of the civil engineering profession, supported with some new
quantitative analysis.
While civil engineering work has been undertaken for millennia, historians high-
light the fundamental changes that took place in how this work was done during the
eighteenth century. Bill Addis, in his monumental history of 3000 years of building
engineering (Addis, 2007), titles the chapter covering 1750-1800, “Engineering be-
34

Figure 3: Share of patents by engineers in Britain and France
All patents Patents with occupation data
Source: Engineers are identified as those listing engineering as their modal occupation. The French data
spans 1791-1843. The British data cover 1790-1849.
comes a Profession.” In it, he describes how this professionalization was reflected in
the career of John Smeaton, one of the leading civil engineers of the age (p. 239-240):
[John] Smeaton was able to apply general principles, based on science
and tested using full-sized and scale model experiments, to an engineer-
ing problem in a field entirely unfamiliar to him...the translation of real
engineering problems into simplified theoretical models was becoming a
matter of course for the few engineers who were scientifically and mathe-
matically educated...from Smeaton’s calculations of the size or number of
water wheels needed to perform pumping duties, we can see that he had
already established our modern approach to engineering design...While
Smeaton has become an engineering icon...many other engineers where
treading similar paths.
I provide quantitative support for this narrative using a list of 338 major British
civil engineering projects. These data, from Skempton et al. (2002), have been digi-
tized and combined with biographical information on the engineers involved.42 While
42Further details on these data can be found in Appendix G.
35

the data cover 1500-1830, I focus mainly on the period after 1600, since there were
few major projects before that point. These data show that from 1600-1760, roughly
75% of major engineering projects were overseen by someone who had not previously
overseen another major project (see Appendix Figure 10). After 1760, however, the
pattern changes. From that point until 1830, roughly 35% of all major projects were
overseen by a chief engineer who had not already overseen a major project. Moreover,
after 1760, and unlike before that point, very few major projects were overseen by
engineers who did not either have prior experience or training under a more experi-
enced engineer. Thus, the engineers chosen to oversee major projects were becoming
a more experienced group.
What changed in the middle of the eighteenth century? Before 1760, major in-
frastructure projects were often designed and overseen by skilled craftsmen as one-off
endeavors.43 Many of these “proto-engineers,” with backgrounds that included mill-
wright, architect, surveyor, mason, and mining engineer, were skilled, and some were
brilliant. What was different was that they had rarely developed their skills by work-
ing on previous major engineering works, and they rarely undertook more than one
or two important engineering projects in their lifetime.
One striking example of this pattern is provided by the construction of the West-
minster Bridge, the most expensive infrastructure project undertaken in Britain the
first half of the eighteenth century. Parliament chose Charles Labelye as the engineer
in charge of this project. Labelye was skilled and knowledgeable, but up to that time
he had not a single major engineering project to his name, either as chief engineer
or as an assistant engineer under someone more experienced (Skempton et al., 2002).
That Parliament chose him to undertake the most important engineering project of
the period was emblematic of how civil engineering was done up to that point.
After about 1760, this pattern begins to change, with the emergence of a more pro-
fessional body of engineers, each overseeing numerous major engineering works. From
1700-1750, for example, the most prolific individuals on Skempton’s list, Thomas
Steer and John Reynolds, oversaw four major projects each. From 1750-1800, the
most prolific engineer, John Smeaton, oversaw eighteen, followed by William Jessop
43Certainly there were some exceptions, such as Cornelius Vermuyden or George Sorocold.
36

(15 projects), John Rennie (9 projects), James Brindley (8 projects), etc.44 By 1800,
the idea that a project such as the Westminster Bridge would have been awarded to
an engineer with no prior experience would have seemed absurd.
One aspect of the professionalization of the civil engineering that took place af-
ter 1760 was that young engineers typically gained extensive experience as assistant
engineers before overseeing major projects. From 1700-1760, my data show that only
20 percent of engineers undertaking their first project had prior experience working
under an engineer who had previous experience on a major project. This changed
in the following generation. After 1760, more than half of all engineers overseeing
major projects were trained by more experienced engineers. John Smeaton, one of
the most influential early civil engineers, trained five engineers who would go on to
oversee major projects, including William Jessop. James Brindley, another important
early engineer, trained six, including Robert Whitworth. Jessop would go on to train
or partner with seven later engineers who oversaw major projects. Whitworth would
train six. Thus, we can see the profession of civil engineering develop after 1760, as
the knowledge and experience of the first generation of professional civil engineers
was passed on to the next.
The growth of engineering into a distinct and respected profession was accom-
panied by the development of institutions that helped engineers meet one another
and exchange ideas. The Society of Civil Engineers was founded in 1771, followed
by the Institution of Civil Engineers 1818 and the Institution of Mechanical Engi-
neers in 1846. These provided a forum for engineers to engage, a way to present
and publish their new ideas, and a representative of their interests. There was also
a growing specialized press focused on disseminating engineering knowledge, includ-
ing William Nicholson’s Journal of Natural Philosophy, founded in 1797, Alexander
Tilloch’s Philosophical Magazine (1798), and, later, Mechanic’s Magazine, founded
in 1823 by Joseph Clinton Robertson, an engineer. Thus, by the middle of the nine-
44Between 1750 and 1770, for example, Smeaton was responsible for the Eddystone Lighthouse,the Colstream Bridge, work on the Perth Bridge, the Potteric Carr Drainage, work on the LondonBridge Waterworks, and the Adlingfleet Drainage. In just the first decade of the 19th century, JohnRennie built the Kelso Bridge, the Leith East Docks, the London Docks, the East India Docksin London, the Humber Dock in Hull, and oversaw the drainage of the Wildmore Fens. Furtherevidence on this patterns is provided in Appendix Table 41.
37

teenth century British engineers were immersed in a rich intellectual milieu based on
networks formed through the learned societies and information transmitted through a
vibrant scientific and technical press, while the profession itself rested on institutional
foundations that would survive to today.
So, the rise of engineers as an important group of inventors shown in the patent
data paralleled by the professionalization of civil engineers as designers of a wide
variety of civil infrastructure. These various strands of engineering were closely tied
to one another, with many engineers moving between them, and in a number of cases
we see civil engineers filing patents, or mechanical engineers relying on income from
civil and consulting work while developing new inventions.
7 A Growth Theory Featuring the Professionalization of Invention
This section briefly describes a theory illustrating how the professionalization of inven-
tion documented in the previous sections could have contributed to the acceleration
in the rate of growth that took place during the Industrial Revolution. Full details
are provided in Appendix A. The central feature of the model is the process through
which new technologies are developed. This can be done either by non-specialists,
who are mainly engaged in other productive activities (manufacturer-inventors), or
by specialist researchers (engineers). A key assumption, supported by the empirical
analysis above, is that specialist researchers are more productive at generating new
technologies than non-specialists. Thus, the core of the model reflects Adam Smith’s
insight that specialization can increase productivity. Specialized research also involves
some fixed cost, a standard assumption in models of innovation, while non-specialists
may develop new ideas simply as a byproduct of their productive activities (e.g.,
learning by doing) without an up-front investment.
To connect my theory to existing work on the Industrial Revolution, the model
incorporates two factors that seem likely to play a role in determining whether a
professional research sector emerges. The first is the institutional environment, and
specifically, whether existing institutions provide sufficient property rights protection
for inventors to profit from their new inventions. This feature connects the model to
existing work, dating back to (North & Thomas, 1973), which argues that Britain’s
38

unique institutional environment may have played an important role in allowing the
Industrial Revolution to take off. The second factor is the ease with which potential
professional researchers are able to access skills and useful knowledge. The rise of
modern engineering would almost certainly not have been possible had access to cer-
tain practical skills and scientific knowledge not been readily accessible, or if Britain
did not have a ready supply of the high-skilled craftsmen needed to implement new
ideas. This feature connects the theory to existing work, such as Mokyr (2009) and
Kelly & O Grada (2020), which emphasize the importance of knowledge in the In-
dustrial Revolution and argue that Britain was particularly well-endowed with such
knowledge by the eighteenth century.45
Starting from an initially low level of technology, the model exhibits three phases of
development, though not all phases will necessarily occur. In the first, “pre-modern
phase,” there is a low level of technology, all individuals specialize in production
activities, and all new ideas are the result of serendipitous discoveries generated by
workers mainly engaged in generating output. There is no professional research sector
in the pre-modern phase because the limited knowledge base means that professional
research is not sufficiently productive to make it worthwhile for any individual. Over
time, serendipitous discoveries raise the overall level of technology in the economy
(similar to the pre-modern period in Unified Growth Theory), but this process may
be very slow.
As the technology level slowly rises, it may reach a point where enough knowledge
is available to support the emergence of a dedicated research sector and the transition
to modern economic growth begins. This occurs because, in the standard Romer
(1990) framework, the productivity of inventors is increasing in the knowledge base
that they have to work with. However, the model makes it clear that the transition
to modern economic growth is not inevitable. In particular, for a specialized research
sector to emerge, the cost of acquiring the necessary skills must not be prohibitive
and there must be institutions in place that allow professional researchers to profit
from their discoveries.
45Existing work highlights a variety of factors that contributed to the availability of useful knowl-edge and craft skills in England during this period, ranging from the influence of Enlightenmentculture to Britain’s well-developed apprenticeship system.
39

If institutions provide inventors with sufficient protection, and they have access
to knowledge at a sufficiently low time cost, then the slow accumulation of knowledge
during the pre-modern period will eventually allow a dedicated research sector to
emerge. If this occurs, then the emergence of a professional research sector causes an
acceleration in the rate at which new technologies are developed. This acts as the
mechanism through which the economy transitions toward a new balance growth path
characterized by more rapid economic growth. As the transition occurs, the share of
the population employed as professional researchers initially grows and then stabilizes.
Concurrently, the overall share of the population acquiring skills increases and then
stabilizes. Serendipitous discoveries as a by-product of production continue to occur,
but over time this source of new technology diminishes relative to the contribution of
dedicated researchers.
The way that slowly rising technology during the pre-modern period eventually
leads (under the right conditions) to a tipping point that launches the economy toward
modern economic growth is a standard feature of models that aim to describe the
transition from pre-modern to modern growth, such as Galor & Weil (2000) and
Hansen & Prescott (2002). This feature also connects to the historical context I
study. The discovery of key macroinventions such as Newcomen’s steam engine and
Arkwright’s water frame provided incentives for follow-on research of the type that
over time would come to be dominated by engineers. Viewed through the lens of the
model, these inventions represent the final increment that pushed the economy over
the tipping point, allowing a professional research sector to emerge. We should not
lose sight, however, of the fact that the model does not predict that such a transition
was inevitable.
Finally, it is important to recognize that the core mechanism in the model, a
change in the production process through which new technology is developed, differs
from existing work emphasizing, on the one hand, changes in the availability of inputs
into the technology production process (such as human capital) and, on the other,
changes in the rewards for producing new technology (such as increasing market size
or better institutional protections for inventors). While those factors are likely to be
important, and are therefore incorporated into my theory, they are distinct from the
mechanism I emphasize.
40

8 Conclusions
This paper documents the emergence of a new division of labor, characterized by the
emergence of professional engineers, and by doing so it provides a new perspective
on the Industrial Revolution. Central to this perspective is the idea that there was
a change in the process through which new technology developed, an innovation in
the process of innovation. I am certainly not the first to argue that the innovation
process changed in important ways during this period. What is new here is backing
that argument up with quantitative evidence, describing in more detail the nature
of the change, and showing, theoretically, exactly how such a change might have
contributed to the transition to modern economic growth.
It is not my intention to argue that the changes documented here mattered to the
exclusion of other factors that may have influenced the innovation rate during the
Industrial Revolution, such as an increasing stock of human capital, the inducements
created by an expanding market, the influence of Enlightenment thinking, or the pro-
tections provided by the institutional environment. Most likely, such factors worked
together, just as they do in my theoretical framework.
The question of what caused the acceleration in innovation and economic growth
that took place during the Industrial Revolution remains debated. However, in order
to make progress in understanding the causes of the Industrial Revolution, it is nec-
essary to first establish the nature of the changes that occurred, particularly those
that directly affected the rate of technological progress. Documenting, quantitatively,
the nature of the changes that took place in the British innovation system during the
Industrial Revolution is the primary contribution of this paper.
41

References
1928. A Brief History of the Institution of Civil Engineers. London: Institution ofCivil Engineers.
Abramitzky, Ran, Boustan, Leah, Eriksson, Katherine, Feigenbaum, James, & Perez,Santiago. Forthcoming. Automated Linking of Historical Data. Journal of Eco-nomic Literature.
Acemoglu, D. 2002. Directed technical change. Review of Economic Studies, 69(4),781–809.
Acemoglu, Daron, Johnson, Simon, & Robinson, James. 2005. The Rise of Europe:Atlantic Trade, Institutional Change, and Economic Growth. American EconomicReview, 95(3), 546 – 579.
Addis, Bill. 2007. Building: 3000 Years of Design Engineering and Construction.London: Phaidon.
Alder, Ken. 1997. Engineering the Revolution. Chicago: University of Chicago Press.
Allen, Robert C. 2009a. The British Industrial Revolution in Global Perspective.Cambridge University Press.
Allen, Robert C. 2009b. The Industrial Revolution in Miniature: The Spinning Jennyin Britain, France, and India. The Journal of Economic History, 69(4), 901–927.
Anderson, Michael L. 2008. Multiple inference and gender differences in the effects ofearly intervention: A reevaluation of the Abecedarian, Perry Preschool, and EarlyTraining Projects. Journal of the American Statistical Association, 103(484), 1481–1495.
Bailey, Martha, Cole, Connor, & Henderson, Morgan. Forthcoming. How Well Do Au-tomated Linking Methods Perform? Evidence from U.S. Historical Data. Journalof Economic Literature.
Benjamini, Yoav, Krieger, Abba M, & Yekutieli, Daniel. 2006. Adaptive linear step-upprocedures that control the false discovery rate. Biometrika, 93(3), 491–507.
Billington, Stephen D., & Hanna, Alan J. 2018 (June). That’s Classified! Inventing aNew Patent Taxonomy. Queens University Center for Economic History WorkingPaper No. 2018-06.
42

Bottomley, Sean. 2014. The British patent system during the Industrial Revolution1700–1852: From privilege to property. Vol. 28. Cambridge University Press.
Desaguliers, J.T. 1744. A Couse of Experimental Philosophy. W. Innys.
Dutton, H.I. 1984. The Patent System and Inventive Activity During the IndustrialRevolution, 1750-1852. Manchester University Press.
Ferrie, Joseph P. 1996. A new sample of males linked from the public use microdatasample of the 1850 US federal census of population to the 1860 US federal censusmanuscript schedules. Historical Methods, 29(4), 141–156.
Galor, Oded. 2011. Unified Growth Theory. Princeton University Press.
Galor, Oded, & Weil, David N. 2000. Population, Technology, and Growth: FromMalthusian Stagnation to the Demographic Transition and Beyond. AmericanEconomic Review, 90(4), 806 – 828.
Hallmann, Carl, Rosenberger, Lukas, & Yavuz, Emre E. 2021 (Nov.). Invention andTechnological Leadership During the Industrial Revolution. Working Paper.
Hanlon, W. Walker. 2015. Necessity is the Mother of Invention: Input Supplies andDirected Technical Change. Econometrica, 83(1), 67–100.
Hanlon, W. Walker. 2022 (Jan.). Bridging Science and Technology During the Indus-trial Revolution. Working Paper.
Hansen, Gary D, & Prescott, Edward C. 2002. Malthus to Solow. American EconomicReview, 92(4), 1205–1217.
Howes, Anton. 2017. The Relevance of Skills to Innovation during the British Indus-trial Revolution, 1547-1851. Mimeo.
Jacob, Margaret C. 2014. The First Knowledge Economy. Cambridge UniversityPress.
Jones, Benjamin F. 2009. The burden of knowledge and the “death of the renaissanceman”: Is innovation getting harder? The Review of Economic Studies, 76(1),283–317.
Jones, Charles I. 2001. Was an industrial revolution inevitable? Economic growthover the very long run. The BE Journal of Macroeconomics, 1(2).
Kelly, Morgan, & O Grada, Cormac. 2016. Adam Smith, Watch Prices, and theIndustrial Revolution. Quarterly Journal of Economics, 1727–1752.
43

Kelly, Morgan, & O Grada, Cormac. 2020. Connecting the Scientific and industrialRevolutions: The Role of Practical Mathematics. CEPR Discussion Paper No.14885.
Kelly, Morgan, Mokyr, Joel, & O Grada, Cormac. 2014. Precocious Albion: a Newinterpretation of the British Industrial Revolution. Annual Review of Economics,6, 363–389.
Kelly, Morgan, Mokyr, Joel, & O Grada, Cormac. 2020. The Mechanics of the In-dustrial Revolution. CEPR Discussion Paper No. 14884.
Khan, B Zorina. 2018. Human Capital, Knowledge and Economic Development:Evidence from the British Industrial Revolution, 1750–1930. Cliometrica, 12(2),313–341.
Landes, David S. 1969. The Unbound Prometheus. London: Cambridge UniversityPress.
Lundgreen, Peter. 1990. Engineering education in Europe and the USA, 1750-1930:The rise to dominance of school culture and the engineering professions. Annals ofscience, 47(1), 33–75.
MacLeod, Christine. 1988. Inventing the Industrial Revolution. Cambridge, UK:Cambridge University Press.
MacLeod, Christine. 2007. Heroes of Invention. Cambridge University Press.
MacLeod, Christine, & Nuvolari, Alessandro. 2009. ‘Glorious Times’: The Emer-gence of Mechanical Engineering in Early Industrial Britain, c. 1700-1850. BrusselsEconomic Review - Cahiers Economiques de Bruxelles, 52(3/4).
MacLeod, Christine, Tann, Jennifer, Andrew, James, & Stein, Jeremy. 2003. Eval-uating Inventive Activity: The Cost of Nineteenth-Century UK Patents and theFallibility of Renewal Data. The Economic History Review, 56(3), pp. 537–562.
Maloney, William F., & Valencia Caicedo, Felipe. 2017. Engineering Growth: In-novative Capacity and Development in the Americas. CESifo Working Paper No.6339.
Meisenzahl, Ralf, & Mokyr, Joel. 2012. The Rate and Direction of Invention in theBritish Industrial Revolution: Incentives and Institutions. University of ChicagoPress.
44

Michaels, Guy, Rauch, Ferdinand, & Redding, Stephen J. 2019. Task Specializationin US Cities from 1880 to 2000. Journal of the European Economic Association,17(3), 754–798.
Mokyr, Joel. 2002. The Gifts of Athena. Princeton University Press.
Mokyr, Joel. 2004. Accounting for the Industrial Revolution. Pages 1–27 of: TheCambridge Economic History of Modern Britain. Cambridge University Press.
Mokyr, Joel. 2005. Handbook of Economic Growth. Amsterdam: Elsevier. Chap.Long-Term Economic Growth and the History of Technology, pages 1113–80.
Mokyr, Joel. 2009. The Enlightened Economy. Yale University Press.
Mokyr, Joel, Sarid, Assaf, & van der Beek, Karine. 2020 (4). The Wheels of Change:Technology Adoption, Millwrights, and Persistence in Britain’s Industrialization.Mimeo.
Moser, P. 2012. Innovation Without Patents: Evidence from World’s Fairs. Journalof Law and Economics, 55(1), pp. 43–74.
Moser, Petra. 2005. How Do Patent Laws Influence Innovation? Evidence fromNineteenth-Century World’s Fairs. American Economic Review, 95(4), 1214.
Musson, A.E., & Robinson, Eric. 1969. Science and Technology in the IndustrialRevolution. Toronto: University of Toronto Press.
North, Douglass, & Thomas, Robert Paul. 1973. The Rise of the Western World.Cambridge University Press.
Nuvolari, A, & Tartari, V. 2011. Bennet Woodcroft and the Value of English Patents,1617-1841. Explorations in Economic History, 48, 97–115.
Nuvolari, Alessandro, Tartari, Valentina, & Tranchero, Matteo. 2021. Patterns ofInnovation During the Industrial Revolution: A Reappraisal Using a CompositeIndicator of Patent Quality. Explorations in Economic History, 82.
Peretto, Pietro F. 2015. From Smith to Schumpeter: A theory of take-off and con-vergence to sustained growth. European Economic Review, 78, 1–26.
Rees, Abraham. 1819. The Cyclopaedia. Longman, Hurst, Rees, Orme & Brown, etc.
Romer, PM. 1990. Endogenous Technological Change. Journal of Political Economy,98(5, Part 2), S71–S102.
45

Rosenberg, Nathan. 1974. Science, Invention and Economic Growth. The EconomicJournal, 84(333), 90–108.
Skempton, A.W. 1996. Civil Engineers and Engineering in Britain, 1600-1830. Alder-shot, Hampshire: Variorum.
Skempton, AW, Chrimes, MM, Cox, RC, Cross-Rudkin, PSM, Reinnison, RW, &Ruddock, EC (eds). 2002. A Biographical Dictionary of Civil Engineers in GreatBritain and Ireland. Vol. 1: 1500-1830. Thomas Telford.
Squicciarini, Mara P, & Voigtlander, Nico. 2015. Human Capital and Industrializa-tion: Evidence from the Age of Enlightenment. The Quarterly Journal of Eco-nomics, 130(4), 1825–1883.
Sullivan, Richard J. 1989. England’s “Age of Invention”: The acceleration of patentsand patentable invention during the Industrial Revolution. Explorations in Eco-nomic History, 26(4), 424–452.
Sullivan, Richard J. 1990. The revolution of ideas: widespread patenting and inventionduring the English industrial revolution. The Journal of Economic History, 50(2),349–362.
Watson, Garth. 1989. The Smeatonians. The Society of Civil Engineers. ThomasTelford.
Whitehead, Alfred North. 1925. Science and the Modern World. London: The FreePress.
Woodcroft, Bennet. 1854a. Subject Matter Index of Patents of Invention. Queen’sPrinting Office.
Woodcroft, Bennett. 1854b. Titles of Patents of Invention, Chronologically Arranged.George Edward Eyre and William Spottiswoode.
46

Appendix
Appendix Table of Contents
Page
A. Theory appendix 48
B. Evidence from Google Ngrams 61
C. Verb stem analysis appendix 62
D. British patent data appendix 67
E. British patent analysis appendix 80
F. French patent analysis appendix 103
G. Civil engineering appendix 105
H. Government and the engineering profession 109
47

A Theory Appendix
This section presents the details of the theory that embeds the emergence of a group
of professional inventors into a model of endogenous growth. The model builds on
elements from Romer (1990), Unified Growth Theory (Galor & Weil, 2000; Galor,
2011) and uses some of the structure of Acemoglu (2002). The goal is to show how
the arrival of a group of professional inventors, engineers, can act as a mechanism
through which the economy transitions from a slow “pre-modern” growth into more
rapid “modern” economic growth regime, as well as to connect my analysis to existing
work on the factors that contributed to the onset of the Industrial Revolution.
A.0.1 Demand
The model is written in continuous-time and, for simplicity, time subscripts are sup-
pressed when possible. The population of the economy is fixed at 1. There is a
homogeneous final good with a price normalized to P=1. The model admits an in-
finitely lived representative consumer with CRRA preferences over consumption of
the final good:
∫ ∞0
C1−σ − 1
1− σe−ρtdt , (1)
where σ is the coefficient of relative risk aversion and ρ is the time preference param-
eter. The budget constraint is given by, C + I + F ≤ Y where Y is total output of
final goods, I is the amount of final goods used in the production of machinery, and
F is a fixed cost associated with undertaking research.
A.0.2 Production of final goods
Final goods are produced using skilled labor H, unskilled labor L, and machines,
in a perfectly competitive market with a constant returns to scale technology. The
aggregate production function is,
Y =1
1− β
(∫ N
0x(j)1−βdj
)[(ιH)α + Lα]
βα (2)
48

where N is the level of technology (number of machine designs available), x(j) is
the quantity of machine type j used in production, α ∈ (−∞, 1) and β ∈ (0, 1) are
production function parameters, and ι ∈ (0, 1) is the fraction of high-skilled workers’
time left over for productive activities after they undertake the education necessary
to become skilled (so 1− ι reflects the cost, in terms of time, of acquiring skill). Final
goods producers solve a standard optimization problem taking as given the wage for
low-skilled workers (wL), wages for high-skilled workers (wH), and a price χ(j) for
machines of type j. The first order conditions are,
wL =β
1− β
(∫ N
0x(j)1−βdj
)[(ιH)α + Lα]
β−αα Lα−1 (3)
wH =β
1− β
(∫ N
0x(j)1−βdj
)[(ιH)α + Lα]
β−αα ια−1Hα−1 (4)
x(j) = χ(j)−1β [(ιH)α + Lα]
1α (5)
A.0.3 Machine producers
Machine producers hold a perpetual monopoly over their machine design, which they
produce using final goods. Machines depreciate fully after use. Setting aside for
now the cost of obtaining a machine design, the profits of machine makers are given
by π(j) = (χ(j) − φ)x(j) where φ reflects the cost of producing a new machine in
terms of output used. Using the first order conditions from the final goods producers’
problem together with the first order condition for the machine makers’ optimization
problem gives χ(j) = φ1−β . Thus, the machine price is just a constant mark-up over
the marginal cost. Using this, we can rewrite the machine makers’ profits as,
π(j) = β
(1− βφ
) 1−ββ
[(ιH)α + Lα]1α (6)
It is useful to note here that profits are independent of the technology level. However,
profit does depend on the number of high and low-skilled workers active in producing
final goods.
49

A.0.4 Occupation choice and technology development
Individuals are endowed with one unit of time and must choose discretely to either
become a low-skilled worker or to invest in skills and then become either a high-skilled
worker or a professional researcher. Skills depreciate completely each period. Let E
denote the quantity of professional researchers (engineers), so L + H + E = 1. Low
skilled workers earn wL while high-skilled workers earn ιwH (since they have to devote
a fraction 1− ι of their time to becoming skilled). Professional researchers, which also
must spend a fraction 1− ι of their time to become skilled, allocate the remainder of
their time to producing new inventions.
New technologies arise from two sources. First, new technologies may be developed
by professional researchers (engineers). Since these researchers must have skills, the
total time available for research is ιE. In addition, they must pay some fixed cost
f to undertake research. Each professional researcher then produces a new machine
design with a probability ηN . This productivity scales with N , a standard feature
of endogenous growth models following Romer (1990). This reflects the idea that
professional researchers are more likely to generate a new technology if they have
more existing ideas and tools to work with. As (Romer, 1990) explains, “The engineer
working today is more productive because he or she can take advantage of all the
additional knowledge accumulated as design problems were solved...” The overall
number of new technologies generated by the professional research sector within a
period is then ηNιE.
In addition, new technologies may be developed by high-skilled workers as a
serendipitous byproduct of production.46 This occurs for each high-skilled worker
with probability γN . It is useful to note that making the probability of a serendip-
itous discovery increasing in N is not a vital assumption for the model, but it is
useful for helping the model match the patterns observed in the data.47 Given this
46The assumption that only high-skilled workers and not low-skilled workers generate new inven-tions as a byproduct of production is not critical for the main results of the theory, but it seemsmore reasonable to confine the development of new technologies to only those with skills.
47Specifically, if instead the rate of serendipitous discoveries occurred at rate γ rather than γN ,then the growth rate of technologies generated through this channel is declining over time. Thatdoes not match the patterns in the patent data, which show that innovations by non-engineers grewat a constant (but low) rate during my study period.
50

formulation, the number of new technologies generated through this channel is γNιH.
Motivated by the results presented in my empirical analysis, I make the following
key assumption:
Assumption: η > γ, so professional researchers are more productive at generat-
ing new technologies than high-skilled workers engaged mainly in goods production.
Technological change in the economy is N = γNιH+ηNιE and the rate of change
is,
N
N= γιH + ηιE (7)
The discounted present value of a new machine design depends on the profits of
machine makers according to V = (π + V )/r, where r is the interest rate and V
accounts for changes in future profits.48
When a professional researcher develops a new technology, their ability to capture
the rents from their design depends on the strength of intellectual property protec-
tion. The strength of IP protection is represented by the parameter λ ∈ (0, 1) which
reflects the probability that an inventor retains ownership over a design. If they retain
ownership, then they sell of the design to one out of a large group of potential machine
making firms, thus capturing the full discounted present value of the invention. If
they do not, I assume that the design is appropriated by the government which sells
the design for the full value and then distributes the proceeds to all individuals in
the economy through equal lump-sum payments. For simplicity, I assume that when
high-skilled workers generate serendipitous inventions they are not able to monetize
the value. Instead, the invention is appropriated by the government, auctioned off to
a machine firm, and the value is returned to individuals through lump-sum transfers.
This is not a critical assumption. It is made only because it simplifies the exposition
48It is worth noting that V ≤ 0 in this model. To see this, note that profits depend only on theamount of skilled and unskilled workers employed in final goods production. As shown below, forlow levels of N all workers will be used in final goods production, and this amount will fall if at somepoint some workers begin choosing to become researchers. Thus, profits can only fall over time inthe model.
51

of the model and helps emphasize the fact that growth during the pre-modern period
is not dependent on the availability of intellectual property protection.
The expected return to low-skilled workers, high-skilled workers, and researchers,
respectively, is,
ERL = wL = β(1− β)1−2β
β φβ−1β [(ιH)α + Lα]
1−αα Lα−1N (8)
ERH = ιwH = β(1− β)1−2β
β φβ−1β [(ιH)α + Lα]
1−αα ιαHα−1N (9)
ERE = ιληV N − f =ιληβ
r
(1− βφ
) 1−ββ
[(ιH)α + Lα]1α N +
ιληV
rN − f (10)
I assume that professional researchers are able to insure each other against the risk of
not producing an invention in any particular period, so that in choosing an occupation
they care only about the expected returns.
In equilibrium, individuals will choose between being a low-skilled worker, a high-
skilled worker, or a researcher, to maximize their expected return. Since both high
and low-skilled workers are vital to the production of final goods (since α < 1), we
know that there will be positive quantities of both of these types of workers. This
implies that in equilibrium ERH = ERL. Using this and Eqs. 8 and 9 we can solve
for the equilibrium relationship between L and H. This is H/L = ια
1−α . This equation
tells us that when high and low-skilled workers are substitutes (α > 0) the share of
high-skilled workers in the economy will increase when the costs of becoming skilled
falls (higher ι). Otherwise, if α < 0, the share of high-skilled workers will fall as the
cost of obtaining skill falls. The relevant case for our setting is likely to be α > 0, so
that locations where it is easier to acquire skills also have more skilled workers.
One feature in Eq. 10 that is worth noting is that the ι parameter increases the
returns to being a professional researcher in two ways. First, there is a direct effect on
engineers through easier access to skills. Second, easier access to skills raises the return
to being a researcher by increasing the number of skilled workers in the economy
able to work with the new technologies that professional researchers discover. This
52

channel, represented by the ιH term, reflects another connection between the theory
and the empirical setting, where historical evidence suggests that the availability of
skilled craftsman in England who could construct new machines played an important
role in incentivizing the development of those technologies.49
A.0.5 Development path and key results
Consider the development path of the economy starting from a very low initial tech-
nology level. The first useful prediction of the theory is that the professional research
sector will be inoperative when the technology level is sufficiently low.
Prop. 1: There exists some N such that for all N < N, ERE < ERH = ERL
when E = 0 and therefore no individuals choose to become professional researchers.
Proof of Prop. 1: This follows directly from the fact that ERE, ERH and ERL
are continuous functions of N and that limN→0ERE < 0 while limN→0ERH = 0.
The intuition here is simple. Since the productivity of researchers scales with
N , at low levels of N they are unproductive, and so it does not pay to become a
professional researcher given the fixed costs involved.
Starting from an initially low level of N , Proposition 1 tells us that the economy
will initially be one in which there are no professional researchers. This initial “pre-
modern” period is characterized by relatively slow growth, which may be very slow if
γ is low, and no professional research sector. This pre-modern period may potentially
last for a very long time; under certain conditions the economy may be stuck in pre-
modern growth forever, as explained shortly. In periods characterized by pre-modern
growth (where E = 0) we have the following equilibrium allocations of high and low
skilled workers,
H =1
1 + ι−α1−α
L =ι
−α1−α
1 + ι−α1−α
derived by using the conditions ERL = ERH and H + L = 1.
49See Mokyr (2009), Chapter 6.
53

It is important to note during pre-modern growth, technological progress is not
dependent on the availability of intellectual property protection, so the model can
capture historical periods in which new technologies were developed even though
inventors received little or no monetary reward from their discoveries.
Next, I show that when the professional research sector is operating, the growth
rate increases.
Prop. 2: When η > γ, the growth rate is increasing in E.
Proof of Prop. 2: The growth rate g = N/N = (γιH + ηιE).
Using H + L + E = 1 and substituting in L = Hι−α1−α , we have
H = (1− E)/(1 + ι−α1−α ). Thus,
N
N=
γι
1 + ι−α1−α
+ E
(ηι− γι
1 + ι−α1−α
)
which is increasing in E when η > γ.
The growth rate in the proof above has an intuitive structure. The first term is
the rate of growth in the pre-modern period while the second term is the product
of the share of researchers in the economy and the difference between the rate that
they produce inventions (ηι) and the rate of serendipitous discovery by high-skilled
workers (γι) and accounting for the fact that only a fraction of non-researchers end
up becoming skilled (reflected in the 1 + ι−α1−α term).
The next proposition describes the conditions under which the economy will even-
tually transition into modern growth. It is useful to begin by defining the following
key condition:
Condition 1: (1− β)ληι− (γισ)/(1 + ι−α1−α ) > ρ
Prop. 3: If Condition 1 holds, there exists some N such that for any N > N ,
ERE > ERH = ERL when E = 0 and therefor at least some individuals choose to
become researchers. If Condition 1 fails, then there is no N such that ERE > ERH =
ERL when E = 0 and the professional research sector never emerges.
54

Proof of Proposition 3: To prove the first statement, by contra-
diction, suppose that (1 − β)ληι − (γισ)/(1 + ι−α1−α ) > ρ but that
ERL > ERE for all N. This implies that limN→+∞ERL−ERE ≥ 0.
Since there is no professional research sector, the economy will be
in a balanced growth path characterized by E = 0, H = 1
1+ι−α1−α
,
L = ι−α1−α
1+ι−α1−α
, and V = 0.
Thus,
limN→+∞
N
[β(1− β)
1−2ββ φ
β−1β [(ιH)α + Lα]
1−αα Lα−1 − ιληβ
r
(1− βφ
) 1−ββ
[(ιH)α + Lα]1α +
f
N
]≥ 0
This is true only if,
β(1− β)1−2β
β φβ−1β [(ιH)α + Lα]
1−αα Lα−1 ≥ ιληβ
r
(1− βφ
) 1−ββ
[(ιH)α + Lα]1α
Substituting in for L and H and solving gives, r ≥ (1− β)ληι.
We now need to substitute in for r using the intertemporal op-
timization condition. Since the professional research sector does
not operate in this scenario, the stead state growth rate is is
N/N = γιH = γι/(1 + ι−α1−α ). The intertemporal optimization
condition implies that (r− ρ)/σ = γι/(1 + ι−α1−α ). Solving for r and
substituting in we have,
ρ ≥ (1− β)ληι− γισ
(1 + ι−α1−α )
But this contradicts the initial assumption.
To prove the second statement, given Proposition 1, it is sufficient
to show that (1 − β)ληι − (γισ)/(1 + ι−α1−α ) < ρ implies d(ERE −
ERL)/dN < 0 for any N .
d(ERE − ERL)
dN=ιληβ
r
(1− βφ
) 1−ββ
[(ιH)α + Lα]1α +
ιληV
r−β(1−β)
1−2ββ φ
β−1β [(ιH)α + Lα]
1−αα Lα−1
Since V ≤ 0, for d(ERE − ERL)/dN < 0 it is sufficient that,
ιληβ
r
(1− βφ
) 1−ββ
[(ιH)α + Lα]1α−β(1−β)
1−2ββ φ
β−1β [(ιH)α + Lα]
1−αα Lα−1 < 0
55

Reorganizing and substituting in for L and H, we have,
(1− β)ιλη < r
Thus, whenever this condition holds, d(ERE − ERL)/dN < 0. It
remains to show that this must hold under the initial assumption of
(1−β)ληι−(γισ)/(1+ι−α1−α ) < ρ. This can be reorganized to obtain
(1− β)ληι < ρ+ (γισ)/(1 + ι−α1−α ). Thus, a sufficient condition for
(1−β)ιλη < r is ρ+ (γισ)/(1 + ι−α1−α ) ≤ r. This can be reorganized
to,
γι
(1 + ι−α1−α )
≤ r − ρσ
To see that this must be true note that the intertemporal optimiza-
tion condition requires that (r − ρ)/σ = g where g is the growth
rate of the economy, and that g ≥ γι/(1 + ι−α1−α ) (see Proposition
3). Thus, if (1− β)ληι− (γισ)/(1 + ι−α1−α ) < ρ it can never be the
case that ERE > ERL with E = 0 and so the professional research
sector can never begin operating.
The intuition here is that, under Condition 1, the return to professional researchers
increases more rapidly with N than returns in the production sector (when E = 0).
As a result, eventually the return to becoming a researcher exceeds the wage of
production workers and some individuals have an incentive to become professional
researchers.50
Proposition 2 is a central result of the theory. It tells us that the professional
research sector emerges only under certain conditions. In particular, the emergence
of the professional research sector depends crucially on the availability of institu-
tions that allow inventors to monetize their inventions, reflected in the λ parameter.
50This begs the question of why the return to the research sector does not continue to rise fasterthan wages in the production sector after the research sector begins to operate. The reason that thisdoes not happen is that as fewer individuals choose to become workers, the profits of the machinemaking firms fall (see Eq. 6) pulling down the value of new inventions and thus the returns tobecoming a professional researcher.
56

Whether a professional research sector emerges also depends on the ease with indi-
viduals can acquire skills, reflected in the ι parameter (note that the left-hand side
of Condition 1 is increasing in ι). Only when these conditions are satisfied will a
professional research sector eventually emerge, allowing growth to accelerate. Thus,
Proposition 2 connects the model to the features of the historical setting, specifically
the availability of useful knowledge, a culture of learning, access to training in craft
skills (such as through apprenticeships), and institutions that allowed inventors to
monetize inventions.
Once modern economic growth begins, the economy approaches a new long-run
balanced growth path. On the equilibrium balanced growth path, ERL = ERH =
ERE, V = 0, and as N → +∞ the economy approaches fixed shares of researchers,
skilled, and unskilled workers (described in Appendix A.0.6).51 The long-run ratio of
researchers to production workers in the economy is,
θ =E
H + L= (1− β)ληι− γσι
11−α
1 + ια
1−α− ρ (11)
This share is increasing in the productivity of researchers η, as we would expect,
as well as the importance of machines in the production function (1 − β) and the
strength of IP protection represented by λ. The share is decreasing in the rate at
which high-skilled manufacturing workers generate new technologies (γ), decreasing
in the time discount factor ρ, and decreasing in the coefficient of relative risk aversion
σ. This is intuitive given that the value of research is mainly realized in the future.
As indicated by Prop. 2, the long-run growth rate in the modern economy with
an active professional research sector is faster than the rate experienced in the pre-
modern period. Thus, the emergence of professional researchers has pushed the econ-
omy onto a more rapid growth path. How much growth increases depends on the
difference between η and γ.
Finally, it is useful to show that the model provides additional predictions that
are consistent with the historical record:
Prop. 4: When Condition 1 holds, the economy converges to a long-run balanced
51Note that the no-Ponzi game condition requires that (1−σ)g < ρ, which restricts the admissibleset of parameter values.
57
growth path in which the share of skilled workers in the economy is higher than the
share during the pre-modern growth period.
Proof of Proposition 4: To prove this proposition it is sufficient
to show that, under Condition 1, L > L∗, where L = 1/(1 + ια
1−α
is the amount of low-skilled workers in the pre-modern period and
L∗ is given by Eq. 12. It will be the case that L > L∗ when,
1
1 + ια
1−α>
ησι+ ρ
(1− β)ληι(1 + ια
1−α )− γσι1
1−α + ησι(1 + ια
1−α )
(1−β)ληι(1+ια
1−α )−γσι1
1−α +ησι(1+ια
1−α ) > ησι(1+ια
1−α )+ρ(1+ια
1−α )
(1− β)ληι(1 + ια
1−α )− γσι1
1−α > ρ(1 + ια
1−α )
(1− β)ληι− γσι1
1−α
(1 + ια
1−α )> ρ
(1− β)ληι− γσι
(1 + ι−α1−α )
> ρ
This is exactly Condition 1.
Thus, the onset of modern economic growth is characterized not just by an ac-
celerated rate of technological progress but also by an increase in the share of skilled
individuals in the economy.52
A.0.6 Long-run balanced growth path
Once modern economic growth begins (if it does), the economy begins to approach
a new long-run stead state characterized a fixed proportion of high-skilled workers,
52It is worth noting that this increase is driven by the demand for skilled workers in the professionalresearch sector. The ratio of skilled to unskilled production workers is unchanged.
58

low-skilled workers, and professional researchers. In equilibrium, ERL = ERE, so,
β(1− β)1−2β
β φβ−1β [(ιH)α + Lα]
1−αα Lα−1N =
ιληβ
r
(1− βφ
) 1−ββ
[(ιH)α + Lα]1α N +
ιληV
rN − f
On the balanced growth path, V = 0 and so as N → +∞ the economy approaches,
β(1− β)1−2β
β φβ−1β [(ιH)α + Lα]
1−αα Lα−1 =
ιληβ
r
(1− βφ
) 1−ββ
[(ιH)α + Lα]1α
This together with H = ια
1−αL can be used to show,
L =rι−1
(1− β)λη(1 + ια
1−α )
H =rι
α1−α−1
(1− β)λη(1 + ια
1−α )
E = 1− rι−1
(1− β)λη
The standard intertemporal optimization condition implies that (r − ρ)/σ = g =
γιH + ηιE. Substituting for H and E and solving for r, we have,
r =(1− β)λη(1 + ι
α1−α )(ηισ + ρ)
(1− β)λη(1 + ια
1−α )− για
1−ασ + ησ(1 + ια
1−α )
Substituting this back in, we have,
L∗ =ηισ + ρ
(1− β)ληι(1− ια
1−α )− γσι1
1−α + ησι(1 + ια
1−α )(12)
H∗ =ι
α1−α (ηισ + ρ)
(1− β)ληι(1− ια
1−α )− γσι1
1−α + ησι(1 + ια
1−α )(13)
59

E∗ =(1− β)ληι(1 + ι
α1−α )− γσι
11−α − ρ(1 + ι
α1−α )
(1− β)ληι(1 + ια
1−α )− γσι1
1−α + ησι(1 + ια
1−α )(14)
The growth rate is,
g =γι
1 + ι−α1−α
+ E
(ηι− γι
1 + ι−α1−α
)
Here, the first term is the growth rate of the economy when there are no pro-
fessional researchers, and the second term is the share of professional researchers
in the economy multiplied by the difference between the rate at which professional
researchers produce innovations and the rate at which high-skilled workers produce
innovations, scaled by 1 + ι−α1−α to reflect the fact that if the share of professional
researchers falls there is a less-then-proportional increase in the share of high-skilled
workers in the economy.
60

B Evidence from Google Ngrams
Figure 4 describes the usage of the term “engineer” in books contained in the Google
Books repository, as reported by Google Ngrams (https://books.google.com/ngrams),
from 1700-1850.
Figure 4: Google Ngram for “engineer”
Data from Google Ngrams, June 18, 2020.
61

C Verb stem analysis appendix
This appendix describes in more detail a text analysis exercise that aims to identify the
functional activities that characterized the early engineering profession. The starting
point for this analysis is biographical data from the ODNB, a rich data source that
has been used in numerous previous studies.53 These biographies cover only a select
sample of the most successful or notable individuals, so an analysis of this data will
not be representative of all engineers. However, it will reflect the activities of upper-
tail engineers, the group most likely to invent valuable new technologies and therefore
the primary interest in this paper.
I begin by collecting the text of the biographies of all those classified by the ODNB
as engineers born before 1850 (439 in total), as well as two natural comparison groups:
manufacturers (349 biographies) and those non-engineers classified as involved in sci-
ence or technology (1547 biographies).54 Using natural language processing methods,
I parse the biographies and identify all verb stems. These verb stems reflect the
types of activities that individuals undertook during their lifetime. This procedure
identifies 924 verb stems. I focus on the 338 verbs that appear in at least 100 out
of the 2335 biographies used in the analysis. To provide a point of comparison, I
identify a set of ‘neutral’ verbs (e.g., is, do, died, sat, etc.) that are unlikely to reflect
activities associated with a particular occupation. I then run the following regression
specification:
V ERBvi =∑v∈V
(γv ENGi θv) + φi + ηv + εvi
where V ERBvi is an indicator for whether verb stem v shows up the biography
of individual i, φi is a set of individual biography fixed effects, which accounts for
53Previous studies using these data include Allen (2009a), Meisenzahl & Mokyr (2012), Nuvolari& Tartari (2011), and Khan (2018).
54Within the ODNB, these are the two natural comparison groups. Most engineers were classifiedas part of those involved in science and technology, so it is natural to compare to that group.Manufacturers were the other major group of inventors during the study period, as the patent datawill show. I exclude military engineers from the engineers group. I also include iron masters asmanufacturers. Of those individuals classified as working in science or technology, I do not includemanufacturers, artists/engravers, alchemists, or fossil collectors.
62

variation in the length of individual biographies, and ηv is a set of verb fixed effects,
to account for variation in the baseline frequency with which each verb is used. The
explanatory variables of interest in this regression are constructed by interacting
an indicator for whether an individual is an engineer (ENGi), with θv, an indicator
variable for each verb in the set of verbs V that excludes neutral verbs. The estimated
coefficient for each verb in this set, γv, reflects the extent to which that verb is
particularly common in engineer biographies. Since I am looking at many outcomes,
I adjust for multiple hypothesis testing by calculating sharpened p-values, following
Benjamini et al. (2006) and Anderson (2008).
Table 10 presents the full listing of verbs strongly associated with engineers (sharp-
ened p-values below 0.05), when comparing to both manufacturers and non-engineers
involved in science and technology. The presence of verbs such as “design”, “invent”
and “patent” indicate the important role of inventive activities to the engineering
profession. Out of all the verbs, the one most closely associated with engineers is
“design”. There are also terms indicating the role that engineers played in imple-
menting their new designs and inventions, words such as “build,” “erect,” “employ,”
“lay,” and “supervise.” Other important roles played by engineers are indicated by
the presence of “consult,” “report,” and “survey.” These terms give us a sense of the
types of activities that set engineers apart from others.
The words least associated with engineers can also be informative. When com-
pared to manufacturers, the five verbs most associated with that group, relative to
engineers, are “sell,” “expand,” “produce,” “manufacture,” and “buy.” For non-
engineers involved in science and technology, the verbs most associated with that
group, relative to engineers, are “publish,” “graduate,” “write,” “study,” and “col-
lect.” The contrast between these terms and the words in Table 1 highlights the
defining differences, in terms of activities, between these various groups.
Table 11 presents the top-20 verbs related to engineers from four alternative esti-
mation approaches. The results in the first two columns correspond to my preferred
approach. That approach uses an indicator for whether a verb appears in a biography
as the outcome variable and compares to biographies from both manufacturers and
non-engineers involved in science and technology. The next two columns compare
only to manufacturers, followed by two columns comparing only to those involved
63

Table 10: Verb stems associated with engineers with sharpened p-values below 0.05
Verb T-stat Sharpened Verb T-stat Sharpenedstem p-value stem p-valuedesign 14.61 0.001 install 3.91 0.001build 11.53 0.001 replace 3.88 0.001construct 9.58 0.001 advocate 3.60 0.002consult 8.16 0.001 operate 3.42 0.003patent 6.74 0.001 engage 3.37 0.003employ 6.23 0.001 apprentice 3.36 0.003report 6.10 0.001 knight 3.28 0.003erect 5.59 0.001 develop 3.11 0.005survey 5.27 0.001 act 3.07 0.006drive 5.15 0.001 train 3.01 0.006complete 5.10 0.001 manufacture 2.98 0.007open 5.01 0.001 assist 2.90 0.008supervise 4.87 0.001 adopt 2.85 0.009improve 4.83 0.001 join 2.75 0.011lay 4.56 0.001 devise 2.74 0.012advise 4.40 0.001 commission 2.72 0.012supply 4.36 0.001 run 2.69 0.013connect 4.24 0.001 test 2.66 0.014propose 4.11 0.001 promote 2.48 0.02invent 4.01 0.001 introduce 2.26 0.032
Estimated coefficients and t-statistics based on robust standard errors. Sharpened p-valuesare calculated using the approach from Anderson (2008). Regressions include verb andindividual fixed effects. N=789,230 (2335 biographies x 338 verbs).
in science and technology. While these two sets of results are similar, we can see
some interesting contrasts. For example, relative to manufacturers, engineers were
more likely to be engaged in activities such as publishing and writing. This is not
true when comparing engineers to non-engineers involved in science and technology.
Similarly, engineers were more likely to be involved in activities such as manufactur-
ing or supervising when compared to non-engineers involved in science or technology,
but not when compared to engineers. However, when comparing to either group we
consistently see that engineers are closely associated with activities such as designing,
consulting, constructing, and surveying (“invent” and “patent’ also have p-values be-
low 0.05 when compared to either group, though they fall outside of the top 20 terms
in some cases). The last two columns present results where the count of verbs in a
64

biography is used in place of an indicator for whether a verb appears. This alternative
approach also delivers very similar results.
Table 11: Verb stem results using alternative comparison groups or outcome variables
Compare to Compare to Using verb countsBaseline manufacturers only sci/tech only as outcome
Verb Sharpened Verb Sharpened Verb Sharpened Verb Sharpenedstem p-value stem p-value stem p-value stem p-valuedesign 0.001 design 0.001 design 0.001 design 0.001build 0.001 construct 0.001 build 0.001 build 0.001construct 0.001 consult 0.001 construct 0.001 construct 0.001consult 0.001 complete 0.001 employ 0.001 consult 0.001patent 0.001 publish 0.001 consult 0.001 employ 0.001employ 0.001 survey 0.001 patent 0.001 patent 0.001report 0.001 report 0.001 open 0.001 report 0.001erect 0.001 propose 0.001 erect 0.001 erect 0.001survey 0.001 award 0.001 manufacture 0.001 improve 0.001drive 0.001 advise 0.001 report 0.001 complete 0.001complete 0.001 assist 0.001 supply 0.001 drive 0.001open 0.001 connect 0.001 drive 0.001 supervise 0.001supervise 0.001 test 0.001 improve 0.001 open 0.001improve 0.001 consider 0.001 supervise 0.001 lay 0.001lay 0.001 engage 0.001 survey 0.001 propose 0.001advise 0.001 undertake 0.001 install 0.001 survey 0.001supply 0.001 act 0.001 lay 0.001 connect 0.001connect 0.001 prepare 0.001 operate 0.001 supply 0.001propose 0.001 supervise 0.001 replace 0.001 advise 0.001invent 0.001 lay 0.001 complete 0.001 act 0.001
Estimated coefficients and t-statistics based on robust standard errors. Sharpened p-values arecalculated using the approach from Anderson (2008). Regressions include verb and individual fixedeffects. In the first and last set of results, N=789,230. When comparing only to manufacturers,N=266,344. When comparing only to non-engineers working in science or technology, N=671,268.
Table 12 presents the top ten verbs associated with engineers based on the matched
patent-ODNB data set. In these results, engineers are identified using the occupations
reported in the patent data (based one each inventor’s modal occupation) and the
comparison group is made up of those individuals in the matched data set with a
unique modal occupation other than engineering. Note that this data set includes a
much smaller set of biographies, so the results are not as strong as those shown above.
65

Despite that, a number of the terms shown in Table 12, most notably “design,” are
also found in the tables above.
Table 12: Verb stems associated with engineers based on matched patent-ODNB data
Verb p-value Sharpened Verb p-value Sharpenedstem p-value stem p-valuedesign 0.0001 0.014 cast 0.0065 0.242erect 0.0003 0.025 develop 0.0083 0.242drive 0.0004 0.025 manufacture 0.0083 0.242construct 0.0043 0.242 install 0.0136 0.315achieve 0.0057 0.242 apprentice 0.0139 0.315
Estimated coefficients and t-statistics based on robust standard errors. Sharp-ened p-values are calculated using the approach from Anderson (2008). Re-gressions include verb and individual fixed effects. N=41,940 (180 biographieswith unique modal occupations x 233 verbs).
66

D British patent data appendix
D.1 Number of patents over time
Figure 5 describes how the number of patents increased across the study period. The
graph uses a log scale and excludes patents received as a communication from a person
abroad.
Figure 5: Number of patents by year, 1700-1849 (log scale)
67

D.2 Patent linking appendix
This section discusses the procedures used to link up patent entries associated with
the same unique inventor. At the outset it is important to recognize that this linking
problem is different in a number of important ways than the more well-known problem
of linking individuals across various censuses (see Abramitzky et al. (Forthcoming)
and Bailey et al. (Forthcoming) for discussions of census linking). The most important
differences are:
1. Unlike standard census to census linking, the linking undertaken in this paper
aims to match up all patents associated with a single individual. This means
that rather than searching for unique one-to-one matches, some patents may
correctly link to numerous other patents, while many others may correctly not
link to any others. One consequence of this is that standard statistics such as
link rate are less meaningful in my context.
2. A second important difference relative to the standard census matching problem
is that, because patenting is a rare activity typically undertaken by a relatively
elite group, I am working with a much smaller universe of observations that
need to be linked. Working with a much smaller sample makes linking easier,
since it means that it is much less likely that an observation for one individual
will have observations for multiple other individuals that are plausible matches.
Working with a small universe (not sample) of observations also means that a
manual linking approach, similar to the one pioneered by Ferrie (1996), can be
used.
3. A third important difference has to do with the quality of the underlying data
in my sample. Unlike an historical census, which is collected by thousands
of enumerators talking with individuals who themselves may not be literate,
and may not even speak the same language well, the patent data that I study
was provided and collected by a relatively elite group of individuals. Literacy
was almost certainly universal within this group. Moreover, patent filers had
strong incentives to ensure that their information was registered correctly, since
incorrect filings could potentially raise subsequent legal issues. These differences
68

mean that the underlying data is likely to have substantially fewer errors than
raw census microdata. As one indicator of this, I do not find any nicknames,
such as “Bill” or “Bob”, in the data. This does not eliminate all name errors,
since there are transcription errors, but it means that one important source of
error in standard census linking is unlikely to be substantial in my setting.
4. A fourth difference relative to standard linking problems is that I am working
with a different, and in many ways richer, set of information to link on. The
examples provided below illustrate the type of data that goes into my links.
One implication of this rich set of linking data is that we can typically have
a high level of confidence in individual links. A second consequences is that
implementing automated linking methods in this setting is likely to be more
challenging, another reason to prefer a manual linking procedure.
Given these features, I have chosen to use a manual linking procedure. This
procedure involves the following steps:
1. First, I manually reviewed the names and cleaned up obvious transcription
errors.
2. Next, I use automated methods to parse names into separate first name and
surname fields. This is relatively straightforward except that it requires the
removal of suffixes such as “Jr.” or “the younger”.
3. Next, in an Excel file, I sort the data based on (i) first name and (ii) surname
and then work down the list of patents to identify potential matches. In the
majority of cases, similar names will be located near one another, unless there
has been a transcription error in one of the first few letters of the first name. For
each potential match, I review available information including the full name,
occupation, location, patent description, and co-inventors (see examples below)
in order to identify matches.
4. After fully working through the data once, I then re-sort the data based on (i)
surname and then (ii) first name and repeat the procedure. Under this sorting
approach, entries for the same individual should be very close to one another
69

unless there has been a serious transcription error in the first few letters of the
surname or in the procedure use to parse out surnames.
The best way to get a sense of the information that goes into forming a match is
to review some examples. A somewhat arbitrary place to start is to look at the first
few entries in the dataset when sorting by first name. These are presented in Table
13. One thing that can be seen in this table is that, because the universe of entries
is small, there are quite a few obviously unique names. There are also a number
of obvious potential matches, such as those associated with Abraham Buzaglo and
Abraham Henry Chambers. One transcription error can be seen in the data, in the
last line, but when sorting by either fist name or surname that entry will still end
up near the other patents by the same individual. It is not hard to imagine working
down this list and identifying likely matches. Or course, there are other names that
are much more common, so it is not always this easy.
Before coming to some more challenging examples, it is useful to get a sense of
the information that goes into making a match. Table 14 presents the first few sets
of matched patents in the data (sorting by first names) where I have filled in the
inventor’s location and the patent description from the original sources. We can see
that quite a lot of information is available to make matches. Often, one type of
information, such as occupation or location, may vary across entries. We can see
this in the case of Abraham Buzaglo, though it is worth noting that an experienced
reviewer may note that St. Mary-le-Strand and Strand are essentially equivalent
and that both are in close proximity to the City of London. The information on
type of invention can be quite useful. Even though the first two entries differ in
the listed occupation and location, a comparison of the inventions would strongly
suggest a match, even if the name wasn’t as unique as Abraham Buzaglo. The last
two entries, where one had a transcription error in the name, illustrate that exact
name matches are not required to identify a link. These entries also highlight how
useful coauthor information can be in confirming a link, though even without that,
the almost identical patent descriptions would be enough to identify a link.
The entries in Table 14 are representative of the vast majority of matches, which
are straightforward. However, it is also useful to consider some more challenging
70

Table 13: First 25 entries in the patent data when sorting by first name
Patent No. Pat. Year Name (as originally entered) Occupation7292 1837 Aaron Fearn Dyer2166 1797 Aaron Garlick Manufacturer393 1713 Aaron Hill Esquire5137 1825 Aaron Jennens Manufacturer and japanners4558 1821 Aaron Manby Iron master9141 1841 Aaron Ryles Agent7923 1839 Abel Morrall10553 1845 Abel Siccama Bachelor of arts2569 1802 Abner Cowell Lea Manufacturer6196 1831 Abraham Adolf Moser Engineer8744 1840 Abraham Alexander Lindo Gentleman2242 1798 Abraham Bosquet Esquire7843 1838 Abraham Bury Esquire826 1765 Abraham Buzaglo Gentleman928 1769 Abraham Buzaglo Warming machine maker1211 1779 Abraham Buzaglo Warming machine maker7882 1838 Abraham Collen Esquire380 1707 Abraham Darby Smith5369 1826 Abraham Dixon Manufacturer845 1766 Abraham Foster Peruke maker5962 1830 Abraham Garnett Esq.4441 1820 Abraham Henry Chambers Esquire4527 1821 Abraham Henry Chambers Esquire4906 1824 Abraham Henry Chambers Esquire5114 1825 Abraliam Henry Chambers Esquire
examples, which highlight the advantages of a manual linking procedure. The first
example is for patentees named Henry Smith, a fairly common name. The first two
columns include the patent number and patent title for each patent with an inventor
with this name. The third column presents the unique individual ID generated by
my name matching process. The first two Henry Smiths (nos. 3804 and 3805) are
unique. The third Henry Smith (no. 3806) is matched to three different patents. For
this inventor, the match between patents 9291 and 10808 is fairly straightforward,
but the match to patent 12266 is more difficult. In that case, the inventor has moved
to a different town and the entry is missing an occupation. However, the very specific
nature of the invention, railway wheels, makes it extremely unlikely that these are
71
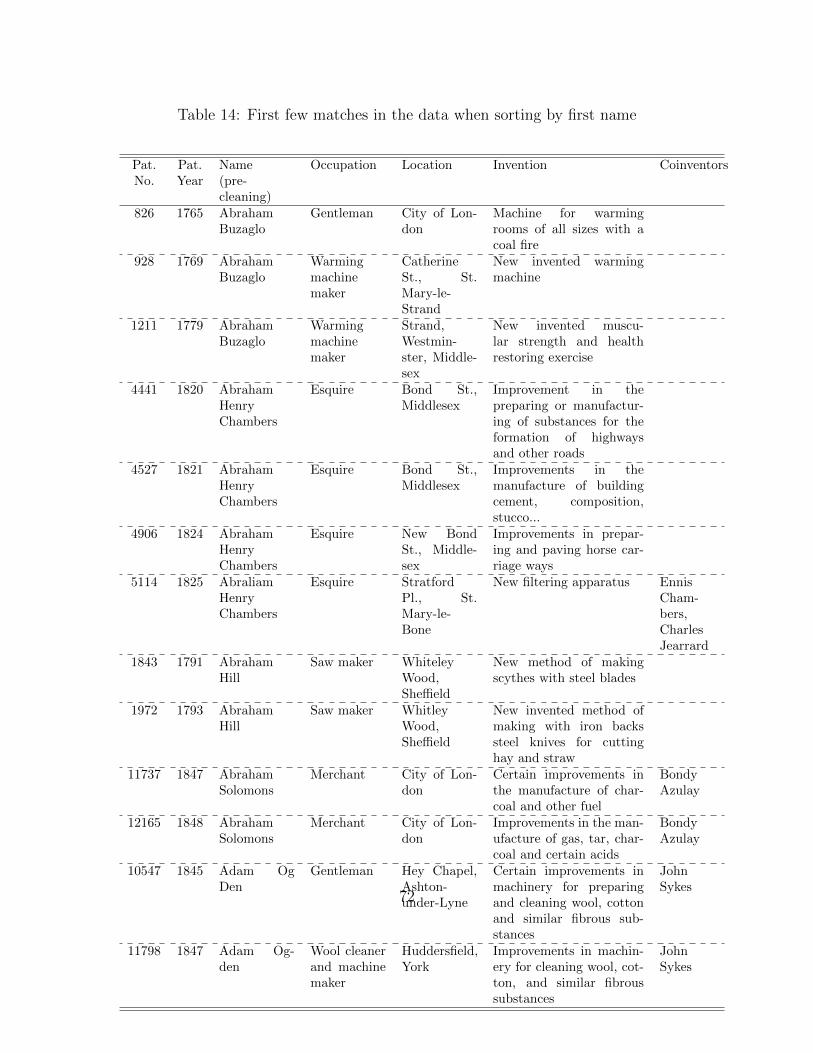
Table 14: First few matches in the data when sorting by first name
Pat. Pat. Name Occupation Location Invention CoinventorsNo. Year (pre-
cleaning)826 1765 Abraham
BuzagloGentleman City of Lon-
donMachine for warmingrooms of all sizes with acoal fire
928 1769 AbrahamBuzaglo
Warmingmachinemaker
CatherineSt., St.Mary-le-Strand
New invented warmingmachine
1211 1779 AbrahamBuzaglo
Warmingmachinemaker
Strand,Westmin-ster, Middle-sex
New invented muscu-lar strength and healthrestoring exercise
4441 1820 AbrahamHenryChambers
Esquire Bond St.,Middlesex
Improvement in thepreparing or manufactur-ing of substances for theformation of highwaysand other roads
4527 1821 AbrahamHenryChambers
Esquire Bond St.,Middlesex
Improvements in themanufacture of buildingcement, composition,stucco...
4906 1824 AbrahamHenryChambers
Esquire New BondSt., Middle-sex
Improvements in prepar-ing and paving horse car-riage ways
5114 1825 AbraliamHenryChambers
Esquire StratfordPl., St.Mary-le-Bone
New filtering apparatus EnnisCham-bers,CharlesJearrard
1843 1791 AbrahamHill
Saw maker WhiteleyWood,Sheffield
New method of makingscythes with steel blades
1972 1793 AbrahamHill
Saw maker WhitleyWood,Sheffield
New invented method ofmaking with iron backssteel knives for cuttinghay and straw
11737 1847 AbrahamSolomons
Merchant City of Lon-don
Certain improvements inthe manufacture of char-coal and other fuel
BondyAzulay
12165 1848 AbrahamSolomons
Merchant City of Lon-don
Improvements in the man-ufacture of gas, tar, char-coal and certain acids
BondyAzulay
10547 1845 Adam OgDen
Gentleman Hey Chapel,Ashton-under-Lyne
Certain improvements inmachinery for preparingand cleaning wool, cottonand similar fibrous sub-stances
JohnSykes
11798 1847 Adam Og-den
Wool cleanerand machinemaker
Huddersfield,York
Improvements in machin-ery for cleaning wool, cot-ton, and similar fibroussubstances
JohnSykes
72

coming from a different inventor. Thus, patent no. 12266 is matched to the Henry
Smith with individual ID 3806. The fourth entry, individual ID 3807, could potentially
be a match for the patent with individual ID 3805 because the name and location are
the same and the timing is proximate. However, Birmingham is a large city and there
is no similarity in the subject matter of the invention. Therefore, these two entries
are not matched. Finally, the Henry Smith with individual ID 3808 is matched to
two patents. Both are straightforward given the occupation and location. These are
more representative of the types of matches that are common in the database.
Table 15: Names matching for “Henry Smith”
The second example is for a subset of individuals named John Browne. Here,
the first two entries are an obvious match. The next two individuals are also a clear
match given the address and occupation. The fifth John Browne, from Brighton, also
appears to be unique. The remaining five patents are all matched to one individual,
no. 5485. There is some question about whether these should be matched given
that there is an address change and there does not appear to be a commonality in
the subject matter of the inventions. However, patent 12452 makes it clear that the
patent listing an address on New Bond Street belong to the same individual who later
lived on Great Portland St. The difficult patent is then 12326, which has a different
address but the same occupation as patent no. 12452. However, it is clear that
73

the individual moved during this period and a search of Google maps reveals that
Osnaburgh St. is in very close proximity to both New Bond St. and Great Portland
St. in London. Together, this information is enough to conclude that all five patents
likely came from the same individual.
Table 16: Names matching for “John Browne”
To summarize, it is hoped that these examples provide a useful illustration of the
linking procedure used in this paper. It should be clear that the combination of a
relatively small universe of observations, together with a rich set of data to match
on, lend themselves to a manual matching procedure, and that such a procedure can
generate matches where, in the substantial majority of cases, there is little doubt
about the accuracy of the resulting link.
74

D.3 List of top patent holders
Table 17 lists those patent holders with 10 or more patents during the 1700-1849
period, excluding communicated patents. This list includes a number of famous
engineers. Many of the names on this list appear in the ODNB (indicated in italics).
Table 17: Top patent filers during the 1700-1849 period
Inventor Pats. Inventor Pats.William Church 18 Robert William Sievier 11Samuel Hall 17 William Chapman 11Joseph Bramah 16 Christopher Nickels 11Marc Isambard Brunel 15 David Napier 11Joseph Clisild Daniell 15 Augustus Applegarth 11William Palmer 14 Thomas Hancock 11Robert Dickinson 14 John George Bodmer 11Elijah Galloway 13 Joseph Manton 10Edward Massey 13 Thomas Robinson Williams 10John Heathcoat 13 William Hale 10John Dickinson 13 Joseph Maudslay 10William Congreve 13 Richard Witty 10William Crofts 12 Samuel Brown 10Lemuel Wellman Wright 12 Edmund Cartwright 10Andrew Smith 12 William Losh 10Benjamin Cook 12 Anthony George Eckhardt 10
Top patent filers from 1700-1849, excluding communicated patents. Names initalics have been matched to the ODNB.
75

D.4 Details on occupation groups in the patent data
Table 18 presents the most common occupations within each of the broad occupa-
tion groupings used in my analysis. We can see that some groups, such as engineers,
esquires, merchants and gentlemen, have a few very common occupations. Others,
particularly those in manufacturing, often have a much larger number of unique oc-
cupations, each with fewer patents.
Table 18: Major occupations within each broad grouping
Counts are based on data from 1700-1849.
76

D.5 List of top patenting engineers by decade
Table 19 lists the top 5 individuals filing patents with an engineering occupation
(in the patent data) in each decade up to the 1840s (counting only patents where
they list their occupation as engineer). This provides a rough guide to prominent
engineers, though note that engineers may fail to make the list simply because their
patents were spread across different decades, and some of these individuals may have
filed additional patents in a decade under a different occupation which would not be
included here.
Table 19: Top engineer inventors by decade
Decade Name Pats. Decade Name Pats.1720s Thomas Benson 1 1800s Joseph Bramah 6
Isaac De La Chaumette 1 Archibald Thompson 4Samuel Miller 4
1730s John Kay 1 William Chapman 4Thomas Benson 1 Richard Trevithick 4
1740s Moses Hadley 1 1810s Samuel John Pauly 5John Wise 1 William Davis 5
Marc Isambard Brunel 41750s George John 1 Bryan Donkin 3
Joseph Bramah 31760s Robert Mackell 1
William Blakey 1 1820s Lemuel Wellman Wright 9Jonathan Greenall 1 Jacob Perkins 7Thomas Perrins 1 James Fraser 6Charles Nicholas Michel Babu 1 John Hague 6
James Neville 51770s John Budge 1
John Rastrick* 1 1830s John Ericsson 11Christopher Chrisel 1 Joseph Gibbs 10Matthew Wasbrough 1 Andrew Smith 9
John George Bodmer 71780s James Watt 5 Joseph Whitworth 7
Robert Cameron 4William Playfair 3 1840s Henry Bessemer 13John Besant 1 Joseph Maudslay 8Joseph Hateley 1 John George Bodmer 8
Elijah Galloway 81790s James Rumsey 3 John Coope Haddan 7
Joseph Bramah 3Joseph Hateley 2Thomas Mead 2William Whitmore 2
Patents indicate the number of patents that the inventor produced in a decade where there occupation waslisted as an engineer. Inventors in italics appear in the ODNB. *John Rastrick is not included in the ODNB,but his son of the same name was included for his work as an engineer and inventor.
77

D.6 Additional details on the BPO technology category data
Table 20 describes the number of patents and share patents in top technology cat-
egories by period. Before 1750, the largest category of inventions was “Water and
Fluids”, which includes pumps, water-wheels, etc. Weaving and Spinning were im-
portant in the early period and grew even more important over time. Three other
technologies associated with the Industrial Revolution, such as steam engines, metal,
and railways, also become much more important over time while technologies such as
Musical instruments and Coaches a road conveyances declines.
Table 20: Top ten technology categories by period
1700-17491700-1749 Technology category Patents Share
1 Water and Fluids 94 0.0512 Navigation I: Ship-Building, Rigging, and Working 79 0.0433 Weaving and Preparing for Weaving 71 0.0384 Spinning and Preparing for Spinning 68 0.0375 Weapons of Defence, Ammunition 68 0.0376 Coaches and Other Road Conveyances 64 0.0357 Motive-Power and Propulsion 57 0.0318 Musical Instruments 46 0.0259 Medical and Surgical Treatments 46 0.025
10 Steam-Engines and Boilers 45 0.024
1750-1799Technology category Patents Share
1 Water and Fluids 132 0.0502 Weaving and Preparing for Weaving 119 0.0453 Spinning and Preparing for Spinning 110 0.0424 Metals and Metallic Substances 106 0.0405 Medical and Surgical Treatments 99 0.0386 Coaches and Other Road Conveyances 91 0.0357 Navigation I: Ship-Building, Rigging, and Working 84 0.0328 Fireplaces, Stoves, Furnaces, Ovens, and Kilns 67 0.0259 Motive-Power and Propulsion 64 0.024
10 Steam-Engines and Boilers 62 0.024
1800-1849Technology category Patents Share
1 Steam-Engines and Boilers 751 0.0542 Motive-Power and Propulsion 722 0.0523 Spinning and Preparing for Spinning 711 0.0514 Weaving and Preparing for Weaving 694 0.0505 Railways and Railway Rolling-Stock 492 0.0356 Metals and Metallic Substances 472 0.0347 Navigation I: Ship-Building, Rigging, And Working 402 0.0298 Smoke Prevention: Consumption of Fuel 354 0.0259 Coaches and Other Road Conveyances 353 0.025
10 Printing 305 0.022
Excludes communicated patents.
78

E British patent analysis appendix
E.1 Additional comparisons to specific occupation groups
This appendix provides additional comparisons between engineers and a selection of
more detailed occupation groups that have been highlighted as making an impor-
tant contribution to innovation during the Industrial Revolution. In particular, I
compare engineers to watchmakers (including clockmakers), millwrights and wheel-
wrights, engine makers, instrument makers, and a general category encompassing
those described as machine makers, machinists or mechanics. I also considered com-
paring to coal viewers/mining engineers, but there too few patents by inventors listing
those occupations to allow any useful comparison.
The top panel of Figure 6 describes patents by each of these groups across the
study period. Note that, as in the main analysis, the engineers category includes civil
engineers. If an individual lists occupation as spanning both engineering and another
one of these groups, such as “Engineer and millwright”, I count the patent in both
groups to allow a fair comparison. It is clear from the top panel of this figure that only
among engineers to we see a take-off in patenting in the decades just after the onset
of the Industrial Revolution. In fact, the difference is so extreme that, when graphed
in levels, it is hard to see much action among the other occupation groups, with the
exception of the broader “Machine maker, machinist and mechanic” category, which
shows some increase after 1820. To deal with this, the bottom panel provides the
same figure but using a log scale on the y-axis. There we can see some more interest-
ing patterns. Patents by watchmakers, for example, increased substantially between
1730 and 1760, before leveling off. This suggest that watchmakers were making an
important contribution to innovation in the middle of the eighteenth century, a pat-
tern that is in line with other evidence on the importance of watchmakers at this time
(Kelly & O Grada, 2016).
79

Figure 6: Comparing engineers to a selection of detailed occupations
Excludes communicated patents.
80

E.2 Patents per inventor using alternative ways of identifying engineers
In the main analysis I identify engineers as those where engineering is the modal
occupation among the occupations listed in each inventor’s patents and those without
a unique modal occupation are excluded from the analysis. In Table 21, I look at
results for the number of patents per inventor when using other alternative definitions
of engineer. To ease comparison, Column 1 presents results following the approach
used in the main text. Note that this differs from the estimates shown in Table 4 only
because I am not estimating a separate coefficient for manufacturers. In Column 2, I
present results where I still identify engineers based on having engineering as a unique
modal occupation, but instead of dropping those without a unique modal occupation
I include them as non-engineers. In Column 3, I count as engineers anyone with at
least one patent listing engineering as their occupation. In Column 4, engineers are
those with at least one-third of their patents listing engineering as their occupation.
In Column 5, engineers are those with two-thirds of their patents listing engineering
as their occupation. This is a fairly restrictive definition which excludes a number
of people who clearly should be counted as engineers, including William Chapman
(inventor of the railroad bogie), William Symington (builder of the first practical
steamboat), and William Playfair.
All of these alternative results provide strong evidence that engineers were more
productive than other types of inventors. It is interesting to note that the size of the
coefficient on engineers actually increases as I apply less restrictive criteria for iden-
tifying engineers. This signals that in identifying engineers, type one errors (failing
to correctly identify engineers) are probably dominating type two errors (incorrectly
identifying those who are not engineers as engineers), so that when more restrictive
criteria are used, more productive individuals, who look like they should be classified
as engineers, are instead being grouped in the non-engineer category. In any case,
Column 1 shows that the use of modal industry while excluding those inventors with-
out a unique modal industry, as is done in the main text, represents a reasonable
middle-ground approach.
81

Table 21: Patents per inventor using alternative definitions of engineer
DV: Number of patents per inventor(1) (2) (3) (4) (5)
Approach Including Engineer is Engineers have Engineers havefrom those without anyone with ≥ one-third ≥ two-thirdsmain unique modal a patent listing patents listing patents listingtext occupations engineering engineering engineering
Engineer 0.606*** 0.546*** 0.884*** 0.722*** 0.488***(0.0906) (0.0901) (0.0938) (0.0867) (0.0888)
Tech. cat. FEs Yes Yes Yes Yes YesObservations 7,966 8,327 8,327 8,327 8,327R-squared 0.044 0.041 0.060 0.050 0.039
*** p<0.01, ** p<0.05, * p<0.1. OLS regressions with robust standard errors in parenthesis. The unit of
observation is an inventor. The outcome variable is the number of patents per inventor across all years. The
explanatory variable is an indicator for whether the inventor’s modal occupation is engineer. All columns
include controls for the modal technology category for each inventor within each period. In all of these, if
there is a tie for the modal category then one is selected randomly.
E.3 Results including other groups as engineers
In the results presented in the main text, the engineers category excludes those de-
scribed as engine builders as well as mining engineers (also called coal viewers).55 One
may worry that this is too restrictive a definition for engineers. In Table 22, I present
results generated following the procedure used in the main text, but including these
groups as engineers rather than in the machinery manufacturers or mining category.56
These results are effectively identical to those presented in the main text, which tells
us that the decision of whether or not to include engine builders and mining engi-
neers in the engineering category has no impact on my results. This should not be
surprising given that both of these groups are small relative to the large number of
inventors who identify as engineers.
55Engine builders also includes those described as, for example, engine makers or engine manu-facturers.
56Note that this changes the sample size slightly because it means that some inventors thatpreviously did not have a modal occupation, and were therefore not included in the analysis, nowhave a modal occupation.
82

Table 22: Patents per inventor including engine makers and mining engineers
DV: Number of patents per inventorAll All 1770- 1790- 1810- 1830-
years years 1789 1809 1829 1849(1) (2) (3) (4) (5) (6)
Engineer 0.677*** 0.629*** 0.805** 0.740*** 0.315** 0.474***(0.0844) (0.0876) (0.380) (0.220) (0.125) (0.0911)
Manufacturer 0.0596* 0.0113 -0.0720 -0.0184 -0.0470 0.00514(0.0326) (0.0372) (0.0627) (0.0602) (0.0590) (0.0535)
Tech. cat. FEs Yes Yes Yes Yes YesObservations 7,965 7,965 652 1,209 1,803 4,215R-squared 0.018 0.047 0.183 0.124 0.064 0.055*** p<0.01, ** p<0.05, * p<0.1. OLS regressions with robust standard errors in parenthesis. The
unit of observation is an inventor. The outcome variable is the number of patents per inventor
across all years (Column 1-2) or with 20-year periods (Columns 3-6). The explanatory variable is
an indicator for whether the inventor’s modal occupation is engineer. Inventors without a unique
modal occupation are not included. The regression in Column 2 controls for the modal technology
category for each inventor looking across all of that inventor’s patents by including a full set of
technology category fixed effects. In Columns 3-6, I control for the modal technology category for
each inventor within each period. In all of these, if there is a tie for the modal category then one is
selected randomly.
E.4 Additional results using patent renewal data
Table 23 present a more complete set of regression results using patent renewal data.
The results in Panel A are based on OLS regressions, while Panel B presents corre-
sponding results from Probit regressions. All of these results indicate that patents
by engineers were more likely to be renewed at both three and seven years, and the
results are both large in magnitude and strongly statistically significant. The mag-
nitude of the results generated using OLS and Probit regressions are very similar.
Manufacturer-inventors were also more likely to renew their patents, but much less
likely than engineers.
83

Table 23: Additional results using patent renewal data
Dep. var: Patent renewed at three years Patent renewed at seven years
A. OLS regressions(1) (2) (3) (4) (5) (6)
Engineer 0.0555*** 0.0557*** 0.0462*** 0.0244*** 0.0244*** 0.0200***(0.00619) (0.00619) (0.00899) (0.00429) (0.00429) (0.00637)
Manufacturer 0.0222*** 0.0221*** 0.0140* 0.0124*** 0.0121*** 0.00870*(0.00515) (0.00517) (0.00772) (0.00342) (0.00342) (0.00520)
Year FEs Yes Yes Yes YesTech. cat. FEs Yes YesObservations 30,579 30,579 54,736 27,436 27,436 41,214R-squared 0.003 0.003 0.020 0.001 0.002 0.015
B. Probit regressions (marginal effects)(7) (8) (9) (10) (11) (12)
Engineer 0.057*** 0.057*** 0.047*** 0.025*** 0.025*** 0.019***(0.0064) (0.0064) (0.009) (0.0046) (0.0046) (0.0062)
Manufacturer 0.023*** 0.023*** 0.015* 0.013*** 0.013*** 0.009*(0.0054) (0.0054) (0.0080) (0.0036) (0.0036) (0.0053)
Year FEs Yes Yes Yes YesTech. cat. FEs Yes YesObservations 30,579 30,579 54,736 27,436 27,436 41,214
*** p<0.01, ** p<0.05, * p<0.1. Robust standard errors in Columns 1-2, 4-5, 7-8 and 10-11. In Columns 3,
6, 9 and 12, standard errors are clustered by patent number to deal with the fact that patents may appear
multiple times if they are classified into multiple technology categories. The analysis in Column 1-3 and 7-9
cover patents originally filed from 1856-1869. The analysis in Columns 4-6 and 10-12 cover patents originally
filed from 1853-1866.
E.5 Additional patent quality index results
Tables 24-25 present additional results using the patent quality indices. Table 24
presents more complete results using the same approach taken in the main text.
In that approach, engineer and manufacturer patents are identified based on the
occupations listed in the entry for each patent. Table 25 presents results from an
alternative approach in which engineer and manufacturer patents are identified based
on the modal industry of each inventor.
84

Table 24: Additional results using patent quality indices
Dep. var: WRI Index BCI index(1) (2) (3) (4) (5) (6)
Engineer 0.0825*** 0.0689*** 0.0389 0.250*** 0.251*** 0.230***(0.0270) (0.0258) (0.0306) (0.0359) (0.0381) (0.0435)
Manufacturer -0.0596*** -0.0653*** -0.0510** -0.0598*** -0.0676*** -0.105***(0.0192) (0.0187) (0.0252) (0.0171) (0.0181) (0.0306)
Year FEs Yes Yes Yes YesTech. cat. FEs Yes YesObservations 12,622 12,616 18,473 12,622 12,616 18,473R-squared 0.002 0.105 0.134 0.010 0.036 0.058
*** p<0.01, ** p<0.05, * p<0.1. OLS regressions. Columns 1-2 and 4-5 present robust standard errors. In
Columns 3 and 6, standard errors are clustered by patent number to deal with the fact that patents may
appear multiple times if they are classified into multiple technology categories. The analysis in Column 1-3
covers patents originally filed from 1856-1869. The analysis in Columns 4-6 covers patents originally filed
from 1853-1866.
Table 25: Patent quality index results using inventors’ modal industry
Dep. var: WRI Index BCI index(1) (2) (3) (4) (5) (6)
Engineer 0.127*** 0.110*** 0.0822** 0.273*** 0.273*** 0.278***(0.0300) (0.0297) (0.0335) (0.0386) (0.0409) (0.0475)
Manufacturer -0.0488*** -0.0606*** -0.0470* -0.0860*** -0.0941*** -0.130***(0.0189) (0.0184) (0.0242) (0.0161) (0.0170) (0.0278)
Year FEs Yes Yes Yes YesTech. cat. FEs Yes YesObservations 12,622 12,616 18,473 12,622 12,616 18,473R-squared 0.003 0.106 0.135 0.013 0.039 0.062
*** p<0.01, ** p<0.05, * p<0.1. OLS regressions. Columns 1-2 and 4-5 present robust standard errors. In
Columns 3 and 6, standard errors are clustered by patent number to deal with the fact that patents may
appear multiple times if they are classified into multiple technology categories. The analysis in Column 1-3
covers patents originally filed from 1856-1869. The analysis in Columns 4-6 covers patents originally filed
from 1853-1866.
E.6 Additional results and discussion using the Great Exhibition data
The Great Exhibition of 1851 was the first major “World’s Fair.” As discussed in
Moser (2005) and Moser (2012), inclusion in the Great Exhibition can be used as an
indicator of the quality of an invention, since only the best inventions were chosen
85

by expert juries. The full listing of exhibits in the Great Exhibition of 1851 were
digitized by Moser, who generously shared them with me. Moser digitized data
includes an indicator for whether an exhibit was patented, based on information from
the description of each invention.
For each patented invention in Moser’s database, I attempt to match the exhibitor
(or in some cases a different inventor, if one is named in the exhibit description) to
those patent holders in my database from 1830-1849. This match was done manually
using the surname and first initial of each inventor, their address, as well as details
on the nature of the invention. In total, out of the 683 patented inventions with
inventors listing an address in England or Wales in Moser’s data, I am able to match
351 to individuals in my patent data, or just over 50%. There are a number of reasons
why I may fail to find match. For example, some exhibits were done by companies
rather than individuals, which makes it impossible to match to an individual inventor.
Also, for those with common names it is often impossible to make a match given that
only first initials are provided in the exhibition data, and in some cases (e.g. “Jones
and Sons”) even first initials are not available. In total, 14.4% of the inventors that
patented from 1830-1849 were engineers, but they make up 21% of those who matched
to exhibits.
Table 26 presents some additional results using the Great Exhibition data. The
first two columns present OLS regressions while the second two columns show marginal
effects from Probit regressions. In Columns 1 and 3, the sample includes all inventors
who filed a patent from 1830-1849 and the outcome variable is whether they match to
an exhibition. We can see that both the OLS and Probit results tell a similar story.
Engineers were more likely to match to patented exhibits in the Great Exhibition
than other types of inventors and, while manufacturer-inventors were also more likely
to exhibit, they were less likely to do so than engineers (the difference between the en-
gineer and manufacturer coefficients is statistically significant at the 95% confidence
level in both specifications).
The results in Column 2 and 4 look at whether, conditional on exhibiting, an
inventor was more likely to win an award. These results indicate that, conditional
on being an exhibitor, both engineers and manufacturer-inventors were more likely
to with awards than other types of inventors, but the two groups are statistically
86

Table 26: Additional results using Great Exhibition data
OLS regressions Probit marginal effectsExhibited Awarded Exhibited Awarded
(1) (2) (3) (4)Engineer 0.0441*** 0.138* 0.0468*** 0.137*
(0.0131) (0.0742) (0.0144) (0.0723)Manufacturer 0.0159* 0.157** 0.017* 0.0157***
(0.00835) (0.0614) (0.0090) (0.0609)Observations 4,469 329 4,469 329R-squared 0.003 0.022
*** p<0.01, ** p<0.05, * p<0.1. Robust standard errors in parenthesis. In the “Exhibited” columns, the
sample is the set of all inventors who patented from 1830-1849 and the outcome variable is an indicator
for whether an inventor matches to a patented exhibit. In the “Awarded” column, the sample is the set of
patent holders who match to a patented exhibit in the exhibition database and the outcome variable is an
indicator for whether the exhibit received an award. In both types of regressions, the explanatory variables
are based on the modal occupation of each inventor. Inventors without unique modal occupations are not
included in the analysis.
indistinguishable from each other in their likelihood of winning an award.
87

E.7 Additional results measuring patent quality using the ODNB
This section provides some additional discussion of results using appearance in the
ODNB to assess patent quality (Table 5 Column 6). Note first that this analysis is
not based on the main ODNB dataset, which identifies engineers based on the occu-
pations listed in the ODNB. Instead, this analysis is based on a dataset constructed
by (i) starting with all patent holders who filed two or more patents, (ii) searching
and manually matching these patent holders to the ODNB database, and (iii) looking
at how the probability that individuals in the patent data were found in the ODNB
data varies based on their occupation classification, where the occupation classifica-
tions come from the patent data. Constructing the dataset in this way allows a fair
comparison between the occupations appearing in the patent data.
There are roughly two thousand individuals with two or more patents in the 1700-
1849 period. Given the effort involved in manually matching each name to the ODNB,
it is necessary to limit to this set of more productive inventors, rather than searching
for every individual that filed a patent. I manually search for each of these individuals
in the ODNB, verifying a match by comparing information in the ODNB to the details
such as patent number, subject, and year, inventor address and occupation, and co-
inventors in the patent data. In many cases the ODNB lists the actual patent number
of patents filed by famous inventors. This procedure yields 245 matches, a match rate
of 11.9% (this rate rises to 18.7% for inventors with three or more patents and 23.8%
for those with four or more). Given that this is a careful manual match relying on
multiple sources of information for verification, it is unlikely that there are many false
matches in the matched set. It is possible that some matches are missing due to, for
example, misspellings and other sources of name variation, but these are unlikely to
by systematic across different occupation groups.
Of the patent holders matched to the ODNB data, the three most common broad
occupation groups (based on occupations in the patent data) are engineers, manufac-
turers, and gentleman/esquires. Table 27 describes the number of inventors in each of
these three main groups with two or more patents (first column) which were searched
for in the ODNB database, the number actually found in the ODNB databases (sec-
ond column), and a breakdown of those found in the ODNB database that were born
88

up to 1780 (third column) or after 1780 (fourth column).57 The most important pat-
tern to note here is that engineers made up 15.5% of the inventors searched for in the
ODNB database but 26.9% of those found in ODNB, and 34.2% of those born after
1780. This suggests that, even conditional on having produced at least two patents,
engineers were more likely to have become noteworthy individuals than other types
of patentees. Since inventors were likely to become noteworthy through the success of
their inventions, this indicates that engineers were more likely to produce noteworthy
inventions than other types of inventors.
A notable feature of the data in Table 27 is that engineers made up over one
third of those inventors with at least two patents born after 1780 that achieved a
substantial level of prominence in their lives, a greater share than any other group,
even when all manufacturing inventors are grouped together. This provides another
indication of the substantial contribution made by engineer inventors to technological
progress.
In fact, these figures likely understate the relative success of engineers, since other
types of inventors were more likely to find their way into the ODNB for reasons other
than the success of their inventions; the gentry category, for example, includes several
Earls, who were naturally more likely to be included in ODNB, while manufacturers
could make it in for building up large and successful firms. We can see this reflected
in the data. I have also digitized the text of the matched ODNB biographies and
undertaken a text analysis. This shows that “patent” appears in 81 percent of the
matched biographies for engineers but only 68 percent of matched biographies for non-
engineers. Similarly, “invent” appears in 70 percent of the biographies for engineers
but only 53 percent for non-engineers.
Table 28 presents regression results where the data set are those inventors with 2+
patents who were searched for in the ODNB and the outcome variable is an indicator
for whether the inventor was found in ODNB. Since this outcome is an indicator
variable, I run both OLS and Probit regressions. As explanatory variables, I focus
on whether the modal occupation associated with each name was engineering. In
Columns 2, 4, and 6 I control for the actual number of patents associated with each
57In a small number of cases the year of baptism is used in place of the year of birth because theyear of birth is not reported in the ODNB.
89

Table 27: Appearances in the ODNB data by broad occupation group
Inventors Inventors Inventors Inventorswith ≥2 in ODNB in ODNB in ODNBpatents database born by 1780 born after 1780
Engineers 220 56 17 3915.5% 26.9% 18.1% 34.2%
Manufacturers 584 54 20 3441.1% 26.0% 21.3% 29.8%
Gentlemen & Esquires 300 46 26 2021.1% 22.1% 27.7% 17.5%
Includes only inventors with a unique modal occupation. The percentages in the first column
reflect each occupation group’s share of total inventors searched for in the ODNB (those
with ≥ 2 patents). The percentages in the second column are the shares of inventors from
each occupation group found in the ODNB relative to all inventors found in the ODNB. The
shares in the last two columns are the shares of inventors from each occupation group found
in the ODNB born before or after 1780, relative to all inventors found in the ODNB born
before or after 1780.
name.
The results in Table 28 indicate that engineers were more likely to end up in the
ODNB and this is true even conditional on the number of patents filed. In terms of
magnitudes, focusing on the results from the linear probability models in Columns
1-2 we can see that the chances an individual is in the ODNB increases by just over 6
percentage points if they are an engineer, or over 9 percentage points if I do not control
for the number of patents that they produced. These are large differences relative
to the sample mean of 12.8%.58 This much greater probability suggests that the
technologies that engineers were producing were more impactful than those produced
by other types of inventors, even after controlling for the fact that they were, on
average, producing more inventions than other types of patentees. As expected, filing
more patents is also strongly associated with the chances that an individual ends up
in the ODNB. Inventors with manufacturing occupations, in contrast, were less likely
on average to end up in the ODNB (gentlemen, esquires, and other types of inventors
fell in between).
I have also digitized the text of the ODNB biographies for all of those inventors
58This sample mean differs from the 11.9% of inventors with 2+ patents found in the ODNBbecause it includes only inventors with a unique modal occupation.
90

Table 28: Regression results using ODNB data
DV: Indicator for being in the ODNB
OLS regressions Probit(marginal effect)
(1) (2) (3) (4) (5) (6)
Engineers 0.0948*** 0.0575** 0.0808*** 0.0393 0.075*** 0.0351(0.0254) (0.0244) (0.0262) (0.0253) (0.0252) (0.0226)
Manufact. -0.0374** -0.0472*** -0.0397** -0.0457***(0.0149) (0.0146) (0.0155) (0.0149)
No. of patents 0.0325*** 0.0330*** 0.0215***(0.00467) (0.00470) (0.0029)
Observations 1,987 1,987 1,987 1,987 1,987 1,987R-squared 0.010 0.069 0.013 0.073
*** p<0.01, ** p<0.05, * p<0.1. Robust standard errors in parentheses. Engineers and
manufacturers are identified based on unique modal occupation. Inventors without a unique
modal occupation are not included.
in the matched patent-ODNB data. One thing that we can look at in the ODNB
biographies is the length allocated to each inventor. This provides an additional way
to quantify the prominence of the various inventors, since more important individuals
are granted more extensive biographies. The length of the ODNB biographies in my
matched data set range from 188 words (Joseph Clinton Robertson) to 9,968 (James
Watt), with a mean length of 1,208 words. There is a clear correlation with the
importance of each inventor. The top five engineers, by word count, are Watt, George
Stephenson (4,897), Richard Trevithick (3,126), Charles William Siemens (2,934),
and Henry Bessemer (2,924).59 While one could naturally argue about whether any
particular inventor receives the space (and appreciation) that they deserve, in broad
strokes this statistic seems informative.
Table 29 presents the average word count per inventor by occupation group. We
can see that engineers typically have longer articles than others, with the exception
of Gentlemen and Esquires. This suggests that, even conditional on being included in
the ODNB, engineers may have been more successful than other types of inventors.
59After Watt, the next longest articles are on Thomas Cochrane, Earl of Dundonald, the Navalhero, followed by Henry Seymour Conway, a cousin of Waldpole who rose to be Commander in Chiefand played an important role in the American Revolution.
91

Table 29: Words per article by inventor type
Occupation Avg. words Occupation Avg. wordsAgric., food/drink makers 699 Manufacturing 954Construction/millwrights 992 Merchant 1,162Engineering 1,323 Other occ. 752Esquire 1,112 Prof. services 997Gentry 1,378 Unknown 1,563
E.8 Analyzing the make-up of coinventor teams
In this appendix I examine the composition of teams of coinventors and how these
differ for inventors within broad occupation groups. These patterns can be viewed in
Table 30, where I separate engineers, those with manufacturing occupations, gentle-
men and esquires, and all others. The way to read this table is as follows. Each cell
reflects the share of multi-inventor patents including one or more inventors from the
row occupation and the column occupation, divided by the total number of multi-
inventor patents filed by inventors in the row occupation. Thus, the values sum to
(close to) one looking across the row, with the discrepancy due to the fact that some
multi-inventor patents have more than two inventors.
Looking across the top row, the first cell reflects the share of multi-inventor patents
by engineers that include one or more other engineers as coinventors. The second cell
of the first row reflects the share of multi-inventor patents by engineers that include
one or more manufacturers as coinventors, relative to the total number of multi-
inventor patents by engineers, and so on.
There are a couple of intriguing patterns to notice in this table. First, those
with manufacturing occupations were much more likely to coauthor with other man-
ufacturers than engineers were to coauthor with other engineers. In part, this may
reflect that there were, overall, more other manufacturers to coauthor with, but it also
hints at the possibility that because manufacturers were more focused on technolo-
gies related to their specific industries, they were more likely to coauthor with others
working in that industry. In contrast, looking across the top row shows that engineers
are often found to be working with inventors from other groups. This may reflect, for
92

example, partnerships between inventors and manufacturers or with gentlemen who
could contribute financing or political connections to a project. This pattern is even
more pronounced for Gentlemen and Esquires, a group that regularly patents with
every other group.
Table 30: Make-up of coinventor teams by inventor type
Coauthoring with:Engineers Manufact. Gentl/Esq. Others
Patents by: Engineer 0.419 0.215 0.215 0.234Manufacturer 0.081 0.596 0.137 0.247Gentry/Esq. 0.196 0.330 0.265 0.271Other 0.133 0.372 0.170 0.546
See text for details of the construction of these figures.
93

E.9 Additional within-inventor regression results
Table 31 presents some additional within-inventor regression results. Specifically,
these regressions include quadratic controls on time since first patent. In all cases,
the estimated effect of becoming an engineer is even stronger than that reported in
the main text.
Table 31: Within-inventor regressions robustness
DV: Share of patents DV: Patents per yearwith multiple inventors
(1) (2) (3) (4) (5) (6)
Engineer 0.0585** 0.0581** 0.0896*** 0.278*** 0.294*** 0.0919**(0.0237) (0.0236) (0.0305) (0.0339) (0.0380) (0.0373)
Years since 0.000639 0.00116 0.00109 -0.00847*** -0.0304*** -0.0302***first patent (0.00128) (0.00170) (0.00170) (0.00196) (0.00339) (0.00351)
Years since -5.30e-05 -8.62e-05 -7.87e-05 0.000194*** 0.00136*** 0.00139***first, squared (4.24e-05) (9.15e-05) (9.08e-05) (7.14e-05) (0.000202) (0.000211)
Years since 3.98e-07 4.03e-07 -1.26e-05*** -1.29e-05***first, cubed (1.21e-06) (1.17e-06) (2.31e-06) (2.41e-06)
Individual FE Yes Yes Yes Yes Yes YesDropping first Yes Yesyear as Eng.Observations 5,333 5,333 5,152 18,787 18,787 18,641R-squared 0.548 0.548 0.552 0.238 0.248 0.247
*** p<0.01, ** p<0.05, * p<0.1. Standard errors are clustered by individual. The Engineer variable is an
indicator for each individual that takes a value of one starting from the first year in which an individual
listed their occupation as engineer in a patent, and zero otherwise.
94

E.10 Distribution of engineer patents across tech. categories
Table 32 lists the technology categories where engineers made up the larges fraction
of patentees. Table 33 lists the technology categories that accounted for at least 2%
of all patents by engineers in the 1700-1849 period. Both of these show that engineers
played an important role in key Industrial Revolution technologies, including machine
tools, steam engines, railroads, etc. However, we can also see that engineers were fairly
diverse in the types of technologies in which they patented. Clearly, they were not a
group that was working in just one or a small number of technology types.
Table 32: Technology categories with a high share of patents from Engineers
Technology category Share by EngineersBoring, Drilling, Punching 0.622Steam; Steam-Engines and Boilers. 0.517Boilers and Pans 0.484Railways and Railway Rolling-Stock 0.419Gas Manufacture and Consumption 0.400Bridges, Arches, Viaducts, Aqueducts 0.356Air and Wind: Air and Gas Engines and Windmills 0.351Turning 0.333Tunnels, Excavations, And Embankments 0.286Smoke Prevention. -Consumption Of Fuel 0.284Measuring And Numbering 0.283Motive Power and Propulsion 0.282Casks And Barrels 0.280
This table lists the share of patents within a technology category with “engineer” listed as
the occupation, excluding communicated patents. Data cover 1700-1849.
95

Table 33: Top technology categories for patents by Engineers
Technology category Patents Share ofengineer patents
Steam-Engines And Boilers 444 0.148Motive-Power And Propulsion 238 0.080Railways And Railway Rolling-Stock 207 0.069Smoke Prevention -Consumption Of Fuel 125 0.042Water And Fluids 112 0.037Boilers And Pans 93 0.031Metals And Metallic Substances 90 0.030Gas Manufacture And Consumption 86 0.029Spinning And Preparing For Spinning 86 0.029Fireplaces, Stoves, Furnaces, Ovens, And Kilns 85 0.028Heat, Heating, Evaporating, And Concentrating 73 0.024Coaches And Other Road Conveyances 66 0.022Ship-Building, Rigging, And Working 65 0.022
All others 1221 0.408This table lists the share of patents with “engineer” listed as the occupation represented by
each technology category, for those categories that accounted for at least 2% of patents by
engineers, excluding communicated patents. Data cover 1700-1849.
E.11 Number of technology categories per inventor regressions
Table 34 presents regression results looking at the how the number of technology
categories patented in varies with inventor type. The results in the first column, which
use data from the full sample period, show that engineer inventors patent in more
technology categories than other types of inventors, while manufacturer-inventors
patent in fewer categories. These results are not driven by the fact that engineers are
concentrated toward the latter part of the sample. Columns 2-5 show that similar
patterns are also observed in every two-decade sub-period from 1770-1849.
96

Table 34: Number of technology categories per inventor regressions
DV: Number of technology categories per inventor
All 1770- 1790- 1810- 1830-years 1789 1809 1829 1849
(1) (2) (3) (4) (5)
Engineer 0.824*** 2.437*** 0.855*** 0.534*** 0.705***(0.0916) (0.904) (0.302) (0.153) (0.109)
Manufacturer -0.125*** -0.0302 -0.100 -0.165*** -0.130**(0.0322) (0.0805) (0.0658) (0.0614) (0.0518)
Observations 7,917 648 1,204 1,789 4,195R-squared 0.031 0.089 0.030 0.022 0.025
*** p<0.01, ** p<0.05, * p<0.1. Robust standard errors in parenthesis. The unit of
observation is an inventor. The outcome variable is the number of different technology
categories that the inventor patented in across all years (Column 1) or within 20-year
periods (Columns 2-5). The explanatory variable is an indicator for whether the in-
ventor’s modal occupation is engineer. Inventors without a unique modal occupation
are not included. Data cover 1700-1849.
E.12 Alternative Billington-Hanna technology category data
This section looks at whether the results using the technology category data are
robust to using an alternative set of technology categorizations. As an alternative
to the BPO categorizations, I use a machine-learning based classification generated
by Billington & Hanna (2018) using the text of patent titles to allocate patents into
20 categories. In the analysis below, I use their “TopicOne” categorization, though
similar results are also obtained from their “TopicTwo” categorization.
Table 35 presents a breakdown showing the average number of Billington-Hanna
technology categories that individual inventors in each occupation group patented in.
We can see from this table that in general inventors were substantially less likely to be
active in multiple Billington-Hanna technology categories, a natural consequence of
the fact that there are far fewer categories than in the British Patent Office classifica-
tion. However, we also see that engineers are, on average, active in more technology
categories than any other group. The regression results in Table 36 confirm that
this difference is statistically significant across the full sample period as well as every
twenty-year sub-period from 1770.
97

Table 35: Average Billington-Hanna technology categories per inventor, by occupa-tion type
Occupation Avg. number of Occupation Avg. number ofgroup tech. categories group tech. categories
per inventor per inventorAgric., food/drink makers 1.144 Merchant 1.153Chemical manuf. 1.288 Metals and mining 1.228Construction 1.127 Misc. manuf. 1.183Engineering 1.570 Other occ. 1.144Esquire 1.376 Prof. services 1.196Gentry 1.304 Textiles 1.134Machinery and tool manuf. 1.207 Unknown 1.079
Based on the modal occupation group of each inventor. Inventors without a unique modal
occupation group are not included. Excludes patents that are communications.
Table 36: Number of Billington-Hanna technology categories per inventor regressions
DV: Number of technology categories per inventor
All 1770- 1790- 1810- 1830-years 1789 1809 1829 1849
(1) (2) (3) (4) (5)
Engineer 0.363*** 0.559* 0.470*** 0.236*** 0.334***(0.0447) (0.317) (0.144) (0.0864) (0.0547)
Manuf. -0.0121 -0.00736 -0.00685 -0.0499 0.0104(0.0152) (0.0346) (0.0347) (0.0380) (0.0236)
Observations 7,964 652 1,210 1,803 4,213R-squared 0.023 0.028 0.030 0.010 0.020*** p<0.01, ** p<0.05, * p<0.1. Robust standard errors in parenthesis. The unit of obser-
vation is an inventor. The outcome variable is the number of different technology categories
that the inventor patented in across all years (Column 1) or within 20-year periods (Columns
2-5). The explanatory variable is an indicator for whether the inventor’s modal occupation
is engineer. Inventors without a unique modal occupation are not included.
E.13 Analyzing inventors’ background
In this appendix, I consider the background of patent holders that can be matched to
the ODNB. To construct this data set, I began with all individuals responsible for at
least two patents in my main study period (1700-1849) and attempted to manually
match each to the ODNB. Out of the 2,052 inventors with two or more patents
98
searched for, I find 245 matches, a match rate of 11.9%. This approach allows a fair
comparison between the backgrounds of inventors in different occupations groups,
where occupation is identified based on the patent data definition.
I focus on the type of education each inventor had based on a manual review
of the biographical information in the ODNB. This can shed light on the extent to
which engineers differed from other types of inventors in terms of their educational
background, though of course it is important to remember that this is a selected
sample of only the most successful inventors.
Table 37 describes the share of inventors in the matched ODNB data with each
type of educational background broken down by occupational group (based on the
modal occupation listed for each inventor). The categories I focus on are univer-
sity education, apprenticeship, a purely working background (beyond basic primary
schooling), private pupillage, learning through working in a family business, and
whether the individual attended a grammar or boarding school (as opposed to a vil-
lage or smaller private school). Note that these shares do not need to add up to
one since for some the background is unknown and for others they may have taken
advantage of more than one option (e.g., an apprenticeship and then university).
As a starting point, it is notable that the overall patterns shown in Table 37 bear a
great deal of similarity to patterns reported in previous studies based on biographical
sources. For example, Meisenzahl & Mokyr (2012) find a university attendance rate
of 15%, while Howes (2017) finds a rate of 18%. The top row of Table 37 shows
that the rate among my matched patent-ODNB data is 17.3%. For apprenticeships,
Meisenzahl & Mokyr (2012) report a rate of 40% while 31% of the inventors in the
expanded databases used by Howes (2017) were apprenticed. The rate in my data is
very similar to Howes’, at 27%. Howes (2017) also finds that 8% of his inventors were
private pupils, which is similar to the 9.6% in my data. These similarities provide
an indicator that the overall patterns identified in the set of patentees I focus on
are similar to those found among the prominent inventor samples used in previous
studies.
In the first column of Table 37, we see that engineers were, if anything, less likely to
have attended university than other types of inventors except manufacturers. Gentle-
men and the “other” category (which included a number of doctors) were more likely
99

to have attended university. However, for those engineers that did spend time at uni-
versity, it was almost always at a Scottish university, particularly Edinburgh, whereas
most of the university attendees in other groups attended Oxford or Cambridge.
The most common educational background for engineers was an apprenticeship. In
this they were similar to inventors who listed a manufacturing occupation. Engineers
were also substantially more likely to have a purely working background, which almost
always meant that they were mainly self-taught in their spare time. The remaining
columns show that engineers were just slightly more likely to have been a private pupil,
and they were much less likely to have learned through working in a family business
than manufacturers. Finally, engineers were less likely to have attended a grammar,
boarding, or higher-end private school than other types of inventors, though their
rate was similar to manufacturers. This is perhaps not surprising given that these
schools often favored teaching Latin and Greek over more practical mechanical skills.
Table 37: Educational background of different types of inventors from ODNB data
University Apprenticed Working Private Family Grammar/pupillage business boarding sch.
All 0.173 0.274 0.096 0.096 0.183 0.212
Engineers 0.107 0.375 0.143 0.125 0.179 0.125Gentl/Esq. 0.196 0.196 0.065 0.109 0.109 0.326Manufact. 0.111 0.333 0.074 0.056 0.315 0.111Others 0.288 0.173 0.096 0.096 0.115 0.308
Inventors are classified based on their modal occupation. Inventors without aunique modal occupation are not included.
A natural question about the patterns shown in Table 37 is whether the differences
across occupations are due to differences in the period in which most of the inventors
in a particular group were born. To examine this, Table 38 breaks down the education
results based on the date of birth of each individual (which is reported in the ODNB
for almost all of the matched inventors). Perhaps surprisingly, this reveals that the
overall share of inventors coming from each type of background was fairly stable over
time. However, among engineers, we see a much high share of inventors with a working
background among those born before 1750, while the importance of apprenticeships
rises over time from 25% for those born before 1750 to 48% for those born after 1800.
100

In contrast, among manufacturers, the share apprenticed was declining over time,
replaced mainly by a rising share trained in within the family business or as private
pupils. University education rose among engineers, from zero before 1750 to 19% for
those born after 1800, and a similar increase is observed among manufacturers.
Table 38: Educational background of different types of inventors from ODNB data
Born before 1750No Univ. Appr. Working Private Family Grammar/
inventors pupillage business boarding sch.All 34 0.235 0.235 0.147 0.059 0.206 0.265
Engineers 4 0.000 0.250 0.500 0.000 0.250 0.250Gentl/Esq. 8 0.250 0.125 0.250 0.125 0.125 0.375Manufact. 6 0.000 0.667 0.000 0.000 0.333 0.333Others 16 0.375 0.125 0.063 0.063 0.188 0.188
Born from 1750-1800No Univ. Appr. Working Private Family Grammar/
inventors pupillage business boarding sch.All 117 0.128 0.282 0.085 0.085 0.171 0.214
Engineers 31 0.065 0.323 0.129 0.065 0.194 0.097Gentl/Esq. 24 0.167 0.208 0.000 0.167 0.125 0.375Manufact. 32 0.094 0.344 0.094 0.031 0.250 0.094Others 30 0.200 0.233 0.100 0.100 0.100 0.333
Born 1800 or laterNo Univ. Appr. Working Private Family Grammar/
inventors pupillage business boarding sch.All 57 0.228 0.281 0.088 0.140 0.193 0.175
Engineers 21 0.190 0.476 0.095 0.238 0.143 0.143Gentl/Esq. 14 0.214 0.214 0.071 0.000 0.071 0.214Manufact. 16 0.188 0.188 0.063 0.125 0.438 0.063Others 6 0.500 0.000 0.167 0.167 0.000 0.500
Inventors are classified based on their modal occupation. Inventors without aunique modal occupation are not included.
101

F French patent analysis appendix
This section presents some additional descriptive statistics and results obtained from
the French patent data. As a starting point, Figure 7 plots the number of patents
in France across the study period, 1791-1843. We can see that relatively few patents
were filed from the initiation of the system until the end of the Napoleonic Wars.
After 1820, the number of patents per year increased substantially.
Figure 7: Patents in France during the study period
0
200
400
600
800
1000
Pate
nts
per y
ear
1790 1800 1810 1820 1830 1840
Year
Figure 8 plots the share of French patents by different occupation groups. Two
patterns are notable here. First, the overall distribution of patents changes very little
across the study period, with the exception of a mild decline in patents by “other”
occupations, those that are essentially unclassifiable. We see no evidence of the
rise of engineering as an important part of the innovation system, nor do any other
occupation groups show substantial increases. Second, main group of inventors by far
across the period are manufacturer-inventors, particularly those in the miscellaneous
manufacturing category, which includes a diverse set of manufacturer-inventors: glass
makers, makers of shoes and hats, etc.
102

Figure 8: Share of French patents by occupation groups
Table 39 presents averages of patents per inventor, the length of patent term
per inventor, and the number of technology categories per inventor, for different
occupation groups. These results reveal that engineers filed more patents than any
other occupation group, they filed patents with longer terms on average than any
other occupation group, and they patented in more technology categories than any
other occupation group.
103

Table 39: Average characteristics by occupation group in France
Occupation Avg. patents Avg. length of Avg. numer ofgroup per person patent term (years) tech. categoriesAg/Food/Drink 1.17 7.65 1.10Chemical 1.33 8.52 1.23Construction 1.15 7.27 1.10Engineer 2.29 9.72 1.91Machinery, tools 1.31 6.85 1.11Mechanic 1.42 7.66 1.27Merchant 1.18 8.57 1.11Metals/Mining 1.21 8.05 1.13Military 1.32 8.72 1.18Misc. manufacture 1.26 7.14 1.12Other 1.22 8.45 1.13Professional 1.25 8.61 1.16Public/Education 1.44 8.35 1.28Textiles 1.25 7.49 1.07Unknown 1.41 8.98 1.29
G Civil engineering appendix
This appendix provides some additional detail supporting the analysis of civil engi-
neering in Section 6. Figure 9 describes the number of major infrastructure projects
on Skempton’s list in each decade as well as the estimated cost (in current dollars)
of those works. We can see from this graph that, while there was some growth in the
number of projects in the first half of the 18th century, the major increase started
between 1750 and 1770. While it is difficult to determine the direction of causality, it
seems likely that the increase in the demand for civil engineering work described in
Figure 9 provided an increase in market size that was sufficient to allow individuals
to begin specializing as civil engineers.
Table 40 provides a breakdown of the main types of infrastructure projects that
took place in each period. From 1500-1700, the most important types of projects, in
terms of numbers or cost, related to harbors and drainage works. The large expendi-
tures on drainage in the first half of the 17th century reflects the Great Level drainage
project of the Fen marshlands. River navigation improvements were also important
during this period, as were occasional bridge and water supply construction projects.
104

Figure 9: Number and cost of major civil engineering works, 1500-1830
Source: Skempton et al. (2002) Appendix II.
From 1750-1799, however, the pattern changed due to the enormous canal building
boom that took place. Canal building continued after 1800, but at a slower pace,
while we can begin to see the start of the railway boom that gathered steam after
1830.
Figure 10 describes the share of major British civil engineering projects that were
the first major project undertaken by the chief engineer (open diamond symbols).
From 1600-1760, roughly 75% of major engineering projects were overseen by someone
who had not previously overseen another major project. The only major exception
to this is in 1640-1659, when the Dutchman, Cornelius Vermeyden, oversaw several
important drainage works. It is notable that this pattern persists into the 18th
century despite the substantial increase in the number of projects available after
1690. After 1760, however, the pattern changes. From that point until 1830, roughly
35% of all major projects were overseen by a chief engineer who had not already
overseen a major project. The second series in Figure 10 (filled circles) shows the
number of first time project by individuals who had not previously trained under
a more experienced engineer.60 After 1760, we can see that very few projects were
60This data set is generated through a laborious manual review of the biographies of every engineerthat oversaw a major project in the data. I begin the graph in 1680 because before that point I amnot confidant that the available biographical information is detailed enough to identify the training
105

Table 40: Share of major civil engineering projects, by type and period
Share of projectsPeriod Canals River Drainage Harbors Railways Water Bridges Other
Nav. supply1500-1549 0.00 0.20 0.00 0.60 0.00 0.00 0.20 0.001550-1599 0.20 0.00 0.20 0.40 0.00 0.20 0.00 0.001600-1649 0.00 0.25 0.50 0.00 0.00 0.08 0.17 0.001650-1699 0.13 0.17 0.17 0.26 0.00 0.22 0.00 0.001700-1749 0.08 0.17 0.11 0.28 0.03 0.06 0.11 0.081750-1799 0.41 0.12 0.09 0.12 0.03 0.00 0.18 0.041800-1830 0.17 0.04 0.04 0.29 0.10 0.00 0.25 0.04
Share by cost (where cost estimates are available)Period Canals River Drainage Harbors Railways Water Bridges Other
Nav. supply1500-1549 0.00 0.02 0.00 0.82 0.00 0.00 0.16 0.001550-1599 0.11 0.00 0.18 0.70 0.00 0.01 0.00 0.001600-1649 0.00 0.15 0.73 0.00 0.00 0.06 0.06 0.001650-1699 0.09 0.07 0.36 0.48 0.00 0.00 0.00 0.001700-1749 0.14 0.17 0.04 0.26 0.01 0.00 0.31 0.021750-1799 0.84 0.04 0.03 0.05 0.03 0.00 0.04 0.001800-1830 0.24 0.03 0.03 0.43 0.06 0.00 0.11 0.04
Source: Skempton et al. (2002) Appendix II.
106

overseen by engineers who did not either have prior experience or training under a
more experienced engineer. Thus, the engineers chosen to oversee major projects were
becoming a more experienced group.
Figure 10: Changes in the structure of the civil engineering profession
Source: Author’s calculations using data from Skempton et al. (2002) Appendix II. Engineers are identified
as having trained under a more experienced engineer if they had either worked for an engineer who had
previously overseen one of the major projects on Skempton’s list or were partnered with such an engineer
on their first major project.
Table 41 lists the top three individuals in each period and the number of projects
they oversaw for each half-century from 1500. Below the top three, I also provide
the mean number of major projects across all individuals in each period as well as
the ratio of the number of projects done by the top individual and the top three
individuals to the mean. These statistics provide a sense of the extent to which the
distribution of projects across individuals was becoming skewed.
for most engineers.
107

Table 41: Leading civil engineers by period and their share of projects
Source: Author’s calculations using data from Skempton et al. (2002) Appendix II.
H Government and the engineering profession
The government never played the central role in the British engineering profession
that it in other countries, most notably France. There, (military) engineers were
108

deeply embedded in the state, which also oversaw the leading engineering schools,
and as a result the engineers that they produced directed their attention first and
foremost at solving the problems of importance to the military or the state.61
Addis (2007) contrasts the role of government in France and Britain in the devel-
opment of civil and building engineering (p. 237):
The civil engineering profession in Britain developed very differ-
ently from its counterpart in France. In Britain, there were formal
systems for educating and training military engineers, but the state
played no part in establishing similar systems for civil engineers
until the late nineteenth century. There was also very little state
patronage of civil engineering works...By contrast, the scope of the
civil engineer’s role in France was defined largely by the king and
his government’s plans for establishing the French nation.
The main way that government influenced the development of the engineering
profession was as a source of demand for engineering services. Here the Royal Navy
was particularly important. The most famous example is the Portsmouth Dockyard,
where Henry Maudslay gained experience building machinery designed by Mark Isam-
bard Brunel under the direction of Samuel Bentham.62 Even this influence, however,
was relatively modest compared the the enormous demand coming from private works,
ranging from canal and railway companies to coal mines and textile factories.
61See Lundgreen (1990) and Alder (1997), particularly p. 9-11.62While both Maudslay and Brunel appear in the patent record as engineers, Samuel Bentham,
brother of the more famous Jeremy, appears as an esquire in the majority of his seven patents.
109