the rise and fall of water hyacinth in lake victoria and the kagera river basin, 1989-2001
TRANSCRIPT

J. Aquat. Plant Manage.
42: 2004. 73
J. Aquat. Plant Manage.
42: 73-84
The Rise and Fall of Water Hyacinth in Lake Victoria and the Kagera River Basin, 1989-2001
THOMAS P. ALBRIGHT,
1
T. G. MOORHOUSE,
2
AND T. J. McNABB
2
ABSTRACT
Water hyacinth (
Eichhornia crassipes
(Mart.) Solms) is aninvasive aquatic macrophyte associated with major negativeeconomic and ecological impacts to the Lake Victoria regionsince the plant’s establishment in Uganda in the 1980s. Reli-able estimates of water hyacinth distribution and extent arerequired to gauge the severity of the problem through time,relate water hyacinth abundance to environmental factors,identify areas requiring management action, and assess theefficacy of management actions. To provide such estimatesand demonstrate the utility of remote sensing for this appli-cation, we processed and analyzed remotely sensed imageryto determine the distribution and extent of water hyacinth.Maps were produced and coverage was quantified using a hy-brid unsupervised image classification approach with manualediting for each of the riparian countries of Kenya, Tanza-nia, and Uganda, as well as for numerous gulfs and bays. Asimilar procedure was carried out for selected lakes in theRwanda-Tanzania borderlands lakes region in the KageraRiver basin. Results confirm the severity of the water hya-cinth infestation, especially in the northern parts of the lake.A maximum lake-wide extent of at least 17,374 ha was at-tained in 1998. Following this, a combination of factors, in-cluding conditions associated with the 1997 to1998 El Niñoand biocontrol with water hyacinth weevils, appear to havecontributed to a major decline in water hyacinth in the mostaffected parts of the lake. Some lakes in the Kagera basin,such as Lake Mihindi, Rwanda, were severely infested in thelate 1990s, but the level of infestation in most of these de-creased markedly by the early 2000s.
Key words:
invasive plants, East Africa,
Eichhornia crassipes
,remote sensing, El Niño, biocontrol, aquatic weeds.
INTRODUCTION
Water hyacinth is native to the northern tropics of SouthAmerica and has been described as the world’s worst aquaticweed (Cook 1990). When it is introduced or colonizes a pre-viously uninfested area, populations may rapidly increasecausing serious disruption to environments, economies, andsocieties (Gopal 1990, Mitchell et al. 1990, Anderson andSteward 1990). After being recognized in Lake Kyoga, Ugan-da, in May 1988 (Twongo 1991), water hyacinth was reportedin Lake Victoria, Uganda, in 1989 (Twongo 1991), Lake Vic-
toria, Tanzania, in 1989 (Bwathondi and Mahika 1994), LakeVictoria, Kenya, in 1990 (Mailu et al. 1998), and the KageraRiver of Rwanda in 1991 (Taylor 1991).
Lake Victoria is the world’s second largest freshwater lake,with a surface area of 6,800,000 ha (Figure 1) (Horne andGoldman 1994). The lake is important for the region’s inhab-itants through the supply of drinking water, power generation,fisheries and food security, transportation, and provision ofother ecological goods and services. The lake basin is approxi-mately 18,400,000 ha in size and supports a population ofmore than 25 million people (Anonymous 1996). The econo-my of the lake basin has an estimated worth of 3 to $4 billionUS annually, with the lake fishery benefiting the livelihood ofat least 500,000 people and having a potential sustainable fish-ery export value of $288 million (Anonymous 1996).
The effects of invasive water hyacinth in the region andworldwide are serious, varied, and well documented (Gallagh-er and Haller 1990, Mitchell 1990, Denny 1991, Harley 1991).In the Lake Victoria area, these have included impeding shoreaccess for fishing, hindering ferry transportation, interferingwith hydroelectric power generation, blocking water intakefor water supply and industry, and disrupting native aquaticplant communities (Mailu et al. 1998, Gichuki et al. 2001).
Water hyacinth is distributed throughout the near-shore ar-eas of Lake Victoria and up to the headwaters of the KageraRiver system in the highlands of northern Rwanda. Severallakes in the Kagera River system are infested with water hya-cinth; the most significant among them is Lake Mihindi, at thenorthern end of the Akagera National Park, Rwanda. Moor-house et al. (2000) estimated the rate of water hyacinth flow-ing into Lake Victoria from the Kagera River as beingequivalent to contiguous floating mats covering between 0.2ha/day and more than 1.5 ha/day (an average 0.75 ha/day or300 ha/year), depending on seasonal river volume conditions.
Efforts to control water hyacinth in Lake Victoria and theUpper Kagera River of Rwanda during the early 1990s were oflimited success and were primarily directed at manually remov-ing water hyacinth and conducting public awareness exercises.In the mid-late 1990s, management to combat water hyacinthincreased with efforts such as the Lake Victoria EnvironmentalManagement Program (LVEMP) and U.S. Agency for Interna-tional Development funding for coordination efforts by CleanLakes, Inc. (Martinez, CA, USA). Control actions included bio-control using
Neochetina
bruchi
and
N. eichhorniae
water hya-cinth weevils, mechanical control using large harvesting andchopping boats, and herbicide trails (Ochiel et al. 1999, Mallya1999). Operational water hyacinth control through the use ofherbicides was not implemented in the region, however.
Currently available information pertaining to the extent,distribution, and status of water hyacinth in Lake Victoria dur-
1
SAIC, USGS/EROS Data Center, and Department of Zoology, Universityof Wisconsin, Madison, WI 53706; [email protected]. Work performedunder U.S. Geological Survey contract 03CRCN0001.
2
Clean Lakes, Inc., P.O. Box 3186, Martinez, CA 94553.Received for publication August 25, 2003 and in revised form May 5, 2004.

74
J. Aquat. Plant Manage.
42: 2004.
ing the 1990s and early 2000s is largely based on anecdotal ac-counts, local field observations, and rough estimates(McKinley 1996, Ochiel et al. 1999, and Twongo and On-dongkara 2000). Schouten et al. (1999) demonstrated thepotential of synthetic aperture radar (SAR) imagery for esti-mating water hyacinth distribution and extent by providing es-timates on three dates in 1998 for selected bays in Uganda and
Kenya. Reliable information is required to gauge the severityof the problem through time, relate water hyacinth abundanceto environmental factors, identify areas requiring manage-ment action, and assess the efficacy of management actions.Satellite remote sensing affords a consistent, repeatable, andsynoptic view that is readily incorporated into geographic in-formation systems for analysis. The goal of this investigation
Figure 1. Lake Victoria, its basin, major rivers, and surrounding countries.

J. Aquat. Plant Manage.
42: 2004. 75
was to examine the progression of the extent and distributionof water hyacinth in Lake Victoria and parts of the Kagera Riv-er basin using remote sensing from the early stages of infesta-tion until 2001, when data collection for the study ceased.
MATERIALS AND METHODS
The primary remote sensing task in this study was to dis-criminate water hyacinth from other image constituents, suchas open water, land, waves, and other types of vegetation. Weacquired 26 different date periods of satellite imagery fromLandsat 5 Thematic Mapper (TM), Landsat 7 Enhanced The-matic Mapper Plus (ETM+), and Ikonos
3
(Space Imaging,Thornton, CO, USA), which are spaceborne optical instru-ments, and the Japanese Earth Resources Satellite (JERS) andRadarsat (Radarsat International, Richmond, BC, Canada),which are spaceborne SAR instruments. The optical instru-ments used in this study provide multispectral measurementsof reflected energy from the sun and are very useful for dis-criminating objects based on their spectral signatures. SARimagery is based on an active system in which the instrumentemits microwave radiation and measures its return. SAR sys-tems are capable of all-weather day and night operation andare useful for discriminating objects based on their structure,texture, and moisture content. Imagery was selected on thebasis of time period availability, cost, spatial resolution, imagearea coverage, cloud cover, image quality, and effectiveness indiscriminating aquatic vegetation. Since some of these factors
are tradeoffs, we also sought balance among the factors sothat some images favored one factor and others favored an-other. Our goal was to cover with cloud-free or otherwise un-impeded imagery every part of the lake on a minimum of fivedates, with additional coverage, preferably at higher resolu-tion, of sensitive and water hyacinth-prone areas (Table 1).Note that the 19 April 1997, 26 July 1997, and 19 January2001 images, which were provided by Synoptics BV (Wagenin-gen, The Netherlands), were in a three-date composite red-green-blue (RGB) clustered format, rather than being rawimagery with full radiometric resolution and fidelity. TheJERS imagery was obtained from the National Aeronauticsand Space Administration (NASA) as part of the Global Rain-forest Mapping Program’s 100-m resolution mosaic. We alsoincluded in our analysis water hyacinth extent data forMurchison Gulf, Uganda, from Schouten et al. (1999), whichwere derived from similar remote sensing techniques. In ad-dition to the imagery, reference maps for the region showinglocal place names were acquired.
We produced an ETM+ image mosaic by merging recentadjacent images into one large image covering the entirestudy area. All remaining images were registered to overlaythis mosaic, using either a simple X/Y offset or a 1st orderpolynomial transformation. We then removed land areasfrom consideration by generating a water mask. To accom-plish this, we used a form of unsupervised classification basedon the ISODATA algorithm available on ERDAS Imagine im-age processing software (Leica Geosystems, Atlanta, GA,USA) to identify spectrally distinct clusters that correspondedto water on individual dates of imagery. For data from radar-based sensors, we identified a backscatter threshold that cor-
3
Any use of trade, product, or firm names is for descriptive purposes onlyand does not imply endorsement by the U.S. Government.
T
ABLE
1. D
ATE
PERIODS
,
SATELLITES
/
SENSORS
AND
MODES
(
WHEN
APPLICABLE
),
CELL
SIZE
,
AND
APPROXIMATE
LOCATIONS
OF
THE
26
IMAGES
USED
IN
THE
STUDY
.TM
IS
L
ANDSAT
5 T
HEMATIC
M
APPER
, JERS
IS
J
APANESE
E
ARTH
R
ESOURCES
S
ATELLITE
,
AND
ETM+
IS
E
NHANCED
T
HEMATIC
M
APPER
P
LUS
.
Date Sensor/mode Cell size Location
8 Oct 1994 Landsat 5 TM 30 m Eastern third of Lake Victoria (path 170, rows 60-62)19 Jan 1995 Landsat 5 TM 30 m NW Lake Victoria (path 171, row 60)8 Mar 1995 Landsat 5 TM 30 m SW Lake Victoria (path 171 row 62)Jan-Mar 1996 JERS (mosaic) 100 m Lakewide, RwandaOct-Nov 1996 JERS (mosaic) 100 m Lakewide, Rwanda6 Dec 1996 Radarsat ScanSAR Narrow B 50 m SW Lake Victoria19 Apr 1997 Radarsat ScanSAR Wide B 100 m Lakewide, Rwanda4 Mar 1998 Radarsat ScanSAR Wide B (from RGB composite) 100 m Lakewide29 May 1998 Radarsat Standard Beam 1 25 m Winam Gulf, Kenya (NE Lake Victoria)26 July 1998 Radarsat ScanSAR Wide B (from RGB composite) 100 m Lakewide except southern fifth6 Nov 1998 Radarsat Standard Beam 4 25 m Winam Gulf, Kenya (NE Lake Victoria)12 Apr 1999 Radarsat Standard Beam 7 25 m Emin Pasha Gulf, Tanzania (SW Lake Victoria)10 Jun 1999 Radarsat Standard Beam 7 25 m Murchison Gulf, Uganda (N Lake Victoria)8 Jul 1999 Landsat 7 ETM+ 30 m Rwanda/Tanzania lakes (path 172, row 61)12 Sep 1999 Landsat 7 ETM+ 30 m SE quadrant of lake (path 170, rows 61, 62)5 Oct 1999 Landsat 7 ETM+ 30 m NW Lake Victoria (path 171, row 60)17 Dec 1999 Landsat 7 ETM+ 30 m NE Lake Victoria (path 170, row 60)12 Feb 2000 Radarsat Standard Beam 6 25 m Winam Gulf, Kenya (NE Lake Victoria)16 May 2000 Landsat 7 ETM+ 30 m SW Lake Victoria (path 171 row 62)10 Oct 2000 Ikonos 1 m, 4 m Lac Mihindi, Rwanda20 Oct 2000 Ikonos 1 m, 4 m Lac Mpanga, Rwanda27 Jan 2001 Landsat 7 ETM+ 30 m Western 2/3 of Lake Victoria (path 171, rows 60-62)5 Apr 2001 Radarsat ScanSAR Wide B (from RGB composite) 100 m Lakewide10 May 2001 Landsat 7 ETM+ 30 m Rwanda/Tanzania lakes (path 172, row 61)12 May 2001 Landsat 7 ETM+ 30 m Eastern third of Lake Victoria (path 170, rows 60-62)27 Nov 2001 Landsat 7 ETM+ 30 m SW Lake Victoria (path 171 row 62)
76
J. Aquat. Plant Manage.
42: 2004.
responded to the land/water interface. The single-datemasks were then used to identify maximum water extent sothat if a pixel had been identified as water on any single date,it would be considered water on the master water mask.
The next stage consisted of discriminating water hyacinthand cloud-covered or image noise areas from other areas freeof water hyacinth. Clouds (in the case of the optical imagery)and noise that obscured observation were considered as “nodata” since it was not possible to discern the presence or ab-sence of water hyacinth in these areas. For most LandsatETM+, TM, and Ikonos data, we used unsupervised clusteringto identify water hyacinth and water hyacinth-free areas. Inputbands included at least bands 3, 4, and 5 for ETM+/TM andthe four multispectral bands for Ikonos. For ETM+ and TM im-agery in the Kagera River area, we calculated a “wetness index”[(band 4 - band 5)/(band 4 + band 5)] as a basis for determin-ing a threshold. For radar-based data, which were single-bandintensity images, we applied speckle reduction filters and resa-mpling as necessary to reduce coherent noise prevalent in ra-dar imagery. We then identified a threshold value for eachimage to differentiate water hyacinth. The Radarsat RGB clus-tered imagery represented a special case; it was a multitempo-ral composite and we did not have access to the original data.For these data, we extracted three separate files correspondingto each of the original image dates, on the basis of the contri-bution of each date to the overall multitemporal composite im-age color. As necessary, we applied a 3
×
3 spatial majority filteror used minimum size threshold elimination techniques toeliminate small, often spuriously misclassified groups of pixels.
In some cases, spectrally based methods and filteringwould not adequately identify water hyacinth. In these cases,“false positives” were removed or, in rare cases, pixels werereclassified as water hyacinth where “false negatives” had oc-curred. This was done by systematically viewing the imageand classification and recoding the image map with screen-digitized polygons. Such manual edits were especially crucialfor extracting water hyacinth information from lower resolu-tion satellite imagery (e.g., JERS mosaic, Radarsat ScanSAR),which were more sensitive to error caused by coregistrationand resolution issues. In addition to intensity and color, man-ual edits were aided by field photos, notes, and experience,and were based on context and texture, which the humaneye and mind are better at interpreting than most computer-based methods. Manual editing was facilitated by interactive-ly overlaying coregistered images from multiple dates, allow-ing discrepancies and errors to be efficiently identified.
After water hyacinth and no-data areas were identified, wecalculated statistics on the basis of various geographic units,which we derived from maps and a 1:1,000,000-scale vector GISdataset. We divided Lake Victoria among three countries andfurther divided it into 73 bays, gulfs, and sounds. We also identi-fied and separated the various lakes of the Kagera River system.The area and fraction occupied by each of the three classes (wa-ter hyacinth, not water hyacinth, and no data) were determinedin the various geographic units defined (countries, gulfs, bays,and lakes). Furthermore, we calculated the area of each unit forwhich usable data were not available, i.e. if part of the unit felloutside of the image or if it was impeded by cloud cover or otherno-data conditions. For specific observations of a given geo-graphic unit to be included in figures and discussion in this re-
port, at least 75% percent of the area had to have been visible inthe imagery, unless otherwise noted. We also developed a classi-fication of water hyacinth severity, which assigned each geo-graphic unit to one of four categories. The categories weredefined
a posteriori
as follows in order to provide clear and dis-tinctive classes: negligible—never more than 0.5% of area visiblecovered by water hyacinth; slight—at least one image showingmore than 0.5%; moderate—at least two images showing morethan 2%; severe—at least two images showing more than 7%.
In this study, several factors prevented a comprehensiveand quantitative assessment of accuracy. The study was large-ly retrospective and data acquired after project initiationwere often collected on dates that were either not of ourchoosing or altogether not known in advance. Even when animage acquisition was known in advance, the large size of thelake, difficulty of access, and highly dynamic nature of free-floating water hyacinth mats made coincident reference datacollection very difficult. Nonetheless, we corroborated re-motely sensed estimates with field photographs and notesduring several field visits. We also arranged for PhotoMap(Kenya) Ltd. (Nairobi, Kenya) to acquire 1:40,000 scaleblack/white aerial photographs of Winam Gulf on the morn-ing of 12 February 2000, approximately two hours before theRadarsat image acquisition from the same date. The amountof detail visible on these photographs greatly exceeded thatof any of the spaceborne remotely sensed images acquiredfor area. As an independent comparison, the amount of wa-ter hyacinth in Kisumu Bay, where water hyacinth was mostabundant within Winam Gulf, was estimated using photo in-terpretation techniques from one frame of the photographs.
RESULTS
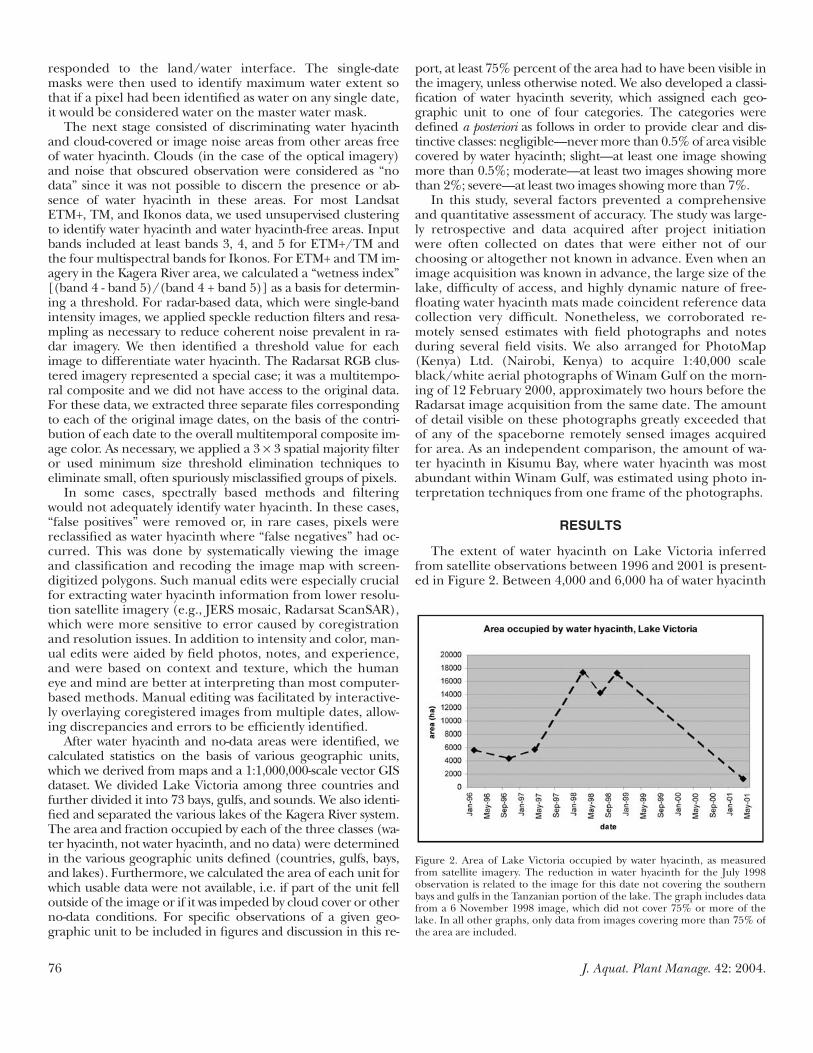
The extent of water hyacinth on Lake Victoria inferredfrom satellite observations between 1996 and 2001 is present-ed in Figure 2. Between 4,000 and 6,000 ha of water hyacinth
Figure 2. Area of Lake Victoria occupied by water hyacinth, as measuredfrom satellite imagery. The reduction in water hyacinth for the July 1998observation is related to the image for this date not covering the southernbays and gulfs in the Tanzanian portion of the lake. The graph includes datafrom a 6 November 1998 image, which did not cover 75% or more of thelake. In all other graphs, only data from images covering more than 75% ofthe area are included.

J. Aquat. Plant Manage.
42: 2004. 77
was present on the lake on dates sampled between January1996 and April 1997. A large increase occurred in 1997 and1998, followed by a decline to low levels by April 2001. Thepeak amount of water hyacinth on the lake determined di-rectly from the imagery was 17,374 ha on 4 March 1998.However, by November of the same year, 17,231 ha of water
hyacinth was visible on an image covering primarily WinamGulf (Kenya), which constituted less than 5% of the entirelake. Thus, it is likely that the amount present on the entirelake at that time exceeded this considerably. Generally, sever-ity of water hyacinth infestation was greater in the north andin relatively protected bays (Figure 3). This may be linked to
Figure 3. The observed relative severity of water hyacinth in selected bays and gulfs as detected by imagery collected between 1994 and 2001. Negligible–never more than 0.5% of area of feature visible covered by water hyacinth; slight–at least one image showing more than 0.5%; moderate–at least two imagesshowing more than 2%; severe–at least two images showing more than 7%.

78
J. Aquat. Plant Manage.
42: 2004.
currents and weather patterns, which may have pushed waterhyacinth to the north, but may also be due to the presence ofmore suitable water hyacinth habitat and possibly higher lev-els of eutrophication associated with agricultural practicesand the larger urban areas of the northern parts of the basin.
Uganda
Large amounts of water hyacinth (>3,000 ha) werepresent in Uganda on all images from February 1996 until anobserved peak of 4,732 ha on 4 March 1998 (Figure 4). Fol-lowing this was a sharp reduction to 2,147 ha on 26 July 1998and further reduction until a low of 53 ha was measured on 5April 2001.
Murchison Bay experienced one of the most severe infes-tations on the lake (Figure 5). Because of strong winds andthe highly mobile nature of water hyacinth (including eventhe largest of mats), estimates could differ markedly betweenmorning and evening, and between seasons, owing to chang-es in wind direction. The earliest four points on the graph,from Schouten et al. (1999), were from two different times ofday on two different dates and reveal how daily wind cyclescan affect measured water hyacinth amounts. The data sug-gest that a rapid increase in water hyacinth extent occurredduring 1994, followed by a peak of 1,974 ha (8.6% of bay) on19 January 1995, and a period of abundant water hyacinth,ranging from 1,140 ha to 1,522 ha on dates observed be-tween 1996 and 1997. During these periods of abundance,the imagery revealed giant mats covering hundreds of hect-ares in inner Murchison Bay and neighboring Wazimenyaand Gobero Bays.
In late 1995,
Neochetina
bruchi
and
N
.
eichhorniae
water hya-cinth weevils were released into the Ugandan portion ofLake Victoria. However
Neochetina
spp. had been released asearly as June 1996 at Katosi, Uganda (Ogwang and Molo1997) and could have spread into Lake Victoria much earlierfrom a test trial pond located in Kajjansi less than 2 km fromthe lake where
Neochetina
spp. had been introduced in June1994. It was not until February 1997 that we observed weevilfeeding activity on plants in Murchison Bay. Weevils multi-
plied rapidly, attaining an average number of 13.8 weevilsper plant in 1998 and 24.7 weevils per plant in 1999 on LakeVictoria in Uganda (pers. comm., Uganda National Agricul-ture Research Organization, 2000). Also during 1998 to1999,mechanical removal work was occurring at Port Bell. By1999, there was only 15 and 1 ha of water hyacinth detectedin March and July, respectively. By late 2001, weevil numbershad declined to an average of 8.8 weevils per plant (pers.comm., Uganda National Agriculture Research Organiza-tion, 2001). Our monitoring of weevil populations indicatedthat populations had declined to 1.2 weevils per plant for sta-tionary water hyacinth growing along the shoreline and to2.3 weevils per plant for floating mats of water hyacinth byJanuary 2002 (unpubl. data). Perhaps associated with this de-cline in weevil density, a slight increase in water hyacinth to35 ha was apparent in the image data in January 2001.
Tanzania
Although occupying nearly half of Lake Victoria, Tanzaniadid not experience the same degree of water hyacinth infes-tation as the other riparian countries. Levels of water hya-cinth extent between 825 ha and 2,004 ha were observed in1996 and 1997, followed by a peak of 4,081 ha on 4 March1998, a drastic decline to only 28.5 ha on 26 July 1998, and aslight resurgence to 117 ha on 5 April 2001 (Figure 6). Itshould be noted that the 26 July 1998 image did not coverthe southern parts of Emin Pasha Gulf (extreme southwest)and Mwanza Gulf (extreme south) and was therefore proba-bly responsible for an underestimation of extent. Weevil re-lease in Tanzania began in August 1997 (Mallya 1999).Observations after 2000 indicated that extents of water hya-cinth were less (100 to 200 ha) than those observed in thelate 1990s.
Kenya
Kenyan waters were late in being infested by water hya-cinth relative to the other countries, but experienced verylarge populations (Figure 7). The late onset of infestationsupports the hypothesis that water hyacinth originally camefrom the Kagera River system and migrated to the Ugandaand Tanzania sides of the lake first. In terms of shorelinelength and economic importance, the Kenyan portion ofLake Victoria is dominated by Winam Gulf, which is the siteof the city of Kisumu and of several rivers that flow into LakeVictoria. Winam Gulf was the site of the largest infestationsrecorded in any location at any time during the study. Aftersmall infestations were observed in 1994 and 1996, 8,504 ha,4,846 ha, 12,091 ha, and 17,218 ha of water hyacinth matswere observed in March, May, July, and November of 1998,respectively. Note that the reduced amount observed in May1998 was due, at least in part, to the fact that a large part ofheavily infested Nyakach Bay was outside of the imaged areaon this date. Because we rarely observed flowering, thesedrastic increases in water hyacinth extent were possibly dueto a combination of rapid asexual reproduction and coloni-zation of areas by individuals from other parts of the lake.Our 1998 field observations revealed that the large floatingmats of water hyacinth also included opportunistic native
Figure 4. Area of the Ugandan portion of Lake Victoria occupied by waterhyacinth, as measured from satellite imagery.

J. Aquat. Plant Manage.
42: 2004. 79
Figure 5. Changes in distribution and extent of water hyacinth coverage in Murchison Bay, Uganda. Note that the first four data points on the graph arefrom Schouten et al. (1999). Wazimenya and Gobero Bays are located within the east central and southeast parts of Murchison Bay, respectively. The verticalline on the graph indicates the approximate timing of weevil release on Murchison Bay. A lake level photograph taken within two hours of satellite image isshown for 27 January 2001. The black arrow on the adjacent image map indicates approximate photo position and direction.

80
J. Aquat. Plant Manage.
42: 2004.
plants, such as hippograss (
Vossia cuspidata
Roxb.) and papy-rus (
Cyperus papyrus
L.), growing on top of water hyacinth.We did not witness these plants colonizing open water in ab-sence of water hyacinth, suggesting that the presence of wa-ter hyacinth was required for their establishment in thesenew areas.
Weevil release in Kenya began in January 1997 (Ochielet al. 1999) and the Kenyan LVEMP used a mechanical chop-per between December 1999 and April 2000. A large reduc-tion to 3,134 ha in December 1999 and 532 ha in February2000 was observed. However, the 2000 image did not coverthe southeastern part of Winam Gulf and therefore this esti-mate may have been lower than the actual extent. Manual in-terpretation of the aerial photograph frame of Kisumu Bayacquired on 12 February 2000 yielded an estimate of 313 haof water hyacinth and associated aquatic vegetation (Figure8). The comparable area measured from part of the Radarsatimage from the same date was 290 ha (approximately 93%agreement). Even in the short time between the photographand the image, shifting of floating mats of water hyacinthand associated aquatic vegetation is readily apparent. Forthis reason, we did not conduct a pixel-wise accuracy assess-ment, whereby corresponding pixels (scanned in the case ofthe photograph) from both the photo and the image wouldbe compared. A field photograph taken on 23 February 2000also clearly showed an expansive mat of water hyacinth, fur-ther confirming the validity of the satellite derived estimates.As with other parts of the lake, a slight increase in water hya-cinth was observed in 2001.
Rwanda-Tanzania Borderland Lakes
This region near the Kagera River at the border betweenTanzania and Rwanda contains a large number of small tomedium-sized lakes. Our analysis revealed that those lakesclose to and/or connected to the Kagera River were morelikely to have experienced water hyacinth invasion thanthose located farther away and/or not connected. Lake Mi-hindi, Rwanda, in particular, has had a large amount of water
hyacinth associated with it for several years. After the first ob-servation of 270 ha in December 1996, a peak of 610 ha,which covered over half of the lake, was observed in April1997 (Figure 9). Our most detailed observation, using thehigh-resolution Ikonos satellite, revealed a decline to 200 hain October 2000. This quantity appeared to be relatively sta-ble through our final spaceborne observation in May 2001.However, a field visit in October 2001 revealed that water hy-acinth coverage had increased greatly over the last image es-timate (Figure 9). Based on the area that appears occupiedin the photos from this visit and areas mapped from previousdates, between 350 and 550 ha of water hyacinth was presentat this time. Biological control implementation started in theRwandan portion of the Kagera River in September 2000 andin Lake Mihindi in October 2001 (Moorhouse et al. 2002).
Explaining the Decline in Water Hyacinth
Several factors may have contributed to the decline in ob-served water hyacinth extent in the Lake Victoria basin. EastAfrica experienced an El Niño associated weather phenome-non during the last quarter of 1997 and first half 1998 (An-yamba et al. 2001). During this time, the lake level climbed1.70 m in a period of 7 months (pers. comm., Uganda Elec-tricity Board, 2001). Since records began in 1899, such a rap-id rise was matched only by an event that occurred in 1962 to1963. Heavy winds and waves associated with a heavy rainyseason may have physically damaged plants and a rapid rise inwater level may have dislodged mats of macrophytes. For in-stance, Gichuki et al. (2001) implicated the 1962 to 1963event, which was also associated with El Niño, in the destruc-tion of wetlands in Winam gulf. The timing of the decline inwater hyacinth extent in Tanzania from 4,080 ha in March1998 to only 28 ha in July 1998 is consistent with the hypothe-sis that El Niño weather conditions contributed to a declinein water hyacinth there. Similarly, in Lake Mihindi, we suspectthat the large reduction in water hyacinth that occurred be-tween 1997 and 1999 was due, at least in part, to flood watersfrom a major rainfall event breaching the blocked outlet ofLac Mihindi and allowing water hyacinth to spill out of thelake and into the river system. The possible effects of the 1997to1998 El Niño are complex, however. Rather than destroyingwater hyacinth, heavy rains and rising water levels may havedislodged and redistributed water hyacinth in some cases.This redistribution may have been the source of new popula-tions in Winam Gulf after the 1997 to 1998 El Niño episode.
The timing of declines in observed water hyacinth with re-spect to the timing of weevil releases and observed popula-tions and feeding scars strongly suggest that weevils played arole in the decline of at least some populations of water hya-cinth on Lake Victoria. In Murchison Bay, Uganda, for in-stance, 1,522 ha of water hyacinth were observed on 19 April1997, 16 months after the December 1995 weevil release inthe area. By 4 March 1998, 27 months after weevil release, thisamount had been reduced to 516 ha and weevil populationsand feeding scars were visible during field visits in this period.Similarly, in Kenya, a reduction from 17,218 ha of water hya-cinth on 6 November 1998 to 3,134 ha on 17 December 1999,occurred some 35 months after weevil release in Kenya. Suchlags between weevil release and major impact are in the typi-
Figure 6. Area of the Tanzanian portion of Lake Victoria occupied by waterhyacinth, as measured from satellite imagery. The vertical line indicates theapproximate timing of weevil release.

J. Aquat. Plant Manage.
42: 2004. 81
Figure 7. Changes in distribution and extent of water hyacinth coverage in Winam Gulf, Kenya. Note that the reduced amount observed in May 1998 is due,at least in part, to the fact that a large part of heavily infested Nyakach Bay, on the far eastern side of the gulf, was outside of the imaged area on this date.The vertical line on the graph indicates the approximate timing of weevil release in Winam Gulf.

82
J. Aquat. Plant Manage.
42: 2004.
cal 2- to 5-year range (Julien et al. 1999). In Tanzania, the ma-jor reduction in water hyacinth extent between March andJuly 1998 occurred less than a year after weevils were released.Such a decrease appears to be too sharp and too soon afterweevil release to be attributable to biological control alone. Inthe case of Lake Mihindi, Rwanda, it is clear that weevilsplayed no role in the declines since they had not been re-leased when the major decline occurred some time betweenApril 1997 and July 1999. Because water hyacinth populationson Lake Mihindi appeared to be increasing again in October2001 when weevils were released, subsequent imagery or fieldvisits would likely prove useful in determining the effects ofweevils on water hyacinth populations on this lake.
Several other factors may also have had an effect on waterhyacinth populations. Various pathogens (
Alterneria
spp.,
Pho-ma
spp.,
Cladosporium
spp.,
Myrothecium
spp.,
Curvularia
spp.,
Acermonium
spp.,
Trichoderma
spp.,
Fusarium
spp., and
Ni-grospora
spp.) capable of weakening water hyacinth have beenisolated from water hyacinth plants in Lake Victoria (Godon-ou 2000). In local areas, such as inner Murchison Gulf andKisumu Bay, mechanical removal may have played a role.Plant health may also have been influenced by other weatherand environmental conditions, such as water quality, nutrientsupply, temperature, and humidity. Any and all of the abovefactors may have acted in combination or even synergistically
with each other. For instance, with plants subjected to her-bivory by weevils and damage by severe weather conditions,pathogens may have found an ideal environment to becomeestablished and further weaken or destroy the plants.
Analysis of satellite imagery collected between 1994 and2001 confirms the serious extent to which Lake Victoria andthe Rwanda-Tanzania borderlands lakes were infested by wa-ter hyacinth. The northern parts of the lake in Uganda andKenya were most severely infested, with Winam Gulf, Kenyahaving the most water hyacinth detected in the study. Inmost locations, the infestation reached a maximum in 1997or 1998, with a lakewide maximum of at least 17,374 ha in1998. By 2001, however, the severity of the water hyacinth in-festation in Lake Victoria was much reduced relative to 1998.
The degree to which each of the control measures and en-vironmental factors were responsible for the decline in waterhyacinth cannot be determined from this study alone. How-ever, it does appear that different factors predominated indifferent locations and may have acted in combination. Fi-nally, the ability of water hyacinth to rapidly propagate, ex-pand its extent, and colonize remote areas was clearlydocumented. This fact, together with the most recent re-motely sensed and photographic evidence of expansions inwater hyacinth extent, suggests that continued monitoringand management actions may be required to reduce the pos-
Figure 8. a) Scanned image of a portion of 1:40,000 aerial photography acquired 12 February 2000 by Photomap (Kenya) Ltd. b) blown up portion showingport of Kisumu. c) Field photograph taken on 23 February 2000. Vegetation in photograph and adjacent areas was identified as water hyacinth with mixtureof hippograss and papyrus. Black arrow in d) indicates approximate position and direction of photo. d) Portion of 12 February 2000 Radarsat image ofKisumu Bay shown at comparable scale and orientation to aerial photograph. White arrow indicates an area of dominant papyrus, which is believed to havesucceeded water hyacinth.

J. Aquat. Plant Manage.
42: 2004. 83
Figure 9. Changes in distribution and extent of water hyacinth coverage in Lake Mihindi, Rwanda. Field photos taken on 24 October 2001 were digitallystitched together to show a panoramic view of expended water hyacinth relative to satellite mapped coverage on 10 May 2001.

84
J. Aquat. Plant Manage.
42: 2004.
sibility of a resurgence to extremely high levels of water hya-cinth in Lake Victoria and the Kagera River basin.
ACKNOWLEDGMENTS
This publication was made possible through support pro-vided by the USAID/Uganda, Greater Horn of Africa Initia-tive (GHAI), under the terms of Grant No. 617-A-00-99-00008-00. The opinions expressed herein are those of the au-thor(s) and do not necessarily reflect the views of USAID.
Special thanks go to Synoptics, BV for making their pro-cessed data available through funding provided to them bythe Dutch Remote Sensing Board, and to NASA’s Jet Propul-sion Laboratory for provision of the Global Rainforest Map-ping Program data. We acknowledge the contributions ofRussell Rykhus and Michael Coan of the USGS/EROS DataCenter who participated in parts of the data processing andanalysis. We acknowledge Larry Tieszen of the USGS/EROSData Center for early project development and vision.Thanks also to Chandra Giri, William Haller, and two anony-mous reviewers for helpful suggestions on the manuscript.
We also wish to acknowledge the numerous national andregional institutions, and projects in Kenya, Rwanda, Tanza-nia, and Uganda as well as numerous institutions that fall out-side the region for their discussions, suggestions, input,interest, or encouragement. Kenya: Kenya Agriculture Re-search Institute, Ministry of Environment and Natural Re-sources—Department of Resource Surveys and RemoteSensing, LVEMP—Kenya, PhotoMap (K) Limited. Uganda:Ministry of Agriculture, Animal Industries and Fisheries—Water Hyacinth Unit and Department of Fisheries Resourc-es, National Agriculture Research Organization—FisheriesResearch Institution and Namalonge Agriculture Research In-stitution, National Environment Management Authority, Min-istry of Lands, Environment and Water—Directorate of WaterDevelopment; Forest Department—National Biomass Study,Makerere University—Institute of Environment and NaturalResources, LVEMP—Uganda; Uganda Electricity Board. Tan-zania: Ministry of Agriculture—Plant Protection, Ministry ofNatural Resources and Tourism, Department of Environment,National Environment management Council, University ofDar es Salaam-Natural Resources and Environment/Institutefor Resource Assessment, University College of Lands and Ar-chitectural Studies—Geo Information Centre, LVEMP—Tan-zania. Rwanda: Institut des Sciences Agronomique duRwanda. Regional: East African Community Secretariat, LakeVictoria Fisheries Organization, Lake Victoria EnvironmentalManagement Program, Regional Centre for Mapping of Re-sources for Development, LVEMP—Regional.
LITERATURE CITED
Andersen, L. W. J. and K. K. Steward. 1990. Aquatic weed problems andmanagement in North America, p. 371-405.
In:
A. H. Pieterse and K.Murphy (eds.). Aquatic Weeds: The ecology and management of nui-sance aquatic vegetation. Oxford University Press, Oxford, England.
[Anonymous]. 1996. Lake Victoria Environmental Management Project.Global Environment Division, Environment Department, World Bank,Project document 15541-AFR.
Anyamba, A., C. J. Tucker and J. R. Eastman. 2001. NDVI anomaly patternsover Africa during the 1997/98 ENSO warm event. Int. J. Remote Sens-ing 22:1847-1859.
Bwathondi, P. and G. Mahika. 1994. A report of the infestation of water hya-cinth (
Eichhornia crassipes
) along the Tanzanian side of Lake Victoria.National Environment Council, Dar es Salaam, Tanzania.
Cook, C. D. K, 1990. Origin, autecology, and spread of some of the world’smost troublesome aquatic weeds, p. 31-38.
In:
A. H. Pieterse and K. Mur-phy (eds.). Aquatic Weeds: The ecology and management of nuisanceaquatic vegetation. Oxford University Press, Oxford, England.
Denny, P. 1991. Africa, p. 115-148.
In
: M. Finlayson and M. Moser (eds.).Wetlands. International Waterfowl and Wetlands Research Bureau.Gloucester, UK.
Gallagher, J. E. and W. T. Haller. 1990. History and development of aquaticweed control in the United States. Reviews of Weed Science 5:115-191.
Gichuki, J., F. Dahdouh Guebas, J. Mugo, C. O. Rabour, L. Triest and F.Dehairs. 2001. Species inventory and the local uses of the plants andfishes of the Lower Sondu Miriu wetland of Lake Victoria, Kenya. Hydro-biologia 458:99-106.
Godonou, I. 2000. Surveys in Kenya, p. 7-8.
In:
R. Murphy and M. Hill (eds.)Water Hyacinth News, CABI Bioscience, United Kingdom. Vol. 2.
Gopal, B. 1990. Aquatic weed problems and management in Asia, p. 318-340.
In:
A. H. Pieterse and K. Murphy (eds.). Aquatic Weeds: The ecol-ogy and management of nuisance aquatic vegetation. Oxford UniversityPress, Oxford, England.
Harley, K. L. S. 1991. Floating Aquatic Weeds: What are they? Where arethey? How should we manage them? p. 111-124.
In:
A. Greathead and P.de Groot (eds.). Control of Africa’s Floating Water Weeds. Common-wealth Science Council, Zimbabwe.
Horne, A. J. and C. R. Goldman. 1994. Limnology, 2nd Edition. McGraw-Hill, Inc. p. 29.
Julien, M. H., Griffiths, M. W. and A. D. Wright. 1999. Biological control ofwater hyacinth. The weevils
Neochetina bruchi
and
N. eichhorniae
: biologies,host ranges, and rearing, releasing, and monitoring techniques for bio-logical control of
Eichhornia crassipes
. ACIAR Monograph No. 60, 87 pp.Mailu, A. M., G. R. S. Ochiel, W. Gitonga and S. W. Njoka. 1998. Water Hya-
cinth: An Environmental Disaster in the Winam Gulf of Lake Victoriaand its Control, p. 101-105.
In:
M. Hill, M. Julien and T. Center (eds.).First IOBC Global Working Group Meeting for the Biological Controland Integrated Control of Water Hyacinth.
Mallya, G. A. 1999. Water hyacinth control in Tanzania, p. 25-29.
In:
M. Hill,M. Julien and T. Center (eds.). First IOBC Global Working Group Meetingfor the Biological Control and Integrated Control of Water Hyacinth.
McKinley, J. 1996. In Lake Victoria, Amazonian weed wreaks havoc. 5 August1996, New York Times, New York, NY.
Mitchell, D. S. 1990. Aquatic weed problems and management in Africa, p.341-354.
In:
A. H. Pieterse and K. Murphy (eds.). Aquatic Weeds: TheEcology and Management of Nuisance Aquatic Vegetation. Oxford Univ.Press, Oxford, England.
Moorhouse, T. G., P. Agaba and T. McNabb. 2001. Recent efforts in biologi-cal control of water hyacinth in the Kagera River headwaters of Rwanda,p. 152.
In:
M. H. Julien, M. P. Hill, T. D. Center and J. Ding (eds.). Bio-logical and Integrated Control of Water Hyacinth,
Eichhornia crassipes
-Proceedings of the Second Meeting of the Global Working Group forthe Biological and Integrated Control of Water Hyacinth, Beijing, China,9-12 October 2002. ACIAR Proc. No. 102.
Ochiel, G. S., A. M. Mailu, W. Gitonga and S. W. Njoka. 1999. Biological Con-trol of Water Hyacinth on Lake Victoria, Kenya, p. 115-118.
In:
M. Hill, M.Julien and T. Center (eds.). First IOBC Global Working Group Meetingfor the Biological Control and Integrated Control of Water Hyacinth.
Ogwang, J. and R. Molo. 1997. Biological Control of Waterhyacinth inUganda, p. 287-293.
In:
16th East African Biennial Weed Sci.Conf. Proc.Weed Sci. Soc. of East Africa.
Schouten, L. S. M., H. J. C. van Leeuwen, J. G. M. Bakker and T. Twongo.1999. Water Hyacinth Detection in Lake Victoria by Means of SatelliteSAR. USP-2 report USP-2 98-28, Netherlands Remote Sensing Board,Delft, The Netherlands.
Taylor, A. R. D. 1991. Floating water-weeds in East Africa, p. 111-124.
In:
A.Greathead and P. de Groot (eds.). Control of Africa’s Floating WaterWeeds. Commonwealth Sci. Council, Zimbabwe.
Twongo, T. 1991. Status of Water Hyacinth in Uganda, p. 55-57.
In:
A. Great-head and P. de Groot (eds.). Control of Africa’s Floating Water Weeds.Commonwealth Sci. Council, Zimbabwe.
Twongo, T. and O. K. Ondongkara. 2000. Invasive water weeds in Lake Vic-toria basin: proliferation, impacts, and control. Lake Victoria 2000. LakeVictoria Fisheries Organisation.