the riksbank’s method for stress testing banks’ liquidity
TRANSCRIPT

Staff memo
The Riksbank’s method for
stress testing banks’ liquidity
Mattias Danielsson Jonatan Manfredini
Financial Stability Department
November 2019

KÄNSLIG

THE RIKSBANK’S METHOD FOR STRESS TESTING BANKS’ LIQUIDITY 1
A staff memo provides members of the Riksbank’s staff with the opportunity to
publish slightly longer, advanced analyses of relevant issues. It is a publication for civil
servants that is free of policy conclusions and individual standpoints on current policy
issues. Staff memos are approved by the appropriate Head of Department. This
memo has been produced by staff at the Riksbank’s Financial Stability Department.
2 STAFF MEMO
Table of contents
SUMMARY 3
INTRODUCTION 4
Banks’ maturity transformation involves liquidity risks 4
What is liquidity risk and how is it measured? 4
Why does the Riksbank use stress tests of liquidity? 5
METHOD FOR STRESS TESTING LIQUIDITY 6
Several components needed for stress tests 6
The stress tests are based on data reported by the banks 7
A scenario corresponds to a set of assumptions 9
Several calculations are required to produce results 14
RESULTS OF THE LIQUIDITY STRESS TESTS 17
CONCLUSION 20
REFERENCES 21
ANNEX A. STRUCTURE OF MATURITY LADDER TEMPLATE 23
ANNEX B. ASSUMED WEIGHTS IN THE RIKSBANK’S SCENARIOS 25
ANNEX C. COMPARISON OF THE RIKSBANK’S SCENARIOS AND REFERENCE SCENARIOS 27
ANNEX D. HISTORICAL BANK RUNS 28

THE RIKSBANK’S METHOD FOR STRESS TESTING BANKS’ LIQUIDITY 3
Summary
Mattias Danielsson and Jonatan Manfredini.1
The authors work in the Financial Stability Department of the Riksbank.
Stress tests are used to assess the resilience of individual banks and the banking
system as a whole, as well as the liquidity needs that may arise in a financial crisis. It is part of the Riksbank’s work to continuously analyse how the banking system is developing so that threats and vulnerabilities can be detected at an early stage.
In the past year, the Riksbank has worked to further develop its framework for
liquidity stress tests. In this staff memo, it is described how the Riksbank stress tests banks’ liquidity. The Riksbank uses cash flow-based stress tests that are based on detailed supervisory data on banks’ contractual cash flows and liquidity reserves. These are then combined with assumptions in a stressed scenario. The outcome of the stress tests is measured in the form of how banks’ liquidity needs develop.
This staff memo focuses on the Riksbank’s methods for stress tests of liquidity and how the results of the tests can be interpreted. No outcomes of stress tests on individual banks or for the banking system as a whole are therefore presented.
1 We would like to thank especially Christoph Bertsch, Robert Emanuelsson, Johan Eng Larsson, Johannes Forss Sandahl, Thomas Jansson, Reimo Juks, Björn Jönsson, Kristian Jönsson, Annika Svensson and Peter van Santen for their valuable contributions to this staff memo. The opinions expressed in this document are those of the authors and are not necessarily shared by the Riksbank.

4 INTRODUCTION
Introduction
The aim of this staff memo is to describe the Riksbank’s method for stress tests of liquidity in
both individual banks and in the banking system as a whole. The staff memo starts with a
description of liquidity risks, how these can be measured, and why the Riksbank stress tests
banks’ liquidity. Thereafter follows a review of the method, i.e. the data and scenarios used
by the Riksbank and the calculations made. After that, there is an explanation of the stress
test results and how they can be interpreted. Finally, an overall comment and description are
given on how the method can be developed going forward. However, no results from stress
tests on individual banks or the banking system as a whole are presented.
Banks’ maturity transformation involves liquidity risks
The financial system has three main roles: to convert savings into funding, to manage risks
and to make it possible for payments to be made efficiently.2 Banks are central actors in the
financial system as mediators of loans, payments and other financial services. A natural part
of banking operations is converting savings to funding via what is known as maturity
transformation. This involves banks borrowing money on short maturities which they then
use to lend on longer maturities.
Banks borrow money in several different ways. The general public’s savings is a source of
funding for banks via deposits from households and companies. Deposits tend to have very
short contractual maturity or none at all. Despite this, deposits tend to be a stable source of
funding as the banks’ customers seldom make large withdrawals at the same time. In other
words, it is usually said that deposits have a long behavioural maturity.3
Banks can also use wholesale funding. This involves them obtaining funding through
capital markets by issuing debt instruments, for example certificates and bonds, which are
typically purchased by institutional investors. The maturity for wholesale funding can vary
from between one day to several years.
The debt taken on by banks is then used to fund their assets. These assets may consist of
loans to households and companies for investments in housing, machinery and product
development, for example. The assets can often have maturities of several years, which can
partly be explained by households and companies usually borrowing money for larger
investments, with the loans consequently taking a longer time to repay.
Maturity transformation benefits society as it streamlines the matching of short-term
saving and long-term investment, as well as helps households and companies to even out
their consumption over time. At the same time, however, transformation also gives rise to
mismatches in maturity between a bank’s assets and liabilities. This means that the bank
normally has to repay its own loans before it recuperates the money it has lent out. To
manage this, the bank must renew its funding several times during a bank loan’s maturity
period. If the bank’s debt-servicing ability is called into question, it may be forced to renew
the funding at a higher cost than before, or may not be able to renew its funding at all. The
bank may then risk being unable to meet its payment obligations. This risk is called liquidity
risk. The Riksbank continually analyses and assess banks’ liquidity risks as part of its work to
identify vulnerabilities in the financial system. Stress tests are an important element in this
work as is explained in more detail below.
What is liquidity risk and how is it measured?
Liquidity risks can be divided into short-term and structural (or long-term) liquidity risks.
Short-term liquidity risks refer to the risk of a bank being unable to meet its payment
2 The Riksbank (2016). 3 The contractual maturity of the banks’ deposits is usually very short. The majority of deposits can be paid out as soon as the customer requests it, which is to say the same day, in practice. But the behavioural maturity of the deposits is normally longer.

THE RIKSBANK’S METHOD FOR STRESS TESTING BANKS’ LIQUIDITY 5
obligations when debts fall due, for example if a bank has difficulty renewing its funding.
However, banks can counteract short-term liquidity risks by having a buffer of liquid assets, in
other words a liquidity reserve. How large the short-term liquidity risks are therefore depend
in part on how large the bank's liquidity reserve is in relation to the gap between the bank’s
expected cash outflow and cash inflow over the short term.
Structural liquidity risks, on the other hand, refer to the maturity mismatches on the
bank’s balance sheet as a whole, i.e. including both short-term and long-term assets and
liabilities. If a bank has substantial structural liquidity risks, it risks encountering funding
problems in the longer term.4
The Basel Committee on Banking Supervision (BCBS) has developed two standardised
liquidity measures intended to gauge and regulate banks’ liquidity risks. The first measure is
called the Liquidity Coverage Ratio (LCR) and indicates a bank’s short-term liquidity risks. The
measure is calculated as the ratio between a bank’s liquidity reserve and its net cash outflows
in a stressed scenario lasting 30 days.5 The second measure indicates a bank's structural
liquidity risks and is called the Net Stable Funding Ratio (NSFR). This measure is calculated as
the ratio between the bank’s available stable funding and its required stable funding.6 These
two standardised measures provide a good starting-point for the analysis of the liquidity risks
in individual banks.7 However, the analysis can be complemented with stress tests in order to
gain a deeper understanding of liquidity risks in individual banks and the banking system as a
whole.
Why does the Riksbank use stress tests of liquidity?
The Riksbank is responsible for promoting a secure and efficient payment system, which, in
more general terms, means safeguarding financial stability. Banking crises, and financial crises
more generally, entail major costs for the economy. The Riksbank therefore continuously
works on assessing resilience and identifying vulnerabilities in the financial system. In
addition, the Riksbank has a special role as lender of last resort, which means that, under
certain circumstances, the Riksbank can provide liquidity support to the banks.
Estimating the potential liquidity needs that could arise in the banking system in a crisis is
part of the Riksbank’s work on crisis preparedness in its role as lender of last resort. The
Riksbank uses liquidity stress tests to estimate how these liquidity needs may develop in
different scenarios of financial stress. Stress tests of this kind can expediently be used as a
complement to key ratios such as the LCR and NSFR. The results from the Riksbank’s stress
tests may contain more detailed information than such key ratios. In addition, stress tests can
measure liquidity risks over other time horizons than those measured using key ratios. Finally,
the Riksbank’s stress testing method is flexible in the sense that it allows for different types of
scenarios to be designed and used in stress tests. Taken together, the stress tests enable a
deeper analysis and make it easier to identify vulnerabilities in the financial system.
Consequently, liquidity stress tests are a tool that can help the Riksbank fulfil its responsibility.
Several times previously, the Riksbank has published analyses of liquidity risks and has
also used stress tests as an analytical tool. For example, Roszbach et al. (2016) analyse
structural liquidity risks, while Sveriges Riksbank (2010) includes a liquidity stress test. In
addition, the Riksbank has used liquidity stress tests to estimate the contingency requirement
in foreign currency, which forms the basis for the assessment of how large the foreign
exchange reserves should be.8
4 Roszbach et al. (2016). 5 See the Basel Committee on Banking Supervision (2013a) for definitions of liquid assets included in the liquidity reserve, as well as a definition of net cash outflow. 6 See the Basel Committee on Banking Supervision (2014) for definitions of available stable funding and required stable funding. 7 See Roszbach et al. (2016), who use a number of measures to analyse liquidity risk. 8 See for example the Riksbank (2017) and the Riksbank (2019).

6 METHOD FOR STRESS TESTING LIQUIDITY
Method for stress testing liquidity
Somewhat simplified, there are two kinds of stress test: top-down stress tests and bottom-up
stress tests. The defining feature for which category a stress test belongs to is the
organisation performing the stress test.
In top-down stress tests, it is the authority that designs the scenarios and makes all
calculations. Consequently, the authority has control over how the stress tests are
performed. As the same method is used for all banks, the results can also be compared
between them.
A bottom-up stress test instead means that the banks make the calculations themselves,
often under the oversight of a supervisory authority or central bank.9 Bottom-up stress tests
are often based on more detailed, institution-specific data to which the bank has access, as it
has a better understanding and more information regarding its own operations and
customers. However, this can lead to differences arising in the data and assumptions
employed by different banks, meaning that the results are not necessarily comparable.
Similar to Oesterreichische Nationalbank10 (OeNB), the Riksbank performs top-down
stress tests. The European Central Bank’s (ECB’s) stress test exercise11, which includes all
banks in the euro area under ECB supervision, is an example of bottom-up stress tests.
Since the financial crisis of 2008–2009, the banks’ supervisory reporting has increased in
scope and, among other things, the banks now need to report detailed data on their future
contractual cash flows and liquidity reserves. This has created opportunities for authorities,
such as the Riksbank, to perform top-down stress tests that are cash flow-based and based
on relatively detailed reporting of the bank’s own data.12
All in all, this means that the advantage of the Riksbank’s top-down stress tests is that the
Riksbank designs the scenarios and the results are comparable from bank to bank. In
addition, the stress tests are based on detailed data that is comparable with the structure of
the data used in bottom-up stress tests.
Several components needed for stress tests
Apart from banks’ reported data, the Riksbank’s stress tests are based on scenarios with
assumptions on how the banks’ cash flows and liquidity reserves are affected under financial
stress. Based on these input values, the results are then calculated in the form of the banks’
liquidity needs in the scenarios and the time until the liquidity needs arise (see Figure 1). Each
of these parts is presented below.
Figure 1. Conceptual model for the Riksbank’s liquidity stress tests
9 See Basel Committee on Banking Supervision (2017) for definitions and a comparison of top-down and bottom-up stress tests. 10 See Feldkircher et al. (2013), pp. 110-114. 11 ECB (2019). 12 See, for example, Jobst et al. (2017), Schmieder et al. (2012) and Schmitz, S. W. (2015) for more information on cash flow-based liquidity stress tests.
Data
Stress scenario
Calculations Result

THE RIKSBANK’S METHOD FOR STRESS TESTING BANKS’ LIQUIDITY 7
The stress tests are based on data reported by the banks
The Riksbank’s stress tests are based on data reported by the banks in accordance with what
is known as the maturity ladder template, which is included in the COREP regulations and
reported to Finansinspektionen on a monthly basis.13 This reporting consists of two main
parts: contractual cash flows and liquidity reserves.
The cash flows arising if all of the bank’s assets and liabilities are assumed to fall due
when the maturity of the contract expires are recorded in the reporting of contractual cash
flows. In addition, the point in time, which is to say the time interval, in which the cash flows
arise and the balance sheet item from which the cash flows are derived, is reported.14 Annex
A presents the various maturity intervals in Table A2 and contract types in Table A1.
The banks also report the liquid assets they own at the time of reporting. Annex A
presents the reported types of liquid assets in Table A1. A bank may only report liquid assets
that are unencumbered, which is to say assets that the bank may freely dispose of and can
sell to create liquidity. In addition, the banks report future changes in the liquid assets. These
changes could, for example, be due to maturing securities or repurchase agreements (repos)
and reverse repurchase agreements (reverse repos) and could lead to the bank’s liquidity
reserves either increasing or decreasing over different time intervals.
The banks report the data for all currencies added together and for individual significant
currencies.15 Then, a residual item, called other currencies, is calculated as the difference
between the sum of all currencies and the sum of individual significant currencies. The
residual item thus consists of the sum of the currencies not individually counted as significant
currencies for the bank.
Illustrative example of reported data
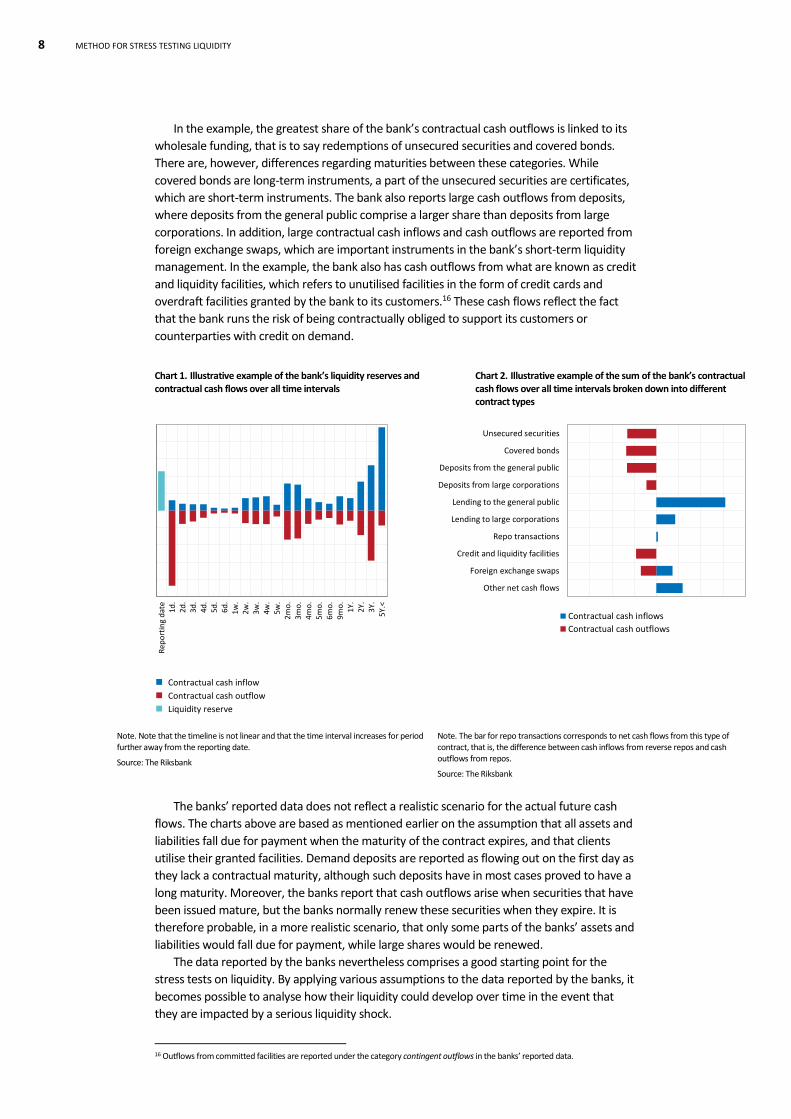
Chart 1 presents an illustrative example of contractual cash flows and liquidity reserves as
reported by the banks. The aim is not to present an individual bank’s actual reported data but
to explain how the reporting template is constructed. The bank’s liquidity reserve at reporting
date is presented by the positive, turquoise column. The columns to the right of this reflect
the bank’s contractual cash flows. The positive, blue columns show the bank’s cash inflows,
while the negative, red columns show the bank’s cash outflows at the various time intervals.
In the example, the bank reports major cash outflows arising after only one day, due to
liabilities falling due for payment. These liabilities mostly consist of demand deposits, which
have no maturity and can be withdrawn by customers at any time. Consequently, these
deposits are reported as a cash outflow from the first time interval. On the other hand, the
bank’s contractual cash outflows arising due to issued securities maturing can be reported in
different time intervals, since the maturity for these varies. At the same time, the bank
reports that the largest cash inflows arise in the last time interval that corresponds to a
maturity of more than five years. This is due to the bank’s assets often having very long
maturities, such as loans to the general public.
The bank’s contractual cash flows shown in Chart 1 can also be presented in other ways.
Chart 2 illustrates the sum of the bank’s contractual cash flows over all time intervals broken
down into different contract types. The blue columns on the right show the cash inflows
while the red columns on the left show the cash outflows.
In the example, most of the bank’s contractual cash inflows come from lending. Seen over
all time intervals, the cash inflows from lending to the general public are significantly greater
than from lending to large corporations (which include non-financial and financial
corporations).
13 The Common Reporting Framework (COREP) is a framework for standardised regulatory reporting for financial institutions active in the EU. See the technical standard for the maturity ladder in Annex XII of Commission Implementing Regulation (EU) 2017/2114 of 9 November 2017 amending Implementing Regulation (EU) No 680/2014 as regards templates and instructions. 14 The banks’ reported data also details contingent outflows deriving from off-balance sheet items, such as outflows from committed facilities and outflows due to downgrade triggers. Cash outflows linked to these contracts are assumed to arise in the time interval when the customer can start utilising these facilities, and not when the contracts’ maturity expires. 15 A significant currency constitutes at least 5 per cent of the bank’s total liabilities.
8 METHOD FOR STRESS TESTING LIQUIDITY
In the example, the greatest share of the bank’s contractual cash outflows is linked to its
wholesale funding, that is to say redemptions of unsecured securities and covered bonds.
There are, however, differences regarding maturities between these categories. While
covered bonds are long-term instruments, a part of the unsecured securities are certificates,
which are short-term instruments. The bank also reports large cash outflows from deposits,
where deposits from the general public comprise a larger share than deposits from large
corporations. In addition, large contractual cash inflows and cash outflows are reported from
foreign exchange swaps, which are important instruments in the bank’s short-term liquidity
management. In the example, the bank also has cash outflows from what are known as credit
and liquidity facilities, which refers to unutilised facilities in the form of credit cards and
overdraft facilities granted by the bank to its customers.16 These cash flows reflect the fact
that the bank runs the risk of being contractually obliged to support its customers or
counterparties with credit on demand.
Chart 1. Illustrative example of the bank’s liquidity reserves and contractual cash flows over all time intervals
Chart 2. Illustrative example of the sum of the bank’s contractual cash flows over all time intervals broken down into different contract types
Note. Note that the timeline is not linear and that the time interval increases for period further away from the reporting date.
Source: The Riksbank
Note. The bar for repo transactions corresponds to net cash flows from this type of contract, that is, the difference between cash inflows from reverse repos and cash outflows from repos.
Source: The Riksbank
The banks’ reported data does not reflect a realistic scenario for the actual future cash
flows. The charts above are based as mentioned earlier on the assumption that all assets and
liabilities fall due for payment when the maturity of the contract expires, and that clients
utilise their granted facilities. Demand deposits are reported as flowing out on the first day as
they lack a contractual maturity, although such deposits have in most cases proved to have a
long maturity. Moreover, the banks report that cash outflows arise when securities that have
been issued mature, but the banks normally renew these securities when they expire. It is
therefore probable, in a more realistic scenario, that only some parts of the banks’ assets and
liabilities would fall due for payment, while large shares would be renewed.
The data reported by the banks nevertheless comprises a good starting point for the
stress tests on liquidity. By applying various assumptions to the data reported by the banks, it
becomes possible to analyse how their liquidity could develop over time in the event that
they are impacted by a serious liquidity shock.
16 Outflows from committed facilities are reported under the category contingent outflows in the banks’ reported data.
-1 000
- 800
- 600
- 400
- 200
0
200
400
600
800
1 000
Rep
ort
ing
dat
e1d
.2d
.3d
.4d
.5d
.6d
.1w
.2w
.3w
.4w
.5w
.2m
o.
3mo
.4m
o.
5mo
.6m
o.
9mo
.1Y
.2Y
.3Y
.5Y
.<
Contractual cash inflow
Contractual cash outflow
Liquidity reserve
Other net cash flows
Foreign exchange swaps
Credit and liquidity facilities
Repo transactions
Lending to large corporations
Lending to the general public
Deposits from large corporations
Deposits from the general public
Covered bonds
Unsecured securities
Contractual cash inflows
Contractual cash outflows
THE RIKSBANK’S METHOD FOR STRESS TESTING BANKS’ LIQUIDITY 9
A scenario corresponds to a set of assumptions
The Riksbank bases its stress tests on various hypothetical scenarios stretching over six
months. The scenarios should reflect a situation where the bank is exposed to an extreme yet
plausible financing and liquidity shock. Such situations can arise for various reasons and
impact banks and banking systems in different ways.
In practice, a scenario reflects a set of weights for various items and maturities related to
cashflows and liquidity reserves. The weights determine both how large a share of the bank’s
contractual cash inflows and cash outflows can be assumed to arise as a consequence of
various contracts falling due for payment in the scenario. In addition, the weights also reflect
so-called haircuts on the liquidity reserves. These haircuts are made as it can be assumed that
the bank’s liquid assets will decline in value under financial stress. The bank can then use the
remaining value of the liquidity reserves to cover cash outflows that arise in the scenario.
The Riksbank can construct and use different types of scenarios
The Riksbank’s method for liquidity stress tests makes it possible to test the banks’ resilience
to various types of stress. This is done by testing a broad set of assumptions, that is, testing
for several different types of scenarios. The stress tests are largely based on assumptions of
extremes, such as the banks having no access at all to certain funding markets.
This staff memo presents two scenarios with different types of stress: one bank-specific
scenario and one system-wide scenario. While the bank-specific scenario reflects a liquidity
shock in an individual bank, the system-wide scenario reflects a shock in the financial system
as a whole. These types of scenarios are common also in other studies.17
In addition to these two scenarios, there are of course other potential assumptions and
scenarios that can be used in liquidity stress tests. For example, one could combine them and
assume that a bank suffers from both bank-specific and system-wide stress at the same time.
Moreover, it is possible to make assumptions in the scenarios based on specific events
arising, for instance, that the foreign exchange (FX) swap market suffers a shock, to test how
this affects the bank's liquidity.
The Riksbank designs its scenarios on the basis of an overall assessment of historical
experiences and expert judgement, and draws inspiration from a number of other studies.
Empirical data would be desirable to support the assumptions, but there is very limited
access to such data. This is because a liquidity shock has often been followed by both banks
and authorities intervening to deflect the negative effects on financial stability.
The assumptions and weights in the Riksbank's scenarios are also compared with so-
called reference scenarios, which consist of assessments in stress tests made by the European
Central Bank (ECB)18, the Italian central bank19 and Schmieder et al. (2012), as well as the
scenario used in LCR20 and a survey carried out by data and analysis firm Liquidatum.21 Table
C1 in Annex C presents a comparison of weights in the Riksbank's scenarios and reference
scenarios.
The ECB has two scenarios where the bank suffers different degrees of bank-specific
stress and which last up to six months. The scenario that the Italian central bank uses extends
over 30 days and is based on the system-wide market stress that arose in Italy during the
euro crisis in 2011. Schmieder et al. (2012) use a scenario that is based on a combination of
historical data and expert assessments, and which should reflect the stress during the global
financial crisis 2008-2009. The scenario used when calculating the LCR should reflect a
combination of bank-specific and system-wide stress. Liquidatum presents two different
scenarios, one bank-specific and one combined, which is based on a survey carried out at
17 See the study by the Basel Committee on Banking Supervision (2013b) for a review of stress tests and scenarios. 18 See ECB (2019). 19 See International Monetary Fund (2013). 20 European Commission Delegated Regulation (EU) 2015/61 of 10 October 2014 to supplement Regulation (EU) No 575/2013 of the European Parliament and the Council with regard to liquidity coverage requirement for credit institutions. 21 See Vander, P. and Vergara, P. (2013) for more information about the survey carried out by Liquidatum.
10 METHOD FOR STRESS TESTING LIQUIDITY
eleven international banks.22 The weights in these scenarios correspond to an aggregate of
the banks’ weights that they use in their internal liquidity stress tests.
Table B1 in Annex B presents the weights used in the bank-specific and system-wide
scenarios described in this report. The weights in the table show the percentage of
contractual cash flows assumed to fall due in the scenario. For instance, a weight of 100 per
cent on row 3, column 2 means that all of the bank’s unsecured securities, that mature during
the time horizon for the stress test, will fall due for payment in the scenario. A weight of 0 per
cent means instead that the bank's liabilities will be refinanced, that is, there will be no cash
outflow from these contracts in the scenario. Similarly, a weight of 0 per cent means that the
bank's assets will not give rise to any cash inflows. Weights for haircuts correspond to the size
of the write-down of the value of the bank’s liquid assets. A haircut of, for instance, 10 per
cent means that only 90 per cent of the liquid assets’ original market value is included in the
bank's liquidity reserve.
Bank-specific scenario
The bank-specific scenario is designed to reflect a liquidity shock for an individual bank. In the
scenario the bank suffers a confidence crisis, for instance due to poorer profitability,
unexpected losses or that the bank's reputation suddenly deteriorates. The bank's customers
and investors thus experience an increase in credit risk, which affects their willingness to do
business with the bank. The bank's access to deposits and the financial markets is thus
negatively impacted, even if the financial markets are otherwise functioning normally.
The fact that the bank is suffering bank-specific stress is expressed in depositors making
large withdrawals of their deposits. Table D1 in Annex D presents examples of historical bank
runs. Withdrawals of deposits here refers both to cash withdrawals and to customers moving
their deposits to other banks they perceive to be less risky, that is to say, the other banks are
perceived as more stable. Withdrawals by the general public begin on the first day and are
then distributed evenly over the first three months of the scenario. Both financial and non-
financial companies, on the other hand, are assumed to make withdrawals more rapidly, over
a month, as they can be assumed to have better insight into the financial markets and better
conditions to quickly reinvest their assets. But it is difficult to assess exactly when in a
stressed scenario one can expect different types of withdrawal to begin, and therefore all
withdrawals are assumed to begin on the first day of stress.
As described above, it is assumed that other banks become aware of the bank's situation
early on. The bank in question therefore loses access to the interbank and repo markets. That
is, the bank no longer has the possibility to borrow money from other banks.
The bank is also assumed to have difficulty renewing its borrowing via market funding,
such as bonds and certificates, as investors will question the bank's viability. However, the
bank can still issue covered bonds to some extent, as the collateral pool behind them will not
be affected to any great extent, as there is no major shock to the economy as a whole.
As the financial markets are on the whole functioning well, there will be no loss of value
on the liquidity reserves. Similarly, it is assumed that the bank's customers only use a small
part of their credit and liquidity facilities, such as credit cards and overdraft facilities, with the
bank, as the stress is not assumed to be broadly spread throughout the economy.
The starting-point for the Riksbank’s stress tests is that the bank shall be able to manage
such a liquidity shock without reducing its lending to the general public. If the bank does not
manage this, it means that the shock could lead to a credit crunch. This would in turn have
negative effects on household consumption, on corporate investments and the conditions for
companies to operate. Such a development could lead to negative consequences for the real
economy. So even if the bank is exposed to a severe liquidity shock in the stress tests, it is
assumed that it will need to maintain its lending to the general public. Therefore, banks’
existing lending to the general public is kept unchanged in the Riksbank’s scenarios, which
22 Two of the banks in Liquidatum’s survey have substantial operations in Sweden.

THE RIKSBANK’S METHOD FOR STRESS TESTING BANKS’ LIQUIDITY 11
means that they issue the same amounts of new loans as the amounts repaid by their
customers.23
As a result of the bank's vulnerable situation and that its ability to repay is being
questioned by its counterparts, the bank has problems entering into FX swap agreements.
This is explained by the counterparties demanding higher compensation, that is, to be paid
more, given the higher credit risk. It is thus assumed in the scenario that the bank's costs for
entering into FX swaps will be so high that it chooses not to renew its existing contracts when
they expire. It is therefore assumed that the banks’ existing FX swaps fall due when they
mature (see Figure 2 for a schematic illustration of cash flows in an FX swap). One possible
assumption could have been that the bank would still have the opportunity to exchange
currency on the spot market. However, spot market transactions mean that the bank takes
increased exchange rate risks, which in turn risks destabilising the bank further. Exchanges on
the spot market are therefore not allowed in the stress tests.
On the whole, the Riksbank's assumptions regarding the effects this type of stress has on
the banks are close to those of other studies (see Table C1 in Annex C). But the Riksbank
assumes in its scenario that the outflows of deposits from the general public not covered by
the deposit guarantee are greater than in several reference scenarios. This is motivated by
the depositors in Swedish banks currently having good technical conditions to quickly move
money between banks and thereby make large withdrawals as soon as a bank is subjected to
financial stress.
Some difference can also be observed with regard to the assumption on covered bonds.
The Riksbank makes a milder assumption that 70 per cent mature and the remaining ones are
refinanced, instead of 100 per cent maturing. As mentioned earlier, this assumption is based
on investors still being willing to own covered bonds during bank-specific stress, as the bonds’
underlying collateral volume is largely detached from the bank's own credit rating.
The Riksbank also has a somewhat milder assumption than the reference scenarios with
regard to outflows from credit facilities. This is because the bank-specific scenario is not
assumed to involve a shock to the economy as a whole, which thus does not motivate the
bank’s customers and counterparts requiring funding from these facilities.
System-wide scenario
The system-wide scenario is designed to reflect stress that affects the entire financial system.
Confidence in the participants in the financial system declines substantially. The stress can
either be concentrated to Sweden or come from abroad and spread internationally, for
instance as the result of a sovereign debt crisis, several price falls on the housing market or a
systemically important bank failing. The scenario is assumed to entail a considerable increase
in unease on the financial markets and a deterioration in real economic development.
The consequences will be that investors feel increasing uncertainty over the banks’
financial situation and therefore stop providing the banks with financing. Thus, the banks lose
the possibility to renew their borrowing by issuing securities. This also applies to covered
bonds as the deterioration in real economic prospects undermines the credit worthiness of
the bonds’ underlying collateral pool. Similarly, the value of the assets in the liquidity reserve
declines as a result of the market turbulence.
But as the general public have difficulty in knowing where their investments are safe or
not so safe, there are not such large withdrawals of deposits as in the bank-specific scenario.
The withdrawals made are therefore assumed to be in the form of cash withdrawals, unlike
the bank-specific scenario, where the customers can transfer deposits to other banks
perceived as less risky.
The assumption regarding lending to the general public, on the other hand, is the same as
in the bank-specific scenario. In other words, the banks’ total lending is assumed to remain
23 For technical reasons, the assumption that all lending to the general public is renewed means that no inflow arises from interest payments received. However, this does not mean that the Riksbank assumes that the general public has been affected by the crisis and lost its ability to repay. The reason is that data does not allow us to distinguish interest payments.

12 METHOD FOR STRESS TESTING LIQUIDITY
unchanged, as a different assumption could entail a credit crunch in the economy as a whole.
This means that no inflows arise from such lending.
The banks’ customers are negatively affected by a deterioration in real economic
conditions, however, which leads to them needing to use credit and liquidity facilities granted
to them by the bank to a greater extent. This is partly because the banks’ corporate
customers are assumed to have such large liquidity problems that they use the facilities to
pay their debts. This means that the banks need to lend money to customers, causing further
cash outflows in the scenario.
The banks are still assumed to have the opportunity to enter into FX swap agreements in
the system-wide scenario and the banks can thus renew existing FX swaps that fall due. The
banks are thus assumed to continue supporting their customers with short-term financing in
foreign currency through FX swaps, as the customers do not have the opportunity to turn to a
less risky alternative as a result of the ongoing system-wide stress. Given the Swedish banks’
large use of FX swaps, however, the assumptions regarding these instruments require special
consideration, as described below.
If a bank has a liquidity surplus in a currency, it is assumed that it could use the surplus to
cover deficits in other currencies in the system-wide scenario.24 This assumption is based on
the bank being assumed to have access to the FX swap market and thereby being able to
exchange currency without taking exchange rate risks.
Assumptions on FX swaps are important for stress tests
Banks active in Sweden finance themselves to a large extent in foreign currency. The banks
need financing in foreign currencies to be able to lend to customers in foreign currencies, for
example lending in euros to the general public in the Baltic countries, or to Swedish
corporations with operations abroad needing foreign currency. The banks also need financing
in foreign currency to finance liquidity reserves in the currencies used in the countries where
the banks conduct their operations, for instance, to attain a satisfactory level of LCR. A further
purpose is that the banks can exchange foreign currency for Swedish krona (or other Nordic
currencies) with their customers.25 Some of the banks’ customers, for instance insurance
companies, demand foreign currency to hedge their investments in foreign assets. When the
banks swap foreign currency for krona in FX swaps, the customers gain access to the foreign
financing they need, while the banks in their turn obtain financing in Swedish krona. To be
able to carry out these FX swaps, the banks use short-term securities funding in foreign
currency.
As the banks use short-term FX swaps to a great extent, the assumptions as to whether
these instruments will fall due or be renewed are of considerable significance for the
outcomes in the stress tests when the results are reported in different currencies. By making
various assumptions in the scenarios, the stress tests provide a possibility to test the effects
of various extremes.
Figure 2 illustrates in greater depth how an FX swap functions. In the example, the FX
swap entails the bank exchanging foreign currency for Swedish krona with its counterpart on
the spot market, but also the bank being obliged to repay krona when the FX swap matures.
At the same time, the counterpart is obliged to repay the foreign currency to the bank. When
an FX swap falls due, the bank has an inflow of foreign currency and an outflow of Swedish
krona.
24 The surplus is divided proportionately over the deficit, which means that all of the surplus is used to some extent to cover potential deficits in the scenario. 25 Hilander, I. (2014).

THE RIKSBANK’S METHOD FOR STRESS TESTING BANKS’ LIQUIDITY 13
Figure 2. Schematic image of cash flows in an FX swap
Note. An FX swap is an agreement between two parties to simultaneously buy and sell one currency against another on two separate points in time.
Under the assumption that FX swaps fall due in the stress test, the banks will have cash
inflows in foreign currency that can then be used to repay their debts in the form of short-
term securities in foreign currencies. At the same time, they have outflows of Swedish krona
in the FX swaps. If one instead assumes that the FX swaps are renewed, no cash flows arise
from the FX swaps at the time of the ordinary maturity, that is, the bank does not have cash
inflows of foreign currency, and not does it have cash outflows of Swedish krona. This
therefore has a positive effect on the banks’ liquidity in krona, but at the same time a
negative effect on the banks’ liquidity in foreign currencies, as they do not receive cash
inflows that they could otherwise have used to cover cash outflows from maturing short-
term securities in foreign currency. The assumptions as to whether the banks’ FX swaps will
be renewed or fall due will thus have an effect on how the results in the stress tests shift
between currencies.
In the bank-specific scenario it is assumed, as mentioned earlier, that all FX swaps fall due
for payment when they mature. This means that it is reasonable to expect liquidity needs of
Swedish krona, while the liquidity needs with regard to foreign currency can be expected to
be lower.
In the system-wide scenario, it is assumed that the banks renew all their existing FX
swaps. The banks therefore do not have the inflows of foreign currency they would otherwise
have experienced if the FX swaps had been assumed to mature. It is thus reasonable to
expect relatively large liquidity needs in foreign currency in the system-wide scenario.
All in all, it is difficult to make qualified assumptions about whether banks have the
opportunity to convert currency at a reasonable price under stress. The stress tests are
therefore based on binary assumptions with the purpose of testing for the effects of different
types of maturity. However, in reality it is possible that the outcome will be somewhere
between the extremes presented here.
Liquidity needs arise before the liquidity reserves run out
As mentioned earlier, the banks have liquidity reserves that they can use to cover cash
outflows that may arise in the event of financial stress. One possible assumption in the
Riksbank's stress tests would have been for the banks to use all of their liquidity reserves to
cover their cash outflows, or that they can use the liquidity reserves down to a lowest level
Bank
Swap counterparty
Foreigncurrency
Swedish krona
Bank
Swap counterparty
Foreigncurrency
Swedishkrona
Start Ending

14 METHOD FOR STRESS TESTING LIQUIDITY
required to conduct their day-to-day activities.26 But from the Riksbank's perspective, a
liquidity need can arise earlier than this. This is because liquidity problems at one or more
banks risk spreading and disrupting the financial system as a whole. As the functioning of the
financial system deteriorates, the costs of the liquidity shock can also spread to the real
economy.
On the domestic market these effects can also be reinforced by the banks themselves
selling large volumes of liquid assets in Swedish krona to cover their liquidity deficit, which
can lead to rising risk premiums and, for instance, higher loan costs.
From the Riksbank's perspective in stress tests, therefore, a bank or the banking system as
a whole, has liquidity needs when a liquidity shock is assessed to have consequences for the
stability of the financial system. Liquidity needs can therefore arise before a bank has used all
of its liquidity reserves. The stress tests therefore need to have a measure of when a bank’s
liquidity situation is so vulnerable that confidence in the bank on the financial markets and
among the general public declines, and extraordinary measures may be required to avert
negative contagion effects.
The earlier mentioned LCR is one of the most common measures of a bank's resilience to
liquidity shocks. It is plausible that falling LCRs in a bank would coincide with confidence in the
bank declining. This is because the financial markets would have become aware that the
bank's liquidity position has deteriorated as it has been forced to use large volumes of liquid
assets to cover the outflows of cash. In other words, LCR gives a good estimate of how the
market may assess the bank's liquidity situation.
The Riksbank has therefore chosen to use the LCR to state the level where the market
could lose confidence in the bank, and where there is a risk that the costs of the liquidity
shock will spread throughout the economy. This assumption thus means that the banks can
use their liquidity reserves to cover cash flows even after this level, but that liquidity needs
will arise.
It is difficult to determine at exactly which level of LCR the needs will arise, however, and
there is limited empirical research to support any assumption. It is assumed in the stress test
that a bank will have liquidity needs when the LCR falls below 75 per cent in any individual
currency.27 But it is ultimately a matter of judgement, and there is no correct answer as to
what is the right limit. To obtain an idea of how sensitive the results are to the choice of limit,
the results are also calculated for several alternative limits, such as LCR of 0, 50 and 100 per
cent.28
Several calculations are required to produce results
Based on the bank’s reported data and what is assumed to happen in the stressed scenarios,
it is possible to perform stress tests. By calculating the stressed (i.e. weighted) in- and
outflows of cash per time interval and in each respective currency, a stressed net cash flow is
obtained. Together with the original liquidity reserve, this gives the banks’ liquidity position
over time. This makes it possible to estimate the bank’s liquidity needs and when they arise.
These calculations are described in more detail below.
Calculation of liquidity position
The bank’s liquidity position corresponds to its liquidity assets at each point in time, 𝑡, in the
scenario and is defined as:
𝐿𝑖𝑞𝑢𝑖𝑑𝑖𝑡𝑦 𝑝𝑜𝑠𝑖𝑡𝑖𝑜𝑛𝑡 = 𝐿𝑖𝑞𝑢𝑖𝑑𝑖𝑡𝑦 𝑝𝑜𝑠𝑖𝑡𝑖𝑜𝑛0 − 𝐶𝑢𝑚𝑢𝑙𝑎𝑡𝑖𝑣𝑒 𝑛𝑒𝑡 𝑐𝑎𝑠ℎ 𝑓𝑙𝑜𝑤𝑡
26 A bank needs liquid assets on a daily basis to provide collateral for the intraday loans the bank needs to fulfil its role as payment intermediary. 27 When a bank has an LCR below 75 per cent in any currency as a baseline in the stress test, then liquidity needs arise immediately. 28 LCR is calculated as the bank's liquidity reserve as a percentage of stressed net cash outflows over a 30-day period. The ratio is based on a set of regulated weights and calculations. See European Commission Delegated Regulation (EU) 2015/61 of 10 October 2014 to supplement Regulation (EU) No 575/2013 of the European Parliament and the Council with regard to liquidity coverage requirement for credit institutions for information on regulatory weights for calculating LCRs.

THE RIKSBANK’S METHOD FOR STRESS TESTING BANKS’ LIQUIDITY 15
The bank’s liquidity position today depends on what its net cash flows looked like yesterday.
At the start of the scenario, (at 𝑡 = 0) the liquidity position is thus equal to the bank’s initial
liquidity reserve. To calculate the bank’s liquidity position at another point in time, 𝑡, its total
net cashflows up to the point in time 𝑡, i.e. the bank’s cumulative net cashflow, must be taken
into account. This is calculated as:
𝐶𝑢𝑚𝑢𝑙𝑎𝑡𝑖𝑣𝑒 𝑛𝑒𝑡 𝑐𝑎𝑠ℎ 𝑓𝑙𝑜𝑤𝑡 = ∑ 𝑁𝑒𝑡 𝑐𝑎𝑠ℎ 𝑓𝑙𝑜𝑤𝑠
𝑡
𝑠=0
𝑁𝑒𝑡 𝑐𝑎𝑠ℎ 𝑓𝑙𝑜𝑤𝑠 = 𝑇𝑜𝑡𝑎𝑙 𝑐𝑎𝑠ℎ 𝑜𝑢𝑡𝑓𝑙𝑜𝑤𝑠 − 𝑇𝑜𝑡𝑎𝑙 𝑐𝑎𝑠ℎ 𝑖𝑛𝑓𝑙𝑜𝑤𝑠
At each point in time, the bank’s cash flow is a product of two factors. The first factor is the
amounts of assets and liabilities that can contractually mature or can create cash flows in
some other way. The second factor is the weight that specifies the share of these assets and
liabilities that is not renewed or extended and thus actually creates cash flows in the
scenario.29 If the bank has larger outflows than inflows during the stressed period, it is
assumed that it covers the deficit in liquidity by using its liquidity reserves. The banks’ liquidity
reserves therefore decrease over time in the stress tests as the outflows are greater than the
inflows, which is illustrated by falling liquidity positions.
Calculation of limit
As mentioned above, a level of 75 per cent LCR is used as a limit for when a bank has liquidity
needs in each respective currency. This limit level is calculated by stressing the banks’ cash
flows in a similar way to how the Riksbank’s liquidity stress tests are calculated, and is defined
as:
𝐿𝑖𝑚𝑖𝑡 = 0,75 × 𝑠𝑡𝑟𝑒𝑠𝑠𝑒𝑑 𝑛𝑒𝑡 𝑐𝑎𝑠ℎ 𝑜𝑢𝑡𝑓𝑙𝑜𝑤 𝑖𝑛 𝐿𝐶𝑅𝑡
But the weights used to calculate stressed net cash outflows in LCR differ from those used by
the Riksbank in the stress tests. Moreover, the structure of the underlying data in LCR differs
from the structure in the data used by the Riksbank in the stress tests. Certain adaptations
are therefore required to calculate the banks’ stressed net cash outflows in LCR in the
stressed scenarios.
LCR is calculated looking forward over a 30-day period. It is therefore only possible to
calculate a stressed net cash outflow in LCR at those points in time at which it is possible to
infer contractual cash flows over exactly 30 days ahead in the banks’ reported data.30
Furthermore, the cash flows that have already occurred in the stress tests up until a new
estimated LCR is calculated need to be taken into account. As a different data format is used
for the calculation of LCR, the regulatory LCR weights need to be adapted to the structure in
the banks’ reported data. Once this has been done, the weights can be applied to the data,
and a stressed net cash outflows in LCR can be calculated. Otherwise, the estimated stressed
net cash outflows in LCR are calculated in the same way as the regulatory LCR measure,
which means that the stressed outflow may be no more than 75 per cent of the stressed
outflow.
Calculation of liquidity needs
To calculate the liquidity needs at a particular point in time, the bank's liquidity position is put
against the calculated limit. If the bank’s liquidity position is higher than the limit, this means
29 The stress tests are based on assumptions that the maturity of renewed assets and liabilities is extended for one year. So, for example, a covered bond maturing in December 2019 is assumed to be refinanced to a new maturity date in December 2020. As the stress tests stretch over six months, the consequence of this is that the new maturity date will be outside the time horizon covered by the stress tests. 30 A forward-looking 30-day period can be observed at the time interval for the first day, after one week, four weeks, two months, three months, four months and five months. The most recently calculated limit level is used for time intervals between these.
16 METHOD FOR STRESS TESTING LIQUIDITY
it has sufficient liquid assets to attain an LCR in excess of 75 per cent. This means that no
liquidity needs arise. On the other hand, if the bank has a liquidity position that is lower than
the limit, liquidity needs will arise, and the needs will then be the difference between the
limit and the bank's liquidity position. The liquidity needs can therefore be calculated using
the following formula:
𝐿𝑖𝑞𝑢𝑖𝑑𝑖𝑡𝑦 𝑛𝑒𝑒𝑑𝑡 =
= max (0,75 × 𝑆𝑡𝑟𝑒𝑠𝑠𝑒𝑑 𝑛𝑒𝑡 𝑐𝑎𝑠ℎ 𝑜𝑢𝑡𝑓𝑙𝑜𝑤 𝑖𝑛 𝐿𝐶𝑅𝑡 − 𝐿𝑖𝑞𝑢𝑖𝑑𝑖𝑡𝑦 𝑝𝑜𝑠𝑖𝑡𝑖𝑜𝑛𝑡 , 0)
This means that the bank’s liquid assets, i.e. liquidity reserves, in LCR are replaced by the
bank’s liquidity position in the Riksbank’s calculations.31
Compilation of results
By calculating the liquidity position and limit level, a bank’s liquidity needs can be estimated
at each time interval in the stressed scenarios. The question then is how each bank should be
represented in the results. If the result of stress tests based on the most recent observation
of reported data is chosen, the risk is that one or more of the banks on that particular
occasion had an abnormally good or bad liquidity situation. The results may therefore be
misleading. One option is to instead use a historical average of the banks’ reported data in
the stress tests. But then there is a risk of disregarding the outliers in reported data, i.e. the
occasions when the banks are exposed to higher liquidity risk.
The structure of the banks’ assets and liabilities will also change. Over time, a bank can,
for example shift assets or liabilities between maturities or from one source of funding to
another. As a result, the bank can have better or worse resilience to liquidity shocks.
Moreover, the banks have seasonal variations in their balance sheets which mean that they
are more or less resilient at different times of the year.
Therefore, the Riksbank performs stress tests on the last twelve months of reported data
for each bank.32 One way to present the results is to show the results for the monthly
observation of data that corresponds to the 90th percentile with regard to when liquidity
needs arise for each individual bank. In practice, this means that the results reflect the month
when the bank has had its second-worst resilience to liquidity shocks over the past year.33
The results are hence not based on either an extreme or an average observation.
With this method, it means that the banks can be represented by observations from
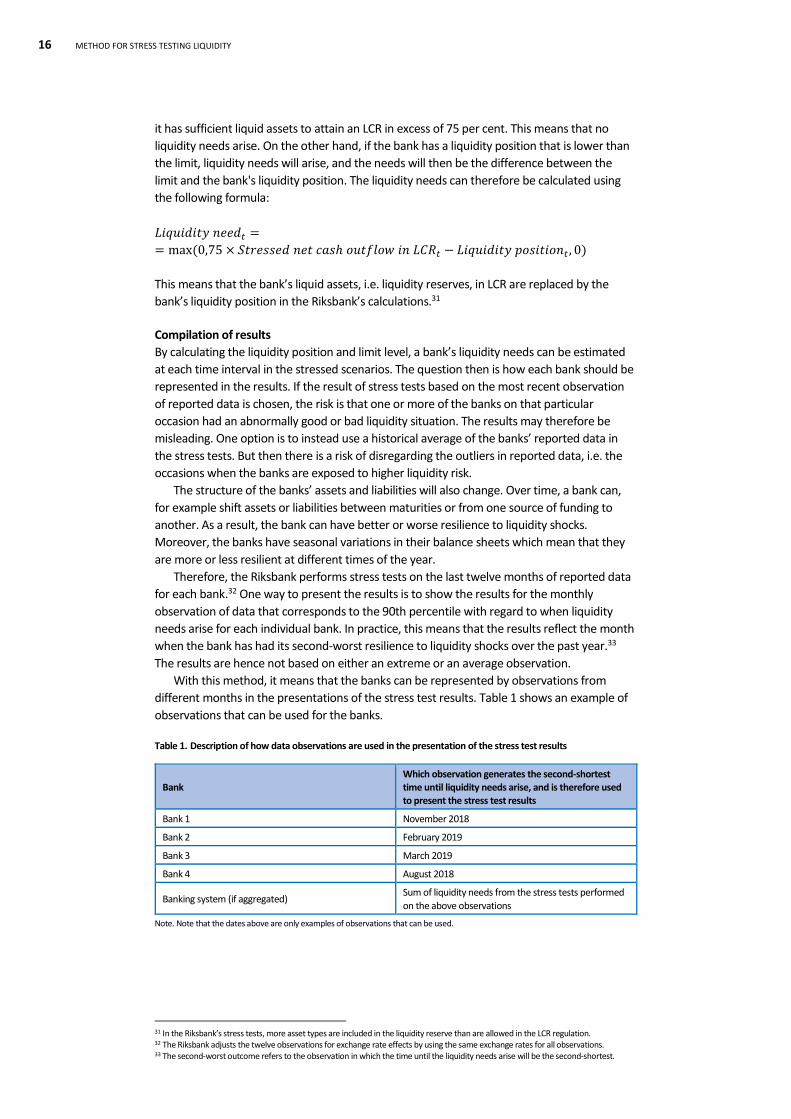
different months in the presentations of the stress test results. Table 1 shows an example of
observations that can be used for the banks.
Table 1. Description of how data observations are used in the presentation of the stress test results
Bank Which observation generates the second-shortest time until liquidity needs arise, and is therefore used to present the stress test results
Bank 1 November 2018
Bank 2 February 2019
Bank 3 March 2019
Bank 4 August 2018
Banking system (if aggregated) Sum of liquidity needs from the stress tests performed
on the above observations
Note. Note that the dates above are only examples of observations that can be used.
31 In the Riksbank’s stress tests, more asset types are included in the liquidity reserve than are allowed in the LCR regulation. 32 The Riksbank adjusts the twelve observations for exchange rate effects by using the same exchange rates for all observations. 33 The second-worst outcome refers to the observation in which the time until the liquidity needs arise will be the second-shortest.
THE RIKSBANK’S METHOD FOR STRESS TESTING BANKS’ LIQUIDITY 17
Results of the liquidity stress tests
The section below explains how the results of the stress tests are presented and how they
can be interpreted. The results presented are just illustrative examples and are not analysed
in depth.
By setting the banks’ liquidity reserves against their net cash outflows, when and how
money starts to flow out of the banks can be observed over time. This can be observed per
date and per currency. It enables an analysis of the size of the liquidity needs the bank has
and the speed at which they arise. Cash inflows and cash outflows can also be broken down,
which makes it possible to see the outcomes in the scenarios by different contracts,
instruments and currencies.
How should the stress test results be interpreted?
Chart 3 illustrates an example of how the development of the liquidity needs for one or more
banks can look in a stressed scenario over six months. The purpose is not to present actual
outcomes, but to explain how the results can be presented. At each point in time, the total
liquidity needs up to that point, i.e. the cumulative liquidity needs, are presented.34 Each bar
shows the total liquidity needs for different currencies, represented by different colours, at
the limit of 75 per cent LCR. In the example, liquidity needs arise as early as during the first
week, then rise relatively quickly over three months and then gradually up to six months.
After six months, the total liquidity needs have grown to SEK 1,000 billion in the example. The
currency for which the largest requirement has arisen in the example is the US dollar (red),
which is responsible for around 60 per cent of the total requirement. The krona requirement
(blue) and other currencies (orange) amount to around 15 per cent and 20 per cent each. The
remaining percentage of the requirement is in euros (light blue).
In the example in Chart 3, liquidity needs arise as early as during the first week, despite
the banks having liquidity reserves. This may be due to the banks having relatively small
liquidity reserves in certain currencies and to LCRs already being below 75 per cent to start
with, or falling rapidly to low levels.
If the limit for when the needs arise had been either 100, 50 or 0 per cent LCR, the total
liquidity needs would have been different. At a limit level of 100 per cent LCR, total liquidity
needs would have been higher while it would be lower with a limit level of 50 per cent LCR
and even lower with a limit level of 0 per cent LCR.
34 If the liquidity needs at two consecutive points in time are of the same size, no further liquidity need has arisen at the later point in time. If the liquidity needs are lower at a later point in time, this may be due to an improved liquidity position and a lower limit level.

18 RESULTS OF THE LIQUIDITY STRESS TESTS
Chart 3. Illustrative example of liquidity needs up to six months SEK billion
Note. The cumulative liquidity needs over time are shown.
Source: The Riksbank
Chart 4 shows an illustrative example of a decomposition of cash flows after six months of
stress and the liquidity reserves used by banks to cover the liquidity needs that arise. The
chart shows total cash flows from various contract types broken down into different
currencies. Positive values (right) lead to a reduction in the liquidity need while negative
values (left) lead to an increase. The sum of the bars in the chart therefore represents the
liquidity needs that arose after six months, that is the last bar on the far right of Chart 3
above.35 The chart shows the main categories that have the greatest impact on the liquidity
needs while the remaining categories are added together in Other net flows. Used liquidity
reserves state how much of the liquidity reserve has been used over six months excluding
liquidity reserves needed to maintain an LCR of at least 75 per cent to the end of the six
month period. It is also possible to see the cash flow per currency for each contract type. The
decomposition in Chart 4 thus shows in detail which contract types and currencies contribute
to the bank’s liquidity needs.
The decomposition shows that the banks use parts of their liquidity reserves to reduce
their liquidity needs. In addition, they have some lending which is repaid and creates cash
inflows. But the banks also have large cash outflows as a result of issued securities maturing
and customers withdrawing their deposits. FX swaps create neither inflows nor outflows in
this example. This is due to the assumption that the banks regularly renew their FX swaps in
the underlying scenario on which the stress test is based.
In the example in Chart 4, the outflows in dollars are driven a great deal by principal
payments/redemptions from unsecured securities and deposits from large companies. The
need in krona is primarily driven by covered bonds maturing and by the general public and
large corporations withdrawing parts of their deposits.
35 Note that the liquidity needs in Chart 4, which correspond to the sum of the bars, are expressed as a negative in contrast to Chart 3 where they are expressed as a positive.
0
200
400
600
800
1 000
1 200
1w. 2w. 3w. 4w. 5w. 2mo. 3mo. 4mo. 5mo. 6mo.
SEK
USD
EUR
Other currencies

THE RIKSBANK’S METHOD FOR STRESS TESTING BANKS’ LIQUIDITY 19
Chart 4. Illustrative example of decomposition of cash flows during six months by contract types SEK billion
Note. Used liquidity reserves correspond to the surpluses of reserves that the banks have over and above the reserves needed to maintain an LCR of 75 per cent until the end of the six month horizon. FX swaps refers to the net cash flows in individual currencies. Repo transactions corresponds to net cash flows from this type of contract, that is, the difference between cash inflows from reverse repos and cash outflows from repos. The chart only shows the main categories that have the greatest impact on the liquidity needs while remaining categories are added together in other net flows. Note that the liquidity needs, which correspond to the sum of the bars, are expressed as a negative in contrast to Chart 3, where they are expressed as a positive.
Source: The Riksbank
The stress tests can be expected to have different outcomes for different types of banks The banks’ results in the stress tests are partly contingent on the structure of their financing, that is, what sources of funding they use, and the maturities of their debts. The results also depend on the amount of liquidity reserves the banks hold and the distribution of different types of liquid asset in the liquidity reserves.
Banks with large liquidity reserves, a small share of short-term market funding and a large
share of stable deposits tend to have good results in the stress tests. A large liquidity reserve
enables potentially unexpected liquidity deficits to be covered, at the same time as stable
long-term financing means that the bank has fewer cash outflows in the near term to cover.
In scenarios where the banks are not assumed to have the possibility of transferring a surplus
in one currency to cover a deficit in another, they also benefit from having a good match of
maturities in the assets and liabilities in the respective currencies.
The stress tests can both over- and underestimate risks and liquidity needs
While the stress tests provide valuable information about potential liquidity needs and when
these may arise, it is important to bear in mind that the results can be both over- and
underestimated. Economic and financial crises can take place in many different ways and it is
therefore difficult to say what the effects of a crisis might be, and how these should be
modelled.
There are some aspects that can affect the outcomes more than others. One of these is
that the stress tests do not consider any measures the banks or public authorities can take to
reduce the risks of cash outflows in the face of a liquidity shock. This means that the liquidity
needs can be overestimated as a result of other measures by banks or public authorities not
being considered in the model.
In addition, there are a number of factors to consider when the results for individual
banks are set against the results for the system as a whole. One such factor is that outflows of
liquidity in domestic currency must be placed somewhere in the Swedish financial system.
The stress tests do not currently include assumptions about how liquidity flows between
institutions in the stressed scenarios, which could overestimate the liquidity needs in SEK. On
-1 500 -1 000 - 500 0 500 1 000 1 500
Other net cash flows
Foreign exchange swaps
Credit and liquidity facilities
Repo transactions
Lending to large corporations
Lending to the general public
Deposits from large corporations
Deposits from the general public
Covered bonds
Unsecured securities
Used liquidity reserves
SEK USD EUR Other currencies
20 CONCLUSION
the other hand, for example, investors may sell back their bond holdings to the banks, which
exposes the banks to more stress than in the scenarios. The fact that the stress tests do not
consider this type of measure can mean that they both overestimate and underestimate the
banks’ liquidity needs.
Conclusion
Stress tests of liquidity are a flexible means of analysing the banks’ liquidity risks. They can
mainly be used to estimate potential liquidity needs that may arise in a crisis. By testing
different assumptions and extremes, lessons can be learned about the resilience of the banks
against liquidity shocks.
However, there are no definitive answers in stress tests; instead the assumptions are
ultimately a matter of judgement. Neither is the data to which the Riksbank has access as
fully detailed as the data the banks themselves use for their internal stress tests. Moreover, it
is important to interpret the results of the stress tests with an analytical eye, as they can both
overestimate and underestimate the effects of a liquidity shock.
There are several areas where the Riksbank's method can be developed. At present, the
Riksbank’s stress tests does not take full consideration of the interconnectedness and
contagion risks present in the Swedish financial system. This is because the data lacks
detailed information on the counterparties for the individual banks’ contractual cash flows.
One possibility would be to supplement the data with, for instance, information on how the
Swedish banks are exposed to one another and their joint exposures with regard to sources
of financing. System-wide risks and counterparty risks could thereby be identified and
implemented in the methodology.
The stress tests could also become more dynamic. For example, they could be
constructed to evaluate the effects of the measures adopted by banks and authorities to
counteract a liquidity shock.
Furthermore, the liquidity stress test can be incorporated as a satellite module to the
Riksbank’s solvency stress tests, similarly to stress tests conducted by OeNB and the Bank of
Canada, for example.36, 37 As there is a connection between a bank’s solvency and its liquidity
position, the model would then capture the liquidity effects of impaired solvency. Solvency
crises generally have a longer time horizon in comparison with liquidity crises, which could
place further demands on the model.
36 See Buncic et al. (2019) for a description of the Riksbank’s stress tests of capital. 37 See Feldkircher et al. (2013) and Bank of Canada (2014) for examples of stress tests of capital that incorporate liquidity aspects.

THE RIKSBANK’S METHOD FOR STRESS TESTING BANKS’ LIQUIDITY 21
References
Bank of Canada (2014), “Stress testing the Canadian banking System: a System-wide
approach”.
Basel Committee on Banking Supervision (2013a), “Basel III: The Liquidity Coverage Ratio and
liquidity risk monitoring tools”, Bank for International Settlements, January 2013.
Basel Committee on Banking Supervision (2013b), “Liquidity stress testing: a survey of theory,
empirics and current industry and supervisory practices”, Bank for International Settlements,
October 2013.
Basel Committee on Banking Supervision (2014), “Basel III: the net stable funding ratio”, Bank
for International Settlements, October 2014.
Basel Committee on Banking Supervision (2017), “Supervisory and bank stress testing: range
of practices”, Bank for International Settlements, December 2017.
Buncic, D., Li, J., van Santen, P., Wallin, P. and Winstrand, J. (2019), “The Riksbank’s method
for stress tests of bank’s capital”, Staff Memo. Sveriges Riksbank.
ECB (2019), “ECB Sensitivity analysis of Liquidity Risk – Stress Test 2019”.
Feldkirscher, M., Fenz, G., Ferstl, R., Krenn, G., Neudorfer, B., Puhr, C., Reininger, T., Schmitz,
S. W., Schneider, M., Siebenbrunner, C., Sigmund, M. and Spitzer, R. (2013), “ARNIE in Action:
The 2013 FSAP Stress Test for the Austrian Banking System, Financial Stability Report.
Oesterreichische Nationalbank.
Hilander, I. (2014), “Short-term funding in foreign currency by major Swedish banks and their
use of the short-term currency swap market”, Economic Review 1(3), pp. 27–49. Sveriges
Riksbank.
International Monetary Fund (2013), “Italy – Technical note on stress testing the banking
sector”, Financial Sector Assessment Program in Italy, IMF Country Report No. 13/349,
International Monetary Fund, Washington, D.C., December 2013.
Jobst, A. A., Ong L. L. and Schmieder, C. (2017), “Macroprudential Liquidity Stress Testing in
FSAPs for Systemically Important Financial Systems”, IMF Working Paper WP/17/102, May
2017.
Roszbach, K., Pettersson, M., Vander, D. and Wissén, P. (2016), “Swedish banks’ structural
liquidity risks”, Riksbank Studies, November 2016, Sveriges Riksbank.
Sveriges Riksbank (2010), “Financial Stability Report 2010:2”, Sveriges Riksbank.
Sveriges Riksbank (2016), “The Swedish Financial Market”, Sveriges Riksbank.
Sveriges Riksbank, (2017), Consultation response to the draft referral to the Council on
Legislation regarding the Riksbank’s financial independence and balance sheet, April, 2017.
Sveriges Riksbank (2019), ”Basis for decision – Slight reduction in the gold and foreign
exchange reserve”, March 2019.

22 REFERENCES
Schmieder, C., Hesse, H., Neudorfer, B., Puhr, C. and Schmitz, S. W. (2012), “Next Generation
System-Wide Liquidity Stress Testing”, IMF Working Paper WP/12/3, January 2012.
Schmitz, S. W. (2015), “Macroprudential Liquidity Stress Tests”, in Bonner, C., Hilbers, P., van
Lelyveldt, I. (eds.), Liquidity Risk Management and Supervision, Risk Books, London 2015, pp.
237–264.
Vander, P. and Vergara, P. (2013), “Peer survey – Definitions, methodology, liquid asset
buffers and scenario assumptions”, Liquidatum Ltd.
THE RIKSBANK’S METHOD FOR STRESS TESTING BANKS’ LIQUIDITY 23
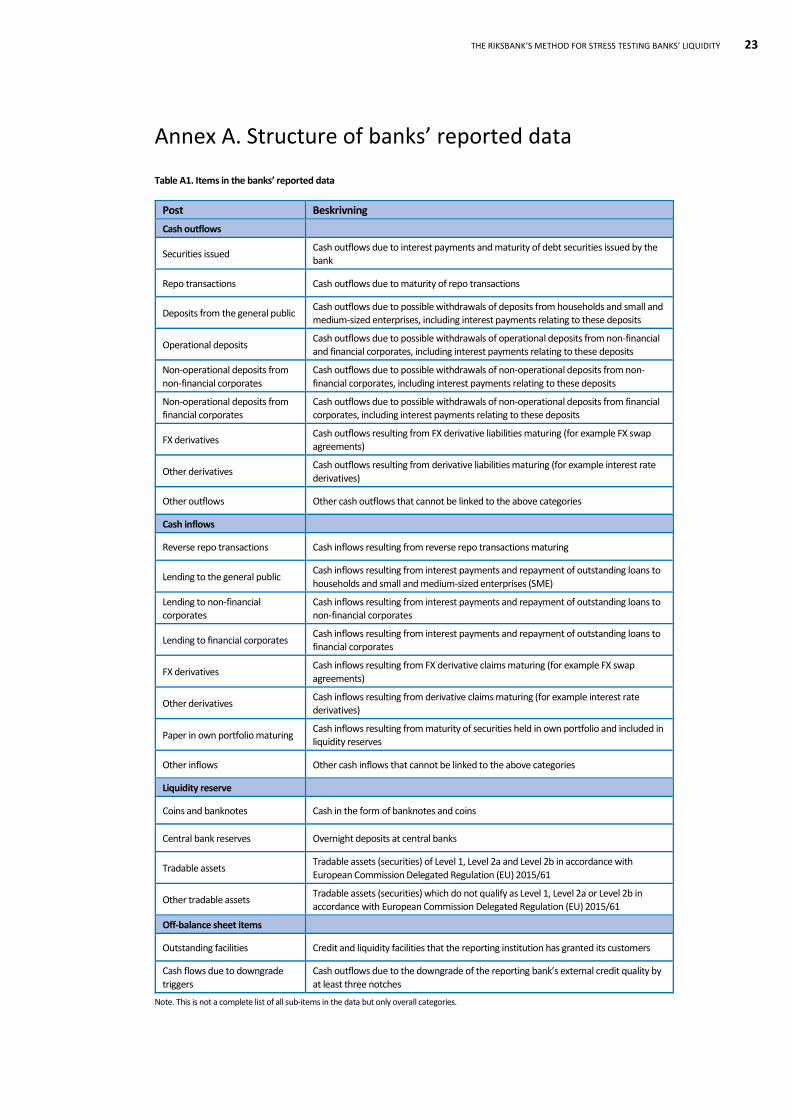
Annex A. Structure of banks’ reported data
Table A1. Items in the banks’ reported data
Post Beskrivning
Cash outflows
Securities issued Cash outflows due to interest payments and maturity of debt securities issued by the bank
Repo transactions Cash outflows due to maturity of repo transactions
Deposits from the general public Cash outflows due to possible withdrawals of deposits from households and small and medium-sized enterprises, including interest payments relating to these deposits
Operational deposits Cash outflows due to possible withdrawals of operational deposits from non-financial and financial corporates, including interest payments relating to these deposits
Non-operational deposits from
non-financial corporates
Cash outflows due to possible withdrawals of non-operational deposits from non-
financial corporates, including interest payments relating to these deposits
Non-operational deposits from financial corporates
Cash outflows due to possible withdrawals of non-operational deposits from financial corporates, including interest payments relating to these deposits
FX derivatives Cash outflows resulting from FX derivative liabilities maturing (for example FX swap agreements)
Other derivatives Cash outflows resulting from derivative liabilities maturing (for example interest rate
derivatives)
Other outflows Other cash outflows that cannot be linked to the above categories
Cash inflows
Reverse repo transactions Cash inflows resulting from reverse repo transactions maturing
Lending to the general public Cash inflows resulting from interest payments and repayment of outstanding loans to
households and small and medium-sized enterprises (SME)
Lending to non-financial corporates
Cash inflows resulting from interest payments and repayment of outstanding loans to non-financial corporates
Lending to financial corporates Cash inflows resulting from interest payments and repayment of outstanding loans to financial corporates
FX derivatives Cash inflows resulting from FX derivative claims maturing (for example FX swap
agreements)
Other derivatives Cash inflows resulting from derivative claims maturing (for example interest rate derivatives)
Paper in own portfolio maturing Cash inflows resulting from maturity of securities held in own portfolio and included in liquidity reserves
Other inflows Other cash inflows that cannot be linked to the above categories
Liquidity reserve
Coins and banknotes Cash in the form of banknotes and coins
Central bank reserves Overnight deposits at central banks
Tradable assets Tradable assets (securities) of Level 1, Level 2a and Level 2b in accordance with
European Commission Delegated Regulation (EU) 2015/61
Other tradable assets Tradable assets (securities) which do not qualify as Level 1, Level 2a or Level 2b in accordance with European Commission Delegated Regulation (EU) 2015/61
Off-balance sheet items
Outstanding facilities Credit and liquidity facilities that the reporting institution has granted its customers
Cash flows due to downgrade
triggers
Cash outflows due to the downgrade of the reporting bank’s external credit quality by
at least three notches
Note. This is not a complete list of all sub-items in the data but only overall categories.
24 ANNEX A. STRUCTURE OF BANKS’ REPORTED DATA
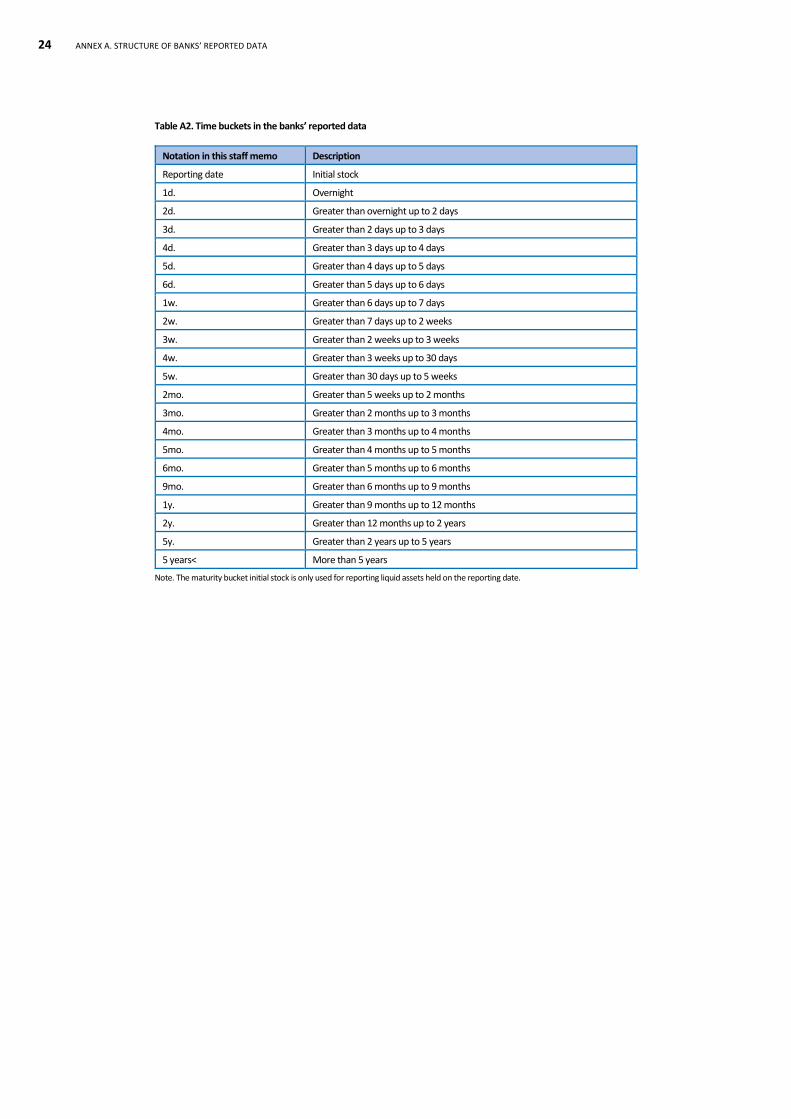
Table A2. Time buckets in the banks’ reported data
Notation in this staff memo Description
Reporting date Initial stock
1d. Overnight
2d. Greater than overnight up to 2 days
3d. Greater than 2 days up to 3 days
4d. Greater than 3 days up to 4 days
5d. Greater than 4 days up to 5 days
6d. Greater than 5 days up to 6 days
1w. Greater than 6 days up to 7 days
2w. Greater than 7 days up to 2 weeks
3w. Greater than 2 weeks up to 3 weeks
4w. Greater than 3 weeks up to 30 days
5w. Greater than 30 days up to 5 weeks
2mo. Greater than 5 weeks up to 2 months
3mo. Greater than 2 months up to 3 months
4mo. Greater than 3 months up to 4 months
5mo. Greater than 4 months up to 5 months
6mo. Greater than 5 months up to 6 months
9mo. Greater than 6 months up to 9 months
1y. Greater than 9 months up to 12 months
2y. Greater than 12 months up to 2 years
5y. Greater than 2 years up to 5 years
5 years< More than 5 years
Note. The maturity bucket initial stock is only used for reporting liquid assets held on the reporting date.

THE RIKSBANK’S METHOD FOR STRESS TESTING BANKS’ LIQUIDITY 25
Annex B. Assumed weights in the Riksbank’s scenarios
Table B1. Scenario weights for the Riksbank’s bank-specific and system-wide scenarios Per cent, weights presented in order: bank-specific | system-wide
Cash outflows 1d.– 4w. 5w. – 3mo. 4-6 mo.
Securities issued
Unsecured bonds 100|100 100|100 100|100
Covered bonds 70|100 70|100 70|100
Other 100|100 100|100 100|100
Repo transactions 100|100 100|100 100|100
Deposits
Stable deposits from the general public Outflows are evenly distributed up to three months when
they reach 10|5 10|5
Other deposits from the general public Outflows are evenly distributed up to three months when
they reach 40|15 40|15
Operational deposits Outflows are evenly distributed up to three months when
they reach 25|10 25|10
Non-operational deposits from credit institutions Outflows are evenly distributed up to one month when they
reach 100|100 100|100 100|100
Non-operational deposits from other financial customers Outflows are evenly distributed up to one month when they
reach 100|100 100|100 100|100
Non-operational deposits from central banks Outflows are evenly distributed up to one month when they
reach 100|100 100|100 100|100
Non-operational deposits from non-financial corporates Outflows are evenly distributed up to one month when they
reach 40|20 40|20 40|20
Non-operational deposits from other counterparties Outflows are evenly distributed up to one month when they
reach 40|20 40|20 40|20
FX-swaps maturing 100|0 100|0 100|0
Derivatives amount payables 100|0 100|0 100|0
Other outflows 100|100 100|100 100|100
Outflows from committed facilities
Committed credit facilities Outflows are evenly distributed up to three months when
they reach 5|12 5|12
Committed liquidity facilities Outflows are evenly distributed up to three months when
they reach 5|60 5|60
Outflows due to downgrade triggers 40|20 40|20 40|20
Cash inflows 1d. – 4w. 5w. – 3mo. 4-6mo.
Reverse repo transactions 100|100 100|100 100|100
Lending
General public 0|0 0|0 0|0
Non-financial corporates 0|0 0|0 0|0
Credit institutions Inflows are evenly distributed up to one month when they
reach 100|100 100|100 100|100
Other financial customers Inflows are evenly distributed up to one month when they
reach 100|100 100|100 100|100
Central banks 0|0 0|0 0|0
Other counterparties 0|0 0|0 0|0
FX-swaps maturing 100|0 100|0 100|0
Derivatives amount receivables 100|0 100|0 100|0
Paper in own portfolio maturing 100|100 100|100 100|100
Other inflows 100|100 100|100 100|100

26 ANNEX B. ASSUMED WEIGHTS IN THE RIKSBANK’S SCENARIOS
Counterbalancing capacity (weight = 1 – haircut) Reporting date, changes between 1d. – 6mo.
Coins and bank notes 100|100
Central bank reserves 100|100
Liquid assets
Level 1 tradable assets
Level 1 excluding covered bonds 100|95
Level 1 covered bonds (CQS1) 100|90
Level 2A tradable assets
Level 2A corporate bonds (CQS1) 100|85
Level 2A covered bonds (CQS1, CQS2) 100|85
Level 2A public sector (CQS1, CQS2) 100|85
Level 2B tradable assets
Level 2B Asset Backed Securities (ABS) (CQS1) 100|75
Level 2B covered bonds (CQS1-6) 100|70
Level 2B: corporate bonds (CQS1-3) 100|50
Level 2B shares 100|50
Level 2B public sector (CQS 3-5) 100|50
Other tradable assets
Central government (CQS1) 100|50
Central government (CQS 2 & 3) 100|50
Shares 100|50
Covered bonds 100|50
ABS 100|50
Other tradable assets 100|50
Non-tradable assets eligible for central banks 100|50
Undrawn committed facilities received 0|0

THE RIKSBANK’S METHOD FOR STRESS TESTING BANKS’ LIQUIDITY 27
Annex C. Comparison of the Riksbank’s scenarios and
reference scenarios
Table C1. Comparison of the Riksbank’s and reference scenarios
Per cent
Item Schmieder et
al. (2012) a LCR Bank of Italy ECB, adverse ECB, extreme
Liquidatum,
bank-specificb
Liquidatum,
combined
The Riksbank,
bank-specific
The Riksbank,
system-wide
Outflows
Unsecured bonds - 100 100 100 100 100 100 100 100
Covered bonds - 100 100 100 100 100 100 70 100
Stable deposits from the general public
20 3-5 5 18 27 2-10 2-10 10 5
Other deposits from the general
public 20 10 20 39 48 5-20 5-20 40 15
Deposits from financial corporates 100 100 100 100 100 100 100 100 100
Credit facilities 10 10/40c - 12 15 10-25 10-25 5 12
Liquidity facilities 100 30/100c - 60 75 100 100 5 60
Inflows
Lending to retail customers - 50 - 0 0 0 0 0d 0d
Lending to financial coporates - 100 - 100 100 100 100 100 100
Haircutsi
Level 1 assetse 5 0-50 -f -g -g - h - h 0 5-10
Level 2 assetse 30 15-50 - - - - - 0 15-50
Other assets 75 - - - - - - 0 50
FX swaps - 100 - 100 100 - - 100 0
Time horizon for scenario - 30 days 30 days 6 months 6 months - - 6 months 6 months
Note. The table is not complete with regard to the Riksbank's weights, the complete set of weights for the Riksbank's scenarios is included in Annex B.
a) Corresponds to the IMF’s severe stress scenario, for further information see Schmieder et al. (2012).
b) The figures in Liquidatum’s scenarios are the result of a survey carried out at eleven international banks, including two with extensive operations in Sweden.
c) Refers to non-financial and financial counterparties respectively.
d) For technical reasons, the assumption means that total lending by the banks is unchanged and that no inflow arises from interest payments received. However, the assumption of interest payments does not mean that the Riksbank assumes that the general public has been affected by the crisis and lost its ability to repay. The reason is that data does not allow us to distinguish interest payments. The result is a somewhat more conservative scenario than if inflows arise from interest payments.
e) Level 1 and 2 refer to level 1 tradable assets and level 2 tradable assets in accordance with the Delegated regulation (EU) 2015/61. Level 2 refers to both level 2A tradable assets and level 2B tradable assets.
f) Bank of Italy uses haircuts applied within the ECB's operational framework for monetary policy, but prior to this assumes a downgrade of the credit rating for all market participants. It is therefore not possible to say more specifically which haircuts are applied, but the interval for which haircuts are used is in the span 0-63 per cent. For further information, see IMF Country Report No. 13/349 page 36.
g) The ECB applies haircuts according to the following. If the asset can be used as collateral in the ECB's standing credit facilities, the haircut applied according to the Eurosystem's operational framework for monetary policy should be used. If the bank is instead referred to a different operational framework for monetary policy, the haircut stated by the relevant central bank shall be applied. If the asset cannot be used as collateral by the central bank, the haircut stated for the asset in the LCR regulation shall be used. For more detailed information, see ECB Sensitivity analysis of Liquidity Risk – Stress Test 2019, page 17.
h) Liquidatum’s summary shows that most banks add a further haircut of around 5-20 per cent onto the haircuts applied in normal cases. This means it is not possible to say which haircut is applied.
Sources: The Delegated regulation (EU) 2015/61, the ECB, the IMF, Liquidatum and the Riksbank

28 ANNEX D. HISTORICAL BANK RUNS
Annex D. Historical bank runs
Table D1. Historical data regarding bank runs
Bank (year) Percentage withdrawals
Time interval
Banking System in Saudi Arabia (1990) 11 % 1 week
Banesto, Spain (1994) 8 % 1 week
Banking system in Argentina (2001) 30 % 9 months
Northern Rock, United Kingdom (2007) 57 % 12 months
Parex Bank, Latvia (2008) 25 % 3 months
IndyMac, USA (2008) 7,5 % 1 week
Washington Mutual, USA (2008) 8,5 % 10 days
DSB Bank, Netherlands (2009) 30 % 12 days
Source: Schmieder et al. (2012), page 19.

SVERIGES RIKSBANK 103 37 Stockholm (Brunkebergstorg 11)
Tel 08 - 787 00 00 Fax 08 - 21 05 31 [email protected] www.riksbank.se