the ric report - merrill lynch ric report ... leading global indicators suggest that earnings growth...
TRANSCRIPT

BofA Merrill Lynch does and seeks to do business with issuers covered in its research reports. As a result, investors should be aware that the firm may have a conflict of interest that could affect the objectivity of this report. Investors should consider this report as only a single factor in making their investment decision. Refer to important disclosures on page 35 to 36. 11718828
The RIC Report Beyond our borders
14 March 2017
Scaling up our forecasts We’ve raised our year-end forecast for the S&P500, and now expect three Fed rate hikes this year, including one on March 15.
Japan favorite developed equity market We believe that favorable economic growth and inflation in Japan along with coordinated monetary and fiscal policy will drive domestic demand and boost Japanese equity prices. The weakening in the yen vs the dollar that we expect should favor cyclical stocks.
Europe in holding pattern Leading global indicators suggest that earnings growth among European companies should accelerate over the remainder of this year. Earnings should also benefit from recovering commodity prices, disciplined capital spending and expanding margins. However, risk that the political landscape becomes more unstable from upcoming elections in the Netherlands, France and Germany keeps us neutral for now.
Maintain favorable view on Emerging Market stocks Emerging Market central banks appear more synchronized with the US, reducing the risk of currency depreciation. The earnings picture has improved with expanding operating margins and free cash flow. However, Asia has near-term challenges, as China balances growth with financial stability amid talk of trade conflicts with the US. We prefer Russia and Brazil.
Limited appeal of bonds outside the US We believe that bond market allocations outside the US should be concentrated in dollar-denominated sovereign and corporate Emerging Markets, but even that market we would approach with caution for the near-term.
Disruptive trends add excitement to auto sector Four trends that are disrupting the auto sector—electrification, autonomous driving, connectivity and shared mobility—are likely to forge a paradigm shift to a future where cars are greener, safer, faster, and available on-demand. See the ideas section, page 11.
Investment Strategy Global
Table of Contents
Financial markets recap 2
Beyond our borders 3
The market’s message to the Fed 9
The future of autos 11
RIC asset class views 17
Fixed Income, Economics, Commodities,
Currencies: views and risks 18
Global equity markets: views and risks 19
Asset allocation for individual investors 20
US Equity Strategy Sector Views 25
Portfolio of the month 26
Stock lists 27
US economic forecast summary 31
Global economic forecast summary 32
Interest rate forecast summary 32
FX rate forecast summary 32
Research Analysts 36
Research Investment Committee MLPF&S
Martin Mauro Fixed Income Strategist MLPF&S
Cheryl Rowan Portfolio Strategist MLPF&S
Matthew Trapp, CFA Investment Strategist MLPF&S
See Team Page for List of Analysts
Timestamp: 14 March 2017 12:01AM EDT
2 The RIC Report | 14 March 2017
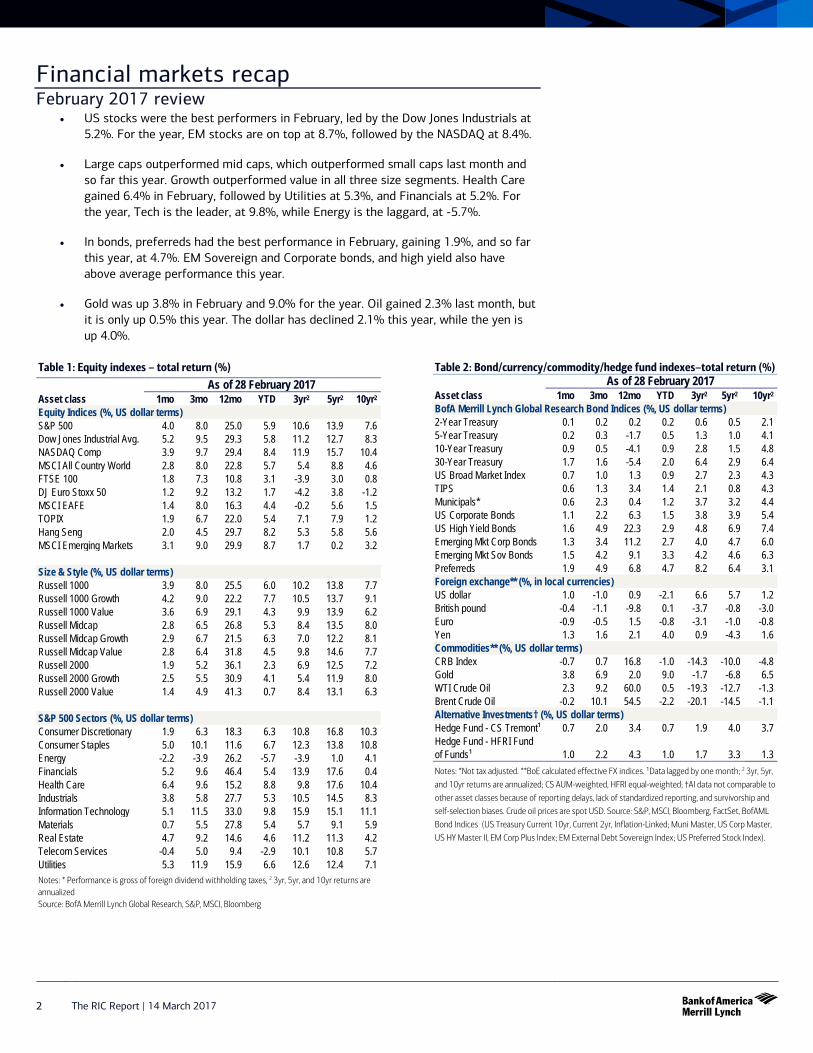
Financial markets recap February 2017 review
• US stocks were the best performers in February, led by the Dow Jones Industrials at5.2%. For the year, EM stocks are on top at 8.7%, followed by the NASDAQ at 8.4%.
• Large caps outperformed mid caps, which outperformed small caps last month andso far this year. Growth outperformed value in all three size segments. Health Caregained 6.4% in February, followed by Utilities at 5.3%, and Financials at 5.2%. Forthe year, Tech is the leader, at 9.8%, while Energy is the laggard, at -5.7%.
• In bonds, preferreds had the best performance in February, gaining 1.9%, and so farthis year, at 4.7%. EM Sovereign and Corporate bonds, and high yield also haveabove average performance this year.
• Gold was up 3.8% in February and 9.0% for the year. Oil gained 2.3% last month, butit is only up 0.5% this year. The dollar has declined 2.1% this year, while the yen isup 4.0%.
Table 1: Equity indexes – total return (%) As of 28 February 2017
Asset class 1mo 3mo 12mo YTD 3yr2 5yr2 10yr2 Equity Indices (%, US dollar terms) S&P 500 4.0 8.0 25.0 5.9 10.6 13.9 7.6 Dow Jones Industrial Avg. 5.2 9.5 29.3 5.8 11.2 12.7 8.3 NASDAQ Comp 3.9 9.7 29.4 8.4 11.9 15.7 10.4 MSCI All Country World 2.8 8.0 22.8 5.7 5.4 8.8 4.6 FTSE 100 1.8 7.3 10.8 3.1 -3.9 3.0 0.8 DJ Euro Stoxx 50 1.2 9.2 13.2 1.7 -4.2 3.8 -1.2MSCI EAFE 1.4 8.0 16.3 4.4 -0.2 5.6 1.5 TOPIX 1.9 6.7 22.0 5.4 7.1 7.9 1.2 Hang Seng 2.0 4.5 29.7 8.2 5.3 5.8 5.6 MSCI Emerging Markets 3.1 9.0 29.9 8.7 1.7 0.2 3.2
Size & Style (%, US dollar terms) Russell 1000 3.9 8.0 25.5 6.0 10.2 13.8 7.7 Russell 1000 Growth 4.2 9.0 22.2 7.7 10.5 13.7 9.1 Russell 1000 Value 3.6 6.9 29.1 4.3 9.9 13.9 6.2 Russell Midcap 2.8 6.5 26.8 5.3 8.4 13.5 8.0 Russell Midcap Growth 2.9 6.7 21.5 6.3 7.0 12.2 8.1 Russell Midcap Value 2.8 6.4 31.8 4.5 9.8 14.6 7.7 Russell 2000 1.9 5.2 36.1 2.3 6.9 12.5 7.2 Russell 2000 Growth 2.5 5.5 30.9 4.1 5.4 11.9 8.0 Russell 2000 Value 1.4 4.9 41.3 0.7 8.4 13.1 6.3
S&P 500 Sectors (%, US dollar terms) Consumer Discretionary 1.9 6.3 18.3 6.3 10.8 16.8 10.3 Consumer Staples 5.0 10.1 11.6 6.7 12.3 13.8 10.8 Energy -2.2 -3.9 26.2 -5.7 -3.9 1.0 4.1 Financials 5.2 9.6 46.4 5.4 13.9 17.6 0.4 Health Care 6.4 9.6 15.2 8.8 9.8 17.6 10.4 Industrials 3.8 5.8 27.7 5.3 10.5 14.5 8.3 Information Technology 5.1 11.5 33.0 9.8 15.9 15.1 11.1 Materials 0.7 5.5 27.8 5.4 5.7 9.1 5.9 Real Estate 4.7 9.2 14.6 4.6 11.2 11.3 4.2 Telecom Services -0.4 5.0 9.4 -2.9 10.1 10.8 5.7 Utilities 5.3 11.9 15.9 6.6 12.6 12.4 7.1 Notes: * Performance is gross of foreign dividend withholding taxes, 2 3yr, 5yr, and 10yr returns are annualized Source: BofA Merrill Lynch Global Research, S&P, MSCI, Bloomberg
Table 2: Bond/currency/commodity/hedge fund indexes–total return (%) As of 28 February 2017
Asset class 1mo 3mo 12mo YTD 3yr2 5yr2 10yr2 BofA Merrill Lynch Global Research Bond Indices (%, US dollar terms) 2-Year Treasury 0.1 0.2 0.2 0.2 0.6 0.5 2.1 5-Year Treasury 0.2 0.3 -1.7 0.5 1.3 1.0 4.1 10-Year Treasury 0.9 0.5 -4.1 0.9 2.8 1.5 4.8 30-Year Treasury 1.7 1.6 -5.4 2.0 6.4 2.9 6.4 US Broad Market Index 0.7 1.0 1.3 0.9 2.7 2.3 4.3 TIPS 0.6 1.3 3.4 1.4 2.1 0.8 4.3 Municipals* 0.6 2.3 0.4 1.2 3.7 3.2 4.4 US Corporate Bonds 1.1 2.2 6.3 1.5 3.8 3.9 5.4 US High Yield Bonds 1.6 4.9 22.3 2.9 4.8 6.9 7.4 Emerging Mkt Corp Bonds 1.3 3.4 11.2 2.7 4.0 4.7 6.0 Emerging Mkt Sov Bonds 1.5 4.2 9.1 3.3 4.2 4.6 6.3 Preferreds 1.9 4.9 6.8 4.7 8.2 6.4 3.1 Foreign exchange** (%, in local currencies) US dollar 1.0 -1.0 0.9 -2.1 6.6 5.7 1.2 British pound -0.4 -1.1 -9.8 0.1 -3.7 -0.8 -3.0Euro -0.9 -0.5 1.5 -0.8 -3.1 -1.0 -0.8Yen 1.3 1.6 2.1 4.0 0.9 -4.3 1.6 Commodities** (%, US dollar terms) CRB Index -0.7 0.7 16.8 -1.0 -14.3 -10.0 -4.8Gold 3.8 6.9 2.0 9.0 -1.7 -6.8 6.5 WTI Crude Oil 2.3 9.2 60.0 0.5 -19.3 -12.7 -1.3Brent Crude Oil -0.2 10.1 54.5 -2.2 -20.1 -14.5 -1.1Alternative Investments† (%, US dollar terms) Hedge Fund - CS Tremont¹ 0.7 2.0 3.4 0.7 1.9 4.0 3.7 Hedge Fund - HFRI Fund of Funds¹ 1.0 2.2 4.3 1.0 1.7 3.3 1.3 Notes: *Not tax adjusted. **BoE calculated effective FX indices. ¹Data lagged by one month; 2 3yr, 5yr,
and 10yr returns are annualized; CS AUM-weighted, HFRI equal-weighted; †AI data not comparable to
other asset classes because of reporting delays, lack of standardized reporting, and survivorship and self-selection biases. Crude oil prices are spot USD. Source: S&P, MSCI, Bloomberg, FactSet, BofAML
Bond Indices (US Treasury Current 10yr, Current 2yr, Inflation-Linked; Muni Master, US Corp Master,
US HY Master II, EM Corp Plus Index; EM External Debt Sovereign Index; US Preferred Stock Index).

The RIC Report | 14 March 2017 3
Beyond our borders
Cheryl Rowan Portfolio Strategist MLPF&S
Martin Mauro Fixed Income Strategist MLPF&S
Matthew Trapp, CFA Investment Strategist MLPF&S
With all the potential tax and regulatory changes from the new leadership in Washington, investors may be paying too little attention to events and markets outside the US. In equities, we broadly favor Japanese and Emerging Markets, while we wait for more clarity on the political situation in Europe before becoming more enthusiastic there. In bonds, we favor Emerging Market dollar-denominated debt, both sovereign and corporate.
Stepped up Fed rate hikes, higher US stock market target The US economic picture has been improving. Job gains have averaged 209,000 during the past three months, the manufacturing ISM index has been above 50% for the past six months, and consumer sentiment has been moving higher. US Economist Michelle Meyer now expects the Fed to raise rates three times this year, with the first move coming on March 15. These moves would probably not rattle the markets. The bond market is already priced for a March 15 move and expects at least three rate hikes this year.
Since we expect yields to move higher in the coming months, we recommend a defensive approach to bond positioning. We favor ladders and barbells. We also suggest areas where coupon rates would likely rise as the Fed hikes rates. Fixed-to-floating rate preferreds fit this description, although in many cases the floating period does not begin until the early 2020s. Senior loans are another choice for investors who can accept low credit quality.
Savita Subramanian, head of US Equity Strategy, recently raised her year-end S&P 500 target to 2450 from 2300. The change reflects a lowering of her year-end equity risk premium assumption and a lowering of her fair value model weight in favor of her sentiment model. Subramanian sees increasing likelihood that we are entering the typical later stages of a bull market during which the fundamentals typically take a back seat to sentiment and technicals.
With strong relative performance from US markets and these forecast changes, it’s easy to understand why investors would be focused solely on the US. But that ignores opportunities in other parts of the world, as we highlight below.
Europe in a holding pattern but runway in sight It appears that the era of Quantitative Easing by the European Central Bank (ECB) is winding down. That’s because Europe seems to be on a solid path toward higher inflation. Data for growth, inflation and earnings are beating expectations. Our economists expect 2017 to be the trough for economic growth at 1.4%. Exports are a significant portion of the European economy, and global growth continues to improve. Nonetheless, the political risks surrounding the upcoming elections including what those outcomes may mean for the sustainability of the Eurozone keep us neutral.
Several reasons to be more inclined to add to European equities The reflation theme keeps gaining traction in Europe, and evidence of rising inflation globally has exceeded expectations, particularly in Germany, the UK and China. Manufacturing survey price indicators suggest that cyclical inflationary pressures are building and the rise in several commodity prices confirms this data. Leading global indicators are hitting levels associated with European EPS growth in the teens (Chart 2).

4 The RIC Report | 14 March 2017
Bond yields are rising again, and European Equity Strategist James Barty thinks, after years of negative rates, there is room for yields to back up further before they create a risk to equity market valuations. This is an important positive for banks, given their sensitivities to the short end of the yield curve. Barty notes that banks’ price returns and valuation are most highly correlated to rising rates and inflation expectations.
Our strategists forecast higher earnings growth in Europe, led by a synchronized upturn in the global economic cycle (Chart 1). Barty believes earnings have bottomed and are poised to deliver double digit (11%) growth for the first time since 2010. This view is based on recovering commodity prices, low margins, a disciplined approach to capital spending and a modest currency tailwind. Further, the region looks inexpensive in relation to US stocks, based on both normalized price/earnings and price/book ratios. Our strategists currently favor banks, oils and chemicals along with the defensive health care and utilities sectors.
Chart 1: European earnings closely correlated with global GDP Europe trailing EPS growth vs World GDP
Source: BofA Merrill Lynch Global Research, Datastream, IBES. Note: GDP for 2017 based on BofAML forecast
Chart 2: Rising PMIs point to upside risks for growth and earnings
Source: BofA Merrill Lynch Global Research, Datastream, IBES
Political risks keep us on the sidelines for longer In our view, the key downside risk for Europe is that the political landscape becomes more unstable and fears of a Eurozone breakup gain momentum. The market is focused on elections in the Netherlands and Germany, and especially the election of a new president in France. A victory by Front National candidate Marine Le Pen could, according to Barty, potentially reignite fears that the Eurozone disintegrates, as Le Pen advocates a referendum on this topic and reversal of some economic reforms. Barty estimates a Le Pen victory could lead to a selloff in European equities of 13-23%. The election’s first round will be held April 23 with any run-off election on May 7.
German elections follow later in the year (September 24), so we expect market volatility to be higher than normal as that date approaches. The political situation in Italy remains complicated, but it looks likely that elections there will not occur until 2018. We do not think national elections will occur in Spain this year, but do not rule it out.
It is possible that an improving growth outlook for European equities could offset political concerns. It is also possible that reform-minded candidates could win elections and bring more stability to European politics. However, we prefer to remain neutral on markets at least until the situation in France becomes clearer.
Underweight UK as economic growth likely to slow We remain underweight on UK equities. We believe that the UK economy will slow more than the market expects as the country begins to implement its exit from the Eurozone—or Brexit. Q4 2016 economic growth was better than expected, but for the full year, the economy showed the slowest growth rate since 2012. Consumer spending accounted for all of UK economic growth in 2016 (Chart 3). However, real income growth (a key driver of consumption) has halved since the Brexit vote and consumer confidence has fallen. The gap
-1%
1%
3%
5%
7%
-50%
-30%
-10%
10%
30%
50%
Q496 Q499 Q402 Q405 Q408 Q411 Q414 Q417MSCI Europe 12m trail EPS (IBES) World GDP (right)
-60
-40
-20
0
20
40
60
30
35
40
45
50
55
60
65
01/98 01/01 01/04 01/07 01/10 01/13 01/16ISM / Euro PMI manuf avg (advanced 9m)MSCI Europe EPS € (trailing yoy, RHS)

The RIC Report | 14 March 2017 5
between wages and retail sales cannot last, in our view. We also expect a currency-induced rise in inflation in coming months. Further, the vast majority of UK growth since the financial crisis has come from expansion of the labor force, so a slowdown in immigration—likely as Brexit is implemented—suggests a downside risk to growth. Investors may want to limit their exposure to the UK consumer; our equity strategists are underweight retailing and travel/leisure stocks.
Chart 3: Contributions to yoy GDP growth: the consumer is the last leg left standing
Source: BofA Merrill Lynch Global Research, ONS.
It’s all coming together in Japan We favored Japan equities last year and we are even more convinced of our overweight stance for 2017. Japan Economist Izumi Devalier has an upbeat view of the Japanese economy, with a forecast of 1.5% GDP growth and an expectation of favorable inflation of 1.0%. Her view is predicated on an alignment of monetary and fiscal policy from the government, along with a recovery in domestic demand driven by consumption and industrial capital spending. Japanese Equity Strategist Shusuke Yamada expects the yen to weaken to 117 at year-end (from about 115 currently) and that should favor Japanese cyclicals.
The main catalyst for Japan’s recovery, according to Devalier, has been the pickup in global growth and the improvement in the global industrial cycle. Japan’s manufacturing sector has responded favorably—exports have been recent leaders. In 2017, expectations are high for domestic demand to drive the Japanese economy and stock market. Wage and full-time employment growth has stimulated consumption. Devalier believes the re-acceleration of wage growth could provide one of the biggest macro surprises for Japan in 2017. The combination of tight labor supply and stronger demand is forecast to lift nominal wage growth to around 1.4% in FY2017, and close to 2% in FY2018, up from the 0-0.5% pace of the past three years (Chart 4). This should support consumption.
The Bank of Japan is likely to be on hold for much of the year—allowing for a natural acceleration in growth. Inflation appears headed higher over the next two years, led by higher oil prices and a more hawkish Fed in the US, which should lead to a weaker yen by year-end.
-3-2-1012345
2014 2015 2016Consumption Capex & underlying stocksNet exports & valuables GovernmentContribution from… "the rest" GDP % yoy

6 The RIC Report | 14 March 2017
Chart 4: Steady labor market tightening points to wage growth ahead
Source: BofA Merrill Lynch Global Research, MHLW
Yamada believes that Japanese equities are attractively valued and thinks the economic environment favors a shift to cyclicals. He favors the domestic demand-driven cyclicals that could benefit from increases in consumption, along with financials (banks and insurance) that benefit from a pickup in inflation.
Maintaining a favorable view of Emerging Market stocks There are several cross currents facing emerging markets (EM); we maintain an overweight stance even though we acknowledge the potential for those stocks to pull back in the near term. Monetary policy has become more hawkish, suggesting less risk of currency devaluation, and the earnings picture looks favorable, particularly for Asian markets. Further, fund manager allocations do not appear aggressive (Chart 5). But China’s ability to maintain financial stability is still in question, potential trade conflicts with the US are worrisome, and expectations for strong global growth may already be built into stock prices.
The comeback in EM asset prices and reflation theme coincides with a shift in EM monetary policy, according to EEMEA Strategist David Hauner. Rather than diverging with the US Federal Reserve’s tightening policy, EM central banks appear to be more in sync with the US. Based on market expectations, 10 out of 15 EM countries are pricing in some probability of tightening rates over the next year. This is likely due to recovery in manufacturing Purchasing Managers’ Indices (PMIs) in Asia and EMEA and an acceleration in Chinese imports that is spilling over to broader Asia demand, and is reflected in our forecasts for steeper yield curves in much of EM this year.
EM Equity Strategist Ajay Kapur believes that a sharp decline in capital spending in key EM countries is likely to lead to expanding operating margins and a doubling of free cash flow in Asia ex-Japan by 2018. That should allow for approximately 20% growth in EPS for the region in 2017. He also thinks that EM valuations are reasonable and currencies are undervalued. But Kapur has become cautious in the near term, as he believes that China’s monetary conditions index may be rolling over and suggests exiting the more cyclical stocks.
China Equity Strategist David Cui is also cautious, as he thinks that China’s government may struggle to maintain both growth and financial stability and thinks that the market underestimates the potential of China-US trade conflicts. Financial deregulation has largely run its course and, according to Cui, if the currency is allowed to free float and devalues, it could trigger broad-based asset price deflation.
We are maintaining our positive view on EM and suggest that investors focus on markets such as Russia and Brazil. The Russian economy is on a recovery path and appears strong enough that the central bank has become less inclined to lower rates, which should support the currency. As long as oil prices are stable to rising they, along with removal of sanctions, should support the market. We expect Brazil to continue on the path toward reform. The
-3
-2
-1
0
1
2
3
-2.5
-2.0
-1.5
-1.0
-0.5
0.0
1995 1997 1999 2001 2003 2005 2007 2009 2011 2013 2015 2017
FT job offers-total applicants gap Hourly wage-all workers 12MMA %YoY (RHS)

The RIC Report | 14 March 2017 7
central bank will likely continue to lower rates and that should help the economy recover from its severe recession. Investors are still under allocated, according to LatAm Equity Strategist Felipe Hirai. Earnings estimates are showing signs of improving and strong oil/commodities markets also support Brazilian equity prices.
The broad trade-weighted US dollar has moved lower since the start of the year, which has helped EM stocks rally (Chart 6). We are closely watching the dollar for signs of it moving higher again, as a significantly stronger dollar would be a negative headwind for EM equities. Two data points we are monitoring are the prospect of Congress enacting a Border Adjustment Tax, which we believe would lead to a stronger dollar, and the path for Fed rate hikes.
Chart 5: Net % fund managers say they are OW GEM equities
Source: BofA Merrill Lynch Global Fund Manager Survey
Chart 6: US broad trade-weighted dollar The dollar has moved lower since the start of the year
Source: BofA Merrill Lynch Global Research, Bloomberg
Bonds: dollar-denominated EM with caution We believe that bond market allocations outside the US should be concentrated in dollar-denominated sovereign and corporate Emerging Markets, but even that market we would approach with caution for the near term. We do not favor bonds in developed markets outside the US because yields are low, and we believe that dollar strength and rising rates will eat into returns.
EM bonds stumbled in the weeks after the election but have since more than recouped their losses. The rise in commodity prices (Chart 7) is helping most EM countries, as is the rise in manufacturing activity over much of Asia and EMEA. Yields have been declining since the middle of December as Chart8 below right shows.
The main positive for EM debt is the favorable economic growth outlook for most of the countries for the next two years. Our economists expect GDP among EM nations to grow by 4.6% this year and 5.1% next year, compared to 2.1% and 2.5% in the US.
100105110115120125130135
US Trade Weighted Broad Dollar Index

8 The RIC Report | 14 March 2017
Chart 7: CRB Commodity Price Index (1967=100)
Source: Commodity Research Bureau, Bloomberg
Chart 8: Emerging market bond yields %
Source: BoA Merrill Lynch Global Bond Indexes
Dollar-denominated sovereign debt The strong recent performance of EM bonds has made finding value more difficult. Jane Brauer, Global EM fixed-income quantitative strategist, is moderately cautious on EM external (dollar-denominated) debt. The biggest positives she sees revolve around the demand among investors for duration and the still-low yields and shortage of bonds with credit exposure in developed countries. Although spreads of EM dollar-denominated sovereigns to US Treasuries have narrowed to their lowest level in three years, they have not narrowed as much as US corporate and high yield bonds.
One risk for EM debt in Brauer’s view is that the recent outperformance in risk assets may have run ahead too quickly. Also, a rise in global rates would reduce the appeal of EM bonds. Other risks are a potential decline in commodity prices, an appreciation in the dollar (which would have a negative influence on commodity prices) and protectionist policies in the US and a significant slowdown in China.
EM corporates: some near-term positives EM corporate bonds, most of which are denominated in dollars, have also fared well this year, but here again valuations are moving toward extremes. The yield spread vs US governments is the narrowest since before the financial crisis. Anne Milne, head of Global EM Credit Research, believes that spreads can remain tight for the near term.
One positive is the near-term cash flow outlook. Maturing issues and coupon payments will total $20 billion in March and $26 billion in April. Those are funds that could be plowed back into the market. Also, EM corporate bonds are benefitting from new institutional allocations and increased retail interest. Finally, commodity producers are benefiting from higher prices. The risks for EM corporate, in Milne’s view, are the potential border adjustment tax in the US, the potential for more aggressive path of Fed rate hikes.
Enter the market gradually Investors need to balance the favorable long-term growth prospects for EM debt with the near-term risks that we cited, as well as the less attractive valuations resulting from the decline in yields in recent months. We suggest committing to the market gradually over the course of the next several months, especially on weakness. .
We favor dollar-denominated debt, both sovereign and corporate, over local currency debt in order to mitigate the currency risk that US investors would face if the dollar appreciates as we expect.
390395400405410415420425430435440
4.004.204.404.604.805.005.205.405.605.806.00
Jul-16 Aug-16 Sep-16 Oct-16 Nov-16 Dec-16 Jan-17 Feb-17
Series1 Corporate

The RIC Report | 14 March 2017 9
The market’s message to the Fed Shyam S.Rajan Rates Strategist MLPF&S
The bond market’s focus in early March was on the Fed’s message to the market. The coordinated attack by Fed officials on the probabilities that the market attached to a March 15 rate hike resulted in a re-pricing of near-term expectations. But even more interesting was the market’s response to the Fed. Despite the 60% increase in near-term Fed hike probabilities, stocks are higher, credit spreads are tighter, interest rate volatility and the VIX are lower. While this has allowed the Fed to have its cake and eat it too at the March meeting, in our view there could be a bigger sign from the markets to the Fed: financial conditions could be at the cusp of signaling that policy is behind the curve. Ultimately, financial conditions that fail to tighten in response to a hawkish Fed could raise concerns of a more hawkish policy stance (higher dots and/or active balance sheet talk). This could translate to higher risk premium in the front end and a steeper skew.
Chart 9: The broken link between financial conditions and the Fed
Source: BofA Merrill Lynch Global Research
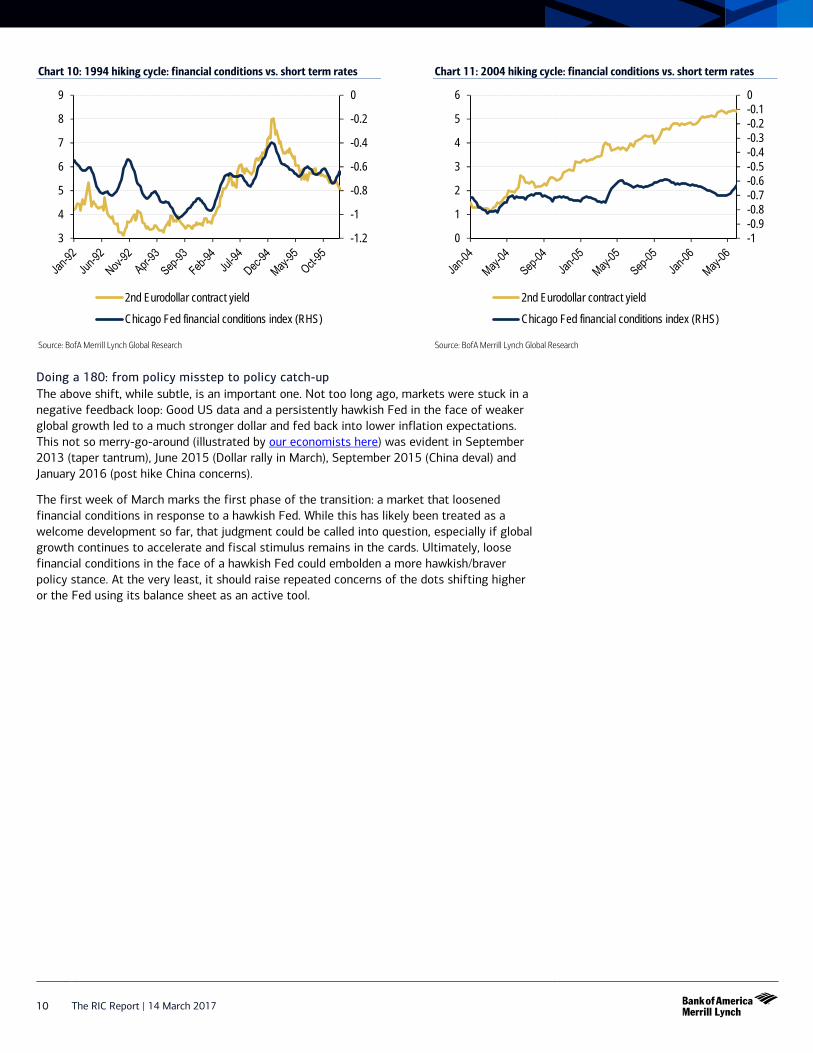
Hikes vs financial conditions: going back to Dudley 2015 Consider the argument put forth by NY Fed President Dudley in 2015. In an interview in June 2015 he said, “If you actually look at what actually happened to financial conditions over that period — 2004 to 2007 — the Fed wasn’t really effective in tightening financial conditions, so the Fed didn’t really achieve its objective. My point in the footnote was basically to say this was probably a period where the Fed should have done a bit more because we probably should have been tightening financial conditions over that period.”
The above failure to tighten financial conditions in the 2004 cycle relative to the 1994 cycle is best illustrated through Chart 10 and Chart 11. The charts plot the Chicago Fed financial conditions index with the second Eurodollar contract yield in both these cycles (Eurodollars are interest bearing bank deposits denominated in US Dollars and held at banks outside of the United States). Clearly, Fed hikes translated to tighter financial conditions in the former and barely moved conditions in the latter. Fast forward to today, Chart 9 shows the same failure in 2004 has repeated so far in the current cycle.
-1.5
-1
-0.5
0
0.5
1
0
0.2
0.4
0.6
0.8
1
1.2
1.4
1/3/2010 1/3/2011 1/3/2012 1/3/2013 1/3/2014 1/3/2015 1/3/2016 1/3/2017
2nd Eurodollar contract yield Chicago Fed financial conditions index (RHS)
10 The RIC Report | 14 March 2017
Chart 10: 1994 hiking cycle: financial conditions vs. short term rates
Source: BofA Merrill Lynch Global Research
Chart 11: 2004 hiking cycle: financial conditions vs. short term rates
Source: BofA Merrill Lynch Global Research
Doing a 180: from policy misstep to policy catch-up The above shift, while subtle, is an important one. Not too long ago, markets were stuck in a negative feedback loop: Good US data and a persistently hawkish Fed in the face of weaker global growth led to a much stronger dollar and fed back into lower inflation expectations. This not so merry-go-around (illustrated by our economists here) was evident in September 2013 (taper tantrum), June 2015 (Dollar rally in March), September 2015 (China deval) and January 2016 (post hike China concerns).
The first week of March marks the first phase of the transition: a market that loosened financial conditions in response to a hawkish Fed. While this has likely been treated as a welcome development so far, that judgment could be called into question, especially if global growth continues to accelerate and fiscal stimulus remains in the cards. Ultimately, loose financial conditions in the face of a hawkish Fed could embolden a more hawkish/braver policy stance. At the very least, it should raise repeated concerns of the dots shifting higher or the Fed using its balance sheet as an active tool.
-1.2
-1
-0.8
-0.6
-0.4
-0.2
0
3
4
5
6
7
8
9
2nd Eurodollar contract yield
Chicago Fed financial conditions index (RHS)
-1-0.9-0.8-0.7-0.6-0.5-0.4-0.3-0.2-0.10
0
1
2
3
4
5
6
2nd Eurodollar contract yield
Chicago Fed financial conditions index (RHS)

The RIC Report | 14 March 2017 11
The future of autos Beijia Ma, CFA >> Equity Strategist MLI (UK)
Sarbjit Nahal >> Equity Strategist MLI (UK)
The global transportation sector is a behemoth with US$6.8 trillion in annual output and 1.2 billion vehicles globally, generating US$2.1 trillion in annual light vehicle sales and another US$4+ trillion in supplies and ancillary services (source: Roland Berger, Navigant). We believe that the sector is ripe for a defining disruptive moment as it moves toward more sustainable ways to tap into transport demand, while evolving toward next-generation solutions using limited resources. Transport in the future will be greener, safer, faster, on-demand, and personalized for the user.
Urbanization, demographics, congestion, pollution, emissions, safety and cost are all challenging the existing vehicle ownership model. The traditional auto ownership model is grossly inefficient, with 95% of cars parked at any one point (source: Donald Shoup 2005, Kenworthy & Laube, IEA). Population growth is projected to add 2.5 billion people to the planet by the middle of this century, with 70% of the planet living in urban settings (source: UN), adding to congestion on the roads. The rising financial, social and environmental costs of transportation are unsustainable, and demand a fundamental rethink of mobility.
Please see the comprehensive primer on future mobility that much of this article is based on: Thematic Investing: Overdrive – Global Future Mobility Primer 16 February 2017
31% of urban land is used for parking, 30% of all traffic is looking for spots Parking accounts for 31% of the central business districts in global cities (source: Kenworthy & Laube). For cities like Los Angeles, 59-66% of land is car-related, consisting of either sidewalks, streets, or parking (source: Transportation and parking for tomorrow’s cities, Smith). In fact, 30% of all traffic flow in urban centers across the world is looking for parking spots (source: Shoup et al). Furthermore, 40% of fuel in cities is wasted looking for parking (source: Casualty Actuarial Society). Liberating space otherwise wasted on parking via replacement by fewer autonomous vehicles (AVs) could allow more people to live in city centers.
Congestion wastes time and fuel – slower than a pig in London Traffic congestion globally has been rising in all urban areas in both DMs and EMs. In the US, commuters in urban areas lost 8bn hours or 50 hours of extra travel time per person in 2015, or nearly 3x the 18 hours in 1982. This wasted 19 gallons per person, up from four gallons in 1982. London has some of the worst traffic within the developed world in terms of wasted time in traffic (source: TomTom Traffic Index, INRIX 2016). The average traffic speed in central London has been declining steadily, from 10.9mph in 2003 to 7.8mph by 2016, or 30% slower than a pig (source: Inrix, Transport for London, Speed of Animals).
Moving to a new transportation paradigm The confluence of electric, autonomous, shared, and connected cars will give rise to an entirely new transportation paradigm. From a technology perspective, we have entered the exponential age, whereby Moore’s law is enabling the rise of sensor content, Big Data, artificial intelligence (AI), cloud analytics, and the broader Internet of Things (IoT) ecosystem. While many sectors are already undergoing the IoT transformation, we believe the automotive industry is the next to be upended. Four trends disrupting the transport sector right now – electrification, autonomous driving, connectivity and shared mobility – will forge a paradigm shift from a vehicle-centric to a platform-centric model. Future Mobility – including an

12 The RIC Report | 14 March 2017
integrated, on-demand electric fleet of autonomous taxis – can generate US$3.8tn of cumulative positive impact over the next 10 years.
These changes will unbundle the automobile, shift revenue pools, change consumer mobility behavior, and introduce new competition and cooperation. We believe the impact will reverberate well beyond vehicles, with significant ramifications for oil and electricity demand, insurance, real estate and jobs.
Chart 12: Macro factors driving shift in mobility paradigm
Source: BofA Merrill Lynch Global Research based on cited sources
Moving toward zero emissions Transport accounts for nearly a quarter of global energy-related emissions. Cars and trucks represent 75% of these (source: IEA). Electric Vehicles (EVs) are set to be a critical component of the global fight against climate change with CO2 emissions 40% lower than internal combustion engines (ICEs) today. The move to EVs will mirror a global move to de-carbonize the economy and double the share of renewable power generation in the next 25 years.
New energy vehicles are expected to reach 26% of global sales (31mn vehicles) by 2030E, 35% by 2040E, and up to 50% in a shared transport scenario (source: BofAML Global Autos team, Bloomberg New Energy Finance). This includes pure EVs, plug-in hybrids (PHEVs), mild hybrids (MHVs), and fuel cells. We see the early 2020Es as the inflection point for pure EV uptake as costs come down to parity vs. the traditional internal combustion engine.
Consumers are demanding fuel-efficient vehicles for cost and environmental reasons, with close to 40% of US adults interested in buying an EV. Levels of interest in EVs are up to 70% with younger US millennials (source: Consumer Federation of America). Barriers to widescale adoption today include cost of vehicle ownership, vehicle range, recharge time, and consumer awareness, each of which are coming down rapidly.
We see several drivers of an expected pick-up in adoption, particularly for EVs:
• EV range improving: Range has been an important consumer consideration holdingback wider EV adoption so far (range anxiety). In our view, EVs will be more widelyadopted if they offer a drive range of 200-250 miles on a single charge. This shouldbe possible in the next 10 years.

The RIC Report | 14 March 2017 13
• Price: The incremental cost of pure EV vs ICE is $12,500 today, but this is set todecline to parity by 2030E, and 2022E with subsidies. In a scenario where thesharing economy takes off and utilization rates double, the parity point could comeas early as 2018.
• Expansion of charging infrastructure
• EV performance catching up: Performance is no longer a reason for consumers toavoid EVs. For example, Toyota’s Prius, the best-selling hybrid, has a maximum speedof 112 mph (well above the legal limit in most countries) and reaches 0-60mph in adecent ~10 seconds.
• Regulatory emission deadlines drawing closer: In particular, 2020 and 2021 arekey hard stop years in terms of CO2 reduction for OEMs in several markets – Europe,China and Japan. Without a materially higher share of hybrid or fully EVs in theirsales mix by then, most OEMs will be unable to achieve these reductions.
The rise of the robo-cars Autonomous vehicles (AVs), otherwise known as self-driving cars, are a vision of the not-too-distant future in which a vehicle can drive itself from A to B without human input. This will be made possible through the use of various sensors, lasers, radars, cameras, advanced driver assistance systems, software, GPS, mapping data, and wireless data communication systems. The data picked up by these sensors must be interpreted by ultra-high-speed computer processors to provide real-time route guidance, navigation, and obstacle detection.
In addition to consumer cars, there are two other types of autonomous vehicles being developed: high passenger-density urban transport and heavy-duty trucks. There has been rapid progress on both.
AV technology is set to create a US$87bn solutions market for OEMs, parts suppliers, and technology companies by 2030E, with software taking the largest share at 29% of the total (source: Lux Research). We think that the large-scale rollout of autonomous cars will likely occur by 2020E, with cars with partial autonomous features set to reach 12-13% penetration by 2025E (source: BCG). Fully autonomous cars will reach 32% global penetration or 21mn units by 2030E, and rise to 75mn units by 2040E (source: IHS 2016).
There are numerous potential benefits from AV technology including:
• Improved safety: There are 6mn car crashes every year in the US, causing 3.9mninjuries, damaging 24mn cars, and leading to 40,000 traffic deaths. Worryingly, 95%of accidents are caused by human error (source: NHTSA). According to the USDepartment of Transportation, as many as 80% of all crashes could be avoided usingself-driving technology.
• Less congestion and pollution: AVs can improve fuel economy by 4-10% just byaccelerating and decelerating more smoothly than human drivers (source: RAND).Platooning – AVs driving together resembling a train – can increase road capacityand reduce highway fuel use by up to 20% (source: KPMG). This makes start-and-stop traffic a thing of the past.
• Greater productivity: Given an average commute of 25 minutes, around 80% of theUS workforce loses 50 minutes of potential productivity every workday (source:KPMG). If the freed-up time were used for work-related activities, this wouldtranslate into a 10-15% productivity increase assuming an eight-hour hour workday

14 The RIC Report | 14 March 2017
Chart 13: Progression toward autonomous driving
Source: Continental
Some hurdles to adoption Despite the conversation on autonomous vehicle adoption reaching the tipping point, several hurdles remain to full commercial adoption:
• Regulation/ Insurance: Fully autonomous driving systems, where no interventionwould be required by the driver, will require changes to regulation for determiningfault in the event of an accident (ie, the driver, OEM, or supplier).
• Cost: The cost of a fully autonomous vehicle features is expected to be aroundUS$5,000-10,000 at introduction in 2025 (source: BCG 2015, Valeo, Delphi). Whilethis is feasible for affluent premium-car consumers, costs will have to fall for widerglobal adoption.
• Ethics: Widespread adoption of driverless cars will involve OEMs tackling somedifficult ethical issues. How should the car be programmed to act in the event of anunavoidable accident? Should it minimize the loss of life, even if it means sacrificingthe occupants, or should it protect the occupants at all costs? The answers to thesequestions will have a significant impact on the way self-driving cars are accepted insociety (ie, would consumers buy a car programmed to sacrifice the owner?).
Shared autonomous EVs the optimal mode of transport The sharing economy is expected to change traditional vehicle ownership models more in the next 5-10Y than in the last 50Y (source: GM). In the long run, a shared vehicle that replaces its internal combustion engine with electric, and replaces its human driver with AI, will be the cheapest, fastest and most flexible form of transport. Today, a fleet of autonomous EVs on the Tesla Network would cost around US$0.42-0.49/mile, including charging, insurance, and maintenance. This is 70-85% cheaper than ride-hailing, up to 50% cheaper than car ownership, and even 35-65% cheaper than car-sharing (source: Chen et al 2016). Many studies show that the long-term cost of a robo-taxi could be as low as US$0.17-0.30/mile as infrastructure, R&D, and other start-up costs fall (source: Chen et al 2016, BCG 2016, KPMG, BNEF/McKinsey, Rock Mountain Institute). This is 40-70% cheaper than ownership, and could even be cost competitive compared with mass transit at a rate of two passengers, but with a 40% lower commute time (source: BCG).

The RIC Report | 14 March 2017 15
Existing modes of multimodal transport – including ride-hailing (Uber), ride-sharing (Commutr), and car-sharing (Zipcar) – are already economical in many situations vs ownership and public transport. For someone traveling 4,000 miles or less per year in the US, ride-hailing would be cheaper than buying and operating a new car. This is often the case for urbanites with shorter commutes. For those travelling 5,000 miles or less per year, using multimodal transport would be around 24% cheaper than a new car, without any sacrifice to time or convenience (source: McKinsey).
Internet of Cars: more cars than phones getting connected Connectivity is an enabler of future mobility and a feature that consumers are increasingly demanding. The Internet of Things (IoT) is one of the biggest disruptors of our age with 25bn connected devices today and an estimated 50bn by 2020E (source: Ericsson, Cisco). IoT is now reaching the automobile, creating the Internet of Cars (IoC). Consultant Chetan Sharma noted that in 1Q16, there were more automobiles getting connected to the network in US than smartphones. In Europe, six out of 10 (59%) of consumers say that connected features influenced their decision to buy a vehicle, and one in three (32%) says it is an important criteria that influenced their decision (source: TNS and the BearingPoint Institute).
The auto-tech arms race For tech giants, the US$5tn transport sector presents a major growth area. Connected cars will drive growth of the global automotive semiconductor market, which is projected to reach US$36bn by 2018E (9% of the total industry, +6.4% CAGR from 2016) (source: BofAMLe). Average semi content stands at US$345 per car today (+40% higher vs 2009), and is set to grow to over US$1000. Infotainment is one of the largest auto semis clusters today at US$5bn, and growing 7% pa. Semis are helping to redefine auto architecture into an integrated cockpit, with OEMs, suppliers and tech enablers aiming for a fully configurable, touch-free experience using gesture control, voice recognition, and eye detection, etc. The next stepwise changes will be led by EVs and AVs. EVs can take semi content up to US$700, while autonomous driving will represent another US$550 of incremental content.
New opportunities The average autonomous car is expected to generate 4,000GB of data per day by 2020E, compared with the 6-700MB per day for the average human now (source: Intel, Cisco). The data generated could help create new business models that, if fully realized, can form a service economy worth US$450-750bn by 2030E (source: McKinsey). Tech companies and other new entrants can have a major role in sifting through the data flood, in order to generate value-added knowledge. Their fundamental models for value creation revolve around generating direct revenues, reducing costs and improving safety and security.
Future mobility stock list The following covered companies were identified as publicly traded participants in the future mobility market in the February 16, 2017 BofA Merrill Lynch Global Future Mobility Primer.
In the full report, the thematic investing team mapped opportunities across 4 entry points for investors wishing to invest in the Future Mobility theme including: 1) electrification; 2) autonomous driving; 3) Internet of Cars (IoC); and 4) shared mobility. We outline these areas in much greater detail throughout our Primer report. For each company, we have estimated the level and materiality of companies’ exposure to future mobility-related themes – and the role of future mobility as a long-term growth driver. For each company, we have characterised their future mobility exposure as follows:
• Low – Future Mobility-related products, technologies, services, and solutions are notmaterial to global revenues and/or growth but are one factor, among others, for thebusiness model, strategy & R&D of the company.
• Medium – Future Mobility -related products, technologies, services, and solutions arean important factor for the business model, strategy and R&D of the company;material to sales and/or growth.

16 The RIC Report | 14 March 2017
• High – Future Mobility -related technologies, services, and solutions are core to thebusiness model, strategy and R&D of the company; material sales and/or growthdriver; pure play (i.e., 100% of sales).
Although it is difficult to accurately gauge the link between such exposure and share price performance (as many factors outside the scope of this analysis are likely to play a role in short- and long-term price development), we still consider future mobility exposure as an important and positive point to track given that future mobility is a global “Transforming World” theme with a long lifespan.
Table 3: Future mobility stock universe
Company BofAML Ticker Price 3/10/2017 Mkt. Cap US$m Q-R-Q Country
Future Mobility Sub-Sector
Future Mobility Exposure
Autonomous Alphabet C GOOG 843.25 588,864 B-1-9 United States Technology Medium Baidu.com-ADR BIDU 172.74 59,925 C-1-9 China Technology Low Delphi DLPH 77.09 20,781 C-3-7 United Kingdom Autoparts Supplier Medium Ford Motor F 12.53 49,798 C-2-7 United States Automaker Medium General Motors GM 36.83 55,170 C-2-7 United States Automaker Medium Gentex GNTX 21.52 6,183 C-3-7 United States Autoparts Supplier Medium Intel INTC 35.91 169,782 B-1-7 United States Tech Hardware Low Magna Intl MGA 42.71 16,326 C-3-7 Canada Autoparts Supplier Medium Nvidia NVDA 99.12 58,382 C-1-7 United States Tech Hardware Medium QUALCOMM QCOM 58.64 86,614 B-1-7 United States Semiconductors Medium Sensata ST 41.82 7,146 C-1-9 United States Autoparts Supplier Low TE Connectivity Ltd. TEL 74.61 26,508 C-1-7 United States Autoparts Supplier Medium Tesla TSLA 243.69 39,397 C-3-9 United States Automaker Medium Texas Instr. TXN 80.33 80,301 B-1-7 United States Semiconductors Low Toyota Motor TM 112.66 183,805 B-2-7 Japan Automaker Low Electric Vehicles BorgWarner BWA 41.79 8,888 C-3-7 United States Autoparts Supplier Medium Delphi DLPH 77.09 20,781 C-3-7 United Kingdom Autoparts Supplier Medium FMC FMC 60.05 8,028 B-3-7 United States Battery Materials Low General Motors GM 36.83 55,170 C-2-7 United States Automaker Low Parker Hannifin PH 157.32 20,970 B-1-7 United States Battery Materials Low Sensata ST 41.82 7,146 C-1-9 United States Autoparts Supplier Low SQM SQM 32.99 9,027 C-2-8 Chile Battery Materials Medium TE Connectivity Ltd. TEL 74.61 26,508 C-1-7 United States Autoparts Supplier Medium Tesla TSLA 243.69 39,397 C-3-9 United States Automaker High Toyota Motor TM 112.66 183,805 B-2-7 Japan Automaker Low Connected Alphabet C GOOG 843.25 588,864 B-1-9 United States Technology Medium Amazon.com AMZN 852.46 406,769 B-1-9 United States Technology Low Analog Devices ADI 82.20 25,417 C-1-7 United States Semiconductors Low Apple Inc. AAPL 139.14 730,004 B-1-7 United States Technology Low Broadcom AVGO 226.35 90,848 C-1-7 Singapore Semiconductors Low Delphi DLPH 77.09 20,781 C-3-7 United Kingdom Autoparts Supplier Medium Intel INTC 35.91 169,782 B-1-7 United States Tech Hardware Medium Microsoft Corp MSFT 64.93 501,749 B-1-7 United States Technology Low Nvidia NVDA 99.12 58,382 C-1-7 United States Tech Hardware Medium ON Semiconductor ON 15.22 6,386 C-1-9 United States Semiconductors Medium QUALCOMM QCOM 58.64 86,614 B-1-7 United States Semiconductors Medium TE Connectivity Ltd. TEL 74.61 26,508 C-1-7 United States Semiconductors Medium Texas Instr. TXN 80.33 80,301 B-1-7 United States Semiconductors Medium Xilinx XLNX 59.55 14,824 C-3-7 United States Semiconductors Low Shared Alphabet C GOOG 843.25 588,864 B-1-9 United States Technology Medium Ford Motor F 12.53 49,798 C-2-7 United States Automaker Low General Motors GM 36.83 55,170 C-2-7 United States Automaker Low Tesla TSLA 243.69 39,397 C-3-9 United States Automaker Medium Source: BofA Merrill Lynch Global Research. This screen is not a recommended list either individually or as a group of stocks. Investors should consider the fundamentals of the companies and their own individual circumstances/objectives before making any investment decisions.

The RIC Report | 14 March 2017 17
RIC asset class views Table 4: Research Investment Committee asset class views Asset Class RIC view Comments
(+ / = / –) Equity markets
US equities + Low but rising rate expectations, modest inflation and a strong dollar are good for stocks Also EPS and sales growth are favorable. But we have concerns about high valuations and potential for disappointment if policy implementation is delayed. Prefer dividend growers.
Consumer Discretionary + Principally domestic orientation, so less exposed to global trade concerns; beneficiary of lower proposed income taxes (increased spending) and corporate taxes, and improved confidence. Watch rising labor costs as economy heats up.
Consumer Staples – High quality stocks but vulnerable to higher dollar and higher inflation. Global sector that would be hurt by restrictions on trade; still expensive. Energy = Oil price forecast suggests upside, but would be hurt by stronger dollar and higher rates. We remain concerned about production risk.
Financials + Key beneficiary of rising rates, steeper yield curve, higher volatility. Attractive valuations (P/B) and earnings revisions are improving. Banks, brokers, insurers likely beneficiaries of reduced regulation.
Health Care + Should get less pricing scrutiny under new administration; earnings and sales improving and PMs have reduced exposure. Prefer managed care and biotech, pharma for yield; watch exposure to hospitals and devices if ACA gets revised/repealed.
Industrials = Highest quality sector, beneficiary of higher commodity prices and improving global growth; benefits from infrastructure and defense spending. Information Technology = Repatriation would benefit but other tax plans less helpful. Vulnerable to trade friction issues. Balance sheets strong, inexpensive. Materials – Benefits from commodity price strength and “buy American,” but most exposed sector to China and still has excess capacity. Real Estate = Most GDP-sensitive sector; good combination of dividend yield plus dividend growth. Hurt by rising rates but can lead to better property cash flows. Telecom Services + Yield at a reasonable price; beneficiary of less anti-broadband regulation and lower corporate taxes; opportunities for growth as data usage rises. Utilities – Expensive and hurt by rising rates; leverage and earnings volatility are both high. Should benefit from lower corporate tax rates.
Growth – Growth may lose momentum as profits growth accelerates, but it is cheap and we like exposure to selected Technology and Industrials. Prefer “half growth, half yield” stocks.
Value + Value tends to outperform when profits are accelerating as we believe they are today. Value indices have high exposure to Energy and Financials.
Small cap + Should benefit from pro-growth policy action and lower corporate taxes. Less vulnerable to global trade friction but valuation to large cap near extremes.
Large cap = Prefer high quality stocks with good dividend growth potential.
Europe (ex. UK) = Expect 11% growth in EPS in 2017 on better growth, as long as euro stays weak and commodity prices recover. PMIs hitting multi-year highs. Take balanced sector approach between cyclicals/defensives. O/W energy, banks, pharmaceuticals, utilities.
United Kingdom − Brexit fallout is GBP weakness and slower economic growth. Current growth looks unsustainable. Avoid domestic UK stocks.
Japan + We think yen weakens in 2017 (shifting spending to services). BoJ monetary policy, as well as fiscal policy, endorses reflation. Expect GDP growth forecasts to rise. Like cyclicals/exporters along with domestic demand beneficiaries. Favor financials.
Asia Pac (ex. Japan) + Valuations attractive. Fundamentals strong due to competitive currencies and global growth/commodity strength. Expect improving cash flow/EPS.
Emerging markets + Beneficiary of rising global growth and rising inflation expectations in DM. China debt service stability and shift to inflation should deflect pessimism. Currencies competitive but “too strong” dollar a risk. China, Russia, Taiwan, Korea, Brazil favored.
Fixed income markets Treasuries –- Treasuries will benefit from risk-off trades as they occur, but we see better yield opportunities elsewhere. The big risk is fiscal stimulus. Agencies / MBS = Historically, MBS have had a good mix of returns and volatility. TIPS = Inflation will likely rise modestly in the coming 12-18 months, but the market appears to be priced for much of that. US IG Corporates + Investment grade (IG) debt offers a good yield pickup over Treasuries, while still high quality. US HY Corporates – High debt levels, narrowing spreads, and weak earnings pose a risk, but potentially better growth and higher energy prices are a positive. Preferred securities = Favor QDI payers and fixed-to-floating structures. Non-US DM Sovereigns – Yields remain low and are likely to rise. A stronger dollar is a risk. EM $ Sovereigns = Economic growth is likely to outpace that in developed nations, but the market has rallied and spreads have narrowed. EM local currency Sovereigns = Favorable growth, fiscal, and current account prospects. Rising dollar is a risk.
Commodities/FX Gold = We expect the price to be $1400/oz at year end, on average in 2018. Fed rate hikes are the key obstacle to a sustained bull market. Oil + We forecast Brent Crude oil to rise to $70/bbl by mid-year, and to average between $50-$70/bbl through 2022. US dollar = We expect the US dollar to rise modestly against most currencies. Source: BofA Merrill Lynch Global Research
Notes to RIC views Ratings designations are as follows: (+) favorable view; (=) neutral view; (-) unfavorable view. Ratings reflect the Research Investment Committee’s view for an investment time horizon of 12 months. Typically, the RIC view will agree with regional/product strategists, but at times there may a difference of opinion based on investor suitability or time frame.

18 The RIC Report | 14 March 2017
Fixed Income, Economics, Commodities, Currencies: views and risks Table 5: Regional strategist views and associated risks
Views Risks Global Economics (Ethan Harris) • We expect 2% growth from 1Q to 3Q as growth momentum is slowed by policy uncertainty. However,
by late in the year we expect moderate fiscal stimulus to kick in moving growth higher. This should allow the Fed to hike in March, then twice more in Sep and Dec.
• The UK is likely to skirt a recession following Brexit, but we expect growth to slow to 1.4% this year. Euro area growth should fall more modestly to 1.5%, with external developments posing the greatest risks to the forecast.
• We take a pause from our structural EM bullishness as we think spreads are too tight ahead of the major uncertainty around US tax reform and French elections in April. However, we would buy the dip as we ultimately expect spreads to revisit their 2012 lows. EM remains supported by improving data, rising commodity prices and strong equity sentiment in the US. Focus on relative value, short duration and idiosyncratic trades.
• Downside risks: the main risk comes from polices driven by populism. This includes trade protectionism in the US and a move toward anti-EU parties in Europe.
• Upside risks: stronger animal spirits after the US election lift spending and investment, and US fiscal expansion could be larger than expected. Better growth in EM is another upside risk.
Global Rates (Shyam Rajan, Ralf Preusser) • US: The sweep election outcome is a game changer. Fiscal stimulus would clear the path for expectations of
faster Fed hikes and bring more front-end supply, giving the 5y sector in the US a lot more room to underperform. We expect 10y rates to test 3% and the 5s-30s curve to bear flatten.
• Europe: Politics have taken over as main driver of European rates, with short positioning in core EUR rates now reduced and positioning in the periphery turning negative. While higher US rates, shorter German QE purchases and rising inflation prints support a bearish bias, investors may remain close to neutral until political risks recede.
• US: The biggest risk to our higher rates view is extended expectations in risk assets and the upcoming election cycle in Europe.
• Europe: A large selloff in US rates could drive EUR rates higher despite existing political risks. Reduced risks associated with French elections could also lead to a significant selloff in rates, especially as headline inflation continues rising.
Global Commodities (Francisco Blanch) • Oil: OPEC agreed to cut crude oil output by 1.2mn b/d with key non-OPEC producers indicating a 600k
b/d curb, a first since 1998. Country quotas and an independent production monitoring committee are also part of the deal, so we expect firmer compliance. We see Brent crude oil averaging $61/bbl in 2017 and hitting $70 by mid-year on the seasonal ramp-up in demand.
• Gold: The outcome of the US presidential elections has changed gold market dynamics. A sharp push higher in nominal and real yields is a headwind to gold. For gold to rise, inflation needs to pick up so real yields stabilize. This may happen through 2017.
• We see EM oil demand expanding by 1.2mn b/d in 2017 but acknowledge downside risks on the back of higher US rates.
• OPEC's action won't propel prices much above our $70 mid-year target. Longer term, we estimate global oil demand will increase by 1.2mn b/d per year over five years at $55-75, and by 1.7mn b/d at $30/bbl.
Global Credit (Michael Contopoulos, Hans Mikkelsen) • We expect US high grade spreads to tighten to 105bp in 2017. • We are bullish on high grade spreads due to continued positive technicals and improving fundamentals. We
expect supply to decline 17% in 2017 while demand remains strong. Also earnings are rebounding for companies with considerable foreign sales exposure, and releveraging activity is declining.
• We expect HY to return 6% this year, driven by continued outperformance from lower quality names over the next several months. However, we think this will ultimately give way to an underwhelming 2nd half of the year.
• In our view, the likely catalyst for a weaker 2nd half is the eventual realization that the promise for tax and infrastructure reform underwhelms and is likely delayed. The month leading up to the August recess is the time period to watch out for, as investors will likely expect concrete plans with signs of passage.
• The biggest risk to US investment grade is the possibility of wider credit spreadsfollowing a rates shock, likely prompted by a rebound in the global economy, leading to fund outflows and institutional repositioning.
• The biggest risk to high yield at the moment is a strong pickup in inflation, which could potentially be caused by fiscal reform via a Border Adjustment Tax. We also think oil falling to the $40 range and remaining there for an extended period of time poses a strong risk to high yield corporates.
Municipals (Philip Fischer) • The muni market grew very little in the fourth quarter of 2016, though international demand has
steadily grown. P&C muni holdings steady as a percent of their assets. • The House Republican plan to repeal and replace Obamacare passed two House Committees by
Thursday after lengthy debates. The American Health Care Act makes significant changes to Medicaid that will likely decrease federal funding over time, and increase budget pressures on the states. Medicaid makes up roughly one-third of state budgets.
Global FX (David Woo) • A clean sweep for the Republicans at the US election provides the green light for fiscal loosening and a
stronger USD. Our highest conviction is for a higher USD/JPY given its interest rate sensitivity and as Japan domestic flows turn JPY negative. Politics will be an important theme for EUR.
• The ECB has extended QE but at a slower pace, consistent with our view that the market increasingly will focus on the potential end of QE, pushing EUR/JPY higher. In the near term we do not preclude some pullback in the USD given its aggressive moves and stretched positioning.
• EM: We are starting to see divergence in EM FX. In particular, we are seeing real signs of reflation in CEE FX, which makes PLN and CZK the most likely candidates for appreciation given their more hawkish central banks. In LatAm, we forecast weaker FX vs USD with MXN and BRL to remain volatile, while PEN and CLP and ARS, to a lesser extent, are more resilient, driven by local dynamics.
• An upside surprise to persistently low US inflation could induce expectations of faster Fed normalization, higher yields and thereby a higher USD.
• Downside risk for EUR-USD comes from the possibility of more aggressive QE moves from the ECB and falling oil prices.
• EM: A slowdown in China, higher US rates and policy uncertainty in the US remains a major risk for global trade, with direct implications for Mexico and Asia.
Source: BofA Merrill Lynch Global Research

The RIC Report | 14 March 2017 19
Global equity markets: views and risks Table 6: Regional strategist views and associated risks
Views Risks Global Equities (Michael Hartnett) • Peak liquidity, peak globalization and peak inequality suggest peak returns, but also big rotation in 2017. • Asset allocation: long stocks, real estate, commodities, US dollar and short bonds. • 2017 expected returns: double digits for Japan, Europe, UK stocks, and oil; single digits for US stocks,
commodities, the USD & Emerging Markets; low/negative returns for corporate & government bonds. • We expect inflation & interest rates to surprise to the upside in 2017, leading to a rotation from “deflation” to
“inflation”, from “ZIRP winners” to “ZIRP losers”, from Wall Street to Main Street. • We believe fiscal stimulus accelerates, trade and immigration policies tighten, and wage growth
accelerates, boosting domestic demand across the G7. • Disruptive technology and aging demographics remain powerful secular forces; they won’t likely prevent a
cyclical pick-up in inflation; but they are likely to constrain the magnitude of the rise in rates and inflation.
• Boom-bust scenario where Fed is forced to respond to macro inflation via bear flattening of yield curve, inducing wider credit spreads, forced liquidation and a bond crash (see Orange County/Mexico 1994).
• US protectionism (global trade war) + weaker-than-expected US growth (policy disappointment) could lead to elevated volatility and stagflationaryreturns.
United States (Savita Subramanian) • Our 2017 year-end S&P 500 target is 2450 and our long-term (year-end 2025) S&P 500 target is 3500. Our
target reflects the increasing likelihood that we are entering the typical later stages of a bull market, during which fundamentals typically take a back seat to sentiment and technicals.
• We forecast 2016 EPS of $118.50 (flat y/y), 2017 EPS of $129 (+9% y/y), and 2018 EPS of $137 (+6% y/y). • Valuations are above historical levels across most metrics, but most metrics are far from stretched, and
stocks still look attractive relative to bonds. • We favor large caps and small caps to mid caps, value over growth, and div. growth to high div. yield.• Overweight Health Care, Financials, Telecom, and Cons. Discr. Underweight: Materials, Utilities and
Consumer Staples. • Post-US election, we believe that tax reform beneficiaries could outperform, whereas fiscal stimulus
beneficiaries could disappoint. See 2017 Theme Screens report for details.
• Risks: protectionism and trade wars crimp growth and squeeze margins,sales growth fails to materialize, global growth disappoints, economic shock tied to credit, global recession; a slowdown in corporate buybacks is not offset by rotation out of fixed income into equities.
• We expect volatility to remain elevated in 2017 as the likelihood of meaningful growth policies wax and wane with political rhetoric.
Europe (James Barty) • We are constructive on European equities especially the earnings cycle given accelerating nominal global
growth. We forecast 11% EPS growth this year and have 5% upside to our 12m Stoxx 600 rolling target of 390.
• Longer-term we think Europe can outperformance the US if Le Pen doesn’t win the French election as uncertainty is priced out of European equities allowing them to re-rate and flows to return.
• We are watching rising in rates closely. We see 30-50bp runway for inflation breakevens to rise back to longer term levels before real rates lead the move, which is typically equity negative.
• Our sector allocation is framed around four themes: 1) skew to reflation beneficiaries with o/w Banks on the short duration side. 2) preference for beneficiaries of rising energy prices / inflation (o/w Oils & Chems, u/w Autos, Construction), 3) avoid UK consumer sectors (u/w Retail and Travel), 4) value preference in Defensives (Utilities and Pharma overweight vs Food & Beverage underweight).
• Political risks likely to dominate into elections in Holland, France: downside from populism gaining further ground; upside if reformers come to power.
• Escalation of US trade policy risks causing risk-off move or upside surprise to tax reform/ fiscal spending expectations causing dollar / US rates overshoot.
• More hawkish ECB policy and / or sharp rise in bond yields without a complementary pick-up in growth and inflation expectations would put pressure on periphery yields in particular.
• Chinese growth or financial stability concerns resurface.
Japan (Shusuke Yamada) • We expect USD/JPY to rise to 122 in 1H17 and the Nikkei 225 index to end the year at 21,000. • Constructive on Japanese equity for five reasons. 1) Contrarian resumption of JPY weakness to end
Japanese deflation. We expect $/¥ to rise back to 120 this year. 2) A policy return to nominal reflation with the new economic package closing much of the existing GDP gap and the BoJ's September policy meeting strengthening the sustainability of monetary policy. 3) Portfolio rebalancing by Japanese investors. 4) Stretched pessimism over undervaluation of Japanese shares. 5) Long-term chart technical remain bullish with a long-term technical objective of 28,500 for the Nikkei.
Risks: • Heightened US protectionism and a weak dollar policy. • Adverse effects from rising interest rates.• RMB and oil weakening.
Asia-Pac ex-Japan (Ajay Kapur) • We turned tactically neutral on Asia ex-Japan (AxJ) on account of the global equity risk-love sentiment
reaching euphoric levels. However, we continue to remain structurally bullish on the region based on reasonable valuations, undervalued currencies, good macro fundamentals and an expected torrent of free cash flow (FCF). We expect FCF in AxJ to more than double from 2016 to 2018. The projected FCF-to-sales ratio is likely to hit close to a record high of 5.8% by 2018 from 3.2% at end-2016.
• Leading indicators of AxJ earnings growth - world trade, US ISM, asset price growth indicator (which has an opinion on global growth), China monetary conditions and earnings revisions suggest 20% Asia ex-Japan earnings growth in 2017. The Street has EPS growth at 15% for 2017.
• Overweight: China, Korea and Taiwan; Underweight: The Philippines, India, Malaysia and Hong Kong.
Downside risks • Stronger USD• Protectionism• China policy tightening• European politics
Emerging Markets (Ajay Kapur)• We are tactically neutral on Emerging Markets on account of the global equity risk-love sentiment reaching
euphoric levels.). However, our structural bullishness on EMs remains intact. EM valuations are reasonable, currencies are competitive, EM financial vulnerability is at a 10-year low, while a slew of indicators are suggesting nominal global growth is likely to continue to pick up.
• EEMEA cross asset strategist David Hauner has a long-term positive stance on EEMEA but believes March may bring a pullback in EEMEA equities. Our LatAm strategist Felipe Hirai, is positive on LatAm equities.
• Overweight: Russia, China, Korea, Taiwan and Turkey; Underweight: The Philippines, India, Malaysia, South Africa, and Mexico.
Downside risks • Policy tightening in China. • Stronger USD. • US growth is weaker and inflation is higher than what consensus expects.
Source: BofA Merrill Lynch Global Research

20 The RIC R
eport | 14 March 2017
Asset allocation for individual investors The tables below represent asset allocation recommendations by investor profile (Conservative – Aggressive). Strategic allocations are designed to be long-term, 20- to 30-year benchmarks developed by the Global Wealth & Investment Management Chief Investment Office (GWIM CIO). RIC Tactical allocations have a 12-month horizon,and are provided by the BofA Merrill Lynch Global Research Investment Committee. Both Strategic and RIC Tactical allocations are intended for individual investors.
Asset allocation for US clients Table 7: Strategic and Tactical allocations without alternative assets (Tier 0 liquidity) Tier 0 (highest liquidity): Highest liquidity needs with none of the portfolio invested in less liquid alternative asset categories.
All Fixed Income Conservative Moderately Conservative Moderate Moderately Aggressive Aggressive All Equity Strategic RIC Tactical Strategic RIC Tactical Strategic RIC Tactical Strategic RIC Tactical Strategic RIC Tactical Strategic RIC Tactical Strategic RIC Tactical
Equities 0% 0% 21% 24% 37% 42% 53% 60% 69% 74% 84% 89% 98% 98% Large Cap Growth 0% 0% 5% 4% 9% 8% 12% 11% 16% 15% 19% 18% 23% 22% Large Cap Value 0% 0% 8% 10% 14% 16% 19% 22% 25% 27% 29% 31% 36% 36% Small Cap Growth 0% 0% 1% 1% 1% 2% 2% 3% 2% 3% 3% 4% 3% 3% Small Cap Value 0% 0% 1% 2% 1% 2% 2% 4% 2% 3% 3% 4% 4% 5% International Equity 0% 0% 5% 5% 9% 10% 13% 14% 17% 18% 21% 22% 24% 24% Emerging Markets 0% 0% 1% 2% 3% 4% 5% 6% 7% 8% 9% 10% 8% 8%
Fixed Income 98% 98% 55% 52% 61% 56% 45% 38% 29% 24% 14% 9% 0% 0% Governments 28% 27% 17% 15% 17% 14% 14% 10% 9% 6% 5% 2% 0% 0% Mortgages 23% 23% 12% 11% 15% 14% 11% 9% 7% 6% 3% 2% 0% 0% Corporates 24% 28% 10% 12% 15% 17% 14% 16% 9% 10% 4% 5% 0% 0% High Yield 7% 5% 4% 3% 5% 3% 4% 2% 3% 2% 1% 0% 0% 0% Intl Fixed Income 16% 15% 12% 11% 9% 8% 2% 1% 1% 0% 1% 0% 0% 0%
Cash 2% 2% 24% 24% 2% 2% 2% 2% 2% 2% 2% 2% 2% 2% Weights have been adjusted qualitatively to be in increments of 1% and the total adds to 100%.
Table 8: Strategic and Tactical allocations with alternative assets (Tier 1 liquidity) Tier 1 (higher liquidity): Up to 15% of the portfolio may be unavailable for 3–5 years.
All Fixed Income Conservative Moderately Conservative Moderate Moderately Aggressive Aggressive All Equity Strategic RIC Tactical Strategic RIC Tactical Strategic RIC Tactical Strategic RIC Tactical Strategic RIC Tactical Strategic RIC Tactical Strategic RIC Tactical
Equities 0% 0% 19% 22% 35% 40% 50% 57% 66% 71% 80% 82% 98% 98% Large Cap Growth 0% 0% 4% 4% 8% 7% 11% 10% 16% 15% 18% 16% 23% 22% Large Cap Value 0% 0% 7% 9% 13% 15% 18% 21% 24% 26% 28% 29% 36% 36% Small Cap Growth 0% 0% 1% 1% 1% 2% 1% 2% 2% 3% 3% 4% 3% 3% Small Cap Value 0% 0% 1% 2% 1% 2% 2% 4% 2% 3% 3% 4% 4% 5% International Equity 0% 0% 5% 5% 9% 10% 13% 14% 16% 17% 20% 20% 24% 24% Emerging Markets 0% 0% 1% 1% 3% 4% 5% 6% 6% 7% 8% 9% 8% 8%
Fixed Income 98% 98% 55% 52% 50% 45% 33% 26% 17% 12% 3% 1% 0% 0% Governments 28% 27% 18% 16% 14% 11% 10% 6% 6% 3% 1% 0% 0% 0% Mortgages 23% 23% 12% 11% 13% 12% 8% 6% 4% 3% 1% 0% 0% 0% Corporates 24% 28% 9% 10% 13% 14% 10% 12% 5% 6% 1% 1% 0% 0% High Yield 7% 5% 4% 3% 4% 3% 3% 1% 1% 0% 0% 0% 0% 0% Intl Fixed Income 16% 15% 12% 12% 6% 5% 2% 1% 1% 0% 0% 0% 0% 0%
Cash 2% 2% 15% 15% 2% 2% 2% 2% 2% 2% 2% 2% 2% 2% Alternatives 0% 0% 11% 11% 13% 13% 15% 15% 15% 15% 15% 15% 0% 0%
Hedge Funds 0% 0% 8% 8% 10% 10% 11% 11% 11% 11% 11% 11% 0% 0% Private Equity 0% 0% 0% 0% 0% 0% 0% 0% 0% 0% 0% 0% 0% 0% Real Assets* 0% 0% 3% 3% 3% 3% 4% 4% 4% 4% 4% 4% 0% 0%
Weights have been adjusted qualitatively to be in increments of 1% and the total adds to 100%. * Real Assets is defined to include commodities and private real estate.

The RIC Report | 14 M
arch 2017 21
Asset allocation for US investors (continued) Table 9: Strategic and RIC allocations with alternative assets (Tier 2 liquidity) Tier 2 (moderate liquidity): Up to 30% of the portfolio may be unavailable for 3–5 years.
All Fixed Income Conservative Moderately Conservative Moderate Moderately Aggressive Aggressive All Equity Strategic RIC Tactical Strategic RIC Tactical Strategic RIC Tactical Strategic RIC Tactical Strategic RIC Tactical Strategic RIC Tactical Strategic RIC Tactical
Equities 0% 0% 17% 20% 32% 37% 46% 53% 60% 65% 73% 75% 98% 98% Large Cap Growth 0% 0% 4% 4% 7% 6% 10% 9% 14% 13% 16% 14% 23% 22% Large Cap Value 0% 0% 6% 8% 12% 14% 16% 19% 21% 23% 26% 27% 36% 36% Small Cap Growth 0% 0% 1% 1% 1% 2% 2% 3% 2% 3% 3% 4% 3% 3% Small Cap Value 0% 0% 1% 2% 1% 2% 2% 4% 2% 3% 3% 4% 4% 5% International Equity 0% 0% 4% 4% 8% 9% 12% 13% 15% 16% 18% 18% 24% 24% Emerging Markets 0% 0% 1% 1% 3% 4% 4% 5% 6% 7% 7% 8% 8% 8%
Fixed Income 98% 98% 55% 52% 51% 46% 35% 28% 19% 14% 3% 1% 0% 0% Governments 28% 27% 18% 16% 15% 12% 11% 7% 6% 3% 1% 0% 0% 0% Mortgages 23% 23% 12% 11% 13% 12% 8% 6% 5% 4% 1% 0% 0% 0% Corporates 24% 28% 9% 10% 12% 13% 11% 13% 5% 6% 1% 1% 0% 0% High Yield 7% 5% 4% 3% 4% 3% 3% 1% 2% 1% 0% 0% 0% 0% Intl Fixed Income 16% 15% 12% 12% 7% 6% 2% 1% 1% 0% 0% 0% 0% 0%
Cash 2% 2% 16% 16% 2% 2% 2% 2% 2% 2% 2% 2% 2% 2% Alternatives 0% 0% 12% 12% 15% 15% 17% 17% 19% 19% 22% 22% 0% 0%
Hedge Funds 0% 0% 6% 6% 8% 8% 9% 9% 9% 9% 11% 11% 0% 0% Private Equity 0% 0% 2% 2% 3% 3% 4% 4% 6% 6% 7% 7% 0% 0% Real Assets* 0% 0% 4% 4% 4% 4% 4% 4% 4% 4% 4% 4% 0% 0%
Weights have been adjusted qualitatively to be in increments of 1% and the total adds to 100%. * Real Assets is defined to include commodities and private real estate.
Table 10: Strategic and RIC allocations with alternative assets (Tier 3 liquidity) Tier 3 (lower liquidity): Up to 45% of the portfolio may be unavailable for 3–5 years.
All Fixed Income Conservative Moderately Conservative Moderate Moderately Aggressive Aggressive All Equity Strategic RIC Tactical Strategic RIC Tactical Strategic RIC Tactical Strategic RIC Tactical Strategic RIC Tactical Strategic RIC Tactical Strategic RIC Tactical
Equities 0% 0% 17% 20% 32% 37% 46% 53% 60% 65% 73% 75% 98% 98% Large Cap Growth 0% 0% 4% 4% 7% 6% 10% 9% 14% 13% 16% 14% 23% 22% Large Cap Value 0% 0% 6% 8% 12% 14% 16% 19% 21% 23% 26% 27% 36% 36% Small Cap Growth 0% 0% 1% 1% 1% 2% 2% 3% 2% 3% 3% 4% 3% 3% Small Cap Value 0% 0% 1% 2% 1% 2% 2% 4% 2% 3% 3% 4% 4% 5% International Equity 0% 0% 4% 4% 8% 9% 12% 13% 15% 16% 18% 18% 24% 24% Emerging Markets 0% 0% 1% 1% 3% 4% 4% 5% 6% 7% 7% 8% 8% 8%
Fixed Income 98% 98% 55% 52% 51% 46% 35% 28% 19% 14% 3% 1% 0% 0% Governments 28% 27% 18% 16% 15% 12% 11% 7% 6% 3% 1% 0% 0% 0% Mortgages 23% 23% 12% 11% 13% 12% 8% 6% 5% 4% 1% 0% 0% 0% Corporates 24% 28% 9% 10% 12% 13% 11% 13% 5% 6% 1% 1% 0% 0% High Yield 7% 5% 4% 3% 4% 3% 3% 1% 2% 1% 0% 0% 0% 0% Intl Fixed Income 16% 15% 12% 12% 7% 6% 2% 1% 1% 0% 0% 0% 0% 0%
Cash 2% 2% 16% 16% 2% 2% 2% 2% 2% 2% 2% 2% 2% 2% Alternatives 0% 0% 12% 12% 15% 15% 17% 17% 19% 19% 22% 22% 0% 0%
Hedge Funds 0% 0% 6% 6% 8% 8% 9% 9% 9% 9% 11% 11% 0% 0% Private Equity 0% 0% 2% 2% 3% 3% 4% 4% 6% 6% 7% 7% 0% 0% Real Assets* 0% 0% 4% 4% 4% 4% 4% 4% 4% 4% 4% 4% 0% 0%
Weights have been adjusted qualitatively to be in increments of 1% and the total adds to 100%. * Real Assets is defined to include commodities and private real estate. Notes: Global Wealth & Investment Management Chief Investment Office’s (GWIM CIO) Strategic Asset Allocation for the US investor was developed for private Merrill Lynch Wealth Management Clients. The Strategic allocations are identified by the GWIM CIO and are designed to serve as guidelines for a 20-30 year investment horizon. The RIC Tactical allocations are provided by the BofA Merrill Lynch Global Research Investment Committee. The GWIM CIO models allocate assets among specified asset classes and, within each class, reflect broad investment diversification. The models offer benchmarks for traditional asset class allocation (stocks, bonds and cash), as well as models for allocations among traditional and alternative asset classes reflecting portfolios targeting varying liquidity levels. The models are designed to provide allocation benchmarks based on risk/return profiles. GWIM CIO defines liquidity as the percentage of assets, by invested value, within a portfolio that can be reasonably expected to be liquidated within a given time duration under typical market conditions. Given the less-liquid nature of certain alternative assets, The BofA Merrill Lynch Global Research Investment Committee does not make RIC Tactical allocation recommendations for portfolios that include these asset classes. Merrill Lynch Wealth Management clients should consult with their financial advisor about any of these allocations.

22 The RIC R
eport | 14 March 2017
Asset allocation for global investors The Asset Allocation for global investors is designed to reduce “home country bias” and introduce a currency perspective. Strategic allocations are designed to be long-term, 20- to 30-year benchmarks developed by the Global Wealth & Investment Management Chief Investment Office (GWIM CIO). RIC Tactical allocations have a 12-month horizon, and are provided by the BofA Merrill Lynch Global Research Investment Committee. Both Strategic and RIC Tactical allocations are intended for individual investors.
Table 11: Strategic and RIC Tactical allocations without alternatives (Tier 0 liquidity) Tier 0 (highest liquidity): Highest liquidity needs with none of the portfolio invested in less liquid alternative asset categories.
All Fixed Income Conservative Moderately Conservative Moderate Moderately Aggressive Aggressive All Equity Strategic RIC Tactical Strategic RIC Tactical Strategic RIC Tactical Strategic RIC Tactical Strategic RIC Tactical Strategic RIC Tactical Strategic RIC Tactical
Equities 0% 0% 22% 25% 37% 42% 52% 59% 66% 71% 81% 86% 98% 98% North America 0% 0% 13% 15% 21% 24% 30% 35% 38% 41% 46% 49% 56% 57% Europe ex UK 0% 0% 3% 3% 5% 5% 7% 7% 9% 9% 11% 11% 13% 13% UK 0% 0% 2% 2% 4% 3% 5% 4% 6% 5% 8% 7% 8% 7% Japan 0% 0% 1% 2% 1% 2% 2% 3% 3% 4% 3% 4% 8% 8% Asia-Pac ex Japan 0% 0% 1% 1% 2% 3% 3% 4% 4% 5% 5% 6% 5% 5% Emerging Markets 0% 0% 2% 2% 4% 5% 5% 6% 6% 7% 8% 9% 8% 8%
Fixed Income 98% 98% 54% 51% 61% 56% 46% 39% 32% 27% 17% 12% 0% 0% Global Governments 55% 53% 30% 28% 33% 29% 23% 18% 15% 12% 8% 5% 0% 0% Global Corporate 18% 21% 8% 9% 10% 11% 9% 11% 7% 8% 4% 5% 0% 0% Global Mortgages 18% 18% 12% 11% 13% 12% 10% 8% 7% 5% 4% 2% 0% 0% Global HY, EM debt 7% 6% 4% 3% 5% 4% 4% 2% 3% 2% 1% 0% 0% 0%
Cash 2% 2% 24% 24% 2% 2% 2% 2% 2% 2% 2% 2% 2% 2% Weights have been adjusted qualitatively to be in increments of 1% and the total adds to 100%.
Table 12: Strategic and RIC Tactical allocations with alternatives (Tier 1 liquidity) Tier 1 (higher liquidity): Up to 15% of the portfolio may be unavailable for 3–5 years.
All Fixed Income Conservative Moderately Conservative Moderate Moderately Aggressive Aggressive All Equity Strategic RIC Tactical Strategic RIC Tactical Strategic RIC Tactical Strategic RIC Tactical Strategic RIC Tactical Strategic RIC Tactical Strategic RIC Tactical
Equities 0% 0% 19% 22% 34% 39% 48% 55% 63% 68% 77% 81% 98% 98% North America 0% 0% 10% 12% 19% 22% 27% 32% 36% 39% 44% 46% 56% 57% Europe ex UK 0% 0% 3% 3% 5% 5% 6% 6% 9% 9% 11% 11% 13% 13% UK 0% 0% 2% 2% 3% 2% 5% 4% 6% 5% 7% 6% 8% 7% Japan 0% 0% 1% 2% 2% 3% 2% 3% 2% 3% 3% 4% 8% 8% Asia-Pac ex Japan 0% 0% 1% 1% 2% 3% 3% 4% 4% 5% 5% 6% 5% 5% Emerging Markets 0% 0% 2% 2% 3% 4% 5% 6% 6% 7% 7% 8% 8% 8%
Fixed Income 98% 98% 53% 50% 49% 44% 35% 28% 20% 15% 7% 3% 0% 0% Global Governments 55% 53% 30% 28% 26% 22% 17% 12% 9% 6% 3% 0% 0% 0% Global Corporate 18% 21% 8% 9% 8% 9% 7% 9% 5% 6% 2% 3% 0% 0% Global Mortgages 18% 18% 12% 11% 11% 10% 8% 6% 4% 2% 1% 0% 0% 0% Global HY, EM debt 7% 6% 3% 2% 4% 3% 3% 1% 2% 1% 1% 0% 0% 0%
Cash 2% 2% 13% 13% 2% 2% 2% 2% 2% 2% 2% 2% 2% 2% Alternatives 0% 0% 15% 15% 15% 15% 15% 15% 15% 15% 14% 14% 0% 0%
Hedge Funds 0% 0% 11% 11% 11% 11% 11% 11% 11% 11% 10% 10% 0% 0% Private Equity 0% 0% 0% 0% 0% 0% 0% 0% 0% 0% 0% 0% 0% 0% Real Assets* 0% 0% 4% 4% 4% 4% 4% 4% 4% 4% 4% 4% 0% 0%
Weights have been adjusted qualitatively to be in increments of 1% and the total adds to 100%. * Real Assets is defined to include commodities and private real estate.
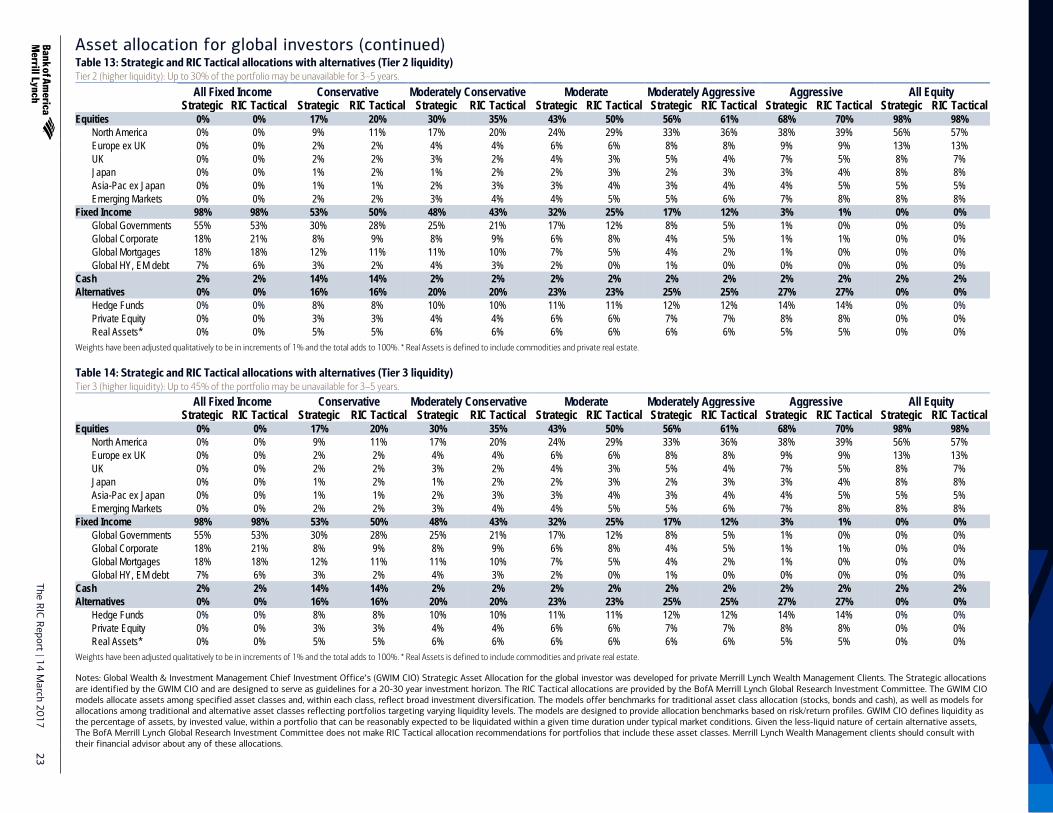
The RIC Report | 14 M
arch 2017 23
Asset allocation for global investors (continued) Table 13: Strategic and RIC Tactical allocations with alternatives (Tier 2 liquidity) Tier 2 (higher liquidity): Up to 30% of the portfolio may be unavailable for 3–5 years.
All Fixed Income Conservative Moderately Conservative Moderate Moderately Aggressive Aggressive All Equity Strategic RIC Tactical Strategic RIC Tactical Strategic RIC Tactical Strategic RIC Tactical Strategic RIC Tactical Strategic RIC Tactical Strategic RIC Tactical
Equities 0% 0% 17% 20% 30% 35% 43% 50% 56% 61% 68% 70% 98% 98% North America 0% 0% 9% 11% 17% 20% 24% 29% 33% 36% 38% 39% 56% 57% Europe ex UK 0% 0% 2% 2% 4% 4% 6% 6% 8% 8% 9% 9% 13% 13% UK 0% 0% 2% 2% 3% 2% 4% 3% 5% 4% 7% 5% 8% 7% Japan 0% 0% 1% 2% 1% 2% 2% 3% 2% 3% 3% 4% 8% 8% Asia-Pac ex Japan 0% 0% 1% 1% 2% 3% 3% 4% 3% 4% 4% 5% 5% 5% Emerging Markets 0% 0% 2% 2% 3% 4% 4% 5% 5% 6% 7% 8% 8% 8%
Fixed Income 98% 98% 53% 50% 48% 43% 32% 25% 17% 12% 3% 1% 0% 0% Global Governments 55% 53% 30% 28% 25% 21% 17% 12% 8% 5% 1% 0% 0% 0% Global Corporate 18% 21% 8% 9% 8% 9% 6% 8% 4% 5% 1% 1% 0% 0% Global Mortgages 18% 18% 12% 11% 11% 10% 7% 5% 4% 2% 1% 0% 0% 0% Global HY, EM debt 7% 6% 3% 2% 4% 3% 2% 0% 1% 0% 0% 0% 0% 0%
Cash 2% 2% 14% 14% 2% 2% 2% 2% 2% 2% 2% 2% 2% 2% Alternatives 0% 0% 16% 16% 20% 20% 23% 23% 25% 25% 27% 27% 0% 0%
Hedge Funds 0% 0% 8% 8% 10% 10% 11% 11% 12% 12% 14% 14% 0% 0% Private Equity 0% 0% 3% 3% 4% 4% 6% 6% 7% 7% 8% 8% 0% 0% Real Assets* 0% 0% 5% 5% 6% 6% 6% 6% 6% 6% 5% 5% 0% 0%
Weights have been adjusted qualitatively to be in increments of 1% and the total adds to 100%. * Real Assets is defined to include commodities and private real estate.
Table 14: Strategic and RIC Tactical allocations with alternatives (Tier 3 liquidity) Tier 3 (higher liquidity): Up to 45% of the portfolio may be unavailable for 3–5 years.
All Fixed Income Conservative Moderately Conservative Moderate Moderately Aggressive Aggressive All Equity Strategic RIC Tactical Strategic RIC Tactical Strategic RIC Tactical Strategic RIC Tactical Strategic RIC Tactical Strategic RIC Tactical Strategic RIC Tactical
Equities 0% 0% 17% 20% 30% 35% 43% 50% 56% 61% 68% 70% 98% 98% North America 0% 0% 9% 11% 17% 20% 24% 29% 33% 36% 38% 39% 56% 57% Europe ex UK 0% 0% 2% 2% 4% 4% 6% 6% 8% 8% 9% 9% 13% 13% UK 0% 0% 2% 2% 3% 2% 4% 3% 5% 4% 7% 5% 8% 7% Japan 0% 0% 1% 2% 1% 2% 2% 3% 2% 3% 3% 4% 8% 8% Asia-Pac ex Japan 0% 0% 1% 1% 2% 3% 3% 4% 3% 4% 4% 5% 5% 5% Emerging Markets 0% 0% 2% 2% 3% 4% 4% 5% 5% 6% 7% 8% 8% 8%
Fixed Income 98% 98% 53% 50% 48% 43% 32% 25% 17% 12% 3% 1% 0% 0% Global Governments 55% 53% 30% 28% 25% 21% 17% 12% 8% 5% 1% 0% 0% 0% Global Corporate 18% 21% 8% 9% 8% 9% 6% 8% 4% 5% 1% 1% 0% 0% Global Mortgages 18% 18% 12% 11% 11% 10% 7% 5% 4% 2% 1% 0% 0% 0% Global HY, EM debt 7% 6% 3% 2% 4% 3% 2% 0% 1% 0% 0% 0% 0% 0%
Cash 2% 2% 14% 14% 2% 2% 2% 2% 2% 2% 2% 2% 2% 2% Alternatives 0% 0% 16% 16% 20% 20% 23% 23% 25% 25% 27% 27% 0% 0%
Hedge Funds 0% 0% 8% 8% 10% 10% 11% 11% 12% 12% 14% 14% 0% 0% Private Equity 0% 0% 3% 3% 4% 4% 6% 6% 7% 7% 8% 8% 0% 0% Real Assets* 0% 0% 5% 5% 6% 6% 6% 6% 6% 6% 5% 5% 0% 0%
Weights have been adjusted qualitatively to be in increments of 1% and the total adds to 100%. * Real Assets is defined to include commodities and private real estate.
Notes: Global Wealth & Investment Management Chief Investment Office’s (GWIM CIO) Strategic Asset Allocation for the global investor was developed for private Merrill Lynch Wealth Management Clients. The Strategic allocations are identified by the GWIM CIO and are designed to serve as guidelines for a 20-30 year investment horizon. The RIC Tactical allocations are provided by the BofA Merrill Lynch Global Research Investment Committee. The GWIM CIO models allocate assets among specified asset classes and, within each class, reflect broad investment diversification. The models offer benchmarks for traditional asset class allocation (stocks, bonds and cash), as well as models for allocations among traditional and alternative asset classes reflecting portfolios targeting varying liquidity levels. The models are designed to provide allocation benchmarks based on risk/return profiles. GWIM CIO defines liquidity as the percentage of assets, by invested value, within a portfolio that can be reasonably expected to be liquidated within a given time duration under typical market conditions. Given the less-liquid nature of certain alternative assets, The BofA Merrill Lynch Global Research Investment Committee does not make RIC Tactical allocation recommendations for portfolios that include these asset classes. Merrill Lynch Wealth Management clients should consult with their financial advisor about any of these allocations.
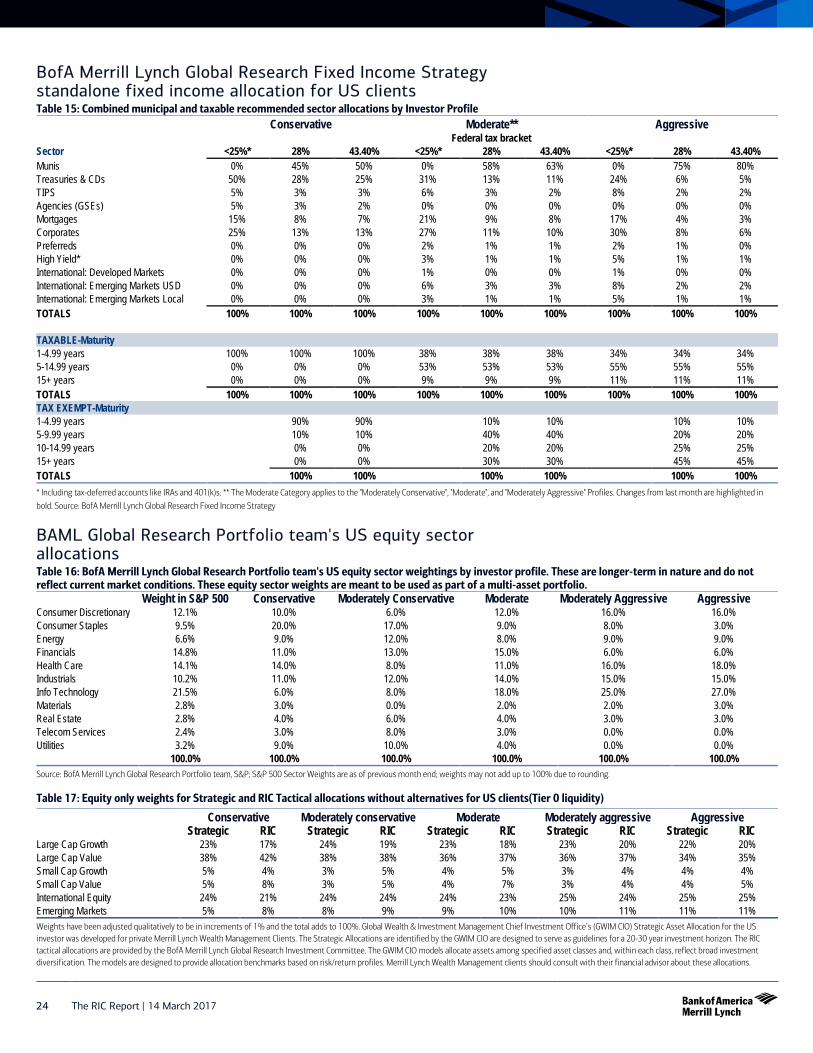
24 The RIC Report | 14 March 2017
BofA Merrill Lynch Global Research Fixed Income Strategy standalone fixed income allocation for US clients Table 15: Combined municipal and taxable recommended sector allocations by Investor Profile
Conservative Moderate** Aggressive Federal tax bracket
Sector <25%* 28% 43.40% <25%* 28% 43.40% <25%* 28% 43.40% Munis 0% 45% 50% 0% 58% 63% 0% 75% 80% Treasuries & CDs 50% 28% 25% 31% 13% 11% 24% 6% 5% TIPS 5% 3% 3% 6% 3% 2% 8% 2% 2% Agencies (GSEs) 5% 3% 2% 0% 0% 0% 0% 0% 0% Mortgages 15% 8% 7% 21% 9% 8% 17% 4% 3% Corporates 25% 13% 13% 27% 11% 10% 30% 8% 6% Preferreds 0% 0% 0% 2% 1% 1% 2% 1% 0% High Yield* 0% 0% 0% 3% 1% 1% 5% 1% 1% International: Developed Markets 0% 0% 0% 1% 0% 0% 1% 0% 0% International: Emerging Markets USD 0% 0% 0% 6% 3% 3% 8% 2% 2% International: Emerging Markets Local 0% 0% 0% 3% 1% 1% 5% 1% 1% TOTALS 100% 100% 100% 100% 100% 100% 100% 100% 100%
TAXABLE-Maturity 1-4.99 years 100% 100% 100% 38% 38% 38% 34% 34% 34% 5-14.99 years 0% 0% 0% 53% 53% 53% 55% 55% 55% 15+ years 0% 0% 0% 9% 9% 9% 11% 11% 11% TOTALS 100% 100% 100% 100% 100% 100% 100% 100% 100% TAX EXEMPT-Maturity1-4.99 years 90% 90% 10% 10% 10% 10% 5-9.99 years 10% 10% 40% 40% 20% 20% 10-14.99 years 0% 0% 20% 20% 25% 25% 15+ years 0% 0% 30% 30% 45% 45% TOTALS 100% 100% 100% 100% 100% 100% * Including tax-deferred accounts like IRAs and 401(k)s. ** The Moderate Category applies to the "Moderately Conservative", "Moderate", and "Moderately Aggressive" Profiles. Changes from last month are highlighted in
bold. Source: BofA Merrill Lynch Global Research Fixed Income Strategy
BAML Global Research Portfolio team's US equity sector allocations Table 16: BofA Merrill Lynch Global Research Portfolio team's US equity sector weightings by investor profile. These are longer-term in nature and do not reflect current market conditions. These equity sector weights are meant to be used as part of a multi-asset portfolio.
Weight in S&P 500 Conservative Moderately Conservative Moderate Moderately Aggressive Aggressive Consumer Discretionary 12.1% 10.0% 6.0% 12.0% 16.0% 16.0% Consumer Staples 9.5% 20.0% 17.0% 9.0% 8.0% 3.0% Energy 6.6% 9.0% 12.0% 8.0% 9.0% 9.0% Financials 14.8% 11.0% 13.0% 15.0% 6.0% 6.0% Health Care 14.1% 14.0% 8.0% 11.0% 16.0% 18.0% Industrials 10.2% 11.0% 12.0% 14.0% 15.0% 15.0% Info Technology 21.5% 6.0% 8.0% 18.0% 25.0% 27.0% Materials 2.8% 3.0% 0.0% 2.0% 2.0% 3.0% Real Estate 2.8% 4.0% 6.0% 4.0% 3.0% 3.0% Telecom Services 2.4% 3.0% 8.0% 3.0% 0.0% 0.0% Utilities 3.2% 9.0% 10.0% 4.0% 0.0% 0.0%
100.0% 100.0% 100.0% 100.0% 100.0% 100.0% Source: BofA Merrill Lynch Global Research Portfolio team, S&P; S&P 500 Sector Weights are as of previous month end; weights may not add up to 100% due to rounding.
Table 17: Equity only weights for Strategic and RIC Tactical allocations without alternatives for US clients(Tier 0 liquidity)
Conservative Moderately conservative Moderate Moderately aggressive Aggressive Strategic RIC Strategic RIC Strategic RIC Strategic RIC Strategic RIC
Large Cap Growth 23% 17% 24% 19% 23% 18% 23% 20% 22% 20% Large Cap Value 38% 42% 38% 38% 36% 37% 36% 37% 34% 35% Small Cap Growth 5% 4% 3% 5% 4% 5% 3% 4% 4% 4% Small Cap Value 5% 8% 3% 5% 4% 7% 3% 4% 4% 5% International Equity 24% 21% 24% 24% 24% 23% 25% 24% 25% 25% Emerging Markets 5% 8% 8% 9% 9% 10% 10% 11% 11% 11% Weights have been adjusted qualitatively to be in increments of 1% and the total adds to 100%. Global Wealth & Investment Management Chief Investment Office’s (GWIM CIO) Strategic Asset Allocation for the US investor was developed for private Merrill Lynch Wealth Management Clients. The Strategic Allocations are identified by the GWIM CIO are designed to serve as guidelines for a 20-30 year investment horizon. The RIC tactical allocations are provided by the BofA Merrill Lynch Global Research Investment Committee. The GWIM CIO models allocate assets among specified asset classes and, within each class, reflect broad investment diversification. The models are designed to provide allocation benchmarks based on risk/return profiles. Merrill Lynch Wealth Management clients should consult with their financial advisor about these allocations.
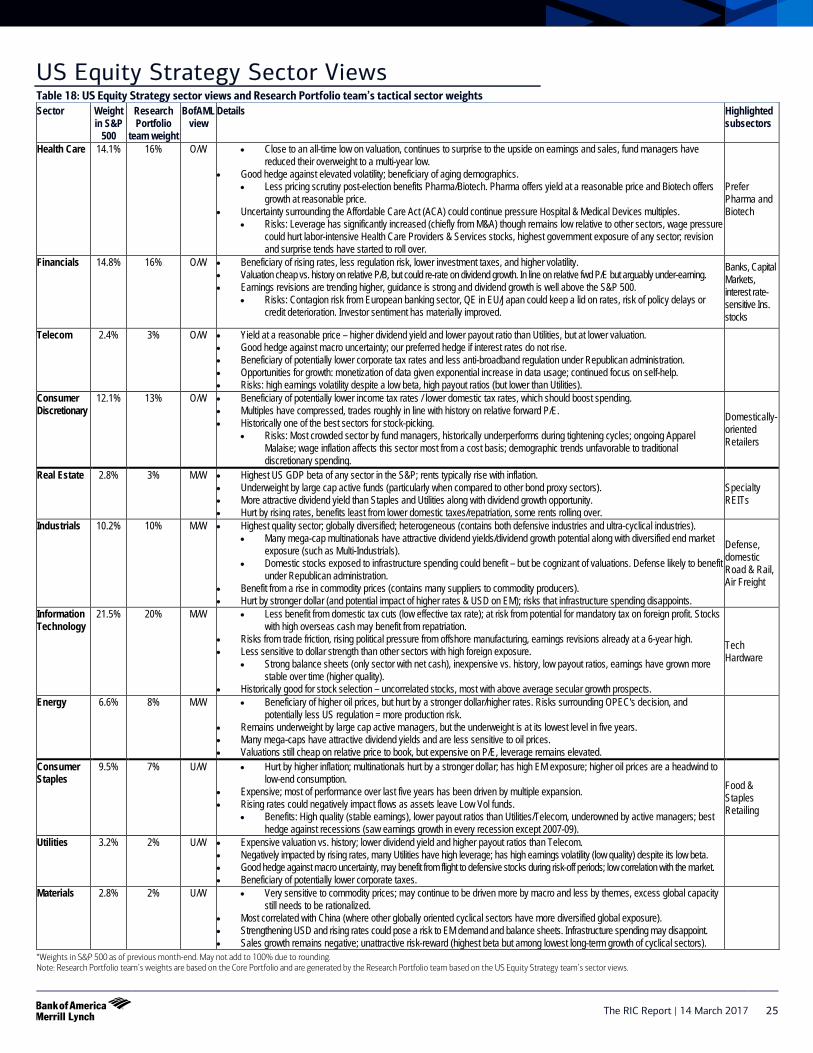
The RIC Report | 14 March 2017 25
US Equity Strategy Sector Views Table 18: US Equity Strategy sector views and Research Portfolio team’s tactical sector weights Sector Weight
in S&P 500
Research Portfolio
team weight
BofAML view
Details Highlighted subsectors
Health Care 14.1% 16% O/W • Close to an all-time low on valuation, continues to surprise to the upside on earnings and sales, fund managers have reduced their overweight to a multi-year low.
• Good hedge against elevated volatility; beneficiary of aging demographics. • Less pricing scrutiny post-election benefits Pharma/Biotech. Pharma offers yield at a reasonable price and Biotech offers
growth at reasonable price. • Uncertainty surrounding the Affordable Care Act (ACA) could continue pressure Hospital & Medical Devices multiples.
• Risks: Leverage has significantly increased (chiefly from M&A) though remains low relative to other sectors, wage pressure could hurt labor-intensive Health Care Providers & Services stocks, highest government exposure of any sector; revision and surprise tends have started to roll over.
Prefer Pharma and Biotech
Financials 14.8% 16% O/W • Beneficiary of rising rates, less regulation risk, lower investment taxes, and higher volatility. • Valuation cheap vs. history on relative P/B, but could re-rate on dividend growth. In line on relative fwd P/E but arguably under-earning.• Earnings revisions are trending higher, guidance is strong and dividend growth is well above the S&P 500.
• Risks: Contagion risk from European banking sector, QE in EU/Japan could keep a lid on rates, risk of policy delays or credit deterioration. Investor sentiment has materially improved.
Banks, Capital Markets, interest rate-sensitive Ins. stocks
Telecom 2.4% 3% O/W • Yield at a reasonable price – higher dividend yield and lower payout ratio than Utilities, but at lower valuation. • Good hedge against macro uncertainty; our preferred hedge if interest rates do not rise. • Beneficiary of potentially lower corporate tax rates and less anti-broadband regulation under Republican administration. • Opportunities for growth: monetization of data given exponential increase in data usage; continued focus on self-help. • Risks: high earnings volatility despite a low beta, high payout ratios (but lower than Utilities).
Consumer Discretionary
12.1% 13% O/W • Beneficiary of potentially lower income tax rates / lower domestic tax rates, which should boost spending. • Multiples have compressed, trades roughly in line with history on relative forward P/E. • Historically one of the best sectors for stock-picking.
• Risks: Most crowded sector by fund managers, historically underperforms during tightening cycles; ongoing Apparel Malaise; wage inflation affects this sector most from a cost basis; demographic trends unfavorable to traditional discretionary spending.
Domestically-oriented Retailers
Real Estate 2.8% 3% M/W • Highest US GDP beta of any sector in the S&P; rents typically rise with inflation. • Underweight by large cap active funds (particularly when compared to other bond proxy sectors). • More attractive dividend yield than Staples and Utilities along with dividend growth opportunity. • Hurt by rising rates, benefits least from lower domestic taxes/repatriation, some rents rolling over.
Specialty REITs
Industrials 10.2% 10% M/W • Highest quality sector; globally diversified; heterogeneous (contains both defensive industries and ultra-cyclical industries). • Many mega-cap multinationals have attractive dividend yields/dividend growth potential along with diversified end market
exposure (such as Multi-Industrials). • Domestic stocks exposed to infrastructure spending could benefit – but be cognizant of valuations. Defense likely to benefit
under Republican administration. • Benefit from a rise in commodity prices (contains many suppliers to commodity producers). • Hurt by stronger dollar (and potential impact of higher rates & USD on EM); risks that infrastructure spending disappoints.
Defense, domestic Road & Rail, Air Freight
Information Technology
21.5% 20% M/W • Less benefit from domestic tax cuts (low effective tax rate); at risk from potential for mandatory tax on foreign profit. Stocks with high overseas cash may benefit from repatriation.
• Risks from trade friction, rising political pressure from offshore manufacturing, earnings revisions already at a 6-year high. • Less sensitive to dollar strength than other sectors with high foreign exposure.
• Strong balance sheets (only sector with net cash), inexpensive vs. history, low payout ratios, earnings have grown more stable over time (higher quality).
• Historically good for stock selection – uncorrelated stocks, most with above average secular growth prospects.
Tech Hardware
Energy 6.6% 8% M/W • Beneficiary of higher oil prices, but hurt by a stronger dollar/higher rates. Risks surrounding OPEC's decision, and potentially less US regulation = more production risk.
• Remains underweight by large cap active managers, but the underweight is at its lowest level in five years. • Many mega-caps have attractive dividend yields and are less sensitive to oil prices. • Valuations still cheap on relative price to book, but expensive on P/E, leverage remains elevated.
Consumer Staples
9.5% 7% U/W • Hurt by higher inflation; multinationals hurt by a stronger dollar; has high EM exposure; higher oil prices are a headwind to low-end consumption.
• Expensive; most of performance over last five years has been driven by multiple expansion. • Rising rates could negatively impact flows as assets leave Low Vol funds.
• Benefits: High quality (stable earnings), lower payout ratios than Utilities/Telecom, underowned by active managers; best hedge against recessions (saw earnings growth in every recession except 2007-09).
Food & Staples Retailing
Utilities 3.2% 2% U/W • Expensive valuation vs. history; lower dividend yield and higher payout ratios than Telecom. • Negatively impacted by rising rates, many Utilities have high leverage; has high earnings volatility (low quality) despite its low beta. • Good hedge against macro uncertainty, may benefit from flight to defensive stocks during risk-off periods; low correlation with the market. • Beneficiary of potentially lower corporate taxes.
Materials 2.8% 2% U/W • Very sensitive to commodity prices; may continue to be driven more by macro and less by themes, excess global capacity still needs to be rationalized.
• Most correlated with China (where other globally oriented cyclical sectors have more diversified global exposure). • Strengthening USD and rising rates could pose a risk to EM demand and balance sheets. Infrastructure spending may disappoint. • Sales growth remains negative; unattractive risk-reward (highest beta but among lowest long-term growth of cyclical sectors).
*Weights in S&P 500 as of previous month-end. May not add to 100% due to rounding. Note: Research Portfolio team’s weights are based on the Core Portfolio and are generated by the Research Portfolio team based on the US Equity Strategy team’s sector views.
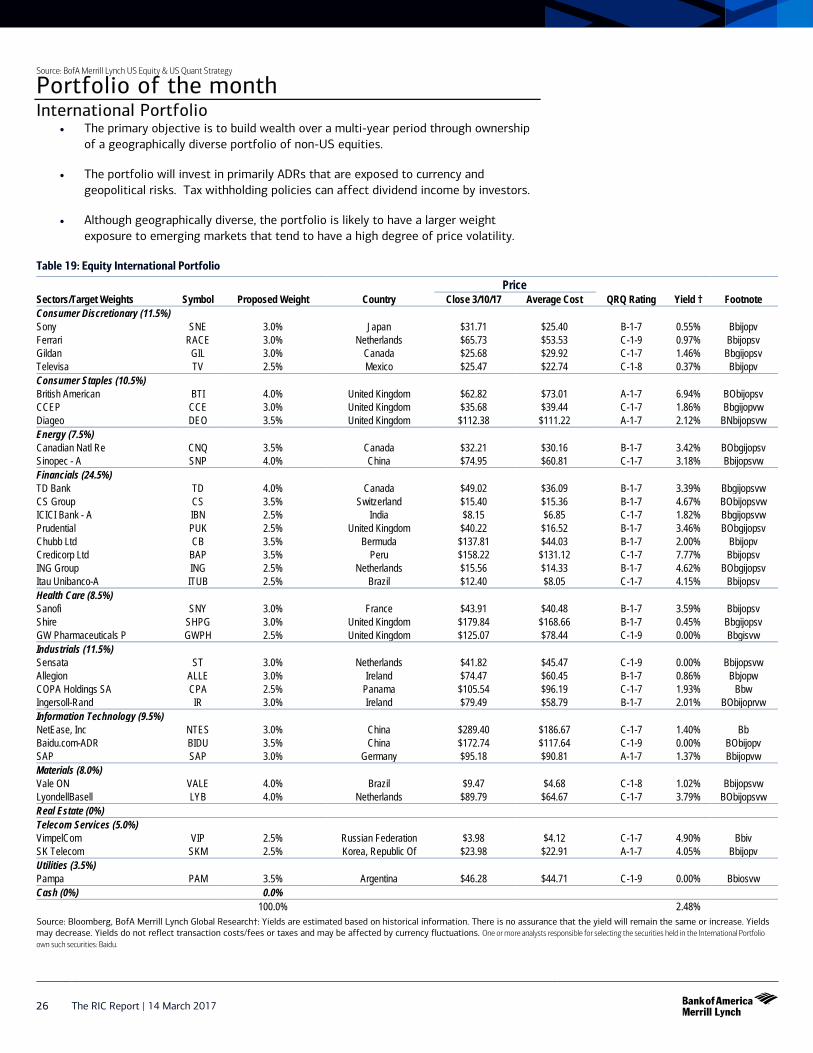
26 The RIC Report | 14 March 2017
Source: BofA Merrill Lynch US Equity & US Quant Strategy
Portfolio of the month International Portfolio
• The primary objective is to build wealth over a multi-year period through ownershipof a geographically diverse portfolio of non-US equities.
• The portfolio will invest in primarily ADRs that are exposed to currency andgeopolitical risks. Tax withholding policies can affect dividend income by investors.
• Although geographically diverse, the portfolio is likely to have a larger weightexposure to emerging markets that tend to have a high degree of price volatility.
Table 19: Equity International Portfolio
Price Sectors/Target Weights Symbol Proposed Weight Country Close 3/10/17 Average Cost QRQ Rating Yield † Footnote Consumer Discretionary (11.5%) Sony SNE 3.0% Japan $31.71 $25.40 B-1-7 0.55% Bbijopv Ferrari RACE 3.0% Netherlands $65.73 $53.53 C-1-9 0.97% Bbijopsv Gildan GIL 3.0% Canada $25.68 $29.92 C-1-7 1.46% Bbgijopsv Televisa TV 2.5% Mexico $25.47 $22.74 C-1-8 0.37% Bbijopv Consumer Staples (10.5%) British American BTI 4.0% United Kingdom $62.82 $73.01 A-1-7 6.94% BObijopsv CCEP CCE 3.0% United Kingdom $35.68 $39.44 C-1-7 1.86% Bbgijopvw Diageo DEO 3.5% United Kingdom $112.38 $111.22 A-1-7 2.12% BNbijopsvw Energy (7.5%) Canadian Natl Re CNQ 3.5% Canada $32.21 $30.16 B-1-7 3.42% BObgijopsv Sinopec - A SNP 4.0% China $74.95 $60.81 C-1-7 3.18% Bbijopsvw Financials (24.5%) TD Bank TD 4.0% Canada $49.02 $36.09 B-1-7 3.39% Bbgijopsvw CS Group CS 3.5% Switzerland $15.40 $15.36 B-1-7 4.67% BObijopsvw ICICI Bank - A IBN 2.5% India $8.15 $6.85 C-1-7 1.82% Bbgijopsvw Prudential PUK 2.5% United Kingdom $40.22 $16.52 B-1-7 3.46% BObgijopsv Chubb Ltd CB 3.5% Bermuda $137.81 $44.03 B-1-7 2.00% Bbijopv Credicorp Ltd BAP 3.5% Peru $158.22 $131.12 C-1-7 7.77% Bbijopsv ING Group ING 2.5% Netherlands $15.56 $14.33 B-1-7 4.62% BObgijopsv Itau Unibanco-A ITUB 2.5% Brazil $12.40 $8.05 C-1-7 4.15% Bbijopsv Health Care (8.5%) Sanofi SNY 3.0% France $43.91 $40.48 B-1-7 3.59% Bbijopsv Shire SHPG 3.0% United Kingdom $179.84 $168.66 B-1-7 0.45% Bbgijopsv GW Pharmaceuticals P GWPH 2.5% United Kingdom $125.07 $78.44 C-1-9 0.00% Bbgisvw Industrials (11.5%) Sensata ST 3.0% Netherlands $41.82 $45.47 C-1-9 0.00% Bbijopsvw Allegion ALLE 3.0% Ireland $74.47 $60.45 B-1-7 0.86% Bbjopw COPA Holdings SA CPA 2.5% Panama $105.54 $96.19 C-1-7 1.93% Bbw Ingersoll-Rand IR 3.0% Ireland $79.49 $58.79 B-1-7 2.01% BObijoprvw Information Technology (9.5%) NetEase, Inc NTES 3.0% China $289.40 $186.67 C-1-7 1.40% Bb Baidu.com-ADR BIDU 3.5% China $172.74 $117.64 C-1-9 0.00% BObijopv SAP SAP 3.0% Germany $95.18 $90.81 A-1-7 1.37% Bbijopvw Materials (8.0%) Vale ON VALE 4.0% Brazil $9.47 $4.68 C-1-8 1.02% Bbijopsvw LyondellBasell LYB 4.0% Netherlands $89.79 $64.67 C-1-7 3.79% BObijopsvw Real Estate (0%) Telecom Services (5.0%) VimpelCom VIP 2.5% Russian Federation $3.98 $4.12 C-1-7 4.90% Bbiv SK Telecom SKM 2.5% Korea, Republic Of $23.98 $22.91 A-1-7 4.05% Bbijopv Utilities (3.5%) Pampa PAM 3.5% Argentina $46.28 $44.71 C-1-9 0.00% Bbiosvw Cash (0%) 0.0%
100.0% 2.48% Source: Bloomberg, BofA Merrill Lynch Global Research†: Yields are estimated based on historical information. There is no assurance that the yield will remain the same or increase. Yields may decrease. Yields do not reflect transaction costs/fees or taxes and may be affected by currency fluctuations. One or more analysts responsible for selecting the securities held in the International Portfolio own such securities: Baidu.
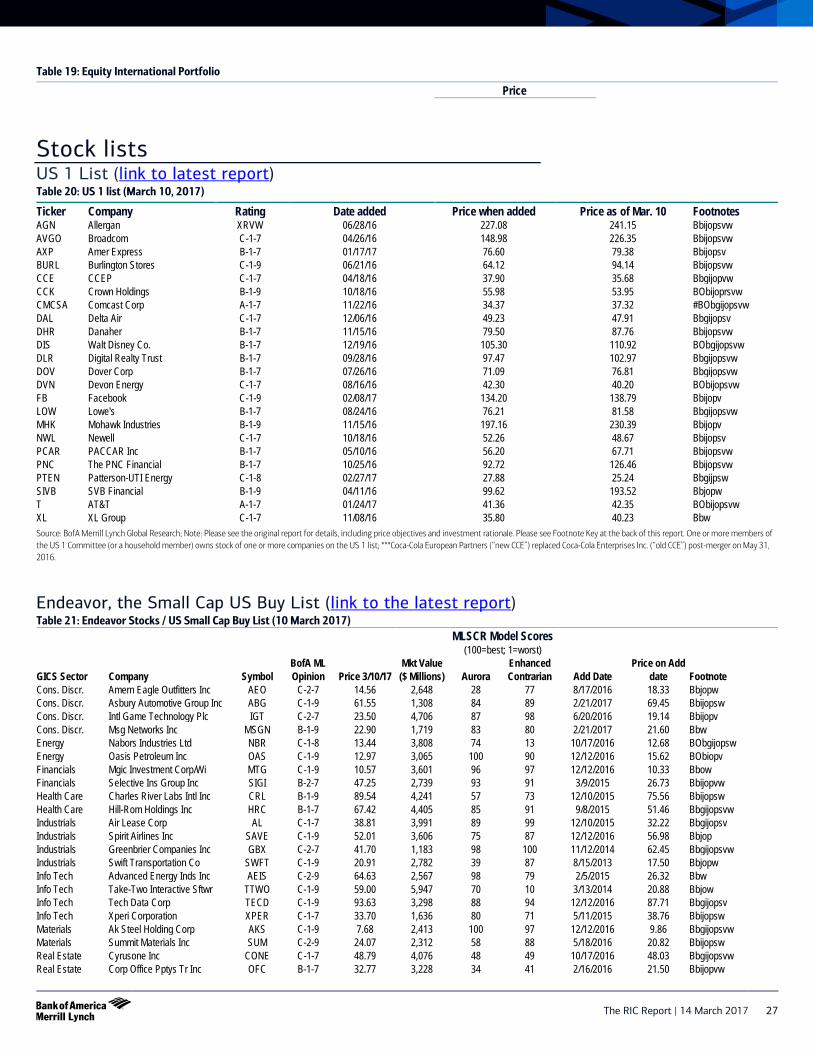
The RIC Report | 14 March 2017 27
Table 19: Equity International Portfolio
Price
Stock lists US 1 List (link to latest report) Table 20: US 1 list (March 10, 2017)
Ticker Company Rating Date added Price when added Price as of Mar. 10 Footnotes AGN Allergan XRVW 06/28/16 227.08 241.15 Bbijopsvw AVGO Broadcom C-1-7 04/26/16 148.98 226.35 Bbijopsvw AXP Amer Express B-1-7 01/17/17 76.60 79.38 Bbijopsv BURL Burlington Stores C-1-9 06/21/16 64.12 94.14 Bbijopsvw CCE CCEP C-1-7 04/18/16 37.90 35.68 Bbgijopvw CCK Crown Holdings B-1-9 10/18/16 55.98 53.95 BObijoprsvw CMCSA Comcast Corp A-1-7 11/22/16 34.37 37.32 #BObgijopsvw DAL Delta Air C-1-7 12/06/16 49.23 47.91 Bbgijopsv DHR Danaher B-1-7 11/15/16 79.50 87.76 Bbijopsvw DIS Walt Disney Co. B-1-7 12/19/16 105.30 110.92 BObgijopsvw DLR Digital Realty Trust B-1-7 09/28/16 97.47 102.97 Bbgijopsvw DOV Dover Corp B-1-7 07/26/16 71.09 76.81 Bbgijopsvw DVN Devon Energy C-1-7 08/16/16 42.30 40.20 BObijopsvw FB Facebook C-1-9 02/08/17 134.20 138.79 Bbijopv LOW Lowe's B-1-7 08/24/16 76.21 81.58 Bbgijopsvw MHK Mohawk Industries B-1-9 11/15/16 197.16 230.39 Bbijopv NWL Newell C-1-7 10/18/16 52.26 48.67 Bbijopsv PCAR PACCAR Inc B-1-7 05/10/16 56.20 67.71 Bbijopsvw PNC The PNC Financial B-1-7 10/25/16 92.72 126.46 Bbijopsvw PTEN Patterson-UTI Energy C-1-8 02/27/17 27.88 25.24 Bbgijpsw SIVB SVB Financial B-1-9 04/11/16 99.62 193.52 Bbjopw T AT&T A-1-7 01/24/17 41.36 42.35 BObijopsvw XL XL Group C-1-7 11/08/16 35.80 40.23 Bbw Source: BofA Merrill Lynch Global Research; Note: Please see the original report for details, including price objectives and investment rationale. Please see Footnote Key at the back of this report. One or more members of the US 1 Committee (or a household member) owns stock of one or more companies on the US 1 list; ***Coca-Cola European Partners (‘‘new CCE’’) replaced Coca-Cola Enterprises Inc. (‘‘old CCE’’) post-merger on May 31, 2016.
Endeavor, the Small Cap US Buy List (link to the latest report) Table 21: Endeavor Stocks / US Small Cap Buy List (10 March 2017)
MLSCR Model Scores (100=best; 1=worst)
GICS Sector Company Symbol BofA ML Opinion Price 3/10/17
Mkt Value ($ Millions) Aurora
Enhanced Contrarian Add Date
Price on Add date Footnote
Cons. Discr. Amern Eagle Outfitters Inc AEO C-2-7 14.56 2,648 28 77 8/17/2016 18.33 Bbjopw Cons. Discr. Asbury Automotive Group Inc ABG C-1-9 61.55 1,308 84 89 2/21/2017 69.45 Bbijopsw Cons. Discr. Intl Game Technology Plc IGT C-2-7 23.50 4,706 87 98 6/20/2016 19.14 Bbijopv Cons. Discr. Msg Networks Inc MSGN B-1-9 22.90 1,719 83 80 2/21/2017 21.60 Bbw Energy Nabors Industries Ltd NBR C-1-8 13.44 3,808 74 13 10/17/2016 12.68 BObgijopsw Energy Oasis Petroleum Inc OAS C-1-9 12.97 3,065 100 90 12/12/2016 15.62 BObiopv Financials Mgic Investment Corp/Wi MTG C-1-9 10.57 3,601 96 97 12/12/2016 10.33 Bbow Financials Selective Ins Group Inc SIGI B-2-7 47.25 2,739 93 91 3/9/2015 26.73 Bbijopvw Health Care Charles River Labs Intl Inc CRL B-1-9 89.54 4,241 57 73 12/10/2015 75.56 Bbijopsw Health Care Hill-Rom Holdings Inc HRC B-1-7 67.42 4,405 85 91 9/8/2015 51.46 Bbgijopsvw Industrials Air Lease Corp AL C-1-7 38.81 3,991 89 99 12/10/2015 32.22 Bbgijopsv Industrials Spirit Airlines Inc SAVE C-1-9 52.01 3,606 75 87 12/12/2016 56.98 Bbjop Industrials Greenbrier Companies Inc GBX C-2-7 41.70 1,183 98 100 11/12/2014 62.45 Bbgijopsvw Industrials Swift Transportation Co SWFT C-1-9 20.91 2,782 39 87 8/15/2013 17.50 Bbjopw Info Tech Advanced Energy Inds Inc AEIS C-2-9 64.63 2,567 98 79 2/5/2015 26.32 Bbw Info Tech Take-Two Interactive Sftwr TTWO C-1-9 59.00 5,947 70 10 3/13/2014 20.88 Bbjow Info Tech Tech Data Corp TECD C-1-9 93.63 3,298 88 94 12/12/2016 87.71 Bbgijopsv Info Tech Xperi Corporation XPER C-1-7 33.70 1,636 80 71 5/11/2015 38.76 Bbijopsw Materials Ak Steel Holding Corp AKS C-1-9 7.68 2,413 100 97 12/12/2016 9.86 Bbgijopsvw Materials Summit Materials Inc SUM C-2-9 24.07 2,312 58 88 5/18/2016 20.82 Bbijopsw Real Estate Cyrusone Inc CONE C-1-7 48.79 4,076 48 49 10/17/2016 48.03 Bbgijopsvw Real Estate Corp Office Pptys Tr Inc OFC B-1-7 32.77 3,228 34 41 2/16/2016 21.50 Bbijopvw

28 The RIC Report | 14 March 2017
Table 21: Endeavor Stocks / US Small Cap Buy List (10 March 2017) MLSCR Model Scores
Real Estate Kennedy-Wilson Holdings Inc KW C-1-7 21.20 2,454 94 97 9/20/2016 21.81 Bbgijopsw Utilities Southwest Gas Holdings Inc SWX B-2-7 82.66 3,925 78 85 12/12/2016 75.19 Bbgijopsw Source: BofA Merrill Lynch Global Researc.h
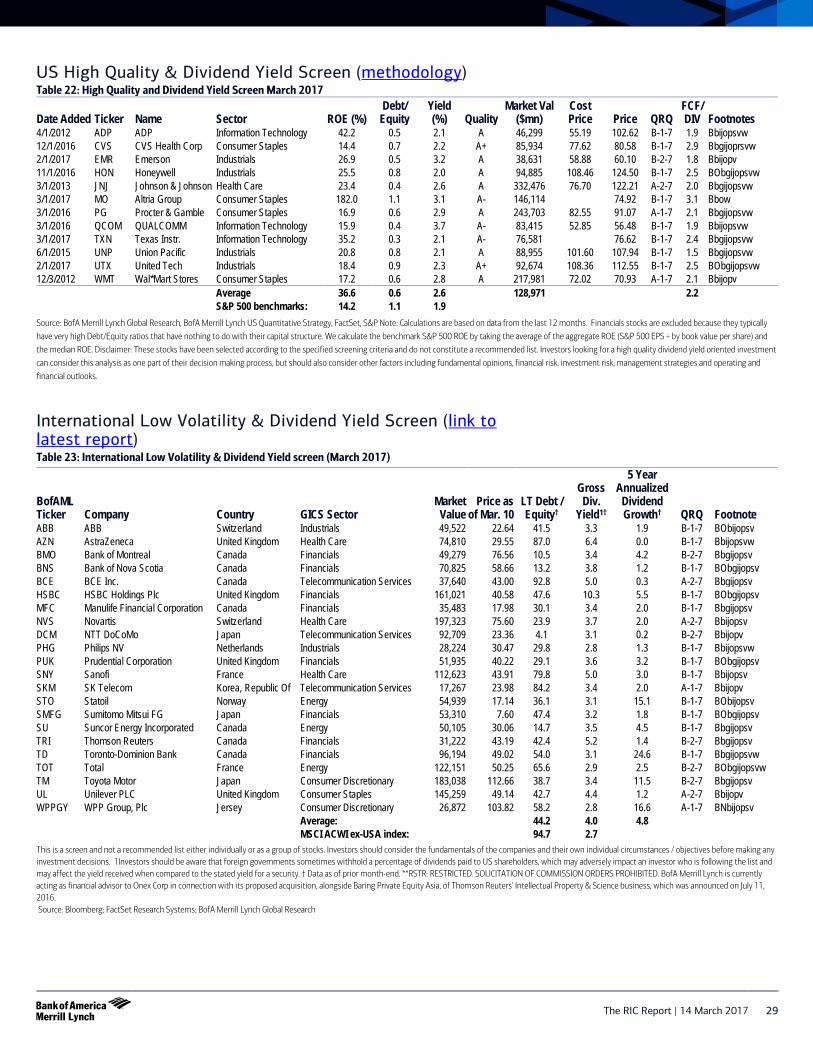
The RIC Report | 14 March 2017 29
US High Quality & Dividend Yield Screen (methodology) Table 22: High Quality and Dividend Yield Screen March 2017
Date Added Ticker Name Sector ROE (%) Debt/
Equity Yield (%) Quality
Market Val ($mn)
Cost Price Price QRQ
FCF/ DIV Footnotes
4/1/2012 ADP ADP Information Technology 42.2 0.5 2.1 A 46,299 55.19 102.62 B-1-7 1.9 Bbijopsvw 12/1/2016 CVS CVS Health Corp Consumer Staples 14.4 0.7 2.2 A+ 85,934 77.62 80.58 B-1-7 2.9 Bbgijoprsvw 2/1/2017 EMR Emerson Industrials 26.9 0.5 3.2 A 38,631 58.88 60.10 B-2-7 1.8 Bbijopv11/1/2016 HON Honeywell Industrials 25.5 0.8 2.0 A 94,885 108.46 124.50 B-1-7 2.5 BObgijopsvw 3/1/2013 JNJ Johnson & Johnson Health Care 23.4 0.4 2.6 A 332,476 76.70 122.21 A-2-7 2.0 Bbgijopsvw 3/1/2017 MO Altria Group Consumer Staples 182.0 1.1 3.1 A- 146,114 74.92 B-1-7 3.1 Bbow 3/1/2016 PG Procter & Gamble Consumer Staples 16.9 0.6 2.9 A 243,703 82.55 91.07 A-1-7 2.1 Bbgijopsvw 3/1/2016 QCOM QUALCOMM Information Technology 15.9 0.4 3.7 A- 83,415 52.85 56.48 B-1-7 1.9 Bbijopsvw 3/1/2017 TXN Texas Instr. Information Technology 35.2 0.3 2.1 A- 76,581 76.62 B-1-7 2.4 Bbgijopsvw 6/1/2015 UNP Union Pacific Industrials 20.8 0.8 2.1 A 88,955 101.60 107.94 B-1-7 1.5 Bbgijopsvw 2/1/2017 UTX United Tech Industrials 18.4 0.9 2.3 A+ 92,674 108.36 112.55 B-1-7 2.5 BObgijopsvw 12/3/2012 WMT Wal*Mart Stores Consumer Staples 17.2 0.6 2.8 A 217,981 72.02 70.93 A-1-7 2.1 Bbijopv
Average 36.6 0.6 2.6 128,971 2.2 S&P 500 benchmarks: 14.2 1.1 1.9
Source: BofA Merrill Lynch Global Research, BofA Merrill Lynch US Quantitative Strategy, FactSet, S&P Note: Calculations are based on data from the last 12 months. Financials stocks are excluded because they typically
have very high Debt/Equity ratios that have nothing to do with their capital structure. We calculate the benchmark S&P 500 ROE by taking the average of the aggregate ROE (S&P 500 EPS ÷ by book value per share) and the median ROE. Disclaimer: These stocks have been selected according to the specified screening criteria and do not constitute a recommended list. Investors looking for a high quality dividend yield oriented investment
can consider this analysis as one part of their decision making process, but should also consider other factors including fundamental opinions, financial risk, investment risk, management strategies and operating and
financial outlooks.
International Low Volatility & Dividend Yield Screen (link to latest report) Table 23: International Low Volatility & Dividend Yield screen (March 2017)
BofAML Ticker Company Country GICS Sector
Market Value
Price as of Mar. 10
LT Debt / Equity†
Gross Div.
Yield1†
5 Year Annualized Dividend Growth† QRQ Footnote
ABB ABB Switzerland Industrials 49,522 22.64 41.5 3.3 1.9 B-1-7 BObijopsv AZN AstraZeneca United Kingdom Health Care 74,810 29.55 87.0 6.4 0.0 B-1-7 Bbijopsvw BMO Bank of Montreal Canada Financials 49,279 76.56 10.5 3.4 4.2 B-2-7 Bbgijopsv BNS Bank of Nova Scotia Canada Financials 70,825 58.66 13.2 3.8 1.2 B-1-7 BObgijopsv BCE BCE Inc. Canada Telecommunication Services 37,640 43.00 92.8 5.0 0.3 A-2-7 Bbgijopsv HSBC HSBC Holdings Plc United Kingdom Financials 161,021 40.58 47.6 10.3 5.5 B-1-7 BObgijopsv MFC Manulife Financial Corporation Canada Financials 35,483 17.98 30.1 3.4 2.0 B-1-7 Bbgijopsv NVS Novartis Switzerland Health Care 197,323 75.60 23.9 3.7 2.0 A-2-7 Bbijopsv DCM NTT DoCoMo Japan Telecommunication Services 92,709 23.36 4.1 3.1 0.2 B-2-7 BbijopvPHG Philips NV Netherlands Industrials 28,224 30.47 29.8 2.8 1.3 B-1-7 Bbijopsvw PUK Prudential Corporation United Kingdom Financials 51,935 40.22 29.1 3.6 3.2 B-1-7 BObgijopsv SNY Sanofi France Health Care 112,623 43.91 79.8 5.0 3.0 B-1-7 Bbijopsv SKM SK Telecom Korea, Republic Of Telecommunication Services 17,267 23.98 84.2 3.4 2.0 A-1-7 BbijopvSTO Statoil Norway Energy 54,939 17.14 36.1 3.1 15.1 B-1-7 BObijopsv SMFG Sumitomo Mitsui FG Japan Financials 53,310 7.60 47.4 3.2 1.8 B-1-7 BObgijopsv SU Suncor Energy Incorporated Canada Energy 50,105 30.06 14.7 3.5 4.5 B-1-7 Bbgijopsv TRI Thomson Reuters Canada Financials 31,222 43.19 42.4 5.2 1.4 B-2-7 Bbgijopsv TD Toronto-Dominion Bank Canada Financials 96,194 49.02 54.0 3.1 24.6 B-1-7 Bbgijopsvw TOT Total France Energy 122,151 50.25 65.6 2.9 2.5 B-2-7 BObgijopsvw TM Toyota Motor Japan Consumer Discretionary 183,038 112.66 38.7 3.4 11.5 B-2-7 Bbgijopsv UL Unilever PLC United Kingdom Consumer Staples 145,259 49.14 42.7 4.4 1.2 A-2-7 BbijopvWPPGY WPP Group, Plc Jersey Consumer Discretionary 26,872 103.82 58.2 2.8 16.6 A-1-7 BNbijopsv
Average: 44.2 4.0 4.8 MSCI ACWI ex-USA index: 94.7 2.7
This is a screen and not a recommended list either individually or as a group of stocks. Investors should consider the fundamentals of the companies and their own individual circumstances / objectives before making any investment decisions. 1Investors should be aware that foreign governments sometimes withhold a percentage of dividends paid to US shareholders, which may adversely impact an investor who is following the list and may affect the yield received when compared to the stated yield for a security. † Data as of prior month-end. **RSTR: RESTRICTED. SOLICITATION OF COMMISSION ORDERS PROHIBITED. BofA Merrill Lynch is currently acting as financial advisor to Onex Corp in connection with its proposed acquisition, alongside Baring Private Equity Asia, of Thomson Reuters' Intellectual Property & Science business, which was announced on July 11, 2016. Source: Bloomberg; FactSet Research Systems; BofA Merrill Lynch Global Research

30 The RIC Report | 14 March 2017
Research portfolios and stock lists Stock lists
Note: Please be aware that links on this page are directed to lists that are updated as of the date of this publication. There may have been updates to one or more lists. Financial Advisors should check for the latest available constituents.
Regional Focus or 1 Lists are best investment ideas chosen among our Buy-rated stocks.
US
Europe
Growth 10 & Value 10 each chosen by the highest five-year EPS growth rates (Growth 10) or the lowest trailing 12-month P/E ratio (Value 10) based on quantitative screening criteria.
Stock portfolios US Large Cap Equity Five portfolios offerings are available to match each of the client profiles of Capital Preservation, Income, Income & Growth, Growth and Aggressive Growth. A sixth portfolio called the Core Portfolio is designed to reflect weighting decisions of our US equity strategy team. Each of these portfolios employs a combination of top-down sector weightings and bottom-up stock selection focusing on the 10 GICS sectors.
Holdings Primer
US Mid Cap Equity Launched in April 2010, this portfolio invests in stocks between $2-12 billion that are selected using a combination of fundamental, quantitative and portfolio management tools, and is built on the GICS sector framework.
Holdings Primer
International Equity This portfolio consists of ADRs and US-listed shares of non-US companies representing all major regions outside the US: Europe/Middle East/Africa, Asia, Latin America and Canada, and is built on the GICS sector framework.
Holdings Primer
Thematic Equity Launched in June 2014, this portfolio invests in stocks that are expected to benefit from one or more investment themes.
Holdings Primer

The RIC Report | 14 March 2017 31
Methodology: US High Quality & Dividend Screen We list a screen of preferred securities that meet specified selection criteria and have relatively high yields for their credit rating and industry sector. The US High Quality & Dividend Yield Screen is not a recommended list.
Screening criteria We combined our two secular themes through the following criteria. In our view, these screening factors were likely to uncover higher-quality companies that offered relatively secure dividend yield. The stocks are selected from the S&P 500.
• S&P Common Stock Rank of A+, A, or A-. The S&P Common Stock Rankings are ourmain measure of quality. These rankings are based primarily on the growth andstability of earnings and dividends over a 10-year period.
• Return on Equity (ROE) greater than the average S&P 500 ROE.
• Debt/Equity lower than the S&P 500.
• Dividend yield greater than the S&P 500.
• BofA Merrill Lynch Research Investment Opinion indicates Buy or Neutral as well asthe likelihood that the dividend will remain the same or be increased (ie, a dividendrating of “7”).
• The ratio of the last 12 months’ free cash flow to dividends must be greaterthan 1.0.
Methodology: International Low Volatility & Dividend Yield Screen We list a screen of preferred securities that meet specified selection criteria and have high yields relative to their index. The International Low Volatility & Dividend Yield Screen is not a recommended list.
This monthly screen selects low volatility and high dividend yield stocks from the universe of non-US stocks that have ordinary shares or ADRs that trade on the NYSE or NASDAQ, are covered by BofA Merrill Lynch Global Research, and are constituent members of the MSCI AC World ex-USA Index. The screen uses the following criteria to uncover low volatility companies that offer relatively secure dividend yield.
• BofAML Investment Rating indicates Buy or Neutral.
• BofAML Volatility Risk Rating is A-low or B-medium.
• BofAML Income Rating is 7, which indicates the dividend is expected to remain thesame or be increased.
• The dividend yield is greater than the MSCI AC World ex-USA index.
• The debt/equity ratio is less than the MSCI AC World ex-USA index.
• The five-year annualized dividend growth rate is =>0%.
• If a stock from the prior month’s screen is put on the Extended Review list (XRVW),the stock will remain on the screen as long as it meets the other screening criteria.

32 The RIC R
eport | 14 March 2017
US economic forecast summary Real Economic Activity, % SAAR 2Q 15 3Q 15 4Q 15 1Q 16 2Q 16 3Q 16 4Q 16 1Q 17 2Q 17 3Q 17 4Q 17 2015 2016 2017 2018 Real GDP 2.6 2.0 0.9 0.8 1.4 3.5 1.9 2.0 2.0 2.0 2.3 2.6 1.6 2.1 2.5 % Change, Year Ago 3.0 2.2 1.9 1.6 1.3 1.7 1.9 2.2 2.3 1.9 2.1 Final Sales 3.2 2.5 1.2 1.3 2.6 3.0 0.9 2.1 1.9 2.0 2.2 2.4 2.0 2.0 2.4 Domestic Demand 3.2 3.1 1.7 1.3 2.4 2.2 2.6 2.5 2.3 2.3 2.6 3.1 2.1 2.4 2.8 Consumer Spending 2.9 2.7 2.3 1.6 4.3 3.0 3.0 2.3 2.3 2.3 2.5 3.2 2.7 2.6 2.6 Residential Investment 14.8 12.6 11.5 7.8 -7.8 -4.1 9.6 2.0 4.0 4.0 5.0 11.7 4.9 2.7 5.8 Nonresidential Investment 1.6 3.9 -3.3 -3.4 1.0 1.4 1.3 5.5 3.7 3.7 4.7 2.1 -0.5 3.3 5.3 Structures -2.7 -4.3 -15.2 0.1 -2.1 12.0 -4.4 3.0 3.0 3.0 4.0 -4.4 -3.0 2.4 4.6 Equipment -0.3 9.1 -2.6 -9.5 -3.0 -4.5 1.9 7.0 3.0 3.0 4.0 3.5 -2.9 2.5 4.6 Intellectual Property 8.0 2.1 4.5 3.8 9.0 3.2 4.5 5.0 5.0 5.0 6.0 4.8 4.9 5.0 6.6 Government 3.2 1.9 1.0 1.6 -1.7 0.8 0.3 0.5 0.5 0.5 0.8 1.8 0.8 0.4 0.9 Exports 2.8 -2.8 -2.7 -0.7 1.8 10.0 -4.0 2.3 2.3 2.3 1.5 0.1 0.4 1.9 1.6 Imports 2.9 1.1 0.7 -0.6 0.2 2.2 8.5 4.0 4.0 4.0 4.1 4.6 1.1 4.4 4.1 Net Exports (Bil 09$) -525 -547 -567 -566 -559 -522 -600 -615 -630 -645 -665 -540 -562 -639 -721 Contribution to growth (ppts) && -0.1 -0.5 -0.5 0.0 0.2 0.9 -1.7 -0.3 -0.3 -0.3 -0.4 -0.7 -0.1 -0.4 -0.4 Inventory Accumulation (Bil 09$) 93.8 70.9 56.9 40.7 -9.5 7.1 46.2 42.5 42.5 42.5 47.5 84.0 21.1 43.8 60.0 Contribution to growth (ppts) () -0.5 -0.6 -0.4 -0.4 -1.2 0.5 1.0 -0.1 0.0 0.0 0.1 0.2 -0.4 0.1 0.1Nominal GDP (Bil $, SAAR) 17998 18142 18223 18282 18450 18675 18861 19048 19216 19400 19596 18037 18567 19315 20148 % SAAR 4.9 3.2 1.8 1.3 3.7 5.0 4.0 4.0 3.6 3.9 4.1 3.7 2.9 4.0 4.3Key Indicators Industrial Production (% SAAR) -2.7 1.5 -3.4 -1.8 -0.8 1.7 0.5 1.9 3.9 2.8 2.6 0.3 -1.0 2.0 2.4 Capacity Utilization (%) 76.7 76.6 75.8 75.4 75.2 75.5 75.4 75.6 76.1 76.4 76.7 76.7 75.4 76.2 77.2 Nonfarm Payrolls (Avg mom change, 000s) 271 170 277 196 164 239 148 218 180 170 175 226 187 186 183 Civilian Unemployment Rate (%) 5.4 5.1 5.0 5.0 4.9 4.9 4.7 4.7 4.6 4.6 4.5 5.3 4.9 4.6 4.3 Civilian Participation Rate (%) 62.7 62.5 62.6 62.9 62.7 62.8 62.7 62.9 63.0 63.0 63.1 62.7 62.8 63.0 63.0 Productivity (% SAAR) 1.2 2.0 -2.4 -0.6 -0.2 3.5 1.3 0.6 0.6 0.6 0.8 0.9 0.2 1.1 1.0 Personal Savings Rate (%) 5.7 5.9 6.1 6.1 5.9 5.8 5.6 5.4 5.4 5.3 5.3 5.8 5.9 5.4 5.3 Light Vehicle Sales (Millions SAAR) 17.2 17.7 17.9 17.3 17.1 17.5 18.0 17.7 17.6 17.7 17.7 17.4 17.5 17.7 17.9 Housing Starts (Thous. SAAR) 1156 1156 1135 1151 1159 1145 1249 1223 1216 1226 1234 1108 1176 1225 1300 Current Account (% of GDP) -2.6 -2.7 -3.0 -3.3US Budget Balance ($bn, Fiscal Year) -439 -587 -590 -815Inflation GDP Price Index (% SAAR) 2.2 1.2 0.9 0.5 2.3 1.4 2.0 2.1 1.6 1.9 1.7 1.1 1.3 1.9 1.8 % Change, Year Ago& 1.1 1.0 1.1 1.2 1.2 1.3 1.5 1.9 1.8 1.9 1.8 PCE Chain Prices (% SAAR) 1.8 1.1 0.4 0.3 2.0 1.5 1.9 2.5 1.0 2.0 1.5 0.3 1.1 1.8 1.7 % Change, Year Ago$* 0.3 0.3 0.4 0.9 1.0 1.0 1.4 2.0 1.7 1.9 1.8 Core PCE Chain Prices (% SAAR) 1.8 1.4 1.2 2.1 1.8 1.7 1.2 2.2 2.0 1.9 1.7 1.4 1.7 1.8 2.0 % Change, Year Ago$ 1.4 1.3 1.4 1.6 1.6 1.7 1.7 1.7 1.8 1.8 1.9 CPI, Consumer Prices (% SAAR) 2.4 1.5 0.4 0.1 2.3 1.8 3.0 3.3 0.5 2.4 1.8 0.1 1.3 2.3 1.9 % Change, Year Ago! 0.0 0.1 0.4 1.1 1.1 1.1 1.8 2.6 2.1 2.3 2.0 CPI ex Food & Energy ( % SAAR) 2.3 1.9 2.2 2.5 2.1 2.1 2.0 2.8 2.2 2.3 2.4 1.8 2.2 2.3 2.5 % Change, Year Ago@ 1.8 1.8 2.0 2.2 2.2 2.2 2.2 2.2 2.3 2.3 2.4 Shaded regions represent BofA Merrill Lynch US Economics Research forecast Source: BofA Merrill Lynch US Economics Research

The RIC Report | 14 March 2017 33
Global economic forecast summary
GDP growth, % CPI inflation, % Short-term interest rates, % 2015 2016F 2017F 2018F 2015 2016F 2017F 2018F Current 2016 2017F 2018F
Global 3.4 3.0 3.5 3.8 2.5 2.4 3.1 3.0 3.40 3.45 3.52 3.67 Global ex US 3.5 3.4 3.7 4.1 3.1 2.6 3.2 3.2 4.02 4.07 3.98 4.00 Euro Area 1.9 1.7 1.5 1.5 0.0 0.2 1.6 1.3 0.00 0.00 0.00 0.00 UK 2.2 1.8 1.4 1.2 0.0 0.7 2.5 2.7 0.25 0.25 0.10 0.10 Japan 1.2 1.0 1.5 1.2 0.8 -0.1 1.3 1.2 -0.10 -0.10 -0.10 -0.10Canada 1.1 1.1 1.5 1.6 1.1 1.5 1.4 1.4 0.50 0.50 0.50 0.25Emerging EMEA 1.4 1.5 1.8 2.4 8.9 5.4 6.0 6.2 6.75 6.43 6.24 6.13Latin America -0.4 -1.2 1.3 2.4 6.0 6.0 4.4 4.1 9.70 10.64 9.79 9.99 Brazil -3.8 -3.6 1.0 3.0 9.0 8.7 4.1 4.6 12.25 13.75 9.00 8.25Emerging Asia 6.2 6.0 6.1 6.3 2.4 2.6 3.1 3.2 4.36 4.39 4.42 4.42 China 6.9 6.7 6.6 6.6 1.4 2.0 2.3 2.2 4.35 4.35 4.35 4.35Shaded regions represent BofA Merrill Lynch Global Economics Research forecast. Source: BofA Merrill Lynch Global Economics Research
Interest rate forecast summary
(% EOP) 1Q15 2Q15 3Q15 4Q15 1Q16 2Q16 3Q16 4Q16 1Q17 2Q17 3Q17 4Q17 2014 2015 2016 2017 Fed Funds 0-0.25 0-0.25 0-0.25 0.25-0.50 0.25-0.50 0.25-0.50 0.25-0.50 0.50-0.75 0.75-1.00 0.75-1.00 1.00-1.25 1.25-1.50 0-0.25 0.25-0.50 0.50-0.75 1.25-1.50Fed effective 0.06 0.08 0.07 0.20 0.25 0.30 0.25 0.62 0.87 0.87 1.13 1.38 0.06 0.20 0.62 1.38 3-Month T-Bill 0.02 0.01 -0.02 0.16 0.20 0.26 0.25 0.40 0.80 0.85 1.05 1.30 0.04 0.16 0.40 1.30 3-Month LIBOR 0.27 0.28 0.33 0.61 0.63 0.65 0.84 1.00 1.20 1.25 1.45 1.70 0.26 0.61 1.00 1.70 2-Year T-Note 0.56 0.64 0.63 1.05 0.72 0.58 0.75 1.19 1.35 1.50 1.65 1.80 0.66 1.05 1.19 1.80 5-Year T-Note 1.37 1.65 1.36 1.76 1.20 1.00 1.13 1.92 2.20 2.50 2.45 2.45 1.65 1.76 1.92 2.45 10-Year T-Note 1.92 2.35 2.04 2.27 1.77 1.47 1.60 2.44 2.65 3.00 2.95 2.85 2.17 2.27 2.44 2.85 30-Year T-Bond 2.54 3.12 2.85 3.02 2.61 2.28 2.29 3.07 3.25 3.45 3.30 3.25 2.75 3.02 3.07 3.25 2-Year swap 0.81 0.90 0.75 1.18 0.84 0.73 0.99 1.45 1.53 1.66 1.75 1.80 0.90 1.18 1.45 1.80 5-year swap 1.53 1.79 1.38 1.74 1.17 0.98 1.15 1.97 2.10 2.15 2.20 2.25 1.77 1.74 1.97 2.25 10-year swap 2.02 2.46 2.00 2.19 1.64 1.36 1.14 2.33 2.57 2.95 2.95 2.85 2.28 2.19 2.33 2.85 30-year swap 2.39 2.94 2.52 2.62 2.14 1.83 1.74 2.59 2.85 3.10 3.00 3.00 2.70 2.62 2.59 3.00 Note: Federal funds rate forecasts are modal expectations; other values are for market rates. Shaded regions represent BofA Merrill Lynch US Rates Research forecast. Source: BofA Merrill Lynch US Rates Research
FX rate forecast summary
Spot 17-Mar 17-Jun 17-Sep 17-Dec 18-Mar 18-JunG3 EUR-USD 1.07 1.05 1.02 1.02 1.05 1.06 1.07 USD-JPY 115 118 122 119 117 117 115 EUR-JPY 123 124 124 121 123 124 123 Dollar Bloc USD-CAD 1.35 1.34 1.36 1.37 1.39 1.38 1.36 AUD-USD 0.75 0.76 0.73 0.71 0.70 0.70 0.71 NZD-USD 0.69 0.71 0.68 0.68 0.67 0.67 0.68 Europe EUR-GBP 0.88 0.91 0.89 0.88 0.88 0.88 0.87 GBP-USD 1.22 1.15 1.15 1.16 1.19 1.20 1.23 EUR-CHF 1.08 1.09 1.10 1.11 1.12 1.12 1.13 USD-CHF 1.01 1.04 1.08 1.09 1.07 1.06 1.06 EUR-SEK 9.58 9.40 9.30 9.20 9.15 9.10 9.00 USD-SEK 9.00 8.95 9.12 9.02 8.71 8.58 8.41 EUR-NOK 9.18 8.90 8.80 8.70 8.60 8.50 8.50 USD-NOK 8.61 8.48 8.63 8.53 8.19 8.02 7.94 Note: Spot exchange rate as of day before publishing. The left of the currency pair is the denominator of the exchange rate. Forecasts for end of period. Source: BofA Merrill Lynch Global FX Rates & Commodities Research

34 The RIC Report | 14 March 2017
Footnote key # - One or more analysts responsible for covering the securities in this report owns stock of the covered issuer. ## - One or more analysts responsible for covering the securities in this report owns bonds of the covered issuer. ### - One or more analysts responsible for covering the securities in this report owns options on the financial instrument b - MLPF&S or one of its affiliates acts as a market maker for the equity securities recommended in the report. g - MLPF&S or an affiliate was a manager of a public offering of securities of this issuer within the last 12 months. i - The issuer is or was, within the last 12 months, an investment banking client of MLPF&S and/or one or more of its affiliates. j - MLPF&S or an affiliate has received compensation from the issuer for non-investment banking services or products within the past 12 months. o - The issuer is or was, within the last 12 months, a securities business client (non-investment banking) of MLPF&S and/or one or more of its affiliates. p - The issuer is or was, within the last 12 months, a non-securities business client of MLPF&S and/or one or more of its affiliates. q - In the US, retail sales and/or distribution of this report may be made only in states where these securities are exempt from registration or have been qualified for sale. r - An officer, director or employee of MLPF&S or one of its affiliates is an officer or director of this issuer. s - MLPF&S or an affiliate has received compensation for investment banking services from this issuer within the past 12 months. v - MLPF&S or an affiliate expects to receive or intends to seek compensation for investment banking services from this issuer or an affiliate of the issuer within the next three months. w - MLPF&S together with its affiliates beneficially owns one percent or more of the common stock of this issuer. If this report was issued on or after the 9th day of the month, it reflects the ownership position on the last day of the previous month. Reports issued before the 9th day of a month reflect the ownership position at the end of the second month preceding the date of the report. z - The country in which this issuer is organized has certain laws or regulations that limit or restrict ownership of the issuer's shares by nationals of other countries. A - One of the analysts covering the issuer is a former employee of the issuer and, in that capacity, received compensation from the issuer within the past 12 months. B - MLPF&S or one of its affiliates is willing to sell to, or buy from, clients the common equity of the issuer on a principal basis. C - The covered issuer and/or one or more of its affiliates owns 2% or more of the common stock of Bank of America Corporation F - MLPF&S or one of its affiliates trades or may trade as principal in the debt securities (or in related derivatives) that are the subject of this research report. G - MLPF&S or one of its affiliates acts as a market maker for the preferred securities recommended in the report. H - MLPF&S or one of its affiliates is willing to sell to, or buy from, clients the preferred securities of the issuer on a principal basis. N - The issuer is a corporate broking client of Merrill Lynch International in the United Kingdom. O - MLPF&S or one of its affiliates has a significant financial interest in the fixed income instruments of the issuer. If this report was issued on or after the 15th day of the month, it reflects a significant financial interest on the last day of the previous month. Reports issued before the 15th day of the month reflect a significant financial interest at the end of the second month preceding the report. P - Class A shares are variable voting Q - Class A shares are subordinate voting R - Class A shares are nonvoting. S - Class B shares are voting T - Class B shares are nonvoting. U - Class B shares are restricted voting. V - Class B shares are subordinate voting. W - Class S shares are subordinate voting. X - Common shares are subordinate voting. Y - Common shares are limited voting.

The RIC Report | 14 March 2017 35
Disclosures Important Disclosures
FUNDAMENTAL EQUITY OPINION KEY: Opinions include a Volatility Risk Rating, an Investment Rating and an Income Rating. VOLATILITY RISK RATINGS, indicators of potential price fluctuation, are: A - Low, B - Medium and C - High. INVESTMENT RATINGS reflect the analyst’s assessment of a stock’s: (i) absolute total return potential and (ii) attractiveness for investment relative to other stocks within its Coverage Cluster (defined below). There are three investment ratings: 1 - Buy stocks are expected to have a total return of at least 10% and are the most attractive stocks in the coverage cluster; 2 - Neutral stocks are expected to remain flat or increase in value and are less attractive than Buy rated stocks and 3 - Underperform stocks are the least attractive stocks in a coverage cluster. Analysts assign investment ratings considering, among other things, the 0-12 month total return expectation for a stock and the firm’s guidelines for ratings dispersions (shown in the table below). The current price objective for a stock should be referenced to better understand the total return expectation at any given time. The price objective reflects the analyst’s view of the potential price appreciation (depreciation). Investment rating Total return expectation (within 12-month period of date of initial rating) Ratings dispersion guidelines for coverage cluster*
Buy ≥ 10% ≤ 70% Neutral ≥ 0% ≤ 30%
Underperform N/A ≥ 20% * Ratings dispersions may vary from time to time where BofA Merrill Lynch Research believes it better reflects the investment prospects of stocks in a Coverage Cluster.
INCOME RATINGS, indicators of potential cash dividends, are: 7 - same/higher (dividend considered to be secure), 8 - same/lower (dividend not considered to be secure) and 9 - pays no cash dividend. Coverage Cluster is comprised of stocks covered by a single analyst or two or more analysts sharing a common industry, sector, region or other classification(s). A stock’s coverage cluster is included in the most recent BofA Merrill Lynch report referencing the stock.
BofA Merrill Lynch Research Personnel (including the analyst(s) responsible for this report) receive compensation based upon, among other factors, the overall profitability of Bank of America Corporation, including profits derived from investment banking. The analyst(s) responsible for this report may also receive compensation based upon, among other factors, the overall profitability of the Bank’s sales and trading businesses relating to the class of securities or financial instruments for which such analyst is responsible.
Other Important Disclosures Prices are indicative and for information purposes only. Except as otherwise stated in the report, for the purpose of any recommendation in relation to: (i) an equity security, the price referenced is the publicly traded price of the security as of close of business on the day prior to the date of the report or, if the report is published during intraday trading, the price referenced is indicative of the traded price as of the date and time of the report; or (ii) a debt security (including equity preferred and CDS), prices are indicative as of the date and time of the report and are from various sources including Bank of America Merrill Lynch trading desks. The date and time of completion of the production of any recommendation in this report shall be the date and time of dissemination of this report as recorded in the report timestamp.
This report may refer to fixed income securities that may not be offered or sold in one or more states or jurisdictions. Readers of this report are advised that any discussion, recommendation or other mention of such securities is not a solicitation or offer to transact in such securities. Investors should contact their BofA Merrill Lynch representative or Merrill Lynch Financial Global Wealth Management financial advisor for information relating to fixed income securities Officers of MLPF&S or one or more of its affiliates (other than research analysts) may have a financial interest in securities of the issuer(s) or in related investments. BofA Merrill Lynch Global Research policies relating to conflicts of interest are described at http://go.bofa.com/coi. "BofA Merrill Lynch" includes Merrill Lynch, Pierce, Fenner & Smith Incorporated ("MLPF&S") and its affiliates. Investors should contact their BofA Merrill Lynch representative or Merrill Lynch Global Wealth Management financial advisor if they have questions concerning this report. "BofA Merrill Lynch" and "Merrill Lynch" are each global brands for BofA Merrill Lynch Global Research. Information relating to Non-US affiliates of BofA Merrill Lynch and Distribution of Affiliate Research Reports: MLPF&S distributes, or may in the future distribute, research reports of the following non-US affiliates in the US (short name: legal name, regulator): Merrill Lynch (South Africa): Merrill Lynch South Africa (Pty) Ltd., regulated by The Financial Service Board; MLI (UK): Merrill Lynch International, regulated by the Financial Conduct Authority (FCA) and the Prudential Regulation Authority (PRA); Merrill Lynch (Australia): Merrill Lynch Equities (Australia) Limited, regulated by the Australian Securities and Investments Commission; Merrill Lynch (Hong Kong): Merrill Lynch (Asia Pacific) Limited, regulated by the Hong Kong Securities and Futures Commission (HKSFC); Merrill Lynch (Singapore): Merrill Lynch (Singapore) Pte Ltd, regulated by the Monetary Authority of Singapore (MAS); Merrill Lynch (Canada): Merrill Lynch Canada Inc, regulated by the Investment Industry Regulatory Organization of Canada; Merrill Lynch (Mexico): Merrill Lynch Mexico, SA de CV, Casa de Bolsa, regulated by the Comisión Nacional Bancaria y de Valores; Merrill Lynch (Argentina): Merrill Lynch Argentina SA, regulated by Comisión Nacional de Valores; Merrill Lynch (Japan): Merrill Lynch Japan Securities Co., Ltd., regulated by the Financial Services Agency; Merrill Lynch (Seoul): Merrill Lynch International Incorporated (Seoul Branch) regulated by the Financial Supervisory Service; Merrill Lynch (Taiwan): Merrill Lynch Securities (Taiwan) Ltd., regulated by the Securities and Futures Bureau; DSP Merrill Lynch (India): DSP Merrill Lynch Limited, regulated by the Securities and Exchange Board of India; PT Merrill Lynch (Indonesia): PT Merrill Lynch Indonesia, regulated by Otoritas Jasa Keuangan (OJK); Merrill Lynch (Israel): Merrill Lynch Israel Limited, regulated by Israel Securities Authority; Merrill Lynch (Russia): OOO Merrill Lynch Securities, Moscow, regulated by the Central Bank of the Russian Federation; Merrill Lynch (DIFC): Merrill Lynch International (DIFC Branch), regulated by the Dubai Financial Services Authority (DFSA); Merrill Lynch (Spain): Merrill Lynch Capital Markets Espana, S.A.S.V., regulated by Comisión Nacional del Mercado De Valores; Merrill Lynch (Brazil): Bank of America Merrill Lynch Banco Multiplo S.A., regulated by Comissão de Valores Mobiliários; Merrill Lynch KSA Company, Merrill Lynch Kingdom of Saudi Arabia Company, regulated by the Capital Market Authority. This research report: has been approved for publication and is distributed in the United Kingdom (UK) to professional clients and eligible counterparties (as each is defined in the rules of the FCA and the PRA) by MLI (UK) and Bank of America Merrill Lynch International Limited, which are authorized by the PRA and regulated by the FCA and the PRA, and is distributed in the UK to retail clients (as defined in the rules of the FCA and the PRA) by Merrill Lynch International Bank Limited, London Branch, which is authorized by the Central Bank of Ireland and subject to limited regulation by the FCA and PRA - details about the extent of our regulation by the FCA and PRA are available from us on request; has been considered and distributed in Japan by Merrill Lynch (Japan), a registered securities dealer under the Financial Instruments and Exchange Act in Japan; is issued and distributed in Hong Kong by Merrill Lynch (Hong Kong) which is regulated by HKSFC (research reports containing any information in relation to, or advice on, futures contracts are not intended for issuance or distribution in Hong Kong and are not directed to, or intended for issuance or distribution to, or use by, any person in Hong Kong); is issued and distributed in Taiwan by Merrill Lynch (Taiwan); is issued and distributed in India by DSP Merrill Lynch (India); and is issued and distributed in Singapore to institutional investors and/or accredited investors (each as defined under the Financial Advisers Regulations) by Merrill Lynch International Bank Limited (Merchant Bank) (MLIBLMB) and Merrill Lynch (Singapore) (Company Registration Nos F 06872E and 198602883D respectively). MLIBLMB and Merrill Lynch (Singapore) are regulated by MAS. Bank of America N.A., Australian Branch (ARBN 064 874 531), AFS License 412901 (BANA Australia) and Merrill Lynch Equities (Australia) Limited (ABN 65 006 276 795), AFS License 235132 (MLEA) distribute this report in Australia only to 'Wholesale' clients as defined by s.761G of the Corporations Act 2001. With the exception of BANA Australia, neither MLEA nor any of its affiliates involved in preparing this research report is an Authorised Deposit-Taking Institution under the Banking Act 1959 nor regulated by the Australian Prudential Regulation Authority. No approval is required for publication or distribution of this report in Brazil and its local distribution is by Merrill Lynch (Brazil) in accordance with applicable regulations. Merrill Lynch (DIFC) is authorized and regulated by the DFSA. Research reports prepared and issued by Merrill Lynch (DIFC) are done so in accordance with the requirements of the DFSA conduct of business rules. Bank of America Merrill Lynch International Limited, Frankfurt Branch (BAMLI Frankfurt) distributes this report in Germany and is regulated by BaFin. This research report has been prepared and issued by MLPF&S and/or one or more of its non-US affiliates. MLPF&S is the distributor of this research report in the US and accepts full responsibility for research reports of its non-US affiliates distributed to MLPF&S clients in the US. Any US person receiving this research report and wishing to effect any transaction in any security discussed in the report should do so through MLPF&S and not such foreign affiliates. Hong Kong recipients of this research report should contact Merrill Lynch (Asia Pacific) Limited in

36 The RIC Report | 14 March 2017
respect of any matters relating to dealing in securities (and not futures contracts) or provision of specific advice on securities (and not futures contracts). Singapore recipients of this research report should contact Merrill Lynch International Bank Limited (Merchant Bank) and/or Merrill Lynch (Singapore) Pte Ltd in respect of any matters arising from, or in connection with, this research report. General Investment Related Disclosures: Taiwan Readers: Neither the information nor any opinion expressed herein constitutes an offer or a solicitation of an offer to transact in any securities or other financial instrument. No part of this report may be used or reproduced or quoted in any manner whatsoever in Taiwan by the press or any other person without the express written consent of BofA Merrill Lynch. This research report provides general information only. Neither the information nor any opinion expressed constitutes an offer or an invitation to make an offer, to buy or sell any securities or other financial instrument or any derivative related to such securities or instruments (e.g., options, futures, warrants, and contracts for differences). This report is not intended to provide personal investment advice and it does not take into account the specific investment objectives, financial situation and the particular needs of any specific person. Investors should seek financial advice regarding the appropriateness of investing in financial instruments and implementing investment strategies discussed or recommended in this report and should understand that statements regarding future prospects may not be realized. Any decision to purchase or subscribe for securities in any offering must be based solely on existing public information on such security or the information in the prospectus or other offering document issued in connection with such offering, and not on this report. Securities and other financial instruments discussed in this report, or recommended, offered or sold by Merrill Lynch, are not insured by the Federal Deposit Insurance Corporation and are not deposits or other obligations of any insured depository institution (including, Bank of America, N.A.). Investments in general and, derivatives, in particular, involve numerous risks, including, among others, market risk, counterparty default risk and liquidity risk. No security, financial instrument or derivative is suitable for all investors. In some cases, securities and other financial instruments may be difficult to value or sell and reliable information about the value or risks related to the security or financial instrument may be difficult to obtain. Investors should note that income from such securities and other financial instruments, if any, may fluctuate and that price or value of such securities and instruments may rise or fall and, in some cases, investors may lose their entire principal investment. Past performance is not necessarily a guide to future performance. Levels and basis for taxation may change. This report may contain a short-term trading idea or recommendation, which highlights a specific near-term catalyst or event impacting the issuer or the market that is anticipated to have a short-term price impact on the equity securities of the issuer. Short-term trading ideas and recommendations are different from and do not affect a stock's fundamental equity rating, which reflects both a longer term total return expectation and attractiveness for investment relative to other stocks within its Coverage Cluster. Short-term trading ideas and recommendations may be more or less positive than a stock's fundamental equity rating. BofA Merrill Lynch is aware that the implementation of the ideas expressed in this report may depend upon an investor's ability to "short" securities or other financial instruments and that such action may be limited by regulations prohibiting or restricting "shortselling" in many jurisdictions. Investors are urged to seek advice regarding the applicability of such regulations prior to executing any short idea contained in this report. Foreign currency rates of exchange may adversely affect the value, price or income of any security or financial instrument mentioned in this report. Investors in such securities and instruments, including ADRs, effectively assume currency risk. UK Readers: The protections provided by the U.K. regulatory regime, including the Financial Services Scheme, do not apply in general to business coordinated by BofA Merrill Lynch entities located outside of the United Kingdom. BofA Merrill Lynch Global Research policies relating to conflicts of interest are described at http://go.bofa.com/coi. MLPF&S or one of its affiliates is a regular issuer of traded financial instruments linked to securities that may have been recommended in this report. MLPF&S or one of its affiliates may, at any time, hold a trading position (long or short) in the securities and financial instruments discussed in this report. BofA Merrill Lynch, through business units other than BofA Merrill Lynch Global Research, may have issued and may in the future issue trading ideas or recommendations that are inconsistent with, and reach different conclusions from, the information presented in this report. Such ideas or recommendations reflect the different time frames, assumptions, views and analytical methods of the persons who prepared them, and BofA Merrill Lynch is under no obligation to ensure that such other trading ideas or recommendations are brought to the attention of any recipient of this report. In the event that the recipient received this report pursuant to a contract between the recipient and MLPF&S for the provision of research services for a separate fee, and in connection therewith MLPF&S may be deemed to be acting as an investment adviser, such status relates, if at all, solely to the person with whom MLPF&S has contracted directly and does not extend beyond the delivery of this report (unless otherwise agreed specifically in writing by MLPF&S). MLPF&S is and continues to act solely as a broker-dealer in connection with the execution of any transactions, including transactions in any securities mentioned in this report. Copyright and General Information regarding Research Reports: Copyright 2017 Bank of America Corporation. All rights reserved. iQmethod, iQmethod 2.0, iQprofile, iQtoolkit, iQworks are service marks of Bank of America Corporation. iQanalytics®, iQcustom®, iQdatabase® are registered service marks of Bank of America Corporation. This research report is prepared for the use of BofA Merrill Lynch clients and may not be redistributed, retransmitted or disclosed, in whole or in part, or in any form or manner, without the express written consent of BofA Merrill Lynch. BofA Merrill Lynch Global Research reports are distributed simultaneously to internal and client websites and other portals by BofA Merrill Lynch and are not publicly-available materials. Any unauthorized use or disclosure is prohibited. Receipt and review of this research report constitutes your agreement not to redistribute, retransmit, or disclose to others the contents, opinions, conclusion, or information contained in this report (including any investment recommendations, estimates or price targets) without first obtaining expressed permission from an authorized officer of BofA Merrill Lynch. Materials prepared by BofA Merrill Lynch Global Research personnel are based on public information. Facts and views presented in this material have not been reviewed by, and may not reflect information known to, professionals in other business areas of BofA Merrill Lynch, including investment banking personnel. BofA Merrill Lynch has established information barriers between BofA Merrill Lynch Global Research and certain business groups. As a result, BofA Merrill Lynch does not disclose certain client relationships with, or compensation received from, such issuers in research reports. To the extent this report discusses any legal proceeding or issues, it has not been prepared as nor is it intended to express any legal conclusion, opinion or advice. Investors should consult their own legal advisers as to issues of law relating to the subject matter of this report. BofA Merrill Lynch Global Research personnel’s knowledge of legal proceedings in which any BofA Merrill Lynch entity and/or its directors, officers and employees may be plaintiffs, defendants, co-defendants or co-plaintiffs with or involving issuers mentioned in this report is based on public information. Facts and views presented in this material that relate to any such proceedings have not been reviewed by, discussed with, and may not reflect information known to, professionals in other business areas of BofA Merrill Lynch in connection with the legal proceedings or matters relevant to such proceedings. This report has been prepared independently of any issuer of securities mentioned herein and not in connection with any proposed offering of securities or as agent of any issuer of any securities. None of MLPF&S, any of its affiliates or their research analysts has any authority whatsoever to make any representation or warranty on behalf of the issuer(s). BofA Merrill Lynch Global Research policy prohibits research personnel from disclosing a recommendation, investment rating, or investment thesis for review by an issuer prior to the publication of a research report containing such rating, recommendation or investment thesis. Any information relating to the tax status of financial instruments discussed herein is not intended to provide tax advice or to be used by anyone to provide tax advice. Investors are urged to seek tax advice based on their particular circumstances from an independent tax professional. The information herein (other than disclosure information relating to BofA Merrill Lynch and its affiliates) was obtained from various sources and we do not guarantee its accuracy. This report may contain links to third-party websites. BofA Merrill Lynch is not responsible for the content of any third-party website or any linked content contained in a third-party website. Content contained on such third-party websites is not part of this report and is not incorporated by reference into this report. The inclusion of a link in this report does not imply any endorsement by or any affiliation with BofA Merrill Lynch. Access to any third-party website is at your own risk, and you should always review the terms and privacy policies at third-party websites before submitting any personal information to them. BofA Merrill Lynch is not responsible for such terms and privacy policies and expressly disclaims any liability for them. Certain outstanding reports may contain discussions and/or investment opinions relating to securities, financial instruments and/or issuers that are no longer current. Always refer to the most recent research report relating to an issuer prior to making an investment decision. In some cases, an issuer may be classified as Restricted or may be Under Review or Extended Review. In each case, investors should consider any investment opinion relating to such issuer (or its security and/or financial instruments) to be suspended or withdrawn and should not rely on the analyses and investment opinion(s) pertaining to such issuer (or its securities and/or financial instruments) nor should the analyses or opinion(s) be considered a solicitation of any kind. Sales persons and financial advisors affiliated with MLPF&S or any of its affiliates may not solicit purchases of securities or financial instruments that are Restricted or Under Review and may only solicit securities under Extended Review in accordance with firm policies. Neither BofA Merrill Lynch nor any officer or employee of BofA Merrill Lynch accepts any liability whatsoever for any direct, indirect or consequential damages or losses arising from any use of this report or its contents.

The RIC Report | 14 March 2017 37
Research Analysts Additional Research Investment Committee (RIC) Contributors James Barty >> Investment Strategist MLI (UK)
Francisco Blanch Commodity & Deriv Strategist MLPF&S
Jill Carey Hall, CFA Equity & Quant Strategist MLPF&S
Michael Contopoulos HY Credit Strategist MLPF&S
Philip Fischer Municipal Research Strategist MLPF&S
Christina Giannini, CFA Portfolio Strategist MLPF&S
Ethan S. Harris Global Economist MLPF&S
Michael Hartnett Chief Investment Strategist MLPF&S
Ajay Singh Kapur, CFA >> Equity Strategist Merrill Lynch (Hong Kong)
Hans Mikkelsen Credit Strategist MLPF&S
Ralf Preusser, CFA Rates Strategist MLI (UK)
Shyam S.Rajan Rates Strategist MLPF&S
Savita Subramanian Equity & Quant Strategist MLPF&S
Stephen Suttmeier, CFA, CMT Technical Research Analyst MLPF&S
Dan Suzuki, CFA Equity & Quant Strategist MLPF&S
Nigel Tupper >> Strategist Merrill Lynch (Hong Kong)
Mark Ulrich Portfolio Strategist MLPF&S
David Woo FX, Rates & EM Strategist MLPF&S
Shusuke Yamada, CFA >> FX/Equity Strategist Merrill Lynch (Japan)
>> Employed by a non-US affiliate of MLPF&S and is not registered/qualified as a research analyst under the FINRA rules. Refer to "Other Important Disclosures" for information on certain BofA Merrill Lynch entities that take responsibility for this report in particular jurisdictions.