the reversal of global warming by the … sources/spray... · the reversal of global warming by the...
TRANSCRIPT

THE REVERSAL OF GLOBAL WARMING BY THE INCREASE OF THEALBEDO OF MARINE STRATOCUMULUS CLOUD
SALTER, Stephen HSchool of Engineering, University of Edinburgh
Scotland
LATHAM , JohnNational Centre for Atmospheric Research
Boulder Co USA
Summary
Charles Keeling [Keeling et al 2005] began measurements of atmospheric CO2 at Mauna Loa inHawaii in 1958. In June of that year the value was 317.27 parts per million. Month-by-month figuresare available from the URL given in the references. The Kyoto agreement was available for signaturein June 1992 when the CO2 concentration was 358.79 parts per million and rising at 1.22 ppm a year.By June 2006, Kyoto plus 14 years, the figure was 384.21 and rising at 1.92 ppm a year.
The present contribution of extra methane to global warming is about one third that of carbon dioxide[Hansen et al 2005] but measurements of the release from Siberian permafrost [Walter et al 2006] areabout five times higher than expected. If the rate of methane release increases it might take over fromcarbon dioxide as the main driver of global warming, making reductions in the use of fossil fuels lesseffective. Even people who believe that the wider use of renewable energy sources is the ideal solutionthink that it is prudent to investigate complementary ways to slow or reverse the increases of globaltemperatures and have them ready for deployment [Latham 1990] [Crutzen 2006][Angel 2006].
Sean Twomey[1977] showed that the reflectivity of clouds is set by the size distribution of the drops inthem. A large number of small drops reflects more than the same amount of water in larger drops. Inclean marine air-masses there are fewer cloud-condensation nuclei (often 10 to 100/cm3) than overland and so the water is shared between drops about 25 microns in diameter, larger than the average15 microns over land. If the number of suitable nuclei could be increased, the same liquid watercontent would be shared over a large number of smaller drops and so more of the incoming solarenergy would be reflected out to space. Doubling the drop number increases cloud albedo by 5.6%.
Micron-sized drops of salt water are ideal condensation nuclei. When they are sprayed into the marineboundary layer, turbulence will move some into the clouds. The spraying could be done from a numberof remotely-navigated, wind-driven sailing vessels dragging water turbines to generate the energy forspray. Depending on assumptions about nuclei concentration, cloud cover, wind-speed, spray-generation efficiency and drop-life, the amount of spray needed to keep pace with, or even reverse, thethermal effects of increases of atmospheric carbon dioxide concentration can be calculated.
The ratio of solar-energy reflected to surface-tension energy needed to create the sub-micron seeds ismany orders of magnitude. The technique does nothing for the chemical problems of CO2 emissionsand so is an emergency measure for use if emissions cannot be reduced or if methane released frompermafrost takes over from CO2 as the main driver of climate change. Progressive deployment andrapid reversibility are attractive.
Keywords
Global-warming, cloud-albedo, marine stratocumulus, Twomey-effect, permafrost-methane.
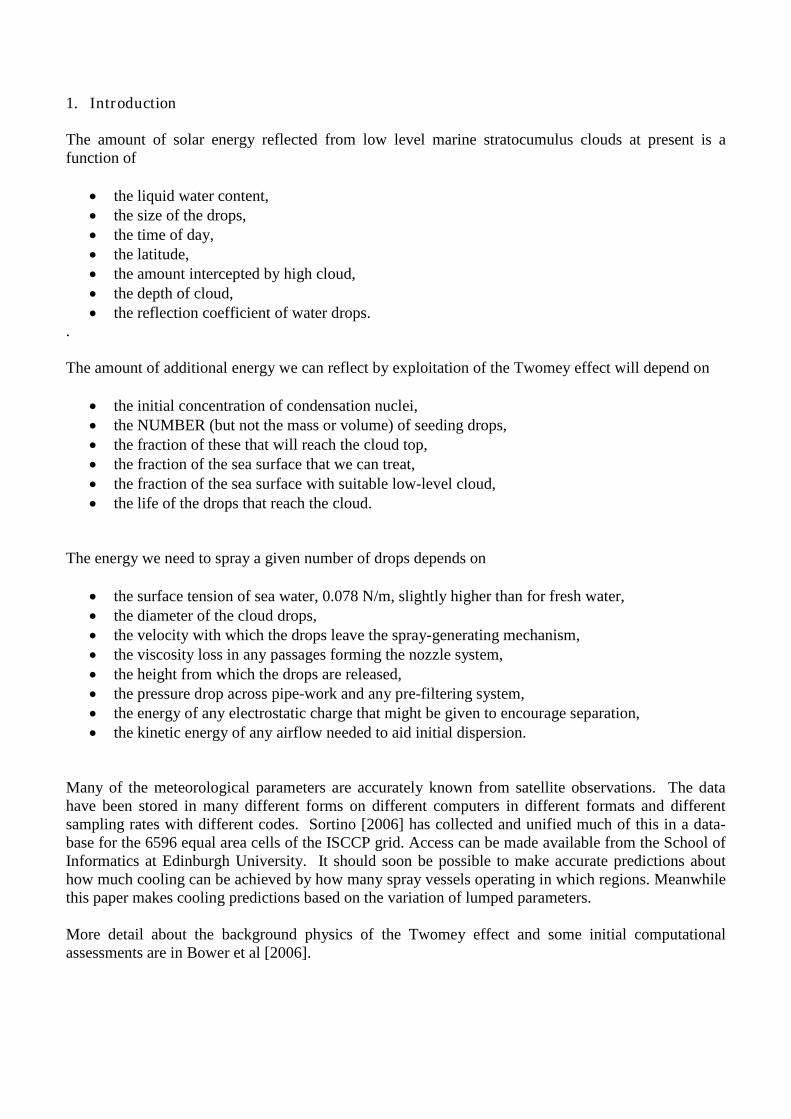
1. Introduction
The amount of solar energy reflected from low level marine stratocumulus clouds at present is afunction of
the liquid water content, the size of the drops, the time of day, the latitude, the amount intercepted by high cloud, the depth of cloud, the reflection coefficient of water drops.
.
The amount of additional energy we can reflect by exploitation of the Twomey effect will depend on
the initial concentration of condensation nuclei, the NUMBER (but not the mass or volume) of seeding drops, the fraction of these that will reach the cloud top, the fraction of the sea surface that we can treat, the fraction of the sea surface with suitable low-level cloud, the life of the drops that reach the cloud.
The energy we need to spray a given number of drops depends on
the surface tension of sea water, 0.078 N/m, slightly higher than for fresh water, the diameter of the cloud drops, the velocity with which the drops leave the spray-generating mechanism, the viscosity loss in any passages forming the nozzle system, the height from which the drops are released, the pressure drop across pipe-work and any pre-filtering system, the energy of any electrostatic charge that might be given to encourage separation, the kinetic energy of any airflow needed to aid initial dispersion.
Many of the meteorological parameters are accurately known from satellite observations. The datahave been stored in many different forms on different computers in different formats and differentsampling rates with different codes. Sortino [2006] has collected and unified much of this in a data-base for the 6596 equal area cells of the ISCCP grid. Access can be made available from the School ofInformatics at Edinburgh University. It should soon be possible to make accurate predictions abouthow much cooling can be achieved by how many spray vessels operating in which regions. Meanwhilethis paper makes cooling predictions based on the variation of lumped parameters.
More detail about the background physics of the Twomey effect and some initial computationalassessments are in Bower et al [2006].
2.0 Equations
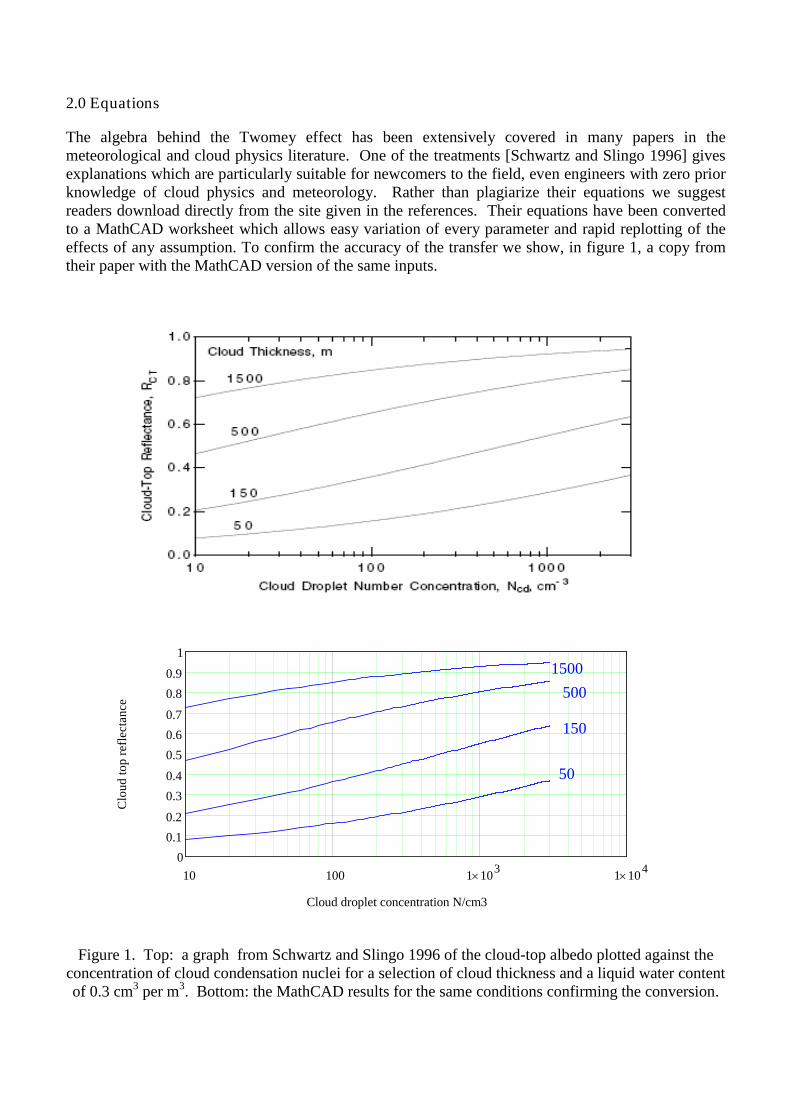
The algebra behind the Twomey effect has been extensively covered in many papers in themeteorological and cloud physics literature. One of the treatments [Schwartz and Slingo 1996] givesexplanations which are particularly suitable for newcomers to the field, even engineers with zero priorknowledge of cloud physics and meteorology. Rather than plagiarize their equations we suggestreaders download directly from the site given in the references. Their equations have been convertedto a MathCAD worksheet which allows easy variation of every parameter and rapid replotting of theeffects of any assumption. To confirm the accuracy of the transfer we show, in figure 1, a copy fromtheir paper with the MathCAD version of the same inputs.
Figure 1. Top: a graph from Schwartz and Slingo 1996 of the cloud-top albedo plotted against theconcentration of cloud condensation nuclei for a selection of cloud thickness and a liquid water contentof 0.3 cm3 per m3. Bottom: the MathCAD results for the same conditions confirming the conversion.
10 100 1 103 1 1040
0.1
0.2
0.3
0.4
0.5
0.6
0.7
0.8
0.9
1
Cloud droplet concentration N/cm3
Clo
udto
pre
flec
tanc
e
150
5001500
50

With confidence in the conversion to MathCAD we can use the Twomey equations to produce thegraph in figure 2. The rising curves show the increase in global power reflected by cloud tops as afunction of spray rate for several assumptions of the initial concentration of nuclei.
Figure 2. The global effects of spray rate on reflected power density.
The central heavy rising line with the left-hand scale is global power change per square metre for aconcentration of cloud condensation nuclei of 64.5 per cm3 as a function of the spray rate drops. Thisconcentration is the average of the measurements [Bennartz 2007] of 40 per cm3 for the clean air of theSouth Pacific and 89 per cm3 for the dirtier North Atlantic air masses which are shown in the thinnersolid lines to either side. The rising dashed lines are half the lowest Bennartz figure and double thehighest. The falling dot/dash line and right-hand axis show the ratio of reflected power per squaremetre to that of the power per square metre needed for spray production assuming an efficiency of10% referred to the surface tension energy of the drops. The power ratio is clearly very large.
BennartzS. Pacific
BennartzN.Atlantic
0 10 20 30 40 50 60 70 80 90 1000
0.5
1
1.5
2
2.5
3
3.5
4
4.5
5
0
1 106
2 106
3 106
4 106
5 106
Global spray rate cubic metres per second
Ext
ragl
obal
refl
ecte
dso
lare
nerg
yw
att/m
2
Rat
ioof
refl
ecte
dpo
wer
tosp
ray
pow
erat
10%
effi
cien
cy
3. Assumptions
Other assumptions are that:
The mean 24-hour value of the solar input to the cloud top is 340 watts per square metre. Thiswill require seasonal migration of spray vessels to the hemisphere which is in summer.
The power reduction from the treated clouds is shared with the rest of the global surface.
The cloud depth is 300 metres.
The boundary layer depth is taken as 1000 metres.
The drop diameter is 0.8 microns.
The liquid water ratio is 0.3 cm3 per m3 as in the Schwartz and Slingo 1996 paper.
The area of the sea being treated is taken as 0.18 of the total global sea area.
The fraction of this area containing suitable low-level marine stratocumulus clouds butinsignificant high cloud cover is taken as 0.3.
Turbulence produces an even distribution of spray drops through the boundary layer.
The average drop life three days is an area of some uncertainty and needs investigation. Thespray quantity would be inversely proportional for other drop lifetimes.
We would be grateful for suggestions about any other sets of assumptions and can quickly produce theresulting graphs of cooling against spray quantity.
The life estimate is the least certain parameter and we have received advice ranging from ‘about a day’ to ‘a few days’ up to ‘about a week’. The collision velocities of 30 micron drops are not sufficient togive a Weber number high enough for coalescence but a drop of drizzle can move fast enough tocoalesce with all the small drops in its path. Bennartz reports drizzle in 80% of the MODISobservations from the Aqua satellite. If a small drop moves out of a cloud its water will largelyevaporate, leaving a concentrated salt residue which is free to go round again. But the residues from alarge drop of drizzle may fall fast enough to reach the sea. This life reduction by drizzle is somewhatoffset by the clean up of air masses which falling drizzle will produce. Further advice and links toexperimental observations would be welcome. It should be possible to make deductions frommeasurements of cloud aerosol in air masses which have moved from land out to sea at differentdistances from the shoreline.
Some spray-generating mechanisms have an efficiency of much less than 10% when producingsubmicron drops. Calculations for the efficiency of a new design of spray generator using electronicmicro-fabrication technology suggest an overall efficiency of better than 20% relative to the surfacetension energy but will be subject to verification.
Figures 3 to 5 show the effects of variation of the assumptions of drop life, cloud depth and liquidwater content.

Figure 3. Post-spray albedo for low, average and high Bennartz initial concentrationsand drop lives of 1.5, 3, and 6 days. The liquid water is content 0.3 cm3/m3
Figure 4. Reflected power for the average Bennartz concentration, 0.3 cm3/m3 liquid water content andvarious cloud depths. There is very little change for the central values of 3, 4, 500 metres but 200
metres (dotted) and 1000 metres (dashed) are low.
Figure5. Post spray albedo for variation of liquid water content 0.1 to 0.5 cm3/m3 and 300m depth.
0 10 20 30 40 50 60 70 80 90 1000.2
0.3
0.4
0.5
0.6
0.7
Global spray rate cubic metres per second
Post
spra
yal
bedo
0 10 20 30 40 50 60 70 80 90 1000
1
2
3
4
5
Global spray rate cubic metres per second
Ref
lect
edpo
wer
gain
wat
t/m2
0 10 20 30 40 50 60 70 80 90 1000.2
0.3
0.4
0.5
0.6
0.7
Global spray rate cubic metres per second
Post
spra
yal
bedo
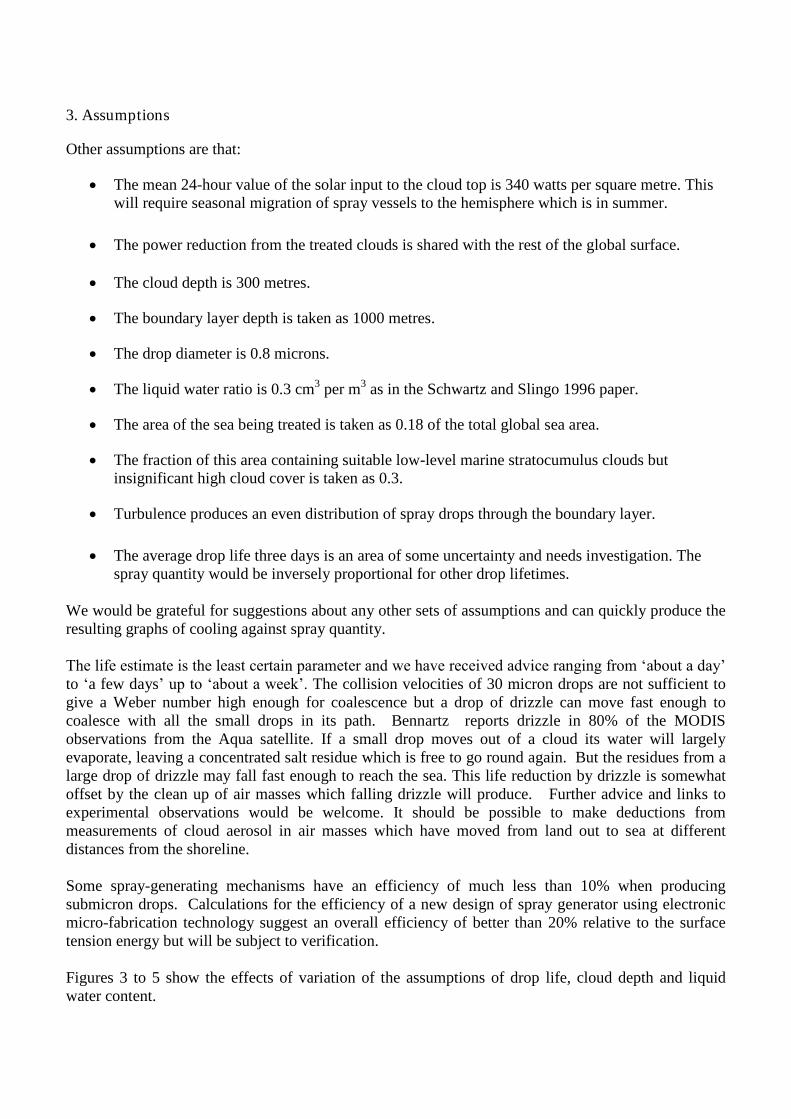
4. Practical hardware.
The requirement for operations with a good solar input points to mobile equipment which can draw allthe spray energy from the wind and so stay on station for long periods. The direction and magnitudeof the thrust from a Flettner rotor are controlled by its rotation speed which is much easier to controlby a computer in an unmanned vessel than would be the case for a vessel with conventional textilesails. It is possible to apply brakes and, with two or more rotors, to rotate about the vessel centre.Heeling moments are proportional to the first power of wind speed rather than its square and soFlettner-powered vessels should be much safer from capsize in heavy seas. The addition of Thomfences can give lift coefficients up to 20 and lift drag ratios up to 35 so that they can tack much closerto the wind than a vessel with a conventional rig.
Figure 3 is an artist’s impression of a spray vessel. Turbines much larger than propellers for a vesselof this size would be dragged through the water to generate energy for spray generation. About 10%of the turbine output would be needed to spin the Flettner rotors. Vessels would be fitted with satellitenavigation and an Iridium communications system which would allow them to be directed to suitablespray sites and also to send back to eager meteorologists data on sea temperatures, atmosphericpressure, wind and current velocity and direction, solar input, cloud cover, wave height and period,plankton and aerosol count and even to relay emergency messages. Once at the chosen site each vesselwould sail back and forth across the prevailing wind producing a wake of treated air downwind.
Figure 4. Albedo spray vessels. They would sail back and forth square to the local prevailing wind.Flettner rotors with Thom fences can give lift coefficients up to 20 and lift drag ratios of 35, much
higher than cloth sails. Artwork by John MacNeill.
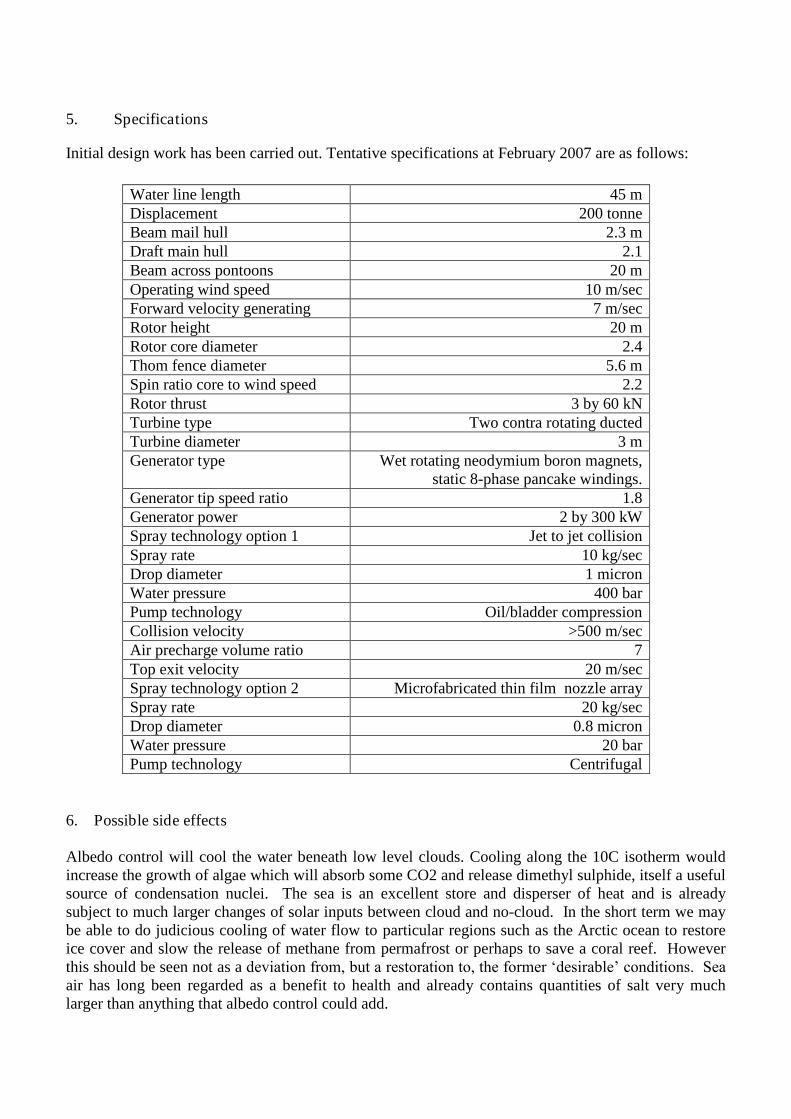
5. Specifications
Initial design work has been carried out. Tentative specifications at February 2007 are as follows:
Water line length 45 mDisplacement 200 tonneBeam mail hull 2.3 mDraft main hull 2.1Beam across pontoons 20 mOperating wind speed 10 m/secForward velocity generating 7 m/secRotor height 20 mRotor core diameter 2.4Thom fence diameter 5.6 mSpin ratio core to wind speed 2.2Rotor thrust 3 by 60 kNTurbine type Two contra rotating ductedTurbine diameter 3 mGenerator type Wet rotating neodymium boron magnets,
static 8-phase pancake windings.Generator tip speed ratio 1.8Generator power 2 by 300 kWSpray technology option 1 Jet to jet collisionSpray rate 10 kg/secDrop diameter 1 micronWater pressure 400 barPump technology Oil/bladder compressionCollision velocity >500 m/secAir precharge volume ratio 7Top exit velocity 20 m/secSpray technology option 2 Microfabricated thin film nozzle arraySpray rate 20 kg/secDrop diameter 0.8 micronWater pressure 20 barPump technology Centrifugal
6. Possible side effects
Albedo control will cool the water beneath low level clouds. Cooling along the 10C isotherm wouldincrease the growth of algae which will absorb some CO2 and release dimethyl sulphide, itself a usefulsource of condensation nuclei. The sea is an excellent store and disperser of heat and is alreadysubject to much larger changes of solar inputs between cloud and no-cloud. In the short term we maybe able to do judicious cooling of water flow to particular regions such as the Arctic ocean to restoreice cover and slow the release of methane from permafrost or perhaps to save a coral reef. Howeverthis should be seen not as a deviation from, but a restoration to, the former ‘desirable’ conditions. Sea air has long been regarded as a benefit to health and already contains quantities of salt very muchlarger than anything that albedo control could add.

7. Conclusions
Everybody working in the field of climate recovery would prefer solutions to the global warmingproblem based on the use of non-carbon energy sources. But fourteen years after the Kyoto agreementwas ready for signature, the rate of increase of atmospheric CO2 has itself increased. It is thereforeurgent to design and test all possible methods to stabilize temperature for use if the present proposedmethods are unsuccessful.
It is technically possible to use albedo control to increase the reflectivity of marine stratocumulusclouds by spraying quite small quantities of sea water into the marine boundary layer. The sprayrequirement is set mainly by the initial concentration of condensation nuclei and droplet residencetime.
As predicted by Twomey, the areas with low initial concentrations of condensation nuclei are the mostsuitable for albedo increase. The previous uncertainty about these values has been greatly reduced bythe recent analysis by Bennartz of Aqua MODIS measurements.
On reasonable assumptions of the present concentrations of condensation nuclei in mid-ocean airmasses and drop life, the first global reduction of 1 watt per square metre will require spraying a totalof only 5 cubic metres a second. Because of diminishing returns, the increase from 2.7 to 3.7 watts persquare metre, needed to stabilize temperatures despite a future doubling of carbon dioxide levels willrequire an extra 30 cubic metres a second, bringing the total spray rate to just under 60 cubic metres ofsea water per second.
If necessary it would be possible to spray amounts sufficient to compensate for five watts per squaremetre over the entire earth surface.
Operations in water en route to the Arctic Ocean will have secondary benefits in the restoration of icecover and the reduction of methane release from Siberian permafrost. Operations may also be aimedat endangered coral.
The possibility of initial small-scale tests, progressive introduction, the use of very small quantities ofbenign materials, six orders of magnitude power gain and rapid shut down are attractive.
Extra observations of surface conditions will complement satellite observations and so be valuable tometeorologists and controllers of the global cooling system.
The next step should be a more detailed analysis of the spray effectiveness in local areas using thecoordinated database assembled by Sortino for which some data are still required. The chief remaininguncertainty is the lifetime of small salt residues inside and outside drizzling and non-drizzling cloud.
7. Acknowledgements
Lowell Wood and Tom Stevenson have made very helpful suggestions about the design of efficientspray generation. Two leading atmospheric physicists have corrected mistakes in the first draft but aretoo modest to allow their names to appear in this section. The work of James Lovelock has givengeneral encouragement.

References.
Angel R. Feasibility of cooling the earth with a cloud of small spacecraft near the inner Lagrangepoint. Proceedings National Academy of Sciences, vol 103 pp 17184-17189 2006.From http://www.pnas.org/cgi/reprint/103/46/17184
Bennartz R. Global assssment of marine boundary layer cloud droplet number concentration fromsatellite. Journal of Geophysical Research, vol 112, 12, D02201, doi:10.1029/2006JD007547, 2007From http://www.agu.org/pubs/crossref/2007/2006JD007547.shtml
Bower K, Choularton T, Latham J, Sahraei J, Salter S. Computational assessment of a proposedtechnique for global warming mitigation via albedo-enhancement of marine stratocumulus clouds.Atmospheric Research vol 82 pp 328-336 2006.
Crutzen P. Albedo enhancement by stratospheric sulfur injections: a contribution to resolve a policydilemma. Climatic Change vol. 77 pp.211-219 2006.From http://www.springerlink.com/content/t1vn75m458373h63/
Hansen J. Efficacy of climate forcings. Journal of Geophysical Research 110(d18): D18104 2005.See also http://www.columbia.edu/~jeh1/
Keeling CD, Piper SC, Bacastow RB, Wahlen M, Whorf TP, Heimann M, and Meijer HA,Atmospheric CO2 and 13CO2 exchange with the terrestrial biosphere and oceans from 1978 to 2000:observations and carbon cycle implications, pages 83-113, in A History of Atmospheric CO2 and itseffects on Plants, Animals, and Ecosystems, editors, Ehleringer JR, Cerling TE, Dearing M D, SpringerVerlag, New York, 2005.Month-by-month data from http://scrippsco2.ucsd.edu/data/in_situ_co2/mlo_in_situ_record.txt.
Latham J. Control of global warming? Nature vol. 347 pp 339-340, 1990.
Schwartz SE, Slingo A. Enhanced shortwave cloud radiative forcing due to anthropgenic aerosols. InClouds, Chemistry and Climate pp 191-236 (Crutzen and Ramanathan eds). Springer Heidelberg1996.From http://www.ecd.bnl.gov/steve/pubs/Enhanced_Shortwave.pdf
Sortino GN. A data resource for cloud cover simulations. Master of Science thesis, School ofInformatics University of Edinburgh, 2006.
Twomey S. The influence of pollution on the shortwave albedo of clouds. Journal of AtmosphericSciences. vol 34 pp1149-1152, July 1977.From http://ams.allenpress.com/archive/1520-0469/34/7/pdf/i1520-0469-34-7-1149.pdf
Walter KM, Zimov SA, Chanton JP, Verbyla D, Chapin FS. Methane bubbling from Siberian thawlakes as a positive feedback to climate warming. Nature vol 443 pp 71-75 September 2006.