the revenue functions of a monopoly - econedlink - free economics … mi… · the revenue...
TRANSCRIPT

Advanced Placement Economics Microeconomics: Student Resource Manual © Council for Economic Education, New York, N.Y. 175
3 Microeconomics
The Revenue Functions of a Monopoly
At the opposite end of the market spectrum from perfect competition is monopoly. A monopoly exists when only one firm sells the good or service. This means the monopolist faces the market demand curve since it has no competition from other firms. If the monopolist wants to sell more of its product, it will have to lower its price. As a result, the price (P) at which an extra unit of output (Q) is sold will be greater than the marginal revenue (MR) from that unit.
Student Alert: P is greater than MR for a monopolist.
1. Table 3-10.1 has information about the demand and revenue functions of the MoonglowMonopoly Company. Complete the table. Assume the monopoly charges each buyer the same P(i.e., there is no price discrimination). Enter the MR values at the higher of the two Q levels. Forexample, since total revenue (TR) increases by $37.50 when the firm increases Q from two to threeunits, put “+$37.50” in the MR column for Q = 3.
Table 3-10.1 The Moonglow Monopoly Company
Q P TR MRAverage revenue
(AR)
0 $100.00 – –
1 $87.50
2 $150.00
3 $62.50 +$37.50
4 $50.00
5 $187.50
6 $25.00
7 –$62.50
8 $0.00
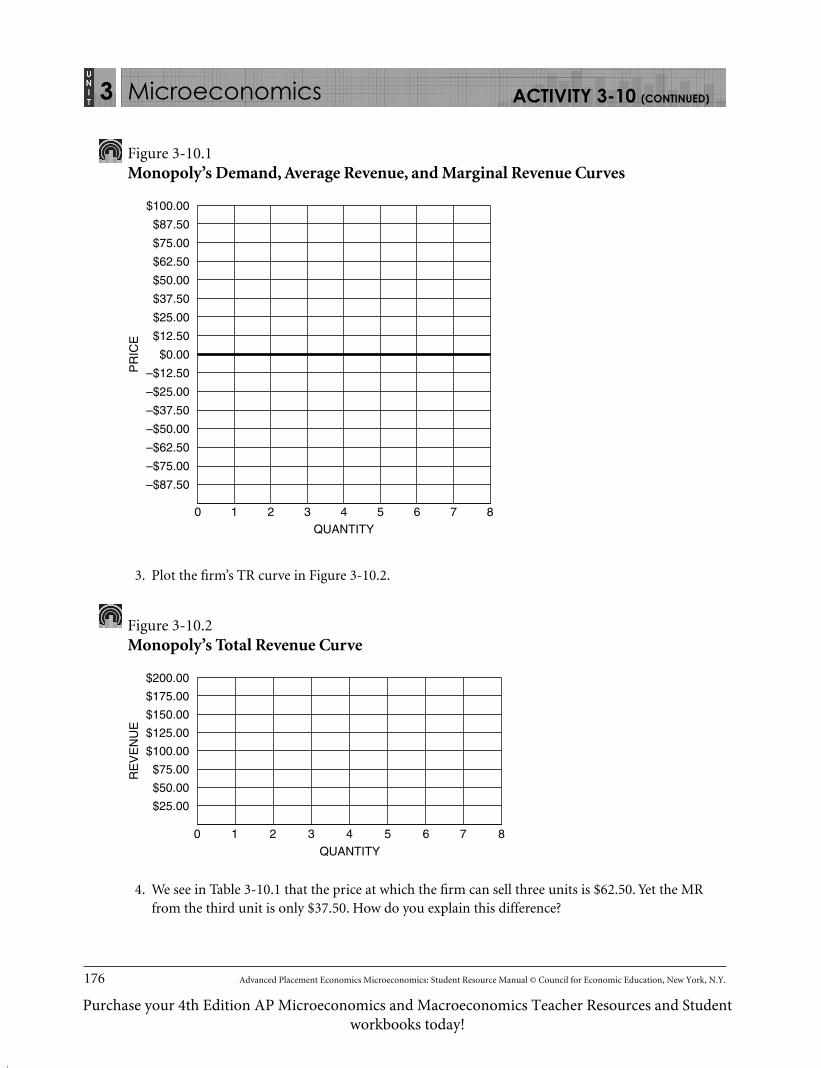
2. Draw the demand (D), AR, and MR curves in Figure 3-10.1. Plot the MR values at the higher ofthe two Q levels.
ACTIVITY 3-10
CEE-APE_MACROSE-12-0101-MISM-Book.indb 175 27/07/12 8:33 PM
Purchase your 4th Edition AP Microeconomics and Macroeconomics Teacher Resources and Student workbooks today!
176 Advanced Placement Economics Microeconomics: Student Resource Manual © Council for Economic Education, New York, N.Y.
3 Microeconomics
Figure 3-10.1 Monopoly’s Demand, Average Revenue, and Marginal Revenue Curves
QUANTITY
PR
ICE
–$75.00
–$50.00
–$25.00
10 2 3 4 5 6
$0.00
$25.00
$50.00
$75.00
–$87.50
–$62.50
–$37.50
–$12.50
$12.50
$37.50
$62.50
$87.50
$100.00
7 8
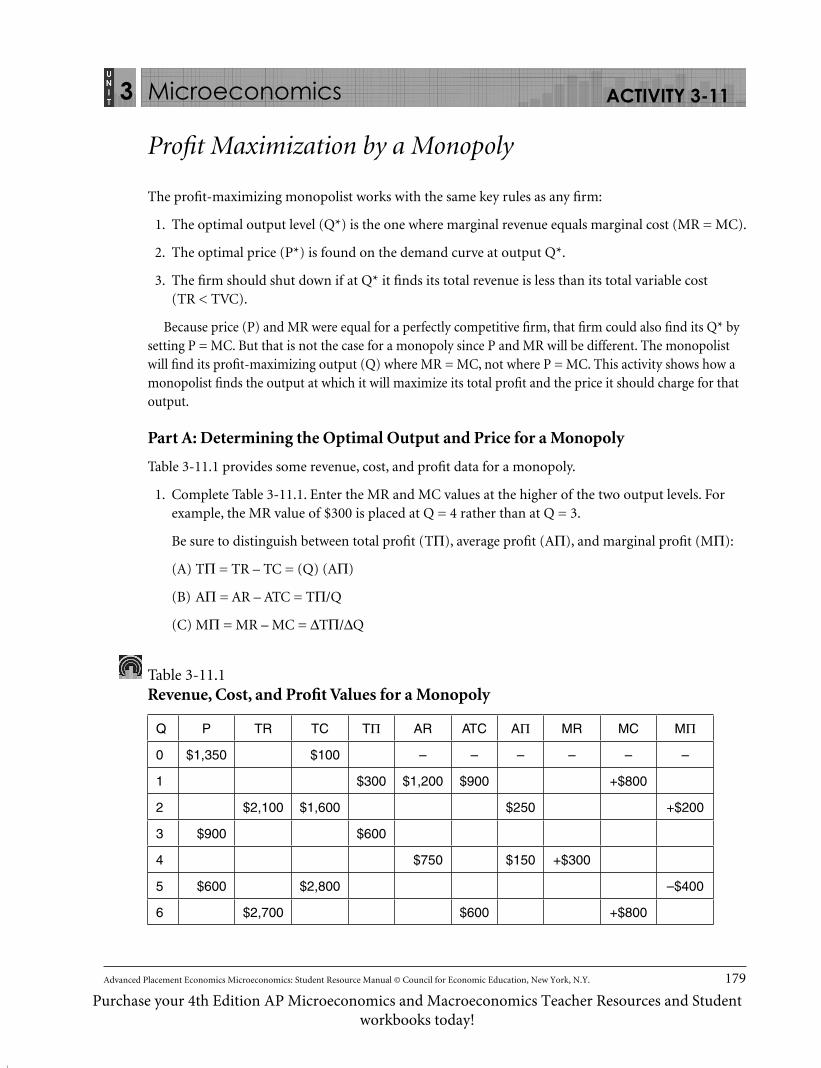
3. Plot the firm’s TR curve in Figure 3-10.2.
Figure 3-10.2 Monopoly’s Total Revenue Curve
QUANTITY
RE
VE
NU
E
$50.00
$100.00
$150.00
10 2 3 4 5 6
$200.00
$25.00
$75.00
$125.00
$175.00
7 8
4. We see in Table 3-10.1 that the price at which the firm can sell three units is $62.50. Yet the MRfrom the third unit is only $37.50. How do you explain this difference?
ACTIVITY 3-10 (CONTINUED)
CEE-APE_MACROSE-12-0101-MISM-Book.indb 176 27/07/12 8:33 PM
Purchase your 4th Edition AP Microeconomics and Macroeconomics Teacher Resources and Student workbooks today!

Advanced Placement Economics Microeconomics: Student Resource Manual © Council for Economic Education, New York, N.Y. 177
3 Microeconomics
5. Why does the vertical gap between the firm’s D curve and MR curve get larger as the firm sellsmore output?
Table 3-10.1 is an example of a discrete case because it has a small number of observations (output varies from zero to eight units). Figure 3-10.3 is an example of a continuous case because it is based on a large number of observations. Answer Questions 6–8 based on Figure 3-10.3.
Figure 3-10.3 A Continuous Example of a Monopoly’s Revenue Curves
QUANTITY
QUANTITY
5000
$40
RE
VE
NU
E
1,000
TR
MR
5000
$80
RE
VE
NU
E
1,000
D = AR
6. Indicate clearly in the top graph of Figure 3-10.3 the elastic, unitary elastic, and inelastic portionsof the D curve. Explain your answer.
ACTIVITY 3-10 (CONTINUED)
CEE-APE_MACROSE-12-0101-MISM-Book.indb 177 27/07/12 8:33 PM
Purchase your 4th Edition AP Microeconomics and Macroeconomics Teacher Resources and Student workbooks today!

178 Advanced Placement Economics Microeconomics: Student Resource Manual © Council for Economic Education, New York, N.Y.
3 Microeconomics
7. Marginal revenue is found using the ratio MR = DTR/DQ. This is also the formula for the slope ofthe TR curve. Thus, MR = slope of the TR curve.
(A) Over what range of output is the slope of the TR curve positive? Over what range of output isthe firm’s MR positive?
(B) Over what range of output is the firm’s MR negative? Over what range of output is the slope of the TR curve negative?
(C) Over what range of output is the slope of the TR curve equal to zero? Over what range of output is the firm’s MR equal to zero?
8. What is the maximum dollar value of TR this firm can receive?
Bonus Question!
9. When the Galaxy Firm lowers its price from $60 to $57, the number of units it sells increases from36 to 39. What is the value of MR? How should you interpret this value?
ACTIVITY 3-10 (CONTINUED)
CEE-APE_MACROSE-12-0101-MISM-Book.indb 178 27/07/12 8:33 PM
Purchase your 4th Edition AP Microeconomics and Macroeconomics Teacher Resources and Student workbooks today!
Advanced Placement Economics Microeconomics: Student Resource Manual © Council for Economic Education, New York, N.Y. 179
3 Microeconomics
Profit Maximization by a Monopoly
The profit-maximizing monopolist works with the same key rules as any firm:
1. The optimal output level (Q*) is the one where marginal revenue equals marginal cost (MR = MC).
2. The optimal price (P*) is found on the demand curve at output Q*.
3. The firm should shut down if at Q* it finds its total revenue is less than its total variable cost(TR < TVC).
Because price (P) and MR were equal for a perfectly competitive firm, that firm could also find its Q* by setting P = MC. But that is not the case for a monopoly since P and MR will be different. The monopolist will find its profit-maximizing output (Q) where MR = MC, not where P = MC. This activity shows how a monopolist finds the output at which it will maximize its total profit and the price it should charge for that output.
Part A: Determining the Optimal Output and Price for a Monopoly
Table 3-11.1 provides some revenue, cost, and profit data for a monopoly.
1. Complete Table 3-11.1. Enter the MR and MC values at the higher of the two output levels. Forexample, the MR value of $300 is placed at Q = 4 rather than at Q = 3.
Be sure to distinguish between total profit (TΠ), average profit (AΠ), and marginal profit (MΠ):
(A) TΠ = TR – TC = (Q) (AΠ)
(B) AΠ = AR – ATC = TΠ/Q
(C) MΠ = MR – MC = DTΠ/DQ
Table 3-11.1 Revenue, Cost, and Profit Values for a Monopoly
Q P TR TC TΠ AR ATC AΠ MR MC MΠ
0 $1,350 $100 – – – – – –
1 $300 $1,200 $900 +$800
2 $2,100 $1,600 $250 +$200
3 $900 $600
4 $750 $150 +$300
5 $600 $2,800 –$400
6 $2,700 $600 +$800
ACTIVITY 3-11
CEE-APE_MACROSE-12-0101-MISM-Book.indb 179 27/07/12 8:33 PM
Purchase your 4th Edition AP Microeconomics and Macroeconomics Teacher Resources and Student workbooks today!
180 Advanced Placement Economics Microeconomics: Student Resource Manual © Council for Economic Education, New York, N.Y.
3 Microeconomics
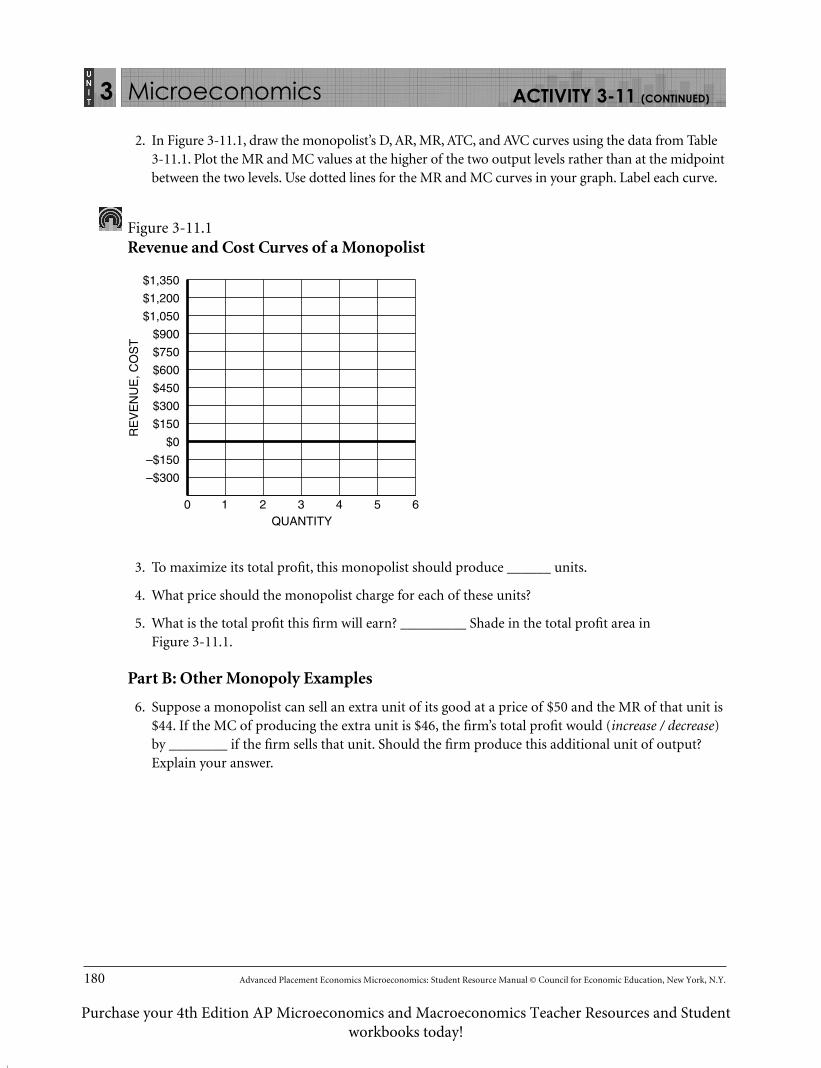
2. In Figure 3-11.1, draw the monopolist’s D, AR, MR, ATC, and AVC curves using the data from Table3-11.1. Plot the MR and MC values at the higher of the two output levels rather than at the midpointbetween the two levels. Use dotted lines for the MR and MC curves in your graph. Label each curve.
Figure 3-11.1 Revenue and Cost Curves of a Monopolist
QUANTITY
RE
VE
NU
E, C
OS
T
–$150
$0
$150
$450
10 2 3 4 5 6
$750
$1,050
$1,350
–$300
$300
$600
$900
$1,200
3. To maximize its total profit, this monopolist should produce ______ units.
4. What price should the monopolist charge for each of these units?
5. What is the total profit this firm will earn? _________ Shade in the total profit area inFigure 3-11.1.
Part B: Other Monopoly Examples
6. Suppose a monopolist can sell an extra unit of its good at a price of $50 and the MR of that unit is$44. If the MC of producing the extra unit is $46, the firm’s total profit would (increase / decrease)by ________ if the firm sells that unit. Should the firm produce this additional unit of output?Explain your answer.
ACTIVITY 3-11 (CONTINUED)
CEE-APE_MACROSE-12-0101-MISM-Book.indb 180 27/07/12 8:33 PM
Purchase your 4th Edition AP Microeconomics and Macroeconomics Teacher Resources and Student workbooks today!
Advanced Placement Economics Microeconomics: Student Resource Manual © Council for Economic Education, New York, N.Y. 181
3 Microeconomics
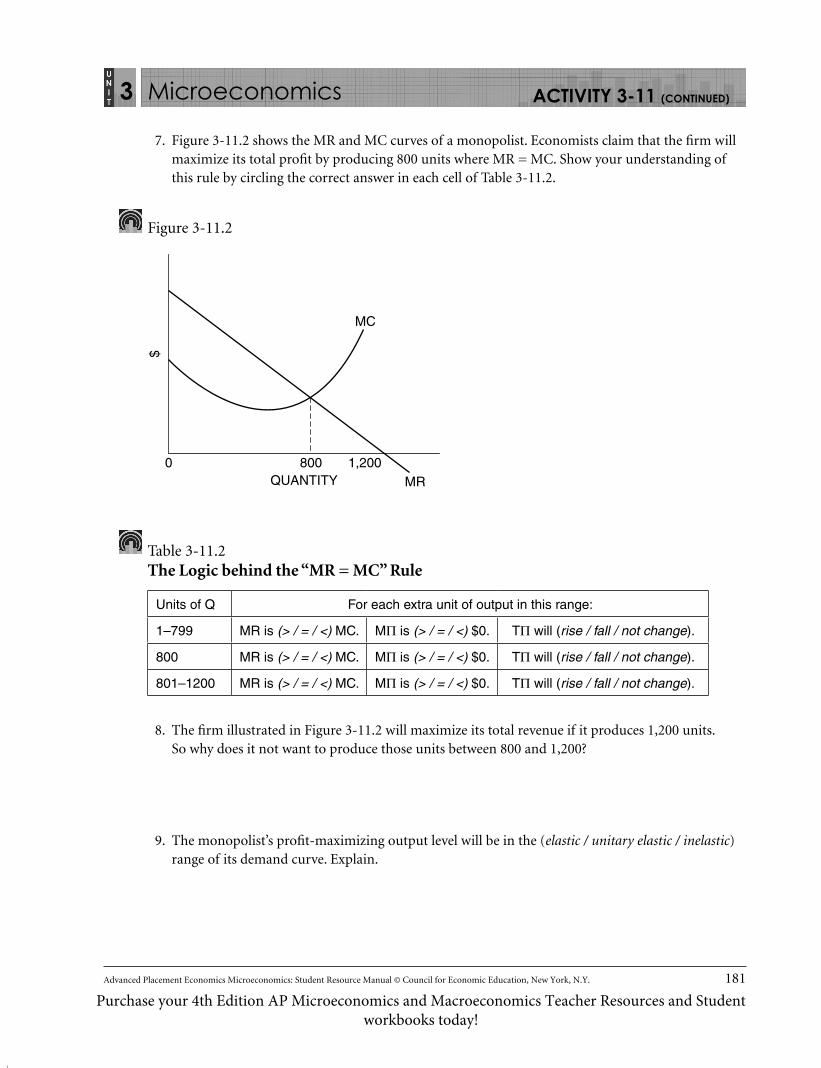
7. Figure 3-11.2 shows the MR and MC curves of a monopolist. Economists claim that the firm willmaximize its total profit by producing 800 units where MR = MC. Show your understanding ofthis rule by circling the correct answer in each cell of Table 3-11.2.
Figure 3-11.2
0
$
800QUANTITY
MC
MR1,200
Table 3-11.2 The Logic behind the “MR = MC” Rule
Units of Q For each extra unit of output in this range:
1–799 MR is (> / = / <) MC. MΠ is (> / = / <) $0. TΠ will (rise / fall / not change).
800 MR is (> / = / <) MC. MΠ is (> / = / <) $0. TΠ will (rise / fall / not change).
801–1200 MR is (> / = / <) MC. MΠ is (> / = / <) $0. TΠ will (rise / fall / not change).
8. The firm illustrated in Figure 3-11.2 will maximize its total revenue if it produces 1,200 units.So why does it not want to produce those units between 800 and 1,200?
9. The monopolist’s profit-maximizing output level will be in the (elastic / unitary elastic / inelastic)range of its demand curve. Explain.
ACTIVITY 3-11 (CONTINUED)
CEE-APE_MACROSE-12-0101-MISM-Book.indb 181 27/07/12 8:33 PM
Purchase your 4th Edition AP Microeconomics and Macroeconomics Teacher Resources and Student workbooks today!

CEE-APE_MACROSE-12-0101-MISM-Book.indb 182 27/07/12 8:33 PM

Advanced Placement Economics Microeconomics: Student Resource Manual © Council for Economic Education, New York, N.Y. 183
3 Microeconomics
Equilibrium in a Monopolistic Market
Part A: Equilibrium in a Perfectly Competitive Market
Consider Figure 3-12.1, which shows a perfectly competitive market. The market supply curve S is the horizontal summation of the marginal cost (MC) curves of all the firms in the market. Use Figure 3-12.1 to answer the questions that follow the graph.
Figure 3-12.1 Equilibrium in a Perfectly Competitive Market
QUANTITY
S = MC
D
B
A
F
H
PR
ICE
$4
$8
$12
10 2 3 4 5 6 7
$16
$20
$24
$2
$6
$10
$14
$18
$22
1. What is the equilibrium quantity in the market?
2. What is the equilibrium price?
3. What area of the graph represents consumer surplus in the market? Calculate the dollar value ofconsumer surplus.
ACTIVITY 3-12
CEE-APE_MACROSE-12-0101-MISM-Book.indb 183 27/07/12 8:33 PM
Purchase your 4th Edition AP Microeconomics and Macroeconomics Teacher Resources and Student workbooks today!
184 Advanced Placement Economics Microeconomics: Student Resource Manual © Council for Economic Education, New York, N.Y.
3 Microeconomics
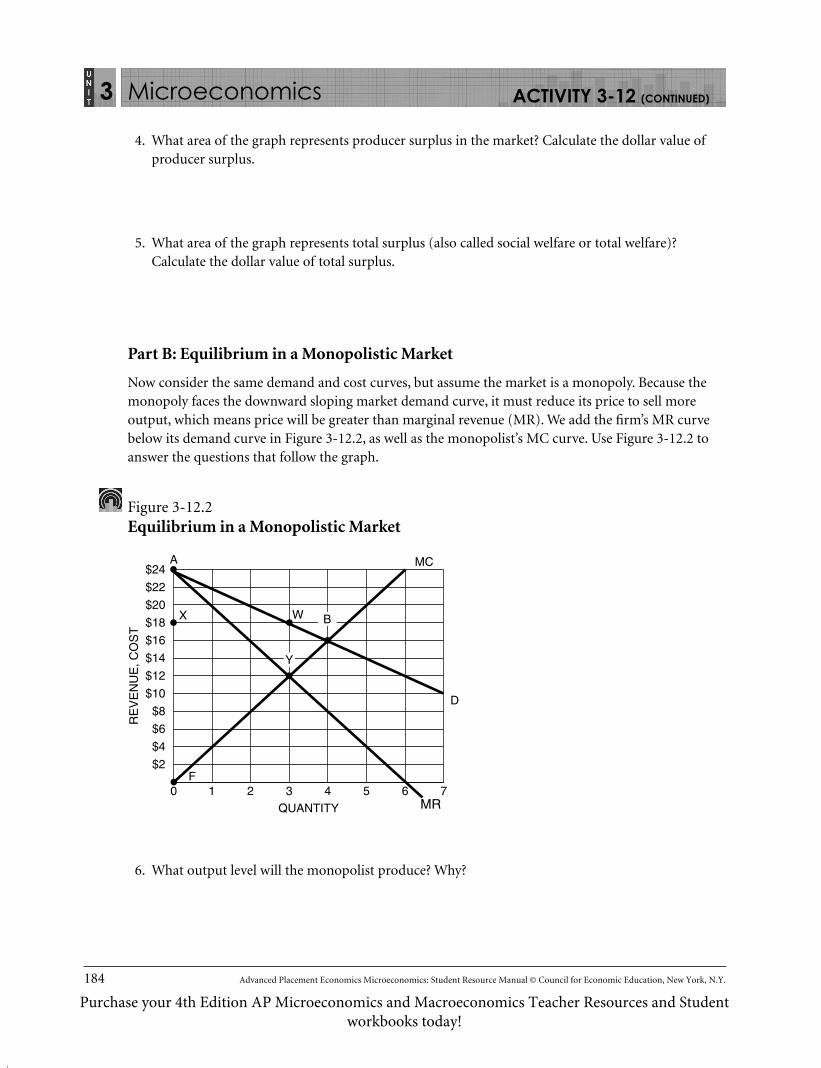
4. What area of the graph represents producer surplus in the market? Calculate the dollar value ofproducer surplus.
5. What area of the graph represents total surplus (also called social welfare or total welfare)?Calculate the dollar value of total surplus.
Part B: Equilibrium in a Monopolistic Market
Now consider the same demand and cost curves, but assume the market is a monopoly. Because the monopoly faces the downward sloping market demand curve, it must reduce its price to sell more output, which means price will be greater than marginal revenue (MR). We add the firm’s MR curve below its demand curve in Figure 3-12.2, as well as the monopolist’s MC curve. Use Figure 3-12.2 to answer the questions that follow the graph.
Figure 3-12.2 Equilibrium in a Monopolistic Market
MRQUANTITY
MC
D
RE
VE
NU
E, C
OS
T
$4
$8
$12
10 2 3 4 5 6 7
$16
$20
$24
$2
$6
$10
$14
$18
$22
A
X
F
BW
Y
6. What output level will the monopolist produce? Why?
ACTIVITY 3-12 (CONTINUED)
CEE-APE_MACROSE-12-0101-MISM-Book.indb 184 27/07/12 8:33 PM
Purchase your 4th Edition AP Microeconomics and Macroeconomics Teacher Resources and Student workbooks today!

Advanced Placement Economics Microeconomics: Student Resource Manual © Council for Economic Education, New York, N.Y. 185
3 Microeconomics
7. What price will the monopolist charge for this output? Why?
8. What area of the graph represents consumer surplus in the market? Calculate the dollar value ofconsumer surplus.
9. What area of the graph represents producer surplus? Calculate the dollar value ofproducer surplus.
10. What area of the graph represents total surplus? Calculate the dollar value of total surplus.
Part C: Comparing Equilibrium in the Two Markets
11. How do the price and output of a monopolist differ from those in the perfectlycompetitive market?
12. What is the dollar value of the portion of consumer surplus in the competitive market that istransferred to the firm’s producer surplus in the monopoly situation?
13. How does a monopoly affect consumer surplus? Is this good or bad from the perspectiveof consumers?
14. What area of Figure 3-12.2 represents the deadweight loss resulting from the market being amonopoly? Calculate the dollar value of the deadweight loss.
ACTIVITY 3-12 (CONTINUED)
CEE-APE_MACROSE-12-0101-MISM-Book.indb 185 27/07/12 8:33 PM
Purchase your 4th Edition AP Microeconomics and Macroeconomics Teacher Resources and Student workbooks today!

CEE-APE_MACROSE-12-0101-MISM-Book.indb 186 27/07/12 8:33 PM
Advanced Placement Economics Microeconomics: Student Resource Manual © Council for Economic Education, New York, N.Y. 187
3 Microeconomics
Price Discrimination
When producers have market power and sell a good or service that cannot be resold, the possibility of price discrimination arises. Price discrimination exists when a producer charges different prices to different customers for the same item, for reasons other than differences in cost. The seller needs to be able to divide the total market for the good into separate submarkets, each with a different demand for the good. There also must be no possibility of resale of the product between the submarkets; otherwise the different submarkets will collapse into a single market.
Part A: Regular Monopoly with No Price Discrimination
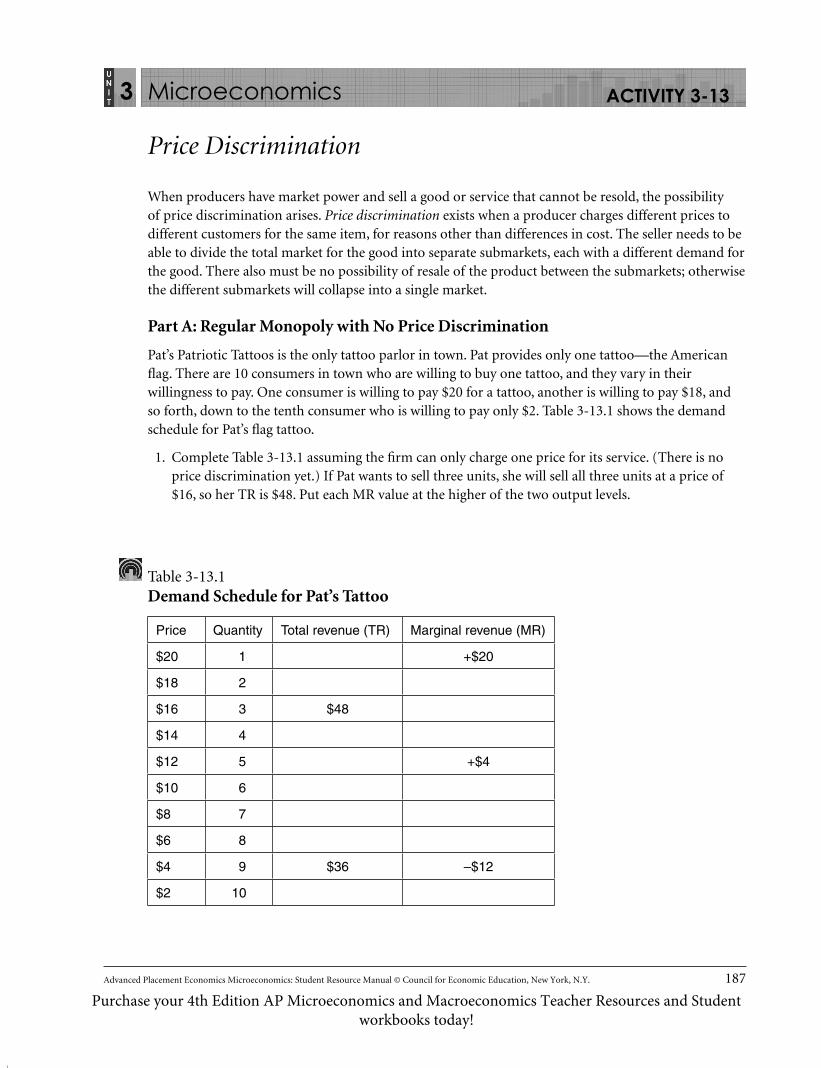
Pat’s Patriotic Tattoos is the only tattoo parlor in town. Pat provides only one tattoo—the American flag. There are 10 consumers in town who are willing to buy one tattoo, and they vary in their willingness to pay. One consumer is willing to pay $20 for a tattoo, another is willing to pay $18, and so forth, down to the tenth consumer who is willing to pay only $2. Table 3-13.1 shows the demand schedule for Pat’s flag tattoo.
1. Complete Table 3-13.1 assuming the firm can only charge one price for its service. (There is noprice discrimination yet.) If Pat wants to sell three units, she will sell all three units at a price of$16, so her TR is $48. Put each MR value at the higher of the two output levels.
Table 3-13.1 Demand Schedule for Pat’s Tattoo
Price Quantity Total revenue (TR) Marginal revenue (MR)
$20 1 +$20
$18 2
$16 3 $48
$14 4
$12 5 +$4
$10 6
$8 7
$6 8
$4 9 $36 –$12
$2 10
ACTIVITY 3-13
CEE-APE_MACROSE-12-0101-MISM-Book.indb 187 27/07/12 8:33 PM
Purchase your 4th Edition AP Microeconomics and Macroeconomics Teacher Resources and Student workbooks today!
188 Advanced Placement Economics Microeconomics: Student Resource Manual © Council for Economic Education, New York, N.Y.
3 Microeconomics
2. What is the total consumer surplus if Pat sells three units at a price of $16?
3. What is the total consumer surplus if she sells five units at a price of $12?
4. In Figure 3-13.1, draw the demand curve for Pat’s tattoos.
Figure 3-13.1 Demand for Pat’s Tattoos
QUANTITY
PR
ICE
–$14
–$10
–$6
10 2 3 4 5 6 7 8 9 10
–$2
$2
$6
$8
$10
$12
$14
$16
$18
$20
–$16
–$12
–$8
–$4
$0
$4
ACTIVITY 3-13 (CONTINUED)
CEE-APE_MACROSE-12-0101-MISM-Book.indb 188 27/07/12 8:33 PM
Purchase your 4th Edition AP Microeconomics and Macroeconomics Teacher Resources and Student workbooks today!
Advanced Placement Economics Microeconomics: Student Resource Manual © Council for Economic Education, New York, N.Y. 189
3 Microeconomics
Part B: Perfect Price Discrimination (Also Called First-Degree Price Discrimination)
Perfect price discrimination is a monopolist’s dream because it means that the firm can charge each individual consumer the highest price that he or she is willing to pay for the firm’s product. As we will see in this activity, perfect price discrimination eliminates all consumer surplus and increases the monopolist’s total profit above what it would if the firm sold all output at one price. For the questions in this section, assume that Pat’s average total cost and marginal cost are constant and equal to $8 (ATC = MC = $8).
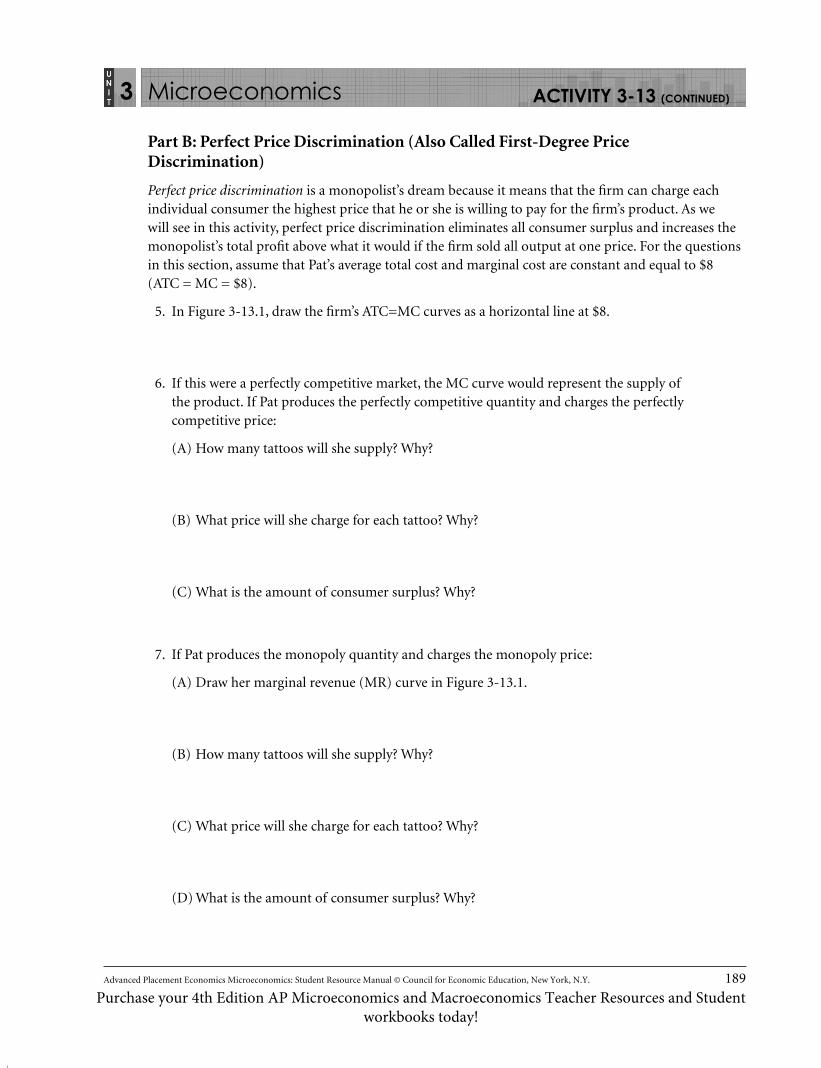
5. In Figure 3-13.1, draw the firm’s ATC=MC curves as a horizontal line at $8.
6. If this were a perfectly competitive market, the MC curve would represent the supply ofthe product. If Pat produces the perfectly competitive quantity and charges the perfectlycompetitive price:
(A) How many tattoos will she supply? Why?
(B) What price will she charge for each tattoo? Why?
(C) What is the amount of consumer surplus? Why?
7. If Pat produces the monopoly quantity and charges the monopoly price:
(A) Draw her marginal revenue (MR) curve in Figure 3-13.1.
(B) How many tattoos will she supply? Why?
(C) What price will she charge for each tattoo? Why?
(D) What is the amount of consumer surplus? Why?
ACTIVITY 3-13 (CONTINUED)
CEE-APE_MACROSE-12-0101-MISM-Book.indb 189 27/07/12 8:33 PM
Purchase your 4th Edition AP Microeconomics and Macroeconomics Teacher Resources and Student workbooks today!

190 Advanced Placement Economics Microeconomics: Student Resource Manual © Council for Economic Education, New York, N.Y.
3 Microeconomics
8. Now assume Pat knows the tastes and preferences of all consumers and the conditions necessaryfor first-degree price discrimination apply.
(A) Does the MR curve for the non-discriminating monopolist still apply? Why?
(B) How many tattoos will she supply? Why?
(C) Complete Table 3-13.2, which shows what price she will charge each individual consumer for her/his tattoo.
Table 3-13.2 Prices Charged by a Perfectly Discriminating Monopsonist
Consumer 1st 2nd 3rd 4th 5th 6th 7th 8th 9th 10th
Price
(D) What is the amount of consumer surplus?
9. In Table 3-13.3, show Pat’s total profit under each of the three market structures. Remember ourassumption that ATC = MC = $8.
Table 3-13.3 Profit in Each Market Structure
Type of market Pat’s total profit
Perfect competition
Regular monopoly
Perfect price discrimination monopoly
ACTIVITY 3-13 (CONTINUED)
CEE-APE_MACROSE-12-0101-MISM-Book.indb 190 27/07/12 8:33 PM
Purchase your 4th Edition AP Microeconomics and Macroeconomics Teacher Resources and Student workbooks today!
Advanced Placement Economics Microeconomics: Student Resource Manual © Council for Economic Education, New York, N.Y. 191
3 Microeconomics
10. How does the total profit of the perfectly discriminating monopolist compare to the consumersurplus that existed in the perfectly competitive market? [See Question 6 (C).] Why?
11. Is the total profit for a regular monopolist different from the total profit of a monopolist that isable to practice perfect price discrimination? Why?
12. Is the output the same for perfect competition and perfect price discrimination? Why?
13. Is there a deadweight loss resulting from the non-discriminating monopolist? What about fromthe monopolist with first-degree price discrimination?
14. If an orange sells in Nebraska for $1.00 and the same quality orange sells in Florida for only $0.50,is this clear evidence of price discrimination? Why?
15. What is an example of price discrimination that works in favor of students?
ACTIVITY 3-13 (CONTINUED)
CEE-APE_MACROSE-12-0101-MISM-Book.indb 191 27/07/12 8:33 PM
Purchase your 4th Edition AP Microeconomics and Macroeconomics Teacher Resources and Student workbooks today!

CEE-APE_MACROSE-12-0101-MISM-Book.indb 192 27/07/12 8:33 PM
Advanced Placement Economics Microeconomics: Student Resource Manual © Council for Economic Education, New York, N.Y. 193
3 Microeconomics
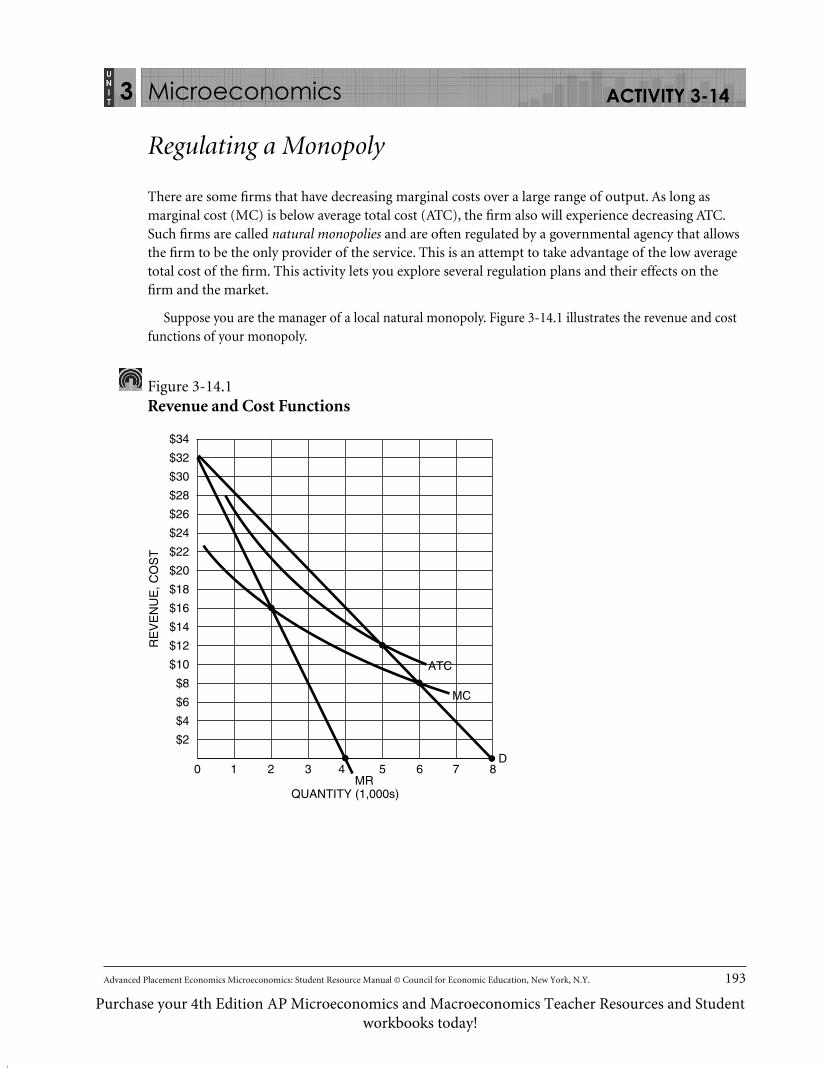
Regulating a Monopoly
There are some firms that have decreasing marginal costs over a large range of output. As long as marginal cost (MC) is below average total cost (ATC), the firm also will experience decreasing ATC. Such firms are called natural monopolies and are often regulated by a governmental agency that allows the firm to be the only provider of the service. This is an attempt to take advantage of the low average total cost of the firm. This activity lets you explore several regulation plans and their effects on the firm and the market.
Suppose you are the manager of a local natural monopoly. Figure 3-14.1 illustrates the revenue and cost functions of your monopoly.
Figure 3-14.1 Revenue and Cost Functions
QUANTITY (1,000s)MR
ATC
MC
D
RE
VE
NU
E, C
OS
T
$4
$8
$12
10 2 3 4 5 6 7 8
$16
$20
$24
$26
$28
$30
$32
$34
$2
$6
$10
$14
$18
$22
ACTIVITY 3-14
CEE-APE_MACROSE-12-0101-MISM-Book.indb 193 27/07/12 8:33 PM
Purchase your 4th Edition AP Microeconomics and Macroeconomics Teacher Resources and Student workbooks today!
194 Advanced Placement Economics Microeconomics: Student Resource Manual © Council for Economic Education, New York, N.Y.
3 Microeconomics
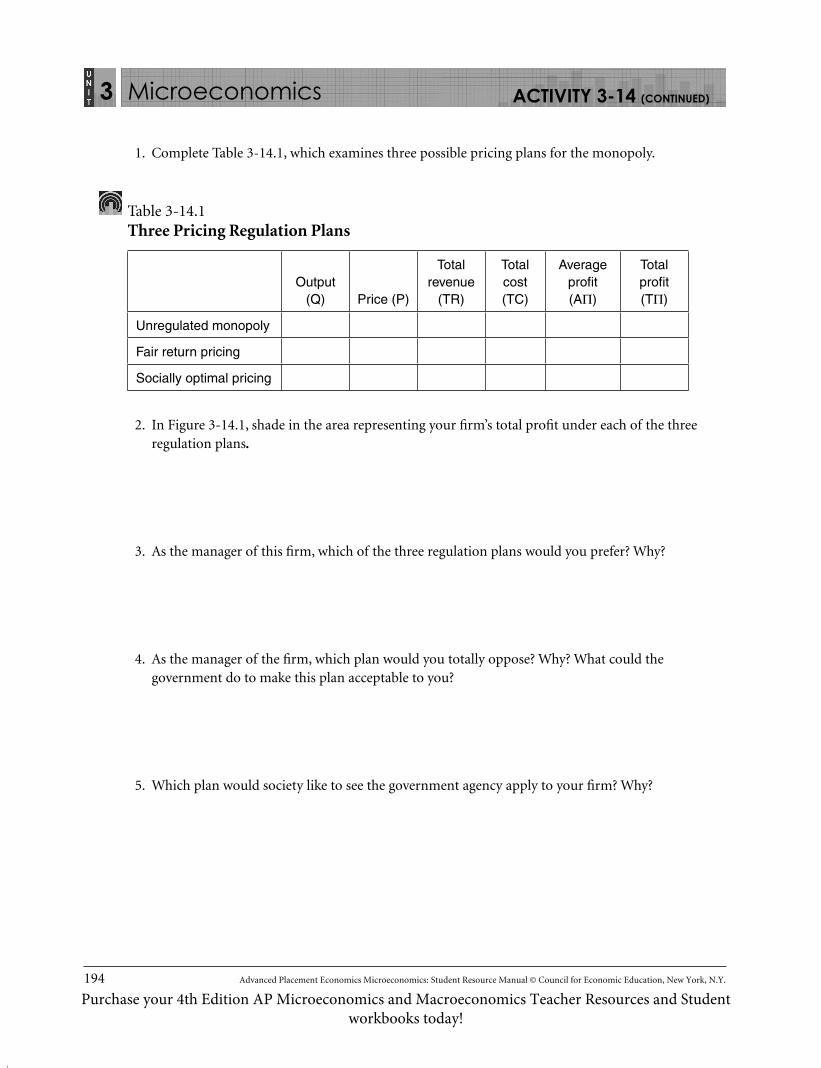
1. Complete Table 3-14.1, which examines three possible pricing plans for the monopoly.
Table 3-14.1 Three Pricing Regulation Plans
Output (Q) Price (P)
Total revenue
(TR)
Total cost (TC)
Average profit (AΠ)
Total profit (TΠ)
Unregulated monopoly
Fair return pricing
Socially optimal pricing
2. In Figure 3-14.1, shade in the area representing your firm’s total profit under each of the threeregulation plans.
3. As the manager of this firm, which of the three regulation plans would you prefer? Why?
4. As the manager of the firm, which plan would you totally oppose? Why? What could thegovernment do to make this plan acceptable to you?
5. Which plan would society like to see the government agency apply to your firm? Why?
ACTIVITY 3-14 (CONTINUED)
CEE-APE_MACROSE-12-0101-MISM-Book.indb 194 27/07/12 8:33 PM
Purchase your 4th Edition AP Microeconomics and Macroeconomics Teacher Resources and Student workbooks today!

Advanced Placement Economics Microeconomics: Student Resource Manual © Council for Economic Education, New York, N.Y. 195
3 Microeconomics
6. Under the fair return pricing plan, does your firm earn an economic profit? Does it earn a normalprofit?
7. Each of the three plans has its own rule for deciding how many units of output your firm willprovide. State those rules.
ACTIVITY 3-14 (CONTINUED)
CEE-APE_MACROSE-12-0101-MISM-Book.indb 195 27/07/12 8:33 PM
Purchase your 4th Edition AP Microeconomics and Macroeconomics Teacher Resources and Student workbooks today!

CEE-APE_MACROSE-12-0101-MISM-Book.indb 196 27/07/12 8:33 PM
Advanced Placement Economics Microeconomics: Student Resource Manual © Council for Economic Education, New York, N.Y. 197
3 Microeconomics
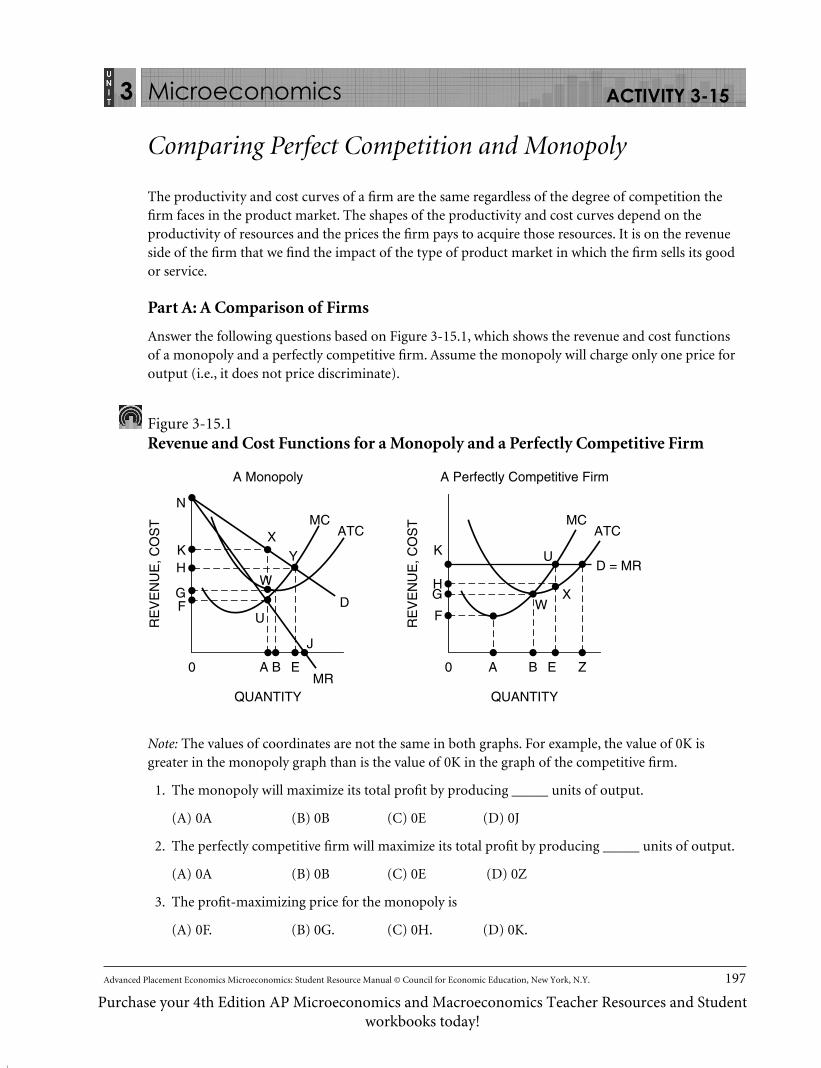
Comparing Perfect Competition and Monopoly
The productivity and cost curves of a firm are the same regardless of the degree of competition the firm faces in the product market. The shapes of the productivity and cost curves depend on the productivity of resources and the prices the firm pays to acquire those resources. It is on the revenue side of the firm that we find the impact of the type of product market in which the firm sells its good or service.
Part A: A Comparison of Firms
Answer the following questions based on Figure 3-15.1, which shows the revenue and cost functions of a monopoly and a perfectly competitive firm. Assume the monopoly will charge only one price for output (i.e., it does not price discriminate).
Figure 3-15.1 Revenue and Cost Functions for a Monopoly and a Perfectly Competitive Firm
0
FG
HK
RE
VE
NU
E, C
OS
T
N
A B EMR
J
D
D = MRW
U
YX
MC MCATC
A Monopoly
QUANTITY
0
F
GH
K
RE
VE
NU
E, C
OS
T
A B E Z
XW
U
ATC
A Perfectly Competitive Firm
QUANTITY
Note: The values of coordinates are not the same in both graphs. For example, the value of 0K is greater in the monopoly graph than is the value of 0K in the graph of the competitive firm.
1. The monopoly will maximize its total profit by producing _____ units of output.
(A) 0A (B) 0B (C) 0E (D) 0J
2. The perfectly competitive firm will maximize its total profit by producing _____ units of output.
(A) 0A (B) 0B (C) 0E (D) 0Z
3. The profit-maximizing price for the monopoly is
(A) 0F. (B) 0G. (C) 0H. (D) 0K.
ACTIVITY 3-15
CEE-APE_MACROSE-12-0101-MISM-Book.indb 197 27/07/12 8:33 PM
Purchase your 4th Edition AP Microeconomics and Macroeconomics Teacher Resources and Student workbooks today!

198 Advanced Placement Economics Microeconomics: Student Resource Manual © Council for Economic Education, New York, N.Y.
3 Microeconomics
4. The profit-maximizing price for the perfectly competitive firm is
(A) 0F. (B) 0G. (C) 0H. (D) 0K.
5. The maximum total profit of the monopoly is shown by the coordinates
(A) AX. (B) UX. (C) GWXK. (D) 0AXK.
6. The maximum total profit of the perfectly competitive firm is shown by the coordinates
(A) EU. (B) UX. (C) 0EUK. (D) HXUK.
7. The maximum average profit of the perfectly competitive firm is at output
(A) 0A. (B) 0B. (C) 0E. (D) 0Z.
8. The marginal profit of the monopoly is $0 at output
(A) 0A. (B) 0B. (C) 0E. (D) 0J.
9. The marginal profit of the perfectly competitive firm is $0 at output
(A) 0A. (B) 0B. (C) 0E. (D) 0Z.
10. The marginal profit of the perfectly competitive firm is maximized at output
(A) 0A. (B) 0B. (C) 0E. (D) 0Z.
11. At output 0A, the total cost of the monopoly is shown by the coordinates
(A) AU. (B) AW. (C) 0AUF. (D) 0AWG.
12. The monopolist will maximize its total revenue at output
(A) 0A. (B) 0B. (C) 0E. (D) 0J.
13. What price will the perfectly competitive firm charge when it is in long-run equilibrium?
(A) 0F (B) 0G (C) 0H (D) 0K
14. What area represents consumer surplus when the monopoly maximizes its total profit?
(A) KXN (B) 0AXN (C) GWXN (D) HYN
15. The profit-maximizing output of the monopoly is _______ the output society would like the firmto produce.
(A) greater than (B) equal to (C) less than
16. The profit-maximizing output of the perfectly competitive firm is _______ the output societywould like the firm to produce.
(A) greater than (B) equal to (C) less than
17. Is the perfectly competitive firm in a position of long-run equilibrium?
(A) Yes (B) No (C) We need more information.
ACTIVITY 3-15 (CONTINUED)
CEE-APE_MACROSE-12-0101-MISM-Book.indb 198 27/07/12 8:33 PM
Purchase your 4th Edition AP Microeconomics and Macroeconomics Teacher Resources and Student workbooks today!
Advanced Placement Economics Microeconomics: Student Resource Manual © Council for Economic Education, New York, N.Y. 199
3 Microeconomics
18. Which firm will operate at the minimum point of its ATC curve in long-run equilibrium?
(A) Only the perfectly competitive firm
(B) Only the monopolistic firm
(C) Both firms
(D) Neither firm
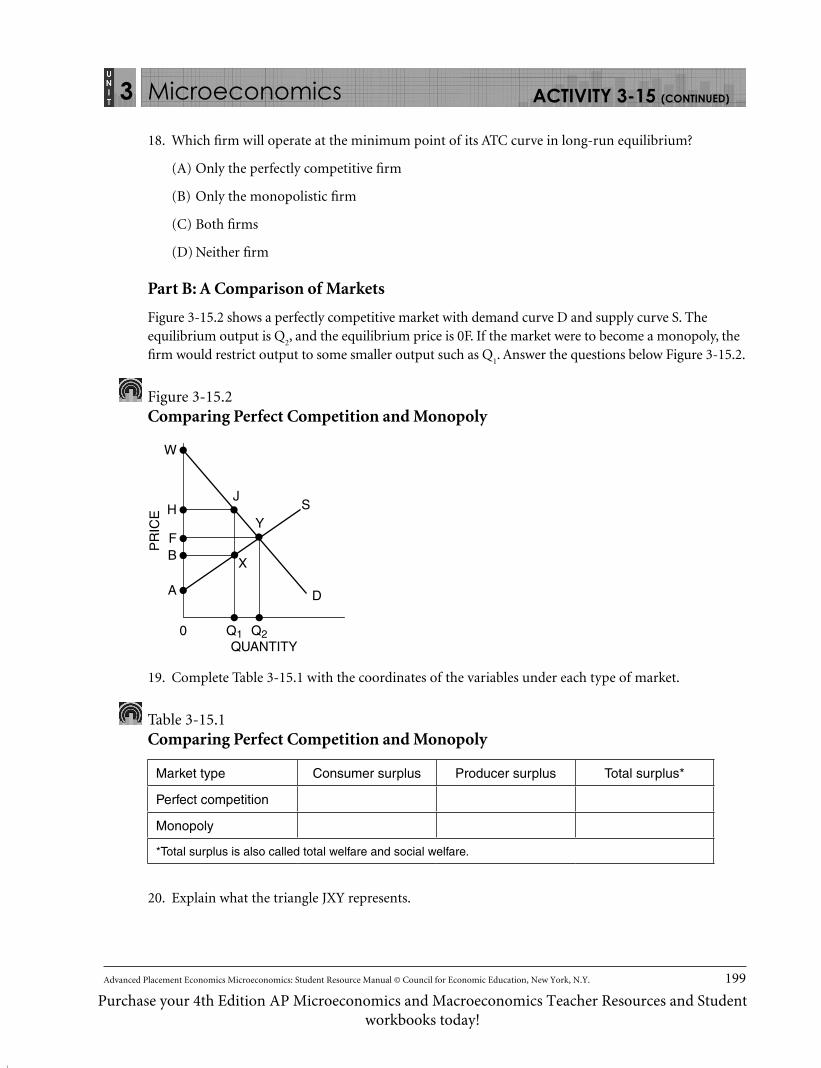
Part B: A Comparison of Markets
Figure 3-15.2 shows a perfectly competitive market with demand curve D and supply curve S. The equilibrium output is Q
2, and the equilibrium price is 0F. If the market were to become a monopoly, the
firm would restrict output to some smaller output such as Q1. Answer the questions below Figure 3-15.2.
Figure 3-15.2 Comparing Perfect Competition and Monopoly
Q10
X
J
YS
DA
BF
H
PR
ICE
QUANTITY
W
Q2
19. Complete Table 3-15.1 with the coordinates of the variables under each type of market.
Table 3-15.1 Comparing Perfect Competition and Monopoly
Market type Consumer surplus Producer surplus Total surplus*
Perfect competition
Monopoly
*Total surplus is also called total welfare and social welfare.
20. Explain what the triangle JXY represents.
ACTIVITY 3-15 (CONTINUED)
CEE-APE_MACROSE-12-0101-MISM-Book.indb 199 27/07/12 8:33 PM
Purchase your 4th Edition AP Microeconomics and Macroeconomics Teacher Resources and Student workbooks today!