the retail labour market - flinders university - adelaide ... · the retail labour market report by...
TRANSCRIPT
The Retail
Labour Market
Report by
National Institute of Labour StudiesProfessor Sue Richardson
for
Coles Myer Ltd
August 2003

Contents
Executive Summary................................................................................................................1
1. Introduction.......................................................................................................................6
2. Overview of Retail Employment....................................................................................7
3. Do Supermarkets Reduce Retail Employment?....................................................14
4. Productivity in the Retail Industry...............................................................................18
5. The Structure of the Retail Industry...........................................................................22
5.1 A Detailed Snapshot of the Retail Industry....................................................22
5.2 Changes over Time: Hours...............................................................................24
5.3 Changes over Time: Turnover...........................................................................24
5.4 Changes over Time: Size of Business............................................................28
6. Employment in the Retail Industry.............................................................................33
6.1 Total Employment................................................................................................34
6.2 Sectors within Retail Employment...................................................................35
6.3 Female and Male Employment.........................................................................36
6.3 Hours Worked......................................................................................................42
7. Earnings.........................................................................................................................44
References...........................................................................................................................49
List of Tables
Table 1: Characteristics of the Retail Labour Force, and a Comparisonwith the Total Australian Labour Force, February 2003 12
Table 2: Employment, and Wages as a Share of Business Activity, byType of Food Retail Business 17
Table 3: Output, Labour Input and Productivity in the Retail Sector, 1974-75 to 1998-99 (average annual rates of growth, per cent per year) 20
Table 4: Characteristics of Components of the Retail Industry, 1998-99 23
Table 5: Retail Group Share in Total Retail Turnover, 1982 and 2003
(per cent). .....................................................................................................27
Table 6: Numbers of People Employed in Retailing, 1984,1996and 2003 .......................................................................................................37
Figures and Diagrams
Diagram 1(b): Structure of All Businesses and Large Businesses,Australia and Retail, 2000-01 11
Figure 1: Retail Indexes of Output, Hours Worked and LabourProductivity, 1984-85 to 1998-99 (Index 1984-5 = 100) 21
Figure 2: Total Retail Turnover Adjusted for CPI, $m 26
Figure 3: Retail Turnover Trend Estimates, by Industry Group1982-2001 26
Figure 4: Food Retail Turnover 1982-2001 Adjusted for CPI 27
Figure 5a: Number of Retail Businesses by Employer Size Group,1983-84, 1988-2000 30
Figure 5b: Number of Retail Businesses by Employer Size Group,1983-84m, 1988-2000 (reported as deviations from thestarting value) 30
Figure 6: Employment in Small Retail Businesses as a Proportionof All Employment in Retail Trade, 1983-84, 1988-2000 31
Figure 7: Employment in Small Retail Businesses as a Proportionof All Employment in Retail Trade, 1983-84, 1988-2000 31
Figure 8: Non-employing Retail Businesses as a Proportion of AllRetail Businesses, 1983-84, 1988-2000 33
Figure 9: Number of People Employed in Australian Businesses,1983-84m, 1988-2000 (reported as deviations from thestarting value) 35
Figure 10: Number of Male and Female Employees in the RetailIndustry 1985-2001 38
Figure 11(a): Number of Employers in the Retail Industry 1985-2001 39
Figure 11(b): Male and Female Own-Account Workers in the RetailIndustry 1985-2001 40
Figure 12: Number of Persons Employed Full-time and Part-timein the Retail Industry as a Proportion of People EmployedFull-time and Part-time in All Industries, 1985-2001 41
Figure 13: Hours Worked in the Retail Industry and a Proportion ofHours Worked in All Industries, 1985-2001 43
Figure 14: Real Average Weekly Earnings in Retail, 1984-2001,1989-90 = 100 45
Figure 15: Real Average Weekly Earnings, Full-time Adults in Retail,1984-2001, Base 1989-90 = 100 46
Figure 16: Average Weekly Earnings for All Persons Employedin the Retail Industry as a Proportion of the AverageWeekly Earnings for All Persons Employed in AllIndustries, 1984-2001 48
Figure 17: Average Full-time Weekly Earnings for Persons Employedin the Retail Industry as a Proportion of the AverageFull-time Weekly Earnings for All Persons Employedin All Industries, 1984-2001 48

Executive Summary
Retailing is a major economic activity and employs more people than any other
Australian industry. This report describes the character of employment in the retail
industry, how it compares with employment in other industries, how it has changed
over time, and how it differs between large and small retailers. This information is
placed in the context of developments in the economy as a whole. Changes in the
characteristics of employment over time are related to changes in the structure of the
retail industry. Part of the examination includes a direct look at the question of
whether growth in market share by the large retailers is detrimental to employment in
the retail industry.
In May 2003, retailing comprised about 5 per cent of the Australian GDP (compared
with 3% for agriculture) and employed 1.5 million people, or 15 per cent of all
employment. Like the rest of the economy, the retail industry has the characteristic
that most firms are small yet half of the workforce work in large firms. The handful of
large businesses accounted for 41 per cent of income. Retail symbolizes much of the
change that has been occurring in the Australian workplace over the past 25 years,
with a relatively small proportion of employees being full-time males and many
working on part-time and casual terms. More than half of retail workers are employed
part-time, two-thirds of whom are female. The workforce is also remarkably young,
which will pose a challenge for the industry as the cohort of young workers shrinks in
size over the coming decades.
The distinctive features of retail employment
The character of employment in retail is quite different from employment in the rest
of the economy. This is especially so if the sale and service of motor vehicles is
excluded: car retailing has a relatively masculine, full-time and higher paid workforce.
Compared with all employment, employment in retail has:

v a much higher proportion of part-time workers, and a higher proportion of women;
v a higher than expected number of employers, especially female employers;
v a very young workforce: half of employees aged 15-19 work in retail but only 11
per cent of those aged over 54;
v an occupational structure that is quite different from the workforce as a whole,
with few managers and administrators and two thirds of all people employed in
elementary clerical, sales and service jobs;
v a disproportionate number of people working part-time, including almost one third
of all people who work fewer than 16 hours per week;
v relatively low wages;
v a relatively low level of formal education among employees.
Does supermarket growth reduce employment?
We examine the question of whether an expansion of supermarkets at the expense of
smaller stores would reduce total retail employment. To do this, it is necessary to
compare supermarket employment with other areas of retail that are similar to
supermarkets in the service and products they provide, but differ in size. We find that
the employment per unit of sales and per unit of production is at least as high in the
large supermarkets/grocery stores as it is in the small greengrocers and liquor stores.
While the evidence is not conclusive, it provides no support for the view that the
transfer of business from the small stores to the large supermarkets would decrease
total employment or labour earnings.
Changes in retail over time
Over the 24 year period from 1974-5 to 1998-9, multifactor productivity in the retail
sector is estimated to have risen at an average rate of 0.3 per cent per annum. The
comparable figure for the whole market sector of the economy is 0.9. Multifactor
productivity in the retail sector is estimated to have fallen over the decade 1984-94,
then turned around to rise at a rate of 1.3 per cent for the remainder of the 1990s.
Labour inputs, which are measured as the number of hours worked, have grown over
the whole period, but at different rates. Growth was especially fast in the period
1984-5 to 1991-2 and continued to be quite strong for the rest of the 1990s. Labour
productivity, however, fell in the middle period, while growing strongly at the
beginning and end of the period.
There is considerable diversity within the retail sector in growth, productivity and
employment changes over time.
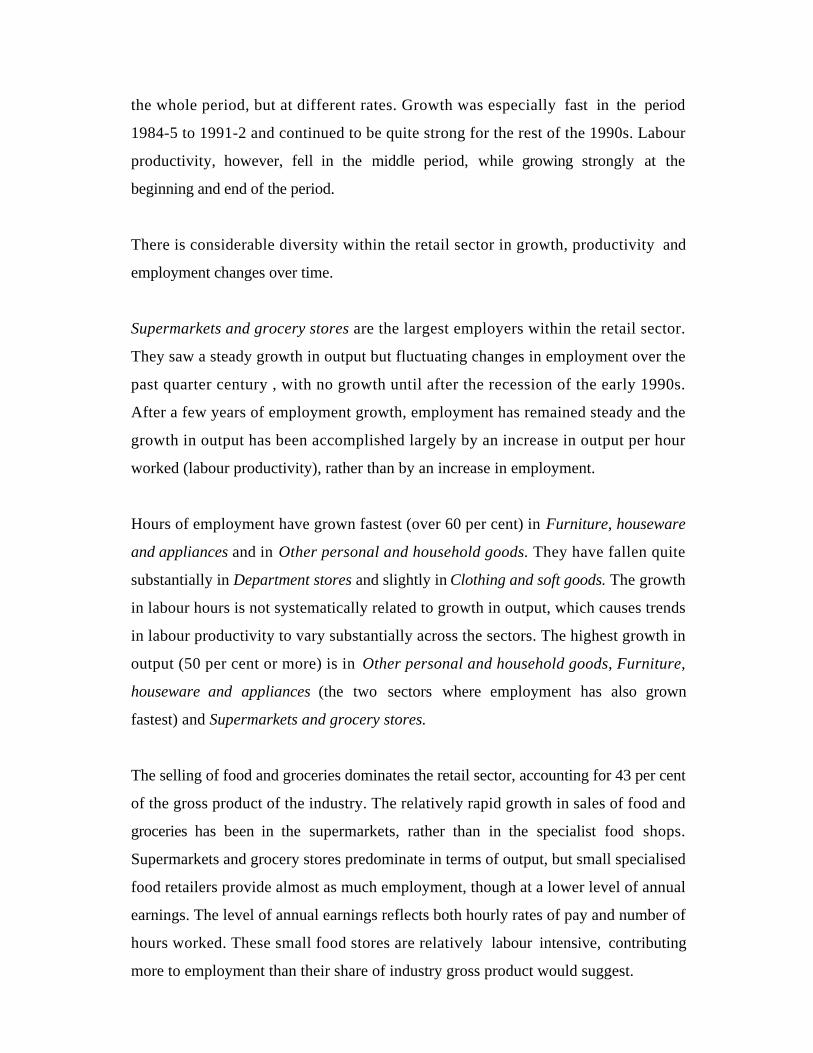
Supermarkets and grocery stores are the largest employers within the retail sector.
They saw a steady growth in output but fluctuating changes in employment over the
past quarter century , with no growth until after the recession of the early 1990s.
After a few years of employment growth, employment has remained steady and the
growth in output has been accomplished largely by an increase in output per hour
worked (labour productivity), rather than by an increase in employment.
Hours of employment have grown fastest (over 60 per cent) in Furniture, houseware
and appliances and in Other personal and household goods. They have fallen quite
substantially in Department stores and slightly in Clothing and soft goods. The growth
in labour hours is not systematically related to growth in output, which causes trends
in labour productivity to vary substantially across the sectors. The highest growth in
output (50 per cent or more) is in Other personal and household goods, Furniture,
houseware and appliances (the two sectors where employment has also grown
fastest) and Supermarkets and grocery stores.
The selling of food and groceries dominates the retail sector, accounting for 43 per cent
of the gross product of the industry. The relatively rapid growth in sales of food and
groceries has been in the supermarkets, rather than in the specialist food shops.
Supermarkets and grocery stores predominate in terms of output, but small specialised
food retailers provide almost as much employment, though at a lower level of annual
earnings. The level of annual earnings reflects both hourly rates of pay and number of
hours worked. These small food stores are relatively labour intensive, contributing
more to employment than their share of industry gross product would suggest.

As is shown in more detail in the report, the major changes over the past 18 years in
retail employment are:
v Total employment in retailing grew faster than in the economy as a whole, but a
little slower than employment in the private business sector;
v There has been a sizeable fall in the proportion of retail employment that is in
small (less than 20 workers) businesses;
v Self-employment in retail has fallen from 22 per cent to 14 per cent of all retail
employment with most of the fall occurring in the last decade;
v Part-time employment grew much faster than full-time employment (147%
compared with 27%);
v Employment in Food Retailing grew relatively fast (78%) ;
v The growth in part-time employment was especially strong (181%), and in full-
time employment especially weak (13%), in Food Retailing.
v By 2003, there were almost as many people employed in Food Retailing as in
Personal and Household Goods.
v Food Retailing has a high and rising ratio of part-time to full-time staff (1.6
compared with 0.8 for Personal and Household Goods in 2003).
Female retail employment in general has not fared well over the past 15 years. The
absolute number of women employed full-time has not grown, remaining at about
250,000. The number employed part-time has grown steadily from 225,000 to
425,000 but this has just matched the general growth in part-time employment for
women. The combination of a falling share of women’s full-time employment
accounted for by retail (from 14.5 per cent to 11.8 per cent), and a constant share of
women’s part-time employment means that the retail share of all hours worked by
women has fallen since 1985.
While total hours worked by women in retail have been growing a little faster than
total hours worked by men, the hours growth for women has not matched that
occurring in other parts of the economy. Thus there are two trends. Within the retail
sector, the share of total hours worked by women has been rising. But for the

economy as a whole, the share of total hours worked in the retail sector, and especially
the share of women’s total hours worked in the retail sector, has been falling.
It is clear that over the past 15 or so years in retail there has been a trend towards
larger businesses and away from small and owner-operated businesses. While the
absolute number of small businesses has not fallen, their share of all businesses has.
Employment in small businesses has fallen substantially as a share of all retail
employment, to just under half, and this trend has been underway for the whole
period since the mid 1980s. Own account workers have also fallen substantially as a
proportion of all retail workers. But the fall in self-employment has been quite recent,
the downturn starting in the mid-1990s. It is not yet clear that this is part of a long-
term trend.
Retail employment is not well paid. The average adult full-time retail worker earns
about three-quarters of the amount earned by the average Australian adult full-time
worker. One reason for the relatively low pay is the high ratio of low paying
occupations, such as sales, to high paying occupations, such as professional and
managerial, in the retail sector. Relative pay for full-time women retail workers is
higher than it is for men and has fluctuated less. As for men, however, it has fallen
somewhat since the mid-1980s.
In brief, the composition of employment in the retail sector has been changing. The
self-employed are diminishing as a component of total retail employment and
becoming more masculine; employees are becoming more feminine; there has been a
rapid expansion of the role of part-time staff and increasingly people are employed by
large rather than small businesses.

1. Introduction1
Retailing is a major economic activity and a major employer. In May 2003, it
comprised about 5 per cent of the Australian GDP (compared with 3% for agriculture)
and employed 1.49 million people, or 15.6 per cent of all employment2. Indeed, it is
the biggest employer of all industries in Australia. Its output (ie, value added) rose in
real terms at 2.7 per cent per annum between 1984-5 and 1998-9, to $31.1 billion.3 It
has a structure much like that of the rest of the private sector, with small businesses
(employing fewer than 20 people) comprising 97 per cent of all businesses but only
38 per cent of total income. The fewer than one per cent of large businesses which
employ 200 people or more accounted for 41 per cent of income. It symbolizes much
of the change that has been occurring in the Australian workplace over the past 25
years, with a relatively small proportion of employees being full-time males and many
working on part-time and casual terms. More than half of retail workers are employed
part-time, two-thirds of whom are female. How retail employment is changing, and
whether it represents an exemplar of the future of work in general is a question of great
social interest.
The past 25 years has seen a large withdrawal of men from the labour force and a large
growth in the employment of married women. It has also seen a substantial
substitution of part-time and casual jobs for full-time and continuing jobs. These
changes have important implications for the way that families work, whether they are
formed at all and their capacity to provide secure and adequate incomes from working.
Employment in retailing has given many people their first work experience. It has been
less good at providing stable employment with reasonably predictable weekly earnings
and some prospects for career progression.
1 Members of the NILS team, particularly Lauren Miller Lewis and Skye Jacobi, have made substantialcontributions to this report.2 ABS Labour Force, catalogue number 6291.0.55.001, Table 4.3 Value added is the value of sales minus the value of purchased inputs: it is the same as wages andsalaries, plus depreciation, interest and profits. The source for these data is the ABS NationalAccounts. Note that ‘retail’ as defined by the ABS excludes the provision of services that are solddirect to consumers, such as hairdressing, real estate sales, house cleaning and trades. See Merrilees andMiller, 1996.
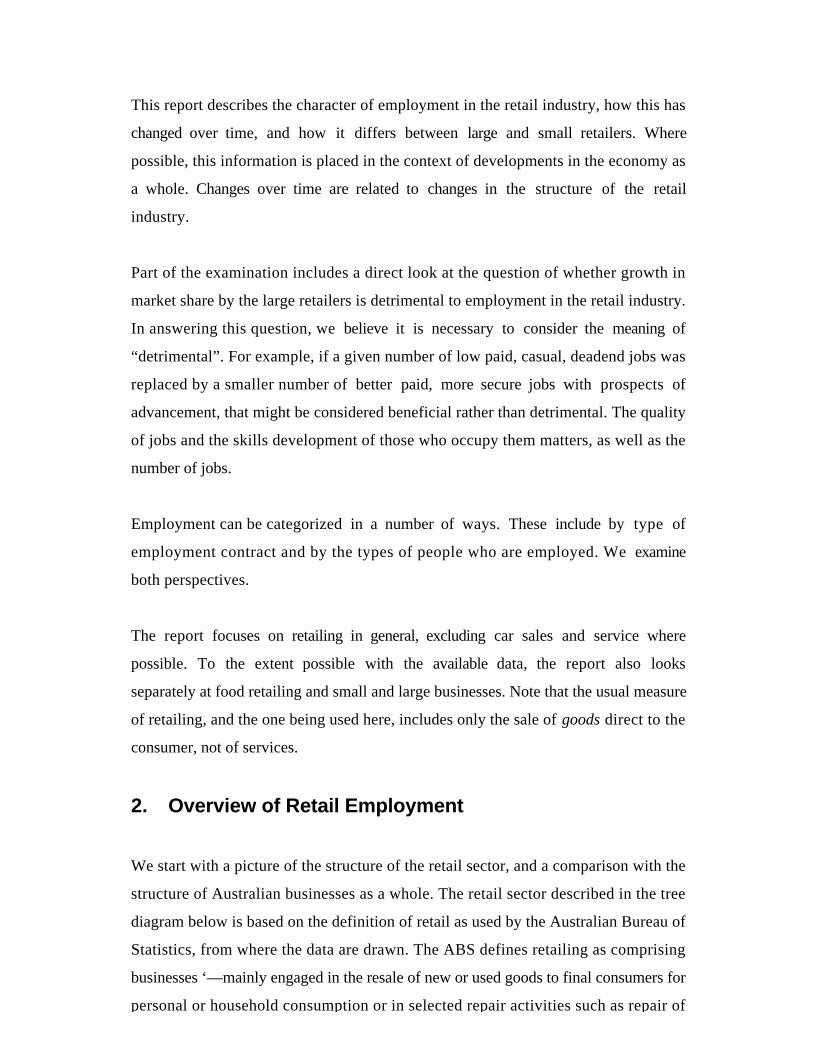
This report describes the character of employment in the retail industry, how this has
changed over time, and how it differs between large and small retailers. Where
possible, this information is placed in the context of developments in the economy as
a whole. Changes over time are related to changes in the structure of the retail
industry.
Part of the examination includes a direct look at the question of whether growth in
market share by the large retailers is detrimental to employment in the retail industry.
In answering this question, we believe it is necessary to consider the meaning of
“detrimental”. For example, if a given number of low paid, casual, deadend jobs was
replaced by a smaller number of better paid, more secure jobs with prospects of
advancement, that might be considered beneficial rather than detrimental. The quality
of jobs and the skills development of those who occupy them matters, as well as the
number of jobs.
Employment can be categorized in a number of ways. These include by type of
employment contract and by the types of people who are employed. We examine
both perspectives.
The report focuses on retailing in general, excluding car sales and service where
possible. To the extent possible with the available data, the report also looks
separately at food retailing and small and large businesses. Note that the usual measure
of retailing, and the one being used here, includes only the sale of goods direct to the
consumer, not of services.
2. Overview of Retail Employment
We start with a picture of the structure of the retail sector, and a comparison with the
structure of Australian businesses as a whole. The retail sector described in the tree
diagram below is based on the definition of retail as used by the Australian Bureau of
Statistics, from where the data are drawn. The ABS defines retailing as comprising
businesses ‘—mainly engaged in the resale of new or used goods to final consumers for
personal or household consumption or in selected repair activities such as repair of

household equipment or motor vehicles.’ (ABS, 1993:157) The data include motor
vehicles sales and service, which constitute about 20 per cent of total retailing.
The structure of businesses and of employment in the Australian economy is set out
in the tree diagram, Diagram 1 below. Comparable data for the retail industry are
included in each box, in italics. The percentage that retail represents of the relevant
category is provided in parentheses. Thus, in 2000-01 there were 168,700 retail
businesses, employing 1,216,200 people. These represent 13.2 per cent and 14.2 per
cent (respectively) of all businesses and of all employment4. Diagram 1 (a) gives
additional data on small business, while Diagram 1 (b) focuses on large businesses.
Further down Diagram 1 (a) we see that there were 93,000 private sector non-
agricultural small retail businesses that employed staff, in which 501,100 people were
employed. This represented 17.2 per cent of such small employing businesses and
19.7 per cent of people employed in such small employing businesses.
We can learn a number of things from this diagram. The retail sector, at 14 per cent of
total employment, is a big employer. The average size of retail businesses (in terms of
employment) is similar to that for all businesses. This is indicated by the fact that the
share of retail in the number of businesses (13.2%) is almost the same as its share in
the number of persons employed (14.2%). Because all retail firms are in the private
sector, and none are in agriculture, forestry or fishing, then retail is a larger share of
non-agricultural private businesses (14.5%) and employment (17.6%). It does not
have an unusually large proportion of small businesses, since its share of non-
agricultural small businesses (14.5%) is the same as its share of all non-agricultural
businesses (14.5%). It has a somewhat lower than average number of non-employing
businesses and a larger number of small employing businesses. Among the small
employing businesses, it has a much higher proportion than other industries of people
who are working in their own business (23.6% of all such people) rather than working
as employees.

The picture for large businesses mirrors that of small retail businesses. Large retail
businesses are 14 per cent of all non-agricultural private sector large businesses—the
same share as small retail businesses. Like small businesses, their share of employment
exceeds their share of businesses. This implies that on average each large retail
business employs more people than the typical large business.
We next present a much more detailed look at the characteristics of the retail labour
force, and compare these with the national picture. When reading the right hand
column of the table below, it is helpful in most instances to keep in mind that 15 per
cent of all employed people were employed in retail, in 2003. Then we can see, for
example, that slightly over one third were employed in food retailing, and that retailing
employed much more than its share of workers aged 15-19 (50% of such workers,
compared with 15% of workers overall).
4 This is the latest date for which data in this form can be obtained. The difference between theseestimates of the size of retail and those given earlier are accounted for by minor differences in datasource and definition as used by the ABS.

Diagram 1 (a):Structure of Australian Business and the Retail Sector, 2000-01
Notes: (a) Generally, the number of businesses (management units) and persons employed have been obtained by averaging the estimates for the middle
months of each quarter for the 2000–2001 financial year. (b) Includes ANZSIC Subdivisions 01 – Agriculture, 02 – Services to Agriculture; Hunting
and Trapping, 03 – Forestry and Logging and 04 – Commercial fishing. (c) Estimates are based on data from two different sources; ANZSIC
Subdivision 01 data are drawn from the 1999–2000 Agricultural Finance survey, while ANZSIC Subdivisions 02, 03 and 04 estimates are drawn from
the 1999–2000 Economic Activity Survey. Excludes management units in ANZSIC Subdivision with an estimated annual value of agricultural
operations (EVAO) of less than $22,500. Employment estimates exclude unpaid family helpers. (d) Agricultural small businesses include those
management units coded to ANZSIC Subdivision 01 with an EVAO of more than $22,500 but less than $400,000, and those management units
coded to ANZSIC Subdivisions 02, 03 and 04 which employ less than 20 persons. (e) Small business (except in agriculture) are defined as those
management units which employ less than 20 persons.
Source: Australian Bureau of Statistics (ABS) (2001), Small Business in Australia, Cat. no, 1321.0 p.6, 12.
PRIVATE SECTORSMALL BUSINESSES
PRIVATE SECTOR
Total public and private sector1,281,700 businessesRetail 168,700 (13,2%)
8,564,500 persons employedRetail 1,216,200 (14.2%)
Agriculture, forestry and fishing(b)112,100 businesses (c)
Retail 0
355,000 persons employed(c)
Non-agricultural sector1,164,100 businesses
Retail 168, 700 (14.5%)
6,901,900 persons employedRetail 1,216,200 (17.6%)
Public trading and Generalgovernment organisations
5,500 organisationsRetail 0
1,307,600 persons employed
PUBLIC SECTOR
ALL BUSINESSES (a)
Agriculture, forestry andfishing(d)
111,200 businessesRetail 0
304,000 persons employed
Non-agricultural small businesses(e)1,122,000 businesses
Retail 162,800 (14.5%)
3,259,100 persons employedRetail 595,900 (18.3%)
Non-employing businesses582,100 businesses
Retail 69,800 (12.0%)
713,200 own account workersRetail 94,800 (13.3%)
Employing businesses539,900 businesses
Retail 93,000 (17.2%)
2,545,900 persons employedRetail 501,100 (19.7%)
Employers276,500 persons employed
in their own business
Retail65,200 (23.6%)
Employees(wage & salary earners)
2,269,400 persons employed
Retail435,900 (19.2%)
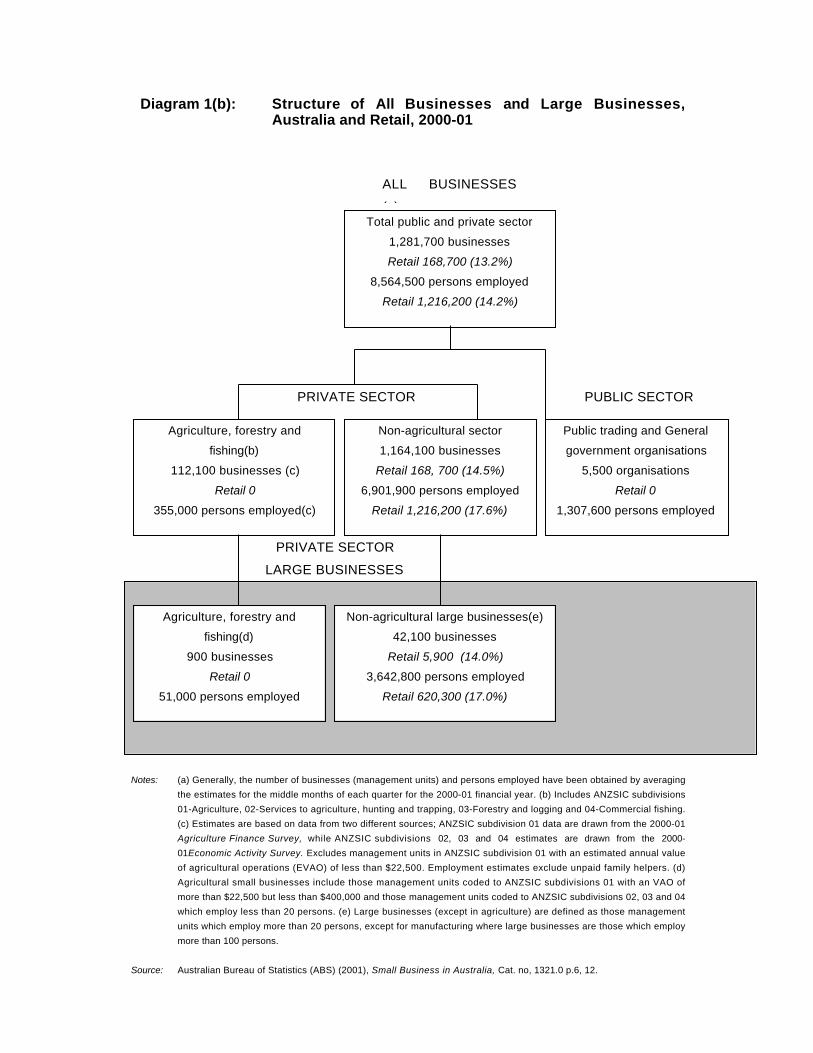
Diagram 1(b): Structure of All Businesses and Large Businesses,Australia and Retail, 2000-01
Notes: (a) Generally, the number of businesses (management units) and persons employed have been obtained by averaging
the estimates for the middle months of each quarter for the 2000-01 financial year. (b) Includes ANZSIC subdivisions
01-Agriculture, 02-Services to agriculture, hunting and trapping, 03-Forestry and logging and 04-Commercial fishing.
(c) Estimates are based on data from two different sources; ANZSIC subdivision 01 data are drawn from the 2000-01
Agriculture Finance Survey, while ANZSIC subdivisions 02, 03 and 04 estimates are drawn from the 2000-
01Economic Activity Survey. Excludes management units in ANZSIC subdivision 01 with an estimated annual value
of agricultural operations (EVAO) of less than $22,500. Employment estimates exclude unpaid family helpers. (d)
Agricultural small businesses include those management units coded to ANZSIC subdivisions 01 with an VAO of
more than $22,500 but less than $400,000 and those management units coded to ANZSIC subdivisions 02, 03 and 04
which employ less than 20 persons. (e) Large businesses (except in agriculture) are defined as those management
units which employ more than 20 persons, except for manufacturing where large businesses are those which employ
more than 100 persons.
Source: Australian Bureau of Statistics (ABS) (2001), Small Business in Australia, Cat. no, 1321.0 p.6, 12.
PRIVATE SECTOR
LARGE BUSINESSES
PRIVATE SECTOR
Total public and private sector
1,281,700 businesses
Retail 168,700 (13.2%)
8,564,500 persons employed
Retail 1,216,200 (14.2%)
Agriculture, forestry and
fishing(b)
112,100 businesses (c)
Retail 0
355,000 persons employed(c)
Non-agricultural sector
1,164,100 businesses
Retail 168, 700 (14.5%)
6,901,900 persons employed
Retail 1,216,200 (17.6%)
Public trading and General
government organisations
5,500 organisations
Retail 0
1,307,600 persons employed
PUBLIC SECTOR
ALL BUSINESSES
(a)
Agriculture, forestry and
fishing(d)
900 businesses
Retail 0
51,000 persons employed
Non-agricultural large businesses(e)
42,100 businesses
Retail 5,900 (14.0%)
3,642,800 persons employed
Retail 620,300 (17.0%)
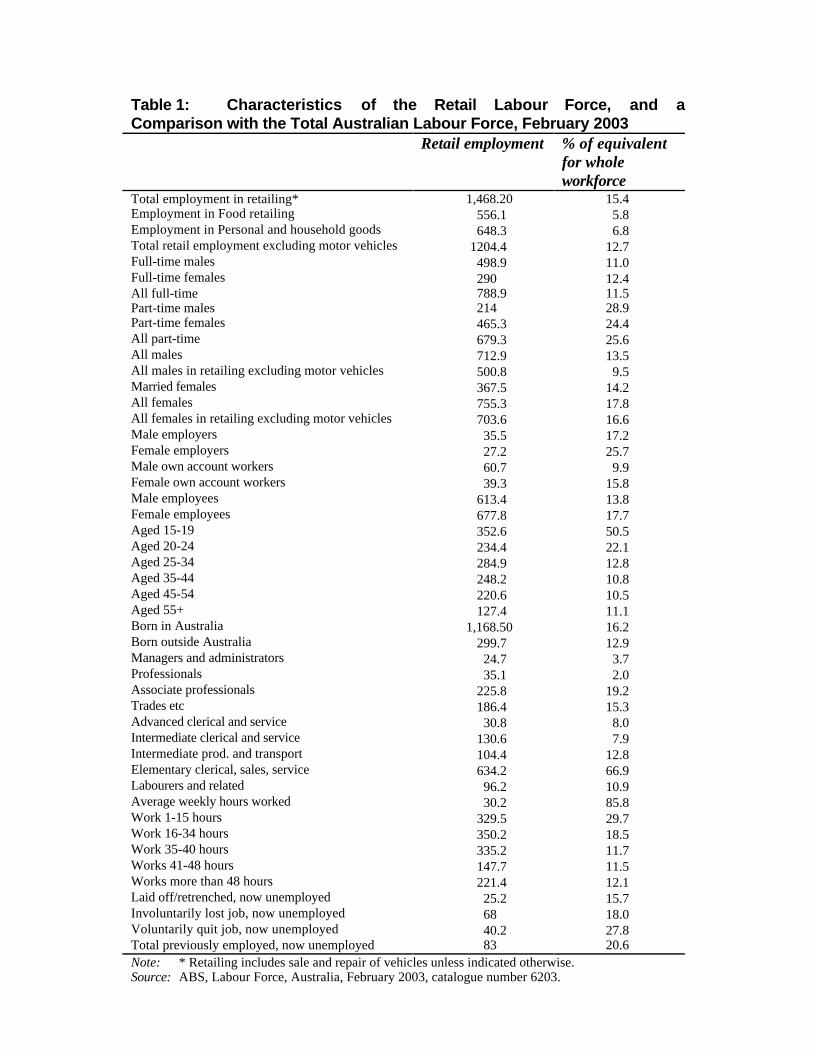
Table 1: Characteristics of the Retail Labour Force, and aComparison with the Total Australian Labour Force, February 2003
Retail employment % of equivalentfor wholeworkforce
Total employment in retailing* 1,468.20 15.4Employment in Food retailing 556.1 5.8Employment in Personal and household goods 648.3 6.8Total retail employment excluding motor vehicles 1204.4 12.7Full-time males 498.9 11.0Full-time females 290 12.4All full-time 788.9 11.5Part-time males 214 28.9Part-time females 465.3 24.4All part-time 679.3 25.6All males 712.9 13.5All males in retailing excluding motor vehicles 500.8 9.5Married females 367.5 14.2All females 755.3 17.8All females in retailing excluding motor vehicles 703.6 16.6Male employers 35.5 17.2Female employers 27.2 25.7Male own account workers 60.7 9.9Female own account workers 39.3 15.8Male employees 613.4 13.8Female employees 677.8 17.7Aged 15-19 352.6 50.5Aged 20-24 234.4 22.1Aged 25-34 284.9 12.8Aged 35-44 248.2 10.8Aged 45-54 220.6 10.5Aged 55+ 127.4 11.1Born in Australia 1,168.50 16.2Born outside Australia 299.7 12.9Managers and administrators 24.7 3.7Professionals 35.1 2.0Associate professionals 225.8 19.2Trades etc 186.4 15.3Advanced clerical and service 30.8 8.0Intermediate clerical and service 130.6 7.9Intermediate prod. and transport 104.4 12.8Elementary clerical, sales, service 634.2 66.9Labourers and related 96.2 10.9Average weekly hours worked 30.2 85.8Work 1-15 hours 329.5 29.7Work 16-34 hours 350.2 18.5Work 35-40 hours 335.2 11.7Works 41-48 hours 147.7 11.5Works more than 48 hours 221.4 12.1Laid off/retrenched, now unemployed 25.2 15.7Involuntarily lost job, now unemployed 68 18.0Voluntarily quit job, now unemployed 40.2 27.8Total previously employed, now unemployed 83 20.6Note: * Retailing includes sale and repair of vehicles unless indicated otherwise.Source: ABS, Labour Force, Australia, February 2003, catalogue number 6203.
From Table 1 we see that retail employment, compared with total employment for the
whole economy:
v When broadly defined, comprises 15.4% of total employment;
v When retailing excludes the sale and repair of cars, comprises 12.7% of totalemployment;
v Has a much higher proportion of part-time workers (about one quarter of all part-time employees), and a higher proportion of women;
v Has a higher than expected number of employers, especially female employers:they comprise one quarter of all female employers;
v Has a very young workforce: half of employees aged 15-19 work in retail but only11 per cent of those aged over 54;
v Has an occupational structure that is quite different from the workforce as awhole, with few managers and administrators and two thirds of all peopleemployed in elementary clerical, sales and service jobs;
v Has a disproportionate number of people working part-time, including almost onethird of all people who work fewer than 16 hours per week;
v Has a disproportionate number of former workers who are now unemployed—arelatively high proportion of whom quit their jobs voluntarily.
While not shown in the table, it is also true that employees in retail have less formal
education than the Australian workforce as a whole. For example, in 1997 28 per cent
of retail employees had post-school qualifications compared with 40 per cent for all
workers. Put another way, 9 per cent of workers with post-school education and 21
per cent of workers without post-school qualifications worked in retail. Between 1984
and 1997, the proportion of all workers without post-school qualifications who
worked in retail rose, from 18 per cent to 21 per cent. Retail employed a higher
proportion of such workers than any other sector (the next largest employer being
manufacturing, with 14 per cent)5.
The major characteristics of retail employment are not static. An examination of how
they have changed over the past 15 years shows that, between 1984 and 2003:
v Total employment in retail (excluding motor vehicle sales and service) has grownfrom 700,000 to 1,204,000, or by 72 per cent;
5 See Barnes, P, Johnson, R, Kulys, A and Hook, S, 1999, Productivity and the Structure of
Employment, Productivity Commission staff research paper, Ausinfo, Canberra, p.27
v This is faster than the rate of growth of all employment (58 per cent);
v Employment in personal and household goods has grown less rapidly than inretail as a whole and in food retailing;
v There has been a rise in the proportion of all employment that is accounted for byretail employment and by food retail employment, but no rise in the proportionemployed in personal and household goods;
v The number of people employed part-time has more than doubled for food andfor total retailing and has grown more slowly for personal and household goods;
v In consequence, part-time employment in food and in total retailing has grown, asa share of all part-time employment, especially for the former: it has fallen forpersonal and household goods retailing;
v There has been no growth in full-time employment in personal and householdgoods retailing and little in food or in total retailing;
v In consequence, full-time employment in total and in the main categories of retail(excluding motor) has fallen as a proportion of all full-time employment;
v Total hours worked in retail have grown by over 10 million, but they have fallenas a proportion of all hours worked, from 13.1% to 12.5%.
3. Do Supermarkets Reduce Retail Employment?
In this section we seek to establish whether the expansion of supermarkets at the
expense of small businesses is likely to reduce overall retail employment. It would do
so if the “labour content” of a unit of sales were higher if the goods were sold by a
small business than if the same goods were sold by a supermarket. By “labour
content” we mean the amount of worker time together with the wage paid for that
time. This is an empirical question. In order to answer it we draw on data from 1998-9
Retail Industry Census (the latest one available). Among other things, the census
contains information on:
v Turnover
v Cost of goods sold
v Wages and other costs of employing labour
v Interest, depreciation, rent, insurance and other expenses
v Number of employed persons
v Industry Gross Product.

It is not easy to establish whether small businesses are more labour intensive in their
operations than are larger firms. In principle, the share of labour costs in value added
(the difference between revenue and the cost of purchased inputs) is the best measure
of how labour intensive is a firm or industry. But many factors can affect labour’s
share of value added at a given moment of observation. In order to identify the effects
of firm size, we need to be able to compare firms that differ in size but otherwise are
the same. For example, they need to be selling the same sort of product, and located in
similar places. In a retail store, two things are being sold. One is the product. The
other is the service that surrounds the sale. Some products, such as spectacles,
inherently require more sales service than do others, such as milk. Some products,
such as fresh bread and takeaway food, are prepared on the premises and the labour
involved in preparation is indistinguishable from the labour involved in the selling. If
small firms specialise in the sale of products that require above average levels of
service or instore preparation, then the labour content of their value added will be
higher. In this case the high labour content is caused by the nature of the product sold
and not by the fact that the retail businesses are small.
In the table below, we examine two measures of the labour intensity of the retail
activity. The retail businesses are confined to those that sell food and groceries, in
order to make them as comparable as possible in their activities. The table
distinguishes supermarkets and grocery stores on the one hand and a range of
specialized food and drink stores on the other. It is not possible to separate
supermarkets from other grocery stores.
Table 2 shows that, compared with the value of goods purchased and other expenses,
the labour content of what is sold is particularly high for bread and cakes and high also
for takeaway food and meat, fish and poultry. It is lowest for liquor and low also for
supermarkets and groceries and greengrocers. Thirty per cent of total turnover goes to
paying wages for bread and cake shops, whereas only 7 per cent of turnover goes to
paying wages in the sale of liquor. This large difference in labour content occurs
despite the fact that the average size of business is about the same in the two types of
retail outlet. It is reasonable to conclude that the nature of what is sold is the key
factor driving the share of turnover accruing to wages, rather than the size of the
business. Where a product is partly or wholly produced on the premises, the labour
content of what is sold is naturally higher than when a business provides only a retail
service.
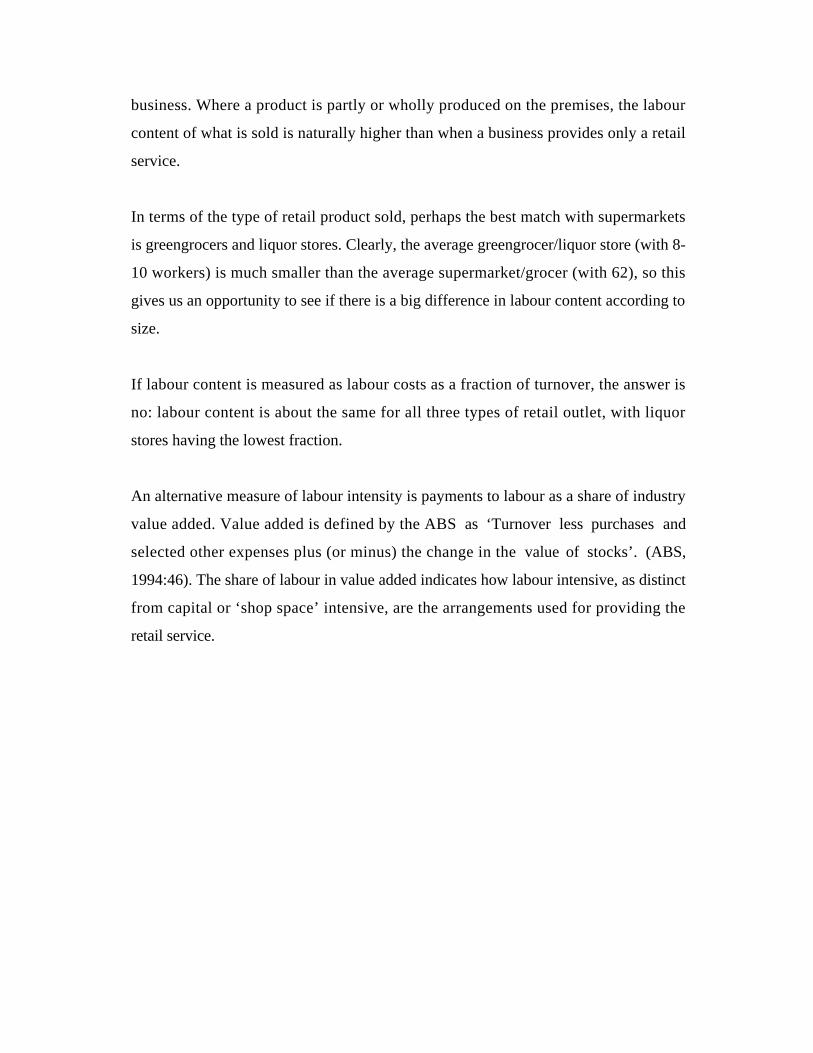
In terms of the type of retail product sold, perhaps the best match with supermarkets
is greengrocers and liquor stores. Clearly, the average greengrocer/liquor store (with 8-
10 workers) is much smaller than the average supermarket/grocer (with 62), so this
gives us an opportunity to see if there is a big difference in labour content according to
size.
If labour content is measured as labour costs as a fraction of turnover, the answer is
no: labour content is about the same for all three types of retail outlet, with liquor
stores having the lowest fraction.
An alternative measure of labour intensity is payments to labour as a share of industry
value added. Value added is defined by the ABS as ‘Turnover less purchases and
selected other expenses plus (or minus) the change in the value of stocks’. (ABS,
1994:46). The share of labour in value added indicates how labour intensive, as distinct
from capital or ‘shop space’ intensive, are the arrangements used for providing the
retail service.
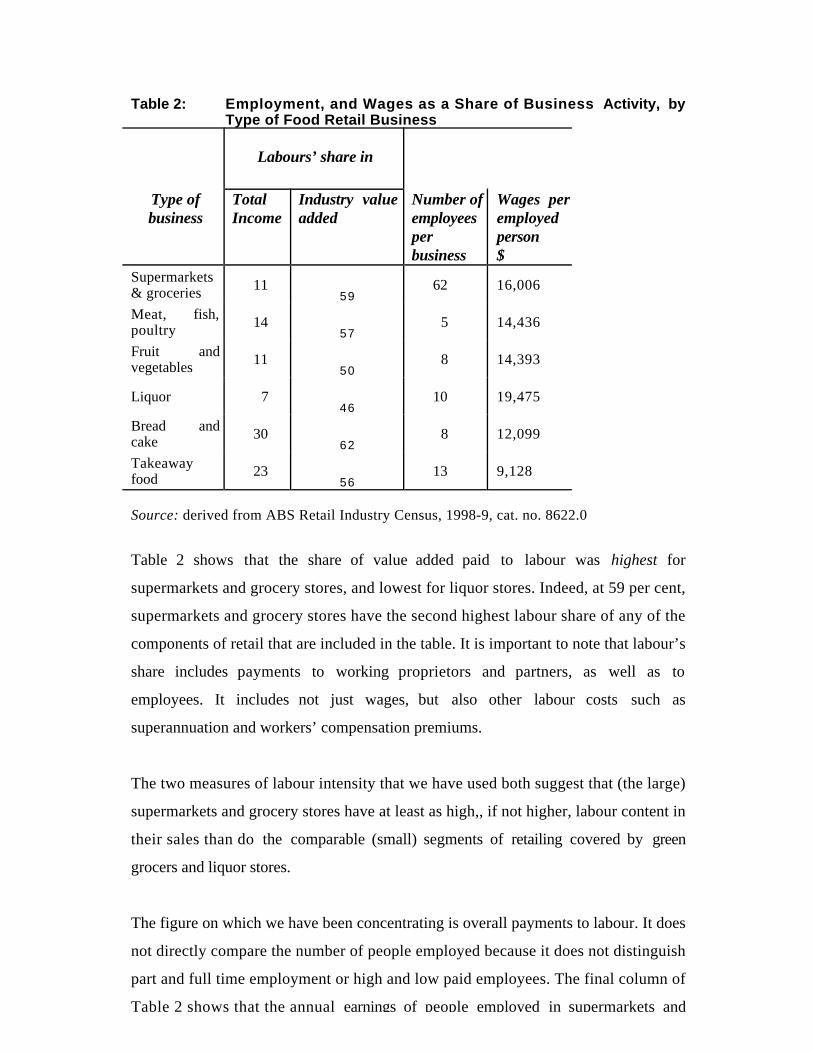
Table 2: Employment, and Wages as a Share of Business Activity, byType of Food Retail Business
Labours’ share in
Type ofbusiness
TotalIncome
Industry valueadded
Number ofemployeesperbusiness
Wages peremployedperson$
Supermarkets& groceries 11
5962 16,006
Meat, fish,poultry 14
575 14,436
Fruit andvegetables 11
508 14,393
Liquor 746
10 19,475
Bread andcake 30
628 12,099
Takeawayfood 23
5613 9,128
Source: derived from ABS Retail Industry Census, 1998-9, cat. no. 8622.0
Table 2 shows that the share of value added paid to labour was highest for
supermarkets and grocery stores, and lowest for liquor stores. Indeed, at 59 per cent,
supermarkets and grocery stores have the second highest labour share of any of the
components of retail that are included in the table. It is important to note that labour’s
share includes payments to working proprietors and partners, as well as to
employees. It includes not just wages, but also other labour costs such as
superannuation and workers’ compensation premiums.
The two measures of labour intensity that we have used both suggest that (the large)
supermarkets and grocery stores have at least as high,, if not higher, labour content in
their sales than do the comparable (small) segments of retailing covered by green
grocers and liquor stores.
The figure on which we have been concentrating is overall payments to labour. It does
not directly compare the number of people employed because it does not distinguish
part and full time employment or high and low paid employees. The final column of
Table 2 shows that the annual earnings of people employed in supermarkets and

grocery stores tend to be higher than those of other food retail segments. (They much
higher than for takeaway food, where payments are well below average.) They are
slightly higher than payments to workers in greengrocers, and less than in liquor
stores. On this evidence, the size of the wage bill is a reasonable indicator of the
quantity of employment. Wages and salaries in supermarkets are the same or higher as
a share of turnover and of value added as they are in greengrocers and liquor stores.
This suggests that the employment per unit of sales and of production is at least as
high in the large supermarkets/grocery stores as it is in the small greengrocers and
liquor stores. The transfer of business from the small stores to the large supermarkets
would not, on this evidence, decrease total employment or labour earnings.
Thus there is nothing in Table 2 to support the view that the expansion of
supermarkets at the expense of smaller food retail outlets would reduce overall
employment.
4. Productivity in the Retail Industry
The changes summarized above have occurred in the context of an economy that has
had several major developments over the period since the mid-1980s. Overall, the
growth in output and productivity for the Australian economy has been robust,
compared with other developed countries. The 1980s saw a strong growth in
employment and output, but quite low productivity growth: this has been ascribed in
part to the success of the Accord in keeping wage growth low and in encouraging
employment. Broadly, the reverse occurred in the 1990s, with strong growth in
productivity and less success in increasing employment. In between, there was a
severe recession in 1990-1, which caused low productivity, output and employment
for a few years. Since this recession, macroeconomic conditions in Australia have seen
sustained and quite high levels of growth in output, if not so much in employment.
In the retail sector, output is measured by the Australian Bureau of Statistics (ABS) as
the difference between the value of sales and the cost of the goods sold (value added).
This measure assumes that the average level of service associated with the sale of
goods does not change over time. Productivity is measured as the ratio of the value of
output to the value of the inputs. Labour productivity is the value of output divided
by the number of labour hours. Capital productivity is the value of output divided by
the value of services from capital equipment. Multifactor productivity is the value of
output divided by the value of both the labour and capital inputs. Both the value of
output and the value of capital services are difficult to measure in ways that make
them comparable over time. Hence some caution should be exercised in interpreting
trend figures.
Over the 24 year period from 1974-5 to 1998-9, multifactor productivity in the retail
sector is estimated to have risen at an average rate of 0.3 per cent per annum. The
comparable figure for the whole market sector of the economy is 0.96. Multifactor
productivity in the retail sector is estimated to have fallen over the decade 1984-94,
then turned around to rise at a rate of 1.3 per cent for the remainder of the 1990s.
Multifactor productivity rises, by definition, when output rises faster than inputs.
Table 3 below shows the behaviour of the key productivity measures, for three
intervals over the period 1975-99.
The growth in output varied considerably over the three periods reflected in Table 3.
At 1.5 per cent per annum during 1984-5 to 1991-2, it was less than half the growth
that was achieved for the remainder of the decade (3.9 per cent pa). Productivity
growth tends to decline when output growth slows and vice-versa, and this is
apparent in the table. It is notable that when output growth was slowing, input
(particularly labour input) growth continued at a rapid rate. Labour inputs, which are
measured as the number of hours worked, have grown over the whole period, but at
different rates. Growth was especially fast in the period 1984-5 to 1991-2 and
continued to be quite strong for the rest of the 1990s. Labour productivity, however,
fell in the middle period, while growing strongly in the earlier and later periods.
6 This and subsequent productivity figures are taken from Johnson et al, 2000.
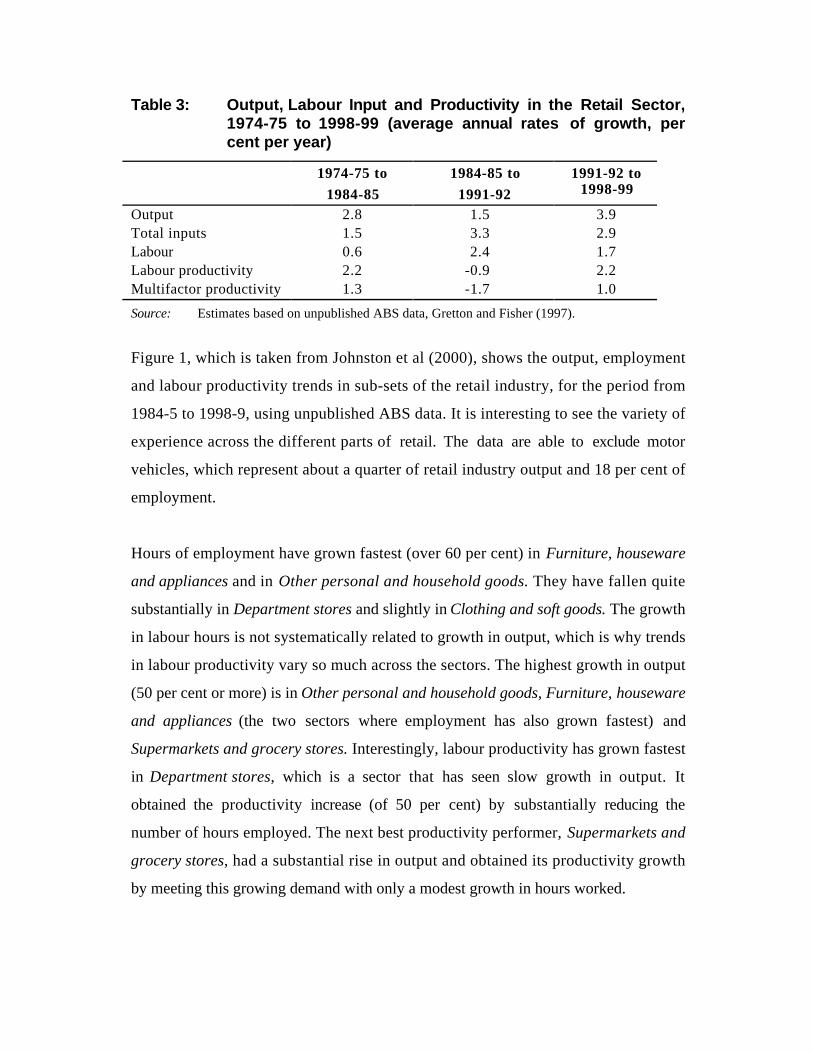
Table 3: Output, Labour Input and Productivity in the Retail Sector,1974-75 to 1998-99 (average annual rates of growth, percent per year)
1974-75 to1984-85
1984-85 to1991-92
1991-92 to1998-99
Output 2.8 1.5 3.9Total inputs 1.5 3.3 2.9Labour 0.6 2.4 1.7Labour productivity 2.2 -0.9 2.2Multifactor productivity 1.3 -1.7 1.0
Source: Estimates based on unpublished ABS data, Gretton and Fisher (1997).
Figure 1, which is taken from Johnston et al (2000), shows the output, employment
and labour productivity trends in sub-sets of the retail industry, for the period from
1984-5 to 1998-9, using unpublished ABS data. It is interesting to see the variety of
experience across the different parts of retail. The data are able to exclude motor
vehicles, which represent about a quarter of retail industry output and 18 per cent of
employment.
Hours of employment have grown fastest (over 60 per cent) in Furniture, houseware
and appliances and in Other personal and household goods. They have fallen quite
substantially in Department stores and slightly in Clothing and soft goods. The growth
in labour hours is not systematically related to growth in output, which is why trends
in labour productivity vary so much across the sectors. The highest growth in output
(50 per cent or more) is in Other personal and household goods, Furniture, houseware
and appliances (the two sectors where employment has also grown fastest) and
Supermarkets and grocery stores. Interestingly, labour productivity has grown fastest
in Department stores, which is a sector that has seen slow growth in output. It
obtained the productivity increase (of 50 per cent) by substantially reducing the
number of hours employed. The next best productivity performer, Supermarkets and
grocery stores, had a substantial rise in output and obtained its productivity growth
by meeting this growing demand with only a modest growth in hours worked.
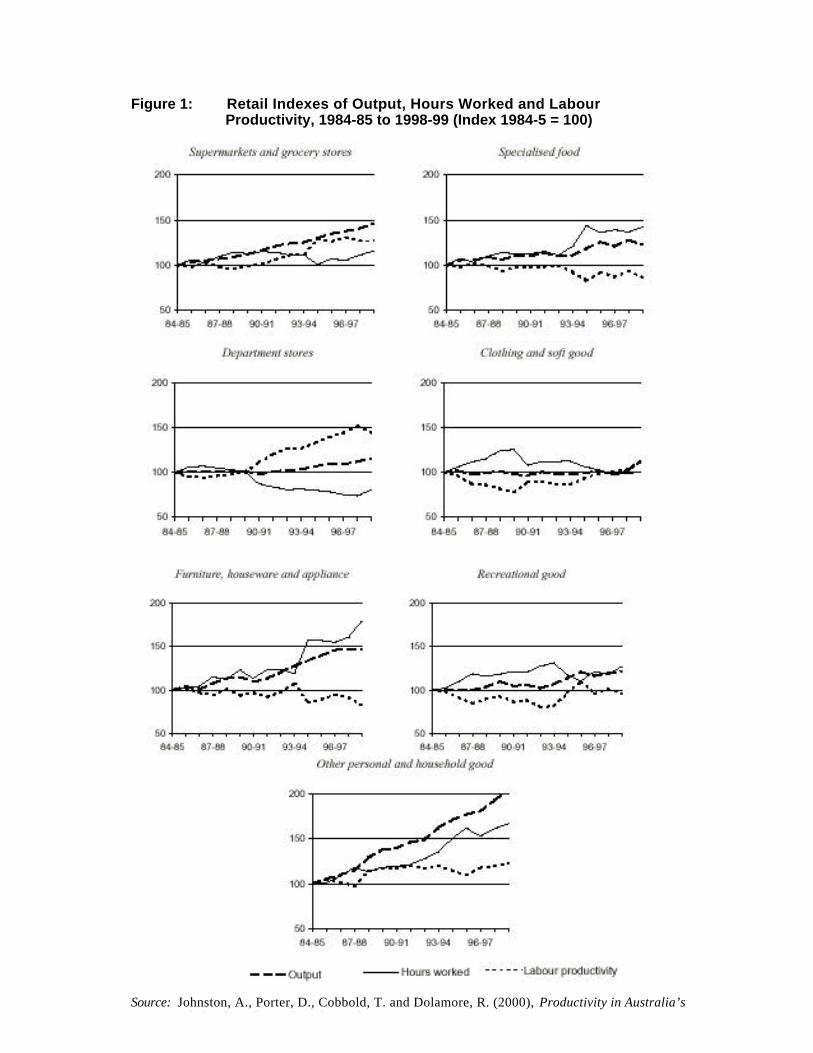
Figure 1: Retail Indexes of Output, Hours Worked and LabourProductivity, 1984-85 to 1998-99 (Index 1984-5 = 100)
Source: Johnston, A., Porter, D., Cobbold, T. and Dolamore, R. (2000), Productivity in Australia’sWholesale and Retail Trade, Productivity Commission.
5. The Structure of the Retail Industry
The retail industry covers the sale of a wide range of products, from flowers to boats
to fast food. The nature of businesses and of employment differs with the type of
product being sold. Butchers differ from department stores which in turn differ from
fast food outlets. In the analysis of changes in the structure of the retail industry, we
must rely on data from the Australian Bureau of Statistics. The ABS sub-divides the
retail industry into three main components. These components are Food, Personal
and household goods and Motor vehicle retailing and services. In what follows, Motor
vehicle retailing and services are excluded from the data, so that we refer only to Food
and Personal and household goods. Further subdivisions are made within each of
these components, but most data are published only at the more aggregated level.
5.1 A Detailed Snapshot of the Retail Industry
A census of the retail industry conducted by the ABS in 1998-9 (the last that has been
conducted) provides a snapshot look at the level of employment, number of
management units, wage bill and contribution to industry gross product by detailed
components of the retail industry. Table 4 below provides a summary of this
information.
The selling of food and groceries dominates the retail sector, accounting for 43 per cent
of the gross product of the industry. Supermarkets and grocery stores predominate in
terms of output, but small specialised food retailers provide almost as much
employment, though at a lower level of annual earnings. The level of annual earnings
reflects both hourly rates of pay and number of hours worked. These small food
stores are relatively labour intensive, contributing more to employment than their
share of industry gross product would suggest.
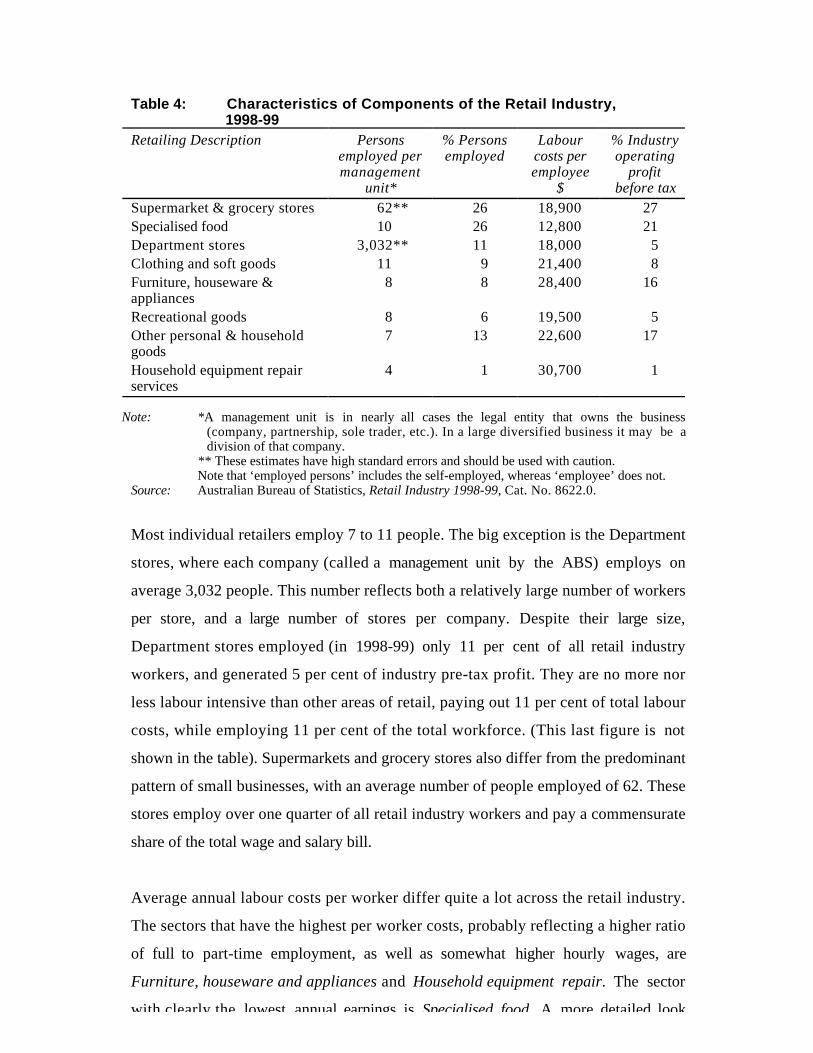
Table 4: Characteristics of Components of the Retail Industry,1998-99
Retailing Description Personsemployed permanagement
unit*
% Personsemployed
Labourcosts peremployee
$
% Industryoperating
profitbefore tax
Supermarket & grocery stores 62** 26 18,900 27Specialised food 10 26 12,800 21Department stores 3,032** 11 18,000 5Clothing and soft goods 11 9 21,400 8Furniture, houseware &appliances
8 8 28,400 16
Recreational goods 8 6 19,500 5Other personal & householdgoods
7 13 22,600 17
Household equipment repairservices
4 1 30,700 1
Note: *A management unit is in nearly all cases the legal entity that owns the business(company, partnership, sole trader, etc.). In a large diversified business it may be adivision of that company.
** These estimates have high standard errors and should be used with caution.Note that ‘employed persons’ includes the self-employed, whereas ‘employee’ does not.
Source: Australian Bureau of Statistics, Retail Industry 1998-99, Cat. No. 8622.0.
Most individual retailers employ 7 to 11 people. The big exception is the Department
stores, where each company (called a management unit by the ABS) employs on
average 3,032 people. This number reflects both a relatively large number of workers
per store, and a large number of stores per company. Despite their large size,
Department stores employed (in 1998-99) only 11 per cent of all retail industry
workers, and generated 5 per cent of industry pre-tax profit. They are no more nor
less labour intensive than other areas of retail, paying out 11 per cent of total labour
costs, while employing 11 per cent of the total workforce. (This last figure is not
shown in the table). Supermarkets and grocery stores also differ from the predominant
pattern of small businesses, with an average number of people employed of 62. These
stores employ over one quarter of all retail industry workers and pay a commensurate
share of the total wage and salary bill.
Average annual labour costs per worker differ quite a lot across the retail industry.
The sectors that have the highest per worker costs, probably reflecting a higher ratio
of full to part-time employment, as well as somewhat higher hourly wages, are
Furniture, houseware and appliances and Household equipment repair. The sector
with clearly the lowest annual earnings is Specialised food. A more detailed look
within Specialised food shows that the low labour costs per worker of this sector is
generated almost entirely in Takeaway food, which had an average per worker cost of
only $10,600. Low hourly wages, paid to youth, as well as a high level of part-time
employment undoubtedly both contribute to this outcome.
5.2 Changes over Time: Hours
In Figure 1 we showed how each of the sectors of the retail industry have evolved
between 1984-5 and 1998-9, in terms of output, hours worked and productivity. We
have already discussed the productivity aspects of these changes. Here we focus on
the changes in hours worked.
Substantial growth in hours worked is apparent for three sectors, namely Furniture,
houseware and appliances, Other personal and household goods and Specialised food.
The sector with the fastest growing employment was also the highest paying, namely
Furniture, houseware and appliances. It seems to have been largely unaffected by
technological change, as productivity per worker hour has fallen over the period. The
next fastest growing area of employment, Other personal and household goods, was
about average in terms of annual earnings. It experienced a rapid growth in output as
well as in employment, and modest labour productivity growth. The largest employer
of all, Supermarkets and grocery stores, saw a steady growth in output but fluctuating
changes in employment, with no growth until after the recession of the early 1990s.
After a few years of employment growth, employment has remained steady and the
growth in output has been accomplished by an increase output per hour worked
(labour productivity).
5.3 Changes over Time: Turnover
Developments in the retail industry can be viewed through a variety of lenses. These
include turnover, employment, value added, total wages and total profits. Here we
focus on turnover as a measure of size.
Figure 2 shows how the value of turnover in retail (excluding motor vehicles) has
grown over the period 1982-2001. The information is expressed in constant value
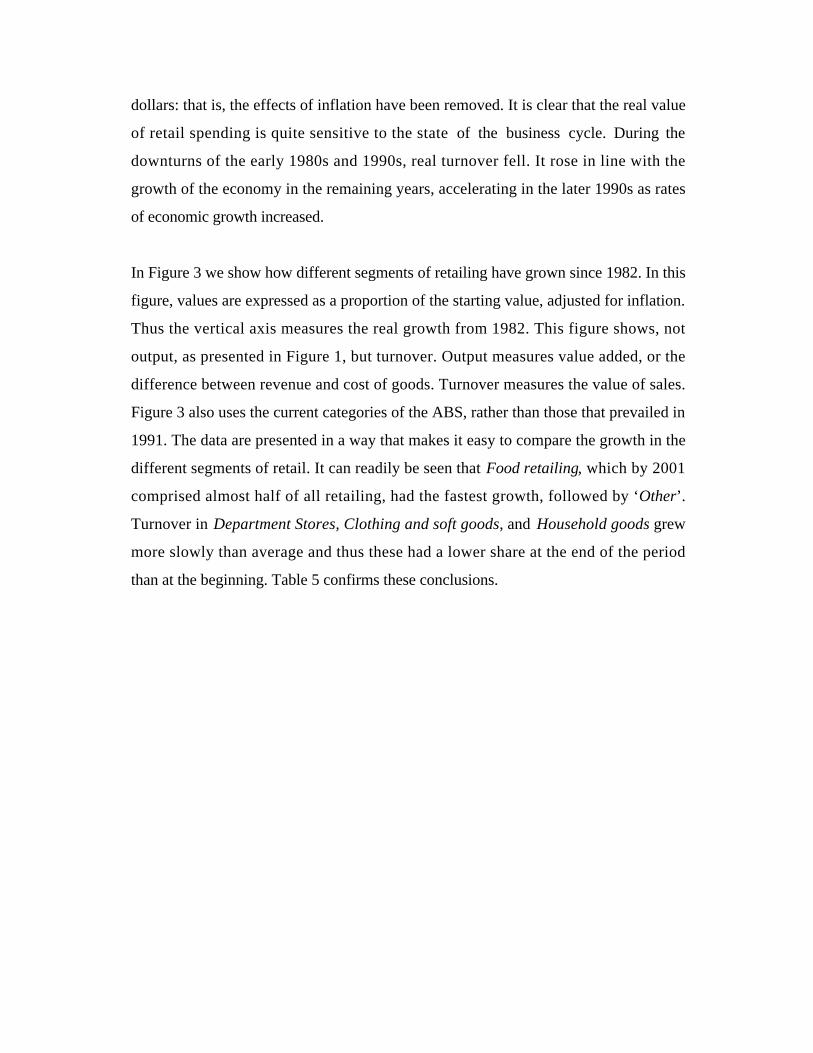
dollars: that is, the effects of inflation have been removed. It is clear that the real value
of retail spending is quite sensitive to the state of the business cycle. During the
downturns of the early 1980s and 1990s, real turnover fell. It rose in line with the
growth of the economy in the remaining years, accelerating in the later 1990s as rates
of economic growth increased.
In Figure 3 we show how different segments of retailing have grown since 1982. In this
figure, values are expressed as a proportion of the starting value, adjusted for inflation.
Thus the vertical axis measures the real growth from 1982. This figure shows, not
output, as presented in Figure 1, but turnover. Output measures value added, or the
difference between revenue and cost of goods. Turnover measures the value of sales.
Figure 3 also uses the current categories of the ABS, rather than those that prevailed in
1991. The data are presented in a way that makes it easy to compare the growth in the
different segments of retail. It can readily be seen that Food retailing, which by 2001
comprised almost half of all retailing, had the fastest growth, followed by ‘Other’.
Turnover in Department Stores, Clothing and soft goods, and Household goods grew
more slowly than average and thus these had a lower share at the end of the period
than at the beginning. Table 5 confirms these conclusions.
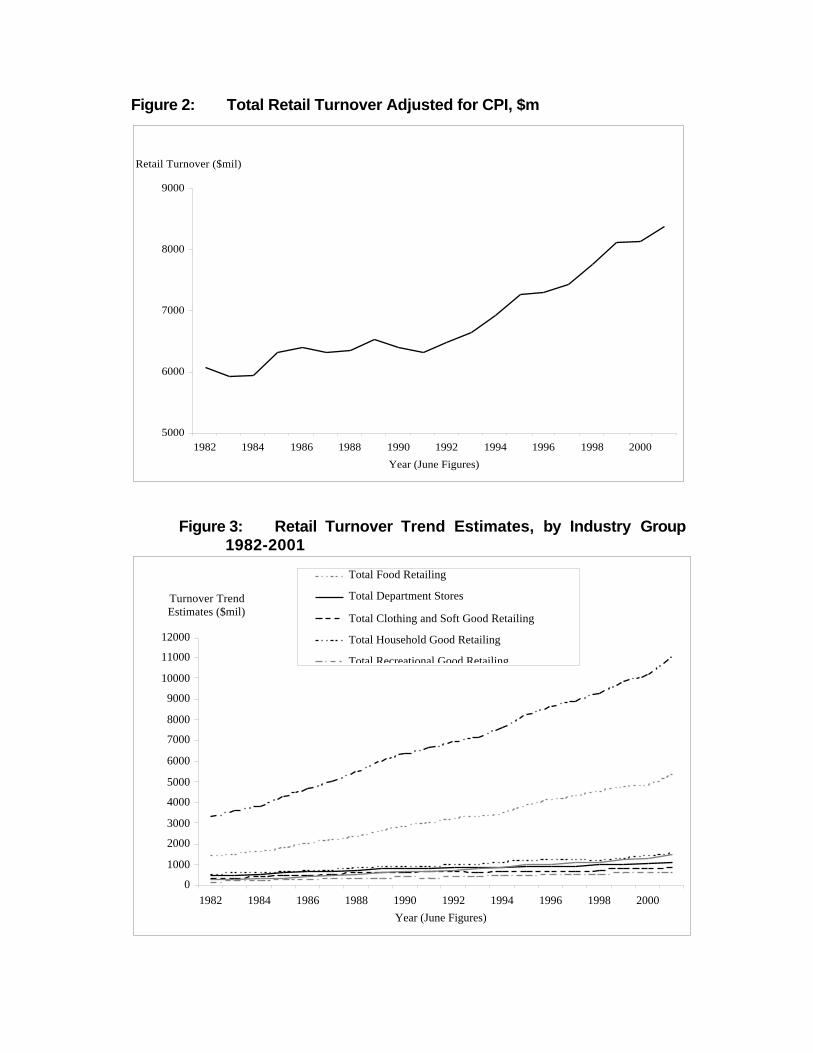
Figure 2: Total Retail Turnover Adjusted for CPI, $m
5000
6000
7000
8000
9000
1982 1984 1986 1988 1990 1992 1994 1996 1998 2000
Year (June Figures)
Retail Turnover ($mil)
Figure 3: Retail Turnover Trend Estimates, by Industry Group1982-2001
0
1000
2000
3000
4000
5000
6000
7000
8000
9000
10000
11000
12000
1982 1984 1986 1988 1990 1992 1994 1996 1998 2000
Year (June Figures)
Turnover Trend Estimates ($mil)
Total Food Retailing
Total Department Stores
Total Clothing and Soft Good Retailing
Total Household Good Retailing
Total Recreational Good Retailing

Table 5: Retail Group Share in Total Retail Turnover, 1982 and 2003(per cent)
Components as % of total Jun-82 May-03Food Retailing 43 49Department Stores 15 10Clothing and Soft Good Retailing 11 8Household Good Retailing 17 16Recreational Good Retailing 6 5Other Retailing 9 12
Source: ABS 8501.0, online data
Food retailing, of course, is quite a diverse sector. On the one hand there are
supermarkets, which range from the dominant Woolworths and Coles to small
independents, and on the other hand there are owner-managed specialty shops such as
butchers and cake shops. Figure 4 shows how turnover has grown for the components
of the food sector—supermarkets and grocery stores, and other food retailing. Other
food retailing excludes takeaway food. Figure 4 strongly makes the point that the
relatively rapid growth in sales of food and groceries has been in the supermarkets,
rather than in the specialist food shops.
Figure 4: Food Retail Turnover 1982-2001 Adjusted for CPI
0
500
1000
1500
2000
2500
3000
3500
4000
4500
5000
1982 1984 1986 1988 1990 1992 1994 1996 1998 2000
Year (June figures)
Turnover ($mil) Supermarkets and Grocery Stores
Other Food Retailing
Total food retailing (excluding Takeaway food)

5.4 Changes over Time: Size of Business
The size of a business can be measured in a variety of ways. Because the focus of this
report is on the labour market, we measure the size of business in terms of the number
of employees. It would be preferable to measure hours worked, since retail is an
industry in which many people work part-time, and part-time work is more prevalent
in some parts of the industry than in others. But suitable data that report hours
worked as a measure of firm size, and how this has changed over time, are not
available.
The retail industry has the characteristic that most firms are small yet most workers
work in large firms. In 2003, 97 per cent of firms were small (ie, employed no more
than 20 people) yet large employers accounted for slightly over half of total
employment.
Figure 5 below shows the pattern of growth of firms of different size over the period
from 1983-4. Note that data are not available for the years 1985-87. The figure has
two panels. In the first, the absolute number of retail businesses of different size is
displayed. It is clear that there is a very small number of larger employers. In the
second, we show the percentage change in the number of businesses. This gives a
different view when the number of businesses in each category is very different.
Because there are only a small number of large firms, an increase of a few extra firms
appears in the second panel as a large percentage increase, but in the first panel is
hardly noticeable.
The very small number and proportion of businesses that employ over 100 people is
immediately apparent from the first panel. On the scale used in this figure, it is hard to
see whether there has been any change in the number of these businesses over the 16
years since 1983-4. Almost half of retail businesses employ fewer than 5 people and
most of the rest employ between 5 and 19 people. Most of the variation in business
numbers occurs among small businesses: indeed, the smaller the business, the larger the
numbers that come and go over the period. This is not surprising, Most new
businesses start out small, many small businesses do not survive for more than a few
years and the very successful ones often grow and move into a larger employment
category. Economic downturns have a disproportionate effect on the number of small
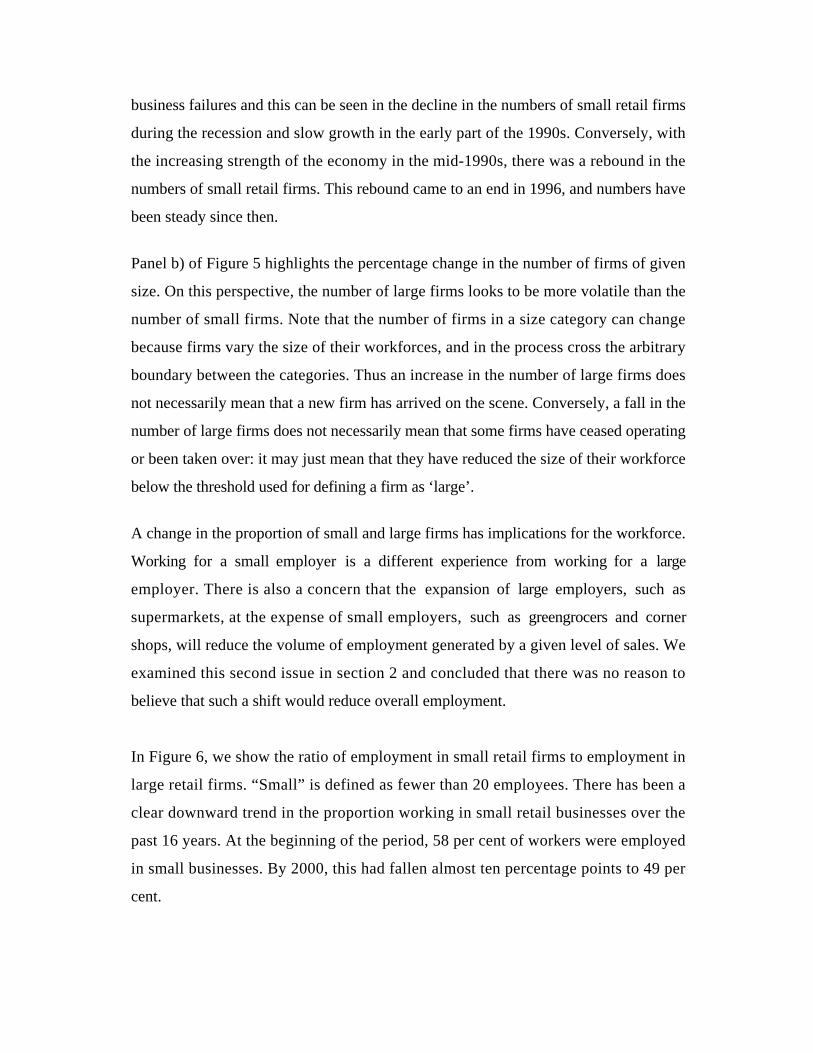
business failures and this can be seen in the decline in the numbers of small retail firms
during the recession and slow growth in the early part of the 1990s. Conversely, with
the increasing strength of the economy in the mid-1990s, there was a rebound in the
numbers of small retail firms. This rebound came to an end in 1996, and numbers have
been steady since then.
Panel b) of Figure 5 highlights the percentage change in the number of firms of given
size. On this perspective, the number of large firms looks to be more volatile than the
number of small firms. Note that the number of firms in a size category can change
because firms vary the size of their workforces, and in the process cross the arbitrary
boundary between the categories. Thus an increase in the number of large firms does
not necessarily mean that a new firm has arrived on the scene. Conversely, a fall in the
number of large firms does not necessarily mean that some firms have ceased operating
or been taken over: it may just mean that they have reduced the size of their workforce
below the threshold used for defining a firm as ‘large’.
A change in the proportion of small and large firms has implications for the workforce.
Working for a small employer is a different experience from working for a large
employer. There is also a concern that the expansion of large employers, such as
supermarkets, at the expense of small employers, such as greengrocers and corner
shops, will reduce the volume of employment generated by a given level of sales. We
examined this second issue in section 2 and concluded that there was no reason to
believe that such a shift would reduce overall employment.
In Figure 6, we show the ratio of employment in small retail firms to employment in
large retail firms. “Small” is defined as fewer than 20 employees. There has been a
clear downward trend in the proportion working in small retail businesses over the
past 16 years. At the beginning of the period, 58 per cent of workers were employed
in small businesses. By 2000, this had fallen almost ten percentage points to 49 per
cent.
Figure 5a: Number of Retail Businesses by Employer Size Group, 1983-84,1988-2000
0
5
10
15
20
25
30
35
40
45
50
55
60
65
1983-84
1988-89
1989-90
1990-91
1991-92
1992-93
1993-94
1994-95
1995-96
1996-97
1997-98
1998-99
1999-2000
Years
Number of retail businesses ('000)
Retail businesses Employing 1-4 employees
Retail businesses Employing 5-19 employees
Retail businesses Employing 20-99 employees
Retail businesses Employing 100+ employees
Figure 5b: Number of Retail Businesses by Employer Size Group, 1983-84m, 1988-2000 (reported as deviations from the startingvalue)
50
100
150
200
250
300
350
1983-84
1988-89
1989-90
1990-91
1991-92
1992-93
1993-94
1994-95
1995-96
1996-97
1997-98
1998-99
1999-2000
Years
Number of retail businesses (% of starting value)
Retail businesses Employing 1-4 employees: Deviations from strating value
Retail businesses Employing 5-19 employees: Deviations from starting value
Retail businesses Employing 20-99 employees: Deviations from starting value
Retail businesses Employing 100+ employees: Deviations from starting value
Note: Data not available for the years 1985-1987.Source: ABS catalogue 1321.0 'Small Business in Australia', Table 2.4: Number of businesses
by industry and employer size, Australia. Data provided as special request from ABS.

Figure 6: Employment in Small Retail Businesses as a Proportion of AllEmployment in Retail Trade, 1983-84, 1988-2000
0.46
0.48
0.5
0.52
0.54
0.56
0.58
1983-84
1988-89
1989-90
1990-91
1991-92
1992-93
1993-94
1994-95
1995-96
1996-97
1997-98
1998-99
1999-2000
Years
Proportion
Note: Data not available for the years 1985-1987.Source: ABS catalogue 1321.0 'Small Business in Australia', Table 2.3: Number of businesses
by industry and employer size, Australia. Data provided as special request from ABS.
Figure 7: Employment in Small Retail Businesses as a Proportion of AllEmployment in Retail Trade, 1983-84, 1988-2000
80
90
100
110
120
130
140
150
1983-84
1988-89
1989-90
1990-91
1991-92
1992-93
1993-94
1994-95
1995-96
1996-97
1997-98
1998-99
1999-2000
Years
Number of People Working in Retail (% of
starting value) Number of persons working in own retail business:Deviations from starting valueEmployment in all retail businesses: Deviations fromstarting value
Note: Data not available for the years 1985-1987.Source: ABS catalogue 1321.0 'Small Business in Australia', Table 2.3: Number of businesses
by industry and employer size, Australia. Data provided as special request from ABS.
At the same time that employment in small retail businesses has been falling, and total
employment in retail has been rising, the number of sole traders working in their own
retail business has fallen by about 10 per cent, to about 93,000. In round terms, own
account workers, who own their business and do not employ others, comprise about
10 per cent of all retail workers. A further 10 per cent consists of people who work in
their own their business and also employ others. Together, then, self-employed retail
workers comprise about one fifth of people working in a retail business. Figure 7
shows how the total number of people working in retail and the number working in
their own retail business have changed between 1983-4 and 1999-2000. The figures are
expressed as deviations from the value that each series had at the beginning of the
period, and hence can be read as percentage changes. Figure 7 shows that movements
in self-employment broadly followed those in total employment until 1994-5. In that
year, total employment began to accelerate and self-employment began to fall, until by
2000 self-employment was 15 per cent below it peak. The decline in self-employment
came later than the decline in overall employment in small retail businesses as shown
in Figure 6. As a result of these changes, self-employment in retail has fallen from 22
per cent to 14 per cent of all retail employment over the period. (ABS, catalogue no.
1321.0, unpublished data).
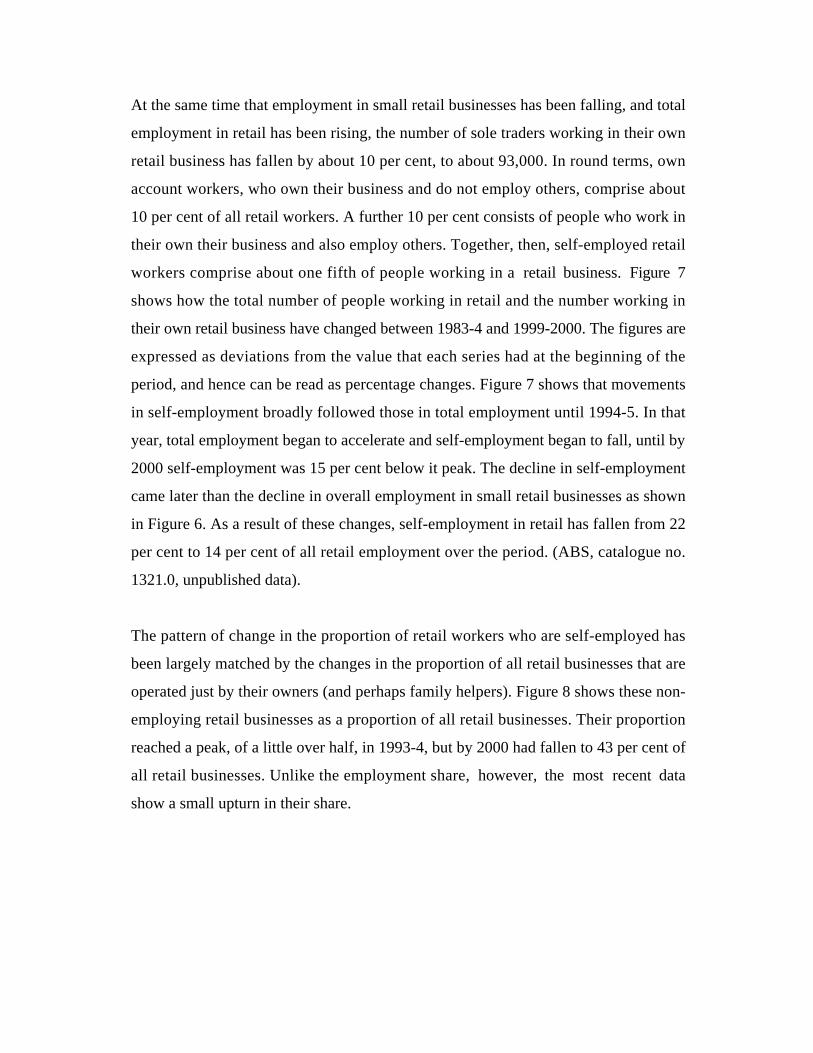
The pattern of change in the proportion of retail workers who are self-employed has
been largely matched by the changes in the proportion of all retail businesses that are
operated just by their owners (and perhaps family helpers). Figure 8 shows these non-
employing retail businesses as a proportion of all retail businesses. Their proportion
reached a peak, of a little over half, in 1993-4, but by 2000 had fallen to 43 per cent of
all retail businesses. Unlike the employment share, however, the most recent data
show a small upturn in their share.
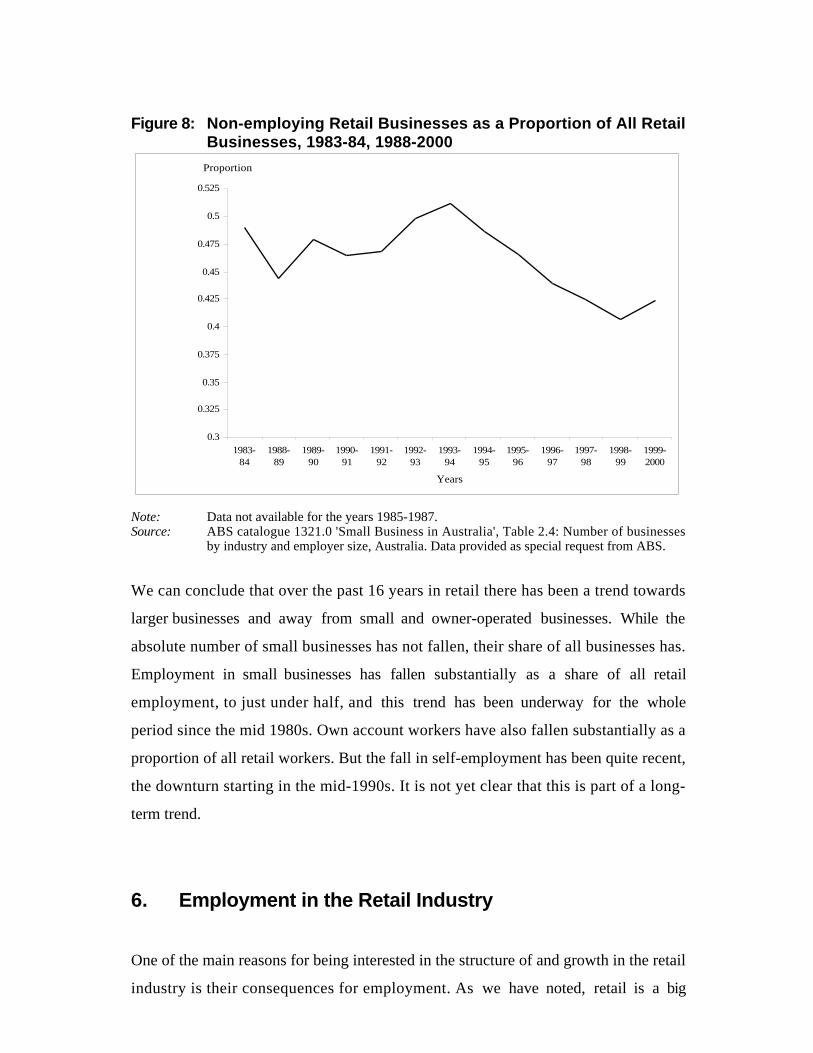
Figure 8: Non-employing Retail Businesses as a Proportion of All RetailBusinesses, 1983-84, 1988-2000
0.3
0.325
0.35
0.375
0.4
0.425
0.45
0.475
0.5
0.525
1983-84
1988-89
1989-90
1990-91
1991-92
1992-93
1993-94
1994-95
1995-96
1996-97
1997-98
1998-99
1999-2000
Years
Proportion
Note: Data not available for the years 1985-1987.Source: ABS catalogue 1321.0 'Small Business in Australia', Table 2.4: Number of businesses
by industry and employer size, Australia. Data provided as special request from ABS.
We can conclude that over the past 16 years in retail there has been a trend towards
larger businesses and away from small and owner-operated businesses. While the
absolute number of small businesses has not fallen, their share of all businesses has.
Employment in small businesses has fallen substantially as a share of all retail
employment, to just under half, and this trend has been underway for the whole
period since the mid 1980s. Own account workers have also fallen substantially as a
proportion of all retail workers. But the fall in self-employment has been quite recent,
the downturn starting in the mid-1990s. It is not yet clear that this is part of a long-
term trend.
6. Employment in the Retail Industry
One of the main reasons for being interested in the structure of and growth in the retail
industry is their consequences for employment. As we have noted, retail is a big
employer. It also provides unusually high levels of opportunity for new entrants to
the labour force (young people and mothers returning to employment, though not
migrants) and for self-employment. So it is not just the total level of employment that
is interesting, but also the composition of that employment. We present below a
summary of developments in the main indicators of employment in the retail industry.
6.1 Total Employment
In Table 1 we saw that retail employment comprised 1,468,200 people in February
2003, or 15 per cent of total employment. This figure applies to a broad definition of
retail, and we will see later how this employment is divided among sub-sets of the
retail sector.
In this section, we examine how retail employment has changed over time, in total and
as a share of all employment.
Figure 9 shows how employment in retail businesses and in all businesses has changed
since the mid-1980s. Employment levels in 1983-4 are set as the starting value, and
employment in later years is expressed as a percentage of the starting value. From the
figure we can see that:
v Employment in all businesses grew by over 50 per cent by 1999-2000.
v Employment in total retail (including motor vehicles sales and service) grew more
slowly, at around 40 per cent, over the same period.
v Retail employment broadly tracked total business employment, but grew at a more
subdued rate.
v Where total business employment was unchanged over the five years from 1989-
90, in retail it fell over this period.
v Total business and retail employment each grew by around 15 per cent in the 6
years since the downturn of 1993-4.

Figure 9: Number of People Employed in Australian Businesses, 1983-84m, 1988-2000 (reported as deviations from the startingvalue)
80
90
100
110
120
130
140
150
160
170
1983-84
1988-89
1989-90
1990-91
1991-92
1992-93
1993-94
1994-95
1995-96
1996-97
1997-98
1998-99
1999-2000
Years
Number of people employed (% of starting value) Total employment in all retail businesses: Deviations
from starting value
Total employment in all businesses: Deviations fromstarting value
Note: Data not available for the years 1985-1987.Source: ABS catalogue 1321.0 'Small Business in Australia', Table 2.3: Number of businesses
by industry and employer size, Australia. Data provided as special request from ABS.
As a result of the flatter growth of retail employment, employment in retail businesses
as a share of employment in all businesses fell from 20 per cent at the beginning of the
period to 18 per cent at the end. All retail employment is in the private sector. If we
express private sector retail employment as a proportion of all private sector
employment, we find that the retail share has fluctuated around a central value of 18
per cent over the period since 1983-4. (ABS 1321.0, unpublished data).
6.2 Sectors within Retail Employment
Coles Myer Ltd is interested to know the changes in that part of the retail labour
market that are of most relevance to its own operations. The ABS publishes data at
different levels of detail, depending on the series and the topic of the data release. For
much of its labour force data, the industry breakdown is at a high level of aggregation,

and the retail sector is treated as a whole. For some series, the next level of
disaggregation is available, that divides the retail sector into food, personal and
household goods, and motor vehicle sales and service. In this section, we present
information on changes in retail employment that draws on this more disaggregated
data. We are thus able to exclude motor vehicle sales and service from the picture.
We start by giving an overview of the major changes in retail employment over the
past 15 years. Motor vehicle sales and service is included in the table in order to
enable its impact on the aggregate retail data to be seen.
Table 6 tells us a great deal about recent developments in employment in the retail
sector. The key points are summarized below:
v Excluding motor vehicles, total employment in retail has grown by 70 per centover the past 18 years (which is faster than for the economy as a whole).
v Employment in Food Retailing grew faster (at 78%) than employment in Personaland Household Goods (at 64%).
v Part-time employment grew much faster than full-time employment (147%compared with 27%).
v The growth in part-time employment was especially strong (181%), and in full-time employment especially weak (13%), in Food Retailing. (Note that FoodRetailing does not include cafes and restaurants).
v By 2003, there were almost as many people employed in Food Retailing as inPersonal and Household Goods.
v Food Retailing has a high and rising ratio of part-time to full-time staff (1.6compared with 0.8 for Personal and Household Goods in 2003).
v Employment in Motor Vehicles Sales and Service rose more slowly than in theother two sectors of the retail industry, so that by 2003 it represented 18 per centof total retail employment.
6.3 Female and Male Employment
We saw in Table 1 that the retail industry employs a relatively large number of
women, especially if the sales and servicing of cars is excluded from the measure of
retail employment.
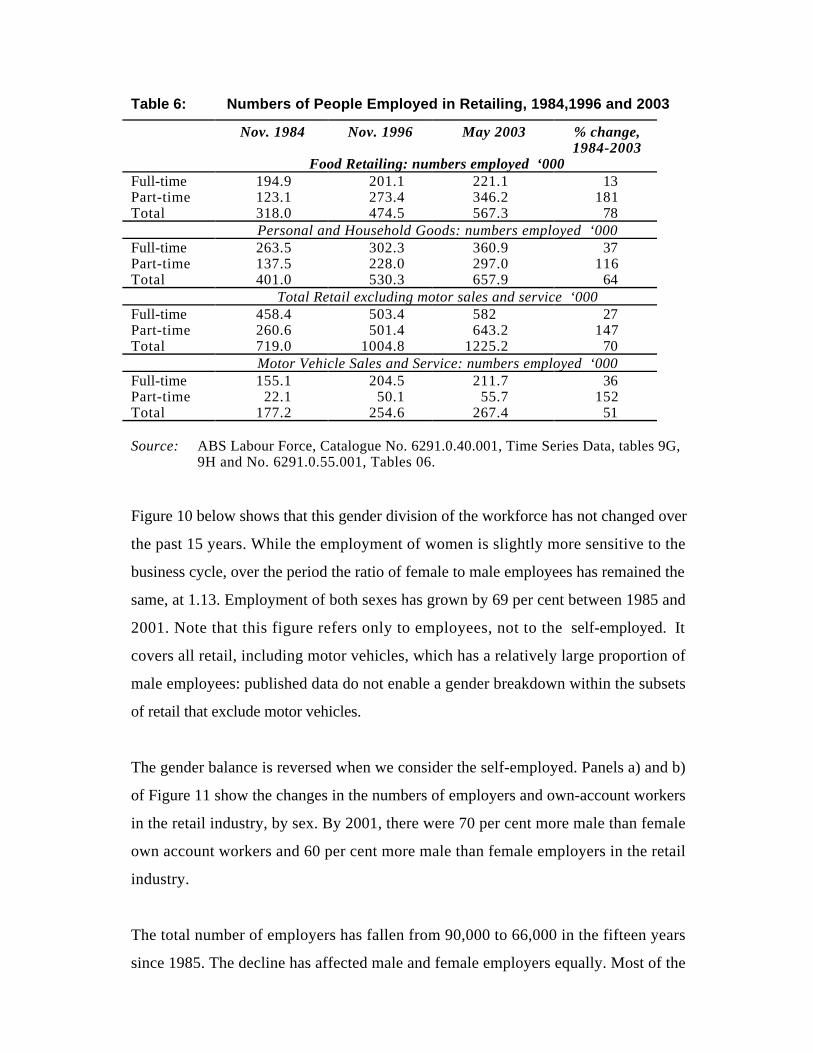
Table 6: Numbers of People Employed in Retailing, 1984,1996 and 2003
Nov. 1984 Nov. 1996 May 2003 % change,1984-2003
Food Retailing: numbers employed ‘000Full-time 194.9 201.1 221.1 13Part-time 123.1 273.4 346.2 181Total 318.0 474.5 567.3 78
Personal and Household Goods: numbers employed ‘000Full-time 263.5 302.3 360.9 37Part-time 137.5 228.0 297.0 116Total 401.0 530.3 657.9 64
Total Retail excluding motor sales and service ‘000Full-time 458.4 503.4 582 27Part-time 260.6 501.4 643.2 147Total 719.0 1004.8 1225.2 70
Motor Vehicle Sales and Service: numbers employed ‘000Full-time 155.1 204.5 211.7 36Part-time 22.1 50.1 55.7 152Total 177.2 254.6 267.4 51
Source: ABS Labour Force, Catalogue No. 6291.0.40.001, Time Series Data, tables 9G,9H and No. 6291.0.55.001, Tables 06.
Figure 10 below shows that this gender division of the workforce has not changed over
the past 15 years. While the employment of women is slightly more sensitive to the
business cycle, over the period the ratio of female to male employees has remained the
same, at 1.13. Employment of both sexes has grown by 69 per cent between 1985 and
2001. Note that this figure refers only to employees, not to the self-employed. It
covers all retail, including motor vehicles, which has a relatively large proportion of
male employees: published data do not enable a gender breakdown within the subsets
of retail that exclude motor vehicles.
The gender balance is reversed when we consider the self-employed. Panels a) and b)
of Figure 11 show the changes in the numbers of employers and own-account workers
in the retail industry, by sex. By 2001, there were 70 per cent more male than female
own account workers and 60 per cent more male than female employers in the retail
industry.
The total number of employers has fallen from 90,000 to 66,000 in the fifteen years
since 1985. The decline has affected male and female employers equally. Most of the

Figure 10: Number of Male and Female Employees in the Retail Industry1985-2001
300
350
400
450
500
550
600
650
1985 1986 1987 1988 1989 1990 1991 1992 1993 1994 1995 1996 1997 1998 1999 2000 2001
Year (May Figures)
Number of Employees ('000)
Number of Male employees in retail
Number of Female employees in Retail
Note: Data from 2000 onwards is not strictly comparable with earlier data, due to definitionalchanges in the labour force survey.
Source: ABS catalogue 6203.0, 'Labour Force, Australia', Time Series Data Tables 9a, 9b, and 9c ‘Labour Force – employees by industry.
decline has occurred since the mid-1990s, after an upturn following the recession of
1990-91.
Over the business cycle, changes to employment tend to lag changes to output. While
the bottom of the output trough of the business cycle occurred in 1991, the bottom of
the employment trough occurred in 1992. It is highly likely that the growth in own
account workers (both male and female) that reached a peak in 1993 was in large part a
response to the increasing difficulties that people had in obtaining work as an
employee. This view is supported by the fact that there was not a similar increase in
the numbers of employers, which have declined fairly steadily since the late 1980s. As
the labour market strengthened during the latter half of the 1990s, the number of own
account workers in the retail industry fell, strongly so for women.

The retail industry attracts a disproportionate number of women employers, but its
role in this respect has declined over the past decade. In 1989, fully 36 per cent of all
women employers operated in the retail sector (and 22 per cent of male employers).
By 2001 this had fallen to 24 per cent (and 18 per cent for men). (ABS 6203.0). This
large fall in the proportion of women employers who are in the retail sector contrasts
with the more modest fall, from 24 to 21 per cent, in the proportion of all types of
retail employment as a share of total private sector employment. The falling
proportion of employers found in retail is one piece of evidence that the changes in the
industry have been favouring larger as compared with smaller businesses.
Figure 11(a):Number of Employers in the Retail Industry 1985-2001
20
30
40
50
60
70
80
90
100
110
120
1985 1986 1987 1988 1989 1990 1991 1992 1993 1994 1995 1996 1997 1998 1999 2000 2001
Year (May Figures)
No. of employers ('000)
Number of Male employers in Retail
Number of Female employers in Retail
Total number of employers in Retail
Total
Male
Female
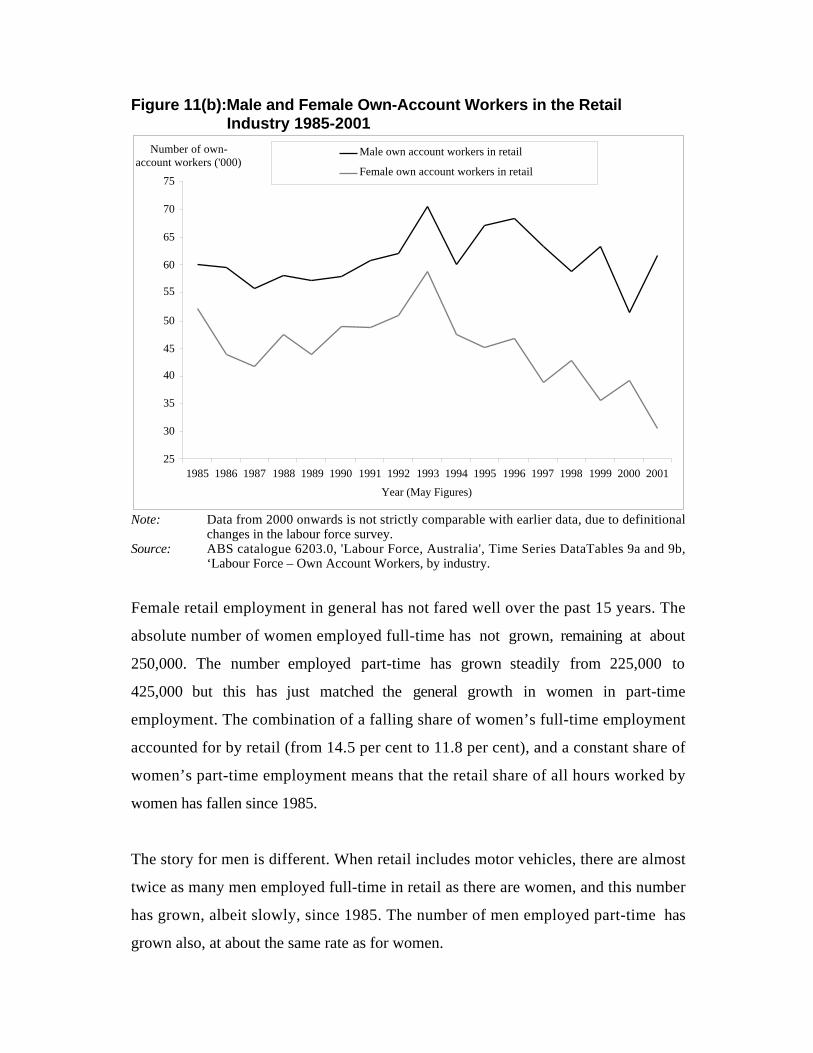
Figure 11(b):Male and Female Own-Account Workers in the RetailIndustry 1985-2001
25
30
35
40
45
50
55
60
65
70
75
1985 1986 1987 1988 1989 1990 1991 1992 1993 1994 1995 1996 1997 1998 1999 2000 2001
Year (May Figures)
Number of own-account workers ('000)
Male own account workers in retail
Female own account workers in retail
Note: Data from 2000 onwards is not strictly comparable with earlier data, due to definitionalchanges in the labour force survey.
Source: ABS catalogue 6203.0, 'Labour Force, Australia', Time Series DataTables 9a and 9b,‘Labour Force – Own Account Workers, by industry.
Female retail employment in general has not fared well over the past 15 years. The
absolute number of women employed full-time has not grown, remaining at about
250,000. The number employed part-time has grown steadily from 225,000 to
425,000 but this has just matched the general growth in women in part-time
employment. The combination of a falling share of women’s full-time employment
accounted for by retail (from 14.5 per cent to 11.8 per cent), and a constant share of
women’s part-time employment means that the retail share of all hours worked by
women has fallen since 1985.
The story for men is different. When retail includes motor vehicles, there are almost
twice as many men employed full-time in retail as there are women, and this number
has grown, albeit slowly, since 1985. The number of men employed part-time has
grown also, at about the same rate as for women.
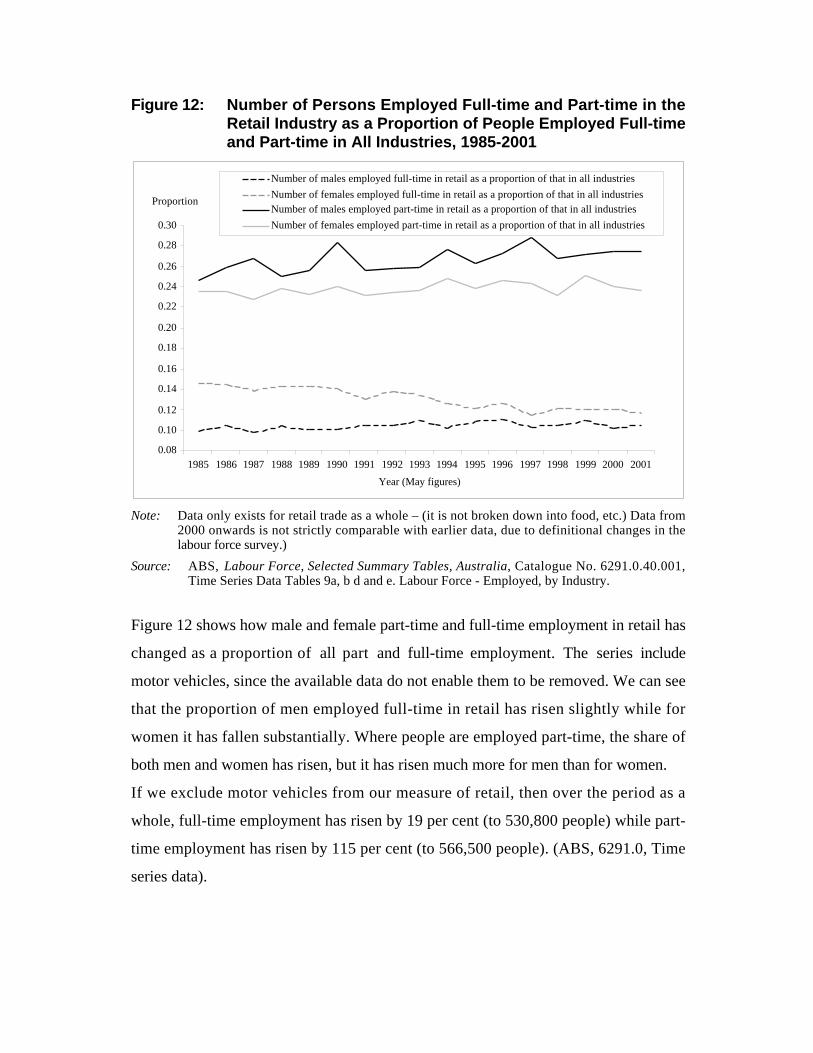
Figure 12: Number of Persons Employed Full-time and Part-time in theRetail Industry as a Proportion of People Employed Full-timeand Part-time in All Industries, 1985-2001
0.08
0.10
0.12
0.14
0.16
0.18
0.20
0.22
0.24
0.26
0.28
0.30
1985 1986 1987 1988 1989 1990 1991 1992 1993 1994 1995 1996 1997 1998 1999 2000 2001
Year (May figures)
Proportion
Number of males employed full-time in retail as a proportion of that in all industries
Number of females employed full-time in retail as a proportion of that in all industriesNumber of males employed part-time in retail as a proportion of that in all industries
Number of females employed part-time in retail as a proportion of that in all industries
Note: Data only exists for retail trade as a whole – (it is not broken down into food, etc.) Data from2000 onwards is not strictly comparable with earlier data, due to definitional changes in thelabour force survey.)
Source: ABS, Labour Force, Selected Summary Tables, Australia, Catalogue No. 6291.0.40.001,Time Series Data Tables 9a, b d and e. Labour Force - Employed, by Industry.
Figure 12 shows how male and female part-time and full-time employment in retail has
changed as a proportion of all part and full-time employment. The series include
motor vehicles, since the available data do not enable them to be removed. We can see
that the proportion of men employed full-time in retail has risen slightly while for
women it has fallen substantially. Where people are employed part-time, the share of
both men and women has risen, but it has risen much more for men than for women.
If we exclude motor vehicles from our measure of retail, then over the period as a
whole, full-time employment has risen by 19 per cent (to 530,800 people) while part-
time employment has risen by 115 per cent (to 566,500 people). (ABS, 6291.0, Time
series data).

6.3 Hours Worked
It is clear from the evidence presented above that the composition of employment in
the retail sector has been changing. The self-employed are diminishing as a component
of total retail employment and becoming more masculine; employees are becoming
more feminine, and there has been a rapid expansion of the role of part-time staff.
The increase in the use of part-time staff means that the growth in the numbers of
people employed in retail exceeds the growth in hours worked. Over the period from
1985 to 2001, when employment for the whole of retail (including motor vehicles)
grew by 47 per cent, the total number of hours worked grew by 30 per cent. This was
a little slower than the growth in hours worked for the whole economy, and in
consequence the share of retail employment in total hours worked fell from 13.1 per
cent in May 1985 to 12.5 per cent in May 2001.
There has been a slightly faster rate of growth of hours worked by women in retail
than in hours worked by men. Total hours worked by men rose over the period by 28
per cent to 23.5 million hours per week. The comparable figures for women are a 31
per cent rise to 17.0 million hours per week. But as shown in the figure below, total
hours worked by women have grown faster in other sectors of the economy than they
have in retail.
Figure 13 shows how total hours worked in retail (including motor vehicles) has varied
for men and for women, as a proportion of all hours worked. For men and women
combined, hours worked in retail as a share of all hours worked has declined a little,
from 13.2 per cent to 12.6 per cent.
The figure shows that employment in retail is not as important for men as it is for
women. However the relatively feminine character of hours of employment in retail
has been diminishing. Hours worked by men in retail as a fraction of all hours worked
by men has been almost constant over the period since 1985. In contrast, the retail
share of women’s hours of employment has diminished substantially, from 17 per

Figure 13: Hours Worked in the Retail Industry and a Proportion ofHours Worked in All Industries, 1985-2001
0.08
0.1
0.12
0.14
0.16
0.18
0.2
1985 1986 1987 1988 1989 1990 1991 1992 1993 1994 1995 1996 1997 1998 1999 2000 2001
Year (May Figures)
Proportion
Total hours worked by males in retail as a proportion of that in all industries
Total hours worked by females in retail as a proportion of that in all industries
Total hours worked in retail as a proportion of hours worked in all industries
Note: Data only exists for retail trade as a whole – (it is not broken down into food, etc.) Data from2000 onwards is not strictly comparable with earlier data, due to definitional changes in thelabour force survey.)
Source: ABS, Labour Force, Selected Summary Tables, Australia, Catalogue No. 6291.0.40.001,Time Series Data Table 18. Labour Force – Hours Worked (‘000) by Industry.
cent to 14 per cent. Note that this trend has occurred while at the same time the share
of the relatively masculine Motor Vehicle Sales and Service has been diminishing, and
part-time employment has been growing strongly.
We conclude that while total hours worked by women in retail have been growing a
little faster than total hours worked by men, the hours growth for women has not
matched that occurring in other parts of the economy. Thus there are two trends.
Within the retail sector, the share of total hours worked by women has been rising.
But for the economy as a whole, the share of total hours worked in the retail sector,
and especially the share of women’s total hours worked in the retail sector, has been
falling.
7. Earnings
Given the character of its workforce—disproportionately young, female and part-
time—we would expect that weekly earnings in retail would be relatively low. In this
section, we present evidence on the level of earnings, how it has been changing and
how it compares with earnings in the rest of the economy.
Adult women/men employed full-time in retail in May 2003 earned $642/$707 so that
the average adult employed full-time in retail earned $684 per week in 2003. This
represents three quarters of the value of average weekly adult ordinary time earnings
for all workers. (Data in this section are from ABS 6302.0, and include motor sales and
service in the definition of retail).
Figure 14 shows how real average weekly earnings have changed since 1984. This
figure covers all employed persons (adults and juniors), and averages earnings across
both full and part-time workers. For women, men and in total, real weekly earnings
have fallen 6 per cent between 1984 and 2001: from $317 to $298 for the average retail
worker. There was a dip in the level of real average earnings that started in 1993 and
continued for three or four years. There is nothing in the other data about the retail
industry—turnover, productivity, employment or number of businesses that matches
this time pattern and that might give a clue as to its cause. Average weekly earnings
may fall because the hourly wage paid for the job falls (in real—ie after adjusting for
inflation—terms). Or it may fall because more people are employed in the lower
paying jobs.
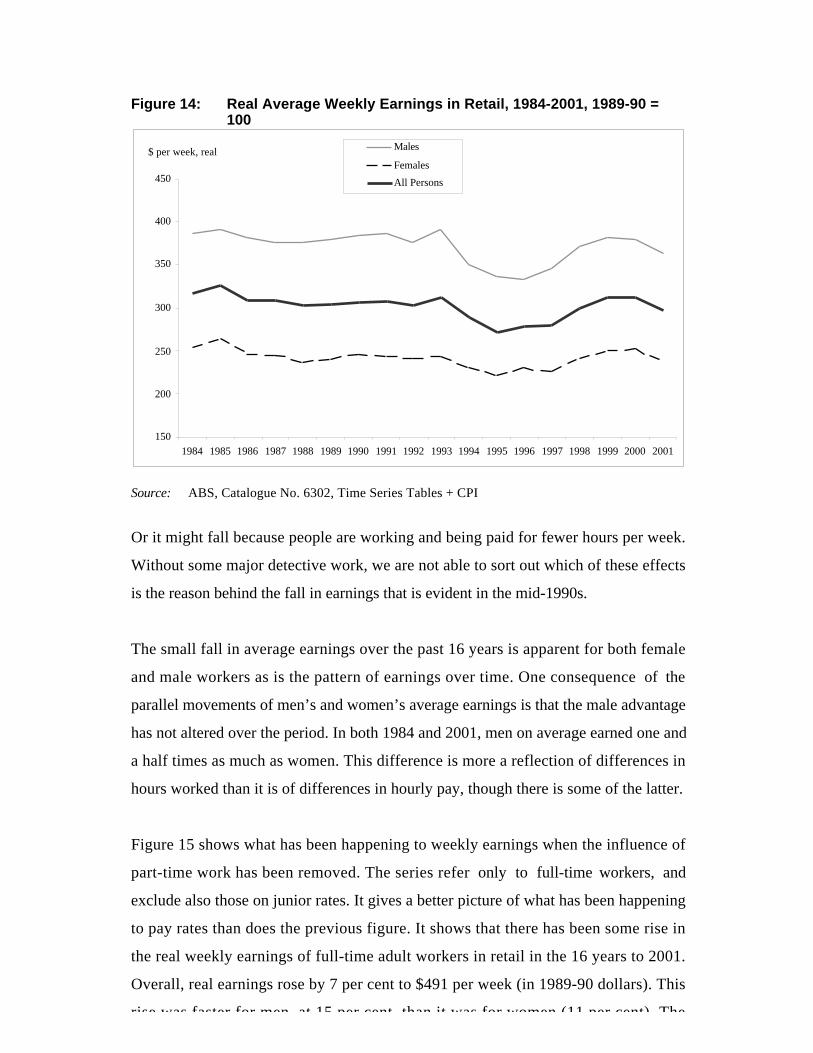
Figure 14: Real Average Weekly Earnings in Retail, 1984-2001, 1989-90 =100
150
200
250
300
350
400
450
1984 1985 1986 1987 1988 1989 1990 1991 1992 1993 1994 1995 1996 1997 1998 1999 2000 2001
$ per week, real Males
Females
All Persons
Source: ABS, Catalogue No. 6302, Time Series Tables + CPI
Or it might fall because people are working and being paid for fewer hours per week.
Without some major detective work, we are not able to sort out which of these effects
is the reason behind the fall in earnings that is evident in the mid-1990s.
The small fall in average earnings over the past 16 years is apparent for both female
and male workers as is the pattern of earnings over time. One consequence of the
parallel movements of men’s and women’s average earnings is that the male advantage
has not altered over the period. In both 1984 and 2001, men on average earned one and
a half times as much as women. This difference is more a reflection of differences in
hours worked than it is of differences in hourly pay, though there is some of the latter.
Figure 15 shows what has been happening to weekly earnings when the influence of
part-time work has been removed. The series refer only to full-time workers, and
exclude also those on junior rates. It gives a better picture of what has been happening
to pay rates than does the previous figure. It shows that there has been some rise in
the real weekly earnings of full-time adult workers in retail in the 16 years to 2001.
Overall, real earnings rose by 7 per cent to $491 per week (in 1989-90 dollars). This
rise was faster for men, at 15 per cent, than it was for women (11 per cent). The

aggregate rose by less than the amount for each of the men and women because the
proportion of women in the total rose over the period, reducing the earnings of the
average worker. It is clear from the figure that women earn considerably less than men,
even adults who work full-time. In 2003, the average full-time adult woman working in
retail earned 90 per cent of her male counterpart ($641 compared with $707, expressed
in 2003 dollars). This is higher than the 83 per cent of the male earnings that she
typically received in 1984.
While real average weekly earnings in retail have not changed much since 1984, the rest
of the economy has not stood still. In the figures below we show how earnings in retail
compare with earnings in the economy as a whole, and how this has changed over
time.
Figure 15: Real Average Weekly Earnings, Full-time Adults in Retail,1984-2001, Base 1989-90 = 100
350
400
450
500
550
1984 1985 1986 1987 1988 1989 1990 1991 1992 1993 1994 1995 1996 1997 1998 1999 2000 2001
$ per weekMales Females Persons
Source: ABS, Catalogue No. 6302, Time Series Tables + CPI
Figure 16 displays the movement of average weekly earnings for all employed persons
in retail, expressed as a fraction of the equivalent figure for all employed persons in the
whole economy. As with Figure 14, it includes employees and the self-employed, full
and part-time workers, men and women, youth and adults. The trend in relative
earnings is an amplified version of the trend in real earnings. Workers in retail earn
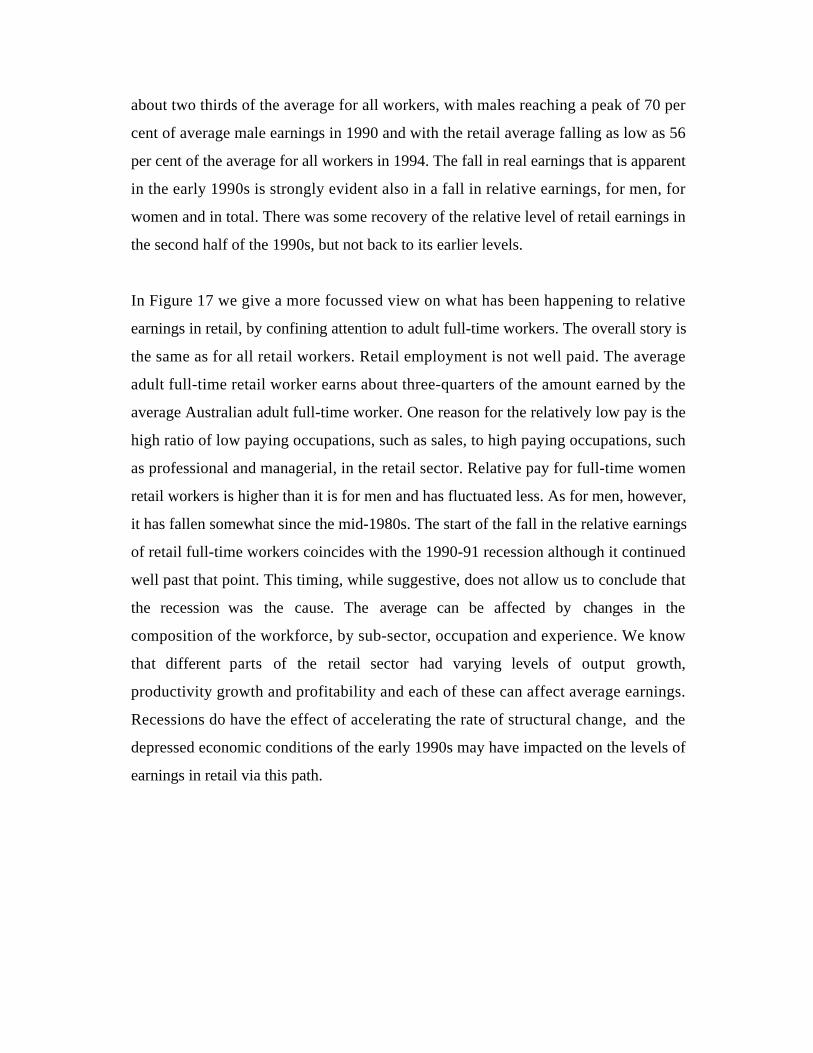
about two thirds of the average for all workers, with males reaching a peak of 70 per
cent of average male earnings in 1990 and with the retail average falling as low as 56
per cent of the average for all workers in 1994. The fall in real earnings that is apparent
in the early 1990s is strongly evident also in a fall in relative earnings, for men, for
women and in total. There was some recovery of the relative level of retail earnings in
the second half of the 1990s, but not back to its earlier levels.
In Figure 17 we give a more focussed view on what has been happening to relative
earnings in retail, by confining attention to adult full-time workers. The overall story is
the same as for all retail workers. Retail employment is not well paid. The average
adult full-time retail worker earns about three-quarters of the amount earned by the
average Australian adult full-time worker. One reason for the relatively low pay is the
high ratio of low paying occupations, such as sales, to high paying occupations, such
as professional and managerial, in the retail sector. Relative pay for full-time women
retail workers is higher than it is for men and has fluctuated less. As for men, however,
it has fallen somewhat since the mid-1980s. The start of the fall in the relative earnings
of retail full-time workers coincides with the 1990-91 recession although it continued
well past that point. This timing, while suggestive, does not allow us to conclude that
the recession was the cause. The average can be affected by changes in the
composition of the workforce, by sub-sector, occupation and experience. We know
that different parts of the retail sector had varying levels of output growth,
productivity growth and profitability and each of these can affect average earnings.
Recessions do have the effect of accelerating the rate of structural change, and the
depressed economic conditions of the early 1990s may have impacted on the levels of
earnings in retail via this path.

Figure 16: Average Weekly Earnings for All Persons Employed in theRetail Industry as a Proportion of the Average WeeklyEarnings for All Persons Employed in All Industries, 1984-2001
0.5
0.55
0.6
0.65
0.7
0.75
1984 1985 1986 1987 1988 1989 1990 1991 1992 1993 1994 1995 1996 1997 1998 1999 2000 2001
Year (May Figures)
Proportion
Av.wkly.erngs for males in retail as a proportion of that for all industries
Av.wkly.erngs for females in retail as a proportion of that for all industries
Av.wkly.erngs in retail as a proportion of that for all industries
Source: ABS, Catalogue No. 6302.0 , Average Weekly Earnings, Time Series Tables 10c, 10f and10i.
Figure 17: Average Full-time Weekly Earnings for Persons Employed inthe Retail Industry as a Proportion of the Average Full-timeWeekly Earnings for All Persons Employed in All Industries,1984-2001
0.72
0.74
0.76
0.78
0.80
0.82
0.84
0.86
1984 1985 1986 1987 1988 1989 1990 1991 1992 1993 1994 1995 1996 1997 1998 1999 2000 2001
Year (May Figures)
Proportion
Av.f/t.wkly.erngs for males in retail as a proportion of that for all industriesAv.f/t.wkly.erngs for females in retail as a proportion of that for all industries
Av.f/t.wkly.erngs in retail as a proportion of that for all industries
Source: ABS, Catalogue No. 6302.0 , Average Weekly Earnings, Time Series Tables 10b, 10e and10h.

References
Australian Bureau of Statistics (ABS) (1993), Australian and New Zealand Standard
Industrial Classifiction (ANZIC), 1993, Catalogue no. 1292.0.
ABS (1994), Retail Industry 1991-92: State and Territory Summary, Catalogue no.
8625.0.
ABS (2001), Small Business in Australia, Catalogue 1321.0: including some
unpublished data.
ABS (2001), Labour Force, selected summary tables, Time Series Data Tables.
Catalogue no. 6291.040.001.
ABS (2001), Average Weekly Earnings, Time Series Data, Catalogue no. 6203.0.
Barnes, P., Johnson, R., Kulys, A. and Hook, S. (1999), Productivity and the Structure
of Employment, Productivity Commission staff research paper, Ausinfo, Canberra.
Johnston, A., Porter, D., Cobbold,T. and Dolamore, R. (2000), Productivity in
Australia’s Wholesale and Retail Trade, Productivity Commission Staff Research
Paper, Ausinfo, Canberra.
Merrilees, B. and Miller, D. (1996), Retailing Management, A best practice approach,
RMIT Press, Victoria.