the results of treatment of cancer of the bladder—a clinical contribution to radiobiology
TRANSCRIPT

Clin. RadioL (1975) 26, 67-75
T H E R E S U L T S OF T R E A T M E N T OF C A N C E R O F T H E B L A D D E R - A C L I N I C A L C O N T R I B U T I O N T O R A D I O B I O L O G Y *
ROBERT M O R R I S O N
Hammersmith Hospital and Royal Postgraduate Medical School, Du Cane Road, Shepherds Bush, London W12 OHS
[ SHOULD like to thank the Faculty of Radiologists for inviting me to deliver this memorial lecture. This is an honour of which [ am deeply conscious - not only because it gives me an opportunity to talk on a subject in which I have had some interest but, also, because of its association with Dr Glyn Evans with whom 1 was privileged to have a close friendship and whose hospitality I enjoyed on many occasions.
As the older radiotherapists will know, Glyn Evans, who was only fifty at the time of his sudden death, was the Director of the Radiotherapy Department at Cardiff. He started his career at the Christie Hospital in Manchester, being one of the stars in a bright constellation of young radio- therapists who trained there after the war. He spent some time as Director at Nott ingham but soon returned to his native city of Cardiff. There- he set himself the task of reorganising the radio- therapy service on the lines of the Christie and planning a new department which was, in many respects, in advance of its time and which became a model from which others were planned later.
In the post-war years conditions were difficult and the development at Cardiff was due to his organising ability, his success at persuading others to undertake difficult tasks and his enormous energy.
The strain of these efforts undoubtedly took a toll on his health and may have contributed to his early death. In an article which he wrote in the British Journal of Radiology (1963) he told of the trying experiences and the many difficulties he had had to overcome and he reflected on how important it had been for him to be young and active, other- wise the task would have been impossible.
The photograph (Fig. 1) for which I am indebted to Dr Tom Deeley, is taken from a portrait which hangs in the Board Room at Velindre Hospital. This is Glyn Evans as we remember him in his later years at about the time he was Vice-President
* Glyn Evans Memorial Lecture given to a Joint Meeting of the Faculty of Radiologists, the British Institute of Radiology and the Scottish Radlological Society at Glasgow on 14 October 1972.
of the Faculty. Although it is a good likeness, I feel that in some respects sitting still while a portrait was painted was perhaps out of character and may have been an exasperating experience for such an active person. The energy which he could apply to any task he undertook was pro- digious while at the same time his efforts were accompanied by a light-hearted gaiety which endeared him to all his associates and his staff.
The last time he spoke at a meeting of radio- therapists was at the Radiotherapists Visiting Society at Hammersmith Hospital in 1961. At that meeting he showed examples of dose distribu- tions in bladder cancer worked out by a computer. This was one of his great interests and, at that time, a very new development. It is perhaps, there- fore, not inappropriate that the subject of this lecture should be on this same disease.
RADIOTHERAPY AND RADIOBIOLOGY
I think a word of explanation is needed for the second part of the title of this talk - 'A Clinical Contribution to Radiobiology'. Most of the know- ledge we have of radiation effects in the human subject has been obtained from the treatment of patients by methods which are largely empiric but have been made more precise by increasing accuracy in dose measurement and in dose distribution. Laboratory studies have extended our knowledge of the reaction which occurs in mammalian ceils and tissues and in animal tumours and have suggested methods of more effective cell killing. Up till now, however, these laboratory studies have given us a framework of ideas but the data obtained from them are insufficient to provide a quantitative basis for practical radiotherapy. We have not yet reached the stage of regarding the practice of radiotherapy as applied radiobiology.
The new information which may be obtained from a scientific approach to the treatment of patients is being appreciated increasingly and the conclusions, for example, f rom controlled trials and from observations and measurements made on patients undergoing planned schemes of
67

68 CLINICAL RADIOLOGY
treatment regimes. Because of the infinite variation in the presentation of human tumours and their response to radiation, however, the elucidation of useful data by application of scientific methods is made very difficult - generally much more work has to be undertaken to obtain valid data from a clinical investigation than from a laboratory experi- ment. The work of the scientist and the clinician should be complementary i the aim should be to create an environment in which there is a free two- way communication. While the findings from planned clinical trials designed to investigate the response of human tumours and normal tissues are of considerable interest to clinicians they may also supply a feed-back of information useful to the radiobiologist.
A CLINICAL TRIAL ON BLADDER CANCER
In this lecture I would like to report some of treatment will provide a more solid basis for
Fro. 1 Glyn Evans: from a portrait at Velindre Hospital.
the results obtained in a controlled trial on the treatment of a series of cases of bladder cancer and discuss some of the findings and their implications.
The data which I wish to present are based on work which we started at Hammersmith Hospital about ten years ago and which has now been completed, although many of the patients are still attending our clinics. I shall give only the essential details of the trial which will be published elsewhere in full and I shall select some of the findings which have a clinical and a scientific interest.
The objects of the trial were fairly simple. They were firstly, to investigate the dose of external radiation required to destroy bladder tumours and, secondly, to consider the tolerance dose levels of the normal bladder and the other pelvic organs which receive radiation during the treatment.
We were encouraged to carry out this trial for two reasons. The first was that we were uncertain of the optimum dose to give to tumours of the bladder. Dr Frank Ellis (1963) had sent a question- naire to seven major radiotherapy centres to find out the dose of external radiation they were giving to patients having radical treatment for this disease. In the replies he received the tumour doses ranged from 5000-6500 rad given in 21 to 49 days (15-35 fractions): the NSD ranged from 1733-2270 ret.
Secondly, in a series of cases which we had treated previously by supervoltage therapy, we observed a high incidence of late radiation effects arising some time after treatment, even in cases where the acute effects of treatment had not been unduly severe. At that time very little information was available about the tolerance of the pelvic tissues to supervoltage radiation.
The trial was set up with the object of comparing the results - particularly the cure rates and the complication rates - from two dose levels. As there was no information about optimum dosage a trial of this type seemed quite ethical, The doses chosen were those we had been using previously and a dose reduced by 750 rad : this difference was arbitrarily chosen but seemed to be the minimum that would show a significant difference in results.
As bladder tumours vary in their type and their extent we had to ensure that when we came to compare the results we would be comparing the response of similar turnouts. We therefore decided to 'pair' the cases so that for every case treated at the original dose level we had a similar case treated at a lower dose.
Before explaining the system of pairing of cases, I should like to tell you how the patients were selected for this trial.

T H E R E S U L T S O F T R E A T M E N T O F C A N C E R O F T H E B L A D D E R 69
S e l e c t i o n of Pa t i en t s . - F o u r cri teria were used in the selection of patients. Firs t , pat ients must be under the age of 75. Second, the diagnosis had to be proved histologically. Third, they must not have had any previous surgery except surgery or electro-cautery for diagnost ic purposes . Some had had a cys to tomy but none had had an excision of the t umour or a par t ia l cystectomy. Four th , the patients should no t suffer f rom any other disease which might affect their prognosis .
Turnout Characteristics. - To ensure similari ty between groups we divided the cases according to the fol lowing characterist ics which are known to influence the prognosis .
1. The stage of advancement of the disease. 2. The type of t umour as seen at cystoscopy, and 3. The histology.
(i) Stage o f Advancement o f the Disease. - The staging used was tha t described by Wal lace (1959) which is based on cystoscopic, r ad iograph ic and bimanual examinat ions. The cri teria for this staging can be summar ised as fol lows:
T1 Mucosal tumours which are limited to the mucosa and are freely mobile within the bladder. An intravenous pyelogram shows no significant dilatation of a ureter, and the biopsy does not show muscle infiltration.
Tz Muscular tumours. On bimanual palpation there is evidence of muscle involvement but the turnour has not yet penetrated the full thickness of the bladder wall. The biopsy may show muscle infiltration and there may be gross dilatation of the ureter.
Ta Peri-vesical turnouts where the tumour has spread through the bladder wall and its mass is greater on palpation than when seen cystoscopically. The external surface of the bladder is nodular and the ureter may be dilated but the tumour is still completely mobile in all directions.
T4 Pelvic fixation. The turnout is restricted in mobility in one or both planes of the pelvis. There may be invasion of the adjoining organs such as the vagina rectum or abdominal wall.
A l though this staging is different f rom the staging recommended by the Un ion In te rna t iona le Contre le Cancer, which was in t roduced in 1962, it has been re ta ined th roughou t the tr ial because of uniformity. In pract ice it is difficult to dis t inguish clinically between T1 and Tz turnouts and these were grouped together. There were, therefore three stage groupings: T1 T~, Ta and T4.
(ii) Type o f Tumour. - The second character is t ic used in 'pa i r ing ' was the type of turnout as seen cystoscopically. F r o n d e d or papi l la ry tumours are known to have a better prognosis than the solid or ' bun ' tumours when t reated either surgic- ally or by rad io the rapy (Riches, 1958; Mor r i son
and Deeley, 1965). Where poss ible the tumours were defined as papi l la ry or solid according to the appearance of the greater pa r t of the tumour . Ulcera ted tumours were classified as a th i rd group because o f their especially bad prognosis.
(iii) Histology. - The th i rd characterist ic we considered was the histology. The his tological pat terns were either t ransi t ional cell tumours which are the c o m m o n type in the bladder , ana- plast ic tumours where there was no cellular differentiation or squamous cell tumours . Adeno- carc inomas were excluded.
Pair ing . - There were, therefore, three stages of tumour , three types of t umour as seen cystoscopic- ally and three histological types, making 27 possible sub-divisions. Each pa t ien t suitable for the tr ial who compl ied with the cri teria was in- c luded in one o f these. There were no cases in some of the sub-divisions and in others there were only a few cases but it was necessary to keep them separate to avoid a possible bias in the results. The dose p lanned to be given was either 'h igh ' or ' low' and was decided by a method using r a n d o m numbers. I f one pat ient of a pa i r was selected for a high dose, the next having the same charac- teristics was given a low dose and these const i tu ted a ' pa i r ' o f cases. In Table 1 the number of pairs of cases is given. The total number of pa t ien ts is, o f course, double this number - 352. At the conclusion of the tr ial there were a number of unpa i red cases bu t these have been excluded in the present discussion.
I t will be seen tha t the largest number are t ransi t ional cell papi l la ry tumours in the T1 T2
TABLE l CARCINOMA OF BLADDER. N o . OF 'PAIRS' OF PATIENTS
Histology Type
Transitional Papillary Solid Ulcerated
Anaplastic Papillary Solid Ulcerated
Squamous Papillary Solid Ulcerated
I Total
T~ T2
37 8
2 3
2 2
54
Stage
T~
37 21
5
2 6 2
86
T4 Total
13 10 3 135
2 3 1 23
2 1 1 18
36 176

70 C L I N I C A L R A D I O L O G Y
and Ta stages. This does not, however, represent the distribution of cases of bladder cancer in hospital practice as a whole because many cases in the earlier stages are treated by surgery or by a combination of surgery and radiotherapy and do not come into this trial.
Technique and Dose . - The technique of treat- ment was similar to that described previously (Morrison and Deeley, 1965). The T1 T~ tumours were treated by a technique in which the aim was to irradiate the bladder only; for the Ta and T4 tumours wider fields were used to include the whole pelvic cavity. A four-field technique was used and daily fractions were given to all fields. In the overall time of four weeks, 20 fractions were received. The mean tumour dose for T1 T2 tumours was either 6250 rad or 5500 rad. For the Ta, T4 tumours the doses were either 5000 or 4250 rad. The doses with their NSD values using the Ellis equation ate given in Table 2. Dose = NSD (IN 0'24 x T0'11).
RESULTS
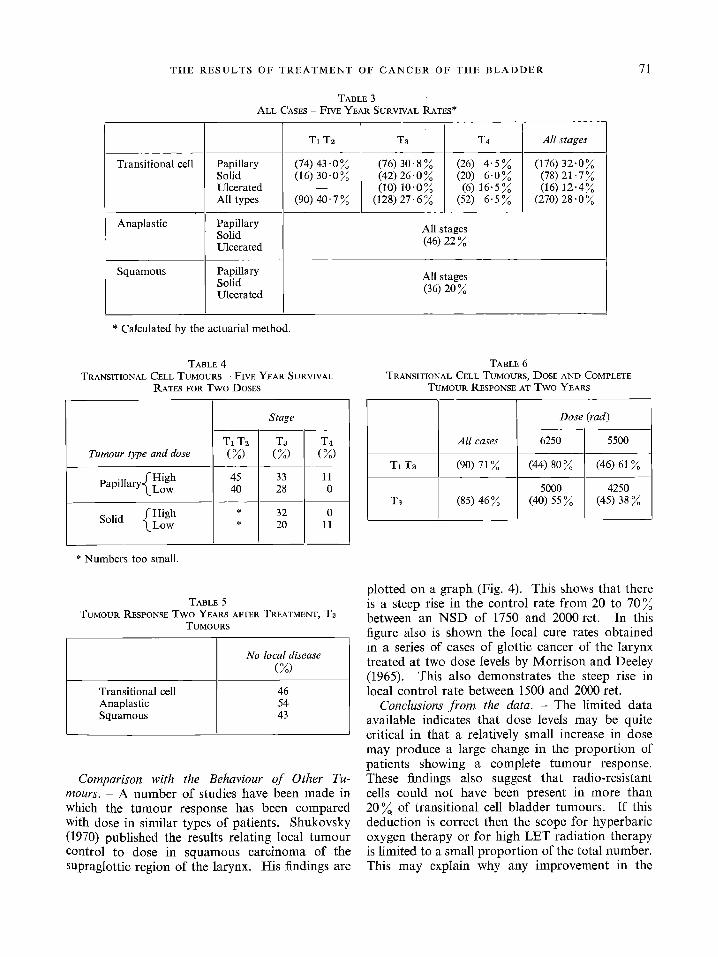
A. Survival. - The survival rates are not relevant to the main theme of this lecture but are shown because they demonstrate the effect of the change in dose. The survival rates for the groups are shown in Table 3. These figures suggest that patients with transitional cell tumours have a better survival rate than the anaplastic or squamous cell groups. Papillary tumours appear better than the solid and, as would be expected, the T1 Tz group has the highest rate of survival. Within each group half of the patients had a high dose and the other half a low dose. The effect of the dose on the survival rate is shown in Table 4. As the numbers are rather small in the anaplastic and squamous cell group the results for transitional cell tumours only are shown. The higher dose appears to give a higher survival rate. A small number of patients had a total cystectomy for recurrence but this did not influence the overall survival rates appreciably.
B. Local Tumour Control. - Although the survival rate is the important consideration for the clinician it may not always be a very good index of the effectiveness of a local method of treatment because death may not be caused by the local disease. 15 ~ of patient in this series died of causes other than cancer, and 5 ~ died of meta- stases although the primary site was free of tumour. I t is, therefore, worth investigating the primary tumour control rate rather than the survival rates
TABLE 2 DOSES AN~ NSD* (20 FRACTIONS IN 26-28 DAYS)
High Low
Dose NSD Dose NeD Stage (tad) (ret ) (rad) (ret )
T1 Tz 6250 2110 5500 1860 T3 T4 5000 1688 4250 1435
* Dose = NSD (N O. 24 x T o. 11).
to assess more accurately the value of a local method of treatment.
To investigate the tumour control rate in this series we have tried to obtain information about the state of the turnout by cystoscopic examination at regular intervals after treatment. Recently, cytological examination of the urine has reduced the number of cystoscopies performed. The figures shown in Table 5 are the result of observations made up to two years after treatment in the Tz tumour groups and can be taken as the primary tumour control rates at two years for the different histological types. Because many patients die during this period the proportion that recur is calculated on an actuarial basis and expressed as a percentage of those alive at 6, 12 and 18 months after treatment. An analysis of the T1 T2 and Ta transitional cell tumour, according to stage and dose, is shown in Table 6.
These percentages can be graphed against the dose of the NSD values (Fig. 2). I t will be noted that the tumour control rate rises from 38 ~ to 80 ~ over the range of from 4250 to 6250 rad.
There are few figures published in the literature with which to compare the present series. Walbom- Jorgensen (1972) reported the tumour response after radiotherapy in a series of 257 patients and Dick (1962) reported cystoscopic findings at two years on 38 Stages A, B1 and B2 cases using the Jewett (1958) classification (these are similar to T1 and Tz).
At a lower dose level further evidence on the relationships between dose and tumour response can be obtained in patients having pre-operative radiotherapy. Whitmore et al. (1968) found that 15 out of 128 patients (12~) receiving a dose of 4000 rad given by 20 fractions in four weeks, had no tumour cells in the cystectomy specimen. In a similar investigation Sagerman et aL (1968) found that six out of 49 (12 ~ ) were free of disease after 3000-3500 rad. These results are shown in Table 7 and plotted on Fig. 3.
THE R E S U L T S OF T R E A T M E N T OF C A N C E R OF THE B L A D D E R
TABLE 3 ALL CASES -- FIVE YEAR SURVIVAL RATES*
71
Transitional cell
Anaplastic
Squamous
Papillary Solid Ulcerated All types
Papillary Solid Ulcerated
Papillary Solid Ulcerated
T1 T2
(74) 43.0 % (16) 30-0%
(90) 40- 7 %
T8
(76) 30.8 % (42) 26.0 % (10) 10-0%
(128) 27- 6 %
T4
(26) 4.5% (20) 6-0 % (6) 16.5%
(52) 6.5%
All stages (46) 22 %
All stages (36) 20 %
All stages
(176) 32"0% (78) 2l-7% (16) 12"4%
(270) 28" 0 %
Calculated by the actuarial method.
TABLE 4 TRANSITIONAL CELL TUMOURS -- FIVE YEAR SURVIVAL
RATES FOR TWO DOSES
Tumour type and dose
PapillarY(LHoigw h
fHigh Solid ~Low
T1 T2 (%)
45 40
Stage
T3 (%)
33 28
32 20
T4 (%)
11 0
0 11
* Numbers too small.
TABLE 5 TUMOUR RESPONSE TWO YEARS AFTER TREATMENT, Ta
TUMOURS
Transitional cell Anaplastic Squamous
No local disease (%)
46 54 43
Comparison with the Behaviour o f Other Tu- mours. - A number of studies have been made in which the tumour response has been compared with dose in similar types of patients. Shukovsky (1970) published the results relating local tumour control to dose in squamous carcinoma of the supraglottic region of the larynx. His findings are
TABLE 6 TRANSITIONAL CELL TUMOURS, DOSE AND COMPLETE
TUMOUR RESPONSE AT TWO YEARS
All cases
T1 T2 (90) 71%
T3 (85) 46%
Dose (rad)
625O 5500
(44) 80% (46) 61%
5000 4250 (40) 55 % (45) 38 %
plotted on a graph (Fig. 4). This shows that there is a steep rise in the control rate from 20 to 70 % between an NSD of 1750 and 2000 ret. In this figure also is shown the local cure rates obtained in a series of cases of glottic cancer of the larynx treated at two dose levels by Morrison and Deeley (1965). This also demonstrates the steep rise in local control rate between 1500 and 2000 ret.
Conclusions f rom the data. - The limited data available indicates that dose levels may be quite critical in that a relatively small increase in dose may produce a large change in the proportion of patients showing a complete turnout response. These findings also suggest that radio-resistant cells could not have been present in more than 20 % of transitional cell bladder turnouts. If this deduction is correct then the scope for hyperbaric oxygen therapy or for high LET radiation therapy is limited to a small proportion of the total number. This may explain why any improvement in the

72 CLINICAL RADIOLOGY
100
100%
80%
~ 60%
o
40%
E
~- 20%
/ O
1000 2000 N.S.D. I I I I J t
1 2 3 4 5 6 x l 0 0 0 rad dose
FIG. 2 Local tumour control and dose: graph of data from Table 6.
80 v 0)
60 O
c
8 -~ 40 0 E
F- 2O
Dick
[] Whitmore et al l ~
• Present series
. f o Watbom Jorgensen
[] Sagerman et al
. / /
0 L 10100 i i 2000 ret
Dose--N.S.D.
FIG. 3 Local turnout control and dose: graph of data from Table 7.
10
O
E 0'8
oo c 0"6
~3 0.4 >~
15 Z O
0 2
m - - I i Ca. la rynx-g lo t t i c (Morrison and Deeley)
o - - - ~ Ca. la rynx-suprag lo t t ic (Shukovsky)
c-----o Present series
m /
///,, I I ] I 6
I I
100o 2000 N.S.D.
Fie. 4 Dose and probability of local turnout control for glottic,
supraglottic and bladder tumours.
4O%
e 30%
g
20%
E 3 10%
./ /
. / "1000 2000 N.S.D.
I I I I I I
1 2 3 4 5 6 1000 rad Dose
F]~. 5 Complication rates and dose in present series
(data from Table 8).

THE RESULTS OF TREATMENT OF CANCER OF THE BLADDER 73
40%
30%
f , 20%
E g,
10%
© Cuccia,Jones and Crigler
o Leigner Taylor and Michaud
• Miller and Jones
• Goodman and Balfour n ]
J ® Laing and Dickinson
• Van der Werf-Messing
[] Present series / ® /
o •
.¢. . /
A
100%
f I I I
0 500 1000 1500 2000
N.S,D,
Fro. 6 Complication rates and dose in reported series
(data from Table 9).
I 80%
60%
40%
20%
0 ret
o - - - o Tumour control
e ~ e Complication rate (composite curve)
A-----A Complication rate o (present series) /
/ j #
j o q;/
J t
/
°1 A!)oA
. / I r
1000 2000
Dose-N.S,D.
FIG. 7 Tumour control and complication rate
(data from Figures 2 and 6).
results of bladder cancer, from the use of hyperbaric oxygen, has been difficult to demonstrate.
C. The Complication Rates. - I should now like to turn to another aspect of treatment which we have to consider, namely the complication rates associated with the treatment at the different dose levels. I have chosen to record only the late complications, i.e. those which come on several weeks or months after the treatment. [ have also limited my observations to complications of major severity - these are the complications which require treatment, often surgical, or may even be the cause of the patient's death. These include intestinal obstruction, fistula formation, bladder contracture and haemorrhage. The complication rates obtained in the four groups of cases are shown in Table 8 and presented in graph form in Fig. 5.
I have also collected from the literature the major complication rates reported by other writers on this subject and these are listed in Table 9.
When these are plotted on a graph (Fig. 6) against the dose in ret and the best line drawn through the points, it would appear that there is a steep rise in complication rates at the 1900 to 2000 ret level.
D. Selection of Optimum Dose. - The curves for tumour control rate and for complication rate
in relation to tumour dose can be represented on the same graph (see Fig. 7). For any level of dose, the expected turnout control rate and the complication rate can be determined (see Table 10). A comparison of these two rates may be regarded as a therapeutic ratio. In the treatment of bladder cancer if one wishes to avoid any complications the dose which may be given is very small and the chance of obtaining a local cure would also be rather small. In practice, one has to decide on the complication rate which is deemed permissible and from the curve derive the dose which should be prescribed. Within each group it is likely that some types of tumour will be more sensitive and others more resistant than the average. Analysis of results in a larger series, however, would be needed to identify them.
DISCUSSION
I would like to suggest that this method of expressing tumour response and the associated complication rate is necessary when one wishes to compare two methods of treatment. To select one dose level only might give misleading results because the dose chosen may not be the optimum for the particular tumour, and an apparent ad- vantage of a new method under trial over a control

74 C L I N I C A L RADIOLOGY
TABLE 7 DoSE AND TUMOUR CONTROL RATE
(a) Radical radiotherapy Dick (1962)
Walbom-Jorgensen (1972)
(b) Pre-operative radiotherapy Whitmore et al. (1968) Sagerman et aL (1968)
Dose
Rad
6000-6250 in 25-35 fractions
6000 in 25 fractions
4000 in 20 fractions 3000-3500 in 15-18
fractions
Ret
1874-1952
1874
1350 1160 1356
% with no local r e c l l r r e n c e
bladder
71
61
12 12
TABLE 8 ALL CASES - MAJOR COMPLICATION RATES
Rate all cases
(%)
36
High dose (6250 rad)
(%)
Low dose (5500 tad)
(%)
T1 Tz 37 35
(5000 rad) (4250 rad) Ta T4 13 16 9.6
TABLE 10 COMPLICATION AND TUMOUR CONTROL RATES AT
DIFFERENT DOSE LEVELS
Major Tumour complication control rate
rate (%) (%)
5 53 7 59
10 61 15 65 20 69 40 75
NSD
1700 1740 1790 1860 1900 2000
Tumour close in 25 fractions over
35 days
5400 5550 5750 5950 6100 6400
series may be because the control method was sub-optimal. To be able to make a valid com- parison, therefore, between two methods of treat- ment one must know the relationship between dose and the local results - both tumour control rate and complication rate, for each method. To obtain these it is necessary to have results at, at least, two dose levels so that the slope of the response curves for the tumour and the normal tissue can be determined and compared. This
inevitably means that controlled clinical trials comparing two methods of treatment become much more complex and require a larger number of patients than is at present considered necessary.
Mr President, I have touched briefly on some of the data which may be obtained from an analysis of response of one type of tumour and perhaps this expresses quantitatively much of what those experienced in this work already know. Analyses of this type would be most useful when we are
TABLE 9 LATE COMPLICATION R_ATES AND DOSE REPORTED SERIES
Cuccia et al. (1958) Liegner et al. (1962) Miller and Jones (1962) Goodman and Balfour (1964) Laing and Dickinson (1965)
Van der Werf-Messing (1965){
Dose
6000 6000 6000 5000 7500 5000 5500 6000 6500
Overall No. of time fractions
35 25 42 3O 35 25 21 15 49 35 35 25 35 25 42 3O 42 30
NSD
1874 1758 1874 1870 2080 1560 1717 1760 1900
Complication rate (%)
9 5
13.5 21 24
6 17 15 27

THE RESULTS OF TREATMENT OF CANCER OF THE BLADDER 75
looking for a base line by which the newer de- velopments in radiotherapy may be assessed. There is a welter of new ideas and methods of t reatment which will need to be investigated, and it is impor tant to have an accurate base line from which comparisons can be made. We have accepted the idea that the only satisfactory way to assess new methods is by a controlled clinical trial. This is currently being pursued with hyperbaric oxygen, with high LET radiat ion and with com- binations of radiotherapy and chemotherapy.
In conduct ing these trials we should know, but I am afraid in many instances we do not know, the technique we should use to obtain the best results in the control group. After we have laboriously carried out a trial, and if the results of the new method show that a better survival rate or local cure rate has been obtained, we may be asked if just as good results could not have been obtained by simpler methods, for example by changing the fractionation or the dose rate or simply by changing the dose. We still do not have enough data about turnout response from conventional therapy and it is only when we try to compare newer methods with established conventional methods as controls that we are finding that much fundamenta l know- ledge about the effects on normal tissues and common turnouts still needs to be worked out.
REFERENCES CUCClA, C. A., JONES, S_ & CRIGLER, C. M. (1958). Clinical
impressions in 100 consecutive cases of carcinoma of the urinary bladder treated by supervoltage. Journal of Urology, 79, 99-109.
DtCK, D. A. L. (1962). Carcinoma of the bladder treated by
external irradiation. British Journal of Urology, 34, 340-350.
ELLIS, F. (1963). Bladder neoplasms - a challenge to the radiotherapist. Clinical Radiology, 14, 1-16.
ELLIS, F. (1969). Dose, time and fractionation. A clinical hypothesis. Clinical Radiology, 20, 1-7.
EVANS, G. C. D. (1963). The planning of a new radiotherapy department. British Journal of Radiology, 36, 327-339.
GOODMAN, G. B. & BALFOUR, J. (1964). Carcinoma of the bladder: cobalt therapy. Journal of Urology, 92, 30-36.
JEWETT, H. J. (1958). The surgical treatment of carcinoma of the bladder_ Journal of Urology, 79, 87-93.
LA1NG, A. H. & DZCKINSON, K. M- (1965). Carcinoma of the bladder treated by supervoltage irradiation. Clinical Radiology, 16, 154 164_
LIEG~R, L. M_, TAYLOR, J. A. & MrCHAUD, N. J. (1962). Supervoltage cobalt 60 treatment of bladder cancer. Journal of Urology, 87, 373-380.
MILLER, L_ S. & JONES, J. S. (1962). Teamwork in super- voltage irradiation in carcinoma of urinary bladder_ Texas Journal of Medicbte, 58, 716-720.
MORRISON, R. & DEELEY, T. J. (1965). The treatment of carcinoma bladder by supervoltage X-rays. British Journal of Radiology, 38, 449-458.
RICHES, E. (1958). Malignant disease of the urinary tract. Lancet, 2, 537.
SAGERMAN, R. H., VEENEMA, R. J., GUTTMAN, R., DEAN, A. L. & USON, A. C. (1968). Pre-operative irradiation for carcinoma of the bladder. American Journal of Roent- genology, 102, 577.
Srft:KOVSKY, L. J. (1970). Dose, time, volume relationships in squamous cell carcinoma of the supraglottic larynx. American Journal of Roentgenology, 108, 27-29.
VAN DER WERF-MESSING, B. (1965). Telecobalt treatment of carcinoma of the bladder_ Clinical Radiology, 16, 165-172.
WALBOM-JoRGENSEN, S. (1972). Treatment of bladder carcinoma with 6 MeV linear accelerator. Scandinavian Journal of Urology and Nephrology, 6, Supp. 15, 113-119.
WALLACE, D. M. (1959). In Tumours of the Bladder, ed. Wallace, D. M_, pp. 201-217. Livingstone, Edinburgh.
WHITMORE, W_ 1~., GRABSTALD, H., MACKENZIE, A- R., ISWARIAH, J. (~ PHILLIPS, R. (1968). Pre-operative irradiation with cystectomy in the management of bladder cancer. American Journal of Roentgenology, 102, 570-576.