the report of the cauvery water disputes tribunal with … · the report of the cauvery water...
TRANSCRIPT

THE REPORT
OF
THE CAUVERY WATER DISPUTES
TRIBUNAL
WITH THE DECISION
IN THE MATTER OF WATER DISPUTES REGARDING THE INTER-STATE RIVER CAUVERY
AND THE RIVER VALLEY THEREOF
BETWEEN
1. The State of Tamil Nadu
2. The State of Karnataka
3. The State of Kerala
4. The Union Territory of Pondicherry
VOLUME III
AVAILABILITY OF WATER
NEW DELHI 2007
ii
VOLUME III
Availability of Water
(Issues under Group II)
I N D E X
Chapter Subject Page Nos. No 1 Surface Flows 1 - 79 2 What should be the basis on which the 80 - 101 availability of waters be determined for apportionment - whether at 50% or 75% 3 Ground Water - whether an additional/ 102 - 173 alternative resource ________

1
Chapter 1
SURFACE FLOWS The yield of a river system is the annual virgin flows at its terminal site.
The yield or the total available quantum of water in a river system depends upon
rainfall pattern, catchment area characteristics including soil and vegetal cover,
and various climatic parameters affecting evaporation and evapo-transpiration in
the basin. The annual yield of a given basin varies from year to year depending
upon the occurrence of the rainfall, its intensity and distribution in time and
space. In a virgin river system, i.e., a river basin where the natural river flows
have not been withdrawn for any use, the assessment of the total yield becomes
easy, based on the gauge and discharge observations. However, such a
situation is hard to come across, because practically in every river system, there
have been withdrawals of water for different uses by man. Therefore, to assess
the available yield in a river system, the observed flows at different gauge and
discharge sites have to be considered along with the withdrawals of water for
different uses like irrigation, hydro-power generation, domestic and industrial
water use etc. above each such gauging station. The computation of total
annual flow including upstream withdrawals at the terminal site is termed as yield
of the river system. Since the annual yield of a river varies from year to year
depending upon the rainfall distribution, consequent run-off and withdrawals etc.,
such data is collected for a number of years to assess the reliable yield. In order
to take care of wet and dry cycles, and to even out their effect, it is preferred that
data for as many years as is available should be considered, provided that data
is homogeneous and reliable.

2
2. For more than a century disputes are being raised between the then
States of Madras and Mysore now the States of Tamil Nadu and Karnataka in
respect of sharing of the waters of river Cauvery. Such disputes are often
raised when an inter-State river or international river passes through different
States or nations. Courts are faced with the situation as to how to sort out the
claim of each State or the nation, as the case may be, on some reasonable and
rational basis. These disputes obviously are linked with more demand for the
water of such inter-State or international rivers in connection with different
development projects including generation of electricity. Each State or country
through which inter-State or international river passes treats the water within
their State or nation as a divine gift which has to be utilised by that State or
nation exclusively for its development and to fulfil its necessities. In this process,
the upper riparian States are in privileged position as upper riparian State claims
exclusive right to utilise the water within its territory. This attitude is bound to
affect the lower riparian State if the water in such river is not sufficient to cater
the needs of all States through which such river passes. A booster came in
the year 1895 to such claims and rights for exclusive use of the water of the river
by a particular State irrespective of the necessity and need of the lower riparian
States when the Attorney General Harmon of the United States put forward a
doctrine that riparian States have exclusive or sovereign rights over the water
flowing through their territories. There was a clear anomaly in this doctrine while
implementing the same specially in cases where the water of such river was not
sufficient for all the States through which it passed. In many cases, it was
discovered that total appropriation of the water by upper riparian State led to

3
deprivation of the right to use of the water of such inter-State river by lower
riparian State. The higher riparian State claimed its exclusive right to utilise the
waters on basis of the aforesaid Harmon doctrine claiming that it had sovereign
right to utilise the water in whatever manner it likes within its territorial
jurisdiction. On the other hand, the lower riparian States asserted that they
were entitled to water of such inter-State or international rivers in their natural
flow without any interference or alteration in their character. Both types of claims
and assertions by the upper riparian and lower riparian States created not only
disharmony, but also anomaly. At different forums thinking started, that when
the nature had provided such inter-State or international rivers for common
benefit of the community as a whole through whose territory they flowed how
any territory through which such rivers pass could be deprived or could be
given the exclusive right to utilise the waters of such rivers.
3. In one of the earlier cases, in which the Supreme Court of United
States had to consider this question is Kansas v. Colorado {206 U.S.46 (1906)}
and the conflicting claims by upper and lower riparian States was resolved.
That case and other cases which followed thereafter including the opinion of the
Supreme Court in a reference under Article 143 of the Constitution by the
President of India in connection with this very river Cauvery have been discussed
in chapter under the heading ‘Principles of apportionment of waters of an inter-
State river’. On the basis of those judgments now it can be said that it is almost
settled that right of a State through which an inter-State river flows is subject to
certain restrictions with respect to the quantity of water which the said State is
entitled to receive or utilise. The other riparian States have the same right in

4
respect of the reasonable enjoyment of it. Each riparian State has a right of
action in respect of any unreasonable use of the water by another riparian State.
A higher riparian State must not use the water so as to cause any material injury
to the lower riparian State which has the equal right to use of the water. The
cardinal rule underlying between the different riparian States in respect of use of
the water of an inter-State river is that of equality of right. Each State stands on
the same level with all the rest. This principle is being described as the principle
of equitable apportionment between the different riparian States in respect of the
waters of an inter-State river. No doubt, the principle in respect of equitable
apportionment of the water is settled, but what shall be the equitable
apportionment in respect of different riparian States so far the water of such
inter-State river is concerned is itself a big question. It becomes all the more
complicated if the apportionment of the waters relates to a river which does not
have enough water to cater the needs of different riparian States. Cauvery is
one such river. If each riparian State starting from Kerala, Karnataka, Tamil
Nadu and Union Territory of Pondicherry wish to utilise its water to their
satisfaction and desire, it cannot fulfil their need and necessity. It is not in
dispute that the total amount of water available in river Cauvery through surface
flows and alternative resources are much less than what the different States
claim and require for their irrigation, electricity, drinking water and to run different
projects. In this background, the task of the Tribunal has become very difficult
as to how to apportion the waters of river Cauvery between the different States
so that river Cauvery remains a blessing and not a river of sorrow for these
States.

5
4. In order to settle the dispute between the different riparian States like
States of Kerala, Mysore, Tamil Nadu regarding sharing of the waters of the
Cauvery and its tributaries, efforts were being made by the then Minister of
Irrigation Dr. K.L. Rao and in that connection a meeting was held on 29th May
1972 at New Delhi between the Chief Ministers of Mysore, Tamil Nadu and
Kerala. The Union Minister for Irrigation and Power alongwith others were
present in the said meeting. The notes of discussions regarding Cauvery held on
the said date were duly recorded and were signed by the Union Minister for
Irrigation and Power and the three Chief Ministers of Mysore, Tamil Nadu and
Kerala. It is advisable to reproduce the same which is as follows:
“Union Minister for Irrigation and Power stated that river problems are
best settled through negotiations and this was the course the Central
Government was adopting for the last few years in settling the
differences on the use of waters of Cauvery. Earlier, it was aimed to
arrive at an interim agreement to be valid till 1974, when the earlier
agreement of 1924 would have come up for review after 50 years, as
provided in the agreement. Now, as 1974 is near, this attempt has been
given up in favour of finding an overall approach to solve the problem
amicably amongst the several States. The discussions amongst the
Chief Ministers revealed general consensus on the three following
points as in para 2.
2.1 A serious attempt should be made to resolve by negotiations
the Cauvery dispute between the States as early as
possible.
6
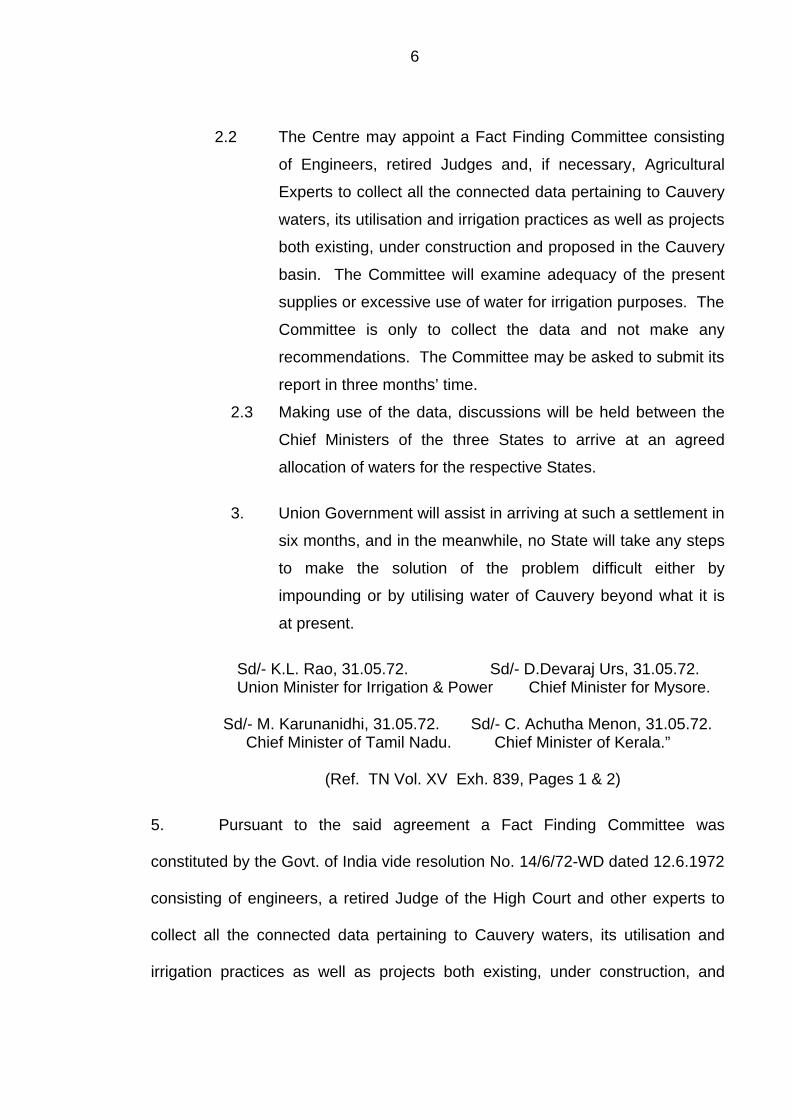
2.2 The Centre may appoint a Fact Finding Committee consisting
of Engineers, retired Judges and, if necessary, Agricultural
Experts to collect all the connected data pertaining to Cauvery
waters, its utilisation and irrigation practices as well as projects
both existing, under construction and proposed in the Cauvery
basin. The Committee will examine adequacy of the present
supplies or excessive use of water for irrigation purposes. The
Committee is only to collect the data and not make any
recommendations. The Committee may be asked to submit its
report in three months’ time.
2.3 Making use of the data, discussions will be held between the
Chief Ministers of the three States to arrive at an agreed
allocation of waters for the respective States.
3. Union Government will assist in arriving at such a settlement in
six months, and in the meanwhile, no State will take any steps
to make the solution of the problem difficult either by
impounding or by utilising water of Cauvery beyond what it is
at present.
Sd/- K.L. Rao, 31.05.72. Sd/- D.Devaraj Urs, 31.05.72. Union Minister for Irrigation & Power Chief Minister for Mysore. Sd/- M. Karunanidhi, 31.05.72. Sd/- C. Achutha Menon, 31.05.72. Chief Minister of Tamil Nadu. Chief Minister of Kerala.”
(Ref. TN Vol. XV Exh. 839, Pages 1 & 2) 5. Pursuant to the said agreement a Fact Finding Committee was
constituted by the Govt. of India vide resolution No. 14/6/72-WD dated 12.6.1972
consisting of engineers, a retired Judge of the High Court and other experts to
collect all the connected data pertaining to Cauvery waters, its utilisation and
irrigation practices as well as projects both existing, under construction, and

7
proposed in the Cauvery basin. The Committee was only to collect the data and
not to make any recommendation. The terms of the reference of the Committee
were:
“(i) To collect all the connected data pertaining to Cauvery waters; its
utilisation at different points of time; irrigation practices; as well as
projects both existing, under construction, and proposed in the
Cauvery basin.
(ii) to examine adequacy of the present supplies or excessive use of
water for irrigation purposes.
(iii) to collect data relevant to the use of water in different States like
the physical and other features; cultivated areas; existing and
proposed uses for domestic and industrial water supply; hydro-
electric power generation, navigation, salinity control and other
non-irrigation purposes.
(iv) Any other connected matters.”
The Committee was to commence its work with effect from 15th June 1972 and to
submit the report to the Government of India by 15th September 1972. The
Central Water and Power Commission was asked to provide technical and
secretarial staff for assisting the Committee.
6. As the data from the different States were not received by 15th
September 1972 the term of the Committee was extended upto 15th December
1972. The data were received from Kerala on 21st September 1972; from
Mysore on 19th October 1972 and from Tamil Nadu on 24th October 1972. Both
Mysore and Tamil Nadu supplemented their data during the discussions with the
Committee at New Delhi from 7th to 14th November 1972.

8
7. During the discussions with the Cauvery Fact Finding Committee, the
States of Kerala, Tamil Nadu and Mysore filed statements giving their
assessment of the total yield in the Cauvery basin. According to the State of
Kerala, the total yield of the Cauvery basin was 663.24 TMC; according to the
State of Tamil Nadu, the total yield was 600 TMC; and so far as the State of
Mysore was concerned, according to them, the total yield of the whole Cauvery
basin was 760 TMC. In the statements, the three respective States also gave
break-up of the yield in the three States separately and then the total thereof
(Vide page 113, 115, & 117 of TNDC Volume XIV). In the proceedings of the
meeting held on 10.11.1972 at New Delhi with the Cauvery Fact Finding
Committee, the fact that the yield calculations were presented by the Mysore
representatives is also recorded as under:-
“The Mysore representatives then furnished the yield calculations for
the Cauvery Basin in Mysore, Kerala and Tamil Nadu and according
to this statement, the total yield worked out for the whole of the
Cauvery Basin is 760 TMC.”
8. Some clarifications had been asked from the States during the
discussions and during the visit of the Committee to Mysore and Tamil Nadu. In
the report the Committee has pointed out that the data supplied by the three
States was in 20 volumes. Apart from that, the States also gave the project
reports for study of the Committee which was in 36 volumes. After careful
examination and scrutiny, the Committee submitted its report on 15th December
1972. During this period the members of the Committee visited different States
and sites for collecting the data on different questions including the availability of
the total run-off i.e. water in the Cauvery basin. In view of the stand taken by the

9
three States the Committee thought it advisable to scrutinise the data with a
special reference to the years 1901, 1956 and 1971. As desired by the different
States to inspect the data supplied by the other States the Committee made
available the data supplied by different States for inspection of the other States
and permitted to offer their comments which the Committee had taken into
consideration. The Committee had pointed out that discussions were held in
cordial and free manner with exchange of data and clarifications. After
discussions it was decided that periods for consideration of the water uses
should be considered with a specific reference to the years 1901, i.e. the
commencement of the century , 1956 at the time of the re-organisation of the
States and at the mid-point of these two (i.e. 1928) and then lastly in the year
1971. The States supplied revised figures of withdrawal and areas under
irrigation for these periods and these data were also exchanged between the
States. The Committee also took into consideration report of the Second
Irrigation Commission 1972 which had dealt at length with the problems of these
States and particularly of the Cauvery basin. They also collected relevant
material available with the Planning Commission, Central Water and Power
Commission, Ministry of Irrigation and Power, Ministry of Food and Agriculture,
Registrar of India, India Meteorological Department, Water Technology Centre of
I.A.R.I. and other sources.
9. It will appear from the report of the Committee that it is very exhaustive
and illuminative with all the relevant data on different questions that have been
furnished. In the beginning, the details of the Cauvery basin with reference to
the different States and areas within those States have been mentioned;

10
thereafter the Cauvery river system has been discussed in detail mentioning the
origin of river Cauvery and its different tributaries in different States. Thereafter
the claims presented by the States on Cauvery waters have been discussed.
First, the case of the Kerala has been discussed on the basis of Memorandum
submitted before the Committee. In the said Memorandum it had been
impressed that though the catchment area in Kerala territory is the least but
substantial contribution to the total run-off (as much as one-third) was being
made by the catchment lying in Kerala on account of very high rain-fall in the
said area. After mentioning the requirement of Kerala for water for successful
paddy cultivation and hydro-power resources and generation it has been said
that according to the Government of Kerala their territory contributes about 214
TMC of water to the Cauvery basin out of which they propose to utilise 208.7
TMC for irrigation and power production including 50.7 TMC for diversion from
east to west.
10. The State of Mysore claimed that it needed water for irrigation and
domestic water supply for the State which in future shall be about 410 TMC
against their estimated contribution of 480 TMC.
11. Tamil Nadu claimed that it had very few water resources and the
Cauvery delta was a rice bowl of the State where bulk requirement of rice is
produced. Although there were other rivers in the State, but Cauvery was the
only dependable one. It was also said on behalf of the Tamil Nadu that for
dependable supplies to the delta the State had to depend on upstream
catchment in Kerala and Mysore. According to the Tamil Nadu their present use
at that time was 573.4 TMC and the ultimate planned utilisation to meet the

11
needs of irrigation, domestic, industrial uses etc. could be 641.5 TMC. The
Committee has noted that according to Tamil Nadu schemes for modernisation
have been taken up and in that connection it has been stated:
“..........To improve the existing irrigation and achieving better water
management control; to avoid over-withdrawal by some areas and to
avoid complaints at the tail end, the Cauvery Delta system is
proposed to be modernised. This shall be achieved by construction
of several important works including sinking of filter points to provide
irrigation supplies in early nursery period and late maturity periods
when it may not be possible to release waters from Mettur.” (Ref. TN
Vol. XV, Exh. 840, Page 43, Para 4)
12. Then the Committee has said under heading ‘Total requirements of
Cauvery Waters as claimed by the States’ as follows:
“It can be seen from the above that according to the
Government of Kerala the present use of Cauvery waters within that
State is 142 M.cu.m. (5 TMC) and the ultimate planned utilisation to
meet the needs of irrigation, power production (by westward
diversion), domestic and industrial uses etc. would be 5910 M.cu.m.
(208.7 TMC).
According to the Government of Mysore their present use is
4848 M.cu.m. (171.2 TMC) and the ultimate planned utilisation to
meet the needs of irrigation, domestic and industrial uses etc. would
be 11613 M.cu.m. (410.1 TMC).
According to the Government of Tamil Nadu their present use is
16237 M.cu.m. (573.4 TMC) and the ultimate planned utilisation to
meet the needs of irrigation, domestic and industrial uses etc. would
be 18168 M.cu.m. (641.5 TMC) (including requirements of
Pondicherry).

12
According to these claims the total planned proposed utilisation,
after taking into account existing projects, projects under construction
and future projects by the three States would thus be 35693 M.cu.m.
(1260TMC) from the Cauvery waters. This is made up of 1435.7
M.cu.m. (50.7 TMC) for power generation by westward diversion,
26321 M.cu.m. (929 TMC) for Major and Medium irrigation works in
the Cauvery Watershed, 1246 M.cu.m. (44 TMC) for irrigation use
outside the Cauvery Watershed, 3846 M.cu.m. (135.8 TMC) for minor
irrigation works, 1218 M.cu.m. (43 TMC) for reservoir evaporation
losses and 1614 M.cu.m. (57 TMC) for domestic and industrial
requirements.
Thus the total present utilisation of Cauvery waters as indicated
by the States is about 21238 M.cu.m. (750 TMC) against the total
planned use of 35693.00 M.cu.m. (1260 TMC).” (Ref. ibid. Pages
43-44)
13. It may be pointed out that before the Committee the State of Kerala
had admitted that by the year 1972 they were utilising 5 TMC of the water only.
Similarly, Mysore had admitted that they were utilising only 171.2 TMC. Tamil
Nadu, however, was utilising 573.4 TMC. Taking all present utilisation the
Committee recorded that the present utilisation was 750 TMC although the total
planned use was 1260 TMC. Again at page 51 of TN Vol. XV under the heading
‘SUMMARY OF EXISTING IRRIGATION AND OTHER CONSUMPTIVE USES’ the
present use of the waters of the Cauvery by different States have been
discussed with reference to the years 1901, 1928, 1956 and 1971 and it has
been summarised as follows:
“Kerala

13
The utilisation of Cauvery waters by the Kerala State was very
little in 1901 and even by 1928 the utilisation was only 3 M.cu.m. (0.1
TMC) for a few minor schemes. By 1956, this had increased to 42
M.cu.m. (1.5 TMC) and by 1971 it is estimated to be 142 M.cu.m. (5.0
TMC). All this utilisation was purely for minor irrigation schemes,
there being no major and medium irrigation schemes.
Mysore
At the commencement of this century, irrigation in Mysore was
mainly from direct diversion channels from rivers to the extent of
nearly one lakh acres. The system of tank irrigation was very wide-
spread and nearly 80940 hectares (2 lakh acres) were under irrigation
from such tanks in the basin. 770 M.cu.m. (27.2 TMC) was
withdrawal for major and medium schemes and 1288 M.cu.m.(45.5
TMC) for the minor schemes. No definite information is available
regarding the domestic and other industrial uses. By 1928 also there
was no appreciable change in irrigation systems. With the
construction of Krishnarajasagar Reservoir which came into operation
in 1931, development of irrigation had received a fillip and by 1956
the irrigation from major and medium schemes had increased to
nearly 121410 hectares (3 lakh acres). The minor irrigation
registered a small increase of about 8094 hectares (20,000 acres).
The total withdrawals were 2435 M.cu.m. (86 TMC) for major and
medium, 1416 M.cu.m. (50 TMC) for minor and 113 M.cu.m. (4 TMC)
for domestic and industrial uses, evaporation losses from reservoirs
being about 159 M.cu.m. (5.6 TMC). Subsequently;, a few other
reservoirs were also constructed like the Nugu, Marconahalli etc. and
the extent of irrigation increased to nearly 174212.8 hectares
(4,35,532 acres) by 1971 and minor irrigation registered further
increase of nearly 8094 hectares (20,000 acres). The withdrawals for
major and medium schemes was 2976.4 M.cu.m. (105.1 TMC) and
for minor schemes 1549 M.cu.m. (54.7 TMC) and 142 M.cu.m. (5
TMC) for domestic and industrial uses. Evaporation losses from

14
Reservoir were about 181.25 M.cu.m. (6.4 TMC). In addition, a large-
scale programme of irrigation development has been initiated by the
Government of Mysore and construction of several projects has been
taken up. According to their Master Plan, the State Government has
indicated that about 2621.6 M.cu.m. (92.57 TMC) is the requirement
for such projects which have not yet come into operation but are
under construction.
Tamil Nadu
The irrigation development in Tamil Nadu started much earlier and
some of the systems like the Cauvery Delta are centuries old. By
1901 nearly 566580 hectares (14 lakh acres) were being benefited
from major and medium schemers and 89034 hectares (2.2 lakh
acres) from minor irrigation works. The development of tank irrigation
in the basin was also very widespread. The withdrawals were 10899
M.cu.m. (384.9 TMC) for major and medium schemes 1274 M.cu.m.
(45 TMC) for minor irrigation and 34 M.cu.m. (1.2 TMC) for domestic
and industrial uses. By 1928, there was no improvement except for
slight increase in domestic and industrial consumption which
increased to 59 M.cu.m. (2.1 TMC). With the construction of Mettur
Dam which came into operation in 1934 and the Lower Bhavani and
Amravathi reservoirs, there has been addition to the areas being
benefited by irrigation and by 1956 nearly 837729 hectares (20.7 lakh
acres) were being benefited from major and medium schemes and
97128 hectares (2.4 lakh acres) from minor irrigation schemes. The
withdrawals were 13745 M.cu.m. (485.4 TMC) for major and medium
irrigation schemes, 1360 M.cu.m. (48 TMC) for minor irrigation
schemes, 88 M.cu.m. (3.1 TMC) for domestic and industrial uses and
about 23 M.cu.m. (0.8 TMC) was evaporation loss. By 1971, there
has been further increase in the irrigation, nearly 10,23,890 hectares
(25.3 lakh acres) being benefited from major and medium irrigation
schemes and 116000 hectares (2.9 lakh acres) from minor irrigation
schemes. The withdrawals were 14198 M.cu.m. (501.4 TMC) for

15
major and medium schemes, 1642 M.cu.m. (58 TMC) for minor
irrigation schemes and 142 M.cu.m. (5 TMC) for industrial and
domestic uses, 255 M.cu.m. (9 TMC) being evaporation losses.
Thus the existing consumptive use in the basin as indicated by
the States is 142 M.cu.m (5 TMC) by Kerala, 4848 M.cu.m.(171.2
TMC) by the Mysore and 16237 M.cu.m. (573.4 TMC) by Tamil Nadu,
giving the total consumptive use of 21226 M.cu.m. (749.6TMC) or say
21238M.cu.m. (750 TMC).The areas receiving benefits of irrigation
and the consumptive uses from time to time, are tabulated in
statement form at the end of this chapter.” (Ref. ibid. Pages 51
to 53)
14. The utilisation of Cauvery water in the years 1901, 1928, 1956 and
1971 by different States have been tabulated including the areas under irrigation
and the water use for irrigating those areas by different States. A copy of the
same reproduced in the succeeding pages.

16
Statement attached at the end of this volume

17
Statement attached at the end of this volume

18
15. Thereafter the Committee has discussed the different projects in
different States, land-use, cultivated areas and agriculture practices, geology,
soils and minerals. It has also given the details of the climate, rainfall and water
resources in different States.
“Climate, Rainfall and Water Resources CLIMATE
The climate of Cauvery river basin may be described as
essentially a tropical monsoon type, which is a product of the
interplay of the two opposing air masses of the South-West and
North-East Monsoons. The following four distinct seasons occur in
the basin.
1. Cold weather period (January-February)
2. Hot weather period (March-May).
3. South-West Monsoon period (June-September).
4. North-East Monsoon period (October-December).
Cold Weather Period or Winter Season
The Winter season commences from December and continues till
the end of February. During cold weather period, the weather is
usually dry and sunny and generally free from rains. In December,
which may be taken as representative of the winter months, the mean
– daily minimum temperature over the Cauvery catchment varies from
8.60C at Kodaikanal to 22.80 C at Nagapattinam indicating that the
mean daily minimum temperature increases from West to East. The
minimum temperature ever recorded was 2.80 C on 30th December
1922 at Kodaikanal.
Hot Weather Period or Summer Season
The hot weather period begins with March and increases in
intensity towards the end of May. The month of May is the
representative of this season, during which the mean daily maximum
temperature ranges from 20.40 C at Kodaikanal to 35.5o C at

19
Nagapattinam. This period is usually dry except for occasional pre-
monsoon showers.
South-West Monsoon Period
The Cauvery basin receives the major portion of its rainfall from
the South-West Monsoon. The South-West Monsoon usually sets in
about the end of May or early in June. It continues with some
intervals till the end of September. 48.3% of the annual rainfall
occurs during this period. During July which may be taken as
representative of the monsoon months, the mean daily maximum
temperature is 11.50 C at Kodaikanal and it increases to 26.30 C at
Nagapattinam. Heavy showers of rainfall generally occur in
association with the monsoon depression from the Bay of Bengal and
Arabian Sea. Heavy rainfall generally comes in the form of torrential
storms during the period of the South-West monsoon usually with a
peak in September.
North-East Monsoon Period
The North East monsoon period is from October to December.
It is during this period that the eastern coastal belt gets most of rain.
33.5% of the annual rainfall occurs during this period in the basin
while 52.5% of the annual rainfall is recorded for the basin from its
confluence with Amaravathi upto the mouth of the Cauvery. The
mean daily maximum temperature recorded at Coimbatore is 30.4o C
during October while the mean daily minimum temperature recorded
at Mercara is 14.60 C during December.
………………………………………………
Rainfall There are in all 224 existing raingauge stations (Reporting to
India Meteorological Department) inside the Cauvery basin. These
raingauge stations are more or less uniformly distributed over the
entire basin and their number is fairly adequate. In view of the
reasonably good net-work of raingauge stations in this basin, sub-
catchments and sub-basins rainfall averages have been worked out

20
as the arithmetic means of the normals of the raingauge stations in
the respective sub-catchments and sub-basins.
The rainfall in the basin varies from State to State. In the State
of Kerala, normal annual rainfall in the basin is about 2872.8 m.m. In
the high ranges of the Western Ghats it is as high as 4435 m.m. at
Vayithri in Kozhikode District but is as low as 1348.9 m.m. at Marayur
in Kottayam District. Most of the rainfall occurs in the Cauvery basin
during the South West Monsoon which commences from June and
lasts till September end. A notable feature of rainfall in this region is
that the coefficient of variation (%) is as low as 15. In the Coorg District of Mysore lying in the Cauvery basin, the
normal annual rainfall is of the order of 2400 m.m. and the most of the
rainfall is received during the South-West Monsoon. The variation of
normal annual rainfall in the district is very much marked as the
normal annual rainfall at Bhagamandala is 6032.3 m.m. while it
decreases to 1120.0 m.m. at Fraserpet in the north of the district.
The other districts of the Mysore State constituting the Southern
Maidans, through which the river flows, and which fall in the rain-
shadow zone of the Western Ghats, receive on an average about 691
m.m. (for Mandya district) to 761.9 m.m. (for Mysore district). In Tamil Nadu, the average annual rainfall in the Cauvery
basin upto the confluence with Amaravathi, is 1010.4 m.m. The
average annual rainfall is maximum in the Nilgiris wherein the
average annual rainfall at Devala is 4045.8 m.m. The contributions of
both the South West monsoon and North East monsoon towards the
rainfall in the basin upto the confluence with Amaravathi are almost
equal and are of the order of 390.4 m.m. and 387.9 m.m.
respectively. The districts of Tanjore and Tiruchirapalli are influenced
more by North East monsoon. The rainfall contribution by the North
East monsoon to this portion of the basin between the confluence
with Amaravathi to the confluence with the Bay of Bengal is 526.7
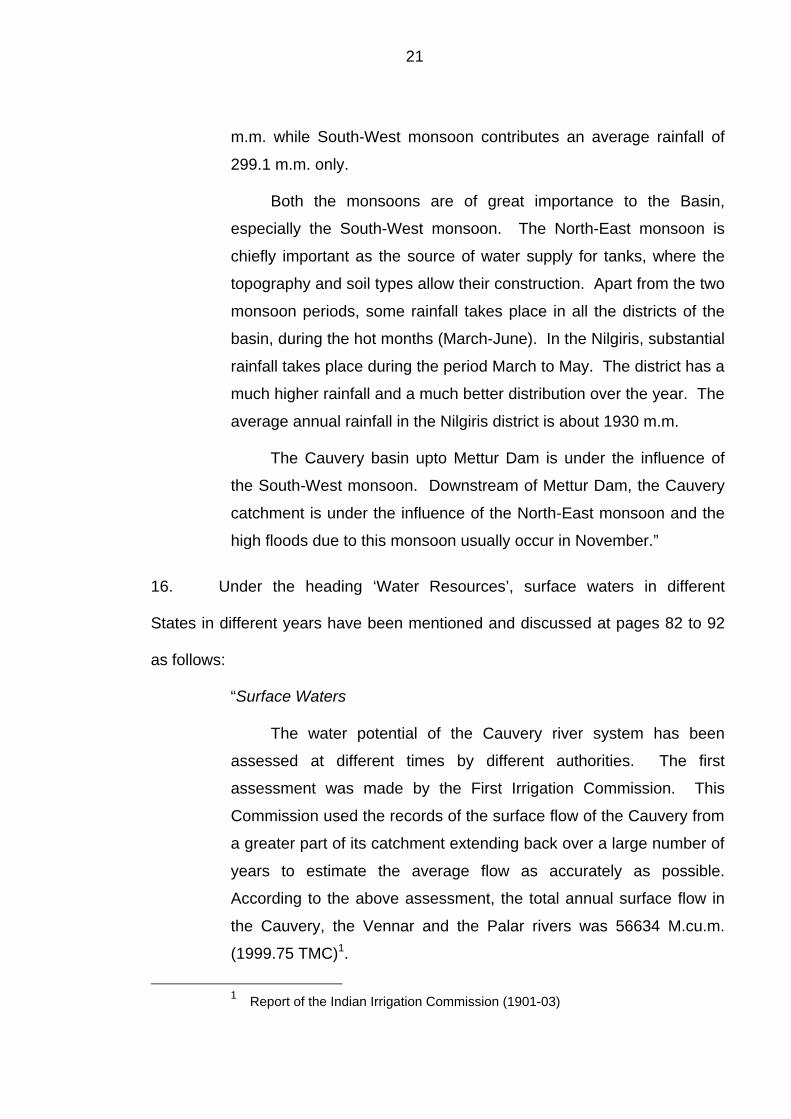
21
m.m. while South-West monsoon contributes an average rainfall of
299.1 m.m. only. Both the monsoons are of great importance to the Basin,
especially the South-West monsoon. The North-East monsoon is
chiefly important as the source of water supply for tanks, where the
topography and soil types allow their construction. Apart from the two
monsoon periods, some rainfall takes place in all the districts of the
basin, during the hot months (March-June). In the Nilgiris, substantial
rainfall takes place during the period March to May. The district has a
much higher rainfall and a much better distribution over the year. The
average annual rainfall in the Nilgiris district is about 1930 m.m.
The Cauvery basin upto Mettur Dam is under the influence of
the South-West monsoon. Downstream of Mettur Dam, the Cauvery
catchment is under the influence of the North-East monsoon and the
high floods due to this monsoon usually occur in November.”
16. Under the heading ‘Water Resources’, surface waters in different
States in different years have been mentioned and discussed at pages 82 to 92
as follows:
“Surface Waters
The water potential of the Cauvery river system has been
assessed at different times by different authorities. The first
assessment was made by the First Irrigation Commission. This
Commission used the records of the surface flow of the Cauvery from
a greater part of its catchment extending back over a large number of
years to estimate the average flow as accurately as possible.
According to the above assessment, the total annual surface flow in
the Cauvery, the Vennar and the Palar rivers was 56634 M.cu.m.
(1999.75 TMC)1.
1 Report of the Indian Irrigation Commission (1901-03)

22
In 1949, when the basin-wise assessment of the water
resources of the country was done on the basis of Khosla’s formula,
the annual runoff of the Cauvery river system was estimated to 9991
M.cu.m. (352.78 TMC).2
In 1960, the Central Water & Power Commission while
conducting irrigation potential studies, assessed the total annual
runoff of the Cauvery river system to be 18601 M.cu.m. (656.80
TMC)3 on the basis of Strange’s Co-efficient for average catchments.
Gauge and discharge observations were started on the Cauvery
as early as 1873 when the first observation site was established at
the Upper Anicut by the Irrigation Department of Tamil Nadu.
Subsequently, in the year 1879, three more gauge and
discharge sites were established by the State across the Coleroon at
the Lower Anicut and two on its tributaries, at the Kodiveri Anicut
across the river Bhavani and the Pallapalayam Anicut across the river
Amaravathi. The observation stations were increased from time to
time and at the time of Independence, there existed five gauge and
discharge sites across the main Cauvery and four on its major
tributaries in Tamil Nadu viz., Bhavani, Noyil and Amaravathi. In the
First Five Year Plan, one more site was established at the
Sedarpalaiyam Bed Regulator across the main river. In addition,
observations were also started at the Lower Bhavani dam across the
river Bhavani and the Kunnimathur Anicut across the river Noyil.
The table given below shows the details of the various gauge and
discharge sites in Tamil Nadu.4
2 An Appraisal of Water Resources by Dr. A.N. Khosla, UNESCO.
3 @ Report of the technological possibilities of Irrigation projects in India, Central Water & Power Commission (unpublished)
4 Inventory of gauge and discharge sites in Tamil Nadu, Directorate of Statistics, Central Water & Power Commission (unpublished).

23
Gauge and Discharge sites in Tamil Nadu
Sl. Name of the Name of Location Whether Started Agency No. river the tributary G or GD in
1. Cauvery - Mettur Dam GD 1934 SID 2. -do- - Sedarpalaiyam GD 1952 SID Bed Regulator
3. -do- - Kulittalai Bed GD 1952 SID Regulator 4. -do- - Upper Anicut GD 1873 SID 5. -do- - Grand Anicut GD 1891 SID 6. Cauvery - Lower Anicut GD 1879 SID (Coleroon) 7. Cauvery Bhavani Lower Bhavani GD 1953 SID Dam
8. -do- “ Kodiveri Anicut GD 1879 SID 9. -do- “ Kalingarayan GD 1880 SID Anicut
10. -do- Noyil Noyil Anicut GD 1880 SID Chitrachavadi
11. –do- “ Kunnimathur GD 1952 SID 12. –do- Amaravathi Pallapalayam GD 1879 SID Anicut
G = Gauge observations. GD = Gauge and discharge observations
SID = State Irrigation Department
In Mysore, the Gauge and Discharge observations on the Cauvery
were first started in the year 1916 when a gauge and discharge observation
site was established by the State Government at Sivasamudram. In 1922,
observations were started at Chunchanakatte site on the Cauvery, at
Akkihebbal on the Hemavathi and at Unduvadi on the Lakshmanathirtha.
In 1947 one more gauge and discharge site was established at Dhangere
by the State Electricity Board. Observations are also made at the
Krishnarajasagar. Among other tributaries, observations are made on the
Kabini at Hullahalli (established in the year 1916) and on Nugu at Birwal
(1922). The table given below shows the various gauge and discharge
observation sites in the Cauvery basin in Mysore State.

24
GAUGE AND DISCHARGE SITES IN MYSORE
Sl. Name of Name of the Location Whether Started No. the river tributary G or GD in
1. Cauvery - Chunchanakatte GD 1922 2. -do- - Krishnarajasagar GD 1956 3. -do- - Dhangere GD 1947 4. -do- - Sivasamudram GD 1916 5. -do- Hemavathi Akkihebbal GD 1922 6. -do- Lakshmanathirtha Unduvadi GD 1922 7. -do- Kabbini Hullahalli GD 1916 8. -do- Nugu Birwal GD 1922 ________________________________________________________
G= Gauge observations
GD = Gauge and discharge observations.
Under the programme of establishing and maintaining centrally
operated key hydrological stations in the country, the Central Water and
Power Commission has included five gauge and discharge sites in
the Cauvery basin, namely (1) on the Cauvery at Kallighat, (2) on the
Cauvery below its confluence with the Arkavathi, (3) on the Kabbini
above its confluence with the Cauvery in Mysore, (4) on the Cauvery
below its confluence with the Bhavani, and (5) on the Cauvery above its
confluence with the Aiyar river in Tamil Nadu. In addition, they have
suggested that three gauge and discharge sites, namely (1) on the
Cauvery at Chunchanakatte, (2) on the Hemavathi at Akkihebbal, and (3)
on the Lakshmanathirtha at Unduvadi in Mysore and two sites namely (1)
on the Bhavani at the Kodiveri Anicut and (2) on the Amaravathi above
its confluence with the Cauvery, may be maintained by the State
Governments concerned.
Assessment by the Committee In view of the long-term record available for the main Cauvery at
Krishnarajasagar, Mettur and Grand Anicut/Lower Anicut, the Committee

25
has estimated the yield at 50%, 75% and 90% dependabilities. Since,
there are reservoirs at Krishnarajasagar and Mettur, the yield figures
would be of high degree of reliability. Mettur also serves as a guide to
estimate the yields at the boundary of Mysore and Tamil Nadu, as there
is only a small catchment of Tamil Nadu, upstream of Mettur. The
terminal usage point on the river is the Lower Anicut and the data of the
Grand Anicut/Lower Anicut has been taken for estimating the total yield
of the basin.
Yield at Krishnarajasagar:
The volumes of observed inflow into Krishnarajasagar are
available from 1933-34 to 1970-71. For obtaining the annual historical
flow, the volumes of withdrawals for each of the year due to Major,
Medium and Minor schemes upstream of Krishnarajasagar dam are
added to the observed flow for the corresponding years for the period
(1933-34 to 1970-71). The existing (1971) utilisation due to four Major
and Medium Irrigation Schemes above Krishnarajasagar (viz. Hemavathi,
Cauvery, Lakshmanathirtha and Yagachi) is of the order of 637.20
M.cu.m. (22.5 TMC) as given in annexure VI (Mysore State). This
annexure also gives the area irrigated and total utilisation by existing
irrigation works in Cauvery Basin in Mysore State as in 1971, while
Annexure I (Mysore State) gives the areas of the ayacut as in 1901 and
1951. Volumes of water utilisations have been worked out in proportion
to the area under irrigation in these years, for 95940 acres of area,
volume of water used has been given as 637.20 M.cu.m. (22.5TMC).
Having obtained the utilisation values for the three years 1901, 1951 and
1971, a smooth curve has been drawn to compute or interpolate the
utilisation due to these medium schemes upstream of Krishnarajasagar
for each of the years for the period 1933-34 to 1970-71. To this the use
by major schemes is added. The withdrawals due to minor schemes
upto Krishnarajasagar have been computed as in 1901, 1928, 1956 and
1971 in proportion to the catchment area upto Krishnarajasagar to the
catchment area of Cauvery basin in Mysore State. Having derived the

26
volumes of utilisation due to Minor schemes upto Krishnarajasagar for
these four years, a smooth curve is drawn to interpolate the utilisation
values for each of the years for the period 1933-34 to 1970-71.
The volumes of withdrawals due to Major, Medium and Minor
schemes for each of the years are added to the corresponding observed
volumes of flow at Krishnarajasagar to obtain historical flow series for the
period 1933-34 to 1970-71.
50%, 75% and 90% dependable runoff or yield is worked out, by
the frequency analysis of the 38 years historical runoff series at
Krishnarajasagar. These are 6213.441 M.cu.m. (219.4 TMC), 5318.50
M.cu.m. (187.8 TMC) and 4746.43 M.cu.m. (167.6TMC). As against this
in the table on page 41 of the write-up supplied by the Government of
Mysore on 13-10-72 the 50% yield upto K.R. Sagar has been indicated
by them to be 6400.32 M.cu.m. (226TMC). This fairly agrees with the
50% dependable runoff as estimated by the Committee.
Mettur Reservoir
The observed flow data of river Cauvery at Mettur Reservoir is
available from 1934-35 to 1971-72.
The volumes of withdrawals at Krishnarajasagar are also available
from 1934-35 to 1971-72. The volume of withdrawals above Mettur i.e. in
Mysore State due to anicut channels as in 1971 is also given as 1345.20
M.cu.m. (47.5 TMC) for an irrigated area of 77782.4 hectares (194456
acres). Applying the ratio of the area irrigated in 1971, to the areas
under irrigation for the years 1901 and 1951, the utilisation at these
points of time, viz., 1901, 1951 and 1971 are obtained and a smooth
curve drawn through these three points to obtain the utilisation due to
anicut channels for each year of the period 1934-35 to 1971-72. The
withdrawals or utilisation due to reservoirs at Marconhalli, Byramangala,
Kanva, Nugu, Hebbahla, Mangala and Chikhole, equal to 113.28 M.cu.m.
(4 TMC), 28.32 M.cu.m. (1 TMC) 33.98 M.cu.m. (1.2 TMC), 169.92

27
M.cu.m.(6 TMC), 11.33 M.cu.m. (0.4 TMC) and 16.99 M.cu.m.(0.6 TMC)
respectively and the utilisations in the Chinar schemes in Tamil Nadu
have also been added from the respective years of operation of these
reservoirs to arrive at the total utilisation or withdrawals upstream of
Mettur Reservoir due to Major and Medium Irrigation schemes.
The withdrawals due to Minor Irrigation schemes in Mysore State
for 1901, 1928, 1956 and 1971 have been indicated by Mysore to be
1288.56 M.cu.m. (45.5 TMC), 1302.72 M.cu.m. (46 TMC), 1416.00
M.cu.m. (50 TMC) and 1549.10 M.cu.m. (54.7 TMC) respectively. Yearly
withdrawals for the period 1934-35 to 1971-72 have been interpolated
with the help of a smooth curve drawn through these four points of time
in 1901, 1928, 1956 and 1971. Withdrawals due to evaporation and
domestic uses have been determined on an ad hoc basis and series of
historical flows obtained for the 38 years from 1934-35 to 1971-72. Applying the frequency analysis, the 50%, 75% and 90%
dependable yields at Mettur Reservoir thus work out to be 14380.90
M.cu.m. (507.8 TMC) 12783.65 M.cu.m. (451.4 TMC) and 11730.14
M.cu.m. (414.2 TMC) respectively.
From the inflows indicated in Volume II (Tamil Nadu) the 50%
dependable inflows at Mettur work out to be 9827 M.cu.m. (347 TMC).
These include the runoff from the catchment of Tamil Nadu above Mettur
taken to be 792.96 M.cu.m. (28 TMC). During discussions the
Government of Tamil Nadu estimated the withdrawals by Mysore to be
3993.12 M.cu.m. (141 TMC). Adding this to the 50% dependable inflows
the yield at 50% dependability works out to 13820.16 M.cu.m. (488 TMC)
against the figure of 14380.90 M.cu.m. (507.8 TMC) worked out by the
Committee. During discussions the representative of Tamil Nadu indicated the
average inflow at Mettur to be 10704.9 M.cu.m. (378 TMC) and
withdrawal by Mysore to be 3993.12 M.cu.m. (141 TMC). Deducting the
yield by catchment in Tamil Nadu of 792.96 M.cu.m. (28 TMC) the

28
average inflow from the catchment of Mysore and part catchment of
Kerala (Kabbini sub-basin), is estimated by them to be 13905.12 M.cu.m.
(491 TMC). Thus, the Government of Tamil Nadu estimated the average yield
from Mysore portion of the catchment to be 11696.16 M.cu.m. (413 TMC)
assuming the flow from Kerala portion of Kabbini to be 2208.96 M.cu.m.
(78 TMC). They also estimated the yield from Kerala portion of Pambar
and Bhavani sub-basins to be 1162.12 M.cu.m. (41 TMC). The
Government of Mysore estimated the contribution from their catchment to
be 11554.56 M.cu.m. (408 TMC) and that of Kerala portion of Kabbini to
be 2208.96 M.cu.m. (78 TMC). Contribution from Kerala portion of Kabini sub-basin: In the Memorandum, Government of Kerala has estimated the
yield from Kerala portion of Kabbini sub-basin as 4332.96 M.cu.m. (153
TMC). The computations are based on a comparison of the Inglis ghat
formula; observation of discharge by surface floats for a part of the
catchment and rainfall-runoff relationship. In extrapolating the observed
runoff from the higher rainfall area which is gauged to the entire
catchment, the lower rainfall in the ungauged catchment has not been
allowed for. Similarly, in establishing rainfall runoff relationship, in the
lower areas, lower runoff factor has not been allowed for. The
Government of Mysore has been observing regular gauges just upstream
of the Hullahalli Anicut in Mysore. These gauges had been correlated
with discharge observations downstream of the anicut jointly by the
Government of Tamil Nadu and the Government of Mysore in the years
1924-25 and 1936. The average yield at the Hullahalli Anicut is 3568.32
M.cu.m. (126 TMC). Application of the Inglis ghat formula to the Kerala
catchment and Inglis non-ghat formula to the Mysore portion of the
catchment indicates that yield of 5210.88 M.cu.m. (184 TMC) would be
resulting from the catchment upto Hullahalli against the observed
3568.32 M.cu.m. (126 TMC). The catchment area of this Sub-basin in

29
Kerala is 1916.60 sq. km. (740 sq. miles), whereas the catchment area
upto Hullahalli is 4706.03 sq. km. (1817 sq. miles). But the average
rainfall in the Kerala catchment is nearly 299.72 cm. (118 inches),
whereas the rainfall in Mysore portion is about 33 inches. The
Government of Mysore have indicated the yield of Kerala portion to be
2208.96 M.cu.m. (78 TMC) by reducing the yield of 5210.88 M.cu.m.
(184 TMC) using Inglis formula and scaling it down proportionately to the
observed yield of 3568.32 M.cu.m. (126 TMC), assuming 3228.48
M.cu.m. (114 TMC) as the yield from the Kerala catchment by applying
Inglis formula. It is also found that the Government of Mysore have observed
yields at Kabini dam site (catchment area of 847 sq. miles – 2193.73 sq.
km.) and the average yield of the current meter observations for 13 years
is about 3823.20 M.cu.m. (135 TMC), which is much higher than the
observed yield at Hullahalli. This raises a doubt about the accuracy of
the yield at Hullahalli. The Committee during the inspection observed
that lot of repairs had been carried out to the anicut, which might have
affected the gauge-discharge relationship arrived at in 1936. In the
opinion of the Mysore engineers, the discrepancies are purely due to
personal errors of observation at the Kabbini dam site and they place
more reliance on the Hullahalli observations. Further according to them,
the site at Kabbini dam is not satisfactory. In view of the conflicting position of the figures of yield being
contributed by the Kabbini sub-basin from Kerala, it is difficult to make
any valid guess.
Grand Anicut
The figures of utilisation at the Grand Anicut for the 38 years from
1934-35 to 1971-72 have been supplied by the Government of Tamil
Nadu. To these, the annual realisations, the surplus at Upper Anicut for
the corresponding year have been added to arrive at the realisation at

30
Upper Anicut. For arriving at the utilisation at Lower Anicut, the
difference in flow at the Lower Anicut and the releases of surplus from
the Upper Anicut and the Grand Anicut is obtained and added to the
realisation at Upper Anicut. Thus the realisation worked out would
represent the yield from the Cauvery basin upto Grand Anicut and the
yield of the Coleroon river but would exclude the runoff from the
Cauvery/Vennar systems which are drained by these systems into the
sea. The realisations have been worked out on the following basis:-
i) Withdrawals due to Major, Medium and Minor Irrigation
schemes, domestic uses and evaporation losses from
reservoirs, upstream of Mettur reservoir have been
computed for each of the year for the period 1934-35 to
1970-71.
ii) Withdrawals due to Major and Medium irrigation schemes
between Mettur and Upper Anicut in Tamil Nadu are
available as in 1901, 1928, 1934, 1954, 1958, 1959 and
1971. These are 4332.96 M.cu.m. (153 TMC), 4511.38
M.cu.m. (159.3 TMC), 4791.74 M.cu.m. (169.2 TMC) and
4791.74 M.cu.m. (169.2 TMC) respectively.
iii) Withdrawals due to the Minor schemes in Tamil Nadu
upstream of Upper Anicut are also given in 1901, 1928,
1956 and 1971 and are 1246.08 M.cu.m. (44 TMC),
1246.08 M..cu.m. (44 TMC), 1359.36 M.cu.m. (48 TMC) and
1642.56 M.cu.m. (58 TMC) respectively. The withdrawals
for each year during the period 1934-35 to 1971-72 have
been worked out by linear interpolation.
iv) Withdrawals due to domestic and industrial uses are also
shown for the years 1928, 1956 and 1971 and are 59.47
M.cu.m. (2.1 TMC), 87.79 M.cu.m. (3.1 TMC) and 141.60

31
M.cu.m. (5 TMC) respectively. The withdrawals for each of
the years during the period 1934-35 to 1971-72 have been
worked out by linear interpolation.
The realisations indicated do not take into account the effect
of carry over storage in the Mettur Reservoir and necessary
modifications, therefore, has been made to arrive at the historical
flow. Applying the frequency analysis, the dependable yields of 50%,
75% and 90% at Lower Anicut are worked out to be 20956.8 M.cu.m.
(740 TMC), 18974.40 M.cu.m. (670 TMC) and 17643.36 M.cu.m.
(623 TMC) respectively. “
[Emphasis supplied]
17. It appears that the committee gave sufficient weightage to the
existence of Krishnarajasagar and Mettur reservoir and has accordingly relied
upon the data from 1933-34, since when both these reservoirs were in position.
The yield at the terminal point of the basin, namely, Lower Coleroon Anicut was
assessed by the Committee as 740 TMC at 50% dependability, 670 TMC at 75%
dependability and 623 TMC at 90% dependability. The Committee on basis of
different data supplied by the States and their own investigation for the total yield
within the Cauvery basin taking into consideration the gauge and discharge
readings at different places in different States the dependable yields at 50%,
75% and 90% were worked out at 740 TMC, 670 TMC and 623 TMC
respectively.
18. The report of the Committee was considered by the Chief Ministers of
the States on 29.4.1973 and they agreed with the report of the Committee
regarding the total yield within the Cauvery basin. Unfortunately, the
Memorandum of that is not available on the record. The party-States had agreed

32
in respect of the total yield estimated by the Committee is established by
referring to the Statement given by then Minister for Irrigation and Power Dr. K.L.
Rao on the floor of the Parliament on 7.5.1973. On May 7, 1973 in the Lok
Sabha there was a debate in respect of the dispute relating to the sharing of the
water of river Cauvery between the different States. A copy of the proceeding of
the Parliament of that date has been produced from which it appears that the
then Deputy Minister in the Ministry of Irrigation and Power gave details of the
report of the Fact Finding Committee. He also stated that the Committee had
submitted its report in December 1972 which contained the necessary data on
availability of waters, existing utilisation apart from other questions referred to the
Committee. Thereafter he stated that there were discussions with the Chief
Ministers of Kerala, Mysore and Tamil Nadu on 29th April 1973 about the report
of the Committee. During these discussions there was a general consensus on
the total yield of the river as given in the Committee’s report. Then Dr. K.L. Rao,
the then Minister for Irrigation and Power in his statement before the Parliament
after giving the other details about the Fact Finding Committee stated as follows:
“In this particular case, the quantum of water flowing in the river has
been agreed to as between the three parties. That is a great thing
which has been done. Normally they could have easily agreed in
regard to the quantum at one point. But in this case, actually, they
have agreed at three vital points, namely Krishnarajasagar, Mettur and
Lower Anicut. These are the three very important points which have
got a bearing on the settlement of the allocation of water between the
various States, and I am happy that on this matter, at these three
points, at the very first meeting, after the fact-finding committee
published their report, the three Chief Ministers have agreed to it. That
is half the battle won.”

33
(Emphasis supplied)
(Ref. TN Vol. 36, Exh. 1364, Page 38, Right Col. & Page 39)
19. By a letter dated May 1, 1973 Dr. K.L. Rao, the Minister for Irrigation
and Power had informed the then Prime Minister in respect of the agreement
between the Chief Ministers in respect of availability of water as assessed by
CFFC:
“The first stage was taken up for a consideration at the meeting. The
Report of the Fact Finding Committee, which had been appointed by
the Ministry of Irrigation & Power, was very helpful in this regard. The
figures assessed by the Committee as to the water availability in the
river were agreed to by the Chief Ministers. This is a big step forward.
Generally, this is an area where considerable amount of time is spent
with difference of estimation continuing to persist evading
reconciliation.”
20. It appears that as desired by the Chief Ministers, the Government of
India revived the Cauvery Fact Finding Committee for a period of three months
with effect from 15th May 1973 with the following terms of reference:-
“The Committee shall review the data supplied to it earlier by the State
Governments in respect of area cropped, net area irrigated, irrigated
cropped area and other data relevant to water utilisation at different
points of time and undertake such verification as is necessary, from
other data available with the State Governments, especially those
published.”
(Ref. TN Vol. XV Exh. 841, Page 127)
It may be pointed out that there was no reference in respect of quantum of water
flowing in the river Cauvery as there was no controversy in respect of the same

34
after the agreement of the Chief Ministers of three States on the assessment of
the Cauvery Fact Finding Committee in its report.
21. After revival, the Committee held discussions with the Chief Engineers
of Kerala, Mysore and Tamil Nadu on 23rd and 26th May 1973 and the following
decisions were reached:
“(i) The States will collect necessary data to enable the CFFC to
carry out verification of the data furnished in tables at pages 30,
39, 40, 40A and 51 of the CFFC’s printed report of December,
1972.
(ii) The State Chief Engineers will signify acceptance of such of the
data which they consider correct and appropriate, and furnish
their comments in respect of data with which they differ. The
Chief Engineers will also furnish their comments, if any,
regarding the data pertaining to other States, as furnished in the
tables, referred to at (i) above.
(iii) The Chief Engineers will indicate corrections, if any, in the figures given in the published report of CFFC of December, 1972.
(v) It was agreed that ten copies of the material along with the books
and registers in support of the data (accepted and contested) will
be kept ready for inspection and perusal of the CFFC by the
Chief Engineers during their scheduled visits as given in the
programme below:
12th to 15th June, 1973 - Kerala
19th to 21st June, 1973 - Mysore
22nd to 25th June, 1973 - Tamil Nadu.
v) After conclusion of the visits to each State, a joint meeting will be
held at New Delhi from 21.7.73 to 23.7.73 where the data
obtained from the different States will be made available to
others for comments.”

35
(Ref. ibid. Pages 127 & 128)
22. The Committee accordingly visited Kerala, Mysore and Tamil Nadu
according to the schedule fixed for the same. It also held meetings with the
representatives of the States at Delhi from 21st to 24th July 1973 and each State
Government was made available the notes submitted by other States. Some
corrections in the original report were suggested with which for the present we
are not concerned. From Tamil Nadu (Documents) Volume XV it shall appear
that at page 139 the Committee again examined the utilisation of water at
different points of time by different States. About the utilisation of the water of
river Cauvery by Kerala it was said:
“In Kerala the first crop of paddy is of long duration and lasts from
May to December and second crop lasts from January to April. Three
short duration crops are also grown. The areas and yields under the
autumn, winter and summer paddy crops are tabulated below. These
are averages for the period from 1962-63 to 1970-71……
…………………………………………………………………………
The figures of 0.5 TMC and 1 TMC for domestic and industrial
supply in 1956 and 1971 are quite high, considering that only 0.1
TMC was indicated as the use for this purpose by the State
Government earlier. However, the total quantity being very small, the
figure of utilisation of 5 TMC as given in the CFFC report for 1971
need not be modified. The irrigation in 1971 was 21550 ha. (53,400
acres as shown in the Land Use Statistics).” 23. Regarding Mysore also utilisation in 1901, 1928 and 1956 were re-
examined but the relevant part of the report for our purpose is the utilisation in
the year 1971 about which it was said as follows:

36
“The area irrigated from schemes constructed prior to 1928 has
increased to 1.821 lakh acres in 1971 from 1.417 lakh acres in 1956
and the utilisation has increased to 47.08 TMC from 36.46 TMC. The
area irrigated from schemes which came into operation between 1928
to 1956 has increased to 2.236 lakh acres from 1.312 lakh acres in
1956 and the utilisation has correspondingly gone upto 54.320 TMC
from 48.420 TMC according to the State authorities. The committee
has, however, raised the figure of utilisation for Krishnaraja Sagar to
46 TMC as discussed earlier. This would raise the figure of 1956
utilisation to 52.82 instead of 48.42 adopted by the State
Government.
For schemes which came into operation between 1956 to 1971,
(vide Statement at pages 20-22) the areas and utilisation are taken
from the project authorities but it is not known whether these have
actually been achieved in the field. The general experience is that full
utilisation and Ayacut as planned in the Project Report are not
realised in practice. In the case of Nugu Project, however, the
utilisation of 7 TMC is the average of about 10 years as verified from
the working tables of the reservoir. It has to be made clear that
except for Nugu, no corroborative evidence is available for other
schemes which came into operation between 1956 and 1971.
For the minor irrigation schemes, the areas have been taken
from the Statistical Abstract of Mysore for 1970-71 published by the
Bureau of Economics and Statistics, Government of Mysore in 1971
and utilisation for this is 54.7 TMC based on utilisation of 4.4
acres/Mcft.
The total utilisation for all categories of schemes in 1971 is 176.82
TMC as per statement at pages 20-22.”
(Ref. ibid. Page 145)

37
From page 148 of the said volume it shall appear that on re-examination the
utilisation by Mysore was raised from 171.2 TMC in the original report to 176.82
TMC.
24. So far Tamil Nadu is concerned, similarly utilisation in the years 1901,
1928, 1956 and 1971 were re-examined. Regarding utilisation in 1971 it was
said:
“The areas of first crop in Cauvery delta system as indicated in the
Administration Reports from 1966-67 to 1969-70 varied from 9.2 lakh
acres to 9.5 lakh acres and of the second crop from 2.7 lakh acres to
4.4 lakh acres. Thus the Cauvery Delta system has registered a
substantial increase in the second crop over that of 1956 which was
1.6 lakh acres. The latest areas as reported by the District Revenue
Officers of 9.34 lakh acres for the first crop and 3.56 lakh acres for
the second crop have been adopted. The average withdrawal for the
period of 38 years i.e. from 1934 to 1972 is 234.8 TMC. The
withdrawals have been continuously declining while the area has
been increasing.
In the case of Lower Coleroon anicut the figures of first crop (1.32
lakh acres) and second crop (0.3 lakh acres) which were reported by
the District Revenue Officers have been adopted. The average
withdrawal for the last 38 years is 38.3 TMC.
The Cauvery-Mettur Project has registered an increase in the area
of first crop from 2.07 lakh acres to 2.56 lakh acres, and the second
crop from 0.35 lakh acres to 0.67 lakh acres from 1956 to 1971 as
reported by District Revenue Officers. The withdrawal of 55 TMC
which is an average of 32 years from 1940-41 to 1970-71 is adopted.
In the case of Lower Bhavani Project, the area irrigated as
reported by the District Revenue Officers is 2.07 lakh acres and the

38
withdrawals over 18 years period i.e. 1954-55 to 1971-72 average to
32.6 TMC against 36 TMC planned under the rules and regulation.
In this project there is no double cropping.
In the case of Mettur Canal, the area irrigated as reported by
District Revenue Officers is 0.45 lakh acres and the average
withdrawals for 15 years from 1957-58 to 1971-72 are 12.6 TMC
against 9.6 TMC planned. There is no double cropping in this project
also. Three schemes viz., Amaravathy Reservoir Scheme, New Kattalai
High Level Canal and Pullambadi Canal Scheme have come into
operation after 1956. The figures in respect of areas irrigated under
these schemes, as furnished by the District Revenue Officers are
0.215, 0.206 and 0.221 lakh acres respectively. The withdrawals
under the Amaravathy Reservoir are 4.8 TMC, being average of 14
years i.e. from 1958-59 to 1971-72, while that of Kattalai and
Pullambadi Canals are 5.3 TMC and 3.5 TMC respectively, being the
average of 10 years from 1962-63 to 1971-72.
The withdrawals for minor irrigation have been computed as for
1928 and 1956 on the basis of 5 acres per Mcft. In case of utilisation for 1956, five years before and five years
after have been considered for the average utilisation. In the case of
1971, for obvious reasons, as figures after 1971 cannot be had and
also to account for vagaries of good and bad years, the series of 38
years from 1934 –71 has been adopted for working out the average
utilisation.” (Ref. ibid. Pages 152 to 154)
25. As already mentioned, tables were annexed to the said report
regarding the area and utilisation of water by the States of Kerala, Mysore and
Tamil Nadu in 1901, 1928, 1956 and 1971. One such relevant table in respect
of Tamil Nadu is at pages 155-157 of the said volume. For the year 1971 the

39
utilisation so far the State of Tamil Nadu is concerned, it has been ascertained at
566.60 TMC. It may be mentioned that in the original report it was 573.4 TMC.
In other words, for Mysore it was increased from 171.2 TMC to 176.82 TMC so
far year 1971 was concerned, whereas in respect of Tamil Nadu it was reduced
from 573.4 TMC to 566.60 TMC. The aforesaid additional report was signed on
14.8.1973. In the additional report of the Fact Finding Committee there has
been some change so far utilisation by different riparian States are concerned,
but there has been no change so far the ascertainment and assessment of the
total yield of river Cauvery is concerned because in view of the agreement
between different States that question had not been referred to the Committee.
26. A meeting was held in October 1973 of the Chief Ministers of three
riparian States and the Minister for Irrigation and Power, Government of India.
In the said meeting it had been agreed that it was necessary for all the
concerned States to effect economies in the use of water so as to make it
possible to meet the legitimate needs of other projects which were feasible in the
Cauvery basin. Thereafter, Mr. C.C. Patel, Additional Secretary in the Ministry of
Irrigation and Power was asked to carry out the detailed studies on the scope for
economy in the use of Cauvery waters. Mr. Patel after completing his studies
suggested some concrete proposals in his report which were considered in the
meeting of the Chief Ministers along with the Union Minister for Irrigation in June
1974. The proposals were as follows:
“Finding of Sri C.C. Patel, the then Additional Secretary,
regarding possible savings in the use of cauvery waters.
*****

40
The following savings can be effected on a very conservative
assessment by various measures as indicated below:
Savings in TMC Tamil Nadu
(a) Improvement and Modernisation of Irrigation systems etc. 50
(b) Providing a lined irrigation channel between Upper 20
Anicut and Grand Anicut (c) More intensive use of ground water 30
1. In addition to the savings quantified above, further savings are
possible by taking the following measures:
(i) Continuous assessment of requirement below Mettur
and monitoring of releases to ensure efficient tie up
between rain-fall, water requirements and releases from
reservoirs thereby saving, a part of the wastage from Tail
end regulators. (ii) Installation of water measuring devices, standing wave
flumes and gauge runs at key locations in the distribution
system for improving duties.
(iii) Storage in tributaries downstream of Mettur and
improved pondage capacity upstream of the lower
Coleroon/Grand Anicut/Upper Anicut.
(iv) Exploitation of ground water potential in Grand Anicut
and other irrigated areas (excluding old delta area).
(v) Integrated operation of reservoirs. Karnataka
(a) Savings be effected by Modernisation 20 of existing systems, improved agriculture and water management practices and diversification of crops.

41
(b) Integrated operation of Mettur, 5 Krishnarajasagar, Harangi, Hemavathi and
Kabini reservoirs.” (Karnataka Vol.2, Exh.180, pp.548-549)
27. Subsequently, the Government of India vide their letter dated
15.2.1975 sent a draft of agreement on the use and development of Cauvery
waters as proposed by the State of Kerala to the Chief Secretary, Tamil Nadu
wherein in the terms and conditions of the proposed agreement, Kerala has
stated as under:-
“The Fact Finding Committee constituted by the Government of India
during the negotiations has found that 740 TMC of water is available
in the Cauvery system in an average year and this has been
accepted by the Chief Ministers of Karnataka, Kerala and Tamil
Nadu.” (Ref: TN Vol. XVI, Exh. 847, Pages 4, 6 & 7)
28. An inter-State meeting was held at Madras on 5-10-1980, on Cauvery
Waters Issue. Shri C.C. Patel, Secretary, Ministry of Irrigation, Shri M.N.
Venkatesan, Member (W.R.), Central Water Commission and other officers of
the Ministry of Irrigation were present on behalf of the Central Government.
The Commissioner and Secretary to the Government of Tamil Nadu, Public
Works Department along with other Chief Engineers and Shri A.
Mohanakrishnan, the then Special Officer, Inter-State Waters, Govt. of Tamil
Nadu were present on behalf of the Tamil Nadu. On behalf of the Government
of Karnataka, Special Secretary to Government Public Works Department, Shri
Shankar Rao, Chief Engineer (Retired) and Shri Raghuram, the then Technical
Assistant was present. Similarly representatives of Kerala and Pondicherry
attended, details whereof have been given in the Summary Record of the

42
Meeting. (T.N.D.C. Vol. XVI, Exh.861, Pages 186-191). In paragraph 4 of the
Minutes of the Meeting it has been stated as under:
“Secretary, Ministry of Irrigation clarifying the position categorically
stated that as far as the Central Government was concerned, no
doubts have been expressed any time regarding the various figures
incorporated in the understanding of 1976. However, he stated that
Central Government will not have any objection if the concerned
States can arrive at an understanding on the basis of some other
figures which are mutually acceptable. Representative of Karnataka
then stated that his State accepts the figure of 740 TMC if the other
States do not reopen this issue. In case the issue is re-opened,
Karnataka reserves the right for expressing its views.”
(Emphasis added)
29. In the Statement of Case filed before this Tribunal on behalf of the
State of Tamil Nadu at page 55, Volume I, it has been stated that the report of
the Cauvery Fact Finding Committee was submitted in December 1972 which
was considered by the Chief Ministers of the three States on 29th April 1973 at a
meeting held in New Delhi. It has been further stated that at the request of
Chief Ministers, the Government of India revived the Cauvery Fact Finding
Committee for a further period of 3 months with a mandate that “the Committee
shall review the data supplied to it earlier by the State Governments in respect of
area cropped, net area irrigated, irrigated cropped area and other data relevant
to water utilisation at different points of time and undertake such verification as is
necessary, from other data available with the State Governments especially
those published.” Thereafter there is reference to the additional report dated
14th August 1973 submitted by the Cauvery Fact Finding Committee in respect
of utilisation of the water by different riparian States and other questions referred

43
to the said Committee as already mentioned above and it has been stated in the
statement of case that the data compiled by the Committee were reviewed and
accepted by the Chief Ministers in the meetings convened on 29.4.1973 and
9.10.1973. In that connection it has been stated as follows:
“The data compiled by this Committee were reviewed and
accepted by the Chief Ministers in the meetings convened on
29.04.73 and 09.10.73. Salient details of the findings of the CFFC
are as follows:
1. Total yield 740 TMC at 50% dependability basis.
of the river:
670 TMC at 75% dependability basis
623 TMC at 90% dependability basis
2. Ayacut & Utilisation
Tamil Nadu Karnataka Kerala Total
Ayacut as on 1972 (gross)
(Lakh Acres) 28.208* 6.825 0.534 35.567 -------------------- ---------- --------- ------- ---------
Lakh ha. 11.424 2.764 0.216 14.404
Utilisation (TMC) 566.60 176.82 5.00 748.42
* Includes 0.43 lakh ac. (0.174 lakh ha.) in Pondicherry.”
(Ref: TN-I Statement of Case, pages 55-56)
30. It can be said that so far the State of Tamil Nadu is concerned it has
not disputed at any stage the assessment made by the Cauvery Fact Finding
Committee in respect of the river flow and total yield of river Cauvery to be at
740 TMC at 50% dependability, 670 TMC at 75% dependability and 623 TMC at
90% dependability. It has also accepted about the utilisation by the three
riparian States – Tamil Nadu, Karnataka and Kerala as found by the said
Committee in its additional report to be 566.60, 176.82 and 5.00 T.M.C.

44
respectively. Again in the counter statement on behalf of Tamil Nadu to the
Statement of Case filed by the State of Karnataka (TN Vol.3) at page 9,
paragraph 4.2.3 it has been stated as follows:
“4.2.3. In the above factual context, the following further facts
are significant:
(a) The States of Karnataka, Kerala and Tamil Nadu (as also the
Union Territory of Pondicherry) accepted and acted upon the
Cauvery Fact Finding Committee’s original Report dated
15.12.1972 as well as the Additional Report dated 14.8.1973.
(b) At no stage, thereafter, did Karnataka or Kerala communicate
to Tamil Nadu any objection on the Cauvery Fact Finding
Committee’s Report or questioned the collection and analysis of
data or the Cauvery Fact Finding Committee’s conclusions
including its assessment of the availability of waters in the
Cauvery basin.
Suffice it to say, Karnataka never communicated to Tamil
Nadu or Kerala or the Central Government any rejection of the
Cauvery Fact Finding Committee’s Reports. On the contrary,
even now in its Statement of Case (Page 121-122 Para 19.9),
Karnataka has quoted from and relied upon the said Reports.
(c) Moreover, as a sequel to the Cauvery Fact Finding Committee’s
Reports, on 25.8.1976, a draft understanding was presented by
the Government of India, in an Inter-State meeting in which the
States of Karnataka, Kerala and Tamil Nadu participated,
regarding the use and development of Cauvery waters, wherein
“fixing utilisation of Cauvery waters is agreed as 671 TMC,
comprising 489 TMC by Tamil Nadu, 177 TMC by Karnataka,
and 5 TMC by Kerala” (see Tamil Nadu’s Statement of Case
Annexures Volume, Enclosures XVIII at Internal pages 72-73).
The said utilisation figures were the average figures for the five

45
consecutive years upto 1971-72 and they were based upon and
derived from the data collected by the C.F.F.C.
(d) As a further sequel, on 5.10.1980, an Inter-State meeting on
the Cauvery waters issue was held at which representatives of
Government of India and the four party States were present. In
the summary record/minutes of the said meeting dated
5.10.1980, as circulated under cover of Government of India’s
letter No.6/2/78-WD dated 21.10.1980, the following significant
passages occurred:
“The Representative of Karnataka stated that there are no serious
differences with regard to figures mentioned in 1976 Agreement but
they had basic difference to the approach of 1976
understanding…………”
“The Secretary, Ministry of Irrigation, clarifying the position
categorically stated that as far as the Central Government was
concerned, no doubts had been expressed any time regarding the
various figures incorporated in the understanding of 1976. However,
he stated that the Central Government will not have any objection if
the concerned States can arrive at an understanding on the basis of
some other figures which are mutually acceptable. The
Representative of Karnataka then stated that his State accepts the
figure of 740 TMC, if the other States do not reopen this issue. In
case, the issue is re-opened, Karnataka reserves the right for
expressing its views”.
(e) Even now, in its Statement of Case filed on 18.9.1990 before
this Hon’ble Tribunal, Karnataka has neither averred, nor
submitted, either expressly or by necessary implication, that it
rejects C.F.F.C’s Reports or that C.F.F.C’s assessment on
availability of water in the Cauvery basin is erroneous or that
C.F.F.C’s Reports cannot be taken into consideration, and
relied upon by or before this Hon’ble Tribunal. In other words,
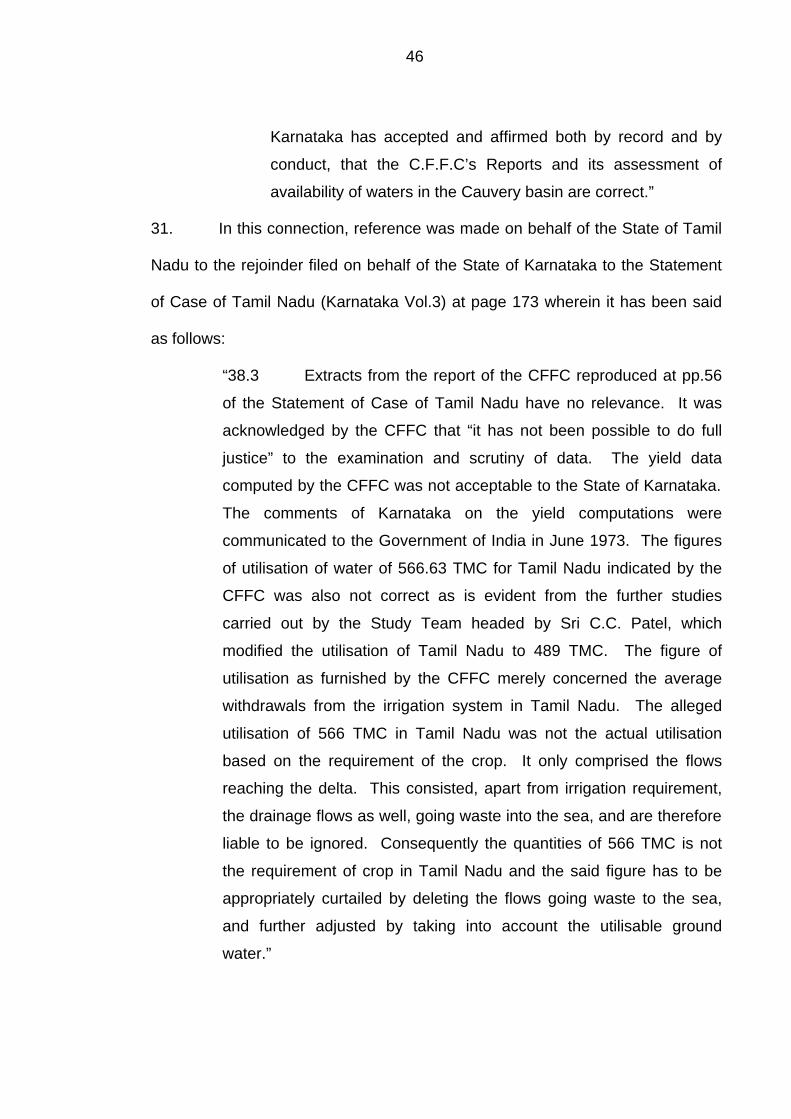
46
Karnataka has accepted and affirmed both by record and by
conduct, that the C.F.F.C’s Reports and its assessment of
availability of waters in the Cauvery basin are correct.”
31. In this connection, reference was made on behalf of the State of Tamil
Nadu to the rejoinder filed on behalf of the State of Karnataka to the Statement
of Case of Tamil Nadu (Karnataka Vol.3) at page 173 wherein it has been said
as follows:
“38.3 Extracts from the report of the CFFC reproduced at pp.56
of the Statement of Case of Tamil Nadu have no relevance. It was
acknowledged by the CFFC that “it has not been possible to do full
justice” to the examination and scrutiny of data. The yield data
computed by the CFFC was not acceptable to the State of Karnataka.
The comments of Karnataka on the yield computations were
communicated to the Government of India in June 1973. The figures
of utilisation of water of 566.63 TMC for Tamil Nadu indicated by the
CFFC was also not correct as is evident from the further studies
carried out by the Study Team headed by Sri C.C. Patel, which
modified the utilisation of Tamil Nadu to 489 TMC. The figure of
utilisation as furnished by the CFFC merely concerned the average
withdrawals from the irrigation system in Tamil Nadu. The alleged
utilisation of 566 TMC in Tamil Nadu was not the actual utilisation
based on the requirement of the crop. It only comprised the flows
reaching the delta. This consisted, apart from irrigation requirement,
the drainage flows as well, going waste into the sea, and are therefore
liable to be ignored. Consequently the quantities of 566 TMC is not
the requirement of crop in Tamil Nadu and the said figure has to be
appropriately curtailed by deleting the flows going waste to the sea,
and further adjusted by taking into account the utilisable ground
water.”

47
32. On basis of the aforesaid statement in the said rejoinder it was urged
on behalf of the State of Tamil Nadu that State of Karnataka never seriously
contested the finding of the Cauvery Fact Finding Committee about the total
yield of river Cauvery as mentioned in the Report of the CFFC. It was also
pointed out that a letter dated 13.6.1973 was addressed by the Chief Minister of
Mysore to the Minister of State for Irrigation and Power, Government of India
about which reference has been made in the aforesaid paragraph 38.3. No
specific stand has been taken that the finding of the Committee about the total
yield was not correct. That letter (Karnataka Document Vol.2 page 478) says as
follows:
“It is seen from the report appearing in the press that during the
last week while replying to a Call Attention Notice, you have stated in
the Lok Sabha that during the meeting of Chief Ministers held on 29th
April, it was agreed that the yield in Cauvery was 740 TMC ft.
It is seen from the report of the Cauvery Fact Finding
Committee that the “historical” 50% dependable yield upto Lower
Anicut works out to 740 TMC ft. This figure is stated to have been
based on historical flows after taking into consideration the effect of
carry over storage of Mettur. It has been worked by the Chief
Engineer of Mysore that the current 50% dependable yield in Cauvery
is much more than 740 TMC ft. the historical yield. A note in this
regard is enclosed for your information as we are concerned with the
current yield for utilisation.
It is suggested therefore, that the Committee may examine this
aspect also.
With regards.”

48
33. From the note which was enclosed with the said letter (at page 479 of
the same volume) it appears that a request was made on behalf of the State of
Mysore to ignore the yields prior to 1954-55. The relevant part of the request in
respect of the assessment of the total yield is as follows:
“Under these circumstances, the correct procedure to ascertain
current yields appears to be to ignore the years prior to 1954-55, when
the utilisation was of low order. If this were to be done and only the 18
years after 1954-55 to 1971-72 are considered, it is found that the
50% dependable yield is 811 TMC ft. (inclusive of surplus of 86 TMC
ft.)”
34. It is difficult to appreciate the stand taken by Mysore in the aforesaid
enclosure that the calculation of the yield should be made only with reference to
years after 1954-55 to 1971-72 (18 years only) and the flow and yield of river
Cauvery during the years prior to 1954-55 should be ignored. It is well-known
that while assessing yield of a river it is always safe and desirable to take note of
the yield of maximum number of years for which reliable data is available to
come to a conclusion as to what is the total yield of that particular river.
35. On the basis of the materials referred to above and data collected by
the Cauvery Fact Finding Committee in respect of total yield of river Cauvery at
50%, 75% and 90% being 20956.8 M.cu.m. (740 TMC), 18974.40 M.cu.m. (670
TMC) and 17643.36 M.cu.m. (623 TMC) respectively which had been accepted
by all riparian States including the then State of Mysore. If there was any
objection on behalf of the then State of Mysore, then in normal course a request
would have been made to refer also that question while referring again to the
Cauvery Fact Finding Committee the questions regarding utilisation of the water

49
of river Cauvery by different riparian States. At no stage the then State of
Mysore or State of Karnataka objected about the said assessment of the total
yield of river Cauvery by the Cauvery Fact Finding Committee. That is why the
then Minister for Irrigation and Power Dr. K.L. Rao made a categorical statement
on the floor of the Parliament quoted above. The letter written on behalf of the
State of Mysore referred to above merely requested that for purpose of
ascertaining the total yield, only yield years 1954-55 to 1971-72 should be
taken into consideration and not the yield of the said river available prior to the
years 1954-55. From all angles and aspects, this was not a reasonable request
on behalf of the then State of Mysore. For ascertaining the yield of a particular
river, data if available for a longer period then that period should also be taken
note of instead of few years only. During arguments the State of Karnataka has
taken this very stand that flows since 1900-1901 should have been considered
by the C.F.F.C.
36. The Irrigation Commission, 1972 had considered this aspect and
recommended that:
“Hydro-meteorological data are basic to the formulation of river valley
schemes. Due to variations in precipitation and river flows, from year
to year, the data should span fairly a long period, say 30 years, to
cover the dry and wet cycles. The longer the period for which data are
available, the sounder would be the base for project formulation.”
(Ref: TN-III, Page 25, Para 4.3.11)
The homogeneity and reliability of the data, namely, rainfall, observed river flows
at various gauge and discharge sites and withdrawals from the river system at
different locations in the entire basin are of utmost importance.
50
37. During the hearing of the arguments an oral direction was given by the
Tribunal to the States of Karnataka and Tamil Nadu to furnish flow series for 38
years i.e. from 1934-35 to 1971-72. Pursuant to that direction, Karnataka
furnished flow series for 72 years from 1900-01 to 1971-72 on 7.11.2002. Tamil
Nadu furnished for years from 1934-35 up to 1971-72. Copies of the same
along with the covering letters have been marked as K.R.Vol. 64, Exh.517 and
T.N. Vol.45, Exh.1663 respectively are attached at the end of this Chapter.
From a bare reference to the flow series filed on behalf of the State of Karnataka
on 7.11.2002 for the period 1900-01 to 1971-72 the average yield is shown as
792.3 TMC; and at 50% it has been shown as 752 TMC. In the covering letter
dated 7.11.2002 it has been stated that average yield in the Cauvery river basin
above and up to delta based on long-term data from 1900-01 to 1971-72 was
792 TMC and the details of the calculation of the yield of the Cauvery basin at
lower Coleroon anicut was enclosed. Tamil Nadu on basis of the flow series
from the year 1934-35 up to 1970-71 has claimed the total yield at 50%
dependability to be 740 TMC. On the other hand, Karnataka calculated the total
yield as 752 TMC on 50% dependability. Therefore, the difference is only of 12
TMC in the flow series filed on behalf of Tamil Nadu and Karnataka. As already
mentioned above that according to the statement filed on behalf of the State of
Mysore before the CFFC on 10.11.1972 (Vide TNDC Volume XIV page 117), the
stand taken on behalf of the State of Mysore was that the total yield of the
Cauvery basin was 760 TMC.
38. Our Assessors have analysed the flow series for 38 years from 1934-
35 to 1971-72 for working out the dependable yield of the river. They have

51
adopted the formula M/N x 100. Regarding this formula, the Krishna Water
Disputes Tribunal in its report has stated as under:
“For ascertaining the percentage dependability of the flow at a given
point of stream where a continuous record of flow for a number of “N”
years is available, the flow discharge data is arrayed in descending
order. Each year’s flow so arrayed is assigned the serial number from
the top and if M be the serial number of the flow in any year, the
percentage dependability for the flow of that year is
calculated by applying the formula
Some authorities say that the percentage dependability should
be arrived at by applying the formula but all the parties
in this case have adopted the formula
If flow at a particular dependability is to be computed and is not
directly available from the flow series as mentioned hereinbefore then
the flow data for the two consecutive years – one just above the
required dependability and the other just below the required
dependability is taken into consideration and proportionate adjustment
is made to arrive at the flow at that particular dependability.”
(Ref: KWDT Report Vol.I, Page 74, Para 2, Left Col.)
In the case of Cauvery, the State of Tamil Nadu has adopted the above
formula i.e. for calculating 50% dependability.
(Ref: TN Vol.45, Exh.1663, Working Sheets – Statement II)
39. The State of Karnataka has submitted series for 72 years from which
the data pertaining to 38 years (1934-35 to 1971-72) has been analysed by the
Assessors for working out the dependable yield using the same formula namely;
The result of analysis is given in the following table:-
Mx100 N+1
M x100 N
M x100. N
Mx100. N
Mx100. N

52
Figures in TMC
40. By analysing the Karnataka flow series of 38 years from 1934-35 to
1971-72 the dependable yield at 50% shall be about 734 TMC, whereas that of
the Tamil Nadu it shall be 740 TMC which almost tally with the earlier
assessment made by the Cauvery Fact Finding Committee.
41. It may be pointed out that some inconsistent stands have been taken on
behalf of the State of Karnataka in respect of the total yield calculated by CFFC.
The Chief Minister of the State of Mysore in the meeting of the Chief Ministers
along with the Central Minister for Irrigation and Power Dr. K.L. Rao held on
29..4.1973 accepted the total yield calculated by CFFC in its report and on basis
of that Dr. K.L. Rao made a categorical statement on the floor of the Parliament
about acceptance of the total yield aforesaid by riparian States including State of
Mysore. Dr. K.L. Rao also informed the then Prime Minister by his aforesaid
letter dated May 1, 1973 about the general consensus between the States on
the total surface yield of river Cauvery. Then a letter dated 13th June 1973 was
sent on behalf of the Chief Minister of Mysore saying that the yield of the
Cauvery basin at 50% dependability was more than 740 TMC, if calculation is
made only on the basis of the yield of 18 years flows and utilisation from 1954-
Period Dependable Yield
1934-35 to 1971-72 50% 75%
Tamil Nadu series 740 651
Karnataka series 734 649
CFFC assessment 740 670

53
55 to 1971-72 instead of 1934-35 to 1971-72. Now before this Tribunal a stand
has been taken that calculation should be made on basis of the flow series since
1900-01 to 1971-72 i.e.for 72 years instead of 38 years. In the statement
showing yield of the Cauvery river basin up to delta, based on the data from
1900-01 to 1971-72 Karnataka has itself calculated the yield for that period
(1900-01 to 1971-72) at 50% dependability to be 752 TMC vide Karnataka
Vol.64 Exh.No.517 filed on 7.11.2002; the difference is of 12 TMC only than
what was calculated by CFFC for the period 1934-35 to 1971-72. It will amount
to repetition only that the State of Mysore itself filed a statement before the
CFFC on 10.11.1972 that the total yield in Cauvery Basin within the States of
Mysore, Kerala and Tamil Nadu was 760 TMC (vide TNDC Volume XIV Page
117).
42. According to the State of Karnataka the yield for the period 1900-01 to
1971-72 at 50% dependability is 752 TMC, but the average yield is 792.3 TMC
(KR Volume No.64, Exhibit No.517). It was submitted on behalf of the State of
Karnataka that the total yield should not be calculated on 50% basis, but on
average flow. In other words, the total yield should be calculated on the basis of
average of flow series from 1900-01 upto 1971-72 which should be 792.3 TMC.
In the Statement of case filed on behalf of the State of Karnataka before this
Tribunal, at page No.79, it has been stated:- “Average flow is close to 50%
dependable flow.” Average flow has been calculated after adding the year-wise
flows from 1900-01 upto 1971-72. The Supreme Court of United States in the
case of Wyoming V. Colorado (259 US 419) has observed that the average
annual flow was not a proper measure because “crops cannot be grown on

54
expectations of average flows which do not come……” The Supreme Court
arrived at a volume, which it regarded as a “fairly constant and dependable flow
materially in excess of the lowest”, but below the average. At page 484, the
Supreme Court observed:-
“We have already indicated that, as to such a stream as this, the
average flow of all years, high and low, cannot be taken as a proper or
reasonable measure of what is available for practical use. What then
is the amount which is available here? According to the general
consensus of opinion among practical irrigators and experienced
irrigation engineers, the lowest natural flow of the years is not the test.
In practice they proceed on the view that within limits, financially and
physically feasible, a fairly constant and dependable flow materially in
excess of the lowest may generally be obtained by means of
reservoirs adapted to conserving and equalizing the natural flow; and
we regard this view as reasonable.”
43. Narmada Water Disputes Tribunal while considering the question of
apportionment on the basis of average flow relying on the aforesaid judgement
of the Supreme Court of United States said :-
“8.5.3 In examining the problem of apportionment, the possibility of
maintaining a sustained flow through storage facilities is a relevant
factor. The Volume of water in any stream varies from year to year.
By the use of a high volume of water as the basis for apportionment,
the upstream-state in a controversy will be favoured against a lower
state in years in which the volume is below the amount used as the
basis for the apportionment. In the dispute between Wyoming and
Colorado before the Supreme Court, Colorado urged that the average
yearly flow was the proper measure of apportionment of the river
waters. Wyoming claimed that the lowest annual stream flow was
proper to be taken into account.” It was held by the Supreme Court
55
that the average annual flow was not a proper measure because
“crops cannot be grown on expectations of average flows which do not
come …”/. Consequently the Supreme Court arrived at a volume
which it regarded as a “fairly constant and dependable flow materially
in excess of the lowest but below the average”/.
44. In this background, we have to proceed on the basis that the total yield
has to be determined taking into consideration as to what is the dependable flow
in the cauvery river system. The State of Karnataka itself has calculated the
yield on the basis of flow series from 1900-01 to 1971-72 at 752 TMC on 50%
dependability and 673 TMC at 75% dependability (KR Volume No.64, Exhibit
No.517).
45. The Karnataka State produced Prof. Rama Prasad as an expert
witness and his statement is on “Reconstruction of surface flows”. Prof.
Rama Prasad has made study of the gauged flows of four Central Water
Commission gauge and discharge stations, namely, Billigundlu,
Urachikottai, Kodumudi and Musiri. He has also analysed the gauged river
flows for four nodal points located within Tamil Nadu, namely, Mettur
reservoir, Upper Anicut, Grand Anicut and Lower Coleroon Anicut. He has
not made any study in respect of Central Water Commission stations
maintained within Karnataka, or any gauge and discharge sites maintained
by the Karnataka State – in particular, Krishnarajasagara, Kabini and
Hemavathy reservoirs. Prof. Rama Prasad has concluded that the gauged
data of Central Water Commission is consistent, whereas the same for
Tamil Nadu stations is inconsistent and, therefore, he has attempted to
correct the Tamil Nadu gauged flows at Mettur, Grand Anicut and Lower

56
Coleroon Anicut. Thereafter, using 19 years gauged flows of Musiri (1971-
72 to 1989-90), he has corrected flows of LCA, and used the same to hind
cast total river flows from 1900-01 to 1989-90 (for 90 years).
46. He has thereby assessed the total yield at LCA, as per his
reconstructed flows as under:-
i) Average flow - 834 TMC
ii) 50% dependable flow - 802 “
iii) 66.67% dependable flow- 732 “
iv) 75% dependable flow - 695 “
as against the CFFC’s assessment of 740 TMC at 50% dependability and
670 TMC at 75% dependability. In the statement of Professor Rama
Prasad, which has been filed on behalf of the State of Karnataka, it has
been stated by him on affidavit that he had been working in the Indian
Institute of Science, Bangalore in various capacities involving Teaching,
Research and Consultancy since 1965. Since the year 1982 he had been
working as Professor in the Department of Civil Engineering. In the year
1990, he was approached and requested to be a Member of the Technical
Committee, Cauvery Water Disputes, to advise on the Cauvery Water
Dispute pending before this Tribunal. He claims that he had gone through
the records of the case and relevant materials made available to him by
the office of the Chief Engineer, Water Resources Development
Organisation, Government of Karnataka, Bangalore. On basis of those
materials, he has reconstructed the surface flows of river Cauvery. First
he has given the details in respect of stream gauging by current meter and
57
as to how the average velocity multiplied by the area of cross section
gives the total discharge. The discharges thus measured at various
stages (i.e, water levels) of the river are sometimes used to establish a
rating curve, which then gives the discharge for a measured stage. The
discharge at dams can be determined from calibration of the spillway,
sluices, turbine gates and other outlets and the area-elevation-capacity
tables. The Cauvery is gauged at several stations through out its length.
The downstream-most station is at the Lower Coleroon Anicut (LCA). The
gauging stations are – Grand Anicut (GA), the Upper Anicut (UA), Musiri,
Kodumudi, Urachikkottai, Mettur reservoir and Biligundlu upto Tamil Nadu,
Karnataka border. Out of these, the Central Water Commission (CWC)
operates the stations at Musiri, Kodumudi, Urachikkottai and Biligundlu.
The Tamil Nadu State operates the remaining stations. It may be
mentioned that Central Water Commission has established the gauging
stations at Musiri (1972), Kodumudi (1971) and Urachikkottai (1979) within
the State of Tamil Nadu and Biligundlu (1971) at the border of Tamil Nadu
and Karnataka. On the basis of readings of the flows at Musiri, Kodumudi,
Urachikkottai and Biligundlu, he has purported to reconstruct the total
surface flow within the Cauvery basin for the period from 1900-01 to 1989-
90 and has come to the conclusion that:-
“(a) The gauged (by Tamil Nadu) flows at Upper Anicut,
Grand Anicut and Lower Coleroon Anicut are
inconsistent with each other and therefore cannot all be
correct.

58
(b) The gauged (by Central Water Commission) flows at
Biligundlu and Urachikottai on the one hand and
Kodumudi and Musiri on the other, are consistent with
each other and therefore can be considered correct. (c) The gauged flows (by Tamil Nadu) at Grand Anicut and
Lower Coleroon Anicut are underestimated as revealed
by their comparison with the gauged flows (by Central
Water Commission) at Musiri. (d) The gauged flow (by Tamil Nadu) at Mettur are
underestimates as revealed by their comparison with the
gauged flows (by Central Water Commission) at
Biligundlu.
(e) There is a well defined linear relationship between the
flows computed on the basis of Musiri (by Central Water
Commission) gauging at Grand Anicut and Lower
Coleroon Anicut on the one hand and the gauged (by
Tamil Nadu) flows at those stations on the other. (f) Since Central Water Commission gauged flows are
available only from 1971-72 onwards and Tamil Nadu
gauged flows from 1900-01 onwards, a correction of the
Tamil Nadu gauged flows from 1900-01 to 1989-90 is
necessary to arrive at the average flows and flows at
various dependability levels. (g) The linear relationship referred to in (e) above is
determined by the well known method of regression
analysis, which is widely used in similar situations. With
the help of this relationship, the Tamil Nadu gauged flows
are corrected. A long term series of gross flows at Lower
Coleroon Anicut has been developed considering
upstream withdrawals.
59
(h) This developed series leads to the following conclusions
about the gross flows at Lower Coleroon Anicut:- (i) Average flow = 834 TMC
(ii) 50% dependable flow = 802 TMC
(iii) 66.67% dependable flow = 732 TMC
(iv) 75% dependable flow = 695 TMC”
47. It may be said at the outset that it is an admitted position that
Prof. Rama Prasad has not considered the records of any gauging
stations maintained either by Central Water Commission or the State of
Karnataka within the territory of the State of Karnataka. He has also not
considered any gauging stations in the State of Kerala for the purpose of
surface flows of Cauvery river system. He has mentioned that the
methodology for consistency check is:-
“If A is an upstream station and B a downstream station, and
the flows at these stations are QA and QB respectively, then the
following equation should be satisfied:
QB = QA + RAB - SAB - WAB …… (1)
Where RAB is the runoff from the intermediate catchment
between A and B,
SAB is the final storage minus initial storage in reservoirs, if
any, between A and B during the time interval considered
and WAB is the total withdrawal/diversion between A and B,
including evaporation losses from reservoirs, if any.

60
The method for checking consistency is to calculate the right
hand side of eq. (1) using the measured values of QA, SAB and
WAB, and an estimated value of RAB, since usually no
measurement of intermediate catchment runoff is available. For
estimating this runoff, the average rainfall in the intermediate
catchment during the monsoon season is first calculated from
the measured monthly rainfall values in the catchment, and then
the corresponding runoff is read from Strange’s Tables. The
right hand side of eq (1), calculated in this way, is here called
the “calculated flow” at B, and QB is called the “gauged flow” at
B.
If the gauged flows at A and B are free from errors, then the
calculated and gauged flows at B should be equal. However,
since all measurements are subject to random errors, these
flows cannot be expected to be exactly equal in any individual
year. If the gaugings are consistent, the calculated flow will be
higher than the gauged flow for about half the number of years
on record, and less for the other half. If the calculated flow is
plotted against the gauged flow the points will be scattered
evenly about a 45 degree line (1 : 1 line) for the case of
consistent gauging excepting points which fall outside the
general trend due to unknown factors. If the gaugings are
inconsistent, the points will be scattered unevenly about the 1: 1
line with a larger number of points lying on one side of the line
than the other. This is the test for consistency applied here.”
According to his own statement for estimated runoff, the average rainfall in
the intermediate catchment during the monsoon season is first calculated
from the measured monthly rainfall values in the catchment, and then

61
corresponding runoff is read from Strange’s tables and he has applied
Strange’s tables for his conclusions regarding the total yield.
48. In this connection, it may be mentioned that the INDIAN STORAGE
RESERVOIRS WITH EARTHEN DAMS: By STRANGE was published in 1902.
The relevant part is at page 57 of TN Volume No.36, Exhibit No.1371.
Paragraph 19 of the said publication says as follows:-
“Estimation of the Run-off from the Daily Rainfall. – The proper
way to estimate the run-off, in the absence of observations of it,
will be to proceed on the lines of the above table, and, if a few
discharge observations have been taken, to construct the table
with reference to them……”
Thereafter it has been said:-
“Such estimates are but approximations, and should be resorted
to only in the absence of actual discharge observations. It is a
matter of the first importance to have such observations for as
many years as possible, and, therefore, no large scheme should
be proceeded with until a record of at least ten years has been
obtained……”
(Emphasis supplied)
49. From the well known publication by COL. ELLIS (COLLEGE OF
ENGINEERING MANUAL – IRRIGATION), the relevant part of which has been
annexed to TN Note No.16 of Group – 2. In Para No.54 (Chapter III) page
35, his opinion is:-
“54. Measurements of run-off much to be preferred to estimates
based on rainfall.—An estimating of run-off based on even the
most accurate and reliable records of rainfall is liable to very
great error, and it should be clearly borne in mind that even
approximate gaugings of actual discharge are wherever

62
procurable much preferable to estimates wholly based on rainfall
data……”
In Paragraph No.56, it has been said:-
“……In the absence of records of actual stream flow, an
estimate of run-off must be made from rainfall records but the
problem is a very complex one and the estimate is liable to
considerable errors. Generally the rainfall is the only factor
influencing run-off, of which exact measurements are available
and the others are not susceptible of exact measurement and
are stated only in general terms.”
(Emphasis supplied)
50. The Ministry of Irrigation and Power published the Report of the
Krishna- Godavari Commission in the year 1962 (TN Volume No.36,
Exhibit No.1379). Chapter IX deals with the river flow. At Pages No.123
to 129 of K.G. Commission report while discussing utility of empirical
formulae, it has been mentioned as under:-
“9-34 Binny’s percentages and Strange’s Table may have
had some merit sixty years ago, with the modern knowledge of
hydrology, these are, in the Commission’s view, completely
outmoded and unreliable.”
51. A paper co-authored by Prof. Rama Prasad was presented in a
“National Seminar on Water Resources Development” in October 1986,
wherein the reasons for large discrepancy in the estimated and actual
yield of Gundal project were analysed. Gundal Reservoir project was
designed on the basis of Strange’s table in the State of Karnataka within
Cauvery basin. Later, it was revealed that the estimated yield was very
high {against the estimated yield of 1.84 TMC (51.62 Mm3), the actual

63
yield was found to be only 0.28 TMC (7.96 Mm3)}. One of the reasons
mentioned in the paper was “inapplicability of Strange’s table of runoff” for
estimating the yield of Gundal project. Prof. Rama Prasad could not give
any satisfactory reply to the factual position during the cross examination
by the learned counsel for the State of Tamil Nadu. Attention of Prof.
Rama Prasad was drawn to the aforesaid paper, which had been co-
authored by him. Question No.1036 and reply there to are at page
No.241-242 of Volume I of his deposition:-
“Q: 1036 Now, turn to page 13-2, the next page, second
paragraph it is stated:
“Runoff is one of the basic hydrologic data and its
estimation plays an important role in the design of the
above mentioned irrigation project. Otherwise the design
with scanty hydrology data may result in failure of the
purpose for which the project is designed.”
Then it says:
“In the present case, the Gundal reservoir project in
Karnataka State has failed since the yield estimated at the
time of planning the project has not been realised after the
construction of the project.”
Have you seen that?
A: Yes.”
52. Attention of Prof. Rama Prasad was drawn to the relevant
paragraphs of Mr. Strange’s publication “INDIAN STORAGE RESERVOIRS
WITH EARTHEN DAMS’ in Questions No.559, 560 & 578 (Page No.123 and
127) of Volume-I:-

64
“Q:559 If you go back to the previous exhibit, which I gave
you, that is 1371 the learned author has himself
delineated the conditions to which his work should be
subjected. Please see the conditions, at page 18, under
the heading “19 Estimation of the run-off from the Daily
Rainfall.” It starts by saying: “The proper way to estimate
the run-off, in the absence of observations of it, will be to
proceed on the lines of the above table, and, if a few
discharge observations have been taken, to construct the
table with reference to them.” With reference to that, at
page 19, the learned author qualifies it by saying: “Such
estimates are but approximations, and should be resorted
to only in the absence of actual discharge observations.”
Do you find that?
A: Yes.
Q:560 According to Strange himself, run-off from rainfall is an
approximate method prescribed by him, and such a
method could be resorted to only if you do not have the
actual discharge observation and data. Right?
A: Yes. Q:578 I have shown you the most important note of caution
drawn by Dr.Strange, when he said that this table gives
you an estimate of approximation and should be strictly
resorted to only in the absence of actual discharge
observations being available. This is the author’s note of
caution.
A: Yes.”
[Emphasis supplied]

65
53. The witness agreed that he was aware of the caution by the
author Strange that his Table should not be used if the actual observed
data is available.
“Q.No.1011. Please come to page l9. This is what the learned
author said further about his own table. He says:
“Such estimates are but approximations, and should be
resorted to only in the absence of actual discharge
observations.”
So, the author has cautioned repeatedly, do not use this
table. If you have the actual observed data. Is that right?
A. Yes”. [Emphasis supplied]
54. In view of the aforesaid opinions of experts on the subject,
including Mr. Strange himself, Strange’s formula should be applied only
when actual gauge readings for surface flow are not available. Where
gauge readings for a sufficiently long time are available, no expert has
said to our knowledge that even in that situation any formula, including
.Strange’s table, should be applied, who has himself described it as an
approximate estimate. The gauge readings for a considerable period of
time are more reliable.
55. In the present case, Additional Advocate General for Tamil Nadu
has shown in the common format data supplied to CWDT (Exhibit E-18,
page 15 and page 17) as also in the data supplied to CFFC (Exhibit 834,
Vol. TN XIV, page 195-196) that discharge tables used for calculating
discharges at Grand Anicut and Lower Coleroon Anicut are based on
current meter observations. Same was the case in respect of other

66
structures. He has also indicated that in UNDP Report, Vol. I, page 38,
last para, a mention has been made that the Public Works Department
has taken discharge measurements at the head of three channels viz. the
Cauvery, the Vennar and the Grand Anicut Canal for 24 years (1946 to
1970) at the Grand Anicut using current meter method and are regarded
as accurate.
56. As already mentioned above, Karnataka and Tamil Nadu both
have filed flow series on the basis of gauging stations within the States of
Karnataka and Tamil Nadu before this Tribunal in November, 2002. The
State of Karnataka has furnished the flow series for 72 years from 1900-
1901 to 1971-72 on 7th November, 2002. Tamil Nadu furnished the flow
series for 38 years from 1934-35 to 1971-72 on 15th November, 2002.
The same, along with the covering letters, have been marked as KR
Volume No.64 – Exhibit No.KR-517 and TN-Volume No.45 – Exhibit
No.1663 respectively. (Copies thereof are enclosed at the end of this
chapter). It is difficult to appreciate, when the State of Karnataka has
relied on the flow series since 1900-01 upto 1971-72 before this Tribunal
as late as on 7.11.2002 then how those very flow series can be ignored or
rejected on basis of a theoretical reconstruction of flows done by Prof.
Rama Prasad on basis of the four gauging stations at Musiri, Kodumudi,
Urachikkottai and Billigundulu established by Central Water Commission
after 1971. On basis of the readings of those three stations, which are all
within the State of Tamil Nadu and one at Biligundlu at the boundary of
the State of Tamil Nadu and Karnataka, it is difficult to reject the flow
67
series submitted before this Tribunal saying that these are not reliable.
Not a single gauging station of Central Water Commission in Karnataka
has been examined. It would be relevant to point out that at no stage
either for fifty years during the continuation of the Agreement of the year
1924 or thereafter Mysore/Karnataka questioned the flow data based on
the gauging stations within the State of Madras/Tamil Nadu and
Mysore/Karnataka. This is apart from the fact that the State of
Mysore/Karnataka admitted the finding of the total yield as estimated by
Cauvery Fact Finding Committee in the meeting of the Chief Ministers in
the year 1973 and even in the meeting of the Chief Engineers held in the
year 1980. If the flow series since the year 1900-01 upto the year 1971-
72 has not been disputed by the State of Karnataka even before the
Tribunal how Prof. Rama Prasad had the occasion to reconstruct another
flow series and to estimate the total yield of river Cauvery on basis of
Strange’s table.
57. Then reference was made on behalf of the Karnataka to the
report of the Narmada Water Disputes Tribunal, Volume-I, Chapter IV,
page 42 in support of their stand that flow series for longest period should
be taken into consideration. From that report it shall appear that flows at
three sites were taken into consideration for the period 1948-49 to 1969-
70. Then it was decided to hind-cast the run-off figures based on the
available rainfall data for the earlier years. Khosla Committee had also felt
that earlier rainfall data for the periods prior to 1915 was for stations few
and far between and as such would not correctly represent the rainfall

68
over the catchment. Ultimately on basis of those figures an agreement
was reached between the party-States in respect of dependable yield at
75% to be 28 MAF. How this part of the report helps Karnataka, when
they themselves have filed flow series for a longer period than what was
available before the Narmada Water Disputes Tribunal.
58. Reference was also made to the affidavit of Prof. A.
Mohanakrishnan, Witness on behalf of the State of Tamil Nadu where it
has been stated:
“31. As the rate of flow is pulsating, so also, the annual yield
in a river system is a variant. Depending on the incidence and
the intensity of the rainfall, the run-off in the river system varies
with time and also from year to year. The statistical
characteristics of stream flow series are useful for the prediction
of future stream flows in terms of the probability of occurrence
over a period of years. The World Meteorological Organisation
adopts the data over a period of 30 years block for analysing
the rainfall and other relevant parameters. A block of 30 years
will even out the variations and would contain a series fully
representing the possible peaks and dips expected in the
meteorological phenomena.” 59. Our attention was also drawn to cross-examination of Prof. A.
Mohanakrishnan, on behalf of the State of Karnataka vide deposition of
Tamil Nadu Witness No.I, Prof. A. Mohanakrishnan, Vol.I pages 181-193.
In the questions it has been repeatedly put to the said witness on basis of
several publications that for flows or for rainfall, longer the series, better the
results, to which he has replied that series for 30 years was enough for
analysis.

69
60. The flow data submitted on behalf of the States is for the period
1933-34 to 1971-72 i.e. for 38 years. The period of 38 years is not a small
period and on basis of the annual flows during that period the conclusion
about the total yield can be arrived at along with other materials. But as
already pointed out earlier, even before this Tribunal the Karnataka itself
has filed flow series for 72 years starting from 1900-01 to 1971-72. On
basis of that Karnataka itself has calculated the dependable yield at 50% to
be 752 TMC.
61. As regards the stand of Karnataka that this Tribunal should take
into consideration the flow series for periods after 1972, it may be
mentioned that none of the party-States has filed annual flow series for the
period after 1972 for important nodal points, namely, Krishnarajasagar,
Mettur and Lower Coleroon Anicut. Unless flow series after 1972 are
made available, it is not possible to come to the conclusion that there has
been a material change in the total yield within the basin. After 1974 with
the expiry of 50 years none of the States appear to be interested in
disclosing the correct information in respect of withdrawals because of
which the details furnished in respect of flows and withdrawals by the
party-States in the common format after 1972 are disputed – by the States
of Tamil Nadu and Karnataka. Both States have alleged that the
information in respect of withdrawals furnished by either party was not
acceptable. The party States have furnished data in the Common Format
for the period 1971-72 to 1989-90. The Common Format data covers
several aspects of water resources development in the States including

70
irrigated areas, water utilization, river supplies and releases besides the
co-efficient of discharge of various structures on the basis of which
discharge observations are made during operation of the system.
However, while commenting on each other’s data, the party States,
namely, Karnataka and Tamil Nadu, in particular, have not accepted the
data furnished by either of them to the Tribunal.
(Ref: Exh. E-8 – Comments of Karnataka on Tamil Nadu’s data;
Exh.E-7 and E-9 – Comments of Tamil Nadu on Karnataka’s data)
Kerala 62. So far the State of Kerala is concerned since the initial stage, it
has supported the finding of the Cauvery Fact Finding Committee that 740
TMC of water was available in the Cauvery system in an average year. It
also supported Tamil Nadu that the Chief Ministers of Karnataka, Kerala
and Tamil Nadu had accepted the said finding of the Cauvery Fact Finding
Committee. In the Statement of Case filed on behalf of the State of Kerala
(Volume No.I) at Page No.39, it has been stated:-
“4.1.4 Kerala contributes 147 TMC of water to the Cauvery
basin. Out of 740 TMC available for the entire basin, it works
out to 20% of the total yield……….”
63. Again at page No.47 while summing up the claim on behalf of
the State of Kerala, it has been stated:-
“4.2 To sum up:
1. Contribution of the Cauvery Basin within the State of Kerala
is about 20% of the total yield of 740 TMC and considering the
peculiar needs of Kerala as an overpopulated and industrially
underdeveloped State with considerable potential for

71
development claims of the State of Kerala for a reasonable
share of the water of Cauvery – worked out at 99.8 TMC – is
only just and fair and this has to be allocated to Kerala……”
64. Regarding the findings of the Cauvery Fact Finding Committee,
it has been stated at page No.9-10:-
“1.11 Chief Minister’s meeting on 29.4.1973
1.11.1 A meeting of the three Chief Ministers was convened by
Dr. K.L. Rao on 29th April, 1973. In the meeting the report of the
Cauvery Fact Finding Committee was considered. The following
decisions were made;
(1) The assessment of the yield in the Cauvery basin (av.
740 TMC) by the Committee was generally agreed by all
States. …………………….”
65. Before this Tribunal, in the rejoinder filed on behalf of the State
of Kerala to the Counter Statement of the State of Tamil Nadu page 13-
14, it has been stated:-
“The CFFC estimated the flow at 740 TMC in the Cauvery
based on 50% dependability. There is no reason to depart from
such a approach. Any attempt to reopen the issue by a fresh
approach would not only be unwarranted but would delay the
settlement of the dispute.”
66. It shall appear that by letter dated 15.2.1975 Government of
India had sent a draft on the use and development of Cauvery waters as
proposed by the State of Kerala to the Chief Secretary, Tamil Nadu. In the
terms and conditions of the proposed agreement, Kerala had stated:-

72
“The Fact Finding Committee constituted by the Government of
India during the negotiations has found that 740 TMC of water is
available in the Cauvery system in an average year and this has
been accepted by the Chief Ministers of Karnataka, Kerala and
Tamil Nadu.”
(Ref. TN Vol. XVI, Exh. 847, Pages 4, 6 & 7)
Having accepted the finding of the Cauvery Fact Finding Committee in
respect of the total yield of the Cauvery basin being 740 TMC at 50%
dependability, during arguments a stand was taken on behalf of the State
of Kerala that the total yield was more than 740 TMC. Several grounds
have been mentioned in the Note No.7 on Group No.2 filed on behalf of
the State of Kerala challenging and questioning the finding of the CFFC in
respect of the total yield of the Cauvery basin being 740 TMC. In this
connection reliance was also placed on the evidence of Prof. Rama
Prasad, the Witness No.5 examined on behalf of the State of Karnataka
on the total yield of the Cauvery basin. The evidence of Prof. Rama
Prasad has already been discussed and considered while dealing with the
claim of the State of Karnataka and there is no necessity to repeat the
same.
67. In this background, it is not open to the State of Kerala to claim
before this Tribunal, during arguments that the total yield of the Cauvery
basin is more than 740 TMC when it was their consistent stand since 1974
upto the stage of arguments before this Tribunal that the total yield was
about 740 TMC at 50% dependability.
Union Territory of Pondicherry

73
68. The Union Territory of Pondicherry during the course of
arguments have stated as under:-
“The Union Territory of Pondicherry respectfully submits that the
Cauvery Fact Finding Committee (CFFC) has correctly
determined the total quantity of water in the river Cauvery and
there is no reason to doubt or make a reassessment of the
same.’ (Ref: Union Territory of Pondicherry Notes of Arguments
on Issues under Group-2, para 2)
The Union Territory of Pondicherry have further pointed
out that all the party States accepted the finding of the Cauvery
Fact Finding Committee as to the yield in the river Cauvery.
This is reflected in the meeting held on 29.4.1973 by the
Minister of Irrigation & Power, Government of India and with the
Chief Ministers of Kerala, Mysore and Tamil Nadu.”
69. The Union Territory of Pondicherry stated that at the meeting of
the Chief Ministers of the three States on 29.4.1973, request was made to
the Government of India seeking revival of the CFFC. The terms of
reference related only to a review of the data supplied to it earlier by the
State Governments in respect of areas cropped, net area irrigated,
irrigated cropped area and other data relating to water utilization at
different points of time and to undertake such verifications as is necessary,
from other data available with the State Governments. There was no
reference for a re-assessment of the yield of the river Cauvery. Even the
additional report of CFFC there is no change in the assessment of yield
made by it in the main report.

74
70. In such a situation on basis of the materials produced before this
Tribunal and referred to above, the total yield of the Cauvery basin at 50%
dependability is about 740 TMC and at 75% dependability is about 670
TMC.

75
KARNATAKA
Exh.. KR No 517
Vol No. 64
Mohan V.Katarki, Advocate, Cauvery Water Cell, Supreme Court, Karnataka Bhavan , August Kranthi Marg, New Dclhi - 110049 3 Date: 7-11-2002. To: The Registrar,
Cauvery Water Tribunal, Janapath Bhanvan, Janapath, New Delhi.
Sir,
Sub: The aVerage yield in the Cauvery River Basin above and upto delta based n long term data.
i I
Ref: 1. Letter No.PWDI3/LCA/80(P.m dated: 2.2.1981. From the Special Secretaly, Government of Kama taka to The Secretaly to Government of India, Mittistry of Inigation & Agnculture, New Delhi, - filed in KRD Vol. II SI.No.185 •. Page568.- . .. .
2. Draft Agreement for Development and Use' of the Waters of the Cauvery Basin, Kamataka January 1981 - filed before CWOT in KR.D Vol.ll Sl..N0.191,Page 592 to 593.
**********
With reference to the above the Statement showing the average yield in the Cauvery River Basin above and upto based on the long term data from 1900-01 to 1971-72 is 792 ~. The detail calculation of the yield of Cauvery Basin as at Lower
Colcroon Anicut is enclosed herewith.
The above document as please be taken on record.
Yours faithfully,

76
Year Flow at LCA Upstream Withdrawals Gross yield
as per Col. 27: utilisation at Hullahalli at LCA.
under Anicut
of River Register;
channel 1 '2 3 4 5
1900-01 702.2 212.5 10.5 925.2
1901-02 437.1 212.8 10.5 660..4 1902-03 486.3 213.1 10,5 709.9 1903-04 881.1 .' 213.4 10.5 .1105.0 1904-05 400.4 . 213.7 10.5 624.6 1905-06 485.0 . 214.0 10.5 709.5' 1906-07' . 467 .. 3 : , , 214.3 10.5 692.1 1907-08 . 602.1 , 214.6 10.5 827.2 1908-09 465.5 . 214.9 10.5 690.9 1909-10 775.2 215.2
. 10.5 1000.9
1910-11 1095.0 21.5.5.
10.5 1321.0 1911-12 615.6 215.8 10.5 841.9 1912-13 657.3 216.1 10.5 883.9 1913-14 502.1 216.4 10.5 729.0 1914-15 485.9 216.7 10.5 713.1 1915-16 412.9 217.0 10.5 640.4 1916-17 683.7 21'7.3 10.5 911.5 1917-18 425.7 217.6 10.5 653.8 1918-19 236.3 217.9 10.5 464.7 -- ..
834.4 1919-20 605.7
218.2
.
10.5
1920-21 694.4 218.5 10.5 .923.4 1921-22 600.5 218.8 : 10.5 829.8 1922-23 584.0 219.1 10.5 8111.4 1923-24 936.0 219.4 10.5 1166.1 1924-25 986.6 219.7 10.5 1216.8 1925-26 460.0 220.0 10.5 690.5 1926-27 444.3 220.3 10.5 675.1 1927-28 471.6 220.6 10.5 702.7 1928-29 363.5 220.7 105 594.7 1929-30 520.5 220.7 10.5 751.7 1930-31 677.3 220.7 10.5 908.5 1931-32 654.3 220.7 10.5 , 885.5 1932-33 696.8 220. 7 I 10.5 928.0
I
1933-34 945.6 220.7 10.5 1176.8 1934-35 345.5 220.7 10.5 576.7 1935-36 415.9 221.3 10.2 647.3 1936-37 441.3 221.9 9.8 673.0 1937-38 400.8 . 222.5 7.8 . 631.1 1938~3
9 375.3 223.1 9.0 607.4
1939-40 539.3 223.7 9.8 772.8

77
. Year Flow at LCA' Upstream Wllithdrawals Gross yield as per Co/.27 utillsation at Hullahalli at LCA. Of River Register under Anicut channel etc
1 2 3
" 5
1940-41 663.7 224.3 9.5 897.5 1941-42 528.0 225.2 11.0 764.2 1942-43 536.6 226.1 10.8 773.5 1943-44 613.8 227.0 11.2 852.0 1944·45 495.5 227.9 9.8 733.2 1945-46 326.5' 228.8 10.6 565.9 1946-47 831.5 229.7 11.0. 1072.2
1947-48. 492.7 230.6 10.7 734.0 1948·49 486.1. 231.5 10.6 728.2 1949-50 356.5' 232.4 10.2 599.2 1950-51 468.2 ;?33.3 10.0 711.5 1951-52 344.9 234.2 9.4 566.5 1952-53 271.7 235 . 1 9.3 516.1 -
: 1953-54 618.1 .. 230.0 9.8 . 803.9 1~)5"-55 . G09.9 230.9 11.2 850.0 1955-56 352.4 237.9 10.8 601.1 1956-57 711.7 239.0 10.5 961.1 1957-58 .535.4 242.0 9.9 787.3 1958-59 557.6 245.0 10.8 ~ . 813.4
1959-60 826.0
248.0 10.5
1084.5
1960-61 520.6 251.0 9.9 781.6 1961-62 924.7 254.0 11.2 1189.9 1$62-63 720.8 257.0 13.0 990.8 1963-64 413.0 260.0 11.1 684.1
. 1964-65 705.9 263.0 11.7 980.6 1965-66 267.0 266.0 11.4 544.4 1966-67 471.5 269.0 9.3 749.8 . 1967-68 367.7 272.0 10.8 650.5 1968-69 380.8 275.0 11.3 667.1 W69-70 389.8 270.0 11.5 679.3
1970-71 430.0 2B1.0 11.5 722.5 1971-72 784.1
490.0
283·O d
__
10.2
. ABSTRACT
--- Period
50% 75% 1900-01
Average 792.3
752.0 . 673.0 To 1971-72 .
Source: DELIBERATIONS AND CORRESPONDENCE REGARDING
CAUVERY WATERS (August 1978- February 1982) Pages 123-125.
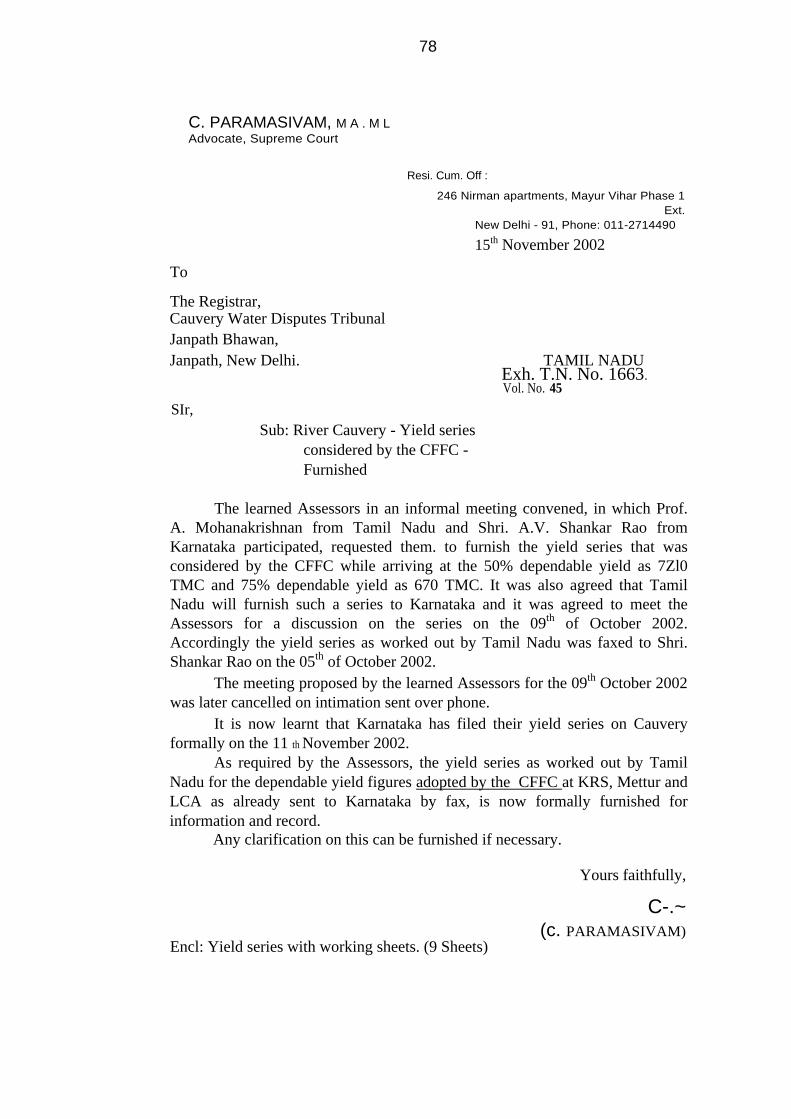
78
C. PARAMASIVAM, M A . M L Advocate, Supreme Court
Resi. Cum. Off :
246 Nirman apartments, Mayur Vihar Phase 1 Ext.
New Delhi - 91, Phone: 011-2714490
15th November 2002
To The Registrar, Cauvery Water Disputes Tribunal Janpath Bhawan, Janpath, New Delhi. TAMIL NADU Exh. T.N. No. 1663 . Vol. No. 45 SIr,
Sub: River Cauvery - Yield series considered by the CFFC - Furnished
The learned Assessors in an informal meeting convened, in which Prof.
A. Mohanakrishnan from Tamil Nadu and Shri. A.V. Shankar Rao from Karnataka participated, requested them. to furnish the yield series that was considered by the CFFC while arriving at the 50% dependable yield as 7Zl0 TMC and 75% dependable yield as 670 TMC. It was also agreed that Tamil Nadu will furnish such a series to Karnataka and it was agreed to meet the Assessors for a discussion on the series on the 09th of October 2002. Accordingly the yield series as worked out by Tamil Nadu was faxed to Shri. Shankar Rao on the 05th of October 2002.
The meeting proposed by the learned Assessors for the 09th October 2002 was later cancelled on intimation sent over phone.
It is now learnt that Karnataka has filed their yield series on Cauvery formally on the 11 th November 2002.
As required by the Assessors, the yield series as worked out by Tamil Nadu for the dependable yield figures adopted by the CFFC at KRS, Mettur and LCA as already sent to Karnataka by fax, is now formally furnished for information and record.
Any clarification on this can be furnished if necessary.
Yours faithfully,
C-.~ (c. PARAMASIVAM)
Encl: Yield series with working sheets. (9 Sheets)

79
Source: Col.3: As per Working sheet II(a) Col.4: As per Data given to CFFC - Working Tables- TNDC Vol.X Col.6: As per working sheet II(b)
Col.7: As per data given in CFFC’s additional report-TNDC Vol.XV. Figures given for 1928, 1956 and 1972. Figures for 1934-35 to 1971-72 are worked out adopting linear variation Col.8: As per Data given to CFFC - Working Tables - TNDC Vol. X
GROSS YIELD AT METTUR AND LOWER COLEROON ANICUT Fla ures In TMC Abstractio
n Inflow Yield Total Domesti
c Total yield Col.5 in Col.9 in
SI. Year above at at Abstraction
use in Surplus at LCA Descending Descending No. Mettur Mettur Mettur below Tamil Nadu at LCA Col. 3 + order order Col.
3+co1.4 Mettur 6+7+8
(1 ) (2) (3 (4 (5 (6 (7) (8) (9) (10 (11 ) 1 1934-35 97.842 282.178 380.020 446.335 1.607 32.683 578.467 929.097 1205.212 i 2 1935-36 117.616 289.410 407.026 470.138 1.675 59.880 649.309 802.961 1102.698 3 1936-37 119.364 334.670 454.034 503.555 1.743 55.738 680.400 744.553 1089.388 4 1937-38 118.271 280.670 398.941 446.775 1.811 72.468 639.325 718.060 1018.709 5 1938-39 117.342 301.322 418.664 432.653 1.879 56.150 608.024 673.738 1006.995 6 1939-40 128.982 327.356 456.338 487.783 1.946 157.726 776.438 661.201 973.942 7 1940-41 136.296 430.197 566.493 494.016 2.014 273.849 906.175 659.956 906.175 8 1941-42 119.512 349.506 469.018 510.882 2.082 140.800 773.276 621.735 876.653 9 1942-43 138.159 367.410 505.569 551.791 2.150 94.507 786.607 621.009 876.001 10 1943-44 144.895 476.840 621.735 540.459 2.218 168.998 856.570 612.359 856.570 11 1944-45 124.949 302.617 427.566 509.711 2.286 99.248 736.194 566.493 829.876 12 1945-46 130.784 234.689 365.473 413.785 2.354 23.363 570.286 554.259 802.293 13 1946-47 156.972 516.766 673.738 574.247 2.421 355.748 1089.388 547.308 798.314 14 1947-48 146.050 375.955 522.005 487.910 2.489 103.699 740.148 533.087 786.607 15 1948-49 137.554 395.533 533.087 521.444 2.557 74.002 735.557 533.040 781.489 16 1949-50 127.950 326.159 454.109 456.043 2.625 20.469 607.087 533.032 776.438 17 1950-51 134.941 389.525 524.466 495.873 2.693 61.931 695.438 524.466 773.276 18 1951-52 151.126 288.371 439.497 429.674 2.761 17.274 600.835 522.005 760.71 j 19 1952-53 121.480 272.048 393.528 389.053 2.829 9.682 523.044 505.569 740.148 20 1953-54 172.147 489.054 661.201 588.738 2.896 112.872 876.653 497.878 736.194 21 1954-55 154.004 458.355 612.359 609.100 2.964 109.933 876.001 487.049 735.557 22 1955-56 131.934 290.938 422.872 434.321 3.032 40.425 609.712 483.581 716.929 23 1956-57 176.093 541.967 718.060 619.323 3.100 175.426 973.942 469.018 696.653 24 1957-58 152.156 402.103 554.259 529.007 3.227 117.904 802.293 456.338 695.438 25 1958-59 168.891 452.118 621.009 572.157 3.353 85.474 829.876 454.109 680.40n 26 1959-60 174.244 628.717 802.961 653.456 3.480 271.518 1102.698 454.034 671.856 27 1960-61 176.411 370.897 547.308 563.041 3.607 55.256 798.314 439.497 670.200 28 1961-62 178.937 750.160 929.097 663.007 3.733 359.535 1205.212 439.024 653.115 29 1962-63 180.763 563.790 744.553 598.785 3.860 235.301 1018.709 435.090 649.309 30 1963-64 168.695 329.183 497.878 478.011 3.987 45.961 696.653 427.566 639.325 31 1964-65 183.306 476.650 659.956 681.955 4.113 137.620 1006.995 422.872 609.712 32 1965-66 159.944 188.768 348.712 352.751 4.240 24.595 541.530 418.664 608.024 33 1966-67 157.301 277.789 435.090 504.595 4.367 94.450 760.713 407.026 607.087 34 1967-68 174.910 264.114 439.024 438.012 4.493 35.699 653.115 398.941 600.835 35 1968-69 177.137 306.444 483.581 485.456 4.620 2.987 670.200 393.528 578.467 36 1969-70 182.845 304.204 487.049 461.650 4.747 22.615 671.856 380.020 570.286 37 1970-71 186.178 346.854 533.032 492.531 4.873 33.346 716.929 365.473 541.530 38 1971-72 185.785 347.255 533.040 539.407 5.000 51.297 781.489 348.712 523.044 Total 5711.765 14330.582 20042.347 19427.429 115.832 3890.429 29145.455 Averaae 150.310 377.121 527.430 511.248 3.048 102.380 766.986 Yield at 50% dependabilitv 505.569 740.148
Yield at 75% dependabilitv 437.057 651.212

80
Chapter 2
What should be the basis on which the availability of waters be
determined for apportionment - whether at 50% or 75%.
Dependable Yield: The natural annual virgin runoff of a river at its terminal site is
called the yield of the river system in a water year (1st June to 31st May of
next year). Yield of a river system depends upon rainfall, catchment
area characteristics, including soil types, land vegetal cover alongwith
various climatic parameters affecting evapo-transpiration in the basin.
The annual yield of a river basin varies from year to year depending
upon the occurrence of rainfall, its intensity and distribution in time and
space. Although, water is a renewable resource, it is not unlimited in
quantity, more so, the supply of water in a tropical region like Cauvery
basin is seasonal depending upon two monsoon seasons (namely south-
west and north-east) and may not be available when required, where
required and in the quantity required, unless it is properly
conserved/stored. Since the annual yield varies from year to year, it is
important to work out a figure of sustainable utilizable flow which could
be considered for allocation among the party States. It is here that the
dependability of the available flows (yield) assumes importance.
2. There are two aspects for consideration of dependability
factor:-

81
i) For allocation of shares from the total utilizable flows
amongst the party States, what should be the dependability
factor?
ii) For designing individual irrigation projects, what should be
the dependability factor?
3. With the increasing demand for water, consistent efforts are
being made by the party States for enhancing the availability of utilizable
waters by constructing new storage reservoirs within the Cauvery basin,
and Karnataka has already taken a lead in this. Since bulk of surface
flow is used for agriculture purposes where the raising of crops and their
production is highly dependant upon timely support of irrigation water at
critical stages of crop growth, the regulated releases from the storage
reservoirs becomes imperative. In view of the above consideration, the
allocation of available utilizable water needs to be made keeping in view
the dependability factor based on the facilities for storage of water
available during any rainy season.
4. The State of Tamil Nadu having not disputed the finding
regarding the yield of river Cauvery as recorded by the Cauvery Fact
Finding Committee, took a stand that the dependability of the yield
should be calculated at 75% and not on the basis of long term average
which is the stand of the State of Karnataka.
5. The State of Karnataka in their Statement of Case has pleaded
as under:-

82
“16.7 The dependable flow which is to be distributed
equitably among the basin States should be the average of the
measured flows over the largest number of years for which
reliable data are available. The average flow is obtained from
the data by adding the flows of all the series of reliable years
divided by the number of years over which the reliable
measurements are taken. Except by an agreement the
mean/average flow is the only correct estimate of the flow in
the river to be distributed. Any higher dependability of flow
means wastage in larger number of years than the normal or
average year flow. Higher dependability is only used for
domestic use, and power generation purposes. In the case of
irrigation, the internationally accepted norm is to use the
average flow for distribution. The latest example is that of the
Ravi-Beas and earlier the Indus Basin. Separate provision is
to be made for the distribution of surplus flows and deficit flows
from the average flows. Average flow is close to 50%
dependable flow…………….”
(Emphasis supplied) (Ref. KAR-I, Pages 78-79, Para 16.7)
6. Before we examine this aspect of the matter as to whether the
total yield of river Cauvery should be calculated at 50% dependability or
75% dependability, a special note has to be taken that in none of the
disputes relating to sharing of the waters of any particular river in India in
respect of which Tribunals have been constituted, there was so much of
shortage and scarcity of the total yield of water in those rivers. Cauvery
as already observed earlier is a river of blessing for the States including
Union Territory of Pondicherry through which it passes before merging in
the sea. But because of the very low total yield in comparison to other

83
rivers in India at times it has proved to be a river of sorrow and has led to
disputes for sharing of the water of the said river between the different
riparian States specially between the States of Mysore/Karnataka and
Madras/Tamil Nadu. The dispute is going on for more than 150 years,
details whereof have already been given in earlier volume of the report.
The first agreement in respect of Cauvery was entered into between the
States of Mysore and Madras after correspondence between the two
States for several years, in the year 1892 referred to above. Then
another agreement about sharing of the water of the said river Cauvery
and its tributaries was entered into in the year 1924. That agreement is
to be reviewed and re-examined for purpose of fresh allocation of water
between the different riparian States in terms thereof. In this
background, it has to be determined as to what is the dependable
percentage 50% or 75%. It has also to be borne in mind that Tamil Nadu
being a lower riparian State is naturally interested in assuring the
dependability at 75%.
Utilizable water resources:
7. Utilization of water resources can be taken as the quantum of
withdrawal of water from its place of natural occurrence such as river or
ground water. This approach has been used more commonly and was
also used by the Central Water Commission in assessing the water
resources of the country.
8. Within the limitations of physiographic conditions, hydro-
meteorological parameters and socio-political environment, legal and

84
constitutional constraints and the available technology of development,
utilizable quantities of water from the surface run-off have been
assessed by different authorities differently. These are indicated below:-
(i) Irrigation Commission 1972, placed the country’s utilizable
quantity at 666 cubic km (1 cubic km = 35.283 TMC) from
surface structures (i.e. storages and diversion structures
Anicut, Barrages etc.); it amounts to 35% of the surface water
resources of the country (annual run-off).
(ii) Dr. K.L. Rao put the utilizable quantity much more and has
suggested that the quantum should be about 50% of the
country’s available annual surface water resources.
(iii) The National Commission on Agriculture, 1976 have
estimated the utilizable quantity as 750 cubic km. This
quantum constitutes about 56% of the annual average flow of
the river.
It may be mentioned, that the above estimates have been made
independently by the two Commissions and Dr. K.L. Rao, renowned
water resources Expert. (Ref. CWC Publication No.30/88 on Water
Resources of India, Page 22)
Improving utilizable flows:
9. The development and utilization of river waters for agriculture
purposes consumes the bulk of the available flows in a river and only a
small percentage is utilized by way of domestic, industrial and other
beneficial uses. In the earlier times when the development of irrigation
was in primitive stages, water was withdrawn from streams and rivers by
diverting small quantities only, whereas the bulk of the flows were
85
running in the rivers downstream, which emptied into the sea. Since the
quantities withdrawn were very little, their assurance was almost 100%.
Later on, with the increase in the demand for irrigation, regular anicuts
and other diversion structures were constructed and more quantities of
water withdrawn from the rivers. Even at that stage, the withdrawn
quantity was almost fully assured. With the further development of
technology in water resources as well as agriculture sector, the
extension of irrigation facilities in larger areas became necessary and
along with that, some small and medium storage reservoirs came to be
built. The design of projects fed by such storages was again of a higher
dependability.
10. When the planned development of irrigation was undertaken in
the country, larger storage reservoirs had to be built for impounding flood
flows of the rivers and utilizing the same in a regulated manner for needs
of agriculture and other uses. Keeping in view, the economic
consideration and other factors, the design of these large reservoirs was
limited to 75% dependable flow at these reservoir sites and, projects to
be served by those reservoirs were assured 75% dependability i.e. the
farmers could normally receive designed supplies for their crops in every
three years out of four year period; of course, this stipulation restricted
the area to be covered by such projects.
11. Later on when the demand of water for agriculture and other
uses further increased and difficulties were experienced, specially in the
arid and other water-short regions of the country for raising crops, much

86
larger storages which could trap river flows at 50% dependability, were
permitted. Such larger storages obviously required greater financial
investments but they helped greatly in improving the quantum of
utilizable flows of a river system. From the above, it would be seen that
increase in the quantum of utilizable flows had been gradual and linked
with the demand of water for agriculture and other beneficial uses.
12. Coming to the Cauvery river basin where the demand of water
is almost twice the quantum of available flows and the concerned
riparian States having already constructed the reservoirs, which would
impound larger quantities of river flows will it be proper to calculate the
dependability at 75%? Here, it may also be mentioned that the
consideration of utilizable quantum of water in a river system is of much
more importance than the 75% or 50% dependability factors. For
example, even in the Cauvery basin, the delta region, which receives
heavy precipitation during the north-east monsoon, bulk of which flows
down to the sea, is not considered for being counted in the available
yield of the river. This is simply because that quantum of water cannot
be stored for any beneficial use, rather it creates problems of flood
congestion in the delta region and consequent damage to the standing
crops.
13. India is blessed with several major river systems. The rivers in
the north like Ravi, Beas, Sutlej, Ganga, Yamuna and Brahamputra etc.
are perennial rivers fed by rainfall and snow-melt from the Himalayan
ranges. In the central and southern parts of the country, major rivers like

87
Narmada, Godavari, Krishna, Chambal etc. are mainly fed by the south-
west monsoon, which occurs during June to September. Further south,
it is only the Cauvery river basin, which comes under greater influence of
two monsoon seasons namely: south-west monsoon and north-east
monsoon.
14. As mentioned earlier, the dependability factor indicates the
degree of assured supply available on the basis of which a
project/scheme for any particular use has been designed. Since heavy
financial investments are involved in the projects for development of
water resources, it is obvious that the assessment of availability should
be fairly reliable. In order to economize on the cost of construction of
storage reservoirs, a criterion of 75% dependability was adopted. In this
connection, the Bureau of Indian Standards has prescribed as under:-
“The active or conservation storage in a project should be
sufficient to ensure success in demand satisfaction, say 75
per cent of the simulation period for irrigation projects,
whereas for power and water supply projects success rates
should be 90 per cent and 100 per cent respectively.
These percentages may be relaxed in case of projects in
drought prone areas…………”
(Ref. I.S. Code: Fixing the Capacities of Reservoirs, IS 5477
(Part I): 1999, Para 4.2.2)
By the above provision, it is meant that at a particular storage site, the
construction of a reservoir was designed to store about 75% dependable

88
flows of the river, passing at that point. Accordingly, the project areas
where irrigation facilities were to be provided were also restricted in
extent and only that much area was considered for providing irrigation
facilities, which could be covered by 75% dependable flows. These
provisions related only to the construction and operation of the irrigation
projects and accordingly, the areas to be covered by irrigation were
restricted.
15. As more than 1/3rd of the country is occupied by arid and semi-
arid areas, which got affected by droughts, due to low rainfall, which is
also erratic, the rainfed agriculture in such areas used to suffer a lot. It
was, therefore, considered necessary to over-come this difficulty. In
such situations, the dependability factor is further lowered while
designing the project. The Govt. of India, therefore, permitted
construction of larger storages, which although involved higher
investment in their construction, but at the same time, would be capable
of storing more water during good rainfall years; thus increasing the
quantum of utilizable water. In this connection, the Govt. of India in the
year 1983 issued a circular to all the States, permitting them to make
investments for construction of storage reservoirs to store 50%
dependable flows in water short areas.
16. It may be mentioned that the States of Karnataka and Kerala
while furnishing information in the Common Format, have indicated that
most of their projects have been designed on 50% dependability.

89
[Ref. Hemavathi reservoir – KAR Vol. VIII, Page 1, Item 4 and E
65, Page 2, Item 4.
Harangi reservoir – KAR Vol. IX, S.No.302, Page 21, Para
4.8 and E 69, Page 2, Item 4 Kabini reservoir – KAR Vol. VII, Page 8 & Page10,
Chapter 2, Para 1(iv) and E-68,
Page 3, Item 4] 17. As regards the State of Kerala, the information on different
projects filed before the Tribunal indicates that they have worked out the
yield adopting Empirical Formula (Inglis Formula), which they call as
available yield. They have further mentioned that since water utilization
in their different projects is in small quantities compared to the available
yield, their projects will be successful.
18. Even in Tamil Nadu, in the case of Lower Bhawani reservoir
project, which came into operation from the year 1953 onwards, the
intermittent system of allowing supplies to the area was followed from the
years 1953-54 to 1958-59. But paddy cultivation was on the increase
and it resulted in scarcity of supplies especially at the tail ends. Hence, a
zonal system of irrigation is being followed from the year 1959-60.
According to this system one half of the entire ayacut area will get supply
from 15th August to 15th December and other half from 16th December to
15th March. There will be no crop restriction during the first turn season,
and the ryots are free to raise paddy. During the second turn season,
only dry crops are permitted. (Ref. TN Vol. XI, Exh.710, Page 98, item
28). From the above, it would be seen that when water scarcity is felt,

90
the State Governments themselves resorted to rotational system of wet
and dry crops to minimize consumption of water. This principle needs to
be followed by all the States as far as possible in the interest of
cooperation amongst them and equitable benefits accruing to their
farmers.
19. While dealing with the utilization of flows of lower dependability,
the Irrigation Commission 1972 has observed as under:
“……………It is obvious that the higher the dependability, the
less the quantity of water available for utilization. Availability
can, however, be improved by providing an extra capacity in
the reservoir for carrying over supplies from surplus years to
lean years. By adopting this device, a project can be
designed on river flows of lower dependability to provide a
larger volume of water to irrigators, with the same degree of
assurance. But the provision of carry-over capacity in a
reservoir entails additional cost and it becomes a matter of
evaluating the additional supply against the additional cost.
The more precious the water in an area, as in drought areas,
the greater is the justification for providing a carry-
over…………..”
(Ref: Report of the Irrigation Commission 1972, Vol.I, Page 125, Para 6.53)
20. On the issue of determination of available waters and the basis
(dependability) for the same, the Krishna Water Disputes Tribunal in their
report has mentioned as under:-
“Dependable flow is the magnitude of river flow which may be
assuredly expected at a given point on the river on some
scientific or rational basis inspiring confidence.”
(Ref. KWDT Vol.I, Chapter IX, Page 74, left column, second para)

91
After hearing the parties to the dispute, the Tribunal concluded as
under:-
“With the able assistance of the parties and after thorough
examination of all the material on record and after a careful
consideration of the matter, the Tribunal directed that the
series of discharge data from 1894-95 to 1971-72 be prepared
on the lines indicated by the Tribunal, which represented the
views of the Tribunal on all matters in controversy between
the parties. The States of Maharashtra, Mysore and Andhra
Pradesh submitted on the 4th May, 1973 separate documents
marked X, Y and Z containing the annual flow series at
Vijayawada for the years 1894-95 to 1971-72. The 75 per
cent dependable flow from each of these series works out to
2,060 TMC.”
“After scrutinizing the documents the parties submitted
an agreed statement stating that the 75 per cent dependable
flow of the Krishna river at Vijayawada for the purpose of the
case may be adopted as 2060 TMC. This statement which is
Ex. MRK-343 is set out at the end of this Chapter. It is a
matter of great satisfaction that the dispute on a very crucial
matter in the case which had been the subject matter of
serious controversy between the parties and which was
mainly responsible for the prolongation of the trial in this case

92
has been thus satisfactorily resolved. We place on record our
appreciation of this attitude adopted by the parties.
The Tribunal hereby determines that for the purpose of
this case the 75 per cent dependable flow of the river Krishna
upto Vijayawada is 2060 TMC.”
(Ref. KWDT Vol.I, Chapter IX, Page 81, Right column, First
three paras)
21. While considering relevancy of dependable flows, Narmada
Water Disputes Tribunal has stated as under:
“In examining the problem of apportionment, the possibility of
maintaining a sustained flow through storage facilities is a
relevant factor.”
The Narmada Water Disputes Tribunal in its final order and decision
under Clause II has mentioned as under:-
“Clause II: Determination of the utilizable quantum of
Narmada waters at Navagam Dam Site.
The Tribunal hereby determines that the utilizable
quantum of waters of the Narmada at Navagam Dam Site on
the basis of 75 percent dependability should be assessed at
28 Million Acre Feet (34,537.44 M.Cu.M.)”
(Ref. NWDT Final Order Chapter XX, Clause II)
A reference to Clause IX of the final orders of the Narmada Water
Disputes Tribunal indicates that although the actual inflow at 75%
dependability, was only 27.01 MAF (1 Million Acre Feet = 43.56 TMC) at
Sardar Sarovar dam, but, this quantum was brought upto utilizable

93
quantum of 28.00 MAF, by means of carry-over in various reservoirs
allowing for evaporation losses and regeneration. This decision was
taken as per the agreement between the concerned parties. For
distribution amongst the various parties, utilizable quantity of 28 MAF
was considered and apportioned.
(Ref. NWDT final order Chapter XX, Clause IX, Para 1)
22. From the Godavari Water Disputes Tribunal report it shall
appear that the States of Maharashtra, Karnataka, Madhya Pradesh and
Orissa had been agitating their claim in the Godavari basin in connection
with different projects. However, all States in respect of different projects
agreed that dependability be calculated at 75%. The States of
Maharashtra and Karnataka entered into an agreement on 4th August
1978 in connection with Polavaram project in Godavari basin. On that
basis dispute was settled regarding the percentage of the dependability.
Similarly, in respect of Indravathi project there was an agreement at 75%
dependability between the different contesting States. As the dispute
whether the dependability should be fixed at 75% or 50% was settled by
an agreement with the aforesaid cases pending before the Krishna Water
Disputes Tribunal, Narmada Water Disputes Tribunal and Godavari
Water Disputes Tribunal, it can hardly be used as precedents for
determination of that question when the party States are not agreeing.
There the reason for agreement was obvious because those rivers and
basins were not such deficit rivers and basins as is the case of Cauvery.
The river Cauvery and its basin is not only deficit so far the total yield is

94
concerned, but the demands of the riparian States are much more.
CFFC as referred to above at page 44 of T.N.D.C. Vol. XV has said:
“Thus the total present utilization of Cauvery waters as
indicated by the States is about 21238 M.cu.m. (750 TMC)
against the total planned use of 35693.00 M.cu.m. (1260
TMC).”
[Emphasis supplied]
23. The report of the Ravi & Beas Waters Tribunal, 1987 mentions
in Chapter-6, Page 19 of the report as under:-
“After partition the surplus Ravi-Beas waters available for
utilization, excluding the pre-partition use of 3.13 MAF, were
worked out to be in the order of 15.85 MAF based on the mean
supplies, 1921-1945 series. On 29th January, 1955, the
Minister of Works and Power, Govt. of India, succeeded in
securing an agreement between the concerned States
whereunder 15.85 MAF of the waters of the Ravi and the Beas
came to be allocated between the concerned States…………..”
(Ref: Report of the Ravi & Beas Waters Tribunal, Chapter VI,
Page 19, last 8 lines of second para)
[Emphasis supplied]
24. On behalf of Tamil Nadu reference has been made in support of
their stand that the dependability should be based at 75%, to the
observations and findings in connection with sanctioning of projects, i.e.
in respect of construction of reservoirs and the areas to be irrigated from

95
such reservoirs. Those observations do not relate in respect of a case
where different reservoirs have already been completed in the States of
Karnataka and Tamil Nadu before the dispute for apportionment of the
waters of river Cauvery was referred to this Tribunal. Here we are not to
sanction any new project in any of the States. Here the question is as to
what shall be the just and equitable dependable flow on basis of which
the total available water in the river Cauvery and basin thereof should be
apportioned. The Supreme Court of United States in the case of
Wyoming v. Colorado 259 US, 419 at 484 said:
“……… According to the general consensus of opinion among
practical irrigators and experienced irrigation engineers, the
lowest natural flow of the years is not the test. In practice they
proceed on the view that within limits, financially and
physically feasible, a fairly constant and dependable flow
materially in excess of the lowest may generally be obtained
by means of reservoirs adapted to conserving and equalizing
the natural flow; and we regard this view as reasonable.”
(Emphasis supplied)
25. Here, it would be pertinent to mention that for maximizing the
availability of utilizable water resources, the Government of India, in the
National Water Policy, 1987 have made a stipulation as under:-
“Maximizing Availability
3.1 The water resources available to the country should be
brought within the category of utilizable resources to the

96
maximum possible extent. The resources should be
conserved and the availability augmented by measures for
maximizing retention and minimizing losses.”
(Ref. Tamil Nadu pleadings TN-II Exh.No.942 page 4 para 3.1)
26. From the yield series furnished by the States of Tamil Nadu
and Karnataka during 38 years period from 1934-35 to 1971-72 the
lowest recorded yield was during the years 1952-53 at 523 TMC
according Tamil Nadu and 516 TMC according to Karnataka. It shall
also appear that in Cauvery basin the fluctuation of the flows is not as
high as in Krishna or Narmada basin. The extent of fluctuations in the
case of Cauvery between the lowest yield, the dependable yield is within
30% whereas in the case of Krishna it is 56% and in the case of
Narmada 70%. This is because of the influence of two monsoon
seasons in this basin. In the case of Cauvery river system it may be
emphasized that there are many reservoirs in the States of Karnataka
and Tamil Nadu. Krishnarajasagar in Karnataka, Mettur and Lower
Bhavani in Tamil Nadu were in existence before the report of the CFFC.
Several reservoirs have been built by the State of Karnataka thereafter.
27. Recognizing that a particular dependable flow may not be
available every year and there will be some years of varying deficit or
excess, in the allocation of river water amongst claimant States, the
dependability factor assumes importance. Some of the States press for
adoption of higher dependability percentage, thereby showing lower
availability of water for distribution; whereas some other States would

97
press for adoption of lower dependability percentage, thereby showing
higher availability of water for allocation.
28. Coming to the CFFC report, wherein historical run-off series of
river Cauvery at Lower Coleroon Anicut was analysed to work out 50%,
75% and 90% dependable yields, adopting scientific method of frequency
analysis, as also, making some modifications on account of carry-over
storage at Mettur, concluded that 50% dependable yield would be of the
order of 740 TMC and 75% dependable yield of the order of 670 TMC.
29. As directed by the Tribunal while Karnataka has furnished
flow series for 72 years from 1900-01 to 1971-72, Tamil Nadu has
furnished flow series for 38 years from 1934-35 to 1971-72.
Examination of these two flow series indicates that there is hardly any
change in 50% dependable yield of 740 TMC as assessed by CFFC.
The Karnataka series when analyzed for 38 years period from 1934-35
to 1971-72 gives 50% dependable yield at 734 TMC, whereas the Tamil
Nadu series gives a figure of 740 TMC. They almost tally with the earlier
assessment made by CFFC. These series indicate that the lowest flow
observed at LCA was in the year 1952-53, the lowest value as per Tamil
Nadu series is 523 TMC and Karnataka series is 516 TMC. This position
indicates that the run-off series of Cauvery river system is quite robust,
as difference between the minimum and 75% dependable yield is only of
the order of 22% and 23% respectively. The following table gives
storage capacities of various reservoirs (live capacity more than 1 TMC

98
each) then in position (i.e. before 1972). It may be seen that nearly 197
TMC water could be stored in these reservoirs.
Storages built (1.00 TMC and above) before 1972 in Cauvery Basin
S. No
Name of Reservoir and Sub-basin
Year of Storage Capacity (TMC)
Start Comple-tion
Gross Live (Effective)
1 2 3 4 5 6 I KERALA II TAMIL NADU
(A) Irrigation: 1. Mettur (Cauvery) 1925 1934 95.660 93.500 2. Lower Bhavani
(Bhavani) 1948 1953 32.800 32.055
3. Amaravathy (Amaravathy)
1953 1952 4.047 3.968
Total of (A) 132.507 129.523 (B) Power: 1. Mukurthi (Bhavani) 1937 1941 1.800 1.792 2. Pykara (Bhavani) 1946 1956 2.000 1.950 3. Upper Bhavani
(Bhavani) 1956 1962 3.572 3.012
4. Porthimund (Bhavani) 1960 1967 2.123 1.993 5. Emerald (Bhavani) 1956 1962 3.365 3.300 6. Avalanche (Bhavani) 1956 1962 2.171 2.136 7. Pillur (Bhavani) 1960 1967 1.568 1.233
Total of (B) 16.599 15.416 Total of (A) + (B) 149.106 144.939
III KARNATAKA 1. Krishnarajasagar
(Upper Cauvery) 1911 1931 49.452 45.051
2. Marconahalli (Shimsha)
1938 1940 2.400 2.260
3. Nugu (Kabini) 1946 1959 5.440 4.893 Sub-Total (Karnataka) 57.292 52.204 Grand Total (I+II+III) 206.398 197.143
30. After 1972, several major and medium reservoirs have been
constructed in the Cauvery basin. Table given below indicates the live
storage capacities of various reservoirs which have been completed

99
(after 1972) having live storage capacity of more than 1 TMC. Nearly 82
TMC live storage capacity has been created in Cauvery basin after 1972.
Storages built (1.00 TMC and above) after 1972 in Cauvery Basin
S.No. Name of Reservoir and
Sub-basin
Year of Storage Capacity (TMC)
Start Completion Gross Live (Effective)
1 2 3 4 5 6 I KERALA
1. Karapuzha (Kabini) 1974 - 2.700 2.541 2. Attappady (Bhavani) 1975 - 2.295 2.144 3. Banasurasagar
(Kabini) 1980 - 5.889 5.050
Sub-Total-I 10.884 9.735 II TAMIL NADU
1. Palar-Porandalar (Amaravathy)
1970 1978 1.524 1.404
Sub-Total-II 1.524 1.404 III KARNATAKA Kabini (Kabini) 1959 1974 19.520 16.000
2. Harangi (Harangi- Upper Cauvery)
1964 1974 8.500 8.073
3. Suvarnavathy (Suvarnavathy)
1965 1984 1.260 1.259
4. Hemavathy (HemavathyUpper Cauvery)
1968 1979 37.103 35.760
5. Manchanabele (Arkavathy)1970 - 1.222 1.061 6. Taraka (Kabini) 1970 - 3.940 3.205 7. Arkavathy (Arkavathy) 1975 - 1.587 1.430 8. Votehole (Hemavathy-
Upper Cauvery) 1976 - 1.510 1.366
9. Yagachi (Hemavathy-Upper Cauvery)
1984 - 3.601 3.269
Sub-Total-III 78.243 71.423 Total (I+II+III) 90.651 82.562
31. Apart from the above, the projects proposed by the State of
Kerala having live storage of more than 1 TMC each, indicated in the
following table, will add another 19 TMC of live storage capacity in the
basin.

100
Storages (1.00 TMC and above) proposed in Cauvery Basin
S.No. Name of Reservoir and Sub-basin
Year of Storage Capacity (TMC)
Start Completion Gross Live (Effective)
1 2 3 4 5 6 I KERALA
1. Noolpuzha (Kabini)
3.030 2.702
2. Thirunelly (Kabini)
3.602 3.496
3. Thonder (Kabini)
2.895 2.225
4. Peringottupuzha (Kabini)
3.355 3.205
5. Kallampathy (Kabini)
2.702 2.502
6. Kadamanthodu (Kabini)
1.805 1.706
7. Cheghat (Kabini)
1.700 1.501
8. Chandalipuzha (Kabini)
2.101 1.992
Total of (A) 21.190 19.329 II TAMIL NADU Nil Nil III KARNATAKA Nil Nil
Grand Total (I+II+III) 21.190 19.329 32. In addition, about 12 TMC of storage capacity (live) would be
available from the small reservoirs with capacity of less than 1 TMC
each.
Summary of storage capability in Cauvery basin
S. No. Period Capacity (in TMC) Gross Live
i) Storages built before 1972 206 197 ii) Storages built after 1972 90 82 iii) Storages proposed in Kerala 21 19 iv) Small storages below 1 TMC
capacity 13 12
Total 330 310

101
33. Thus, it would be seen that about 42% of 740 TMC (i.e. 50%
dependable yield) could be stored in all the storage reservoirs in the
Cauvery basin. This in itself is an important aspect for consideration in
the development and utilization of water resources of a river basin. From
the above discussion, it would be clear that adoption of 50% dependable
flow for apportionment amongst the party States in the prevalent
situation of Cauvery basin which is supported by two monsoon seasons
and with ample available storage facilities would be quite fair, and, the
system could be further strengthened by integrated operation of
important reservoirs. This is all the more necessary keeping in view the
status of water utilization in the Cauvery basin, which has already
crossed 75% dependable yield. The above approach would eliminate
the difficulties, which would otherwise be faced by the concerned parties.
While it is for the parties to adopt specific norms to ensure success of
irrigation & power projects as per regional characteristics, social needs &
economic considerations, it is felt that in determination of basin yield for
apportionment, what is more important is to arrive at sustainable
utilizable quantum which will meet expectations of the people of different
regions in the basin optimally.
--------

102
Chapter 3
Ground water – whether an additional/alternative resource Ground water is one portion of the earth’s hydrological cycle.
Ground water originates for all practical purposes as surface water.
Water infiltrates into the ground from natural recharge of precipitation,
stream flow, lakes and reservoirs. The stream flow shall also include
canals. Once under ground water moves downward under force of
gravity, discharge of ground water represents a return of the water to the
earth’s surface. A spring flow and evaporation are other modes of
discharge. Pumping from wells is the primary artificial discharge method.
Recharge of the ground water takes place from natural resource like
rainfall and artificial modes like application of water to irrigate crops,
flooding of areas caused by over-flowing of streams to their sides,
seepage from unlined canals, tanks and other sources of recharge of the
ground water in any particular area. The role of the ground water cannot
be minimised so far hydrological cycle is concerned, because it is an
important source of irrigation and according to the Central Ground Water
Board, Ministry of Water Resources, Government of India, ground water
caters to more than 45% of total irrigation in the country.
2. According to the State of Karnataka while making
apportionment of the waters available within the Cauvery basin ground
water available within the Delta areas should also be taken into
consideration. It may be mentioned at the outset that according to the

103
State of Tamil Nadu ground water cannot be considered to be an
additional/alternative resource available in the delta area of the Cauvery
basin. In that connection, it was pointed out that so far as the delta is
concerned, the said ground water is mainly derived from recharge by
supplies from Mettur. In other words, it is the water of river Cauvery and
its tributaries which by process of recharge becomes ground water within
the delta area in the State of Tamil Nadu and the same is being utilised
by the farmers for raising of early nurseries, ahead of releases from
Mettur and for irrigating belated crop after stoppage of Mettur releases.
As the ground water in the delta area is replenished by releases from the
Mettur, it cannot be considered to be an independent source of irrigation
or an alternative means of irrigation. In this background, the ground
water within the Cauvery basin should be ignored for all purposes while
making apportionment of the waters of river Cauvery and its tributaries.
3. The Central Ground Water Board, Ministry of Water
Resources, Government of India along with other agencies has been
trying to ascertain the availability of ground water in different States in
India as well as the proportion of utilisation of such ground water. In
their report “Ground Water Resources of India” which was published in
the year 1995 in the preface it has been said as follows:
“As per the National Water Policy, development of ground
water resources is to be limited to utilisation of the renewable
part of the naturally occurring ground water available in sub-
surface domain. The present development policy, obviously
forbids utilisation of the secular reserve to prevent ground

104
water mining. Precise assessment of replenishable ground
water resources and its development in terms of area which
can be irrigated in the framework of land availability, cropping
pattern, etc. is, therefore, key to our plans to develop ground
water resources for various uses. The complexities of
processes governing occurrence and movement of ground
water make the problem of ground water assessment
somewhat difficult, as not only vast volume of data is required
to be collected but also many disciplines of science have
to be involved in a co-ordinated manner for space time
location of ground water in quantity and quality. The gravity of
the situation can, however, be gauged through one of the
conclusions drawn in the International Advanced Research
Workshops on “Estimation of Natural Recharge of Ground
Water” in 1987 at Antalay, Turkey. It says “no single
comprehensive estimation technique can yet be identified from
the spectrum of methods available, all are reported to give
suspect results”. But in view of the rapidly expanding urban,
industrial and agricultural water requirements, assessment of
ground water resources with best possible accuracy is of
fundamental importance for planning the resource use on
scientific and economic considerations.
In India, the efforts in this direction were initiated
immediately in post-independence era and the approach and
methodologies utilised since then have undergone gradual
changes based on the refinement of our understanding in the
field of ground water. The methodology, recommended by
“Ground Water Resource Estimation Committee” in 1984 is in
a true sense the logical scientific approach for assessment of
country’s ground water resources in volumetric terms. The
resources so assessed volumetrically have by and large been
accepted. The real problem, however, arose when the

105
volumetric resources were converted in terms of area which
can ultimately be irrigated. The figures originally computed
gave rise to differences and controversies. Keeping this in
view, the Central Ground Water Board made a realistic effort
for resolving these issues in coordination with Central Water
Commission, National Water Development Agency, National
Institute of Hydrology, National Bank for Agriculture and Rural
Development and State Ground Water Organisations, under
the overall guidance of Ministry of Water Resources. After an
in-depth discussion and analysis, the figures reflected in this
Report have been firmed up. The aspects like land availability,
water requirement for prevalent cropping pattern, ground water
development strategy, etc. were accounted for which have now
resulted in realistic figures. There is, however, always a scope
for improvement in methodology and revision of information
contained herein on quantum of ground water resource and the
resultant irrigation potential. This in fact will be a continuous
process as ground water is a dynamic resource and science is
in continuous search for better understanding. Based on the
developments in science and situation, the Board in
consultation with State and other Organisations would continue
to update these figures in future as per the covenants of the
National Water Policy.”
4. Thereafter under the heading ‘GROUND WATER RESOURCES OF
INDIA’ the said Board in its aforesaid report has said:
“Ground water is an important source of irrigation and
caters to more than 45% of the total irrigation in the country.
The contribution of ground water irrigation to achieve self-
sufficiency in food grains production in the past three decades
is phenomenal. In the coming years the ground water
utilization is likely to increase manifold for expansion of

106
irrigated agriculture and to achieve National targets of food
production. Although the ground water is annually
replenishable resource, its availability is non-uniform in space
and time. Hence, precise estimation of ground water resource
and irrigation potential is a pre-requisite for planning its
development.
A complexity of factors – hydro-geological, hydrological
and climatological, control the ground water occurrence and
movement. The precise assessment of recharge and
discharge is rather difficult, as no techniques are currently
available for their direct measurements. Hence, the methods
employed for ground water resource estimation are all indirect.
Ground water being a dynamic and replenishable resource, is
generally estimated based on the component of annual
recharge, which could be subjected to development by means
of suitable ground water structures.
For quantification of ground water resources proper
understanding of the behaviour and characteristics of the water
bearing rock formation known as Aquifer is essential. An
aquifer has two main functions – (i) to transit water (conduit
function) and (ii) to store it (storage function). The Ground
water resources in unconfined aquifers can be classified as
Static and Dynamic. The static resources can be defined as
the amount of ground water available in the permeable portion
of the aquifer below the zone of water level fluctuation. The
dynamic resources can be defined as the amount of ground
water available in the zone of water level fluctuation. The
replenishable ground water resource is essentially a dynamic
resource which is replenished annually or periodically by
precipitation, irrigation return flow, canal seepage, tank
seepage, influent seepage etc.

107
The methodologies adopted for computing ground water
resources, are generally based on the hydrological budget
techniques. The hydrologic equation for ground water regime
is a specialized form of water balance equation that requires
quantification of the items of inflow to and outflow from a
ground water reservoir, as well as of changes in storage
therein. A few of these are directly measurable, some may be
determined by differences between measured volumes or rates
of flow of surface water and some require indirect methods of
estimation. These items are elaborated as below:-
“I. Items of supply to ground water reservoir:
1 Precipitation infiltration to the water table.
2 Natural recharge from steam, lakes and ponds. 3 Ground water inflow into the area under
consideration.
4 Recharge from irrigation, reservoirs, and other
schemes especially designed for artificial recharge.
II. Items of disposal from ground water reservoir:
1. Evaporation from capillary fringe in areas of shallow
water table, and transpiration by phreatophytes and
other plant/vegetation.
2. Natural discharge by seepage and spring flow to
streams, lakes and ponds.
3. Ground water outflow.
4. Artificial discharge by pumping or flowing wells or
drains.
Over the years the ground water assessment techniques
have evolved from progressive understanding of ground water
occurrence and movement, recharge and discharge
processes……….”

108
5. Both surface and ground water are replenished by rainfall and
form part of the circulatory pattern of the hydrologic cycle. If the water
table at the top of the zone of saturation is above in level of the water
surface in a stream, ground water seeps into the stream; but when the
water table is below this level, there is seepage from the stream into the
porous layers of rocks. Thus, ground water supplies the relatively stable
and uniform base flow of the stream and is, in its turn, replenished by the
stream flow. Depletion of ground water by pumping or otherwise may
reduce the stream flow somewhere else in the river basin. Ground water
may furnish alternative means for satisfying the State’s irrigation needs.
Moreover there may be such a close connection between the surface
and ground water resources of a river basin that it may be necessary to
limit the use of ground water to prevent diminution of the water supply
downstream.
6. It is well known that for irrigation there are three sources:
(1) Rainfall;
(2) Surface flow of any river which can be taken to different
areas through canal system; and
(3) Ground water which can be taken out through open-wells or
tube-wells.
7. The three sources of irrigation indicated above – one is beyond
the reach of human being i.e. the rainfall. There is some fluctuation in
the time and quantity of the rainfall in different parts of the river basin
affecting the plantation and growth of the crops. So far the second
source i.e. surface flow of a river within a State is concerned, it is

109
dependent on the system for taking such waters to different areas
through canals or by storing them in different reservoirs to be utilised
from time to time. The third source is the ground water which is being
utilised for irrigation and other purposes in different parts of the country.
So far Cauvery basin is concerned, it appears to be an admitted position
that the variability in time and quantity of rainfall from the south-west
monsoon and the north-east monsoon in some years create problems.
This also affects the surface flow of river Cauvery and its tributaries
which in its own turn affects the storage in different reservoirs like
Krishnarajasagar, Mettur etc. The surface flow and the rainfall are not
enough in some years for the cultivators within the different States of the
Cauvery basin and this has led to conflict and confrontation from time to
time specially between Mysore/Karnataka and Madras/Tamil Nadu. In
this background, the ground water, if available assumes importance.
8. The stand of Tamil Nadu is that ground water cannot be
considered as an alternative source of irrigation. It was also pointed out
that by mere reference to the pleadings of the State of Karnataka filed
before this Tribunal, it shall appear that according to Karnataka the
ground water which is being utilised for irrigation by Tamil Nadu is mainly
in the delta area. It is the case of Tamil Nadu that the ground water
which is being utilised for early seedlings and in hour of distress in the
delta areas are only recharge from the flows of river Cauvery and as such
that cannot be considered to be an alternative source.

110
9. All water that exists below the surface of earth in the interstices
of soil and rocks may be called sub-surface water; “that part of sub-
surface water in interstices completely saturated with water is called
groundwater”. (Walton W.C. 1970 Ground Water Resource Evaluation,
McGraw Hill Book Co., New York). Of practical concern is the portion
of groundwater that can be extracted by dug/tube wells or that forms the
base flow of surface streams/rivers.
10. Dr. Ven Te Chow, a renowned hydrologist has written a book
“Hand Book of Applied Hydrology” which even to this day is used for
reference in universities and departments all over the globe. In Chapter
13 on Ground Water Resources (page 3), he has described groundwater
in the hydrologic cycle as under:-
“Groundwater is one portion of the earth’s hydrologic
cycle…….. Permeable formations in the earth’s crust serve as
conduits for transmission and as reservoirs for storage of
water. Essentially, all groundwater is in motion; velocities
range from a few feet per day to only a few feet per year. As
such, groundwater provides large, widely distributed sources
of water supply. Groundwater discharging into streams
maintains stream flow during periods of no surface runoff. In
arid zones, pumped water is the only available supply for
large portions of each year.
Ground water originates for all practical purposes as
surface water. Water infiltrates into the ground from natural
recharge of precipitation, stream flow, lakes, and reservoirs.
In addition, efforts by man constitute artificial recharge. Once
underground, the water moves downward, under the action of

111
gravity. When a zone of saturation is reached, the water flows
in a direction controlled by the hydraulic boundary conditions.
Discharge of groundwater represents a return of the water to
the earth’s surface. Most discharge is into surface-water
bodies. Spring flow, evaporation, and transpiration are other
modes of discharge. Pumping of wells is the primary artificial
discharge method.”
11. Recharge of groundwater takes place from natural source like
rainfall and artificial modes like application of water to irrigate crops,
flooding of areas caused by over flowing of streams to their sides and
also by artificial methods – such as injecting water into wells during rainy
season, besides, recharge also take place due to seepage from unlined
canals, tanks etc.
Total annual recharge = Recharge during monsoon + non-
monsoon rainfall recharge + seepage
from canals + return flow from irrigation
+ inflow from influent rivers etc. +
recharge from submerged lands, lakes
etc.
(Source: Ground water resources of India – Page 14, Central Ground Water Board {CGWB} Publication 1995)
12. As regards underground water fluctuation, Dr. Ven Te Chow in
his hand- book in Chapter 13, Page 33, has described about the secular
and seasonal effects as under:-
“Secular variations are those extending over periods of several
years or more. These are commonly produced by alternating
series of wet and dry years in which rainfall is above or below
the mean……. As rainfall is the primary source of recharge in

112
many aquifers, variations of rainfall and groundwater levels are
closely correlated. The correlation is imperfect, however,
because differences in rainfall intensity and distribution
produce different amounts of recharge from the same total
annual rainfall.
Where overdraft is a continuing phenomenon in a
groundwater basin, a downward trend in water levels over a
period of years is apparent.”
13. Dr. Ven Te Chow has also mentioned about stream flow effects
on groundwater recharge as under:-
“Where a stream channel is in contact with an unconfined
aquifer, water may flow from the stream into the ground, or the
reverse, depending upon the relative water levels. An influent
stream supplies water to aquifers; an effluent stream receives
water from the aquifer. A stream may be influent in one
location and effluent in another; also, changes can occur with
time as stream stages relative to nearby groundwater levels
shift.
During a flood period groundwater levels may be
temporarily raised near a channel by inflow from the
stream. This water is known as `bank storage’……...
Groundwater discharging into a stream forms the base
flow of the stream. This may vary from total flow during
periods of no surface runoff to a negligible fraction of the
total flow during periods of high surface runoff.”
14. The availability of groundwater for use is limited to the annual
recharge, which could be withdrawn and again gets replenished by
natural rainfall/artificial modes of recharge mentioned above.
Groundwater is naturally inter-related with surface water; groundwater

113
feeds springs and even surface streams, and in turn, surface water
replenishes groundwater aquifers/reservoirs.
15. It is very important to understand that the annual withdrawals of
groundwater in any region need to be in equilibrium with the annual
replenishment of groundwater in that region. Over-withdrawals made
from an aquifer at rates in excess of the net recharge are described as
“mining” of groundwater, because it lowers the groundwater level
permanently to the extent these over-withdrawals are made. In such
situation of over-withdrawals, the problem becomes serious if the
practice continuous over a period of time resulting in decline of
groundwater table and making the pumping of water more and more
expensive because of greater depth from which water needs to be
pumped. It is, therefore, imperative that adequate care is taken in
assessment of the actual recharge of the groundwater resources and
balancing the same with annual water withdrawals.
16. Government of India in the year 1982 constituted “Ground
Water Estimation Committee” with the members drawn from various
organizations engaged in hydro-geological studies and groundwater
development. This Committee after reviewing the data collected by
Central and State agencies, research organizations, universities etc.
recommended methods for groundwater recharge estimation in the year
1984.

114
a) Ground Water Level Fluctuation and Specific Yield Method:
“The water table fluctuation and specific yield approach has
been recommended for recharge estimation ……………………..
The utilizable recharge is estimated based on pre-monsoon
(April-May) to post-monsoon (November), water level fluctuations
for the areas receiving south-west monsoon. Similarly, for the
areas receiving north-east monsoon, water level fluctuations of
pre-monsoon (November) and post-monsoon (March) have been
taken into consideration.”
“The specific yield values of the geological formations in
the zone of water table fluctuation as computed from pumping
tests were utilized in this recharge estimation. As a guide
following values computed in different studies are
recommended:-
(i) Sandy alluvial area 12 to 18 percent
(ii) Valley fills 10 to 14 percent
(iii) Silty/Clayey alluvial area 5 to 12 percent
(iv) Granites 2 to 4 percent
(v) Basalts 1 to 3 percent
(vi) Laterite 2 to 4 percent
(vii) Weathered Phyllites, Shales, Schist and associates rocks. 1 to 3 percent (viii) Sandstone 1 to 8 percent
(ix) Limestone 3 percent
(x) Highly Karstified Limestones 7 percent”
(Ref: Ground water resources of India – Pages 10 & 11; CGWB – Publication 1995)
17. For estimation of groundwater recharge by water level
fluctuation method, the report of the Groundwater Estimation Committee
1984 stipulates as under:-

115
“For estimating the groundwater recharge, water level
fluctuation and specific yield approach should be applied as far
as possible. The monitoring of water level net-work stations
should be adequate in space (about 1 station for 100 sq km
area) and time (about six times in a year) to monitor effects of
groundwater development on groundwater regime. Efforts
should be made to install continuous water level recorders
wherever possible.” (Ref ibid Page 27, Para 5(b))
The recharge is broadly calculated as under:-
Recharge = Area (sq km) x Water level fluctuation (m)
x specific yield.
b) Rainfall Infiltration Method: “In areas where groundwater level monitoring is not
adequate in space and time, rainfall infiltration may be
adopted. The norms for rainfall infiltration contributing to
groundwater recharge are evolved based on the studies
undertaken in various water balance projects in India…….”
(Ref. CGWB publication 1995, Page 12)
18. The norms for recharge from rainfall under various
hydrogeological situations as recommended are given in the table below
(Ref . ibid page 13):

116
Rainfall infiltration factor in different hydrogeological situations
S.No. Hydrogeological Situation Rainfall Infiltration Factor
1. Alluvial Areas a. Sandy Areas b. Areas with higher clay content
20 to 25 percent of normal rainfall 10 to 20 percent of normal rainfall
2. Semi-Consolidated Sandstones (Friable and highly porous)
10 to 15 percent of normal rainfall
3. Hard rock areas a. Granitic Terrain (i) Weathered and Fractured (ii) Un-Weathered b. Basaltic Terrain
(i) Vesicular and Jointed Basalt
(ii) Weathered Basalt c. Phyllites, Limestones, Sandstones, Quartzites, Shales, etc.
10 to 15 percent of normal rainfall 5 to 10 percent of normal rainfall 10 to 15 percent of normal rainfall 4 to 10 percent of normal rainfall 3 to 10 percent of normal rainfall.
19. The Central Ground Water Board in their publication “Ground
Water Resources of India – 1995” have commented on the scope of
groundwater resources availability of various States of the country. As
regards party States in this dispute namely: Karnataka, Kerala and Tamil
Nadu, they have stated as under:-
“i) Karnataka -
The heterogeneity of hard rock formation and discontinuous
nature of aquifers require proper location of wells for their
success. Remote Sensing techniques along with Geophysical
Surveys are needed for success of a well. Small land holdings
do not permit a bankable groundwater development scheme for
institutional financing. Proper siting, along with suitable
117
spacing is needed for regulated groundwater development to
avoid local over-development of groundwater resource. Dug
wells, dug-cum-bore wells and bore wells are the main ground
water structures feasible in the State.
(Ref: ibid, Page 20)
ii) Kerala -
The groundwater development for irrigation has
commenced recently in the State. The main constraints for
speedy groundwater development are high rainfall, substantial
surface water availability, limited land for groundwater
development and small and fragmented land holdings. The
community well scheme is recommended for speedy
development of ground water. In alluvial areas, the tubewells
are the main groundwater development structures, whereas
dug wells and bore wells are feasible in hard rock areas.
(Ref: ibid, Page 20)
iii) Tamil Nadu –
In hard rock area the dug wells and bore wells are
common structures for groundwater development. In alluvial
areas deep tubewells are feasible. The groundwater
development in most of the parts of State is high resulting in
lowering of water level in many areas. Regulated development
of groundwater is required specially in hard rock areas. In the
coastal areas, a cautious approach has to be adopted for
groundwater development due to salinity hazards.”
(Ref: ibid, Page 21)
The report does not offer any comments regarding the U.T. of
Pondicherry. A small part of which namely: Karaikal region falls within
the Cauvery basin.

118
20. The State of Karnataka had produced Dr. K.R. Karanth, geo-
hydrologist expert as a witness. He was cross-examined in great detail
during the proceedings of the Tribunal. A book namely “Hydrogeology”
(Tata Mcgraw-Hill Publishing Co.Ltd- Second reprint 1996) written by Dr.
K.R. Karanth, was also presented before the Tribunal. Dr. Karanth has
observed that while one can make an assessment of surface water which
is visible, assessment of groundwater resource is a complex exercise
involving many parameters that can be evaluated only indirectly. In his
introduction chapter, Page 5, Para 1.3, he has mentioned as under:-
“1.3 Hydrogeological Evaluation
Surface water and groundwater are two interdependent
phases of the hydrologic cycle. Each resource needs to be
evaluated and quantified for planning their utilization in an
integrated manner. While one can make an assessment of
surface water which is visible, assessment of groundwater
resource is a complex exercise involving many parameters that
can be evaluated only indirectly. All the parameters that are
needed for evaluation of surface water resources can be
measured on the surface of the earth - precipitation, infiltration,
runoff, topographic slopes, land use, etc. and interrelationships
can be developed. At present, there are a vast number of
reservoirs, which are gauged and the data of which are available
for evaluation of basin yields under different conditions. On the
other hand, the quantification of groundwater resources is beset
with many constraints. Adequate information on the geometry of
groundwater basins, storage and yield properties of water-bearing
formations, groundwater inflows and outflows, is lacking in many
areas. Besides, some of these parameters are not only not
measurable on the surface, but, are also diverse and

119
unpredictable, in their variations in space and time. In planning
groundwater supply systems one is confronted with posers like
how much fresh water is available, where, at what depth and what
is the reliability of supplies. In order to answer these questions
one should know the dimensions of the producing horizons, their
disposition, properties and interconnection with sources of
replenishment and disposal, through hydro-geological studies
which may consist of surface inspection supplemented with
geophysical studies and exploratory drilling, wherever necessary.”
21. The Irrigation Commission (1972) in their report, while dealing
with groundwater conditions in the Deccan area have quoted from the
report of Fact Finding Committee for the survey of scarcity areas in
Bombay State (1960) as under:-
“6.50 In regard to Maharashtra, the Fact Finding Committee
for the survey of scarcity areas in Bombay State (1960), in their
report has stated that:
Unlike the alluvial plains in the country, such as those in
the Punjab and Uttar Pradesh, the Deccan conditions present
altogether a different and complicated problem in so far as
groundwater and its flow is concerned. In the Indo-Gangetic
plains, striking water in wells is not at all an uncertain factor as
it is related to a water-table which spreads all over the area. . .
. In the Deccan, however, there is no such thing as a water
table. The wells derive their supply from the water seams the
exact location of which cannot be predicted. Any well sunk in
the Deccan has to be excavated in rock to some extent except
in certain regions where the rock level happens to be very low
and excavation is limited to the upper layer consisting of MAN
or CHOPAN. The cost of sinking wells in the Deccan varies
from about Rs.3,000 to Rs.5,000. A normal well in the Deccan

120
plateau is about 12 to 15 m. deep and water is struck at a
depth of about 8 to 12 m. The capacity for irrigation of a
normal well in the Deccan (not within the commands of
irrigation canals) is noticed to be between three to five acres.
The supplies of these wells are adequate for irrigation up to
about the middle of March and then dwindle rapidly, giving
barely sufficient water for drinking purposes at the end of the
hot weather. As a matter of fact, a number of wells are known
to get dry by the end of April. Well irrigation should therefore
be resorted to where the other more economic modes of
providing irrigation are not available or where an adequate and
copious supply of underground water with a low lift exists, for
example, in the areas under command of major irrigation
works.”
(Ref: Irrigation Commission 1972 report, Vol.III [Part 2], Page
197, Para 6.50) 22. Similarly, in the compilation “The Law of International Drainage
Basins” by A.H. Garretson, Editor, Chapter 8, Page 312, it has been
mentioned as under:-
“……………….With much variation in the quantity of flow in any
particular channel, confusion over the correct stream was likely.
The course of a river is indicated traditionally only by its surface
flow and geographers as well as lawyers are accustomed to
having a fairly well defined channel with which to work. Here
flat marshy land confounds the issue. And the important role of
underground water flow, though known to the hydrologist, is not
fully calculable from the technical point of view and, therefore,
not fully cognizable as yet from the legal point of view.”
(Source: TN Note No.19 on Group-II, Document No.9, Page 35
- Para 4 of Page 37)

121
23. Since the river flows (surface water) could be measured every
year to an acceptable degree for apportionment, it is well nigh not
possible to measure the available groundwater for planning its utilization
during the course of the year. Moreover, there is great interdependence
of the availability of groundwater on rainfall, various other parameters,
affecting its recharge and availability in different pockets/zones in any
river basin.
24. Keeping in view the important relationship between surface and
ground water resources as also the conspicuous role being played by
groundwater in the overall development of use for irrigation and other
beneficial purposes, the mention for encouraging conjunctive use of
groundwater with the available surface waters seems to be quite
pertinent. Dr. Ven Te Chow in his book – “Hand Book of Applied
Hydrology”, in Chapter 13 page 41 has observed regarding conjunctive
use of water resources as under:-
“Future demand for water requires planning for the maximum
utilization of all existing supplies. This can most economically
be attained by conjunctive use of surface and ground water
reservoirs …… During normal and wet years, surface
storage will meet most needs, while ground water storage can
be retained for use during years of sub-normal precipitation.
Ground water levels will be raised during wet periods and
lowered during dry periods. Artificial recharge (Sub Section
VIII) is necessary to store a maximum volume of water
underground when it is available at the surface.”

122
25. Dr. K.R. Karanth has in his book “Ground Water Assessment,
Development and Management” (1987) made observations regarding
conjunctive use at page 685 of his book in para 16.3, that, because of
the inter-relationship existing between surface and ground water, it is
possible to utilize, during critical periods, the surplus of one to tide over
the deficit of the other. Thus ground water may be used to supplement
surface water supplies in order to reduce peak demands for irrigation
and other uses, or to meet deficit in years of low rainfall. On the other
hand, surplus surface water may be used in over-draft areas to increase
the ground water storage by artificial recharge.
26. The Irrigation Commission, 1972 in their report have generally
reiterated the comments of above mentioned experts. The Commission
has further observed as under:-
“It can also take the form of irrigating pockets exclusively with
ground water in a canal command, especially where the terrain
is uneven. Planning for combined use of surface and
groundwaters calls for greater ingenuity than is needed for their
separate use. It has to be admitted that, so far, no projects
have been planned on the basis of such combined use of
water. Such combined use, as is now practiced, was not pre-
planned, but has come into being out of necessity.”
(Ref: Irrigation Commission 1972 Report Vol.-I, Page 96, Para
5.38)
At page 97 para 5.41, the Irrigation Commission has observed as under
in respect of Cauvery delta: -
“In certain parts of the Cauvery Delta, farmers have installed
their own filter-points in the irrigated area to raise paddy

123
seedlings early in June before the canal system is opened.
The first crop is harvested by the end of September before the
onset of the north-east monsoon. A second crop is raised on
these lands which is harvested in January or February. The
filter-points enable the farmers to give a watering to the crop
after the closure of the canals wherever necessary, particularly
in areas in the tail-reaches which suffer from scarcity even
when canals are open. Some cultivators raise even a summer
crop of cotton or groundnut, with the help of these filter-points
and give irrigation support to sugarcane. Thus, with the
conjunctive use of the surface waters of the Cauvery and
groundwater, it has been possible for farmers in the Cauvery
Delta to raise two and sometimes three crops.”
The Irrigation Commission at page 99 para 5.50 have, however, given a
caution in respect of conjunctive use as under: -
“In advocating conjunctive use, we are aware that
indiscriminate exploitation of groundwaters may lead to serious
difficulties. It is in this context that the need for legislation to
regulate the exploitation of groundwaters becomes important.
We are of the view that tubewell construction should be
regulated by law in areas where there is a risk of over-
exploitation, so that the size and spacing of tubewells is
controlled to facilitate the systematic exploitation of the
groundwater resources in a particular area.”
27. Since the uncontrolled exploitation of groundwater in some
regions of the country has resulted in mining of water and such areas
have been declared as “dark”, the Government of India in the Ministry of
Environment and Forest has taken serious note about the damage which
mining of groundwater would cause and re-constituted the earlier

124
“Central Ground Water Board” into a “Central Ground Water Authority”
vide notification dated 14.01.1997 (which has been reconstituted from
time to time, the last amendment being on 06.11.2000). The Chairman
of the Central Ground Water Board will continue to work as Chairman of
the newly constituted Central Ground Water Authority alongwith all other
members and in addition, some more members have been taken in, from
Oil & Natural Gas Corporation Limited, Central Water Commission,
Ministry of Environment etc. The Authority would, however, function
under the administrative control of the Ministry of Water Resources. One
of the functions of the Authority is “regulation & control, management and
development of groundwater in the country and to issue necessary
regulatory direction for this purpose.” It may be mentioned that after the
formation of this Authority under the Environment (Protection) Act, 1986,
the State Governments would have to further set up some mechanism,
where by, they would be allowing development of groundwater within
their jurisdiction in a properly regulated manner, so that, no over-
exploitation of this replenishable resource is done and the development
is limited only within the quantum of water that is naturally replenished
annually.
28. The Tata Services Ltd. bring out annual “Statistical Outline of
India", through their Department of Economics and Statistics for the
entire country, measuring large number of economic parameters of
development. In their publication of 2002-2003 at Page 49, Table 46,
they have given details regarding area irrigated by sources in the country

125
as a whole for 1970-71, 1980-81, 1990-91, 1996-97 and 1997-98. These
figures are reproduced below in a tabular form:-
Area irrigated by sources 1997-
98 1996-97
1994-95 1990-91 1980-81 1970-71
(million hectares) Government canals….
16.6 (30.4)
16.9 (30.7)
16.8 (31.7)
17.0 (35.4)
14.5 (37.5)
12.0 (38.6)
Private canals………….
0.5 (0.9)
0.5 (0.9)
0.5 (1.0)
0.5 (1.0)
0.8 (2.1)
0.9 (2.9)
Tanks……………………..
3.1 (5.7)
3.3 (5.9)
3.3 (6.2)
2.9 (6.5)
3.2 (8.2)
4.1 (13.1)
Wells and tubewells……..
30.9 (56.6)
30.8 (55.9)
28.9 (54.5)
24.7 (51.5)
17.7 (45.7)
11.9 (38.3)
Others…………………….
3.5 (6.4)
3.6 (6.5)
3.5 (6.6)
2.9 (6.0)
2.6 (6.7)
2.3 (7.4)
Total net irrigated area
54.6 (100.0)
55.1 (100.0)
53.0 (100.0)
48.0 (100.0)
38.7 (100.0)
31.1 (100.0)
Note:i) Figures in brackets show percentages to total irrigated area. ii) Figures for 1994-95 taken from Tata Services Publication 1999- 2000 (page 64). From the above, it would be seen that even country as a whole the area
irrigated by groundwater (through wells and tubewells) was around
56.6% of the total irrigated area in 1997-98. Further, it is seen that in
1970-71, the area irrigated by Government canals and wells and
tubewells was almost equal being about 38% in each case, which has
increased in the case of groundwater to 56.6% and decreased in the
case of Government canals from 38.6% to 30.4%. Also, the area
irrigated from tanks has fallen from 13.2% in 1970-71 to 5.7% during
1997-98. Thus, contribution of groundwater is quite substantial in the
development of irrigation.
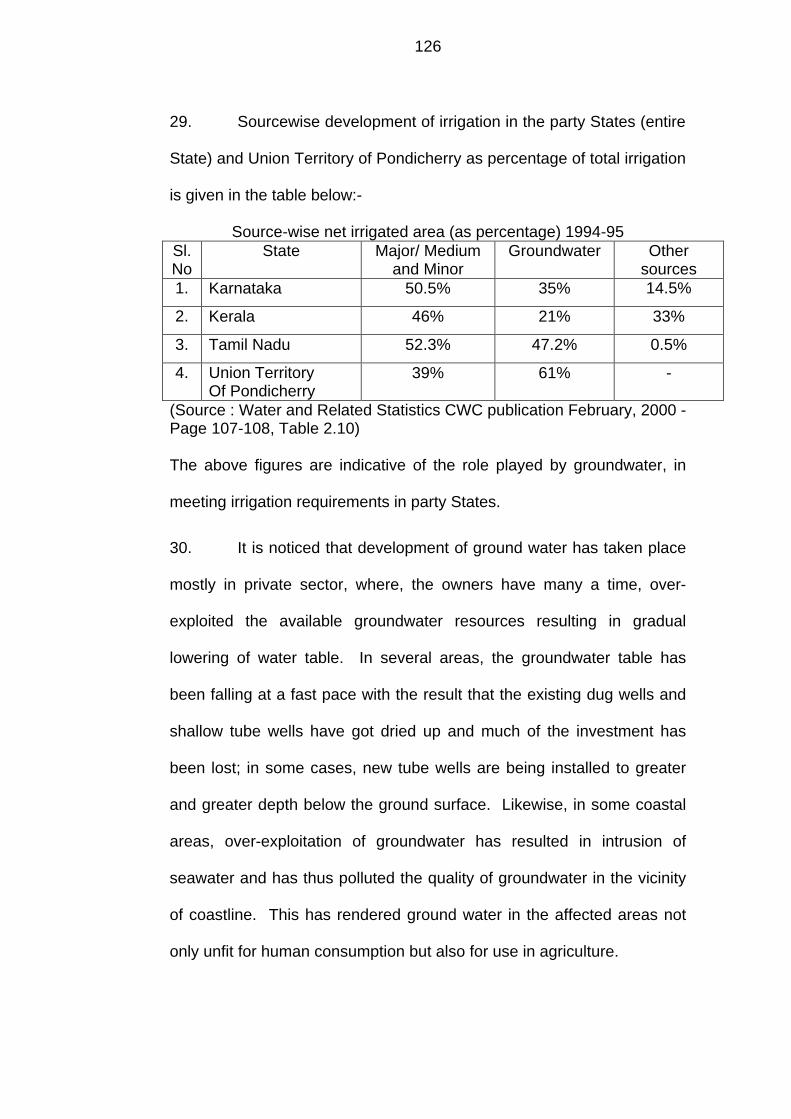
126
29. Sourcewise development of irrigation in the party States (entire
State) and Union Territory of Pondicherry as percentage of total irrigation
is given in the table below:-
Source-wise net irrigated area (as percentage) 1994-95 Sl.No
State Major/ Medium and Minor
Groundwater Other sources
1. Karnataka 50.5% 35% 14.5%
2. Kerala 46% 21% 33%
3. Tamil Nadu 52.3% 47.2% 0.5%
4. Union Territory Of Pondicherry
39% 61% -
(Source : Water and Related Statistics CWC publication February, 2000 -Page 107-108, Table 2.10) The above figures are indicative of the role played by groundwater, in
meeting irrigation requirements in party States.
30. It is noticed that development of ground water has taken place
mostly in private sector, where, the owners have many a time, over-
exploited the available groundwater resources resulting in gradual
lowering of water table. In several areas, the groundwater table has
been falling at a fast pace with the result that the existing dug wells and
shallow tube wells have got dried up and much of the investment has
been lost; in some cases, new tube wells are being installed to greater
and greater depth below the ground surface. Likewise, in some coastal
areas, over-exploitation of groundwater has resulted in intrusion of
seawater and has thus polluted the quality of groundwater in the vicinity
of coastline. This has rendered ground water in the affected areas not
only unfit for human consumption but also for use in agriculture.
127
31. As per National Water Policy, groundwater development is
limited to annual replenishable groundwater resources; hence
groundwater exploitation is not permitted in over exploited areas. The
behaviour of groundwater level is a deciding factor to stop further
groundwater development in areas where long term decline in the
groundwater levels is witnessed, even though the groundwater resource
assessment may be indicating surplus availability of groundwater.
(Source: Ground Water Resources of India, CGWB publication 1995
page 15-16).
32. Krishna Water Disputes Tribunal in their report 1973, Vol.I,
Chapter VIII, Page 71(left column) and Page 72(right column) have
observed as under:-
“For equitable apportionment of waters of an inter-State river
system, the underground water resources of a State is a
relevant factor. Groundwater may furnish alternative means for
satisfying the State’s irrigation needs. Moreover, there may be
such a close connection between the surface and groundwater
resources of a river basin that it may be necessary to limit the
use of groundwater to prevent diminution of the water supply
downstream.2
“However, groundwater flow is not fully calculable from the
technical point of view and, therefore, not fully cognizable as
2 Arizona v/s California 376, U.S. 340. (Clause IV of the decree); Masters Report in the same case cited in A.H. Garretson and others, The Law of International Drainage Basins 1967. pp. 525-526, see also ibid pp. 585-586.

128
yet from the legal point of view.(5) Being invisible, groundwater
resources baffle quantitative measurement(6)……….”
“On a consideration of all relevant materials, we propose
to pass the following order:-
The Tribunal hereby declares that the States of
Maharashtra, Karnataka and Andhra Pradesh will be free to
make use of underground water within their respective State
territories in the Krishna river basin……”
33. In view of the lack of precise calculability of the underground
water and as agreed to by the parties, the underground water resources
of the States concerned were not taken into account for purposes for
equitable apportionment of the waters of the river Krishna and physical
basin (river valley) thereof. Thus, the Tribunal decided that the
concerned States will be free to make use of underground water within
their respective State territories in the Krishna river basin.
34. Narmada Water Disputes Tribunal in their report of 1978, Vol.I.
Chapter IX, Page 118, Para 9.4.1 have observed as under:-
“Ground water
9.4.1 For equitable apportionment of the waters of an inter-
State river system, the underground water resource of a State
is a relevant factor. The reason is that underground water may
furnish alternative means for satisfying the State’s irrigation
needs. But the difficulty is that groundwater flow cannot be
accurately estimated from the technical point of view, and,
5 A.H. Garretson and others, The Law of International Drainage Basins(1967) p. 312; L.A. Teclaff’ The River Basin in History and Law, p.10.
6 The Nation’s Water Resources, United States Water Resources Council 1968, pp. 3-2-1, 3-2-7.

129
therefore, not fully cognizable as yet from the legal point of
view. In view of this difficulty, we are of the opinion that
groundwater should be omitted altogether in the consideration
of legal problems of the river basin……”.
35. The Narmada Water Disputes Tribunal in their report of 1979,
though considered underground water resources of a State as a relevant
factor for equitable apportionment of the waters of an inter-state river
system but because of the difficulty that groundwater could not be
accurately estimated, were of the opinion that this resource was not fully
cognizable from the legal point of view and, therefore, the groundwater
was altogether omitted from the consideration.
36. Godavari Water Disputes Tribunal in their report of 1979, Vol.I,
Chapter IV, Page 32 have observed as under:-
“The underground water resources of an inter-State river basin
is a relevant factor for the equitable apportionment of the
waters of a river basin. Underground water may furnish
alternative means for satisfying irrigation needs. Moreover,
there may be such a close connection between the surface and
groundwater resources of a river basin that it may be
necessary to limit the use of groundwater to prevent diminution
of the water supply downstream.
Further, groundwater flow is not fully calculable from the
technical point of view and, therefore, not fully cognizable as
yet from the legal point of view. Being invisible, groundwater
resources baffle quantitative measurement.
In the present case, however, we are dividing the waters of the
river Godavari on the basis of the agreements already arrived
at between the parties. The question of furnishing alternative

130
means for satisfying the irrigation needs of a State does not,
therefore, arise.”
37. As mentioned earlier, the stand of the State of Tamil Nadu in
respect of the ground water is that it is not a relevant factor for purpose of
calculation of the total yield of the basin or for apportionment. In this
connection, Krishna Water Disputes Tribunal, Narmada Water Disputes
Tribunal as well as Godavari Water Disputes Tribunal have said – For
equitable apportionment of waters of an inter-State river system, the
underground water resources of a State is a relevant factor but they
declined to investigate the question regarding availability of the ground
water and quantity thereof on the ground that ground water flow cannot
be accurately estimated from the technical point of view and, therefore,
was not fully cognisable as yet from the legal point of view.
38. In this connection, reference was also made to the Irrigation
Commission Report (1972) Volume-I, Page-54, in which it has been
said:- ‘no systematic quantitative assessment of ground water has so
far been made in India for the various river basins and that assessment
can be made only on the basis of complete data (yet to be collected) on
sub-surface geology, rainfall, evapo-transpiration, percolation zone,
extent of saturation, hydraulic gradient, acquifer characteristics, geo-
chemistry of water, etc.”
39. Teclaff’s “River Basin in History & Law-1967”, pages -9-10, it
has been said:-
131
“The derivation of stream flow from underground sources is
thus very complex and can often be traced only by detailed
study of the geology of the basin. For this reason it has been
recommended that groundwater be omitted altogether in the
consideration of legal problems of the river basin.”
40. In the book – “The Law of INTERNATIONAL DRAINAGE BASINS” by
A.H. Garretson and others published in the year 1967, at page No.312 it
has been said:-
“The course of a river is indicated traditionally only by its surface
flow, and geographers as well as lawyers are accustomed to
having fairly well defined channel with which to work. Here flat
marshy land confounds the issue. And the important role of
underground water flow, though known to the hydrologist, is not
fully calculable from the technical point of view and, therefore,
not fully cognizable as yet from the legal point of view.”
41. But in the book - ‘The Law of International Watercourses’ by
STEPHEN C. McCAFFREY in Chapter dealing with the Special Case of
Groundwater at page No.420-421, it has been said:-
“Perhaps because of the increasing understanding of hydrology,
the trend among modern agreements on shared freshwater
resources is to include groundwater within their scope. For
example, the Agreement between Nigeria and Niger concerning
the Equitable sharing in the Development, Conservation and Use
of their Common Water Resources provides that a reference to
the shared river basins shall include a reference to underground
waters contributing to the flow of surface waters.; Groundwater
not so related to surface water is also within the scope of the
agreement, provided it straddles a border between contracting
states. Similarly, as has been seen, both the 1995 SADC
132
Protocol and the 2000 Revised Protocol defined the
watercourses they cover to include groundwater. More generally,
the 1994 Convention on Cooperation for the Protection and
Sustainable Use of the Danube River defines ‘catchment area’ of
the Danube River to mean ‘the hydrological river basin’; a
definition that would include ground water, as we have seen.
And reflecting the special importance of groundwater in arid
regions, this resource is specifically provided for in the 1994
Treaty of Peace between Israel and Jordan. That agreement
allocates not only ‘Jordan River and Yarmouk River waters’ but
also ‘Araba Arava ground water’.
42. The Central Ground Water Board, Ministry of Water Resources,
Government of India, along with other agencies has been trying to
ascertain the availability of the ground water in different States in India.
In the report published in the year 1995 quoted in detail earlier, it has
been mentioned:-
“But in view of the rapidly expanding urban, industrial and
agricultural water requirements, assessment of ground water
resources with best possible accuracy is of fundamental
importance for planning the resource use on scientific and
economic considerations…..”
“Ground water is an important source of irrigation and caters to
more than 45% of the total irrigation in the country. The
contribution of ground water irrigation to achieve self-
sufficiency in food grains production in the past three decades
is phenomenal. In the coming years the ground water
utilization is likely to increase manifold for expansion of
irrigated agriculture and to achieve National targets of food
production…….”
[Emphasis supplied]

133
43. “The Ground Water Estimation Committee” constituted by the
Government of India in the year 1982 with members drawn from various
organisations engaged in hydro-geological studies and ground water
development, the recommendations whereof have been quoted in detail
above, has said about Tamil Nadu:-
“Tamil Nadu –
In hard rock area the dug wells and bore wells are common
structures for groundwater development. In alluvial areas deep
tubewells are feasible.
The groundwater development in most of the parts of State is
high resulting in lowering of water level in many areas.
Regulated development of groundwater is required specially in
hard rock areas. In the coastal areas, a cautious approach has
to be adopted for groundwater development due to salinity
hazards.”
44. Even the Irrigation Commission’s Report of the year 1972, has
referred to the use of ground water in the Cauvery delta area, which has
been quoted earlier in para 26.
45. The National Water Policy published by Government of India,
Ministry of Water Resources in April,2002 says about ;Ground Water
Development as under:-
“Ground Water Development
7.1 There should be a periodical reassessment of the ground
water potential on a scientific basis, taking into consideration
the quality of the water available and economic viability of its
extraction.

134
7.2 Exploitation of ground water resources should be so
regulated as not to exceed the recharging possibilities, as also
to ensure social equity. The detrimental environmental
consequences of over-exploitation of ground water need to be
effectively prevented by the Central and State Governments.
Ground water recharge projects should be developed and
implemented for improving both the quality and availability of
ground water resource.
7.3 Integrated and coordinated development of surface water
and ground water resources and their conjunctive use, should
be envisaged right from the project planning stage and should
form an integral part of the project implementation.
7.4 Over exploitation of ground water should be avoided
especially near the coast to prevent ingress of sea water into
sweet water aquifers.”
(Emphasis supplied)
46. It has been reiterated that exploitation of ground water
resources should be so regulated as not to exceed the recharging
possibility, but it has been also said that there should be integrated and
coordinated development of surface water and ground water resources
for their conjunctive use. With increase of the use of surface water for
purposes other than agriculture and as well as because of the increase of
the acreage under irrigation, the importance of ground water has been
increasing in most of the States in India where there is necessity of
conjunctive use of ground water resources with surface water.

135
47. The fresh water resources of the basin include both the surface
water and the ground water. In many cases the surface flow may
contribute to the ground water in any particular area apart from the
rainfall. In such situation it can be said that there is a close connection
between the surface and the ground water. The rainfall is also not only
the source of surface flow but also of the ground water by vertical
infiltration. The same rainfall may contribute to the ground water in the
basin if the topography so permits by lateral entry through streams and
canals. The State of Karnataka in the Statement of Case have also
referred to the Irrigation Commission 1972 report wherein the Irrigation
Commission had stated that:-
“Modern planning of river basins has to be on the basis of
the totality of the available surface and groundwater resources
in the basin. The concept of the integrated use of surface and
groundwater is now universally recognized. It would be
incorrect and even harmful to allow them to develop in
isolation.”
(Ref: Irrigation Commission 1972, Vol.I, Page 281, Para 12.18)
48. Also, Karnataka State has made a reference to the report of
National Commission on Agriculture, 1976 recommendations, wherein,
the Agriculture Commission has observed that “there are tracts in the
Country…….. that are rich in both surface water and groundwater, and it
becomes a matter for consideration as to how best the two can be
utilized for irrigation………..” (Ref: Agriculture Commission Report Page
26, Para 15.6.7)

136
49. At the very outset Shri Divan, learned Senior Counsel arguing
the case on behalf of Karnataka stated that ground water available in the
delta area only should be considered for assessment and allocation; the
ground water in respect of non-deltaic area both in Tamil Nadu and
Karnataka within the Cauvery basin need not be considered for
assessment and allocation. His plea was that the non-deltaic basin area
in Tamil Nadu is similar to Karnataka which does not possess aquifer
conditions and consist of hard rocks of the types like granite, gneiss,
schist, etc. They are hard, and fractured. They have limited storage of
low yielding capacities.
50. The State of Karnataka had produced Dr. D.M. Nanjundappa,
socio-economic expert, as one of their witnesses who was cross-
examined by the learned senior counsel on behalf of State of Tamil
Nadu. During the course of his cross-examination, Tamil Nadu submitted
Exh. No.1352 (TN Vol. 35) which gives details about all marginal and
small farmers and their number of holdings along with total number of
land holdings in the Cauvery basin. The position in Tamil Nadu area of
Cauvery basin is as under:-
Marginal farmers below 1.0 ha holding - 15.67 lac
Small farmers (1 to 2 ha holding) - 4.63 “
Others (more than 2 ha holding) - 3.30 “ Total - 23.60 lac 51. Thus, it would be seen that about 66% holdings are below 1 ha
and 19.6% holdings are between 1 and 2 ha and about 14% are the land
holdings, which are more than 2 ha in area. It is abundantly clear that

137
the bulk of the farmers are falling in the category of marginal and small
farmers. The additional Advocate General of Tamil Nadu during the
course of arguments emphasized that in the delta area, if large
extractions are made from the groundwater by the State, it could create
adverse socio-economic problems due to fall in the water level of dug
wells of small/marginal farmers.
52. In November 1964, following the request of the Government of
India, the United Nations team visited Tamil Nadu, then known as
Madras State, to study the possibility of augmenting domestic water
supplies for Madras city and adjoining metropolitan areas. Later the
Government of India submitted another request to United Nations
Development Programme for extension of the ground water investigation
into the Cauvery Delta alone. A three-man Mission from United Nations
visited the Cauvery Delta in January 1968. As will appear from the
‘Abstract’ which is at the beginning of the report of Volume I, the object of
the project was to investigate the hydrology of the Cauvery Delta to
assess its ground water potential for irrigation and to carry out certain
agricultural and soils- studies. During the investigation in association
with team of Experts of Tamil Nadu, data were collected geological
mapping, etc. were carried out, details whereof have been mentioned in
the said report. In the beginning of Volume I of the report under the
heading ‘Abstract’ at pages xiv and xv it was said by the UNDP team as
under:-

138
“The Pliocene and Quaternary deposits form the shallow aquifer
which extends over most of the delta area. The recharge of the
shallow aquifer is by infiltration of surface irrigation water and
precipitation. There are indications that water-levels in shallow
aquifers can be lowered more and still fully recover by the end of
the north-east monsoon. The yearly quantity of groundwater that
can be extracted by using centrifugal pumps is: in the Cauvery
sub-basin 954 million m3 (33.7 TMC); in the Vennar sub-basin, 157
million m3 (5.4 TMC); and in the New Delta area 923 million m3
(32.5 TMC).
An additional quantity of 1,600 million m3 (56.5 TMC)/year of
ground water can be made available in the Cauvery sub-basin by
lowering seasonally groundwater level to 10 metres depth below
the regional groundwater level and substituting high-yielding
medium-depth tube wells equipped with turbines for the low-yield
filter points with centrifugal pumps………”
“The total yearly quantity of replenishable groundwater that
can be extracted from the shallow aquifer in the delta through high-
yielding medium-depth tube wells equipped with turbine pumps is
3,650 million m3 (129 TMC).
The medium-depth wells equipped with turbine pumps are
costly, but their production can be shared by several farmers. Such
a well when used for irrigation of early rice nurseries and for
irrigation of summer short-term cotton would pay for itself in one or
two years time.
The idea of co-operatives, however, does not at present
appeal to the farmers of the delta who prefer to have each his own
well. It will take some time and some effort to convince the people
of the economic benefit of medium-depth tubewell and co-
operation. At present and for some time to come therefore,
groundwater will have to be developed by the existing method, that
is, shallow wells, dug wells and filter points equipped with

139
centrifugal pumps. The total yearly quantity of groundwater that
can be extracted from shallow aquifers in the delta by using
centrifugal pumps is about 1,170 million m3 (41.3 TMC). This
represents about one third of the volume 2of groundwater which
could be lifted by turbine pumps.”
53. At page 130 of the UNDP Report - Volume-I, the conclusions of the
ground water investigation in the delta have been stated. In Paragraph
7 at page 131, it is stated:-
“The ultimate additional quantities of groundwater of good or
acceptable quality for each stage and for each of the sub-basins
are tabulated below.
Sub-basin (area in sq.km) New Delta
Stage Cauvery (2,650)
Vennar (447)
NE corner (328)
Remaining (1,582)
Total
First objective(Mm3) Shallow aquifer, seasonal depletion level 4-5 metres.
954 (33.7 TMC)
157 (5.54 TMC)
55 (1.94 TMC)
-
41.17 TMC
Second objective (Mm3) Deep aquifer
135a/
(4.77 TMC)
-
-
-
4.77 TMC
Third objective (Mm3) Shallow aquifer, seasonal depletion, level 9-10 metres.
1,600 (56.5 TMC)
-
-
868 (30.66 TMC)
87.06 TMC
a / Leakage potential for 30-metre piestic head relief over 300 sq. km
already included in the shallow-aquifer system, recommended for a
limited development only.”
54. According to the aforesaid report in Cauvery sub-basin, the
quantity of ground water has been estimated to be 954 million m3 = 33.7

140
TMC; in Vennar sub-basin 157 million m3 = 5.4 TMC and in the New
Delta area 923 million m3 = 32.5 TMC, the total being 70.16 TMC.
According to UNDP the ground water available in the old Delta
consisting of Cauvery sub-basin and Vennar sub-basin along with part of
the new Delta (N.E. corner) which is in the Cauvery basin is about 41.17
TMC. This quantity is recommended for exploitation under the first
objective i.e. seasonal depletion level 4-5 metres. The said report
mentions that additional quantity of 1600 Mm3= 56.5 TMC can be
available as ground water in the Cauvery sub-basin area by lowering
seasonally ground-water level to 9-10 metres depth below the regional
ground water level and substituting high-yielding medium-depth
tubewells equipped with turbines for the low-yield filter points with
centrifugal pumps. The suggestion which was given by the UNDP team
to lower the level to 10 metres depth and substituting tubewells
equipped with turbine pumps was to take out water from still lower
levels. It is the case of the Tamil Nadu, that because of the high cost
involved in purchasing these equipments and in lowering the depth upto
10 metres by different cultivators in the delta, it was not practicable and
un-workable. Apart from that this would have resulted in drying of all the
existing drinking water wells. It is not correct to say that UNDP had
assessed the total available ground water to be 129 TMC. The figure of
129 TMC can be achieved only if the ground water level is lowered by
10 metre depth and then they are substituted by high-yielding medium
depth tubewells equipped with turbines for the low-yield filter points with

141
centrifugal pumps. For introduction of any such scheme, the cultivators
of the delta must have the capacity to meet the expenses apart from the
risk of existing wells becoming dry.
55. The stand of Karnataka is that if the recommendation of UNDP
made in the year 1973 had been implemented, then the aquifers in the
delta would have been recharged by north-east monsoon rainfall which
could be utilised during the period between June to October next year.
Unless either at the instance of the State Government or the cultivators
the aforesaid recommendation to tap the additional resource of 56.5
TMC by lowering the ground water level to 10 metres depth and
substituting high-yielding medium-depth tubewells equipped with turbine
pumps for the low-yield filter points with centrifugal pumps are
implemented, it is difficult at this juncture, to take that amount of 56.5
TMC into account for purpose of determination as to what is the total
ground water available in the delta. It is not in dispute that second and
third objectives mentioned in the aforesaid report at page 131 have not
been achieved.
56. It appears that CFFC had referred the question regarding
quantity of the ground water in the delta to the Central Ground Water
Board for their opinion. Since reply from the Central Ground Water
Board was not received until the submission of the report by the
Committee, no opinion has been expressed by CFFC regarding ground
water. The Government of India vide its letter dated 19th/20th September,
1973 forwarded the opinion of the Central Ground Water Board to the

142
Government of Tamil Nadu (Exhibit No.TN-842, TNDC Volume No. XV
(Page No.161-166). A three Member team consisting of Shri A.K. Roy,
Chief Hydrogeologist, Shri D.S. Deshmukh, Director, Southern Region
and Dr. K.V. Raghava Rao, Superintending, Hydrogeologist, Central
Ground Water Board visited Madras and held detailed discussion with
the State Ground Water Directorate Officials as well as with other officers
of the irrigation department. The team also scrutinised the available
technical information collected through UNDP Project and allied studies
in the Cauvery delta. At page165 (para.6) is the SUM-UP
“On the basis of the data made available to the Team, the
following consensus is arrived at:-
i) The surface water released from Mettur Dam does
definitely contribute to the recharge of the upper aquifer
now being intensively developed for large scale extraction
of water for irrigation purposes in the Cauvery Delta.
ii) The benefit from the north-east monsoon (November-
December) to recharge shallow aquifers is not being fully
utilised at present. If the water table in the shallow aquifers
is kept suitably depressed till the onset of North-East
monsoon, it is felt that adequate recharge to the shallow
aquifer can also be effected. The contention of the State
Government that the upper aquifers are blanketed by an
impervious clay bed to prevent percolation of precipitation
all through the system is not convincing.
iii) In order to implement as in (ii) above the adverse socio-
economic impact has to be given careful consideration, as
it would involve changing over or designing of the existing
extraction system as a whole of the filter points and open
wells (i.e. centrifugal pumping).

143
iv) The data collected through the UNDP project study and as
presented by the State Government also substantiate that
the deeper confined aquifer (Tertiary aquifer) is not prolific
enough to support 1000 heavy duty tubewells as originally
planned under Cauvery Delta Modernisation proposals.
This stands to reason.”
57. The question regarding the utilisation of the ground water with
a special reference to the delta area in Tamil Nadu was again examined
by a team of Central Ground Water Board, and the opinion was
forwarded vide letter dated 5th September, 1974 addressed by the
Government of India and to the Government of Tamil Nadu (TN Exhibit
No.843, TNDC Volume No. XV (Page -166). The Central Ground Water
Board examined the ground water potential of Cauvery delta, the details
whereof have been mentioned in the report enclosed to the letter
aforesaid. In para 5 of TNDC Volume XV (Page 170-172), points
emerged through the assessment have been stated:-
“i) The quantitative estimates made for the release of the
water from the ground water reservoir for the shallow as well
as deep aquifer systems in the delta for two set of depletion of
the water level (4 to 5 metres and 9 to 10 metres) is
acceptable but for the adjustments stated below.
i) The ground water potential of the shallow aquifer is
estimated under UNDP study based on phreatic conditions for
the aquifer system, ignoring the possibility of the shallow
ground water reservoir functioning initially as a confined aquifer
system with low storativity efficient for large scale pumping. As
such, till the system attains phreatic conditions (the piezometric
head of the aquifer system drops below the clay bed) the

144
contribution from the ground water reservoir cannot be of the
magnitude of 20% specified as assumed in the UNDP study.
In view of this, the ground water potential shown against first
stage development of the shallow aquifer in the old delta may
not be of the order of 1110 Mm3 (40 TMC). It may have to be
slightly lesser than this figure. As a first approximation,
reduced figure of 30 TMC may be reckoned.
ii) The limited ground potential of 135 Mm3 (5TMC) from the
deep aquifer systems (upto 100 metres) exclusively in the
Cauvery sub-basin may also be utilised by pumping through
tube wells.
iii) The fairly large potential of ground water from the shallow
aquifer in the Cauvery sub-basin 1600 Mm3 (58 TMC) with
water level depressions created close to 10 metres (and above
if feasible) could only be made available for gradual and
phased development. This, however, would necessitate a
change in the design of ground water extraction structures
(tube wells) and the extent of its utilisation would depend on its
effective recharge from the North East Monsoon due to the
depletion created in the water levels in the shallow aquifer
system through sizeable extraction of ground water. This
situation may induce better recharge condition to the aquifer
system from the North East Monsoon and reduce its heavy
run-off (as is being experienced now) on the expectation that
the persistence clay-bed would not as a leaky confined bed in
the changed conditions and the unlined drain channels may
also function as better recharge points to the shallow aquifer.
While utilising this additional recharge, however, it will be
desirable to limit the pumping to a safe limit between the salt
water and fresh water zones and no ingress of salt water takes
place. As a rough first approximation, it is reckoned that it may
not be safe to utilise more than 50% of the potential.

145
On this reckoning the ground water potential available from the delta
works out to 1780 Mm3 (64 TMC). The break-up for the same is given
below.
Mm3 TMC i) From the shallow aquifer system In the Cauvery & Vennar Sub- Basin (old delta) with 4-5 metres
Depletion. 840 30
ii) Deep aquifer exclusively in Cauvery sub-basin 135 5
ii) From the shallow aquifer system in Cauvery sub-basin with depletion
close to 10 metres (and above if feasible) with suitable and gradual introduction of ground water extraction structures (tube wells) and scope for recharge from the North East Monsoon to the shallow
aquifer. 812 29 1787 64
(say) 1789 “
58. From the above estimation made by the Central Ground Water
Board, as quoted above, it appears that according to them ground water
potential available from the delta works out to 64 TMC which includes 5
TMC from deep aquifer (upto 100 meter deep). The break up whereof
has been mentioned towards the end of the report. From the shallow
aquifer system in the Cauvery & Vennar sub-basin (old delta) with 4-5
metres depletion, the estimate was made at 30 TMC. However, another
29 TMC can be added to this if the shallow aquifer system in cauvery
sub-basin with depletion close to 10 metres and above is feasible with
suitable and gradual introduction of ground water extraction structures

146
(tubewells) and a scope for recharge from the North East Monsoon. It is
obvious from the report that no estimation then had been made in
respect of the portion of the new delta.
59. It appears that the Central Ground Water Board in its report
was of the opinion that the work carried out by the UNDP in
collaboration with the State PWD Department (1969-72) in the Cauvery
delta and its follow up was not only systematic but also brought out
substantial information on functional behaviour of the shallow and
deeper aquifers both in the old and New deltas.
60. Cauvery Delta Modernization Project
(The Groundwater Resources of the Cauvery Delta with Special Reference to Conjunctive Use of Surface Water and Groundwater By W. Barber, Consultant, World Bank)
The Report was forwarded vide letter dated 30th April,1985 to the
Government of Tamil Nadu (TNDC Volume XV – Page No.173). Mr. W.
Barber (Consultant) World Bank, who had examined the delta area in its
different aspects and contours along with the UNDP report; has given a
table of Gross Groundwater Abstractions from Cauvery Delta between
the years from 1971 to 1983 (Page 190, TNDC Volume No. XV). The
table is extracted below:-

147
Table 7 GROSS GROUNDWATER ABSTRACTIONS FROM CAUVERY DELTA
Year Cauvery
Sub-basin Vennar
Sub-basin New Delta S.B.
Total
Mm3 Mm3 TMC 1971 1972 1973 1974 1975 1976 1977 1978 1979 1980 1981 1982 1983
99 159 127 204 254 533 656 409 387 524 398 689 572
22 35 30 39 50 84 95 68 92 86 98
103 93
9 15 13 13 16
149 152 152 102 108 111 105 165
130 (4.58) 209 (7.38) 170 (6.00) 256 (9.04) 320 (11.30) 766 (27.05) 903 (31.89) 629 (22.22) 581 (20.52) 718 (25.36) 607 (21.44) 897 (31.68) 830 (29.32)
61. Regarding the available ground water resources for
conjunctive use, It is mentioned in the said report as under (Volume No.
TNDC-XV (page No.192-193):-
“35. Given that the aquifer system fills before the end of the
monsoon and the end of the main irrigation season, and thus
rejects further potential recharge, one approach to defining the
maximum available groundwater resource would be to
determine the amount of pumping required to create the
necessary fill-able storage in the aquifer system so that
rejection was minimized or eliminated. This type of approach
was postulated in the UNDP report as an ultimate
development scenario with the aquifer being dewatered each
year to a depth of 9-10 m below ground surface. However, the
scenario does not give proper weighting to the interaction of
the rainfall and surface water irrigation regimes with the
groundwater system, and the fact that the main monsoon crop
is one or other variety of rice for which the paddies must be

148
kept flooded. This relationship is particularly sensitive during
the south west monsoon period when both rainfall and surface
irrigation water may be in short supply. The large volume of
groundwater storage created under the scenario, presumably
largely by dry season pumping, could only be refilled at the
expense of increased deep percolation losses from the
surface water supply (both in the conveyance and on the field)
and by increased deep percolation of rainfall, thus reducing
the effectiveness of these sources of water to sustain a rice
crop. Hypothetically, it might be possible to make more
effective use of groundwater by changing the cropping pattern
from early rice to a dry crop, but the Government rejects any
such solution, considering the importance of the Cauvery
Delta for the State’s rice production. Moreover,
implementation of the deep water level scenario would put
most of the very large number of shallow tubewells owned by
the farmers, and many of the village water supply wells, out of
commission. It would demand large investments in
redesigned facilities, probably involving installation of electric
submersible or vertical shaft driven turbine pumps. The
Government rightly rejects such a development plan for the
foreseeable future.
36. A more acceptable scenario for development of
groundwater for conjunctive use envisages creation of
groundwater storage down to about 4.5 m below land surface
in the tubewell and filter point areas (mainly in Cauvery and
Vennar sub-basins) and to about 9 m below land surface in
the dug-cum-bored well area (limited to the New Delta sub-
basin) where infiltration rates are lower and hydrogeological
conditions demand this type of facility. This level of
development would keep the existing private facilities in
commission without major modifications. The available water

149
resource at full development of the above scenario has been
estimated as follows for the three sub-basins, after elimination
of areas of poor quality water and salt marsh.
Table 8: ESTIMATE OF AVAILABLE GROUNDWATER IN THE PLIOCENE-QUATERNARY SYSTEM OF CAUVERY DELTA UNDER THE LIMITED DRAWDOWN SCENARIO
Sub-basins Totals Cauvery Vennar New
Delta
Total area (Km2) Rejected area (Km2) Usable water area (Km2)
3282 632 2650
2434 1987 447
2084 174 1910
7800 2793 5007
Water availability (Mm3/yr) By tubewells and filter points By dug-cum-bored wells
765 - 765 (27.03 (TMC)
50 - 50 (1.76 TMC)
40 605 645
22.77 (TMC)
855 605 1460
(51.56 TMC)
37. It should be noted that the above estimates refer to net
abstraction. Table 7 indicates that gross abstraction has, to
date, never exceeded about 900 Mm3 (31.79 TMC) in any
year and a considerable proportion of the water pumped
would have recirculated back to the aquifer. Thus, it is
evident that there is considerable scope for further
groundwater development under the limited drawdown plan.
This is confirmed by the fact that water levels at present fall to
4 m below land surface in only a limited area of the tubewell
zone of the delta (Figure 7) and this is located in the tail
reaches of the surface system, where surface irrigation water
is in short supply and the farmers have a high incentive to
pump groundwater.”
62. Regarding recharge of the groundwater in the delta, it was said
as under (TNDC Vol. No. XV - Page 186-187):-

150
“24. The main components of recharge to the Pliocene-
Quaternary aquifer system are:
(a) recharge from rainfall;
(b) recharge from influent seepage from the delta
rivers;
(c) deep percolation of seepage losses from the canal
system;
(d) deep percolation of irrigation water applied to the
fields;
(e) deep percolation from temporary flood waters; and
(f) return flows of groundwater abstraction.
25. It will be noted that in almost every year, most of the
aquifer system fills to near land surface long before the end of
the monsoon rains and the end of the main irrigation season.
Under these circumstances, the system may be regarded as
rejecting potential recharge. This is not necessarily a
disadvantage overall, as the main crop is rice and the aim is to
minimise losses from the paddies, as happens at full
saturation of the aquifer system. It should also be noted that
system water levels are at their lowest just before the onset of
the southwest monsoon. Mettur reservoir releases are often
made in advance of the monsoon becoming fully established,
and southwest monsoon rainfall is rarely adequate to fully
support a rice crop. Thus, it may be argued that a
considerable proportion of the early Mettur reservoir releases
go to aquifer replenishment through deep percolation from
river channels, canals and fields. This situation is of
significance when deciding optimal groundwater development
involving creation of groundwater reservoir storage, a
considerable proportion of which may have to be refilled from
the surface water resource.”

151
63. As regards recharge of shallow aquifer in the delta area from
the releases of the Mettur is supported even from the reports of the
UNDP Volume No.I – Page 78 under heading ‘Water-level fluctuation in
the shallow aquifer and its recharge’.
“2. (b) The shallow aquifer in the Cauvery basin is
usually fully recharged in about two months after the water
from the Mettur dam has been released over its area. This fast
recharge is due to the fact that most river channels cut through
the 3 to 5 metre semi-confining deposits and water from them
recharges the shallow aquifer directly by lateral infiltration.
Consequently, when the peak monsoon rainfall is reached in
October/November practically all of it runs off as surface water
into the sea.
The semi-confining deposits in Vennar sub-basin are
deeper. The river channels, therefore, are not in a direct
hydraulic contact with the shallow aquifer and lateral infiltration
from the rivers carrying irrigation water is negligible. The main
recharge of the shallow aquifer comes from infiltration mainly
from the fields which becomes maximum during the period of
the peak monsoon rainfall. The difference in recharge pattern
in Cauvery and Vennar sub-basins is reflected by their
hydrographs of cumulative change in ground-water storage.
In New Delta area the recharge of the shallow aquifer is
by infiltration from the fields of the surface irrigation water from
Mettur Dam. This water recharges the semi-confining deposits
and subsequently the shallow aquifer zone but after a time-lag
of 7-10 days. The time-lag was ascertained by a comparative
study of the recovery pattern of the shallow observation wells
and of 7 piezometers in the shallow aquifer. The shallow
aquifer and the semi-confining deposits are usually fully

152
saturated before the peak monsoon rainfall which therefore is
rejected and as a surface water runs off to the sea.”
64. The earlier Tribunals in 1970s had observed that since the
groundwater resources are not properly calculable, the groundwater
cannot be considered for apportionment and on this account the yield
assessment cannot be recognized under law. Although because of the
pressure on the demand of groundwater, this resource is being exploited
but mostly remains in the private sector. In our country even for
agricultural purposes, it is generally the farmers who install dug wells,
filter points and tubewells; statistics have shown that so far the States of
Karnataka and Tamil Nadu who are the major parties in this dispute do
not have a single tubewell owned by the Government for agricultural
purpose.
65. The State of Tamil Nadu has repeatedly stressed that the
recharge of groundwater in the delta area is mainly due to releases from
Mettur reservoir. This view to a greater extent has been supported by
UNDP, the Central Ground Water Board and Mr. Barber of World Bank.
However, It appears to be an admitted position that in the year 1989
Tamil Nadu utilised 47 TMC of ground water. According to the State of
Tamil Nadu, the scope for conjunctive use of ground water was to the
extent of only about 30 TMC. (Ref. Pleadings TN Vol.III, page 187, para
16.8.10).

153
66. In TN Pleadings Vol. VI at page No.141-142, it has been said:-
“The above facts and figures supported by the U.N.D.P.,
Central Ground Water Board, the World Bank Consultant and
further data collected by the State Ground Water Department
during 1972-1991 prove that the utilisable ground water
potential is limited and it is not an additional source from the
point of availability of water resources for irrigation. It is only
an extra facility available in the Delta for supplementing
surface water for irrigation during water shortage periods. The
available potential has been utilised to the maximum extent
possible through 41,800 energised pump sets, 15,000 diesel
pumpsets and 1,00,000 non-energised irrigation and domestic
wells now available in the Delta. The total ground water
extraction during the year 1989 is estimated as 28.4, TMC in
the Cauvery sub-basin, 7.3 TMC in the Vennar Sub-basin and
11.3 TMC in the Grand Anicut Canal area.”
The total of the ground water utilised in the aforesaid three sub-basins
shall be 47 TMC. It may be mentioned that Grand Anicut Canal area is
known as New Delta area.
67. In TN Pleadings Vol.III at page No.186-187 (para 9-10), it has
been said:-
“9. It may be seen from the above that there has been a
general consensus in the opinions expressed by the
competent expert agencies who studied in great detail the
availability of the ground water in the Cauvery Delta at
different points of time, 1972 (UNDP), 1974 (Central Ground
Water Board and Govt. of India) and 1985 (World Bank
Mission).

154
10. Thus in the old Delta, there is scope for conjunctive use of
ground water to the extent of only about 30 TMC. The present
extraction in the old Delta is already nearing about this level,
the extraction in 1989 being 28 TMC. Extraction of ground
water in excess of 30 TMC is ruled out in view of the adverse
socio-economic impact of depleting the aquifer beyond 5 m
depth. It is also relevant to note that ground water is being
used only for supplementary irrigation such as raising of early
nurseries ahead of release from Mettur and supporting belated
crop on ground after stoppage of Mettur releases and during
critical shortage periods. Since only Mettur releases replenish
the ground water, the ground water cannot be considered as
an additional or a separate resource in the Cauvery Delta.”
[Emphasis supplied]
68. In Tamil Nadu Pleadings Vol. III at page 180 (para 4), it has
been said:-
“4. Tamil Nadu has been in the forefront in the country in
identification and utilisation of ground water potential. The
Irrigation Commission (1972) Volume I, Page 97, Para 5.40,
has observed that conjunctive use of ground water and
surface water was already in vogue in the Cauvery Delta. The
detailed investigation for ground water taken up with the
assistance from UNDP in 1966 is the first of its kind in the
country. In the study carried out in the Cauvery Delta during
1966-72, voluminous data have been collected and
documented for interpretation. Aquifers were identified, their
hydraulic characteristics determined and potential estimated.”
(emphasis supplied)
69. From the aforesaid Statements, it is apparent that Tamil Nadu
has been strongly supporting the investigation and collection of data as

155
well as the estimate of ground water made in the delta area by UNDP
throughout, but during the course of arguments at a later stage, on the
basis of the Report of the Ground Water Resource Estimation
Committee 1997 (GEC), the correctness of the estimation of ground
water by UNDP was questioned.
70. On behalf of the State of Tamil Nadu, it was urged that in view
of the new norms prescribed in the year 1997 by the Ground Water
Resource Estimation Committee (hereinafter referred to as ‘Committee’)
more observation wells should have been dug in the delta area by
UNDP for better observation and collection of data to estimate
accurately the quantity of ground water available in the delta area. It
was pointed out that UNDP had 39 observation wells since 1966 and in
the year 1969, 46 more were added, a total 85 observation wells in the
delta, of which area is about 8000 sq. km. In other words, one
observation well for 100 sq. km. approximately. On the basis of the
aforesaid report of the Committee prescribing better parameters for
evaluation of the aquifer, the exercise done by the UNDP, should not be
accepted on its face value. It was objected to on behalf of the State of
Karnataka that merely because some better parameters have been
prescribed for assessment of the ground water in the report of the
Committee in the year 1997, the reports regarding the availability of the
ground water by the UNDP, cannot be now questioned. In that
connection, it was urged by Karnataka that although the proceedings
before the Tribunal, were pending since 1990, still Tamil Nadu has not
156
examined any expert to say that if the calculations are made on basis of
the parameters prescribed in the year 1997 by the Committee aforesaid,
a different result in respect of the estimation of the ground water would
have followed and further that this Tribunal cannot re-calculate the
quantity of the ground water available in the old and new delta by
applying some change in the norm in respect of observation of
fluctuations of the water level in the aquifers within the delta area. It was
also urged by Karnataka that if Tamil Nadu wanted to verify the
correctness of evaluation by UNDP, the data collected by the UNDP,
should have been checked first by a team of experts applying
parameters suggested by the Committee in the year 1997 and one of
such experts could have been examined and the other riparian States
should have been given an opportunity to cross examine him for
showing that new parameters hardly make any difference in so far as
the earlier estimation of the ground water is concerned. The
observation, collection of the data and estimation of the ground water
are in accordance with the requirements prescribed in the report of the
Ground Water Resource Committee in the year 1984. Although there is
no necessity to express any opinion as to what changes in the
parameters have been prescribed, but as a first impression it amounts to
only fine tuning of the norms, which have been used by the UNDP and
prescribed by the same Committee in the year 1984. At page 26, the
Committee has observed in respect of ground water assessment in
accordance with the 1984 guidelines as follows:-

157
“While alternate methodologies for ground water recharge
assessment are possible, the ground water level fluctuation
method, based on the concept of ground water balance, is the
most suitable and reliable at this point of time, considering the
type and extent of data available. As the ground water
assessment has to be done all over the country at each
block/taluk/mandal level, there is also a need to retain the
alternate empirical approach based on specified norms, for
application in areas without adequate water level data. The
two approaches recommended by the GEC – 1984 can
therefore still form the basis for ground water assessment.”
71. It will be relevant to mention that the Committee was
prescribing the norms for whole of India, but UNDP which collected the
data from different observation wells between1966 to 1972 was
concerned only with the delta area of Tamil Nadu. Tamil Nadu, having
applauded and fully supported the collection of data, investigation and
estimation, done by UNDP throughout till the late stage of the argument,
suddenly raised the question of calculating the availability of the data on
the basis of new parameters, which prescribe more observation wells
per 100 sq. km. of area. In any case, unless as already mentioned
above, some expert who had examined the data calculated by UNDP in
the light of the new norms prescribed and examined before the Tribunal,
this Tribunal cannot take into consideration the changes in the
parameters, if any.
72. Reference was also made on behalf of the State of Tamil Nadu
to the cross examination of Dr. K.R. Karanth, the first witness examined

158
on behalf of the State of Karnataka, in respect of its case that so far
ground water in the delta areas is concerned, there is contribution from
the releases made from by Mettur reservoir. This aspect has already
been discussed in the Report of UNDP, Cental Ground Water Board and
Mr. Barber. They have said that the releases from Mettur to the delta
area, contribute to the re-charge of ground water by lateral infiltration
where it is possible according to topography of the land. There is also
re-charge by infiltration after the said water released from Mettur, enters
and remains on the paddy fields. So far the infiltration from the paddy
fields to the aquifers are concerned, that shall be part of the ground
water like rainfall over the said fields. If the infiltration by the surface
flow or the rainfall are also excluded from the quantity of the ground
water, then it is difficult to imagine any other source of availability of
ground water in any particular area including the delta. So far the lateral
re-charge from the releases in any part of the delta is concerned, that is
a question to be determined whether the said amount of water can be
counted while estimating the ground water in the delta. The reason is
obvious. In dispute regarding apportionment of the surface water and
ground water the same amount of surface water released from the
Mettur cannot be counted twice; first as surface water and then as
ground water.
73. It is an admitted position that in no other river basin in India so
much of investigations have been done and data have been collected
159
from time to time, by group of Experts in respect of ground water in
which process Tamil Nadu was always associated.
74. Several documents and reports were shown to us as well as
the evidence of Dr. Karanth, the witness examined on behalf of
Karnataka as to how in the year 1987 the Mettur releases started in the
month of November due to shortage of water, still Kuruvai crop was
grown in about 65,000 acres of land. In that year, on the advice of
experts there was direct seeding of samba crop in about 4.5 lakh acres
in the delta with good results. Karnataka argues that Tamil Nadu should
be directed to grow samba crop by direct seeding as was done in the
year 1987. But the fact remains that if the stand of Karnataka is
accepted that there should not be any release from Mettur prior to
October-November, then as a logical sequence a direction has to be
given that cultivators of Tamil Nadu should not cultivate kuruvai and
thaladi paddy crops in the delta area which they have been growing for
nearly a century. Kuruvai crop is grown early with the help of ground
water and releases from Mettur. This variety of paddy takes much less
time to mature than samba crop. The cultivation of kuruvai starts in
June – July and is harvested by September. Then thaladi is planted in
the same field. This practice is being followed at least since the
beginning of twentieth century and has been recognised under the
agreement of the year 1924. Prior to the agreement of 1924, Kuruvai
was being grown on about 95,000 acres of land and under the terms of

160
agreement, the then Madras Presidency was permitted to extend the
said area by 70,000 acres. The total area being 1,65,000 acres.
75. The Learned Counsel for Karnataka during the course of
arguments referred to the evidence of Dr. M.S.Swaminathan (TNW-4)
examined on behalf of Tamil Nadu, who had particularly referred to the
excellent water management done by the Distt. Administration of
Thanjavur during the year 1987 when the releases from Mettur were
made as late as on 9th November and the State of Tamil Nadu had
successfully faced the situation arising out of meagre release of only 62
TMC of water from Mettur Reservoir, but still the State was able to
harvest a bumper crop of rice. Day to day details were recorded by Mr.
V.Palaniappan (Agriculture Department, Tamil Nadu) in the document
namely “1987 – The Year of Challenge” (Ref.: KAR Note 9 on Issues
Group No. 2, page 24, para 8.5) produced during the examination of Dr
Swaminathan. Karnataka contended that although during the year
1987-88, the releases from Mettur started on 9th November, 1987, still
Kuruvai was grown by the cultivators of Tamil Nadu on about 65,000
acres of land and this must have been done mainly with the help of
ground water available before November and further that considering
that roughly 5,000 acres of paddy require one TMC of water, it seems
reasonable to assume that the said Kuruvai in about 65,000 acres was
grown with the help of 10 to 12 TMC of ground water without any
contribution from Mettur. On behalf of the State of Tamil Nadu, it was
said that the rainfall in the year 1987-88 was exceptionally good and

161
timely because of that Kuruvai could be grown in 65000 acres without
the releases from the Mettur. In support of the stand that in the year
1987-88 there was exceptionally good rainfall, a statement prepared by
Tamil Nadu was filed on 5th December, 2003. It was pointed out from
that Statement that in the year 1987-88, the rainfall in the month of
September was 98.5 mm., in October 328.7mm., in November 134.7
mm. and in December 340.1 mm., which was much more than any of
the years between 1984 to 1987 and then 1988 to 1991.
76. The State of Karnataka had produced Dr. K.R. Karanth (KR-
W1) as an expert witness on ground water. He recommends that ground
water is available for exploitation during any month of the year and can
be used for irrigation and to that extent surface water could be saved.
Paddy cultivation in the delta area is from June to September and
October to January. The former period is the period of south-west
monsoon and the latter period is of north-east monsoon. The only
consideration could be to raise nurseries of Kuruvai during the early
months i.e. June till July by tapping ground water in the event of
delay/decrease in releases from Mettur. Similarly, whenever there is a
dry spell during the rainy season or late requirement of water for
standing crop nearing maturity cultivators can use ground water. This
position has also been accepted by Tamil Nadu State in their pleadings.
(Ref: E-101, page 77, para 5.4.3).
77. The suggestion of Dr. Karanth that large scale pumping should
be done during the months of June to September so that the empty

162
underground reservoir could be filled by north-east monsoon and also to
pump water during north-east monsoon from October to January, so that
whatever pumping is done during that season is also replenished from
north-east monsoon, does not seem to be workable at all, if agro climatic
conditions and periods of raising crop are kept in view.
78. Dr. Karanth had also presented in his statement an
assessment of rainfall component for recharge of ground water by two
methods. In the first method, changes in the ground water storage have
been considered using the rainfall for the months of September and
October. Thereafter, increase in ground water storage due to rainfall in
the months of November and December has been worked out on pro-
rata basis adopting the rainfall of September and October. Using this
methodology he has worked out recharge component of annual rainfall
for the delta area. In his second method, he has analyzed two aspects
of recharge namely surface irrigation and total recharge, and, worked out
the percentage of overall annual rainfall that goes to recharge the
ground water. Dr. Karanth in his first affidavit of 3.8.1993, has referred
to the report “Ground Water Estimation Methodology” of the Ground
Water Estimation Committee (1984), set-up by the Govt. of India. He
mentions about the following ad-hoc norms given in the guidelines:-
“Recharge from Rainfall:
(i) Alluvial areas –
In sandy areas - 20-25% of normal rainfall
In areas with higher clay content -10-20% of normal rainfall”

163
The study of Dr. Karanth for assessing the rainfall component for
recharge of ground water specifically pertains to the year 1987 on the
plea that during this year, Mettur releases were made only on 9th
November, 1987. Thus, during the period from June to end of October,
there were no releases from Mettur reservoir and consequently, the
component of recharge from Mettur releases was insignificant. (Ref:
Supplementary affidavit of Dr. Karanth, page 129, para 162)
79. He further seems to have not considered the rainfall in the
delta area during the period from June to August which was as under:-
Year Project June July Aug. Sept. Oct.
1987-88 Cauvery Delta Rainfall mm 28.3 18.2 90.2 98.5 328.7 System River releases Mcft. 30 43 1254 97 537
-do- New Delta -do- 35.2 3.6 81.2 75.0 215.9 (G.A. Canal) 38 10 137 223 824 (Ref: E-19, pages 136 and 156)
Thus, during the period June to October, the total rainfall in Cauvery
Delta system and New Delta has been 563.9 mm and 410.9 mm
respectively. As regards the releases, the total releases during this
period of June to October in Cauvery Delta has been 1961 mcft. (1.96
TMC) and in New Delta 1232 mcft. (1.23 TMC). From the above, it is
clear that Dr. Karanth has taken into consideration only the rainfall for
the month of September/October ignoring the rainfall from June to
August; and as regards recharge from the river releases, he has totally
ignored the same for the period June to October. In other words,
contribution towards recharge from the above sources seem to have
been ignored in his study.

164
80. Dr. Karanth during his cross-examination by the learned
Counsel of Tamil Nadu on the above aspects has stated as under:-
“Q: 1367 ………………………. I asked you – what are the
factors which are important and which have a bearing
in the case of recharge from rainfall. You say 1, 2, 3,
4 factors. You answer the question one by one.
A: Rainfall is one factor. Topography is another factor.
Soil characteristics is the third factor. Then the land
use is another factor. All these 3 to 4 factors have a
bearing.
Q: 1368 Surely, when you say ‘rainfall’, the duration of the
rainfall, then the time and spacing of the rainfall,
intensity of the rainfall. Are these important factors?
A: Yes, correct.
Q: 1370 Mr. Karanth, do you suggest that if you have a higher
rainfall on a particular day, the recharge will be more.
Is that your suggestion?
A: There will be more runoff.”
It also appears that recharge of ground water from irrigation during the
months of November and December when Mettur releases were made,
had not been considered by Dr. Karanth as will appear from his following
cross-examination:-
“Q: 1697 All right. You have not ignored. Where have you
indicated the effect of irrigation in November and
December? Please show us at page 130
calculations.
A: There is no need to indicate it at all. You are
calculating rainfall recharge, what it would be. It is
quite likely that in some year there may not be any
irrigation release. If there is irrigation supplies, there
165
would be recharge. Nobody can dispute that. I have
not disputed it. But there is no need to mention it
separately, because it is implied; it is obvious.
Q: 1698 It is obvious that you have taken into account
recharge in these two months of November and
December which will take place from irrigation
supplies, in your calculation? ………..
(Mr. Chairman: He has admitted that for November and
December, he has not taken recharge from irrigation, but only
rainfall……………….)
Q: Contd. Mr. Karanth, Am I right in saying that in your
calculations here, when you are calculating the
recharge factor for November and December, you did
not take into account the irrigation supplies and its
impact, for the purpose of this calculation?
A: Yes.
Q: 1699 If in these two months, November and December,
there is irrigation supplies and also rainfall, is it
possible to ascertain how much is the recharge from
out of rainfall and how much recharge has taken
place on account of irrigation supplies? Is it possible
to ascertain? Can you bifurcate the two?
A: If both are concurrent then you can not identify how
much is from what.
Q: 1701 If I understood you correctly, if in the same months of
November and December you have both irrigation
supplies and rainfall, you cannot discern which
quantity has been responsible for recharge due to
rainfall and which quantity of recharge is due to
irrigation supply. Is that not correct?
A: Correct.”
166
81. From the above cross-examination, it is clear that although
there were releases from Mettur during the months of
November/December 1987, the effect of these releases on the recharge
was ignored by Dr. Karanth who only arrived at a general conclusion
assuming that in a year when there will be no releases from Mettur for
irrigation during November and December, the recharge component
from rainfall will be as worked out by him. This assumption is
hypothetical, as hardly there will be any year in which there would be no
releases during June to December. Therefore, his study is only a
theoretical exercise.
82. In this connection, it would be pertinent to mention that the
infiltration from rainfall is dependent on various parameters namely: the
intensity of rainfall, its duration and frequency, for example: if 100 mm of
rainfall occurs during one hour, the same will create much more runoff
than 100 mm of rainfall occurring in 3-4 days. Thus, giving same weight
to the rainfall of November/December as that of September/October,
ignoring the effect of intensity of rainfall for calculating recharge is
questionable.
83. During the course of cross-examination, Dr. Karanth was
shown relevant portion of Irrigation Commission Report 1972 (Vol. III,
Part II, page 304, paragraph 10.20) which is reproduced below:-
“In general, highest rainfall in the Cauvery basin usually
occurs in July or early August upto the point where the Mettur
Dam is situated, the area comes under the influence of the
south-west monsoon, and from this point downwards, the

167
catchment is within the influence of the north-east monsoon,
and the high floods due to this monsoon usually occur in
November. This pattern of rainfall is conductive to a fairly
high flow during the irrigation season from June to January,
except for a short period of about six weeks from when there
is a break in the monsoon. While the south-west monsoon
supply is copious and dependable, the north-east monsoon
supply is irregular and subject to frequent failure.”
And cross-examined on the point:
“Q: 1722 Do you agree with the last two sentences that the
south-west monsoon is dependable whereas the north-east
monsoon is not dependable, it is irregular. Even today, My
Lord he has seen the kind of rainfall. Do you agree, Mr.
Karanth?
A: “Frequent failure”, I am not aware that this is so.
Q: 1723 Do you agree that it is irregular?
A: “Copious and dependable”, this only an agricultural scientist
can say whether that is dependable for his crops, an irrigation
engineer can say whether it is dependable for his run-off.
Q: 1724 You talk about the north-east monsoon, you have seen
the north-east monsoon.
A: If you want to get a technical reply, I can say only hydro-
meteorologist. But if it is……..
(After, the Tribunal pointed out that the witness may take note
of the fact that the Irrigation Commission Report 1972 which
contain all these findings must be constituted of experts on the
subject – the witness then replied that as it comes from the
Irrigation Commission, I accept it in toto.)” (Ref:Dr. Karanth
deposition, Vol.III, page 523 to 525)

168
84. From the above deposition of Dr. Karanth (Q. Nos. 1722 to
1724), it would be seen that Dr. Karanth has admitted that he has done
the study as a Hydrogeologist for assessing rainfall component of
recharge. In reply to further questions, he has clearly stated that he is
not a Hydrometeorologist or Agricultural Scientist or Irrigation Engineer
who could answer, questions pertaining to the pattern of rainfall, its
intensity and dependability and whether the rainfall is sufficient for the
crop etc. Thus, Dr. Karanth has conducted the study only from the
viewpoint of a Hydrogeologist without taking into consideration the
characteristics of rainfall and its adequacy or otherwise for the crops
during the normal years.
85. The State of Tamil Nadu in their Statement of Case, TN 1,
page 25, para 29(b) have stated as under:-
“The upper part of the Cauvery basin which is above Mettur is
influenced by the South West monsoon, while the lower part is
influenced by the North East monsoon. …………………………..
The South West monsoon is more intensive, unfailing and
dependable, spread over a long period. The co-efficient of
variation of rainfall for this season in this part of the region is 15 to
25% from normal. ………………….. The coastal areas and the
delta occasionally receive heavy intense rains of very short
duration, most of which can neither be conserved nor utilized in
the delta. Damages also occur. The worst damage suffered by
the farmers is when their first crop harvests are hampered and the
grains soaked or washed away.”
86. It will be pertinent to mention here that it is not only the
Irrigation Commission but the CFFC Report also had held similar view as

169
regards the northeast monsoon is concerned – that the northeast
monsoon is irregular and subject to frequent failure, and also the high
floods due to this monsoon usually occur in the month of November in
view of the nature and pattern of northeast monsoon which occurs as a
result of cyclonic formation in the Bay of Bengal which bring torrential
rainfall in the eastern coast in delta area. It results in large surface
runoff which many a time even damage the standing paddy crop. As
such, calculation of ground water recharge component of this rainfall on
pro-rata basis with the recharge component from rainfall of September-
October does not seem to be justified.
87. But according to the UNDP report (Phase II, Volume I -1973-
page xiv-para 4), the yearly quantity of ground water that can be
extracted by using centrifugal pumps has been estimated as under:-
In the Cauvery sub-basin 954 million m3 (33.7 TMC); in the
Vennar sub-basin,157 million m3 (5.5 TMC) and in the New Delta
area 923 million m3 (32.6 TMC-upto 9 to 10 metres) the total being
71.08 TMC. However the UNDP report (Volume I page xv para 4)
mentions that:-
“At present and for some time to come therefore, groundwater
will have to be developed by the existing method, that is, shallow
wells, dug wells and filter points equipped with centrifugal pumps.
The total yearly quantity of groundwater that can be extracted from
shallow aquifers in the delta by using centrifugal pumps is about
1,170 million m3 (41.3 TMC)”.
88. According to the Central Ground Water Board from the shallow
aquifer system in Cauvery and Vennar sub-basins (old delta), the

170
available ground water is 30 TMC (Reference: TNDC Volume XV-Page
172). The Central Ground Water Board did not examine the availability
of ground water in the new delta. From the report of Mr. Barber, it
appears that according to him the available ground water in cauvery
sub-basin is 765 million m3 (27.03 TMC); in Vennar sub-basin 50 million
m3, (1.76 TMC) and in New Delta 645 million m3 (22.77 TMC), the
Grand Total of which is 1460 million m3 (51.56 TMC) (Reference: TNDC
Volume XV-Page 193). In other words, whereas according to UNDP
report in the old delta about 39.2 TMC of ground water was available,
according to the Central Ground Water Board; it is only 30 TMC. Mr.
Barber estimated 28.79 TMC. As regards the New delta UNDP
estimated 32.6 TMC and Mr.Barber estimated 22.77 TMC.
89. The area which is located North of Coleroon river falls outside
the delta area which is confined mostly to South of Coleroon river. It is
also noticed that neither CGWB nor Mr. Barber while estimating the
ground water availability in the delta area have considered this area
(falling north of Coleroon river) as delta area, apart from the fact that no
detailed investigation has been done to estimate and to locate ground
water in the area which is located north of Coleroon river, although being
part of the Cauvery basin.
90. The Central Ground Water Board after having discussions with
the Tamil Nadu State officials and scrutiny of the data observed as
under:-

171
“(a) In order to assess whether release of Mettur waters in June has
substantial influence…….. Hydrographs have revealed a downward
trend for the period ending from January to almost end of May
indicating not only the drop in the seasonal fluctuation of the
regional water-table but also its reflection to the large scale
extraction of ground water through pumping from the shallow
aquifer. This is followed by a steep rise in June-July period
depending on the release of the Mettur waters. Though in every
case, the recharge has not brought back the regional water table to
its original level or almost to the bottom of the upper confining clay
bed, a small peak is observed usually during November-December
period indicating a slow rise in the water table and this may be
attributed to recharge from North-East monsoon to the extent the
vacuum in the ground water reservoir permits……” (Ref:TNDC Vol.
XV, Exh. 842, page 163)
91. The State of Tamil Nadu have furnished data regarding
observation wells in the Common Format, Exh. E-20 from page 352
onwards. 14 observation wells pertain to Tanjavur distt. as indicated in
the table at page 352 and details thereof are given from pages 411 to
424. An examination of the water level fluctuation in the observation
wells indicates that the aquifer was almost full by the end of north-east
monsoon i.e. December/January indicating thereby that the under ground
reservoir in the delta rises to its maximum level only by the end of north-
east monsoon and it becomes lowest (water levels fall below the ground
level to the maximum) depending upon the extraction from the ground
water. This position is during the period 1971 to 1991 for which data has
been furnished in the Common Format.

172
92. As regards the new delta area, because the canal system is
manmade there is hardly any chance of lateral infiltration from the river
waters.
93. As indicated by Mr. Barber, World Bank expert, the State of
Tamil Nadu has been using ground water right from the year 1971 and
gradually increasing it depending upon the availability of surface water
as also other considerations of available ground water structures and
power for running the same. As mentioned above, different agencies
have suggested exploitation of different quantities of ground water, but
limiting the withdrawal from the upper portion of shallow aquifer i.e. a
depth of 4-5 metres in the old delta (Cauvery and Vennar Sub-basins).
This according to even Tamil Nadu seems to be acceptable. In the
Cauvery Delta Modernisation Project (covering old delta area), they
projected conjunctive use of about 30 TMC. Of course, that State is
pleading that bulk of it comes from Mettur releases and only insignificant
component is from rainfall recharge.”
94. In the above background, it is clear that in a normal year when
there would be regular releases of water from Mettur, the bulk of
contribution to the ground water in the Cauvery sub-basin would be from
such releases. However, the contribution from surface irrigation and
rainfall (occurring both during south-west and north-east monsoon
seasons) cannot be overlooked.
95. The special feature of the assessment of the ground water in
the delta is that in no other river basin in India so much investigations

173
and assessments have been made in respect of ground water.
However, considering the severe limitations in the assessment of ground
water resource, it would be safe to assume in the present case that the
ground water to an extent of 20 TMC may be used by Tamil Nadu
conjunctively with surface water. This quantum is after excluding the
component of ground water recharge from river water by lateral
infiltration.
---------

16
UTILISATION OF CAUVERY WATERS IN YEARS 1901,1928,1956 AND 1971 Sl. No.
Name of State
Schemes in Operation prior to 1928
Schemes in Operation between 1928-56
Schemes in Operation between 1956-71
Total of Major and Medium schemes
Evaporation losses
Minor Irrigation
Domestic water supply
Total use
Area TMC Area TMC Area TMC Area TMC Area TMC
Area TMC Popul. TMC Area TMC
1 2 3 4 5 6 7 8 9 10 12 13 14 15 16 17 YEAR 1901
11 Lakhs
1. Tamil Nadu
13.853 384.9 -- -- -- -- 13.853 384.9 -- 2.190 44.00 -- 1.20 16.043 430.13
2. Mysore 1.110 24.463 -- -- -- -- 1.110 26.463 -- 1.991 45.50 -- 3.101 71.96 3. Kerala -- -- -- -- -- -- -- -- -- -- -- -- -- -- --
TOTAL 14.963 411.363 -- -- -- -- 14.963 411.363 -- 4.181 89.50 1.20 19.144 502.09 YEAR 1928
1. Tamil Nadu
13.853 384.9 -- -- -- -- 13.853 384.9 -- 2.210 44.00 -- 2.10 16.063 431.00
2. Mysore 1.110 26.463 -- -- -- -- 1.110 26.463 -- 2.039 46.00 -- -- 2.149 72.46 3. Kerala -- -- -- -- -- -- -- -- -- -- -- -- -- -- --
TOTAL 14.963 411.363 -- -- -- -- 14.963 411.363 -- 4.249 90.00 -- 2.10 18.212 503.46

17
Sl. No.
Name of State
Schemes in Operation prior to 1928
Schemes in Operation between 1928-56
Schemes in Operation between 1956-71
Total of Major and Medium schemes
Evaporation losses
Minor Irrigation
Domestic water supply
Total use
Area TMC Area TMC Area TMC Area TMC Area TMC
Area TMC Popul. TMC Area TMC
1 2 3 4 5 6 7 8 9 10 12 13 14 15 16 17 YEAR 1956
11 Lakhs
1. Tamil Nadu
15.375 384.9 5.384 100.60 -- -- 20.759 485.5 8.00 2.412 48.00 -- 3.10 23.171 514.6
2. Mysore 1.395 34.211 2.059 56.20 -- -- 3.454 90.411 5.34 2.200 50.00 -- 4.00 5.654 149.751 3. Kerala -- -- -- -- -- -- -- -- -- 0.063 5.00 -- 0.100 0.063 5.100
TOTAL 16.770 419.111 7.443 156.80 -- -- 24.213 575.911 13.34 4.675 103.00 -- 7.20 28.888 699.451 YEAR 1971
1. Tamil Nadu
18.911 384.9 5.746 100.6 0.642 15.9 25.299 501.4 9.00 2.909 58.00 -- 5.00 28.208 573.4
2. Mysore 1.862 45.79 2.049 56.20 0.359 7.81 4.280 105.10 6.40 2.409 54.70 7.138* 5.0 6.680 171.20 3. Kerala -- -- -- -- -- -- -- -- -- 0.063 5.00 0.063 0.100 0.063 5.10
TOTAL 20.773 430.69 7.895 156.80 1.001 23.71 29.579 606.50 15.40 5.381 117.70 7.138* 10.1 34.951 749.70
*= Population