the relationship between the learning organization concept and firms' financial performance: an...
TRANSCRIPT
5
F E A T U R E
The Relationship Betweenthe Learning OrganizationConcept and Firms’Financial Performance:An Empirical Assessment
Andrea D. Ellinger, Alexander E. Ellinger,Baiyin Yang, Shelly W. Howton
The concept of the learning organization has received considerableattention in the scholarly literature because superior learning processeshave been heralded as a source of competitive advantage. Organizationsthat embrace strategies consistent with the learning organization arethought to achieve improved performance. Yet few empirical studies haveexamined the relationship between the learning organization concept andfirms’ financial performance. To assess this association, the authorsobtained managerial responses to the Watkins and Marsick Dimensions ofthe Learning Organization Questionnaire (DLOQ©) instrument along withboth perceptual and objective measures of firms’ financial performance.Results suggest a positive association between the learning organizationconcept and firms’ financial performance. The article discusses implicationsfor research and practice.
Despite the considerable scholarly attention that has been devoted to the con-cept of the learning organization, Jacobs (1995) has suggested that the learn-ing organization concept is similar to the Wizard in The Wizard of Oz.Although the Good Witch advises Dorothy that the Wizard is the only person
HUMAN RESOURCE DEVELOPMENT QUARTERLY, vol. 13, no. 1, Spring 2002Copyright © 2002 Wiley Periodicals, Inc.
Note: The authors wish to thank the editors and three anonymous reviewers for theirinsightful and helpful comments on an earlier version of this manuscript. The authorsalso wish to thank Drs. Karen E. Watkins, Victoria J. Marsick, and Judy O’Neil forallowing the Dimensions of the Learning Organization Questionnaire (DLOQ) instrument tobe used for this research study.
6 Ellinger, Ellinger, Yang, Howton
who can help her to get home, Dorothy’s dog, Toto, unmasks the Wizard toreveal, as Jacobs puts it, “a mortal being, without any special powers otherthan the ability to control a noisy, smoke-producing machine” (p. 122). Somescholars contend that, like the Wizard, the concept of the learning organiza-tion is in danger of becoming another management fad that is promoted asa remedy for many organizational problems without the benefit of research-based evaluations that examine the outcomes associated with becoming alearning organization (Kuchinke, 1995). Accordingly, to determine whetherthe learning organization concept withstands scrutiny from both a practicaland a theoretical perspective, Jacobs has advocated that scholars “must bethe ones who ask hard questions about important issues in the field and, ifonly in a metaphorical sense, look to see what is behind the curtain of eachone” (p. 122).
Many definitions of the term learning organization exist, based upon schol-ars’ attempts to define general characteristics of the learning organization. Mostdefinitions focus on the importance of acquiring, improving, and transferringknowledge, facilitating individual and collective learning, and integrating andmodifying behaviors and practices of the organization and its members asa result of the learning (Appelbaum and Reichart, 1998; Leitch, Harrison,Burgoyne, and Blantern, 1996). Additionally, learning organizations aregenerally described as being market-oriented; having an entrepreneurial cul-ture as well as a flexible, organic structure; and having facilitative leadership(Lundberg, 1995; Luthans, Rubach, and Marsnik, 1995; Slater and Narver,1995; Watkins and Marsick, 1996b).
The concept of the learning organization is well established. Its proponentssuggest that adopting learning organization strategies should promote indi-vidual, team, and organizational learning and that such enhanced learningshould yield performance gains (Baker and Sinkula, 1999; Day, 1994; Dickson,1996; Hunt and Morgan, 1996; Pettigrew and Whipp, 1991; Slater and Narver,1995). However, contributions in the learning organization literature remainlargely descriptive or prescriptive; few are grounded in practice (Altmanand Iles, 1998; Gardiner, 1999; Iles, 1994; Jacobs, 1995; Leitch, Harrison,Burgoyne, and Blantern, 1996). Numerous discussions center on why learn-ing matters. Yet fewer research studies address the processes required to buildlearning organizations, their potential impact on firm performance, and over-all assessment approaches (Goh and Richards, 1997; Henderson, 1997). Inshort, few concrete studies exist that clarify how the learning organization con-cept works to achieve performance improvement ( Jacobs, 1995; Kaiser andHolton, 1998).
Smith and Tosey (1999, p. 70) acknowledge that “evidence is even harderto come by of organizations linking learning to ROI [return on investment]and to the kinds of results that might convince hard-headed business peopleto risk their money on a learning organization journey.” Without such assess-
ment approaches, they contend, “even a preliminary exploration of means tosubstantiate a business case for a learning organization is precluded” (p. 70).Accordingly, one of the major research challenges articulated in the literatureis to establish the relationships between characteristics of the learning organi-zation and organizational performance.
The primary purpose of the current research is to assess the relationshipbetween the learning organization concept as articulated by Marsick andWatkins (1999) and Watkins and Marsick (1993, 1996a, 1996b, 1997)and firms’ financial performance using both perceptual measures of firmperformance and objective, secondary financial data drawn from theCOMPUSTAT and the Stern Stewart Performance 1000 financial databases.
Theoretical Framework
The theoretical framework guiding this research is the Watkins and Marsickconceptualization of the learning organization (1993, 1996a, 1996b, 1997).According to Watkins and Marsick (1996b, p. 4), a learning organization is“one that learns continuously and transforms itself. . . . Learning is a continu-ous, strategically used process—integrated with and running parallel to work.”In the same book, they identify seven complementary action imperatives thatcharacterize organizations journeying toward the concept of the learningorganization:
• Create continuous learning opportunities.• Promote inquiry and dialogue.• Encourage collaboration and team learning.• Establish systems to capture and share learning.• Empower people toward a collective vision.• Connect the organization to its environment.• Use leaders who model and support learning at the individual, team, and
organizational levels.
Marsick and Watkins (1999, pp. 10–11) emphasize three leverage points intheir framework: “(1) systems-level, continuous learning; (2) that is createdin order to create and manage knowledge outcomes; (3) which lead toimprovement in the organization’s performance, and ultimately its value, asmeasured through both financial assets and non-financial intellectual capital.”(For a full discussion of the seven action imperatives, see Marsick andWatkins, 1999.)
Watkins and Marsick (1993, 1996a, 1996b, 1997) developed the DLOQ,an instrument whose seven dimensions represent the seven action impera-tives. The DLOQ learning organization assessment tool allows members of
Learning Organization Concept and Firms’ Financial Performance 7
8 Ellinger, Ellinger, Yang, Howton
organizations to examine the extent to which their organizations embrace thepractices and beliefs associated with the seven action imperatives.
Research Questions
This study addresses the following research questions:
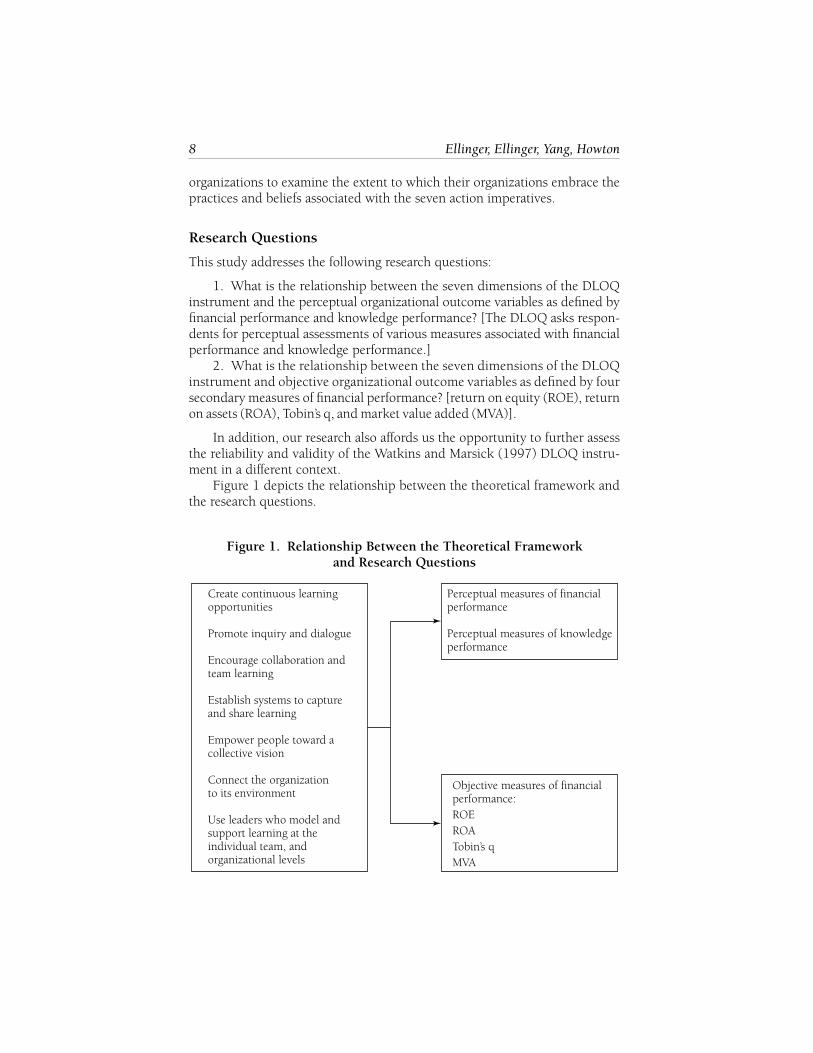
1. What is the relationship between the seven dimensions of the DLOQinstrument and the perceptual organizational outcome variables as defined byfinancial performance and knowledge performance? [The DLOQ asks respon-dents for perceptual assessments of various measures associated with financialperformance and knowledge performance.]
2. What is the relationship between the seven dimensions of the DLOQinstrument and objective organizational outcome variables as defined by foursecondary measures of financial performance? [return on equity (ROE), returnon assets (ROA), Tobin’s q, and market value added (MVA)].
In addition, our research also affords us the opportunity to further assessthe reliability and validity of the Watkins and Marsick (1997) DLOQ instru-ment in a different context.
Figure 1 depicts the relationship between the theoretical framework andthe research questions.
Figure 1. Relationship Between the Theoretical Frameworkand Research Questions
Perceptual measures of financialperformance
Perceptual measures of knowledgeperformance
Objective measures of financialperformance:ROEROATobin’s qMVA
Create continuous learningopportunities
Promote inquiry and dialogue
Encourage collaboration andteam learning
Establish systems to captureand share learning
Empower people toward acollective vision
Connect the organizationto its environment
Use leaders who model andsupport learning at theindividual team, andorganizational levels
Research Design
We used a mail survey methodology to address the research questions. Theprocedures we used to design the sampling frame correspond to those outlinedby Dillman (1978).
Sample. We obtained a random sample of four hundred midlevel man-agers at U.S. manufacturing firms from the Council of Logistics ManagementMembership listing. We selected logistics managers as key respondents for thisstudy based upon the increasing role of supply chain management as a keyelement in corporate strategies that focus on service for the provision ofsuperior customer value (Christopher and Ryals, 1999; Poirer, 1999; Stank,Daugherty, and Ellinger, 1998). The supply chain encompasses all of the activ-ities associated with moving products from the raw materials stage through tothe end user. These include sourcing and procurement, production schedul-ing, order processing, inventory management, transportation, warehousing,and customer service, as well as monitoring the information systems that arerequired to integrate all these activities into a seamless process.
As the “quarterbacks” of these processes, logistics managers receive, assess,and interpret large amounts of feedback and data to determine how best tomeet customers’ divergent and continuously changing needs. In additionto synchronizing superior levels of customer service, logistics managers mustalso continuously interact and be highly conversant with the operations of theother business functions within their organizations (Quinn, 1997). The needto have a broad understanding and familiarity with the firms’ operations andthose of the customers make the logistics managers’ perceptions of their firms’learning behaviors a unique measure by which to examine the dimensions ofthe learning organization concept and their impact on performance.
To ensure that the association between the survey data and objective mea-sures of firms’ financial performance could be assessed, we screened potentialrespondents’ firms to determine the availability of secondary data about themon the COMPUSTAT database. We replaced respondent firms from the initialrandom sample for which we did not find data on the COMPUSTAT databaseby randomly selecting additional firms from the Council of Logistics Manage-ment Membership listing and applying the same screening procedure forCOMPUSTAT data.
Prenotification of prospective respondents is believed to increase responserates (Fox, Crask, and Kim, 1988), so we contacted each of the managers inthe sampling frame by telephone to solicit his or her participation in the study.From the final sampling frame of 400, 262 prospective respondents agreed toparticipate in the study, and 138 either declined to participate or could not bereached after multiple attempts. Because type of postage, the sponsorship of auniversity, and monetary incentives are also believed to be influential factorsfor increasing response rate (Fox, Crask, and Kim, 1988), the initial mailingof the questionnaire included prepaid return postage, a personalized letter on
Learning Organization Concept and Firms’ Financial Performance 9
10 Ellinger, Ellinger, Yang, Howton
university letterhead, and a $2 bill as an incentive to respond. We contactednonrespondents with a follow-up letter two weeks after the initial mailing.Respondents returned a total of 208 completed surveys. This response rate rep-resents 52 percent of the sampling frame of 400 and 79 percent of the 262questionnaires that we mailed out.
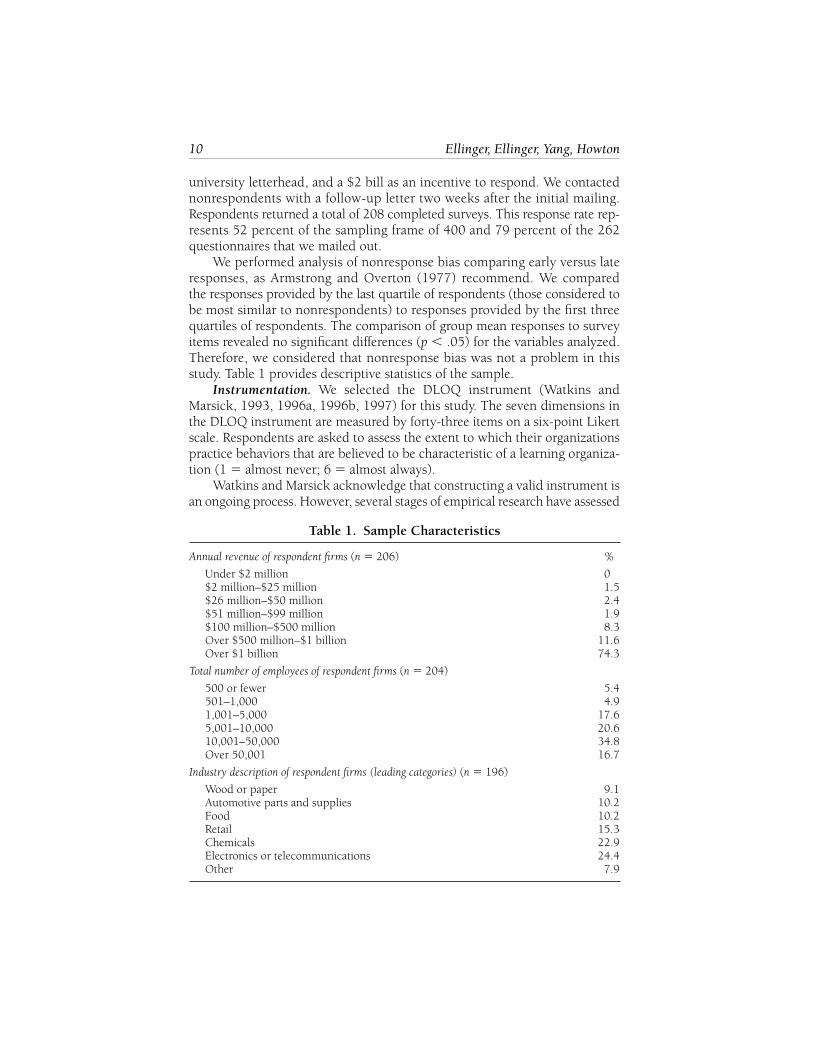
We performed analysis of nonresponse bias comparing early versus lateresponses, as Armstrong and Overton (1977) recommend. We comparedthe responses provided by the last quartile of respondents (those considered tobe most similar to nonrespondents) to responses provided by the first threequartiles of respondents. The comparison of group mean responses to surveyitems revealed no significant differences (p � .05) for the variables analyzed.Therefore, we considered that nonresponse bias was not a problem in thisstudy. Table 1 provides descriptive statistics of the sample.
Instrumentation. We selected the DLOQ instrument (Watkins andMarsick, 1993, 1996a, 1996b, 1997) for this study. The seven dimensions inthe DLOQ instrument are measured by forty-three items on a six-point Likertscale. Respondents are asked to assess the extent to which their organizationspractice behaviors that are believed to be characteristic of a learning organiza-tion (1 � almost never; 6 � almost always).
Watkins and Marsick acknowledge that constructing a valid instrument isan ongoing process. However, several stages of empirical research have assessed
Table 1. Sample Characteristics
Annual revenue of respondent firms (n � 206) %
Under $2 million 0$2 million–$25 million 1.5$26 million–$50 million 2.4$51 million–$99 million 1.9$100 million–$500 million 8.3Over $500 million–$1 billion 11.6Over $1 billion 74.3
Total number of employees of respondent firms (n � 204)
500 or fewer 5.4501–1,000 4.91,001–5,000 17.65,001–10,000 20.610,001–50,000 34.8Over 50,001 16.7
Industry description of respondent firms (leading categories) (n � 196)
Wood or paper 9.1Automotive parts and supplies 10.2Food 10.2Retail 15.3Chemicals 22.9Electronics or telecommunications 24.4Other 7.9
the psychometric properties of the DLOQ (McHargue, 1999, 2000; Selden,Watkins, Valentine, and Marsick, 1998; Watkins, Yang, and Marsick, 1997;Yang, Watkins, and Marsick, 1998; Yang, Watkins, and Marsick, in press). Theseanalyses suggest that the seven dimensions have acceptable reliability estimates(coefficient alpha ranges from .75 to .85). The seven-factor structure was alsofound to fit the empirical data reasonably well (Yang, Watkins, and Marsick,1998). Previous DLOQ instrument development and validation studies haveused nonrandom samples of 116 and 469 respondents respectively from mul-tiple organizations (Watkins, Yang, and Marsick, 1997; Yang, Watkins, andMarsick, 1998). The current research examines a random sample of key respon-dents within a business context.
Perceptual Performance Measures. In addition to the forty-three itemsrepresenting the seven action imperatives, the DLOQ instrument includes twoperceptual outcome measures: financial performance and knowledge perfor-mance. Respondents indicate their assessments of the organization’s cur-rent performance when compared to the previous year. They assess financialperformance by return on investment, average productivity per employee, timeto market for products and services, response time for customer complaints,market share, and cost per business transaction. Respondents assess knowl-edge performance by customer satisfaction, the number of suggestions imple-mented, the number of new products or services, the percentage of skilledworkers compared to the total workforce, the percentage of total spendingdevoted to technology and information processing, and the number of indi-viduals learning new skills.
Secondary Financial Performance Measures. We created a databaseconsisting of secondary objective measures of financial performance forthe respondent organizations in the study with data obtained from the 1998COMPUSTAT and the Stern Stewart Performance 1000 financial databases. Theintegration of perceptual databases and more objective secondary measures offirms’ financial performance for empirical research is well established. Exam-ples in the management literature include studies that examine the quality ofwork life (Lau and May, 1998), human resource orientation (Lam and White,1998), and human resource management practices (Huselid, 1995; Huselid,Jackson, and Schuler, 1997).
Because no single measure is able to completely describe all aspects of afirm’s condition, it is important to examine several different measures of per-formance when attempting to evaluate an organization’s financial performance.The use of a combination of traditional accounting measures such as ROE andtoday’s more popular value-added measures such as MVA provide a goodoverview of the success of a business’s operations.
Our research uses four measures to obtain a comprehensive view of firmfinancial performance: ROE, ROA, Tobin’s q, and MVA. The ROA and ROEmeasures are from the COMPUSTAT database’s data items for each company forthe 1998 financial year. We calculated a proxy for Tobin’s q using a method sug-gested by Chung and Pruitt (1994). We obtained all of the data necessary to cal-
Learning Organization Concept and Firms’ Financial Performance 11
12 Ellinger, Ellinger, Yang, Howton
culate the proxy from the COMPUSTAT database. The MVA data, quoted in adollar amount for each firm, come from the Stern Stewart Performance 1000 andare 1998 financial year data for the firms. Because the research here includesfirms of varying sizes, we standardized MVA by total assets, a proxy for firm size.
ROE. The goal of any publicly held firm should be to maximizeshareholder wealth (see, for example, Brigham, 1995; Jones, 1992; Peterson,1994). An accounting measure that examines firm performance in thiscontext is ROE. The ROE ratio indicates the return on shareholder investmentthat a firm generates; it is calculated by dividing net income by the marketvalue of equity. Often used as a measure of firm performance because it allowspotential investors to compare similar firms and provides shareholders withan indication of their firm’s return, ROE is the most important traditionalaccounting measure for shareholders and potential investors attempting toevaluate a firm.
ROA. ROA is another return-on-investment ratio that is used as anindicator of financial performance. It is an indication of the return availableto shareholders from the investment of all the firm’s capital, including fundssupplied by both owners and creditors of the firm. Similar to ROE, ROA isused both to evaluate the financial performance of a firm over time and tocompare a firm’s performance with the performance of other firms in thesame industry.
Although ROA and ROE are often used as measures of firm performance,the use of additional financial measures is desirable for several reasons. ROEand ROA are both accounting-based performance measures. Both ratiosuse data that tend to be historical in context and that are sensitive to the choiceof accounting methods. Accordingly, our research used two additional finan-cial performance measures (Tobin’s q and MVA) that are regarded as moreforward-looking measures of firm performance because they are based on thecurrent market value of a firm.
Tobin’s Q. Tobin’s q (Tobin, 1969) is another performance measure thatfirms and potential investors frequently use to evaluate firm performance.Tobin’s q represents the value added by management above the value of thefirm’s assets. The q-measure is equal to the market value of assets divided bythe replacement cost of assets and is often used as a proxy for a firm’sinvestment opportunity set (Born and McWilliams, 1997). High q firms arefirms for which the market anticipates a lot of future investment oppor-tunities. In contrast, the market expects low q firms to have fewer investmentopportunities. A q value greater than one means that the market believes theassets of a firm can generate cash flows that exceed the liquidation value ofthose assets. Tobin’s q has been shown to have a high correlation with thequality of managers and is often used to represent this qualitative measure.Determining the actual replacement cost of the assets of a firm is difficult, so aproxy for q is usually used. Perfect and Wiles (1994) show that the proxy for qis similar to Tobin’s q.
MVA. MVA is calculated by subtracting the total capital invested in a firmfrom the sum of the market value of a firm’s equity and the book value of itsdebt. This ratio is forward-looking because it represents the differencebetween the money invested in the firm and the present value of the cashflows expected to be generated by this capital. Thus, MVA is the premium thatthe market places on a stock beyond the amount of capital invested byshareholders and creditors. It is the difference between the amount thatinvestors put into a firm and the amount that is available for investors to takeout of a firm. A positive MVA suggests an increase in shareholder wealth, anda negative MVA indicates a decline in shareholder wealth.
Peterson and Peterson (1996) suggest that, because the goal of managersshould be to maximize shareholders’ wealth, the best test of a measure of per-formance for a public firm is the price of the company’s stock. They find thatmarket value-added measures are statistically significantly correlated with stockreturns. Although the measures are not perfectly correlated, Peterson andPeterson conclude that the market value-added measures are good proxies forthe financial performance of a firm.
Data Analysis
The primary objective of our study was to examine the overall effects of thelearning organization concept on firms’ financial performance. Accordingly, weselected canonical correlation as an appropriate statistical techniquewith which to explore an omnibus impact of the dimensions of the learn-ing organization on a set of perceptual and objective measures of financialperformance. Canonical correlation is a technique for examining the associationbetween two sets of variables (Stevens, 1996). The underlying principle is todevelop a linear combination of each set of variables (both independentand dependent) in a manner that maximizes the correlation between the twosets. The canonical correlation analysis was performed by multivariateanalysis of variance (MANOVA) procedure using the SPSS statistical package(Norusis/SPSS Inc., 1990).
To assess the psychometric properties of the DLOQ instrument, we per-formed confirmatory factor analysis (CFA) to examine the dimensionality andvalidity of the DLOQ in a business context. CFA is a procedure that examinesthe construct validity of an instrument with prespecified dimensions. We con-ducted the CFA using LISREL 8 (Jöreskog and Sörbom, 1989, 1993a, 1993b).
Psychometric Properties of the DLOQ Instrument. An earlier DLOQvalidation study conducted an extensive series of exploratory and confirma-tory factor analyses where the forty-three-item scale representing the sevendimensions of the learning organization was reduced to a more parsimonioustwenty-one-item scale. The resulting twenty-one-item, seven-construct modelyielded superior fit indices than the original forty-three-item model (Yang,Watkins, and Marsick, in press). Based on these findings, our research also
Learning Organization Concept and Firms’ Financial Performance 13
14 Ellinger, Ellinger, Yang, Howton
examined two measurement models to assess the applicability of the DLOQ ina business context: one for all forty-three learning organization items andanother for the reduced set of twenty-one items.
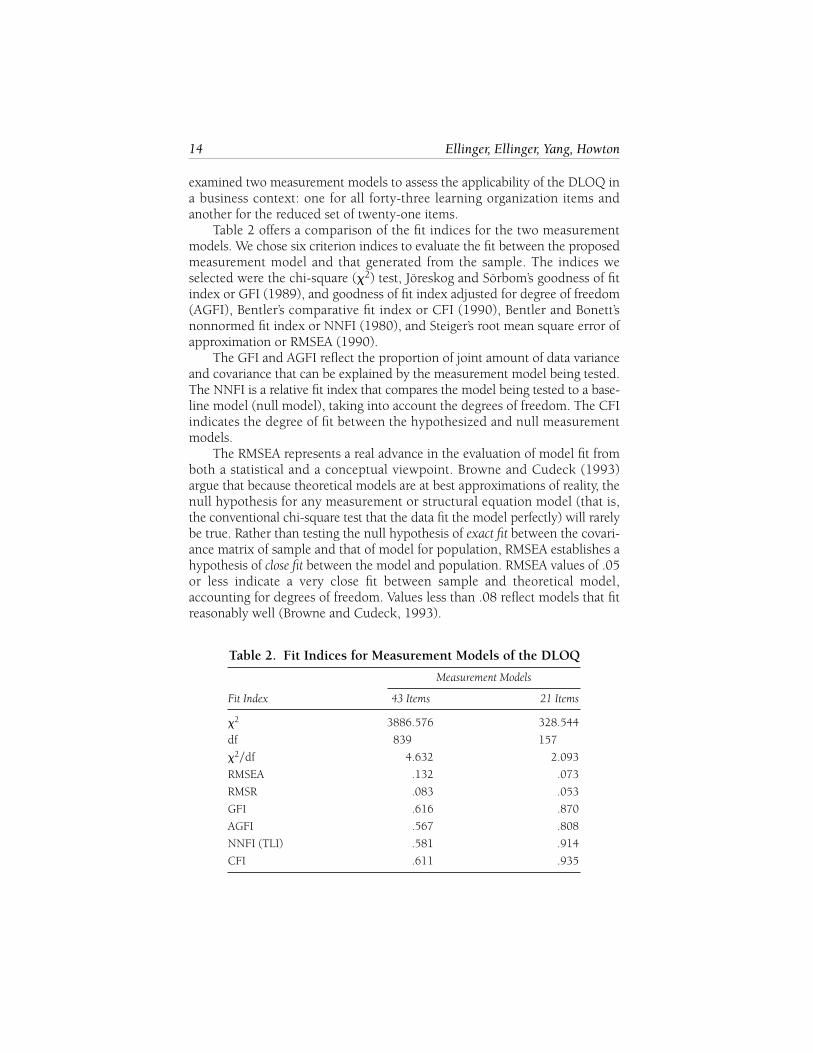
Table 2 offers a comparison of the fit indices for the two measurementmodels. We chose six criterion indices to evaluate the fit between the proposedmeasurement model and that generated from the sample. The indices weselected were the chi-square (�2) test, Jöreskog and Sörbom’s goodness of fitindex or GFI (1989), and goodness of fit index adjusted for degree of freedom(AGFI), Bentler’s comparative fit index or CFI (1990), Bentler and Bonett’snonnormed fit index or NNFI (1980), and Steiger’s root mean square error ofapproximation or RMSEA (1990).
The GFI and AGFI reflect the proportion of joint amount of data varianceand covariance that can be explained by the measurement model being tested.The NNFI is a relative fit index that compares the model being tested to a base-line model (null model), taking into account the degrees of freedom. The CFIindicates the degree of fit between the hypothesized and null measurementmodels.
The RMSEA represents a real advance in the evaluation of model fit fromboth a statistical and a conceptual viewpoint. Browne and Cudeck (1993)argue that because theoretical models are at best approximations of reality, thenull hypothesis for any measurement or structural equation model (that is,the conventional chi-square test that the data fit the model perfectly) will rarelybe true. Rather than testing the null hypothesis of exact fit between the covari-ance matrix of sample and that of model for population, RMSEA establishes ahypothesis of close fit between the model and population. RMSEA values of .05or less indicate a very close fit between sample and theoretical model,accounting for degrees of freedom. Values less than .08 reflect models that fitreasonably well (Browne and Cudeck, 1993).
Table 2. Fit Indices for Measurement Models of the DLOQ
Measurement Models
Fit Index 43 Items 21 Items
�2 3886.576 328.544
df 839 157
�2�df 4.632 2.093
RMSEA .132 .073
RMSR .083 .053
GFI .616 .870
AGFI .567 .808
NNFI (TLI) .581 .914
CFI .611 .935
The CFA results for our sample add further credence to the dimensional-ity proposed by the DLOQ instrument developers. Specifically, the forty-three-item model with seven underlying dimensions fits the data only moderately,whereas the reduced seven-factor twenty-one-item model forms a reasonablemeasurement model (RMSEA � .08). The proposed seven dimensions of thelearning organization account for 87 percent of item variances and covariances(GFI � .87). Both the NNFI and the CFI are above the .90 level. These resultssuggest that the seven-dimension structure also fits the data very well in com-parison to the baseline measurement model.
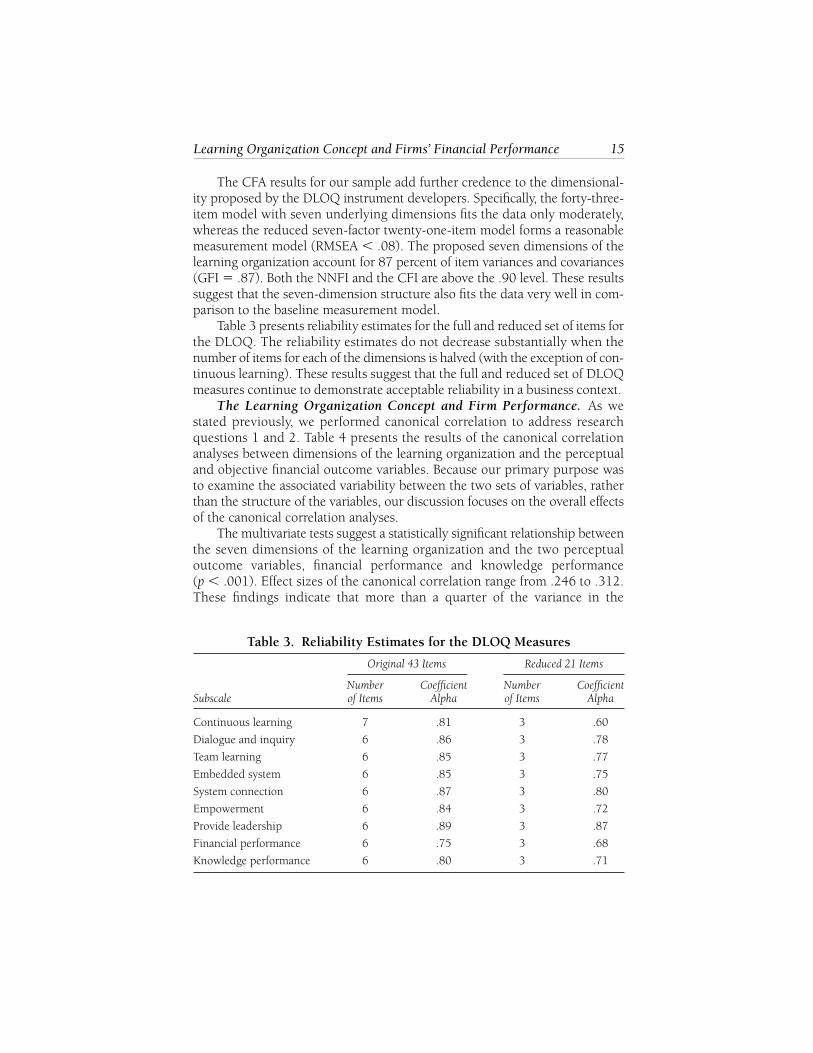
Table 3 presents reliability estimates for the full and reduced set of items forthe DLOQ. The reliability estimates do not decrease substantially when thenumber of items for each of the dimensions is halved (with the exception of con-tinuous learning). These results suggest that the full and reduced set of DLOQmeasures continue to demonstrate acceptable reliability in a business context.
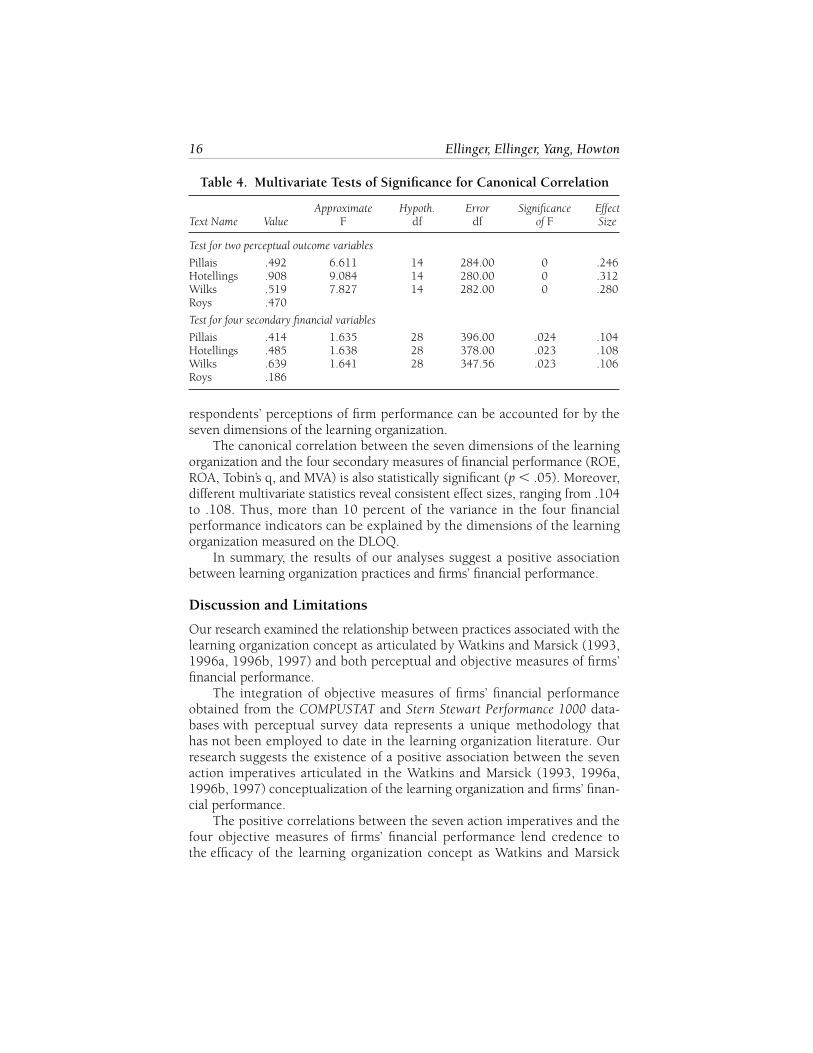
The Learning Organization Concept and Firm Performance. As westated previously, we performed canonical correlation to address researchquestions 1 and 2. Table 4 presents the results of the canonical correlationanalyses between dimensions of the learning organization and the perceptualand objective financial outcome variables. Because our primary purpose wasto examine the associated variability between the two sets of variables, ratherthan the structure of the variables, our discussion focuses on the overall effectsof the canonical correlation analyses.
The multivariate tests suggest a statistically significant relationship betweenthe seven dimensions of the learning organization and the two perceptualoutcome variables, financial performance and knowledge performance(p � .001). Effect sizes of the canonical correlation range from .246 to .312.These findings indicate that more than a quarter of the variance in the
Learning Organization Concept and Firms’ Financial Performance 15
Table 3. Reliability Estimates for the DLOQ Measures
Original 43 Items Reduced 21 Items
Number Coefficient Number CoefficientSubscale of Items Alpha of Items Alpha
Continuous learning 7 .81 3 .60
Dialogue and inquiry 6 .86 3 .78
Team learning 6 .85 3 .77
Embedded system 6 .85 3 .75
System connection 6 .87 3 .80
Empowerment 6 .84 3 .72
Provide leadership 6 .89 3 .87
Financial performance 6 .75 3 .68
Knowledge performance 6 .80 3 .71
16 Ellinger, Ellinger, Yang, Howton
respondents’ perceptions of firm performance can be accounted for by theseven dimensions of the learning organization.
The canonical correlation between the seven dimensions of the learningorganization and the four secondary measures of financial performance (ROE,ROA, Tobin’s q, and MVA) is also statistically significant (p � .05). Moreover,different multivariate statistics reveal consistent effect sizes, ranging from .104to .108. Thus, more than 10 percent of the variance in the four financialperformance indicators can be explained by the dimensions of the learningorganization measured on the DLOQ.
In summary, the results of our analyses suggest a positive associationbetween learning organization practices and firms’ financial performance.
Discussion and Limitations
Our research examined the relationship between practices associated with thelearning organization concept as articulated by Watkins and Marsick (1993,1996a, 1996b, 1997) and both perceptual and objective measures of firms’financial performance.
The integration of objective measures of firms’ financial performanceobtained from the COMPUSTAT and Stern Stewart Performance 1000 data-bases with perceptual survey data represents a unique methodology thathas not been employed to date in the learning organization literature. Ourresearch suggests the existence of a positive association between the sevenaction imperatives articulated in the Watkins and Marsick (1993, 1996a,1996b, 1997) conceptualization of the learning organization and firms’ finan-cial performance.
The positive correlations between the seven action imperatives and thefour objective measures of firms’ financial performance lend credence tothe efficacy of the learning organization concept as Watkins and Marsick
Table 4. Multivariate Tests of Significance for Canonical Correlation
Approximate Hypoth. Error Significance EffectText Name Value F df df of F Size
Test for two perceptual outcome variables
Pillais .492 6.611 14 284.00 0 .246Hotellings .908 9.084 14 280.00 0 .312Wilks .519 7.827 14 282.00 0 .280Roys .470
Test for four secondary financial variables
Pillais .414 1.635 28 396.00 .024 .104Hotellings .485 1.638 28 378.00 .023 .108Wilks .639 1.641 28 347.56 .023 .106Roys .186
envisioned it. In addition, the results of our study reconfirm the positive asso-ciations with perceptual measures of financial and knowledge performance inprevious research using the DLOQ instrument.
Our research findings offer tentative support for the existence of a busi-ness case for the learning organization concept. The positive associationsbetween the learning organization concept and firms’ financial performancesuggest that there is a payoff for organizations that embrace practices andstrategies consistent with the learning organization literature. HRD practition-ers may use our findings to support the case for implementing learning orga-nization initiatives. Our findings may also be useful to senior managers whoare assessing the efficacy of the learning organization concept. Embarking uponthe journey to become a more learning-oriented organization is a time- andresource-intensive change process. As suggested by Smith and Tosey (1999,p. 70), evidence linking characteristics of the learning organization to perfor-mance improvement may help to convince “hard-headed business people” tocommit sufficient resources to implement strategies consistent with the learn-ing organization concept.
Our research study also presented an opportunity to further examine psy-chometric properties of the DLOQ using a random sample of key respondentsin a different context. Yang, Watkins, and Marsick (1998) have acknowledgedthat additional studies are needed to further cross-validate the DLOQ instru-ment with different populations of organizations and with larger samples inorder to more firmly establish its utility and validity as an assessment tool. Ouranalyses of the DLOQ in a business context offer further support for the reli-ability and validity of the instrument.
Despite the positive associations suggested by our exploratory researchbetween the learning organization concept and objective and perceptual mea-sures of firms’ financial performance, we noted several limitations of thestudy. The sample, although randomly drawn, includes only firms for whichsecondary data are available. Different results might have been obtained if wehad included smaller, privately owned firms in the sample. This studyincludes only a limited number of secondary financial performance measuresto assess the relationship between the dimensions of the learning organiza-tion concept and firms’ financial performance. The inclusion of other mea-sures of financial performance might have yielded different results.Additionally, we solicited the perceptions of a single key informant middlemanager from each firm for the purposes of this research. Thus, we neithersolicited nor included responses from upper-level managers and front-line employees in our study. It has been suggested that the perspectives ofemployees at different levels within the organization may vary (Schein, 1996).It is possible that a larger, more holistic sampling strategy within each firmmight have yielded different results. These limitations, however, representopportunities for future research in this area.
Learning Organization Concept and Firms’ Financial Performance 17
18 Ellinger, Ellinger, Yang, Howton
Conclusions
The relationship between the presence of behavioral practices and strategiesassociated with the learning organization concept and firms’ financial perfor-mance has not been adequately established in the learning organizationliterature (Leitch, Harrison, Burgoyne, and Blantern, 1996; Smith and Tosey,1999). The relative absence of such research does not encourage leaders, man-agers, and employees to adopt learning organization practices. Accordingly, acompelling need to more firmly establish the linkage between the learningorganization concept and firm performance exists. Our exploratory researchsuggests a positive association between learning organization practices andobjective measures of firms’ financial performance. The findings offer tentativesupport for some of the more normative assertions that are found in the learn-ing organization literature. Our research study lends credence to the existenceof a business case for embracing learning organization practices and, as such,represents a foundation for future studies.
Future research should further investigate our exploratory findings byintegrating a wider variety of financial and nonfinancial indicators in differentcontexts with larger, more inclusive sampling strategies. For example, longi-tudinal studies that examine the lagged effects of behaviors characteristic of thelearning organization may further contribute to our understanding of howthe concept may enhance firm performance. In addition, cross-cultural assess-ments would help establish whether the relationship between the learningorganization concept and firm performance is consistent across cultures.
References
Altman, Y., & Iles, P. (1998). Learning, leadership, teams: Corporate learning and organisationalchange. Journal of Management Development, 17 (1), 44–56.
Appelbaum, S. H., & Reichart, W. (1998). How to measure an organization’s learning ability: Thefacilitating factors—Part II. Journal of Workplace Learning, 10 (1), 15–28.
Armstrong, J. S., & Overton, T. S. (1977). Estimating nonresponse bias in mail surveys. Journalof Marketing Research, 14 (3), 396–402.
Baker, W. E., & Sinkula, J. M. (1999). The synergistic effect of market orientation and learningorientation on organizational performance. Journal of the Academy of Marketing Science, 27 (4),411–427.
Bentler, P. M. (1990). Comparative fit indexes in structural models. Psychological Bulletin, 107,238–246.
Bentler, P. M., & Bonett, D. G. (1980). Significance tests and goodness of fit in the analysis ofcovariance structures. Psychological Bulletin, 88, 588–606.
Born, J., & McWilliams, V. (1997). Equity-for-debt exchange offers: Theory, practice, and evi-dence. Financial Review, 32, 273–292.
Brigham, E. F. (1995). Fundamentals of financial management. Orlando: Dryden Press.Browne, M. W., & Cudeck, R. (1993). Alternative ways of assessing model fit. In K. A. Bollen &
J. S. Long (Eds.), Testing structural equation models (pp. 136–162). Thousand Oaks, CA: Sage.Christopher, M., & Ryals, L. (1999). Supply chain strategy: Its impact on shareholder value. Inter-
national Journal of Logistics Management, 10 (1), 1–10.
Chung, K. H., & Pruitt, S. W. (1994). A simple approximation of Tobin’s q. Financial Manage-ment, 20 (7), 70–74.
COMPUSTAT [Database]. (1998). Standard and Poor’s. New York: McGraw-Hill [Producer andDistributor].
Day, G. S. (1994). The capabilities of market-driven organizations. Journal of Marketing, 58,37–52.
Dickson, P. R. (1996). The static and dynamic mechanics of competition: A comment on Huntand Morgan’s comparative advantage theory. Journal of Marketing, 60, 102–106.
Dillman, D. A. (1978). Mail and telephone surveys: The total design method. New York: Wiley.Fox, R. J., Crask, M. R., & Kim, J. (1988). Mail survey response rate: A meta-analysis of selected
techniques for inducing response. Public Opinion Quarterly, 52, 467–491.Gardiner, P. (1999). Soaring to new heights with learning oriented companies. Journal of
Workplace Learning, 11 (7), 255–265.Goh, S., & Richards, G. (1997). Benchmarking the learning capability of organizations. European
Management Journal, 15 (5), 575–583.Henderson, S. (1997). Black swans don’t fly double loops: The limits of the learning organiza-
tion? Learning Organization, 4 (3), 99–105.Hunt, S. D., & Morgan, R. M. (1996). The resource-advantage theory of competition: Dynamics,
path dependencies, and evolutionary dimensions. Journal of Marketing, 60, 107–114.Huselid, M. A. (1995). The impact of human resource management practices on turnover,
productivity, and corporate financial performance. Academy of Management Journal, 38 (3),635–672.
Huselid, M. A., Jackson, S. E., & Schuler, R. S. (1997). Technical and strategic human resourcemanagement effectiveness as determinants of firm performance. Academy of ManagementJournal, 40 (1), 171–188.
Iles, P. (1994). Developing a learning environment: Challenges for theory, research, and practice.Journal of European Training, 18 (3), 3–9.
Jacobs, R. (1995). Impressions about the learning organization: Looking to see what is behindthe curtain. Human Resource Development Quarterly, 6 (2), 119–122.
Jones, C. P. (1992). Introduction to financial management. Burr Ridge, IL: Irwin.Jöreskog, K. G., & Sörbom, D. (1989). LISREL 7: A guide to the program applications (2nd ed.).
Chicago: SPSS.Jöreskog, K. G., & Sörbom, D. (1993a). LISREL 8: User’s reference guide. Chicago: Scientific
Software.Jöreskog, K. G., & Sörbom, D. (1993b). PRELIS 8: User’s reference guide. Chicago: Scientific
Software.Kaiser, S. M., & Holton, E. F. (1998). The learning organization as a performance improvement
strategy. In R. Torraco (Ed.), Proceedings of the Academy of Human Resource DevelopmentConference (pp. 75–82). Oak Brook, IL: Academy of Human Resource Development.
Kuchinke, K. P. (1995). Managing learning for performance. Human Resource DevelopmentQuarterly, 6 (3), 307–316.
Lam, L. W., & White, L. P. (1998). Human resource orientation and corporate performance.Human Resource Development Quarterly, 9 (4), 351–363.
Lau, R.S.M., & May, B. E. (1998). A win-win paradigm for quality of work life and businessperformance. Human Resource Development Quarterly, 9 (3), 211–226.
Leitch, C., Harrison, R., Burgoyne, J., & Blantern, C. (1996). Learning organizations: Themeasurement of company performance. Journal of European Industrial Training, 20 (1), 31–44.
Lundberg, C. C. (1995). Learning in and by organizations: Three conceptual issues. InternationalJournal of Organizational Analysis, 3 (1), 10–23.
Luthans, F., Rubach, M. J., & Marsnik, P. (1995). Going beyond total quality: The characteristics,techniques, and measures of learning organizations. International Journal of OrganizationalAnalysis, 3 (1), 24–44.
Learning Organization Concept and Firms’ Financial Performance 19
20 Ellinger, Ellinger, Yang, Howton
Marsick, V. J., & Watkins, K. E. (1999). Facilitating learning organizations: Making learning count.Aldershot, England: Gower.
McHargue, S. K. (1999). Dimensions of the learning organization as determinants of organizationalperformance in nonprofit organizations. Unpublished doctoral dissertation, University of Georgia,Athens.
McHargue, S. K. (2000). Nonprofit learning organizations: Issues for human resource develop-ment. In K. P. Kuchinke (Ed.), Proceedings of the Academy of Human Resource DevelopmentConference (pp. 62–69). Raleigh-Durham, NC: Academy of Human Resource Development.
Norusis, M. J./SPSS Inc. (1990). SPSS advanced statistics student guide. Chicago: SPSS.Perfect, S., & Wiles, K. (1994). Alternative constructions of Tobin’s q: An empirical comparison.
Journal of Empirical Finance, 1 (3�4), 314–341.Peterson, P. P. (1994). Financial management and analysis. New York: McGraw-Hill.Peterson, P. P., & Peterson, D. R. (1996). Company performance and measures of value added. The
Research Foundation of the Institute of Chartered Financial Analysis, Association for Invest-ment Management and Research.
Pettigrew, A., & Whipp, R. (1991). Managing change for competitive success. Oxford: Blackwell.Poirer, C. C. (1999). Advanced supply chain management: How to build a sustained competitive advan-
tage. San Francisco: Berrett-Koehler.Quinn, F. J. (1997). What’s the buzz? Logistics Management, 36 (2), 43–46.Schein, E. H. (1996). Three cultures of management: The key to organizational learning. Sloan
Management Review, 38 (1), 9–20.Selden, G., Watkins, K. E., Valentine, T., & Marsick, V. J. (1998). Action imperatives that
impact knowledge performance and financial performance in the learning organization:An exploratory model. In R. J. Torraco (Ed.), Proceedings of the Academy of Human ResourceDevelopment Conference (pp. 573–580). Oak Brook, IL: Academy of Human ResourceDevelopment.
Slater, S. F., & Narver, J. C. (1995). Market orientation and the learning organization. Journal ofMarketing, 59, 63–74.
Smith, P.A.C., & Tosey, P. (1999). Assessing the learning organization: Part I—Theoretical foun-dations. Learning Organization, 6 (2), 70–75.
Stank, T. P., Daugherty, P. J., & Ellinger, A. E. (1998). Pulling customers closer through logisticsservice. Business Horizons, 41 (5), 74–80.
Steiger, J. H. (1990). Structural model evaluation and modification: An interval estimationapproach. Multivariate Behavioral Research, 25, 173–180.
Stern Stewart Performance 1000 [Database]. (1998). New York: Stern Stewart [Producer andDistributor].
Stevens, J. (1996). Applied multivariate statistics for the social sciences (3rd ed.). Hillsdale,NJ: Erlbaum.
Tobin, J. (1969). A general equilibrium approach to monetary theory. Journal of Money, Credit,and Banking, 1 (1), 15–29.
Watkins, K. E., & Marsick, V. J. (1993). Sculpting the learning organization: Lessons in the art andscience of systemic change. San Francisco: Jossey-Bass.
Watkins, K. E., & Marsick, V. J. (1996a). Adult educators and the challenge of the learning orga-nization. Adult Learning, 7 (4), 18–20.
Watkins, K. E., & Marsick, V. J. (Eds.). (1996b). In action: Creating the learning organization.Alexandria, VA: American Society for Training and Development.
Watkins, K. E., & Marsick, V. J. (1997). Dimensions of the learning organization questionnaire[Survey]. Warwick, RI: Partners for the Learning Organization.
Watkins, K. E., Yang, B., & Marsick, V. J. (1997). Measuring dimensions of the learningorganization. In R. Torraco (Ed.), Proceedings of the Academy of Human Resource DevelopmentConference (pp. 543–546). Atlanta, GA: Academy of Human Resource Development.
Yang, B., Watkins, K. E., & Marsick, V. J. (1998). Examining construct validity of the dimensionsof the learning organization questionnaire. In R. Torraco (Ed.), Proceedings of the Academy of
Human Resource Development Conference (pp. 83–90). Oak Brook, IL: Academy of HumanResource Development.
Yang, B., Watkins, K. E., & Marsick, V. J. (In press). The construct of the learning organization:Dimensions, measurement, and validation. Manuscript submitted for publication.
Andrea D. Ellinger is a research associate at the Center for Business and EconomicResearch in the Culverhouse College of Commerce and Business Administration at theUniversity of Alabama, Tuscaloosa.
Alexander E. Ellinger is assistant professor of marketing and supply chain management atthe University of Alabama, Tuscaloosa.
Baiyin Yang is assistant professor of human resource development and adult education atthe University of Minnesota, St. Paul.
Shelly W. Howton is assistant professor of finance at Villanova University.
Learning Organization Concept and Firms’ Financial Performance 21