the relationship between the average number of …
TRANSCRIPT

THE RELATIONSHIP BETWEEN THE AVERAGE NUMBER OF PRINCIPAL
WALKTHROUGHS AND SCHOOL ACCOUNTABILITY GRADE OF FLORIDA HIGH
SCHOOLS
by
Robert Bennett
Liberty University
A Dissertation Presented in Partial Fulfillment
Of the Requirements for the Degree
Doctor of Education
Liberty University
2020

2
THE RELATIONSHIP BETWEEN THE AVERAGE NUMBER OF PRINCIPAL
WALKTHROUGHS AND SCHOOL ACCOUNTABILITY GRADE OF FLORIDA HIGH
SCHOOLS
by
Robert Bennett
Liberty University
A Dissertation Presented in Partial Fulfillment
Of the Requirements for the Degree
Doctor of Education
Liberty University
2020
APPROVED BY:
John Bartlett, EdD, Committee Chair
Rebecca Lunde, EdD, Committee Member

3
ABSTRACT
This quantitative correlational study sought to determine if the administrative time and financial
investment in administrative walkthroughs is an effective practice that leads to improved student
achievement. This study sought to determine if a predictive relationship existed between the
predictor variable mean of principal school-wide walkthroughs, and the criterion variable school
grade in Florida high schools. This study was designed to determine if the principal walkthrough
is an effective tool to improve teaching practice to improve student achievement to meet
accountability measures. The sample include 72 high school principals in Florida. Data was
collected through a self-report survey in which the respondents answered three questions.
Archival data from the Florida Department of Education was used to determine school grade by
percent. A bivariate regression was used to determine the relationship between predictor
variable mean of walkthroughs and criterion variable school achievement grade.
Keywords: accountability, evaluation, instructional practices, student achievement

4
Dedication
This dissertation is dedicated to my Lord and savior, my wife Amy, and our daughters
Taylor, Brittany, Brooke, and Abigail. To my wife Amy, I have been blessed beyond measure to
have made this doctoral journey with you. You always made me believe that this could be
accomplished. One verse that always personified our journey together was Psalm 27:17 “As iron
sharpens iron, so one person sharpens another” (New International Version). I have the deepest
respect for you my darling. To my Lord Jesus Christ, thank you for my salvation, my beautiful
wife, and daughters. Without the blessing of God, this study would not have been possible.

5
Acknowledgments
I would like to acknowledge Jesus Christ for the grace that I have received. My
wife Amy, has been my greatest cheerleader and proponent. To my late parents, Wiley and
Faye Bennett, thank you for instilling a Christian worldview and work ethic in me. I wish to
acknowledge my Chair Dr. John Bartlett for his guidance and support of a “work in
progress”. To Dr. Rebecca Lunde, thank you for your diligent efforts serving as my
methodologist.

6
Table of Contents
ABSTRACT .....................................................................................................................................3
Dedication (Optional) ......................................................................................................................4
Acknowledgments (Optional) ..........................................................................................................5
List of Tables ...................................................................................................................................9
List of Figures ................................................................................................................................10
List of Abbreviations .....................................................................................................................11
CHAPTER ONE: INTRODUCTION ............................................................................................12
Overview ............................................................................................................................12
Background ........................................................................................................................12
Problem Statement .............................................................................................................14
Purpose Statement ..............................................................................................................16
Significance of the Study ...................................................................................................17
Research Question(s) .........................................................................................................18
Definitions..........................................................................................................................18
CHAPTER TWO: LITERATURE REVIEW ................................................................................19
Overview ............................................................................................................................19
Theoretical Framework ......................................................................................................19
Related Literature ...............................................................................................................19
Summary ............................................................................................................................49
CHAPTER THREE: METHODS ..................................................................................................52
Overview ............................................................................................................................52
Design ................................................................................................................................52

7
Research Question(s) .........................................................................................................52
Hypothesis..........................................................................................................................53
Participants and Setting ......................................................................................................53
Instrumentation ..................................................................................................................58
Procedures ..........................................................................................................................58
Data Analysis .....................................................................................................................64
CHAPTER FOUR: FINDINGS .....................................................................................................66
Overview ............................................................................................................................66
Research Question .............................................................................................................66
Null Hypothesis .................................................................................................................66
Descriptive Statistics ..........................................................................................................67
Results ................................................................................................................................69
CHAPTER FIVE: CONCLUSION................................................................................................76
Overview ............................................................................................................................76
Discussion ..........................................................................................................................76
Implications........................................................................................................................81
Limitations .........................................................................................................................82
Recommendations for Future Research .............................................................................82
REFERENCES ..............................................................................................................................84
APPENDIX A: IRB APPROVAL ...............................................................................................102 APPENDIX B: VALIDITY TEST WORKSHEET .....................................................................103 APPENDIX C: INFORMED CONSENT ....................................................................................104 APPENDIX D: SCHOOL WALKTHROUGH SURVEY ..........................................................106
8
APPENDIX E: INVITATION TO PARTICIPATE ....................................................................107

9
List of Tables
Table 1: Comparison of Evaluation Systems Domains .................................................................34
Table 2: Summary of Variables and Demographics ......................................................................54
Table 3: Descriptive Statistics .......................................................................................................68
Table 4: Demographic Descriptive Statistics .................................................................................68
Table 5: Summary of Bivariate Regression ...................................................................................74
Table 6: Model Summary Table for Regression ............................................................................74
Table 7: ANOVA Summary for F Test .........................................................................................75

10
List of Figures
Figure 1. Theory of Action Underling Teacher Evaluation and School Improvement ................33
Figure 2. Scatterplot Relationship of Mean Walkthroughs and School Grade ..............................70
Figure 3. Frequency Histogram with Outlier .................................................................................71
Figure 4. Scatterplot with Outlier ..................................................................................................71
Figure 5. Standardized Residuals Against Standardized Predicted School Grades .......................72

11
List of Abbreviations
Every Student Succeeds Act (ESSA)
Excellence in Mathematics, Science, and Engineering Education Act (EMSEA)
Georgia Teachers Keys Effectiveness System (TKES)
Improving America’s Schools Act (IASA)
Individuals with Disabilities Education Act (IDEA)
International Business Machine (IBM)
Management by Wondering Around (MBWA).
Mid-continent Research for Education and Learning (McREL)
No Child Left Behind (NCLB)
Principal Rapid Orientation and Preparation in Educational Leadership (PROPEL)
Race to The Top (RTTT)
School Walkthrough Survey (SWS)
School Management Program (SMP)

12
CHAPTER ONE: INTRODUCTION
Overview
The purpose of this study was to determine if there is a relationship between the mean
number of principal walkthroughs and high school’s accountability grade, based on academic
achievement and acceleration in 10 categories totaling 1000 points as determined by the Florida
Department of Education. Chapter One provides background information, the problem
statement, the purpose statement, the significance of the study, the research question, and
definitions.
Background
Accountability and school reform legislation such as No Child Left Behind (NCLB) of
2001 and the implementation Race to The Top (RTTT) in 2009 has increased pressure on the
high school principal. While the Every Student Succeeds Act (ESSA) of 2015 gave state
departments of education and school districts independence from federal influence on teacher
evaluation, ESSA also illuminated states and school districts often lacked the technical expertise
to design an effective evaluation system (Steinberg & Craft, 2017). ESSA’s focus on
improvement in traditionally low-performing schools created principal turnover when these
schools failed to improve (Jacob, 2017). District and school leadership is under public scrutiny
based on school achievement score. This increased pressure on the principal to increase student
achievement has led to the early departure of many school principals (Hamilton, Heilig, &
Pazey, 2014). The accountability movement has fostered a culture of shared power or distributed
power. While distributive leadership is often practiced by schools, and leads to democratic
relationships between educators, the physical presence of the principal reinforces his or her
influence with other educators and students within the school (Mifsud, 2015). This physical

13
presence can be implemented in informal classroom visits or observations called walkthroughs
for short durations of time. Walkthroughs have potential to support both teaching and learning
(Grissom, Loeb, & Master, 2013).
Historical Background
American school administrators during the post-World War II era used classroom visits
to have a better understanding of the teacher (Coleman, 1945). The post-World War era
walkthroughs also built readiness for supervision, and shared experiences with the teacher
(Coleman, 1945). Historically, teacher observation has been under the umbrella of supervision.
During the late 1960s, clinical supervision came to the forefront of teacher evaluation technique.
Holland (1988) referenced clinical supervision as an instrument of improvement leading to
improved instructional practices. Reflecting back to the 1960s, teacher observation was viewed
as a method to gather data that would lead to improvement of teaching practices (Garman, 1990).
However, historically teacher observations have proved to be ineffective at discerning the quality
of education that a teacher is giving to his or her students (Hill & Grossman, 2013). Glanz
(2007) supported the view that supervision and the teacher evaluation process lacked leadership
abilities, emotional behaviors, and personal accountability of the administrator to effectively
improve teacher practice (p. 120).
Social Background
The inability of schools to improve teacher practices in a manner that increased learning
for all students led to increased scrutiny and the advent of penalties for low performing schools
and districts. Thus, there is debate whether punitive accountability measures improve student
achievement (Ingersoll, Merrill, & May, 2016; Murray & Howe, 2017). Conversely, while
attempting to avoid punitive measures, many schools experienced brief improvements because

14
the schools manipulated testing situations rather than improving instructional practices (Chang,
2009). To improve teaching practices, it is incumbent upon the principal to properly evaluate
and observe teacher practices. Specifically, failure to observe teacher practices places the
principal at a disadvantage in terms of assessing the effectiveness of school and district level
mandates as well as failure to determine the implementation of specified teaching strategies.
Namely, unannounced walkthroughs give the principal keen insight as to authentic teaching in
classrooms rather than staged lessons that are seen in a formal observation (Garza et al., 2016;
Range, Scherz, Holt & Young, 2011).
Theoretical Background
The theory behind this study is Cogan’s (1973) clinical supervision. This theory
reinforces the need to improve the evaluation process if the goal of the process is improving
teacher instruction. Bulunz, Gursoy, Kesner, Baltaci Goktalay, and Salihoglu’s (2014) three-
year study found that teachers that were subjected to clinical supervision hag higher scores than a
control group that was not exposed to clinical supervision. In fact, clinical supervision has been
studied extensively for over 30 years but continues to evolve and improve (Pajak, 2002).
Clinical supervision is focused on teacher observation as a means to improve teaching practice
via professional development (Acheson & Gall, 1997).
Problem Statement
Walkthroughs are designed to generate a conversation between the administrator and the
teacher and focus on improving instruction and professional growth (Danley & Theiss, 2015;
Garza et al., 2016; Protheroe, 2009). Research has been conducted that evaluate the principals’
perception of walkthroughs (Garza et al, 2016; Grissom et al., 2013). Also, there have been
studies conducted to determine teachers’ perceptions of the walkthrough (Dickenson, 2016;
15
Range, Finch, Young, & Hvidston, 2014). Information is readily available on walkthrough
protocol and various forms that are used to collect data during walkthroughs (Goldhorn,
Kearney, & Webb, 2013). Though walkthroughs loosely resemble the post-World War 2
classroom visits that fostered collegiality, threats exist to the effectiveness of walkthroughs to
improve instruction. A significant threat is the differences in perspective of teachers and
administrators threaten the effectiveness of walkthroughs to improve instruction. While it can be
assumed that principal classroom walkthroughs are effective as a means to improve instruction,
there is also ample evidence that indicates classroom walkthroughs are ineffective in improving
instructional practices of teachers. Describing the impact of a teacher and the complexity of the
observation process, Muñoz and Dossett (2016) state “Effective teaching does make a difference
in student learning and that teaching is too complex for any single measure of performance to
capture it accurately” (p. 126). Identifying great teachers requires multiple measures.
Walkthroughs are a component of the teacher observation and evaluation process.
Barriers to effective walkthroughs have been identified as well as interventions to
overcome these barriers (Garza et al, 2016; Grissom et al., 2013; Range et al., 2011). Two
example of barriers includes time demands on the principal and resistance of veteran teachers to
engage in feedback (Grissom et al., 2013, Range et al., 2011). One intervention that overcomes
the two barriers previously mentioned is to develop a school culture that facilitates
administrators and teachers viewing walkthroughs as professional development (Grissom et al.,
2013).
An increase in student engagement which should lead to improved student achievement
has been documented in studies of walkthroughs (Allen & Topolka-Jorissen, 2014; Cervantes,
Hemmer, & Kouzekanani, 2015; Muñoz & Dossett, 2016). The literature indicates classroom

16
walkthroughs are effective in observing teaching and learning in a principal’s school (Grissom et
al., 2013; Protheroe, 2009). There is ample evidence that walkthroughs potentially improve
teaching practices when post walkthrough conferences occur that include meaningful feedback
(Marshall, 2003; Marzano, 2012; Range et al., 2014).
This study examined effective supervision techniques for improving teacher instructional
practice in an effort to improve student achievement. Specifically, regular walkthroughs provide
the principal information, such as teachers are implementing curriculum, students are engaged,
and who the teachers are that need redirection (Marshall, 2003). Overall school climate is easily
discernable when the principal visits classrooms regularly (Protheroe, 2009). Instructional
practice is improved for non-tenured teachers or less experienced teachers by walkthroughs
because issue of low-level teaching issues can be addressed, and a corrective conversation can
take place (Range et al., 2014). The problem is there are insufficient studies that determine if
there is a positive relationship between number of principal walkthroughs and student
achievement, which leads to school grade (Boothe, 2013).
Purpose Statement
The purpose of this quantitative, correlational study was to determine if there is a
predictive relationship between the predictor variable mean of principal school-wide
walkthroughs, and the criterion variable school accountability grade in Florida high schools. A
walkthrough is a defined as a brief informal classroom visit lasting from three to 20 minutes
(DeBoer & Hinojosa, 2012; Grissom et al., 2013). Mean (Warner, 2013) per teacher of the
school wide walkthrough will be the total number of principal or assistant principals divided by
the number of teachers. For example, the mean walkthroughs based on 200 total walkthroughs
divided by 50 teachers would equal a mean per teacher of four walkthroughs. School grade for

17
high schools in Florida is based on student achievement and schools earning points in 10
categories worth 100 points each for academic proficiency and acceleration for a total of 1000
points (FLDOE, 2107). The sample population is composed Florida high school principals from
477 high schools in 67 Florida school districts (FLDOE, 2018). The sample population of
teachers in this southern state was 67,244 (FLDOE, Public Schools Data, 2018).
Significance of the Study
The results of this study added to the body of knowledge of supervision in terms of the
effectiveness of informal walkthroughs and the impact they have on school grades. This study
was important due to two interconnected circumstances. First, principal and school administrator
time is a finite commodity and walkthroughs demand time. Secondly, improved teacher
instructional practice that leads to improved student achievement must be a product of
walkthroughs to justify the time consumed conducting the walkthroughs. Principal walkthroughs
designed to facilitate conversations centered on instructional practices have become a common
practice in schools around the country. In Florida, walkthroughs are used for teacher evaluation
and is referenced in school improvement plans as a method to improve instruction (Florida
Department of Education [FLDOE], 2018). Walkthroughs are being implemented in an attempt
to fill the void of identifying teacher quality that formal observation has failed to do (Hill, &
Grossman, 2013). On average, principals spend almost 13% of their time in instructional related
undertakings with almost half of that time being committed to walkthroughs (Grissom et al.,
2013). Furthermore, DuFour, and Marzano (2009) indicate that formal observations and
walkthroughs are time consuming, and ineffective tools for school improvement. By
determining the effectiveness of walkthrough practice, the practice can be utilized to its highest
capacity for the benefit of administrators, teachers, and ultimately students. This study seeks to

18
determine if walkthroughs make a discernable mark on student achievement as measured by
school grade in a southern state’s high schools.
Research Question
RQ1: Is there a predictive relationship between the mean number of administrative
school-wide walkthroughs and school accountability grade?
Definitions
1. Florida High School Grade - Individual schools in the state of Florida are given letter
grades A through F based on percentage of points earned of 1000 points from 10
categories (Florida Department of Education, [FLDOE], 2017).
2. Formal observations – Formal observations occur when teachers have prior knowledge
principals will observe their lesson and might last 30 minutes to one hour (Range et al.,
2014).
3. Informal observations – Informal observations are shorter than formal observations,
usually 10 to 30 minutes, and are not precluded with a preobservation conference so
teachers do not have prior knowledge they will be observed (Range et al, 2014).
4. Walkthrough – Walkthroughs are brief, informal classroom visits lasting 3 minutes to 20
minutes to facilitate the principal working directly with the teacher (DeBoer & Hinojosa,
2012; Grissom et al., 2013).

19
CHAPTER TWO: LITERATURE REVIEW
Overview
This chapter provides the reader pertinent information on walkthroughs in the realm of
teacher evaluation designed to improve instructional practices. The theoretical framework is
identified and clarified. The reviewed literature emphasizes key components of the topic and is
comprised of: (a) historical perspective of principals’ role in supervision and evaluation, (b)
educational accountability, (c) leadership, (d) leadership styles, (e) evaluations and professional
development, (f) purpose of walkthroughs, (g) walkthrough models, (h) and perspective of
walkthroughs. The examination of literature underpins both the concept behind and the
importance of this study.
Theoretical Framework
This study sought to determine the impact of walkthroughs, which is part of the teacher
observation cycle, on school accountability grade determined by student achievement factors in
Florida. For teacher observation to be the impetus of improved instructional practice that leads
to increased student achievement, it is of paramount importance that teacher observation be
rooted in a sound framework. The theoretical framework that this study employed was Clinical
Supervision.
Clinical Supervision is rooted in Cogan and Goldhammer’s work at the Harvard School
of Education during the mid-20th century. The impetus for clinical supervision was the need for
a solution to poor supervisory practices with student teachers (Glickman, Gordon, & Ross-
Gordon, 2014; Reavis, 1978: Pajak, 1993). Goldhammer, a Harvard graduate student in the
1960s, died prior to the completion of a book authored on clinical supervision (Pajak, 1993).
Nonetheless, Goldhammer is viewed as a pioneer of clinical supervision due to his refinement of
20
Cogan’s clinical supervision (Glickman et al., 2014). Furthermore, Goldhammer’s book, titled
Clinical Supervision, was published four years prior to Cogan publishing his own book
(Anderson, 1993). The foundation of clinical supervision is observing the teacher in the
classroom and the supervisor using data gathered from the observation to provide feedback
(Sergiovanni & Starratt, 1998).
There are three primary models of clinical supervision with Cogan’s being the most
detailed. Cogan’s (1973) model is cyclical and is made up of eight phases: 1) establish teacher
supervisor relationship, 2) plan with the teacher, 3) plan the strategy for the observation, 4)
observe the teacher instructing students, 5) analyze the teaching-learning process, 6) plan the
conference, 7) hold the conference, 8) and renew the planning. Cogan’s student Goldhammer
(1969) provided five compressed steps to the observation process: 1) pre-observation conference,
2) observation, 3) analysis and strategy, 4) supervision conference, 5) and post-observation
conference analysis. Acheson and Gall (1987) further compressed clinical supervision into three
stages: 1) plan the conference, 2) conduct the observation, 3) and conclude with feedback.
Regardless of the model of clinical supervision that is followed, communication is an essential
component (Acheson & Gall, 1987).
Since the inception of clinical supervision, many studies have been conducted to
determine the effectiveness of clinical supervision. Ebmeir and Nicklaus (1999) found that
clinical supervision elicited a greater level of commitment, were more receptive to collaboration,
exhibited increased levels of trust, and displayed greater self-confidence than a control group that
did not participate in clinical supervision. Nolan, Hawkes, and Francis (1993) examined six case
studies to determine the effectiveness of clinical supervision on teacher performance. The case
studies were of mixed results in effectiveness (Nolan, Hawkes, & Francis,1993). However, it

21
was determined when the feedback process allowed the teacher to question and reflect upon their
teaching practices improvement occurred (Nolan, Hawkes, & Francis,1993). The McCombe
study (as cited in Nolan, Hawkes, & Francis, 1993) found the veteran teacher in the case study
felt that clinical supervision and the feedback cycle improved teaching because of the feedback
cycle and reflection. The Potash study (as cited in Nolan, Hawkes, & Francis, 1993) focused on
a 15-year veteran teacher and determined that while clinical supervision illuminated deficiencies
that while difficult to transform did provide for teacher reflection to make changes. Conversely,
Grimmet and Creehan (as cited in Nolan, Hawkes, & Francis, 1993) determined that clinical
supervision failed to improve teaching practices due to the one-sided dialogue that favored the
principal.
Clinical supervision is a structure that is governed by principles (Glickman et al., 2014).
Glickman et al. (2014) identified twelve universally accepted principles as foundational to
clinical supervision. According to Glickman et al., “clinical supervision (a) is classroom based,
(b) has the dual purpose of improvement of instruction and teacher professional development, (d)
is separate from the summative evaluation, (e) the principal must understand child development,
pedagogy, and teacher development, (f) the principal must have interpersonal, observation, and
problem-solving skills, (g) is non-judgmental, (h) is based on mutual trust, (i) requires a collegial
relationship between principal and teacher, (j) is data-based, (k) gathers data on the teachers
concerns about the lesson, (l) involves the principal and teacher in reflective dialogue , (m) and is
cyclical and repeated on a regular basis” (pp. 246-247). There are many models of clinical
supervision; therefore, there is variation in the implementation of the principles from model to
model (Glickman et al., 2014).

22
This framework was an appropriate lens for this study that was designed to find the
nature of the relationship of principal walkthroughs and school grade based on current
accountability measures. Decidedly, clinical supervision illuminates that teacher observation or
walkthroughs alone do not improve teaching practice which leads to improved student
achievement. Subsequently, student achievement improvement is a factor of school
accountability grade. Moreover, there is a need for a feedback component that initiates
communication which leads to improved teacher practice. In addition, this framework supports
that walkthroughs are a tool used to gather data to inform professional development.
Furthermore, the framework supports walkthroughs have the ability to remove ineffective
teachers who do not possess the ability to be effective. Specifically, this framework supports
walkthrough effectiveness in the evaluation process.
Related Literature
The emphasis on student achievement is a measuring stick of administrative and
institutional effectiveness. Consequently, improved teaching practice leads to improved student
achievement (Bright, 2011; Ehri & Flugman, 2018; Miri, 2012; Roussin & Zimmerman, 2014).
Thus, the correlation between improved instruction that leads to student achievement and student
achievement is one of the primary components of school and administrative evaluation. This
correlation has led to the principal and administrative team taking the role of instructional leader.
Furthermore, it is imperative that teacher evaluation and the components of evaluation, such as
walkthroughs, lead to improved instructional practices that positively affect student learning
(Danielson, 2011; Darling-Hammond, 2014).

23
Historical Perspective of Principals’ Role in Supervision and Evaluation
In the early 19th century, the position of principal was typically held by a male that
incorporated clerical and organizational duties with continued teaching duties (Pierce, 1935).
The position was that of principal-teacher, and the duties were primarily hiring of personnel,
physically ringing the school bell, and serving as a conduit of communication from the board of
education to the teachers (Pierce, 1935). By the mid-19th century, the principal was given relief
from some teaching duties to provide time for classroom visitation in the school (Pierce, 1935).
The principal position continued to increase on a fulltime basis to managerial and supervisory
roles by the close of the 19th century (Pierce, 1935).
The early 20th century found the school principal as a position that was patterned after the
business model of organization (Murphy, 1998). With the emphasis on sound management
practices, school principals were reluctant to implement unproven new practices, thus leading to
a continuation of the status quo for the middle decades of the 20th century. The 1980s saw the
principal position assuming the duties of instructional leader and beginning to focus on
improvement of instruction provided to students (Rossow & Warner, 2000). The increased
accountability further supported the shift from manager to leader, specifically instructional
leader. These shifts in principal job descriptions and responsibilities corresponded with changes
in teacher evaluation. The evaluation of teachers in early American schools, including colonial
schools, was often conducted by the superintendent and based on acceptable cultural behaviors,
personality, and religion rather than standards-based instruction (Peterson, 1982). Due to the
Industrial Revolution and the shift in American society from primarily agrarian to a society
based on manufacturing, large cities emerged as well as the growth of city school systems. This
increased the number of teachers and led to the principal as the evaluator (Clark, 1993). With

24
the modern emphasis on improving teacher practice, one would expect teacher evaluations to be
an effective instrument to promote professional growth. That is simply not the case and in
modern standards-based instruction, teacher evaluations often identify all teachers as effective
and have little or no prescriptive value for improvement (Weisberg, Sexton, Mulhern, & Keeling,
2009).
Accountability Measures
It is plausible to state that the modern educational accountability is rooted in Secretary of
Education T.H. Bell’s formation of the National Commission on Excellence in Education. The
Commission was formed to address public concerns that the educational system in the United
States was lax in preparing students to take their places in the world (Gardner, Larsen, Campbell,
& Crosby, 1983). In A Nation at Risk: The Imperative for Educational Reform, public sentiment
was reinforced that secondary schools were not preparing America’s students to keep up with
other countries of the world (Gardner et al., 1983). The commission recommended more
stringent graduation requirements, a school year of up to 220 days, more homework for high
school students, recruitment of science and math teachers from private industry, and giving
teachers 11-month contracts for additional preparation time (Gardner et al., 1983). While not
specifically addressing accountability, A Nation at Risk increased the use of standardized testing
in states and placed an emphasis on improved student learning for students from lower socio-
economic homes (Guthrie & Springer, 2004).
The Excellence in Mathematics, Science, and Engineering Education Act (EMSEA) of
1990 highlighted that American students compared poorly with their foreign counterparts in
mathematics and science (Congress, 1990). These findings led Congress (1990) to establish the
following goals (p.1):

25
• Ensure that American students are first in the world in the subjects of mathematics,
science, and engineering by the year 2000
• Facilitate student entry into the math, science, and engineering career fields
• Improve teaching quality
• Increase graduate degrees in the fields of mathematics, science, and engineering
• Encourage minority and women to choose career pathways in mathematics, science, and
engineering
The EMSEA also identified that American students were not only failing to keep pace with
foreign students, but in fact, American students’ scores in mathematics were unchanged in
mathematics and were lower in science in the time period from the early 1970s to the mid-1980s
(Congress, 1990).
The Goals 2000: Educate America Act, emerged as the most prolific transfer of
educational policy and decision making, from local governments to federal control (Heise,
1994). To support the expansion of federal government’s role in education, Congress gave the
following reasons: (a) shift from general employability skills to more technical skills dependent
on critical thinking, (b) the need for a transformation of the educational system, (c) the need to
eliminate redundant school improvement activities due to independent collection of data (Heise,
1994). Heise (1994) predicted the narrowing of curriculum by government regulation and
centralized policy making. Another unintended consequence would be court involvement in the
educational process (Heise, 1994).
The Improving America’s Schools Act (IASA) of 1994 reauthorized Title I for an
additional five years to elevate educational achievement for disadvantaged students (Johnson,
1997). The IASA makes the parental involvement component a more robust feature of Title I

26
(Johnson, 1997). Billig (1997) indicated that Title I was addressed by IASA through five themes
as follows: (a) all children high academic standards, (b) innovation encouraged flexible
accountability, (c) funding greatest need, (d) school, family, and community partnerships
facilitate student success, support systems into place provide educators assistance. Title I of
IASA ensured disadvantaged students would have fair opportunity to receive an education.
IASA addressed Title II to ensure all educators are provided outstanding professional
development (Garet, Porter, Desimone, Herman, & Sun Yoon, 1999). Title III focused on
America’s students’ and teacher’s need to incorporate technology to improve learning with
$40,000,000 in funding allocated (Fox, 1995).
With the No Child Left Behind Act (NCLB) of 2001, schools and districts were required
to test and measure student achievement by all student sub-groups (Albrecht & Joles, 2003;
Hodges; 2018; Jacob, 2017). Furthermore, to give teeth to the accountability movement, Title 1
funding was predicated on state compliance with NCLB mandates (Hodges, 2018). Earlier
legislation such as The Individuals with Disabilities Education Act (IDEA) of 1975 mandated
inclusion for special education students in a regular education setting to the greatest degree
possible for the student (Albrecht & Joles, 2003). However, prior to NCLB, accountability for
academic achievement was lacking for students with disabilities (Albrecht & Joles, 2003).
NCLB forced schools to hold all students, teachers, and administrators accountable for mastery
of standards (Albrecht & Joles, 2003).
The 2015 Every Student Succeeds Act (ESSA) replaced NCLB with a focus on
historically under-performing schools (Jacob, 2017). This focus has further identified under
performing schools and districts and increased pressure on the principal attempting to turn these
schools around (Jacob, 2017). This pressure is felt from the principal down to the faculty and

27
has led to longer school days, tutoring for under-performing students, and changes in school
organization such as number of periods in the day and professional development focus (Jacob,
2017; VanGronigen & Meyers, 2017). Increased accountability has led to the demand for
principals that can change the culture and achievement of schools to turn them around.
Organization change leadership is needed to transform low-performing schools. Research
indicates that school principals have a discernable impact on student learning and achievement,
either positively or negatively (Hitt, Woodruff, Myers, & Guorong, 2018). With principal
leadership being identified as a component of school success, there are certain attributes that the
turnaround principal must possess to effect positive change.
Leadership
When examining educational leadership through the lens of general leadership, one finds
it a formidable task to find more appropriate attributes of a leader than those that Kouzes and
Posner’s (2012) propose in The Leadership Challenge. Kouzes and Posner present five practices
of leadership that enable the leader to be successful due to the heart connection with others, the
practices are as follows:
• Model the way
• Inspire a shared vision
• Challenge the process
• Enable others to act
• Encourage the heart
Leadership, whether in schools or the corporate world, makes a tremendous difference in the
productivity and performance of the employees in the organization (Ahn, Lee, & Yun, 2018;
Kouzes & Posner, 2012). If one is a leader, he or she must have followers. If one claims to be a
28
leader, they must have the ability to make a positive difference in the work of others. To make a
positive difference with employees, the leader must resonate as a person with his or her
employees.
There is a significant correlation between the leader’s positive self-concept and ethical
leadership behaviors (Ahn, Lee, & Yun, 2018). In many instances, employee perception that the
leader is fair and honest increases individual employee performance or production (Murphy &
Myers, 2008; Ahn, Lee, & Yun, 2018). Leaders communicate their values to employees in a
myriad of ways including verbal and non-verbal cues, and the fact that employees are watching
the leader’s actions (Kouzes & Posner, 2012; Rebore, 2014). Rebore (2014) stated that the
character is of higher importance than administrative acumen for a principal to have a successful
tenure. Furthermore, Kouzes and Posner (2012) report that when employees identify the worst
leader they have worked for, the leader only utilized an average of 31.2% of the employee’s
talents (p. 333). Conversely, leaders that were viewed as the best leader they ever worked for
utilized 95% of their energy and production (Kouzes and Posner, 2012, p. 334). While it is
readily accepted that leadership make a positive difference in schools and businesses, there must
also be acceptance that leadership can lead to a decline in a school or business.
Leaders that lack the necessary skills, preparation, and the determination to improve are
typical of failing schools (Murphy & Myers, 2008). While poor leadership leads to low morale
among employees, successful leaders imprint a vision of what the future holds to employees and
give hope (Kouzes & Posner, 2012; Murphy & Myers, 2008). The leader of a failing school or
business is unable to develop and improve connections, and the existing structure that hinders
improvement efforts (Munro, 2014).

29
The success of the school or organization hinges on communication and getting optimal
performance from a large percentage of the employees. The effective leader can adapt to
changing situations and demands without sacrificing relationships (Munro, 2014). Rebore
(2014) describes the leader’s outward expressions aligning with their internal feelings as
congruency (p. 306). Congruency essentially means the leader is genuine, they are who they
appear to be, and is a person that means what they say (Rebore, 2014). Employees have no
doubt of the successful leader’s position on a topic and can respect the position even when there
is disagreement.
Leadership Styles
Research reveals that the principal’s skills and leadership style influence teaching by
increasing efficacy, promoting student engagement, job satisfaction, and academic direction for
the school and faculty (Allen et al., 2015). The last quarter century has seen two leadership
models emerge as the leading models of principal leadership: instructional leadership and
transformational leadership (Vekeman, Devos, & Valcke, 2016; Leithwood & Jantzi, 2006).
Instructional leadership. An adept description of instructional leadership is being of a
three-dimensional composition (Vekeman et al., 2016). The three dimensions of instructional
leadership are defining the school’s mission, managing the school’s instructional program, and
promoting a positive school climate (Vekeman et al., 2016, p.5). Often, observers view
instructional leadership as being transactional in nature. Transactional leaders are leaders who
seek agreement to complete work or directives in such a manner as to receive remuneration or to
avoid punishment (Hoover, 1991, pp. 2-3). Vekeman et al. (2016) describes the following as
characteristics of instructional leadership: “(a) define the school mission, (b) frame clear school
goals, (3) communicate clear school goals, (d) manage the instructional program, (e) supervise

30
and evaluate instruction, (f) coordinate curriculum, (h) monitor student academic progress, (i)
create a positive school learning climate, (j) protect instructional time, (k) promote professional
development, (l) be highly visible in the school, (j) incentivize teaching and learning” (p. 6).
Instructional leadership is top down leadership based on coordination and control (Vekeman et
al., 2016). The role of instructional leader supposes that the principal has a focused approach to
academic and instructional issues that affect student achievement (Shaked, 2018).
Transformational leadership. Transformational leadership can be defined as “a certain
kind of leader who is capable of inspiring subordinates to heights they never intended to
achieve” (Hoover, 1991, p. 1). For school improvement situations, transformational leadership
from the principal is viewed as an effective leadership style (Allen, Grigsby, & Peters, 2015).
Vekeman et al. (2016) explains the following are key attributes of transformational leaders: (a)
individualized support, (b) vision, (c) shared goals, (d) intellectual stimulation, (e) culture
building, (f) rewards, (g) high expectations, (h) and modeling” (p. 6).
Changing the school culture of low-performing schools is a predominant theme with
school improvement experts. There are six ways identified to change the school culture:
“strengthening the culture, modifying bureaucratic mechanisms, engaging in staff development,
communicating frequently and directly with staff, sharing power and using symbols to express
cultural value” (Leithwood & Jantzi, 1990, p. 29). This type of leadership promotes a
collaborative environment that increases instructional capacity and student development
(Leithwood & Jantzi, 1990). The transformational principal can discern positive attributes as
well as obstacles on campus by being active and visible in classrooms (Allen et al., 2015).
Transformational leaders embrace a bottom up focus on school improvement rather than a top
down approach (Vekeman et al., 2016).

31
School turnaround leaders. To be a turnaround school, the school must make
substantial improvements in a short window of time (Murphy & Meyers, 2008). Specifically, a
turnaround is having a two-year time threshold (Hitt, Woodruff, Meyers & Guorong, 2018).
This period is the measure considered when ascertaining the qualities of the turnaround leader
(Hitt et al., 2018). School turnaround by a principal is similar to an executive turning around a
business. There are common principles and themes that govern both turnaround situations.
Slater (1999) studied the International Business Machine (IBM) turnaround and found that
leadership focused on performance rather than activity, alignment, and accountability.
Turnaround leadership in schools is similar in that the turnaround leader focuses classroom
activity to bolster student achievement, correcting curriculum alignment issues, and ensuring
accountability (Herrmann, Dragoset, James-Burdumy, & National Center, 2014). Conversely,
poor student achievement, alignment issues, and a lack of accountability are all common in low-
performing schools (Herrmann et al., 2014). Turnover of high school principals is frequent due
to poor student achievement data (Hamilton, Heilig, & Pazey, 2014).
Much like teacher preparation programs, many principal preparation programs are
lacking in equipping aspiring principals for the demands of modern educational leadership.
Reyes-Guerra, Pisapia, and Mick (2016) conducted a study to determine whether the traditional
master's degree programs or the Principal Rapid Orientation and Preparation in Educational
Leadership (PROPEL) at Florida Atlantic University prepared principals to better navigate the
turnaround process at low-performing schools. While stating more time was needed to measure
the turnaround impact of the cognitive agility traits in principal candidates, Reyes-Guerra,
Pisapia, and Mick (2016) found that PROPEL graduates: “(a) used strategic thinking skills, (b)
engaged in systems thinking, reflection, and reframing, (c) reframed situations stronger than

32
traditional master's degree graduates, (d) listened to new ideas and interventions than their
traditional peers, (e) saw situations from varying vantage points” (p. 413). The turnaround
principal can be developed or at least given tools that facilitate improvement of low-achieving
schools (Reyes-Guerra et al., 2016).
The principal that emphasizes improving student achievement will focus on improving
instructional practices (VanGronigen & Meyers, 2017). Improving instructional practices often
comes through data gleaned while conducting walkthroughs and observations. This focus on
achievement cannot occur at the expense of ignoring other important duties and facets of the
school, such as schedule structure and the school-wide discipline plan (VanGronigen & Meyers,
2017). The principal must also effectively use teacher evaluations to build instructional capacity
at the school (Hallinger & Heck, 2010). For school leadership to develop a strategy that
optimizes the transformation of classrooms to student centered, Fullan, Hill, and Crevola (2006)
recommends:
• Powerful assessment tools aligned for each lesson objective for daily assessment of
student learning
• Quick formative assessments that provide necessary information to inform instructional
decisions
• Personalized instruction
• The ability to self-monitor in real time to manage learning and determining what works to
improve classroom instruction to fit the learning needs of individual students (Fullan et
al., 2006, p. 37)
The effective leader must have an observation protocol in place that encourages frequent
classroom visits to ensure instruction is meets student-learning needs.

33
Evaluations and Professional Development
While teacher evaluations determine future employment, the walkthrough, which is a
component of many evaluation systems, can lead to improved teacher practice by providing
feedback and support to the teacher. In turn, this feedback can lead to improve student learning.
A major fault of some evaluation systems is effective teaching is identified by behaviors that are
ambiguous at best (Clark, 1993). The purpose of evaluation is to identify areas of strength and
weakness, as well as providing a platform for dialogue to provide the teacher an opportunity to
improve teaching practice (Wagoner & O’Hanlon, 1968). In the evaluation process, teacher
observations provide the opportunity to compile data needed to develop discourse designed to
improve teaching and learning (Danielson & McGreal, 2000).
Effective leaders provide feedback that is essential to improve teaching practices.
Wahlstrom and Louis (2008) described the key components of the observation feedback cycle as:
The principal is expected to understand the tenets of quality instruction as well as have
sufficient knowledge of the curriculum to know that appropriate content is being
delivered to all students. This presumes that the principal is capable of providing
constructive feedback to improve teaching or is able to design a system in which others
provide this support. (p. 459)
It is imperative that feedback and discussion is focused and regular to improve teacher
instructional practices. The effectiveness of the evaluative and feedback cycle of the principal,
which leads to increased teacher engagement, should build teacher trust (Bird et al, 2009). The
walkthrough provides the principal the insight needed to determine the strengths and weaknesses
of the school in order to change the culture. Furthermore, the walkthrough places the principal in
classrooms and hallways where they are visible to teachers and students.

34
An effective evaluation protocol has multiple functions. First, the evaluation process
must be capable of removing teachers that are incapable of positively affecting student
achievement from the classroom (Hallinger et al., 2014). Secondly, for teachers that do have the
potential to positively affect student achievement, the processes must have the capacity to create
a dialogue that facilitates the improvement of individual teaching practices (Hallinger et al.,
2014). Finally, the process of teacher evaluation with school improvement in mind should have
a transformative effect on the school to foster the acceptance of a results-oriented culture
(Hallinger et al., 2014).
Socio-political Context
Of the School
Filter Out Poor Performers
Growth in Teacher Evaluations Feedback and Teacher Student Support Effectiveness Achievement Results Oriented School Culture
Socio-political Context Of the School
Figure 1. Illustration of the theory of action underling teacher evaluation and school improvement. Adapted from “Teacher Evaluation and School Improvement: An Analysis of the Evidence,” by P. Hallinger, R.H. Heck, and J. Murphy, 2014, Education Assessment, Evaluation and Accountability, 26, p. 5. Copyright 2014 by Springer Nature. Adapted with permission.
Classroom observation is not limited to only evaluating teacher performance; the
evaluation can also glean insights that lead to teacher professional growth (Goe, Biggers, &

35
Croft, 2012; Muñoz, & Dossett, 2016). However, evaluators often lack the preparation to
determine the strengths and deficits of instructional practices, learning environment, and
classroom management to use the results of the evaluation to make a meaningful difference in
professional development (Goe et al., 2012). Evaluations must measure essential practices of
effective teaching and coordinate with appropriate professional development tailored to address
the needs of individual teachers (Muñoz & Dossett, 2016). For the evaluation process to be a
meaningful experience, an instrument must be used to gather data that is reliable.
Evaluation models. An example of an observation model is Danielson’s (2013)
Framework for Teaching Evaluation Instrument, which is composed of four domains. Each of
the domains provides benchmarks and examples to look for when appraising teacher
performance on four domains designed. Danielson’s (2013) four domains are as follows: (a)
planning and preparation, (b) the classroom environment, (c) instruction, (d) and professional
responsibilities. The classroom walkthrough gives the administrator the opportunity to observe
and discern at least two of the domains, classroom environment and instruction. Instruction
planning and preparation can be at the very least correlated by the subject matter being taught.
There are many choices and combinations of evaluation models in the United States.
Hite (2014) proposes the following 5 models, which includes Danielson, as most prominent in
the United States:
• Danielson’s Framework for Teaching
• Marshall’s Teacher Evaluation Rubrics
• Marzano’s Teacher Evaluation Model
• Mid-continent Research for Education and Learning (McREL) Teacher Evaluation
System

36
• Stronge’s Teacher Effectiveness Performance Evaluation System (Hite, 2014, pp. 1-2).
Each of the systems is made up of multiple domains (see Figure 1). While many states use a
standard evaluation such as Georgia Teachers Keys Effectiveness System (TKES) other states
allow districts to use the instrument of their choice or to blend instruments to meet the perceived
needs of each district. The evaluation process places the principal as the instructional leader of
the school by providing data to base professional development decisions on (Guskey, 1999).

36
Table 1
Comparison of evaluation systems domains Danielson’s
Framework for Teaching Danielson (2014)
Marshall’s Teacher Evaluation Rubric Cartusciello (2014)
Marzano’s Teacher Evaluation Model Carrero (2015)
McREL’s Teacher Evaluation System McREL (2009).
Stronge’s Teacher Effectiveness Performance Evaluation System Stronge (2012)
Planning planning and preparation
planning/preparation for learning
preparing and planning
instructional planning
Environment classroom environment
classroom management classroom strategies and behaviors
Teachers establish a respectful environment for a diverse population of students
learning environment
Instruction instruction delivery of instruction
teachers know the content that they teach/ teachers facilitate student learning
instructional delivery/ professional knowledge
Assessment
monitoring, assessment, and follow up
assessment for learning/ student progress
Reflection reflecting on teaching
teachers reflect on their practice
Professionalism/ Other
professional responsibilities
Responsibilities/ family and community outreach
collegiality and professionalism
teachers demonstrate leadership
professionalism

37
Professional development. When professional development, which is teacher learning,
is viewed through the same lens as student learning, there is a commonality that stands out. In
the same manner that a teacher uses various assessments, such as diagnostic and formative to
inform instruction, so must the evaluation process provide data from various and authentic
sources, such as observations in the evaluation instrument to inform professional development
(Guskey, 1999).
Teacher professional development is an essential element for school reform, and the
value of professional development is often overlooked (Wei, Darling Hammond, Andree,
Richardson & Orphanos, 2009; Pow & Wong, 2017). Professional development addresses
teaching technology, data-identified student needs, pedagogy, classroom management, and
evolving standards determined by state boards of education (Chiyaka, Kibirige, Sithole,
McCarthy, & Mupinga, 2017; Zepeda, 2019). Furthermore, without improved professional
development to improve teaching, the prospects are bleak for school turnaround (Wei, Darling
Hammond, Andree, Richardson & Orphanos, 2009).
Professional development generally follows the Teacher Career Cycle, which consists of
eight phases (Fessler, 1992, as cited in Pow & Wong, 2017). Pow and Wong (2017) divide
teacher professional development into the following eight stages: (a) pre-service, (b) induction,
(c) competency building, (d) enthusiasm and growth, (e) stability, (f) frustration, (g) career wind-
down, (d) career exit (p. 69). The first four stages of professional development find teachers are
more willing and accepting of participating in professional development due to the individual
needs being greater (Patton, Parker, & Tannehill, 2015; Pow & Wong, 2017). In the case of
veteran teachers, the group that composes the final four stages of professional development, their
professional development needs are often unmet (Patton et al., 2015). This may be due to

38
general professional development that fails to recognize the areas of mastery that the veteran
teacher possesses and increases a passive response to professional development (Pow & Wong,
2017). The final three stages of professional development reveal a greater decline in motivation
to participate in professional development (Pow & Wong, 2017). The downward trend in
interest in professional development by veteran teachers correlates to the discouragement of
feeling their needs are overlooked. Professional development activities, such as classroom
management and mentoring focus on the needs of new and less experienced teachers rather than
the needs of experienced teachers (Bressman, Winter, & Efron, 2018).
Effective professional development measures. The planning of professional
development goals and activities should incorporate data that is congruent with achieving
specific targets (Guskey & Suk Yoon, 2009). It cannot be emphasized strongly enough that the
data needed to plan for professional development must be collected with fidelity and
disaggregated to successfully plan professional development activities (Guskey & Suk Yoon,
2009). Upon making data-based decisions to determine areas of professional development need,
training teachers to implement the interventions that lead to improved student learning must
occur.
Professional development measures must facilitate teacher development with enhanced
student learning in mind (Chiyaka, et al., 2017; Patton et al., 2015; Pow & Wong, 2017).
Effective professional development encompasses teacher engagement, improving teacher
practice, and improving student learning (Chiyaka, et al., 2017; Leithwood & Jantzi, 2006;
Hallinger et al., 2014; Patton et al., 2015). Patton et al. (2015) propose that eight central features
support effective professional development:
1. Professional development centers on teacher needs and interests.

39
2. Professional development acknowledges learning is a social process.
3. Professional development has collaborative opportunities within learning communities of
educators.
4. Professional development is ongoing and sustained.
5. Teachers are treated as active learners.
6. Professional development Improves teachers’ pedagogical skills and content knowledge.
7. Professional development is facilitated with care.
8. Professional development focuses on improving learning outcomes for students. (pp.4-
11)
Teacher learning is ongoing and rejects the passivity of teachers (Patton et al., 2015).
Pow and Wong (2017) point to four factors that determine the success of professional
development: (a) access to professional development, (b) arrangement of participation, (c) ability
to experiment with new techniques, (d) and the administration’s long-range commitment to new
techniques that are implemented. School leadership, a learner-driven culture, and support
provided for professional development are the primary drivers of a successful teacher learning
experience.
Purpose of Walkthroughs
Specifically, regular walkthroughs provide the principal information, such as the teachers
are implementing curriculum, students are engaged, and who the teachers are that need
redirection (Marshall, 2003). Instructional practice is improved for non-tenured or less-
experienced teachers by walkthroughs because low-level teaching issues can be addressed and a
corrective conversation can take place (Range et al., 2014). Many teachers perceive
walkthroughs as occurring too infrequently but welcome the opportunity for feedback and
40
discussion that can occur with walkthroughs that are conducted regularly throughout the year
(Ginsburg & Murphy, 2002). Walkthroughs allow the administrator to monitor implementation
of agreed upon instructional practices that target student achievement (Skretta, 2007).
The term administrative walkthrough is indicative of a brief informal classroom visit
lasting from 3 to 20 minutes (DeBoer & Hinojosa, 2012; Garza, Ovando & O'Doherty, 2016;
Grissom, Loeb, & Master, 2013; Skretta, 2007). Walkthrough observation is used for a myriad
of purposes, such as collecting data to ensure teachers are following district mandates. For that
matter, data can be collected on any instructional indicator the principal chooses to observe
(Range, Finch, Young, & Hvidston, 2014). The data that the administrator attempts to garner
from the walkthrough varies by individual administrator, school, and district. Certain districts
use a “look for” template to document targets that teacher reach during the walkthrough
(DuFour& Marzano, 2009).
Overall school climate is easily discernable when the principal visits classrooms regularly
(Protheroe, 2009). As common-sense dictates, unannounced classroom visits increase in teacher
time on task and focus on student instruction (Protheroe, 2009). Walkthroughs designed to
observe interns can facilitate conversation between the principal and higher educational
institution that can provide intervention for the individual intern as well as improving overall
teacher preparation programs (Danley & Theiss, 2015). Walkthroughs aid administrators in
acting as the instructional leader of the school by providing focus on teaching and learning
(Ginsburg, 2008). The walkthrough creates a collegial atmosphere where teachers share with
each other and leads to a responsive culture that recognizes learning needs (Ginsburg, 2008).
Schoolwide walkthrough needs staff agreement on the process and acceptance that reflection can
improve practice and student learning (Ginsburg, 2008). Finally, the walkthrough presents the
41
principal with the opportunity to communicate with the students of the school that they are
important and their learning in of paramount importance by the physical presence of the principal
in classrooms (Ginsburg, 2008).
The use of the walkthroughs to observe the school's faculty provides the principal with
data needed to properly identify instructional strengths, weaknesses, and patterns throughout the
school (Marzano, Frontier & Livingston, 2011). Walkthroughs have the potential to nurture
focus, create reflection, and lead to collaborative adult learning (Ginsberg, & Murphy, 2002).
Walkthroughs open the chain of communication and lead to an increase in dialogue (Skretta,
2007).
Formal observation often fails to identify teacher quality, and walkthroughs provide that
opportunity due to brevity of time and frequency of occurrence (Hill, & Grossman, 2013). The
desired outcome of walkthroughs is reflective teaching, redirection, and continuous improvement
of teaching (Kachur, Stout, & Edwards, 2009). Thus, the unannounced walkthrough provides the
administrator the opportunity to view unscripted teaching and leads to reflection and
improvement (Gillespie, 2016).
This unscripted teaching presents the principal with the opportunity to create dialogue
with the teacher for the purpose of self-reflection. Gillespie (2016) listed the follow reflective
questions for teachers that designed to nurture growth after walkthroughs:
• What was my rationale for the process and implementation plan?
• What instructional decisions or student behaviors led to that action?
• What would I do differently if I could reteach this lesson?
• What was the most effective component of the lesson?
• How can I better serve all students in my next lesson? (Gillespie, 2016, p. 14)
42
The walkthrough generates the opportunity of self-reflection and this is foundational for school
excellence (Gillespie, 2016).
Walkthrough Models
A necessary guideline of a well-designed walkthrough system is that a teacher will do
three things: review the data, reflect on the data, and adjust professional practice based on the
data (Gillespie, 2016). The precursor for modern walkthroughs was the business model
developed by Hewlett-Packard called Management by Wandering Around (MBWA). The
concept behind MWBA was managers could get a true picture of the inner workings of the
individual employed by Hewlett-Packard by daily walks (Frase & Hetzel, 2002). Frase and
Hetzel (2001) used MWBA in a school setting to improve principal communication with
teachers and to increase the visibility of the principal on campus.
There are several models of walkthroughs (the three-minute classroom walkthrough,
daily impact walkthroughs, focused walkthroughs, the learning walk, the instructional rounds
model, Moss and Brookhart model, and school management program) that can be used as an
instrument designed to gather data to improve professional development. These same models
also serve the dual purpose of being a connector between the instructional leader and the teacher,
which creates an opportunity for meaningful dialogue about instructional practices to occur.
The Three-Minute Classroom Walkthrough model that came into prevalence in 2004 is
buoyed by brief informal observations (Downey, Steffy, English, Frase, & Poston, 2004). The
focus in on curriculum and instruction and is not evaluative and is designed to foster
conversation between the observer and teacher (Downey et al., 2004). The process is non-
threatening and is collaborative in nature with an end goal of being improved teacher practice
through reflection (Downey et al., 2004).

43
Daily impact walkthroughs are performed to align instruction and ensure consistency of
instruction by the faculty (Etheridge, 2014). Each classroom should be visited weekly for
approximately 15 minutes. It is imperative that individual teachers receive written feedback and
the feedback should be provided three to five times each semester (Etheridge, 2014).
Focused walkthroughs use the daily impact mechanics with a four-member team to look
for schoolwide foci (Etheridge, 2014). The focus is based on school data and needs of the school
(Etheridge, 2014). This is non-evaluative and is used to create dialogue between teachers and
the lead member of the team (Etheridge, 2014). A model that is similar to focused walkthroughs
is the learning walk.
The Learning Walk is composed of a team of observers from within and outside of the
school that determines a focus (Goldman, Resnick, Johnston, Micheaux, & Seitz, 2004). After
determining the focus, decisions are made on how to identify evidence that will be sought prior
to the observation (Goldman et al., 2004). This model is not evaluative and focuses on getting an
overview of how the school is progressing at meeting predetermined goals (Goldman et al.,
2004).
The Instructional Rounds model is a team-based observation that seeks to determine
teaching and learning (Etheridge, 2014). Teams observe 3 to 5 classrooms and write a narrative
of what is said by teachers and students and seen in each classroom (Etheridge, 2014). Data
from the observation is then placed into the following quadrants: (a) answer does teaching
support instructional focus, (b) answer does teaching work against organizational focus, (c)
reflection by the observation team, (d) recommended next steps (Etheridge, 2014). This occurs
twice per semester and should be 10 minutes in length (Etheridge, 2014).

44
The Moss and Brookhart (2012) classroom walkthrough model is based on identified
targets and a list of look-fors designed to focus feedback. The principal determines detailed
targets to gather data and present in the form of feedback to the teacher to foster collegial
conversation with the teacher and to guide the teacher in self-reflection (Moss & Brookhart,
2012).
The UCLA School Management Program (SMP) classroom walkthrough procedure is
based on schools gathering real-time data (Cervone & Martinez-Miller, 2007). The SMP is
based on teachers attempting to answer their own questions about their individual teaching
practices and is not evaluative (Cervone & Martinez-Miller, 2007). The teacher makes the
determination of what the observer will look for and then a conference is held to use the data
gathered by the observer to drive a culture of continual improvement at the individual teacher
level that permeates the entire school (Cervone & Martinez-Miller, 2007).
Perspective of Walkthroughs by Administrators and Teachers
While evidence exist that principal classroom walkthroughs are an effective leadership to
improve instruction, research also indicates classroom walkthroughs are ineffective with veteran
or tenured teachers (Range et al., 2014). Additionally, many principals view classroom visits as
time consuming with a low return in pupil achievement when compared to the administrative
time allocated (Brown & Coley, 2011). Even though walkthroughs are loosely related to the
post-World War II classroom visits that fostered collegiality, threats exist to the effectiveness of
walkthroughs to improve instruction. Many teachers are threatened and are uncertain of the
motives of the administrator conducting the walkthroughs (Brown & Coley, 2011). The
differences in perspective of teachers and administrators threaten the effectiveness of
walkthroughs to improve instruction. There is also the view that teacher evaluation systems are

45
too time consuming for administrators and do not provide the dividends of improved
instructional practices of other strategies such as professional learning communities (DuFour &
Mattos, 2013; Range, Scherz, Holt & Young, 2011).
There are stark differences in the perspective of teachers and administrators concerning
evaluations and walkthroughs. These differences in perspective can impede the principal from
using walkthroughs to improve the faculty’s teaching practice. Teacher evaluation serves the
dual purpose of evaluation for job status and evaluation to improve teacher practice, which can
lead to tension in the relationship between the principal and teacher (Rigby, 2014). To gain
understanding of the nature of this conflict, one must examine the way teacher evaluation,
principal evaluation, and student learning impact employment. While it is apparent that
improved teacher practice will result in improved student achievement, there is clash between the
different uses of evaluation. The dichotomy is that in one instance a walkthrough is conducted to
stimulate discussion that leads to collaborative efforts to improve teaching capacity in the
building, and conversely, the use of the same walkthrough practice is often used to determine
employability status. Most principals and district administrators view teacher evaluations, of
which walkthroughs are a component, as being a critical element of supervision in overall school
operation (Acheson & Gall,1997). This being the case, there are perspectives that are both
supportive of and against a robust walkthrough and evaluation protocol.
Walkthroughs provide the principal an opportunity to identify gaps in the curriculum and
a platform for feedback to teachers (Walsh, 2014). Keruskin (2005) found that principals felt
that walkthroughs led to new habits for teachers attempting to meet the look-for matrix. These
habits spread from individual teachers to others in the building. Essentially, walkthroughs
contributed to faculty members incorporating other teachers’ best practices. During

46
walkthroughs, principals can ascertain what are impediments in individual teacher classroom
environments and provide resolution or resources to improve the situation (Frase, 2001).
While administrators feel the walkthrough is integral to teacher supervision, they also
view the time demands of their administrative position make walkthroughs an arduous task
(Sheppard, 2013). Furthermore, walkthroughs are often viewed as required formalities that must
be conducted that lack return on investment (Lemons & Helsing, 2009). Many principals view
walkthroughs and teacher observations in general as having a negative impact on teacher attitude
(Coulter, 2013). Principals also perceive the threat of increasing union activism because many
teachers are resistant to change and resentful of negative feedback from the principal being in
classrooms (Coulter, 2013).
Misunderstanding the purpose of walkthroughs is a risk that impedes the effectiveness of
the walkthrough process. It is vital that teachers do not perceive walkthroughs as only the
principal checking for compliance. When compliance with district and school directives are
being examined through walkthroughs, teachers feel unfair pressure. When walkthroughs are
used to determine teacher effectiveness pursuant to the teacher evaluation, the teacher is often
resistant to view the principal’s feedback as a professional learning opportunity (Downey et al,
2004). This is because a walkthrough is for a brief time and teachers might not use an
instruction strategy during the time frame that instruction is being observed (Marzano et al.,
2011).
Teachers are often distrustful about evaluations and feel that cronyism is exhibited with
favorable evaluations going to administrative favorites (Danielson & McGreal, 2000; Larsen,
2004). Beatty (2017) found teachers felt that district evaluations, while purposeful, did not align
with professional development. One perspective that teachers hold regarding administrative
47
observation is not enough time spent in a snapshot of time to properly address and acknowledge
the professionalism of the teacher (Myung & Martinez, 2013). Rather, the brief amount of time
that a walkthrough comprises does not properly recognize the complexity of pedagogy and the
learning process (Myung & Martinez, 2013). In fact, many teachers feel the power structure and
design of the observation process is completely one-sided with the administration having all
power (Roussin & Zimmerman, 2014). Often, teachers feel the principal is not qualified to
properly evaluate the teacher because the principal has inadequate knowledge of subject matter
to determine the effectiveness of the teacher (Kelly, 2014).
The presence of the principal and others conducting walkthroughs can be a source of
anxiety, fear, and dread to teachers even when the purpose of the walkthrough is clearly defined
and communicated to the faculty (Valli & Buese, 2007). For example, Valli and Buese (2007)
cited a principal, who attempted to reduce anxiety and trepidation by communicating exactly
what the administration was looking for during the walkthrough and specifically that the
walkthrough was not intended to be a “gotcha” (p. 544). Describing the concern of one teacher,
Valli and Buese (2007) stated, “He wondered when any of the visitors had last taught, and his
teammates expressed concern that they would be singled out for doing something wrong” (p.
544). Principals must establish trust while demonstrating an awareness of pedagogical practices
of teachers they observe.
A reoccurring theme of teacher dissatisfaction is the administrators conducting
evaluations lack the steadfastness, ability, or pedagogical knowledge to provide an accurate
evaluation of teaching, and fail to provide meaningful feedback (Maharaj, 2014). From the early
1970s, teachers have viewed the evaluation process with skepticism, viewing inconsistency of
the observer and observer bias as devaluing the evaluation (Maharaj, 2014). In fact, teachers

48
view observations as lacking feedback in the form of praise or constructive criticism (Range,
2013). Dougherty’s (2009) study of 182 educators found that teachers were not confident that
the administrators evaluating them possessed the ability to demonstrate the needed teaching
improvements. The study also found that teachers view the standards that are addressed as not
being individualized enough for differing subject areas, such as reading and mathematics
(Dougherty, 2009). Nonetheless, Brutto’s (2016) study that found teachers that were evaluated
were more connected with their own professional development needs than their peers that had
not been evaluated. Walsh’s (2014) study found that teachers viewed walkthroughs as an
opportunity to augment their pedagogical expertise because they were attempting to meet
administrative look-fors. The individual teacher’s desire to be prepared for unannounced
observations led to improved practices, such as teachers using higher order questions (Walsh,
2014). Frequent classroom visits by the principal lessen teacher feelings of isolation and give the
teacher connectedness with another adult (Frase, 2001).
Range (2013) found that when principals engaged in walkthroughs of each classroom on
a weekly basis, teachers felt the principal saw a more complete picture of their individual
classrooms. In fact, frequent walkthroughs lead to improved teacher attitude toward professional
development (Frase, 1998). When principals provide feedback, but especially positive feedback
first, teachers felt that the principal recognized their strengths and were more receptive to new
ideas (Range, 2013). Teachers have indicated that improved teaching methodology, tighter
instructional focus, and increased collegiality are a byproduct of walkthroughs and the feedback
that is generated by data collection and sharing (Keruskin, 2005).
The erosion of trust will undermine the collegial conversations that are needed to
improve instruction (Skretta, 2007). Infrequent walkthroughs lack consistency and are a barrier

49
to both trust and effective walkthroughs (DeBoer & Hinojosa, 2012). Principals lacking working
knowledge of subject area standards of each classroom where they perform a walkthrough, face a
hurdle to articulate information that is essential to improve instructional practice (Range et al.,
2011). The veteran teacher is often resistant to feedback from walkthroughs due to tenure and
the protection that it affords, and the fact they attribute negative feedback to flawed
instrumentation or walkthrough process (DuFour & Marzano, 2009).
Summary
Chapter Two served as an overview of research on accountability, evaluation, and the
effect of walkthroughs on teacher practices. The concept of improved instructional practice
should correlate to improved student achievement. The educational leadership practices
employed by the school principal have a tremendous impact on teacher effectiveness and student
achievement. It is not an understatement to declare that an outstanding teacher is the greatest
indicator of student success.
The principal has a tremendous impact on the climate and organizational effectiveness of
his or her school by both implicit and explicit educational leadership practices. There are
transformative leaders that change the culture and expectations of low-performing schools.
These turnaround specialists generally show a marked improvement within two years. The
evaluation and observation protocol that is in place must have the structure needed for frequent
classroom visits. There is a need for an informal component that is not evaluative in order to
create meaningful conversations that promote teacher self-reflection and continual growth. The
concept of continual growth is also applicable institutionally. In fact, low-performing schools
often have deficiencies in teaching and learning that are systemic.

50
School reform measures such as NCLB of 2001 and the Obama administrations
implementation of RTTT in 2009 has increased the focus on improved teaching and learning.
The high school principal is responsible for student achievement of all sub-groups of students.,
With increasing accountability, principal use of classroom walkthroughs has potential to
improve student achievement by refining teaching practices and facilitating a collegial
atmosphere. However, there are attitudinal differences that must be reconciled for this to occur.
For example, the attitude of district office personal to emphasize various managerial duties
placed on principals takes time away that is need for effective classroom visitation. Another
example is the differing beliefs of the purpose of walkthroughs by both administrators and
teachers. These differences lead to a rejection of constructive conversation.
The 2015 ESSA placed low-performing school leaders under the microscope and will
subject school leaders to possible loss of employment or a change of work location through the
transfer process. The lowest schools will receive the greatest share of turnaround resources from
the district but will also receive strict monitoring to ensure compliance with school district, state,
and federal mandates. Walkthroughs significantly increase the opportunity for the principal to
ensure that teachers implement these mandates with fidelity in each classroom. Regular
walkthroughs lead to improved conversations about instruction and precipitate the development
of common language centered around instruction (Protheroe, 2009). The greatest benefit of
walkthrough should be increased student achievement (Skretta, 2007).
While there is a solid case made for principal classroom walkthroughs to improve
instruction, there is also evidence that indicates classroom walkthroughs are more effective with
less experienced teachers than veteran teachers. Additionally, time constraints are cited as a
prevalent factor that hinder school administrators from conducting enough walkthroughs
51
(Grissom et al., 2013; Range et al., 2011). The difference in perceptions between administrators
and teachers of the amount of time allocated for the walkthrough is an issue. Many teachers
view 25 minutes as the minimum amount of time needed to give an accurate portrayal of
teaching for the walkthrough (Garza et al, 2016). When administrators are in classrooms for
shorter visits, there is potential for teachers to question the validity of the information.

52
CHAPTER THREE: METHODS
Overview
The purpose of this study was to determine the relationship between the mean number of
principal walkthroughs and the high school accountability grade in Florida. A survey that the
principal completed, provided the following: name of school, number of teachers, number of
administrators that perform walkthroughs, and the total number of walkthroughs conducted.
Archival data form the Florida Department of Education was used to determine school economic
status, student population, raw score, and school type. A bivariate regression was conducted to
determine if there is a significant relationship between walkthrough and school grade in Florida
high schools. Chapter Three covered design, research question, hypothesis, participants and
setting, instrumentation, procedures, and data analysis.
Design
This study utilized a quantitative, correlational design to determine the predictive
relationship of mean of principal school wide walkthroughs and school grade in Florida schools.
A correlational design is appropriate to determine the relationship between a predictor variable
and a criterion variable (Gall, Gall, & Borg, 2007). The predictor variable was mean of school-
wide walkthroughs. A walkthrough is a defined as a brief informal classroom visit lasting from
three minutes to 20 minutes (DeBoer & Hinojosa, 2012; Garza, Ovando & O'Doherty, 2016;
Grissom, Loeb, & Master, 2013; Skretta, 2007). The mean of school wide walkthroughs is
defined as taking the total number of walkthroughs and dividing by the total number of teachers.
The mean of school wide walkthroughs is similar to the mean of observations of Whitehurst,
Chingos, and Lindquist’s (2015) study, which divided the number of observations by the number
of teachers. Whitehurst, Chingos, and Lindquist’s (2015) study sought to determine the

53
correlation of teacher evaluation scores with the following year’s value-added score. The
criterion variable is school grade. School grade for Florida high schools is based on earning
points in 10 categories worth 100 points each for a total of 1000 points with the percentage of
total points earned determining the grade (Florida Department of Education, [FLDOE], 2017).
Research Question
RQ1: Is there a predictive relationship between the mean number of administrative
school-wide walkthroughs and Florida high school accountability grade?
Hypothesis
H01: There is no statistically significant predictive relationship between the mean of
school wide walkthroughs and the high school accountability grade in Florida.
Participants and Setting
The data used for this study was drawn from high schools in the state of Florida during
the 2018-2019 school year. The schools are diverse in terms of ethnic composition, socio-
economic status, and community setting is rural, urban and suburban in Florida’s 67 school
districts. Based on Florida Department of Education (FLDOE) accountability data for the 2017-
2018 school year, there were 477 high schools in Florida (FLDOE, 2018). Florida’s graduation
rate is 76% and ranked as the second poorest graduation rate, next to Louisiana, in the
Southeastern United States (United States Department of Education [USDE], 2018). Florida
schools are represented by the following ethnicities: American Indian .3%, Black 22.5%,
Hispanic 31.5%, Pacific Islander .2%, and White 39.5% (USDE, 2018). There are 288,809
English Language Learners (ELL) in Florida’s public schools (USDE, 2018). Finally, 59% of
Florida’s public-school students are classified as low income (USDE, 2018). Florida has
legislation that caps high school class size at a maximum of 25 students (FLDOE, 2002)

54
This study used a convenience sample of 72 high schools. Gall, Gall, and Borg (2007)
defined a convenience sample as “A group of cases that are selected simply because they are
available and easy to access” (p. 636). The sample was identified from all Florida high school
principals that agree to participate in the study. A convenience sample is employed by this study
because the sample “suits the purposes of the study and that is convenient” (Gall et al., 2007, p.
175).
Through email addresses that were public record and on district and school websites, all
high school principals of participating School Districts in Florida were presented the opportunity
to participate in this study. The principals at each participating school accessed a self-report
survey created by the researcher to report name of the school, total number of teachers in this
school, and the total number of administrative walkthroughs as previously defined as lasting
three to 20 minutes each. Next, the researcher went to the schools’ report card on the state
accountability report (FLDOE, 2019), which is public record, to determine the following: each
school’s grade, Title 1 status, number of students, and the school type either rural or urban. The
reported survey was matched with each individual school grade. The number of schools was at
72 which exceeds the required minimum of 66 for a medium effect size with a statistical power
of .7 at the .05 alpha level (Gall et al., 2007). The sample represented 22 districts and 72
schools. 35 of the schools had greater than 60% of their student body on free and reduced lunch.
The sample reflects the following school grades: 28 A schools, 19 B schools, and 25 C schools.
Table 2 Summary of Variables and Demographics School Administrators Teachers Ratio Title Grade Rural/Urban
1 2 45 2:45 Y B R

55
2 4 114 2:57 Y A S
3 3 62 1:21 Y C R
4 2 38 1:19 Y B R
5 5 125 1:25 N A S
6 4 64 1:16 Y C S
7 3 29 3:29 N B R
8 5 70 1:14 N B U
9 4 112 1:28 Y C S
10 2 33 2:33 Y B R
11 3 38 3:38 Y A R
12 4 110 2:55 N A S
13 2 26 1:13 Y B R
14 4 76 1:19 N A S
15 4 98 2:49 N A S
16 2 33 2:33 N B R
17 3 69 1:23 N A U
18 4 55 4:55 Y C R
19 4 66 2:33 N C U
20 3 81 1:27 Y C U
21 5 95 1:19 Y C U
22 3 84 1:28 Y C S
23 2 48 1:24 N A S
24 5 110 1:22 Y B U

56
25 4 96 1:24 N A U
26 3 75 1:25 N C S
27 3 72 1:24 Y C R
28 2 43 2:43 N A R
29 4 92 1:23 N A S
30 2 36 1:18 Y C R
31 3 75 1:25 N C R
32 2 45 2:45 N A R
33 2 32 1:16 N B R
34 5 80 1:16 N A S
35 2 54 1:17 Y C R
36 5 115 1:23 N B U
37 3 37 3:37 Y C R
38 5 140 1:28 N A S
39 4 96 1:24 N B S
40 4 112 1:28 N A S
41 4 92 1:23 N A S
42 4 68 1:17 Y C R
43 2 34 1:17 N C R
44 4 74 2:37 Y A U
45 4 100 1:25 Y C S
46 2 35 2:35 Y C U
47 4 70 2:34 Y C S

57
48 4 90 2:35 N A S
49 4 72 1:18 Y C U
50 4 80 1:20 Y B U
51 5 125 1:25 Y A U
52 3 56 3:56 N B S
53 6 114 1:19 N A S
54 4 78 2:39 Y C R
55 5 115 1:23 N B S
56 2 33 2:37 Y B R
57 3 66 1:22 N A S
58 4 84 1:21 N A U
59 3 60 1:20 Y B R
60 4 104 1:26 N B S
61 2 53 2:53 N C R
62 4 82 2:41 Y C U
63 6 108 1:18 N A S
64 2 60 1:30 Y B R
65 3 60 1:20 N A R
66 3 45 1:15 N A S
67 3 40 3:40 N A R
68 4 102 2:51 Y B R
69 3 87 1:29 Y C U
70 3 32 3:32 Y C R

58
71 3 40 3:40 Y A S
72 3 54 1:18 N A R
Instrumentation
Data used to determine the schoolwide walkthroughs practices by administration for the
academic year was reported by the principal on a researcher-created survey. In addition, the
number of teachers was be reported on the survey. See Appendix D for the survey. Informed
consent to participate in the survey was in the email body above the survey link. See Appendix
C for informed consent. There are six demographic questions followed by four questions
regarding classroom walkthrough practice. The demographic portion of the SWS includes the
following general questions designed to yield the following:
1. I indicate my consent to participate by checking permission granted on informed consent
form.
2. Years served in current administrative assignment
3. Total years of administrative experience
4. Classification of school’s geographical entity
5. District the school is located in
6. Name of the school
7. Number of teachers on the faculty during the 2017-2018 school year
The second section of the SWS focused on walkthrough practices. This data is gathered to
determine relationship between walkthrough practices and school grade that is archival data in
Florida. The second section asked four questions:
8. Do you conduct classroom walkthroughs in your school?
59
9. Which of the following statements best describes your current situation? (a) Classroom
walkthroughs are mandated by central office administration, (b) I complete classroom
walkthroughs through my own initiative, (c) and this is district mandated and I complete
additional walkthroughs
10. How many walkthroughs were conducted during the 2018-2019 school year?
11. In what form do you usually provide feedback after a walkthrough has been completed?
Validity and Reliability of Instrument
The first section of the SWS was composed of demographic information and is highly
structured and can be considered to be more accurate according to Gall, Gall and Borg (2007, p.
229). The first and second section of survey questions on the SWS was proven valid by a review
of the instrument by a group of teacher evaluation experts. The group was composed of five
individuals that are currently employed as school principals or as district level personnel that
have currently have evaluative duties and are very experienced in such duties. The group was
composed of three members that held a Ph.D. or an Ed.D. (doctorate) in Educational Leadership,
two of whom served as school principals and one currently serving as an assistant
superintendent. The remaining two members held an Ed.S. (Educational Specialist) in
Curriculum and Instruction for a director at the district level and in Educational Leadership for a
school principal. Finally, the dissertation chair was given a copy of the SWS to examine and
share with other faculty members.
The panel was given a letter of explanation, the instrument, and a validity worksheet to
rate the validity of each item on the survey on a Monday in mid-April. The validly worksheet
was patterned on Bartlett’s (2007) form used to determine the validity of Instructional

60
Leadership Practices Survey (p. 48). Panel members reviewed the SWS and returned all validity
worksheets within one month.
Content validity:
1. Is the survey instrument organized in an appropriate fashion? What could make the
organization better?
2. Is the consent to participate (Question one) addressed in a clear and understandable
manner?
3. In part one (the demographics section) is there information that is needed that is not
currently requested?
4. Is part one clear and concise?
5. Is there an issue with the validity of any question in part one?
6. Is part one clear and concise as determined by Chapter Three of the APA Manuel?
For part two of the survey, the following questions were asked:
1. Is question eight clearly and concisely written?
2. Do you have any validity concerns with question eight?
3. Is question nine clearly and concisely written?
4. Do you have any validity concerns with question nine?
5. Is question ten clearly and concisely written?
6. Do you have any validity concerns with question ten?
7. Is question 11 clearly and concisely written?
8. Do you have any validity concerns with question 11?
The panel reviewed the instrument and found the instrument to be valid (see Appendix B). The panel
made four suggestions. First, a panelist suggested question one be identified in the body of the email
as the point of opting in out of the study. Another suggestion was to increase spacing between

61
answer choices on all questions. Panelist four suggested that key information be bolded in question
two and question three. Finally, the language in question nine was considered unclear. Adjustments
were made based on the suggestions of the panel and question nine was changed from “Which of the
following statements best describes your current situation?” to “Which of the following
statements best describes how you conduct walkthroughs?” in an effort to communicate more
effectively. Using SurveyMonkey rather than a paper survey rectified the spacing issues of the
answer choices on the survey. Finally, due to the fact instrument is purely demographic and
collecting information about the walkthroughs and it is deemed valid; it can be stated that it is in
fact trustworthy and therefore reliable for this study. While trustworthy is often viewed as a
qualitative statement; it is appropriate in the context of this quantitative study because this
instrument is measuring school accountability grade and mean of administrative walkthrough to
determine if a predictive relationship occurs.
Florida Standards Assessment Reliability
The FLDOE (2015) contracted with Alpine Testing Solutions and determined that FSA
were valid. The study found that items were fully aligned with the intended content and that
items in FSA test forms demonstrated a good representation of the language arts and
mathematics standards (FLDOE, 2018, p. 44). Furthermore, the FLDOE mapped test questions
to subject area standards to further ensure validity (2018, p. 40).
Florida Standards Assessment Reliability
Determining reliability of FSA testing, the FLDOE (2015) in conjunction with American
Institutes for Research (AIR) found the following:
For English Language Arts (ELA) the Cronbach alpha ranged from 0.88 to 0.92, the
stratified alpha coefficients ranged from 0.88 to 0.92, and the Feldt-Raju coefficients
were between 0.85 and 0.91. For Mathematics the Cronbach alpha ranged from 0.90 to

62
0.95, the stratified alpha coefficients were between 0.91 to 0.95, and the Feldt-Raju
coefficients ranged from 0.89 and 0.94. End of Course test (EOC) had Cronbach alpha
that ranged from 0.87 to 0.95, stratified alpha coefficients ranged from 0.87 to 0.95, and
the Feldt-Raju coefficients were between 0.88 and 0.93. The marginal reliability
coefficients for all subjects and grades ranged from 0.85 to 0.93. (p. 10-12)
For the FSA ELA, Mathematics, and EOC assessments, the reliability coefficients were
calculated by means of Cronbach alpha, stratified alpha, and Feldt-Raju coefficient (FLDOE,
2018). Multiple-choice and non-multiple-choice items were calculated as two distinct levels
(FLDOE, 2018). According to Taber (2018), a Cronbach alpha of higher than .70 is acceptable
in terms of internal consistency. All of Florida’s assessments had a Cronbach alpha and Feldt-
Raju coefficient of greater than .70 (FLDOE, 2015).
Florida Accountability Test
In examining school accountability grade and high stakes testing from a historical
perspective, Florida’s previous high stakes testing program was the Florida Comprehensive
Assessment Test (FCAT) and it was implemented in 1998 (FLDOE, 2015). In 1999 school
grades were given based on FCAT performance (FLDOE, 2015). In 2002, the FLDOE use
learning gains, and learning gains of the lowest 25% to account for 50% of the school grade with
student achievement comprising the remaining 50% (FLDOE, 2015). In 2003, science was
added to the FCAT battery and in 2007 science performance and learning gains of the lowest
25% in mathematics were calculated in school grade (FLDOE, 2015). By 2010, acceleration,
graduation rates, and college readiness were added as components of school grade (FLDOE,
2015). To create more rigor, Next Generation Sunshine State Standards were measured by
FCAT 2.0 in 2011 (FLDOE, 2015). EOC assessments were implemented with Algebra 1 in

63
2011, geometry and biology in 2012, history in 2013, and civics for middle schools in 2014
(FLDOE, 2015). By 2012 school grade was computed adding FCAT 2.0 and EOC test (FLDOE,
2015). In 2014, the state of Florida transitioned from FCAT 2.0 to FSA which was in line with
Common Core (FLDOE, 2015).
Florida School Grade Calculation
School grade is measuring student achievement on high stakes assesments.as determined
by the Florida Department of Education. Supporting the use of outcomes of Florida high-stakes
testing platform is Williams’s (2011) study that examines the differences in student achievement
as determined by the State of Florida between students enrolled in alternate block schedule and
students enrolled in a seven-period traditional schedule (p. 68). School grade is archival data of
Florida Standards Assessment (FSA) testing and is determined by 10 components valued at 100
points each for a total of 1,000 points (Florida Department of Education, [FLDOE], 2017).
There are four achievement components English Language Arts (ELA), Mathematics, Science,
and Social Studies that are determined by state standardized assessment (FLDOE, 2017).
English and mathematics have two additional components, one for learning gains from previous
year and another for leaning gains by the students in lowest performing 25% (FLDOE, 2017).
The ninth component is the graduation rate with points awarded that reflect the actual four-year
cohort graduation percentage (FLDOE, 2017). The tenth component is college and career
acceleration, which is based on the percentage of the graduating cohort who earned a passing
score on acceleration examination such as Advanced Placement (AP), dual enrollment college
classes, or earned an industry certification in an approved area (FLDOE, 2017). Grades are
determined by the percentage of total points earned (FLDOE, 2017). The FLDOE school
accountability grade is based on percentages as follows: A is 62% of points and higher, B is 54%

64
to 61% of points, C is 41% to 53% of points, D is 32% to 40% of total points, and F is 31% or
lower of points (FLDOE, 2017).
Procedures
Prior to the commencement of research, permission to conduct research was obtained
from the Institutional Review Board (IRB) of Liberty University (see Appendix A for IRB
approval). Email address for all participating high school principals was on each of the 22
participating district websites. An email was be sent to the principal, the body contained the
invitation to participate in the study and a link to the survey (see Appendix E for email). First,
participating principals read and electronically signed the informed consent as question one.
Then participating principals completed the remainder of the survey. The length of time to
complete the survey was less than 10 minutes. SurveyMonkey compiled the results. I divided
the total number of school wide walkthroughs (defined as all walkthrough performed by all
building level administrators) by the total number of teachers to determine the mean number of
walkthroughs. Then, I placed then school name and walkthrough mean on a spreadsheet. The
data for school grades is archival and was obtained from The Florida Department of Education
for the given academic year (FLDOE, 2018). The researcher used the raw school score in points
from 10 categories that totaled potentially 1,000 points. The school grade was then matched
with the corresponding principal’s survey data. Coding involved each school being assigned a
number to ensure anonymity. Then the mean of walkthroughs and total points was entered into
SPSS.
Data Analysis
First the assumption of bivariate outliers was tested using a scatter plot between the
predictor variable and criterion variable was be used to determine extreme outliers (Warner,

65
2013). The assumption of normality was then tested. Due to the sample size exceeding 50, the
Kolmogorov–Smirnov test and a histogram was used determine if the assumption of normality
was tenable (Warner, 2013). The assumption of linearity was tested. A scatter plot between the
predictor variable and criterion variable was used to determine if the assumption of linearity is
tenable (Warner, 2013). The assumption of bivariate normal distribution was determined. A
scatter plot between the predictor variable and criterion variable was conducted; the classic cigar
shape was sought (Warner, 2013). Finally, the use of linear regression assisted the researcher in
determining if there was a predictive relationship between principal walkthroughs and Florida
high school accountability grade. To ensure a medium effect size with a statistical power of .7 at
the .05 alpha level based on Cohen’s d between .20 and .79 and a minimum of 66 schools was
included (Gall et al., 2007, Warner 2013).

66
CHAPTER FOUR: FINDINGS
Overview
This study sought to evaluate the predictive relationship between the number of
administrative school-wide walkthroughs performed during the 2018-2019 school year in 70
Florida high schools and the high school accountability grades subsequently assigned to those
schools by the Florida Department of Education. Chapter Four begins by restating the study’s
research question and its associated null hypothesis. The chapter then explains how the data
obtained from 72 high schools were screened for univariate and bivariate outliers, resulting in the
elimination of two schools from subsequent analyses. Descriptive statistics are then presented
for the study’s key variables, mean walkthroughs and school accountability grades for the 70
schools that passed data quality screening. Attention turns next to the bivariate linear regression
analysis used to test the study’s null hypothesis. Tests of the statistical assumptions of that
procedure are described, followed by the results of the regression analysis.
Research Question
This quantitative study addressed the impact of administrative walkthroughs on school
accountability grade with a single research question.
RQ1: Is there a predictive relationship between the mean number of administrative
school-wide walkthroughs and Florida high school accountability grade?
Null Hypothesis
The null hypothesis associated with the study’s research question was as follows:
H01: There is no statistically significant predictive relationship between the mean of
school-wide walkthroughs and the high school accountability grade in Florida.

67
Descriptive Statistics
With 70 high school principals providing usable data out of 214 who were invited to
complete the survey, this study achieved a response rate of 33.6%. The response rate was less
than hoped for but not entirely unexpected in the absence of incentives to participate. Even so,
the response rate seen in this study leads to questions about self-selection bias and the sample’s
representativeness. Babbie (2007) stated,
A review of the published social research literature suggests that a response rate of at
least 50 percent is considered adequate for analysis and reporting. A response rate of 60
percent is good; a response rate of 70 percent is very good. (p. 262)
Fowler (2009) has suggested that response rates in the 20% range are indicative of self-selection
bias and are unlikely to yield “credible statistics about the characteristics of the population as a
whole” (p. 51). The reality, however, is that response rates to surveys distributed by email
typically approximate 25% to 30% (Fincham, 2008) and “response rates higher than 50% are
now anomalous, and rates lower than 40% are quite typical” (Laguilles et al., 2011, p. 538).
Descriptive statistics for mean walkthroughs (the study’s predictor variable) and school
grades (the criterion variable) for the 70 cases that passed data screening are presented in Table
3. The 95% confidence intervals included in the table provide ranges of values within which one
can be 95% confident of finding variable means in the hypothetical population of schools like the
schools which were examined in the study.
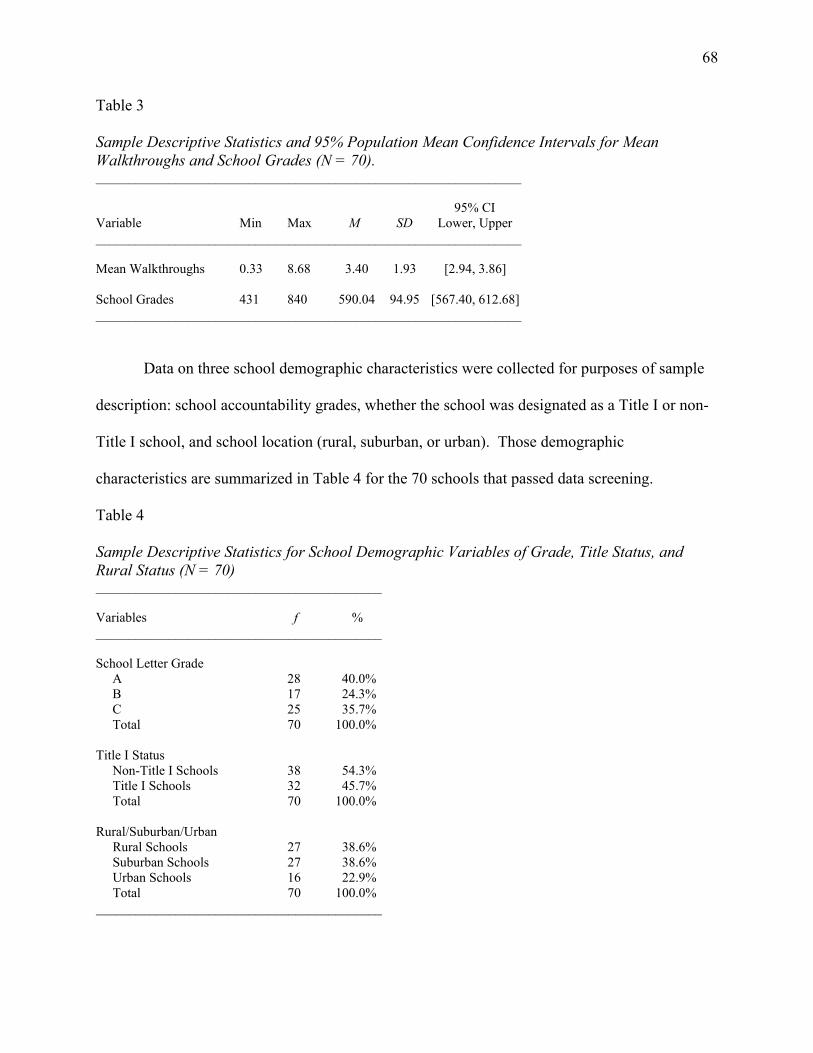
68
Table 3 Sample Descriptive Statistics and 95% Population Mean Confidence Intervals for Mean Walkthroughs and School Grades (N = 70). ________________________________________________________________ 95% CI Variable Min Max M SD Lower, Upper ________________________________________________________________ Mean Walkthroughs 0.33 8.68 3.40 1.93 [2.94, 3.86] School Grades 431 840 590.04 94.95 [567.40, 612.68] ________________________________________________________________
Data on three school demographic characteristics were collected for purposes of sample
description: school accountability grades, whether the school was designated as a Title I or non-
Title I school, and school location (rural, suburban, or urban). Those demographic
characteristics are summarized in Table 4 for the 70 schools that passed data screening.
Table 4
Sample Descriptive Statistics for School Demographic Variables of Grade, Title Status, and Rural Status (N = 70) ___________________________________________ Variables f % ___________________________________________ School Letter Grade A 28 40.0% B 17 24.3% C 25 35.7% Total 70 100.0% Title I Status Non-Title I Schools 38 54.3% Title I Schools 32 45.7% Total 70 100.0% Rural/Suburban/Urban Rural Schools 27 38.6% Suburban Schools 27 38.6% Urban Schools 16 22.9% Total 70 100.0% ___________________________________________

69
Participant demographics are identified as letter grade, title 1 status, and whether the school is
located in a rural area, suburban area, or an urban area. Letter grade was coded as 4 for an A, 3
for a B, and 2 for a C. The coding for title 1 status was a 2 if school was considered title 1 and a
1 if school was not labeled as a title 1 school. Rural schools were coded as 1, suburban as 2, and
urban as 3 (Table 4).
Results
Bivariate linear regression analysis was used in this study to test the null hypothesis that
there is no statistically significant relationship between the mean of school wide walkthroughs
(the independent or predictor variable) and the high school accountability grade in Florida (the
dependent or criterion variable). However, because the results of that analysis are only valid to
the extent that the data display certain characteristics, those statistical assumptions were tested
prior to performing the regression analysis. Tests of four additional important assumptions for
the bivariate regression analysis, linearity of the relationship between the variables, bivariate
normal distribution, absence of bivariate outliers, and homoscedasticity are described next,
followed by the results of the bivariate regression analysis.
Assumptions Tests
Linearity. Bivariate linear regression analysis evaluates the strength of the linear
relationship between variables. If that relationship is strongly nonlinear, the linear regression
analysis underestimates the strength of the relationship. Consequently, the assumption of
linearity is really an assumption that the variables do not show a strongly nonlinear relationship.
The assumption of linearity was tested in this study by generating a scatterplot capturing the
relationship between mean walkthroughs and school grades. This scatterplot was examined for
indications of linearity by fitting a line through the scatterplot (Figure 2). Using the r2 goodness

70
of fit measure the line provided a very poor fit to the scatterplot (r2 = .00). However, the
scatterplot did not show any indications of strong nonlinearity, such as would be indicated by a
curved distribution of points (e.g., banana-shaped, U-shaped, or S-shaped). It was concluded that
the relationship between the variables was not strongly nonlinear in a manner that would cause
measures of linear relationship strength to be attenuated.
Figure 2. Scatterplot depicting the relationship between mean walkthroughs and school grades, with line of best fit. Bivariate normal distribution. Bivariate linear regression analysis also assumes that the
variables show a bivariate normal distribution. This assumption was tested by examining the
scatterplot shown in Figure 2 for the classic cigar shape pattern, this assumption was not met.
Absence of bivariate outliers. As reported previously, the Mahalanobis distance statistic
was used to evaluate the data for bivariate outliers which would exert a disproportionate effect
on the positioning of the regression line and attenuate the calculated value of r. One such outlier
was identified on the frequency histogram and school 29 was removed with a raw score of 45
(Figure 3).

71
Figure 3. Frequency histogram showing the distribution of mean walkthrough scores for all 72 reporting high schools. The high-scoring outlier (raw score 45, z-score 7.59) is apparent. The case located at 13.72 mean walkthroughs (z = 1.78) did meet the criterion to be identified as a univariate outlier (i.e., z > +3.0). Following that removal, the scatterplot depicting the relationship between mean walkthroughs
and school grades shown in Figure 4 was inspected for any remaining bivariate outliers. In a
bivariate study such as this one, data are unusable unless valid scores are available on both
variables under investigation. Therefore, all data from the outlier school 43 which was over
12.50 mean walkthroughs (i.e., both mean walkthroughs and school grade) were deleted (see
Figure 4).
Figure 4. Scatterplot depicting bivariate outlier.
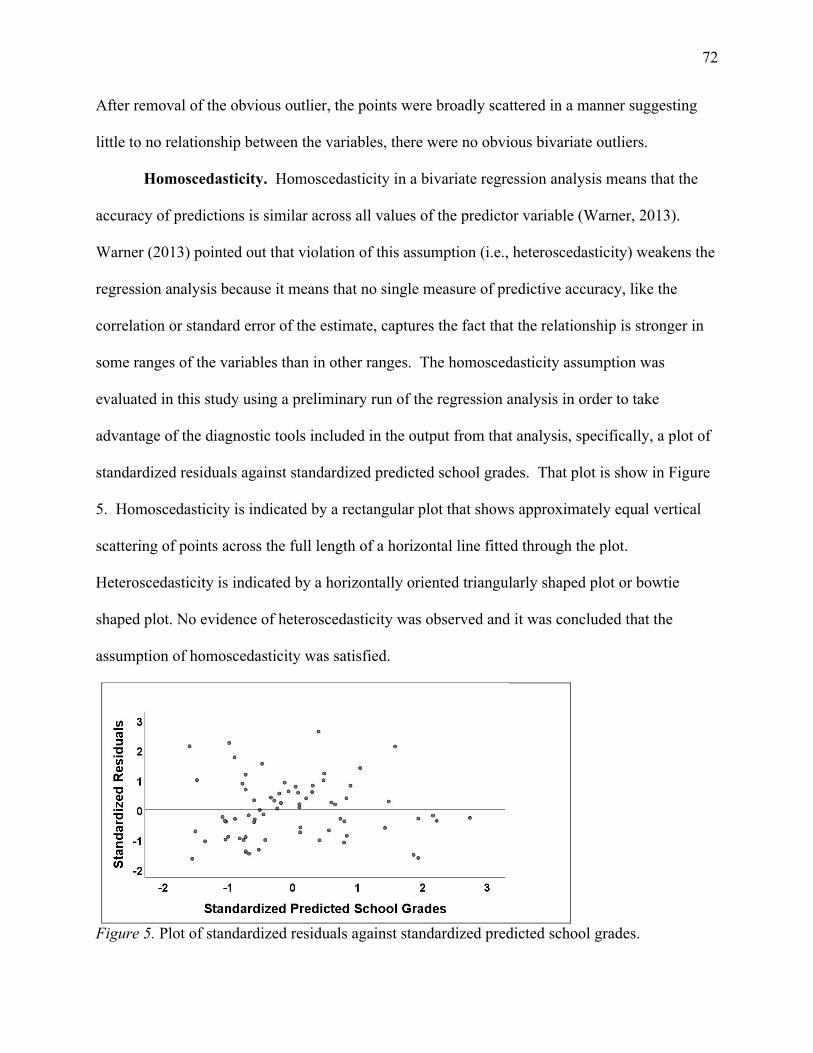
72
After removal of the obvious outlier, the points were broadly scattered in a manner suggesting
little to no relationship between the variables, there were no obvious bivariate outliers.
Homoscedasticity. Homoscedasticity in a bivariate regression analysis means that the
accuracy of predictions is similar across all values of the predictor variable (Warner, 2013).
Warner (2013) pointed out that violation of this assumption (i.e., heteroscedasticity) weakens the
regression analysis because it means that no single measure of predictive accuracy, like the
correlation or standard error of the estimate, captures the fact that the relationship is stronger in
some ranges of the variables than in other ranges. The homoscedasticity assumption was
evaluated in this study using a preliminary run of the regression analysis in order to take
advantage of the diagnostic tools included in the output from that analysis, specifically, a plot of
standardized residuals against standardized predicted school grades. That plot is show in Figure
5. Homoscedasticity is indicated by a rectangular plot that shows approximately equal vertical
scattering of points across the full length of a horizontal line fitted through the plot.
Heteroscedasticity is indicated by a horizontally oriented triangularly shaped plot or bowtie
shaped plot. No evidence of heteroscedasticity was observed and it was concluded that the
assumption of homoscedasticity was satisfied.
Figure 5. Plot of standardized residuals against standardized predicted school grades.

73
Results of the Bivariate Regression Analysis
Having established that the assumptions upon which bivariate linear regression analysis
is based were satisfied in this study, that analysis was performed to test the null hypothesis that
there is no statistically significant predictive relationship between the mean of school wide
walkthroughs and the high school accountability grade in Florida. The absence of any linear
relationship between the variables indicated that a linear regression equation would not provide
any appreciable power to predict school grades from mean walkthroughs. That impression was
confirmed by subsequent analyses. Table 5 provides a summary of the results of the bivariate
regression analysis, including the Pearson correlation (r) between mean walkthroughs and school
grades, the squared correlation (r2), and the standard error of the estimate (SE). The weak
correlation (r =.01) indicated virtually no linear relationship between school grades and mean
walkthroughs. Consistent with this fact, the squared correlation (r2 = .00) indicated that nearly
none of the variance in school grades was explained by mean walkthroughs. The standard error
of the estimate (SE = 95.64) can be interpreted as approximately equal to the average absolute
error of predictions and indicated that the average error in predicting school grades from mean
walkthroughs in this sample of 70 cases was about 95.64 points on a variable that showed a
standard deviation of 94.95. Table 6 summarizes the bivariate regression model including the
regression constant, standardized regression coefficient, and raw score regression coefficient.
That table also provides a t-test of the significance of the regression coefficient. That test showed
that the regression coefficient (β = 0.01) was not significant, t = 0.09, p = .932, indicating that
mean walkthroughs provided virtually no power to predict school grades. Table 7 is an ANOVA
summary table summarizing the F test used in evaluating the significance of the Pearson

74
correlation between mean walkthroughs and school grades. That correlation (r = .01) indicated
that there was virtually no relationship between mean walkthroughs and school grades and the F
test confirmed that the relationship was statistically non-significant, F(1, 68) = 0.01, p = .932. It
was concluded that there was insufficient evidence in this study to reject the null hypothesis that
there is no statistically significant relationship between the mean of school-wide walkthroughs
and the high school accountability grade in Florida.
Table 5
Summary of the Bivariate Regression of School Grades on Mean Walkthroughs (N = 70) _____________________________________________________________________________________ Std. Error of Model r r2 the Estimate ________________________________________ 1 .01 .00 95.64 ________________________________________
Table 6
Model Summary Table for the Regression of School Grades on Mean Walkthroughs (N = 70) _________________________________________________________________________________________ Unstandardized Standardized Coefficient Coefficient _____________________ ____________ Model B Std. Err. Beta t Sig. __________________________________________________________________________________________ 1 (Constant) 588.30 23.25 Mean Walkthroughs 0.51 5.96 0.01 0.09 .932 __________________________________________________________________________________________ Note. The dependent variable was school grade.

75
Table 7
ANOVA Summary Table for the F Test of the Significance of the Pearson Correlation Between Mean Walkthroughs and School Grades (N = 70) ____________________________________________________________________________ Model SS df MS F Sig. ____________________________________________________________________________ Regression 67.64 1 67.64 0.01 .932 Residual 621957.23 68 9146.43 Total 622024.87 69 ____________________________________________________________________________

76
CHAPTER FIVE: CONCLUSIONS
Overview
The purpose of this study is to determine the relationship between the mean number of
principal walkthroughs and the high school accountability grade in Florida. A bivariate
regression was conducted to determine if there was a significant relationship between
walkthrough and school grade in 72 Florida high schools. This chapter gives a synopsis of the
findings of this quantitative, correlational study and the implications of administrative
observational practices in terms of improved teaching practices leading to improved student
academic performance. Results of the null hypothesis are discussed as well as determining how
the results align with prior research. Limitations of the study are examined, and the chapter
concludes with recommendations for future research.
Discussion
The purpose of this study is to determine the relationship between the mean number of
principal walkthroughs and the high school accountability grade in Florida. This quantitative
study endeavored to determine what the relationship was between administrative walkthrough
and school accountability grade and answer the flowing research question: Is there a predictive
relationship between the mean number of administrative school-wide walkthroughs and Florida
high school accountability grade?
The research topic was chosen because insufficient studies were conducted that
determined if there was a positive relationship between number of principal walkthroughs and
student achievement, which leads to school grade (Boothe, 2013). However, it has been opined
that teacher evaluation, which includes walkthroughs, leads to improved instructional practices
that positively affect student learning (Danielson, 2011; Darling-Hammond, 2014). The null
77
hypothesis asserted there was no statistically significant predictive relationship between the
mean of school wide walkthroughs and the high school accountability grade in Florida. Analysis
was performed to test the null hypothesis, and that analysis indicated virtually no predictive
relationship between mean walkthroughs and school grades, r(68) =.01, F(1, 68) = 0.01, p =.932.
It was concluded that there was insufficient evidence in this study to reject the null hypothesis.
There is a plethora of previous research on leadership and school leadership that links
leadership to heightened employee production. Leadership has a tremendous impact on the
productivity of employees and overall effeteness of the organization (Ahn, Lee, & Yun, 2018;
Kouzes & Posner, 2012). Kouzes and Posner (2012) found employees viewed poor leaders as
underutilizing their talents and great leaders as being able to utilize individual talents
productively. Additionally, ineffective leadership resulted in low morale and uncertain results
Kouzes & Posner, 2012; Murphy & Myers, 2008). The accountability movement significantly
increased the perceived value of the principal to the school as a learning organization.
In 2015, the ESSA emphasized the need to improve chronically under-performing
schools (Jacob, 2017). This attention on underperforming schools and districts has led to an
increasing burden on school principals to ensure student achievement gains (Jacob, 2017). It is
known that improved instruction leads to greater student achievement (Bright, 2011; Ehri &
Flugman, 2018; Miri, 2012; Roussin & Zimmerman, 2014). In fact, the effectiveness and future
employment of administrators and teachers is often assessed based on student achievement. This
has led to the principal and administrative team assuming instructional leadership of the building
and attempting to improve instructional practices through professional development. The goal of
teacher evaluation and walkthroughs should be improved instructional practices (Danielson,
2011; Darling-Hammond, 2014). The result of improving instructional practice should lead to

78
improved student achievement (Danielson, 2011; Darling-Hammond, 2014). Ultimately,
increased student achievement should lead to improve student performance on high-stakes
accountability test.
This study’s failure to reject the null is in contrast with a tremendous amount of literature
that was examined in chapter two. Several studies have associated improved teaching practice to
improved student achievement (Bright, 2011; Ehri & Flugman, 2018; Miri, 2012; Roussin &
Zimmerman, 2014). Hitt et al.’s (2018) research found principals have a distinct influence on
student learning and achievement. (Hitt, Woodruff, Myers, & Guorong, 2018). Among the foci
of walkthroughs is teacher instructional practices. VanGronigen and Meyers (2017) found that
principals’ emphasizing improved student achievement focused on refining instructional
practices. According to Hallinger and Heck (2010), to increase instructional capacity teacher
evaluations must be employed efficiently.
Specifically, studies have been conducted that support walkthroughs and evaluations
improving teaching practices (Marshall, 2003; Marzano, 2012; Range et al., 2014). Marzano et
al. (2011) found walkthroughs provides the principal with data needed to accurately ascertain
instructional strengths and weaknesses of the faculty. Furthermore, Gillespie (2016) found
walkthroughs led to teacher reflection and improved teaching. Additionally, Range et al. (2014)
found walkthroughs aided less-experienced teachers because low-level teaching issues can be
addressed and corrected. The evaluation and feedback cycle of the principal should lead to
increased teacher engagement, reflection, and improved instruction (Bird et al, 2009).
Ultimately, improved teacher instructional practices should lead to better student engagement. A
plethora of studies on walkthroughs indicated an increase in student engagement led to improved
student achievement (Allen & Topolka-Jorissen, 2014; Cervantes, Hemmer, & Kouzekanani,
79
2015; Muñoz & Dossett, 2016). Both Danielson (2011) and Darling-Hammond (2014)
supported that evaluations, including walkthroughs, must lead to improved instructional practices
that positively affect student learning (Danielson, 2011; Darling-Hammond, 2014).
However, the failure to reject the null in this study is supported by some research.
Weisberg et al. (2009) describe teacher evaluation as a failure because all or a majority of
educators are rated as effective and evaluations are not used as a means for improvement. The
connection of improved student learning and effective teaching practices is difficult to quantity.
This is in part because effective teaching is multifaceted and a single measure of performance,
such as a walkthrough, fails to completely identify a singular link to student growth (Muñoz and
Dossett, 2016). Hill and Grossman (2013) have found that formal, announced observations fail
to identify accurate teacher quality. Additionally, administrators that fail to conduct sufficient
walkthroughs on a regular basis do not get an accurate representation of teaching (Range, 2013).
This supports the assertion that teacher evaluation and walkthroughs fail to lead to improved
student achievement.
Often, teacher evaluation and walkthroughs are poorly accepted by veteran teachers and
tenured teachers (Range et al., 2014). Principals frequently view walkthroughs and teacher
evaluations as very time consuming with an imbalance of time invested for the amount of
academic growth that occurs (Brown & Coley, 2011, DuFour & Mattos, 2013; Range, Scherz,
Holt & Young, 2011). Brown and Coley (2011) found teachers were distrustful of administrative
intent with walkthrough. In fact, the teachers felt threatened by the presence of administrators in
classrooms (Brown & Coley, 2011). This distrust, and ineffectiveness, might be attributed to the
dual purpose of evaluation and walkthroughs.
Rigby (2014) opined that using evaluations for continued employment, and then using
80
evaluations to improve teaching practices, led to friction between teachers and administrators. In
fact, the dual use of observation triggers teacher anxiety (Rigby, 2014). Administrators have
tremendous constraints on their time. When a walkthrough is conducted, an opportunity is
presented to use this as a component of the observation process due to collective bargaining
agreements on number of observations and deadlines for final observations. Principals that
choose to use the walkthrough as evidence to continue or end employment for teachers face
difficulty in using the same walkthrough as a catalyst for improvement.
Frequently, teachers perceive the evaluation process and walkthrough feedback as being
skewed by the administrator’s personal relationships with the faculty and having favorites on the
faculty (Danielson & McGreal, 2000; Larsen, 2004). Teachers view the evaluation process with
cynicism because of observer bias as devaluing the evaluation (Maharaj, 2014). A great deal of
teacher distrust and discontent is rooted in the teachers viewing the administrator holding all of
the power in the observation process (Roussin & Zimmerman, 2014). This distrust and
discontent weaken the acceptance of feedback (Roussin & Zimmerman, 2014).
Trust of academic proficiency of the evaluator is an obstacle to a meaningful
walkthrough. Specifically, teachers view administrators as lacking pedagogical expertise.
Teachers are often resistant to feedback from administrators who lack experience or
understanding of their particular discipline (Kelly, 2014; Maharaj, 2014). In effect, a principal
that has a social studies background might be viewed as lacking the subject area knowledge to
provide feedback to a mathematics teacher for improved instructional practices. Dougherty’s
(2009) study examining the shortcoming of understanding of genetics in science students,
determined that instructors lacked confidence in the evaluators ability to demonstrate needed
instructional improvements.
81
Finally, the infrequency of walkthroughs conducted and amount of time of each
walkthrough might impact the effectiveness of walkthroughs. Too few walkthroughs fail to
develop consistency and trust (DeBoer & Hinojosa, 2012). Also, many teachers view that a
classroom visit of less than 25 minutes does not give an accurate portrayal of teaching for the
administrator to provide feedback (Garza et al., 2016).
Implications
This study is relevant and significant to the field of educational leadership and teacher
supervision. There have been many studies on the impact of leadership on organizations (Ahn,
Lee, & Yun, 2018; Kouzes & Posner, 2012). Furthermore, several studies have been conducted
identifying behaviors of transformational school leaders (Allen et al., 2015; Leithwood & Jantzi,
1990; Vekeman et al., 2016).
The findings of this study aided in reducing the gap in literature by supplying research on
the principal walkthroughs and the impact they have on school accountability grades.
Furthermore, this study added to the body of knowledge of supervision in terms of the
effectiveness of informal walkthroughs and the impact they have on school grades. This study is
important due to two interconnected circumstances. First, principal and school administrator
time are a finite commodity and walkthroughs are time intensive. Secondly, improved teacher
instructional practice that leads to improved student achievement must be a product of
walkthroughs to justify the time consumed conducting the walkthroughs.
Additionally, the findings of this study can provide school districts information to make a
rational decision in the investment of administrative time in walkthroughs. This information
could also lead districts to provide targeted training for administrators that conduct walkthroughs
to better lead to improved teaching practices. Finally, this might provide school districts

82
evidence that using walkthroughs for the dual purpose of employability status and instructional
improvement is a conflict. In fact, districts might choose to use walkthroughs exclusively as a
tool for improvement or as a component of employability.
Limitations
All studies have limitations, as did this correlational study. This study was limited to
public high school principals in Florida. Then the study was further limited to principals’ that
had at least one year of experience in their current assignment. There were several threats to
internal and external validity of this study. First, participation in this study was based on high
school principals’ volunteering to take the survey. Gall et al, (2007) indicated that volunteers out
of a target population are often biased. Supporting the fact that volunteers for studies are biased,
Oswald et al., (2013) identified participants that self-select often do so due to the nature of the
research. In fact, there are differences in the characteristics of volunteers and non-volunteers
(Oswald, 2013). Based on the illustration of Gall et al., (2007) this study was comprised of 72
volunteers and 142 non-volunteers.
Additionally, the question of how many walkthroughs were conducted during the 2018-
2019 school year can be considered vague. This is because many Florida high school principals
did not track informal walkthroughs. Frequently, the only walkthroughs recorded were used for
district mandated teacher evaluation. Many of the participants in this study estimated the total
number of walkthroughs that were conducted. These estimations might be skewed and have a
tremendous impact on the validity of the study.
Recommendations for Future Research
The development of this study has made clear that further research is needed to determine
the value of walkthroughs. The first recommendation would be to determine how and what type

83
of feedback is provided from walkthroughs. While there is a plethora of information about
walkthrough models and mechanisms, there is a need to determine what specific practices are
being used in high achieving schools.
A second recommendation would be to examine the walkthrough practices of high
achieving high-poverty rate schools. The researcher would need to focus on schools that are
successful and diverse. There is a need to separate high achieving schools that are advantaged
from high achieving schools that are more diverse and disadvantaged economically because
economically disadvantaged students are behind their more advantaged peers in terms of
academic preparation and support (Payne, 2005).

84
REFERENCES
Acheson, K.A., & Gall, M.D. (1997). Techniques in the clinical supervision of teachers.
New York: John Wiley & Sons, Inc
Ahn, J., Lee, S., & Yun, S. (2018). Leaders’ Core Self-evaluation, Ethical Leadership, and
Employees’ Job Performance: The Moderating Role of Employees’ Exchange
Ideology. Journal of Business Ethics, 148(2), 457–470.
Albrecht, S. F., & Joles, C. (2003). Accountability and Access to Opportunity: Mutually
Exclusive Tenets Under a High-Stakes Testing Mandate. Preventing School Failure,
47(2), 86–91.
Allen, N., Grigsby, B., & Peters, M. L. (2015). Does Leadership Matter? Examining the
relationship among transformational leadership, school climate, and student
achievement. International Journal of Educational Leadership Preparation, 10(2), 1–22.
Retrieved from
http://ezproxy.liberty.edu/login?url=http://search.ebscohost.com/login.aspx?direct=true&
db=eric&AN=EJ1083099&site=ehost-live&scope=site
Allen, A. S., & Topolka-Jorissen, K. (2014). Using teacher learning walks to build capacity in a
rural elementary school: Repurposing a supervisory tool. Professional Development in
Education, 40(5), 822-837
Anderson, R. H. (1993). Clinical Supervision: Its history and current context. In R. H. Anderson
& K. J. Snyder (Eds.), Clinical supervision: Coaching for higher performance (pp. 5-35).
Lancaster, PA: Technomic
Babbie, E. (2007). The practice of social research (11th ed.). Belmont, CA: Wadsworth.

85
Beatty, I. (2017). Oklahoma teachers’ perceptions of the qualitative portion of the teacher
evaluation system. Retrieved from https://shareok.org/bitstream/handle
/11244/48168/2017-01-26_Beatty_Ivana_Annette_Dissertation.pdf?sequence=1
Billig, S. H. (1997). Title I of the Improving America’s Schools Act: What It Looks Like in
Practice. Journal of Education for Students Placed at Risk, 2(4), 329–43. Retrieved from
http://ezproxy.liberty.edu/login?url=http://search.ebscohost.com/login.aspx?direct=true&
db=eric&AN=EJ557774&site=ehost-live&scope=site
Bird, J., Wang, C., Watson, J., & Murray, L. (2009). Relationships among principal authentic
leadership and teacher trust and engagement levels. Journal of School Leadership, 19(2),
153-171
Boothe, B.D., (2013). Classroom walkthroughs: Impact on student achievement (Doctoral
dissertation). Retrieved from
https://www.bakeru.edu/images/pdf/SOE/EdD_Theses/Boothe_Ben.pdf
Bressman, S., Winter, J. S., & Efron, S. E. (2018). Next generation mentoring: Supporting
teachers beyond induction. Teaching & Teacher Education, 73, 162–170.
Bright, N. (2011, October). Five habits of highly effective teachers: A role for
administrators. The School Administrator, 68(9), 33-35.
Brown, G. B., & Coley, K. S. (2011). The effect of walkthrough observations on teacher
perspectives in Christian schools. Christian Perspectives in Education, 4(2), 1-24

86
Brutto, B.L. (2016) Teachers’ and administrators’ perceptions of the Kansas educator
evaluation protocol. Retrieved from
www.bakeru.edu/images/pdf/SOE/EdD_Theses/Brutto_Brooke.pdf
Bulunz, N., Gursoy, E., Kesner, J., Baltaci Goktalay, S., & Salihoglu, U. M. (2014). The
Implementation and Evaluation of a Clinical Supervision Model in Teacher Education in
Turkey: Is It an Effective Method? Educational Sciences: Theory and Practice, 14(5),
1823–1833
Carrero, J. (2015). Measuring up: Are you looking for a way to assess your teaching practice?
These three frameworks can help you evaluate your performance. Educational
Horizons, 93(3), 13–15
Cartusciello, J. (2014). Measuring effective teaching in social studies. Social Science
Docket, 14(1), 18–22.
Cervantes, B., Hemmer, L., & Kouzekanani, K. (2015). The Impact of Project-Based Learning
on Minority Student Achievement: Implications for School Redesign. Education
Leadership Review of Doctoral Research, 2(2), 50–66.
Cervone, L., & Martinez-Miller, P. (2007b). Classroom walkthroughs as a catalyst for school
improvement. Leadership Compass, 4(4), 1-4.
Chiang, H. (2009). How accountability pressure on failing schools affects student
achievement. Journal of Public Economics, 93(9/10), 1045-1057.
Chirichello, M. (2004). Collective Leadership: Reinventing the Principalship. Kappa Delta Pi
Record, 40(3), 119–123
87
Chiyaka, E.T., Kibirige, J., Sithole, A., McCarthy, P., & Mupinga, D.M. (2017). Comparative
analysis of participation of teachers of STEM and non-STEM- subjects in professional
development: Journal of Education and Training, 5(9), 18-26
Clark, D. (1993). Teacher evaluation: A review of the literature with implications for educator.
Retrieved from https://files.eric.ed.gov/fulltext/ED359174.pdf
Coleman, E. (1945). The "supervisory visit". Educational Leadership, 2(4), 164-167
Cogan, M. L. (1973). Clinical supervision. Boston: Houghton Mifflin Company.
Congress of the U.S., W. D. S. C. on L. and H. R. (1990). Excellence in Mathematics, Science,
and Engineering Education Act of 1990. Report to Accompany S. 2114. 101st Congress,
2d Session. Retrieved from
http://ezproxy.liberty.edu/login?url=http://search.ebscohost.com/login.aspx?direct=true&
db=eric&AN=ED326441&site=ehost-live&scope=site
Coulter, M. P. (2013). A qualitative study of teacher and principal perceptions of Washington
State teacher evaluation instruments: Danielson, Marzano, and CEL 5D+ (Doctoral
Dissertation). Retrieved from
https://research.wsulibs.wsu.edu/xmlui/bitstream/handle/2376/4776/Coulter_wsu_0251E
_10749.pdf?sequence=1
Danielson, C. (2011). Evaluations that help teachers learn. Educational Leadership,
68(4), 35–39.
Danielson, C. (2013). The framework for teaching evaluation instrument. 2013 Instructionally
Focused Edition. Retrieved December 12, 2018 from https://4aece201-a-59bb6b72-s-
sites.googlegroups.com/a/tcusd2.org/triadunit2/framework-for-teaching-2013-
instructionally-focused-edition.pdf?attachauth=A

88
Danielson, C. (2014). The framework for teaching evaluation instrument (2nd ed.). Princeton,
NJ: Danielson Group
Danielson, C., & McGreal, T. (2000). Teacher evaluation to enhance professional practice.
Alexandria, VA: Association for Supervision and Curriculum Development.
Danley, A., & Theiss, D. (2015). Using walkthrough observations to document dispositional
actions. School-University Partnerships, 8(2), 26–32
Darling-Hammond, L. (2014). One piece of the whole: Teacher evaluation as part of a
comprehensive system for teaching. American Educator, 38(1), 4–13, 44.
Deboer, L., & Hinojosa, M. (2012). Walkthroughs: Observation timeframes: What works best?
National Forum of Educational Administration and Supervision Journal, 29(4), 1–5.
Dickenson, K. N. (2016, January 1). The effect of classroom walkthroughs on middle school
teacher motivation (Doctoral dissertation).
Dougherty, M. J. (2009). Closing the gap: inverting the genetics curriculum to ensure an
informed public. American Journal of Human Genetics, 85(1), 6–12
Downey, C., Steffy, B., English, F., Frase, L., & Poston, W. (2004). The three-minute classroom
walk-through: Changing school supervisory practice one teacher at a time. Thousand
Oaks, CA: Corwin Press.
DuFour, R., & Marzano, R. J. (2009). High-leverage for principal leadership. Educational
Leadership, 66(5), 62.
DuFour, R., & Mattos, M. (2013). How do principals really improve schools? Educational
Leadership, 70(7), 34–40.

89
Ebmeir, H. & Nicklaus, J. (1999). The impact of peer and principal collaborative supervision on
teachers’ trust, commitment and desire for collaboration, and efficacy. Journal of
Curriculum and Supervision, 14(4), 351-378.
Ehri, L. C., & Flugman, B. (2018). Mentoring teachers in systematic phonics instruction:
Effectiveness of an intensive year-long program for kindergarten through 3rd grade
teachers and their students. Reading & Writing, 31(2), 425–456
Etheridge, K. (2014, December). Walking the walk: 4 effective walkthrough models. Retrieved
December 1, 2018, from https://www.naesp.org/communicator-december-2014/walking-
walk-4-effective-walkthrough-models
Fincham, J. E. (2008). Response rates and responsiveness for surveys, standards, and the
journal. American Journal of Pharmaceutical Education, 71, 1
Florida Department of Education (2002) Class size Retrieved December 10, 2018 from
http://www.fldoe.org/finance/budget/class-size/
Florida Department of Education (2015). Evidence of reliability and validity. Retrieved June 11,
2018 from http://www.fldoe.org/core/fileparse.php/5663/urlt/1415TechV4FSA.pdf
Florida Department of Education (2017). Guide to calculating school and district grades.
Retrieved June 11, 2018 from
http://www.fldoe.org/core/fileparse.php/18534/urlt/SchoolGradesCalcGuide17.pdf
Florida Department of Education (2018). Accountability reports. Retrieved December 10, 2018
from http://www.fldoe.org/accountability/accountability-reporting/school-grades/
Florida Department of Education. (2018). Bureau of school improvement. Retrieved June 12,
2018 from https://www.floridacims.org/districts

90
Florida Department of Education. (2018). Technical Reports. Retrieved October 12, 2019, from
http://www.fldoe.org/core/fileparse.php/5663/urlt/V4-FSA-1718-TechRpt.pdf
Florida Department of Education (2019). Accountability reports. Retrieved July 25, 2019 from
http://www.fldoe.org/accountability/accountability-reporting/school-grades/
Fowler, F. J., Jr. (2009). Survey research methods: Applied social research methods series (#1).
Los Angeles, CA: Sage.
Fox, R. (1995). Legislative Update. Communications of the ACM, 38(1), 9. Retrieved from
http://ezproxy.liberty.edu/login?url=http://search.ebscohost.com/login.aspx?direct=true&
db=iih&AN=12572223&site=ehost-live&scope=site
Frase, L. E. (2001). A confirming study of the predictive power of principal classroom visits on
efficacy and teacher flow experiences. Paper presented at the Annual meeting of the
American Educational Research Association, Seattle, WA.
Frase, L., & Hetzel, R. (2002). School management by wandering around. Lanham, MD:
Scarecrow Press.
Fullan, M., Hill, P., & Crevola, C. (2006). Breakthrough. Thousand Oaks, CA: Corwin Press.
Gall, M. D., Gall, J. P., & Borg, W. R. (2007). Educational research: An introduction (8th ed.)
Boston, MA: Pearson.
Gardner, D. P., Larsen, Y. W., Baker, W., Campbell, A., & Crosby, E. A. (1983). A nation at
risk: The imperative for educational reform. United States Department of Education.
Retrieved from https://files.eric.ed.gov/fulltext/ED226006.pdf
Garet, M., Birman, B., Porter, A., Desimone, L., Herman, R., & Suk Yoon, K. (1999). Designing
effective professional development: Lessons from the Eisenhower program. Washington,
DC: U.S. Department of Education

91
Garman, N. B. (1990). Theories embedded in the events of clinical supervision: A hermeneutic
approach. Journal of Curriculum & Supervision, 5(3), 201-213.
Garza, R., Ovando, M., & O'Doherty, A. (2016). Aspiring school leaders' perceptions of
the walkthrough observations. International Journal of Educational Leadership
Preparation, 11(1).
Gillespie, K. (2016). Classroom walkthrough observation: Leading edge instructional
leadership. Perspectives, 22, 4.
Ginsberg, M. B., & Murphy, D. (2002). How Walkthroughs Open Doors. Educational
Leadership, 59(8), 34–36
Glanz, J. (2007). On vulnerability and transformative leadership: An imperative for leaders of
supervision. International Journal of Leadership in Education, 10(2), 115-135.
Glickman, C.D., Gordon, S.P., & Ross-Gordon, J.M. (2014). Supervision and instructional
leadership: A developmental approach (9th ed.). Upper Saddle River, NJ: Pearson
Education
Goe, L., Biggers, K., & Croft, A. (2012). Linking teacher evaluation to professional
development: Focusing on improving teaching and learning. National Comprehensive
Center for Teacher Quality. Washington, D.C. Retrieved from
https://gtlcenter.org/sites/default/files/docs/LinkingTeacherEval.pdf
Goldhammer, R. (1969). Clinical supervision: Special methods for the supervision
of teachers. New York, NY: Holt, Rinehart, & Winston.
Goldhorn, J., Kearney, W. S., & Webb, M. (2013). Classroom walkthrough practices: Lessons
learned from 10,000 observations. National Forum of Educational Administration &
Supervision Journal, 30(3), 20-28

92
Goldman, P., Resnick, L., Bill, V., Johnston, J., Micheaux, D., & Seitz, A. (2004).
LearningWalk Sourcebook; Version 2.0. Pittsburgh, PA: University of Pittsburgh.
Grissom, J. A., Loeb, S., & Master, B. (2013). Effective instructional time use for school
leaders: Longitudinal evidence from observations of principals. Educational
Researcher, 42(8), 433-444. Retrieved from http://journals.sagepub.com.ezproxy.
liberty.edu
Guskey, T. (1999). Evaluating professional development. Thousand Oaks, CA: Corwin Press,
Inc.
Guskey, T., & Suk Yoon, K. (2009). What works in professional development. Phi Delta
Kappan, 90(7), 495-500.
Guthrie, J. W., & Springer, M. G. (2004). A nation at risk revisited: Did “wrong” reasoning
result in" right" results? At what cost? Peabody Journal of Education, 79(1), 7-35.
Hallinger, P., & Heck, R. (1998). Exploring the principal's contribution to school effectiveness:
1980–1995. School Effectiveness & School Improvement, 9, 157–202.
Hallinger, P., Heck, R. H., & Murphy, J. (2014). Teacher evaluation and school improvement:
An analysis of the evidence. Education Assessment, Evaluation and Accountability, 26,
5–28.
Hamilton, M. P., Heilig, J. V., & Pazey, B. L. (2014). A nostrum of school reform? Turning
around reconstituted urban Texas high schools. Urban Education, 49(2), 182-215.
Heise, M. (1994). Goals 2000: Educate America Act: the federalization and legalization of
educational policy. Fordham Law Review, 63, 345–381. Retrieved from
http://ezproxy.liberty.edu/login?url=http://search.ebscohost.com/login.aspx?direct=true&
db=ofm&AN=502348841&site=ehost-live&scope=site

93
Herrmann, M., Dragoset, L., James-Burdumy, S., & National Center for Education Evaluation
and Regional Assistance (ED). (2014). Are low-performing schools adopting practices
promoted by school improvement grants? NCEE evaluation brief. NCEE 2015-4001.
National Center for Education Evaluation and Regional Assistance. Retrieved from
http://ezproxy.liberty.edu/login?url=http://search.ebscohost.com/login.aspx?direct=true&
db=eric&AN=ED547647&site=ehost-live&scope=site
Hill, H. C., & Grossman, P. (2013). Learning from teacher observations: Challenges and
opportunities posed by new teacher evaluation systems. Harvard Educational
Review, 83(2), 371-384
Hite, S (2014) Using the FIT teaching framework for successful teacher evaluations.
Association for Supervision and Curriculum Development. Alexandria, Va. Retrieved
from http://www.ascd.org/ASCD/pdf/siteASCD/publications/fit-teaching-whitepaper.pdf
Hitt, D. H., Woodruff, D., Meyers, C. V., & Guorong Z. (2018). Principal competencies that
make a difference: Identifying a model for leaders of school turnaround. Journal of
School Leadership, 28(1), 56–81.
Hodges, J. (2018). Assessing the influence of No Child Left Behind on gifted education
funding in Texas: A descriptive study. Journal of Advanced Academics, 29(4), 321–342
Holifield, M., & Cline, D. (1997). Clinical supervision and its outcomes: Teachers and principals
report. National Association of Secondary School Principals. NASSP Bulletin, 81(590),
109-113.
Holland, P. E. (1988). Practice of clinical supervision. Journal of Curriculum and
Supervision, 3(2), 97-108.

94
Hoover, N. R., & And Others. (1991). Transformational and Transactional Leadership: An
Empirical Test of a Theory. Retrieved from
http://ezproxy.liberty.edu/login?url=http://search.ebscohost.com/login.aspx?direct=true&d
b=eric&AN=ED331177&site=ehost-live&scope=site
Ingersoll, R., Merrill, L., & May, H. (2016). Do Accountability Policies Push Teachers
Out? Educational Leadership, 73(8), 44–49.
Jacob, B. (2017). The changing federal role in school accountability. Journal of Policy Analysis
& Management, 36(2), 469–477
Johnson, D. (1997). Putting the cart before the horse: Parent involvement in the improving
America’s schools act. California Law Review, 85(6), 1757. https://doi-
org.ezproxy.liberty.edu/10.2307/3481082
Kafka, J. (2009). The Principalship in Historical Perspective. Peabody Journal of Education
(0161956X), 84(3), 318–330
Kalinowski, E., Gronostaj, A., & Vock, M. (2019). Effective professional development for
teachers to foster students’ academic language proficiency across the curriculum: A
systematic review. AERA Open, 5(1).
Kelly, S. (2014). A case study examining teacher responses to principal feedback of class
observations (Doctoral dissertation, Kennesaw State University Dissertation ETD, 2014)
(pp. 1-180). GA: Retrieved from:
https://digitalcommons.kennesaw.edu/cgi/viewcontent.cgi?article=1000&context=educle
addoc_etd
95
Keruskin, T. E. (2005). The perceptions of high school principals on student achievement by
conducting walkthroughs (Doctoral Dissertation). Retrieved from http://d-
scholarship.pitt.edu/9315/1/KeruskinToddAugust2005.pdf
Kouzes, James M. & Posner, Barry Z. (2012). The leadership challenge: How to make
extraordinary things happen in organizations (5th ed.). San Francisco, CA:
Jossey-Bass
Laguilles, J. S., Williams, E. A., & Saunders, D. B (2011). Can lottery incentives boost web
survey response rates? Findings from four experiments. Research in Higher Education,
52, 537-553
Larsen, M. (2004). A critical analysis of teacher evaluation policy trends. Australian Journal of
Education, 49(2), 3
Leithwood, K., & Jantzi, D. (1990). Transformational Leadership: How Principals Can Help
Reform School Cultures. School Effectiveness & School Improvement, 1(4), 249–280.
Retrieved from https://files.eric.ed.gov/fulltext/ED323622.pdf
Leithwood, K., & Jantzi, D. (2006). Transformational School Leadership for Large-Scale
Reform: Effects on Students, Teachers, and Their Classroom Practices. School
Effectiveness and School Improvement, 17(2), 201–227. Retrieved from
http://search.ebscohost.com.ezproxy.liberty.edu/login.aspx?direct=true&db=eric&AN=E
J738654&site=ehost-live&scope=site
Lemons, R. W., & Helsing, D. (2009). Learning to walk, walking to learn: Reconsidering the
walkthrough as an improvement strategy. Phi Delta Kappan, 90(7), 478-484.
Marshall, K. (2003). Recovering from HSPS (hyperactive superficial principal syndrome): A
progress report. Phi Delta Kappan, 84(9), 701.
96
Marzano, R. J. (2012). The Two Purposes of Teacher Evaluation. Educational Leadership, 70(3),
14–19
Marzano, R. J., Frontier, T., & Livingston, D. (2011). Effective supervision, supporting
the art and science of teaching. Alexandria: ASCD.
Mid-continent Research for Education and Learning. (2009). McREL’s teacher evaluation
system. Denver, CO
Mifsud, D. (2015). Circulating power and in/visibility: Layers of educational leadership. Journal
of Workplace Learning, 27(1), 51-67.
Miri, J. (2012). Aligning teacher effectiveness to greater student achievement. A Strategy Paper
from Center for Digital Education.
Moss, C. M. & Brookhart, S. M. (2012). Learning targets: Helping students aim for
understanding in today’s lesson. Alexandria, VA: ASCD.
Munoz, M. A., & Dossett, D. H. (2016). Multiple measures of teaching effectiveness:
Classroom observations and student surveys as predictors of student learning. Planning &
Changing, 47(3/4), 123–140
Munro, J. H. (2014). Roundtable viewpoints: Educational leadership. Boston, MA: McGraw-
Hill/Create.
Murray, K., & Howe, K. R. (2017). Neglecting Democracy in Education Policy: A-F School
Report Card Accountability Systems. Education Policy Analysis Archives, 25(109).
Murphy, J. (1998). Preparation for the school principalship: The United States’ story. School
Leadership and Management, 18, 359-372.
Murphy, J., & Meyers, C. V. (2008). Turning around failing schools: Leadership lessons from the
organizational sciences. Thousand Oaks, CA: Corwin Press.

97
Meyers, L. S., Gamst, G., & Guarino, A. J. (2017). Applied multivariate research: Design and
interpretation (3rd ed.). Los Angeles, CA: Sage.
Myung, J., Martinez, K., & Carnegie Foundation for the Advancement of Teaching. (2013).
Strategies for enhancing the impact of post-observation feedback for teachers. Retrieved
fromhttp://ezproxy.liberty.edu/login?url=http://search.ebscohost.com/login.aspx?direct
=true&db=eric&AN=ED560122&site=ehost-live&scope=site
Nolan, J., Hawkes, B., & Francis, P., (1993). Case studies: Windows onto clinical supervision.
Educational Leadership, 51(2), 52-56.
Oswald, L. M., Wand, G. S., Zhu, S., & Selby, V. (2013). Volunteerism and self-selection bias in
human positron emission tomography neuroimaging research. Brain Imaging and
Behavior, 7(2), 163–176.
Pajak, E. (1993). Approaches to clinical supervision: Alternatives for improving
instruction. Norwood, MA: Christopher-Gordon.
Pajak, E. (2002). Clinical Supervision and Psychological Functions: A New Direction for Theory
and Practice. Journal of Curriculum & Supervision, 17(3), 189.
Patton, K., Parker, M., & Tannehill, D. (2015). Helping teachers help themselves: Professional
development that makes a difference. NASSP Bulletin, 99(1), 26–42.
Payne, Ruby K. (2005) A Framework for Understanding Poverty. Highlands, Texas: aha!
Process.
Pierce, P. R. (1935). The origin and development of the public school principalship. Chicago, IL:
University of Chicago Press.
Peterson, C. H. (1982). A century's growth in teacher evaluation in the United States. New York,
NY: Vantage Press.

98
Pow, J., Wong, M. (2017). Effect of workplace factors in professional teacher development on
the implementation of small class teaching: Journal of Education and Training: 5(8), 68-
76.
Protheroe, N. (2009). Using classroom walkthroughs to improve instruction. Principal, 88(4),
30–34.
Range, B. G., Finch, K., Young, S., & Hvidston, D. J. (2014). Teachers' perceptions based on
tenure status and gender about principals' supervision. International Journal of
Educational Leadership Preparation, 9(1).
Range, B. G., Scherz, S., Holt, C. R., & Young, S. (2011). Supervision and evaluation: The
Wyoming perspective. Educational Assessment, Evaluation and Accountability, 23(3),
243-265.
Rebore, R. (2014). The ethics of educational leadership (2nd ed.) Upper Saddle River, NJ:
Pearson Inc
Reavis, C. A. (1978). Research in review/clinical supervision: A review of the
research. Educational Leadership, 35(7), 580-584.
Reyes-Guerra, D., Pisapia, J., & Mick, A. (2016). The preparation of cognitively agile
principals for turnaround schools: a leadership preparation programme study. School
Leadership & Management, 36(4), 401–418. Retrieved from
http://ezproxy.liberty.edu/login?url=http://search.ebscohost.com/login.aspx?direct=true&
db=eric&AN=EJ1128675&site=ehost-live&scope=site
Rossow, L. and Warner, L. (2000). The principalship: Dimensions of instructional leadership.
Durham, NC: Carolina Academic Press.

99
Roussin, J. L., & Zimmerman, D. P. (2014). Inspire learning, not dread: Create a feedback
culture that leads to improved practice. Journal of Staff Development, 35(6), 36–39.
Sergiovanni, T.J. and Starratt, R.J. (1998), Supervision: A redefinition, 6th ed., McGraw-Hill,
New York, NY
Shaked, H. (2018). Why principals sidestep instructional leadership: The disregarded question of
schools’ primary objective. Journal of School Leadership, 28(4), 517–538. https://doi-
org.ezproxy.liberty.edu/10.1177/105268461802800404
Sheppard, J. D. (2013). Perceptions of teachers and administrators regarding the teacher
evaluation process (Doctoral Dissertation). Retrieved from
https://digitalcommons.georgiasouthern.edu
/cgi/viewcontent.cgi?article=1856&context=etd
Skretta, J. A. (2007). Using walkthroughs to gather data for school improvement. Principal
Leadership, 7(9), 16-23.
Slater, R. (1999). Saving big blue: Leadership lessons and turnaround tactics of IBM’s Lou
Gerstner. New York: McGraw-Hill
Steinberg, M. P., & Kraft, M. A. (2017). The sensitivity of teacher performance ratings to the
design of teacher evaluation systems. Educational Researcher, 46(7), 378–396.
https://doi-org.ezproxy.liberty.edu/10.3102/0013189X17726752
Stronge, J. H. (2012). Teacher effectiveness performance evaluation system: Handbook 2012-
2013. Stronge & Associates Educational Consulting, LLC.
Taber, K. S. (2018). The Use of Cronbach’s Alpha When Developing and Reporting Research
Instruments in Science Education. Research in Science Education, 48(6), 1273–1296.

100
United States Department of Education (2018). Ed data express. Retrieved December 10, 2018
from https://eddataexpress.ed.gov/index.cfm
VanGronigen, B. A.., & Meyers, C. V. (2017). Topics and trends in short-cycle planning: Are
principals leading school turnaround efforts identifying the right priorities? Planning &
Changing, 48(1/2), 26–42.
Vekeman, E., Devos, G., & Valcke, M. (2016). Linking educational leadership styles to the HR
architecture for new teachers in primary education. SpringerPlus, 5(1), 1–19. https://doi-
org.ezproxy.liberty.edu/10.1186/s40064-016-3378-8
Wagoner, R., & O’Hanlon, J. (1968). Teacher attitude toward evaluation. Journal of Teacher
Education, 19, 471–475. Retrieved from.https://files.eric.ed.gov/fulltext/ED013236.pdf
Wahlstrom, K. L., & Louis, K. S. (2008). How teachers experience principal leadership: The
roles of professional community, trust, efficacy, and shared responsibility. Educational
Administration Quarterly, 44(4), 458–495. Retrieved from
http://ezproxy.liberty.edu/login?url=http://search.ebscohost.com/login.aspx?direct=true&
db=eric&AN=EJ809575&site=ehost-live&scope=site
Walsh, R.A. (2014). The walkthrough observation; The elementary principals’ and elementary
teachers’ perceptions of the walkthrough observation tool affect on professional growth.
(Doctoral dissertation). Retrieved from https://knowledge.library.iup.edu
/cgi/viewcontent.cgi?article=1854&context=etd
Warner, R. (2013). Applied statistics: From bivariate through multivariate techniques (2nd ed.).
Thousand Oaks, CA: Sage Publications.
Wei, R., Darling-Hammond, L., Andree, A., Richardson, N., & Orphanos, S. (2009).
Professional learning in the learning profession: A status report on teacher development

101
in the United States and abroad (Technical report). Dallas, TX: National Staff
Development Council. Retrieved from.
https://edpolicy.stanford.edu/sites/default/files/publications/professional-learning
Weisberg, D., Sexton, S., Mulhern, J., & Keeling, D. (2009). The widget effect: Our
national failure to recognize differences in teacher effectiveness. New York: New
Teacher Project.
Whitehurst, G., Chingos, M. M., & Lindquist, K. (2015). Getting classroom observations
right. Education Next, 15(1), 62-68.
Wiley, A., Hembry, T.R., Buckendahl, C.W., Forte, E., Towles, E., Nebelsick-Gullett, L., (2015)
Independent verification of the psychometric validity for the Florida standards
assessment. Alpine Testing Solutions: Orem, UT. Retrieved on June 12, 2018 from
http://www.fldoe.org/core/fileparse.php/5663/urlt/1415TechV4FSA.pdf
Williams, C. Jr. (2011). The impact of block scheduling on student achievement, attendance, and
discipline at the high school level (Doctoral dissertation). Argosy University. Retrieved
from https://files.eric.ed.gov/fulltext/ED528899.pdf
Zepeda, S. J. (2019). Professional development: What works. Routledge.
103
APPENDIX B: VALIDITY TEST WORKSHEET
Name__________________________________ Position________________________________ Years in current position___________________ Highest degree earned________________ Conferring Institution___________________ Please answer the following questions concerning the survey instrument.
Is the survey instrument organized in an appropriate fashion? What could make the organization better?
Part 1 Demographics
1. In the Demographics is there information that is needed that is not currently requested?
2. Is the Demographic section clear and concise?
3. Is there an issue with the validity of any question in part one?
4. Is part one clear and concise as determined by Chapter Three of the APA Manuel. Part 2
1. Is question eight clearly and concisely written?
2. Do you have any validity concerns with question eight?
3. Is question nine clearly and concisely written?
4. Do you have any validity concerns with question nine?
5. Is question ten clearly and concisely written?
6. Do you have any validity concerns with question ten?
7. Is question 11 clearly and concisely written?
8. Do you have any validity concerns with question 11?

104
APPENDIX C: INFORMED CONSENT
CONSENT FORM The Relationship Between the Average Number of Principal Walkthroughs and School
Accountability Grade of Florida High Schools
Liberty University School of Education
You are invited to be in a research study on principal walkthrough practices. The study weeks to determine if there is a predicitive relationship in average number of principal walkthroughs and high school accountability grade. You were selected as a possible participant because you are a high school principal in Florida and evaluate teachers. Please read this form and ask any questions you may have before agreeing to be in the study. Robert Bennett, doctoral candidate in the School of Education at Liberty University, is conducting this study.
1. Background Information: This study attempts to determine a predictive relationship between the mean number of administrative school-wide walkthroughs and school accountability grade.
Procedures: If you agree to be in this study, I would ask you to do the following things:
2. Click the link to survey monkey and answer 10 questions. The estimated time to complete the survey is 10 minutes.
Risks: The risks involved in this study “The risks involved in this study are minimal, which means they are equal to the risks you would encounter in everyday life.” Benefits: Participants should not expect to receive a direct benefit from taking part in this study. Benefits to society include determining if the time invested in walkthroughs translates to academic success. If walkthroughs are not productive, the time could be allocated in a more productive manner. Compensation: Participants will not be compensated for participating in this study. Confidentiality: The records of this study will be kept private. In any sort of report I might publish, I will not include any information that will make it possible to identify a subject. Research records will be stored securely, and only the researcher will have access to the records. I may share the data I collect from you for use in future research studies or with other researchers; if I share the data that I collect about you, I will remove any information that could identify you, if applicable, before I share the data.
• Participants will be assigned a non-identifying number, for example school 36. • Data will be stored on a password locked computer and may be used in future
presentations. After three years, all electronic records will be deleted.

105
• All information will remain confidential Voluntary Nature of the Study: Participation in this study is voluntary. Your decision whether or not to participate will not affect your current or future relations with Liberty University. If you decide to participate, you are free to not answer any question or withdraw at any time. How to Withdraw from the Study: If you choose to withdraw from the study, please contact the researcher at the email address/phone number included in the next paragraph. Should you choose to withdraw, data collected from you, will be destroyed immediately and will not be included in this study. Contacts and Questions: The researcher conducting this study is Robert Bennett. You may ask any questions you have now. If you have questions later, you are encouraged to contact him at [email protected] may also contact the researcher’s faculty chair, John Christopher Bartlett at [email protected]. If you have any questions or concerns regarding this study and would like to talk to someone other than the researcher, you are encouraged to contact the Institutional Review Board, 1971 University Blvd., Green Hall Ste. 2845, Lynchburg, VA 24515 or email at [email protected]. Please notify the researcher if you would like a copy of this information for your records. Statement of Consent: I have read and understood the above information. I have asked questions and have received answers. I consent to participate in the study. ______________________________________________________________________________ Signature of Participant Date ______________________________________________________________________________ Signature of Investigator Date

106
APPENDIX D: SCHOOL WALKTHROUGH SURVEY
Principals: Please click on your selected response for each item.
Part 1 Demographic Questions 1. Including this school year, how many years have you served in your current administrative position? a. 1-5 years b. 6-10 years c. 11 or more years 2. Including this school year, how many years have you served as an administrator in this or any other school district? a. 1-5 years b. 6-10 years c. 11 or more years 3. What would you classify your school as? a. urban b. suburban c. rural 4. In what District is your school? 5. What is the name of your school? 6. How many teachers were on the faculty for the 2017-2018 school year?
Part 2 Questions Regarding the Classroom Walkthrough Process 7. Do you conduct classroom walkthroughs in your school? a. Yes b. No (If “No,” survey concludes) 8. Which of the following statements best describes how you conduct walkthroughs? a. Classroom walkthroughs are mandated by central office administration. b. I complete classroom walkthroughs through my own initiative. c. District mandated and I complete additional walkthroughs 9. How many total walkthroughs were conducted during the 2017-2018 school year? 10. In what form do you usually provide feedback after a classroom walkthrough has been completed? a. Mostly written (email and/or hard copy). b. Mostly verbal (post-observation conference). c. Verbal followed up by written. d. Feedback is not typically provided after conducting classroom walkthroughs.

107
APPENDIX E: INVITATION TO PARTICPATE
Dear Principal
As a graduate student in the School of Education at Liberty University, I am conducting
research as part of the requirements for a Doctor of Education degree. The purpose of my
research is to determine if there is a predictive relationship between the mean number of
administrative school-wide walkthroughs and school accountability grade, and I am writing to
invite you to participate in my study. The study is 10 questions and will take approximately 5
minutes to complete.
To participate, click here https://www.surveymonkey.com/r/CJCKGD6 to complete the survey.
Sincerely,
Robert Bennett
Doctoral Candidate
Liberty University