the relationship between slips, trips and falls and the design and … · 2019-01-23 ·...
TRANSCRIPT

THE RELATIONSHIP BETWEEN SLIPS, TRIPS AND FALLS AND THE DESIGN AND CONSTRUCTION OF BUILDINGS
Funded by Australian Building Codes Board
Joan Ozanne-Smith Jonathon Guy
Mary Kelly Angela Clapperton
Report No. 281
April, 2008

ii MONASH UNIVERSITY ACCIDENT RESEARCH CENTRE

RELATIONSHIP BETWEEN SLIPS, TRIPS & FALLS & THE DESIGN & CONSTRUCTION OF BUILDINGS iii
MONASH UNIVERSITY ACCIDENT RESEARCH CENTRE REPORT DOCUMENTATION PAGE
Report No. Date ISBN ISSN Pages
281 2008 0 7326 2351 0 1835-4815 (online) 223 Title and sub-title: The relationship between slips, trips and falls and the design and construction of buildings Author(s): J. Ozanne-Smith, J. Guy, M. Kelly & A. Clapperton Sponsoring Organisation(s): Australian Building Codes Board Abstract: Aim
Monash University Accident Research Centre was commissioned by the Australian Building Codes Board (ABCB) to undertake a study of the incidence of slips, trips and falls and their relationship to the design and construction of buildings. The objective of this study was to review and analyse Australian fall injury and fatality data and the international scientific literature in order to ascertain whether the existing requirements of the BCA provide an acceptable minimum standard of safety relating to the incidence of slips, trips and falls in buildings for the community.
Methods
Slip, trip and fall injuries were examined across three levels of severity: emergency department presentations (without admission), hospital admissions, and deaths. Through a preliminary analysis of state, national and international data and as identified in similar studies conducted internationally, the most prevalent hazards and harms related to slips, trips and falls and the design and construction of buildings were identified. Accordingly, the literature review focused on the design and construction of stairs and steps, access to and falls from heights, other building features identified as particular hazards such as balconies, verandahs/porches and flooring surfaces, the particular vulnerability of the old and young to these hazards (with an emphasis on aged care and health service areas) and the resultant economic and societal costs of these falls.
An expert panel including the project researchers, ABCB and Federal Government representation, and representation of the building, architectural and design industries and aged care providers was convened and informed the final recommendations of the study.
Results
The major building structural and design components identified as being associated with fall injuries in this study were flooring surfaces, stairs, windows, balconies, verandahs and, indirectly, guttering and roofs in residential settings. As shown by the epidemiological data in this study, many of the victims of fall injuries in buildings are from vulnerable populations, particularly the elderly, the sick and children.
This report contains a review of all relevant literature available for the primary structural and design building components outlined above, a thorough analysis of Australian national injury and fatality data pertaining to falls in buildings, estimates of the economic costs of

iv MONASH UNIVERSITY ACCIDENT RESEARCH CENTRE
these hospitalisations and deaths and wide ranging recommendations for improvements to the Building Code of Australia.
The total average annual frequency of deaths and hospitalisations respectively, for falls in buildings in Australia were 343 and 105,968 for the period July 2002 – June 2005. The estimated annual cost for these deaths was $250 million, and $1.28 billion for hospital admissions, excluding indirect costs.
This compares with 110 deaths and 3,300 injuries in one year in Australia related to fires. As for falls, other factors (such as alcohol and cigarettes in the case of fires) may contribute to the chain of events resulting in fire related injury. Also, while property damage may add to the cost of fires, the research and development investment in fire related injury prevention may be disproportionate to that directed at fall injury prevention.
While changes to building design and construction could prevent many fall injuries, particularly the generic effects of inadequacies in protection against falls from heights and falling onto a hard surface, other factors also contribute to the chain of events that result in injuries falls.
Beyond a categorical analysis, it was beyond the scope of this study to analyse death and hospital data with regard to the details of non-building related trip hazards, for example, the removal of which might have prevented initiation of the fall. Co-morbidities and frailties associated with vulnerable populations probably contributed to a substantial proportion of the falls studied here, or the consequences of the falls. However, it can be argued that these community members are equally entitled to a safe environment as the more physically robust members of society. Accordingly they should be protected by the BCA and innovation in safe building design and construction.
Conclusion
Slips, trips and falls in buildings constitute a large and costly public health problem, which is expected to grow in coming years due to the ageing of the Australian population and the increase in housing density, with associated trends to multi-storey dwellings. Although falls and injuries in buildings may be caused by a combination of factors including the design and construction of buildings, many potential solutions lie with the building industry and its regulators. Others with responsibility include the residential and community aged care sectors, the health sector, Standards makers and those responsible for death and injury data systems and research funding. Given the enormous cost of the problem, investment in effective preventative solutions is imperative.
Key Words: Disclaimer Slip, trip, fall, injury, building This report is disseminated in the interest of
information exchange. The views expressed here are those of the authors, and not necessarily those of Monash University
Reproduction of this page is authorised Monash University Accident Research Centre,
Building 70, Clayton Campus, Victoria, 3800, Australia.Telephone: +61 3 9905 4371, Fax: +61 3 9905 4363

RELATIONSHIP BETWEEN SLIPS, TRIPS & FALLS & THE DESIGN & CONSTRUCTION OF BUILDINGS v
Preface
Project Manager / Team Leader:
Professor Joan Ozanne-Smith
Research Team:
Jonathon Guy
Mary Kelly
Angela Clapperton
This project forms an important first step in understanding the dimensions of the problem and costs of falls in buildings in Australia. The depth and breadth of the research that was achievable was substantially enhanced by the placement of Victorian Public Health Training Scheme Fellow, Ms Mary Kelly at MUARC. Mary worked full time on this project for a total of 4 months, in addition to the originally contracted research team.

vi MONASH UNIVERSITY ACCIDENT RESEARCH CENTRE
Contents
EXECUTIVE SUMMARY ........................................................................................................IX
CHAPTER 1 INTRODUCTION ............................................................................................1 1.0 BACKGROUND .................................................................................................................1 1.1 PROJECT OBJECTIVES ....................................................................................................1 1.2 DEFINITIONS ....................................................................................................................2 1.3 REPORT OVERVIEW........................................................................................................3 1.4 REFERENCES ....................................................................................................................3
CHAPTER 2 METHODS......................................................................................................4 2.0 DATA COLLECTION AND ANALYSIS..........................................................................4 2.1 LITERATURE REVIEW ....................................................................................................4 2.2 HAZARDS AND HARMS RATING SYSTEM.................................................................5 2.3 REFERENCES ....................................................................................................................9 2.4 EXPERT PANEL ..............................................................................................................10
CHAPTER 3 LITERATURE REVIEW: OVERVIEW OF FALLS IN BUILDINGS .............11 3.0 INTRODUCTION .............................................................................................................11 3.1 FALL RELATED HOSPITALISATIONS AND DEATHS IN AUSTRALIA.................11 3.2 INJURY AND FALLS RELATED DEATHS IN AUSTRALIA......................................11 3.3 FALLS AND FALL RELATED INJURIES IN OLDER PERSONS ...............................12 3.4 OTHER IMPORTANT CONSEQUENCES OF FALLS IN OLDER PEOPLE...............13 3.5 COSTS AND CONSEQUENCES ASSOCIATED WITH FALL RELATED INJURY
IN OLDER PERSONS ......................................................................................................15 3.6 BIOMECHANICS AND INJURY ....................................................................................16 3.7 REFERENCES ..................................................................................................................18
CHAPTER 4 FALLS ON AND FROM STAIRS AND STEPS............................................21 4.1 RISK FACTORS ...............................................................................................................21 4.2 PREVENTION ..................................................................................................................23 4.3 REFERENCES ..................................................................................................................26
CHAPTER 5 FALLS FROM HEIGHTS..............................................................................29 5.0 INTRODUCTION .............................................................................................................29 5.1 FALLS FROM LADDERS ...............................................................................................29 5.2 FALLS FROM HEIGHTS: NATURE OF INJURY .........................................................30 5.3 FALLS FROM HEIGHTS IN DOMESTIC BUILDINGS: CIRCUMSTANCES OF
INJURY .............................................................................................................................31 5.4 AGEING............................................................................................................................31 5.5 PREVENTION OF FALLS FROM HEIGHTS IN DOMESTIC BUILDINGS................32 5.6 REMOVAL OF THE NEED TO ACCESS HEIGHTS.....................................................32 5.7 CHILD FALLS FROM HEIGHT......................................................................................32 5.8 REFERENCES ..................................................................................................................39
CHAPTER 6 FALLS IN OLDER PERSONS IN RESIDENTIAL AGED CARE FACILITIES AND HOSPITALS....................................................................43
6.1 INTRODUCTION .............................................................................................................43 6.2 FALLS AND FALL RELATED INJURY IN RESIDENTIAL AGED CARE
FACILITIES ......................................................................................................................44 6.3 FALLS IN HOSPITALS ...................................................................................................45 6.4 BEDS AND BEDRAILS ...................................................................................................48 6.5 FOOTWEAR .....................................................................................................................49 6.6 MENTAL STATUS...........................................................................................................50

RELATIONSHIP BETWEEN SLIPS, TRIPS & FALLS & THE DESIGN & CONSTRUCTION OF BUILDINGS vii
6.7 CONTINENCE AND TOILETING ..................................................................................50 6.8 GAPS IN EVIDENCE.......................................................................................................50 6.9 REFERENCES ..................................................................................................................51
CHAPTER 7 SLIPPING AND SLIP RESISTANCE ...........................................................53 7.1 OVERVIEW......................................................................................................................53 7.2 HUMAN GAIT & COEFFICIENT OF FRICTION..........................................................53 7.3 TRIBOMETERS & RESISTANCE TESTING.................................................................53 7.4 BUILDING CODES & STANDARDS.............................................................................54 7.5 AGE & GENDER..............................................................................................................55 7.6 RECOMMENDATIONS...................................................................................................56 7.7 REFERENCES ..................................................................................................................56
CHAPTER 8 LANDING SURFACES .................................................................................59 8.1 INTRODUCTION .............................................................................................................59 8.2 FLOORING SURFACES..................................................................................................60 8.3 ENERGY ABSORBING FORCE ATTENUATING FLOOR TECHNOLOGY .............60 8.4 REFERENCES ..................................................................................................................61
CHAPTER 9 NATIONAL DATA ON HOSPITALISATION AND DEATHS DUE TO FALLS IN BUILDINGS .................................................................................62
9.1 ANALYSIS OF VICTORIAN DEATHS FROM FALLS OCCURRING IN BUILDINGS: OVERVIEW .............................................................................................68
9.5 RESIDENTIAL AGED CARE FACILITIES: FALL FATALITIES (NURSING HOMES & HOMES FOR THE ELDERLY) ....................................................................81
9.6 HOSPITALS FALL FATALITIES: VICTORIA .............................................................85 9.7 FALLS FROM BEDS FATALITIES: VICTORIA..........................................................87 9.8 FALL RELATED HOSPITAL SEPARATIONS IN AUSTRALIA.................................89 9.9 FALL RELATED HOSPITAL SEPARATIONS OCCURRING IN BUILDINGS..........97 9.10 FALL RELATED HOSPITALISATIONS OCCURRING IN THE HOME ..................106 9.11 FALL RELATED HOSPITAL SEPARATIONS MOST LIKELY OCCURRING ON
STAIRS AND STEPS .....................................................................................................117 9.12 FALL RELATED HOSPITAL SEPARATIONS OCCURRING IN RESIDENTIAL
AGED CARE ..................................................................................................................134 9.13 FALL RELATED HOSPITAL SEPARATIONS OCCURRING IN HEALTH
SERVICE AREAS ..........................................................................................................142 9.14 FALLS FROM BEDS: HOSPITAL SEPARATIONS ...................................................151 9.15 INTRINSIC CONDITION OF INJURED PERSON ......................................................159 9.16 DATA ISSUES................................................................................................................166 9.17 REFERENCES ................................................................................................................168
CHAPTER 10 HOSPITAL TREATMENT COSTS OF FALL INJURIES AND FATALITIES MOST LIKELY OCCURRING IN BUILDINGS, AUSTRALIA, 2002-2005 ............................................................................169
10.1.1 COST PER CASEMIX-ADJUSTED SEPARATION ....................................................169 10.1.2 COST PER CASEMIX-ADJUSTED SEPARATION/COST PER DAY .......................169 10.1.3 AVERAGE COST PER ACUTE PUBLIC HOSPITAL BED PER DAY ......................170 10.2.2 NCIS BUILDING RELATED FALL SLIP, TRIP AND FALL FATALITIES, 2001-
2005 .................................................................................................................................175 10.3 SUMMARY COST OF FALLS IN BUILDINGS ..........................................................179 10.4 REFERENCES ................................................................................................................179
CHAPTER 11 DISCUSSION OF EVIDENCE BASE FROM CURRENT DATA AND SCIENTIFIC LITERATURE ........................................................................180
11.1 OVERVIEW....................................................................................................................180 11.2 DISCUSSION OF PROJECT OBJECTIVES .................................................................180

viii MONASH UNIVERSITY ACCIDENT RESEARCH CENTRE
CHAPTER 12 OUTCOMES FROM EXPERT PANEL.......................................................183 12.1 INTRODUCTION ...........................................................................................................183 12.2 STAIR AND STEP FALLS.............................................................................................183 12.3 SURFACES: IMPACT ABSORPTION, SLIP RESISTANCE.......................................184 12.4 EXPERT PANEL RECOMMENDATIONS FOR IMPROVING SLIP RESISTANCE
AND IMPACT ABSORPTION OF FLOORING ...........................................................185 12.5 FALLS FROM HEIGHTS: WINDOWS, BALCONIES, VERANDAHS ......................185 12.6 EXPERT PANEL RECOMMENDATIONS ON FALLS FROM HEIGHTS:
WINDOWS, BALCONIES, VERANDAHS...................................................................185 12.7 RESIDENTIAL BUILDING MAINTENANCE AND ACCESS TO HEIGHTS...........186 12.8 EXPERT PANEL RECOMMENDATIONS FOR RESIDENTIAL BUILDING
MAINTENANCE AND ACCESS TO HEIGHTS ..........................................................186 12.9 CONCLUSION AND SUMMARY ................................................................................186
CHAPTER 13 RECOMMENDATIONS FOR THE PREVENTION OF SLIPS, TRIPS AND FALLS IN BUILDINGS AND FUTURE RESEARCH .................................188
13.1 INTRODUCTION ...........................................................................................................188 13.2 RECOMMENDATIONS TO THE ABCB AND BUILDING INDUSTRY..................188 13.3 AGED CARE FACILITIES AND HEALTH SERVICE AREAS ..................................189 13.4 DATA RECOMMENDATIONS.....................................................................................190 13.5 RECOMMENDATIONS FOR CONTINUING AND FUTURE RESEARCH ..............190 13.6 RECOMMENDATIONS FOR DISSEMINATION........................................................190 13.7 CONCLUSION................................................................................................................191
APPENDIX 1 RAW ET AL. – “A RISK ASSESSMENT PROCEDURE FOR HEALTH AND SAFETY IN BUILDINGS”..................................................................193
APPENDIX 2 RELEVANT MATTERS AFFECTING LIKELIHOOD AND HARM OUTCOME .................................................................................................197
APPENDIX 3 COMPARISON OF NCIS AND ABS BUILDING FALL FATALITY DATABASES, AUSTRALIA, 2005-2005....................................................201
APPENDIX 4 OVERVIEW OF HOSPITAL ADMITTED FALLS, VICTORIA 1998/9-2004/5.........................................................................................................205
APPENDIX 5 EXPERT PANEL ...........................................................................................223

RELATIONSHIP BETWEEN SLIPS, TRIPS & FALLS & THE DESIGN & CONSTRUCTION OF BUILDINGS ix
EXECUTIVE SUMMARY
INTRODUCTION
Monash University Accident Research Centre was commissioned by the Australian Building Codes Board to undertake a study of the incidence of slips, trips and falls and the design and construction of buildings.
Falls are a neglected but substantial hazard and have long been identified as a major injury problem in the epidemiological data. Globally falls are the 2nd largest cause of unintentional injury death after road traffic injuries, with an estimated 391,000 people dying due to falls annually worldwide, though this figure is probably an under-estimate. In Australia, there are over 500 fatal falls recorded by the Australian Bureau of Statistics every year and over 110,000 hospital admissions for falls in buildings annually nationwide.
This compares with 110 deaths and 3,300 injuries in one year in Australia (Productivity Commission 2006) related to fires. As for falls, other factors (such as alcohol and cigarettes in the case of fires) may contribute to the chain of events resulting in fire related injury. Also, while property damage may add to the cost of fires, the research and development investment in fire related injury prevention may be disproportionate to that directed at fall injury prevention.
Adults over the age of 70 years, and in particular women, have higher mortality rates due to falls than younger people and the increasing incidence of fatality with advancing age is evidenced world wide. In both Australia and the United States, approximately 75% of fall fatalities are aged 65 years and over and falls account for approximately 10.9% of all hospital bed days. These frequencies represent an over-representation by a factor of approximately six for this age group. In Europe, men over 65 years are over-represented in fatality figures by a factor of at least four and women over 65 years by at least a factor of six. In the UK, both men and women over 75 years are shown to be particularly vulnerable, and over-represented in fatalities by a factor of eight and ten respectively. Despite lower mortality rates for falls than adults, children carry the largest fall injury burden with nearly 50% of the total number or disability adjusted life years lost worldwide to falls occurring in children under the age of 15 years.
Specific Objectives
(a) To determine the actual risk contribution of 'slips, trips and falls' in buildings, which are a direct result of any number of relevant factors including:
i. building design; ii. building construction; iii. obstacles not forming part of the structure that create a trip hazard; iv. the presence or absence of surface contaminants (water, oil or grease); v. the intrinsic condition of the person suffering the injury; and vi. the number of persons exposed to each particular hazard.
(b) Ascertain the level of risk in building classes (relevant to the BCA) in order to establish whether the inherent level of risk is acceptable.
(c) Identify and prioritise the incidence, frequency or severity of slips, trips and falls in relation to the design and construction of buildings in Australia.

x MONASH UNIVERSITY ACCIDENT RESEARCH CENTRE
(d) Identify the age group most at risk of incurring injury from slips, trips and falls in buildings in Australia.
(e) Provide information regarding the cost of slips, trips and falls, that would directly support a cost/benefit analysis of any proposed amendments to the BCA resulting from the research.
The major building structural and design components identified as being associated with fall injuries in this study were flooring surfaces, stairs, windows, balconies, verandahs and, indirectly, guttering and roofs in residential settings. As shown by the epidemiological data in this study, many of the victims of fall injuries in buildings are from vulnerable populations, particularly the elderly, the sick and children. This study excluded the construction phase of buildings and intentional injuries.
The intrinsic condition of the person suffering the injury may influence both a higher risk of falling and the severity of the subsequent injury. Similarly step and trip hazards which are unrelated or indirectly related to the building design and construction may contribute to the initiating event leading the fall injury. However, the bottom line is that the injury is caused by landing on a hard surface that does not absorb or attenuate the energy exchange that results in the injury. Building design and construction developments have the potential to prevent many of these fall injuries in vulnerable populations.
RESULTS
Frequency and causes of falls in buildings in Australia
Fall related hospital separations that most likely occurred in buildings account for 59.1% (n = 317,905) of all fall related hospital separations for the period 2002/03 – 2004/05. The average annual frequency for hospitalised falls in buildings over this three year period was 105,968.
The major causes of building fall hospital separations in rank order were:
o Slips, trips and stumbles on the same level (29.2%)
o Other fall on same level (20.6%)
o Fall involving bed (6.6%)
o Fall on and from stairs and steps (6.0%)
o Combined falls from heights (including fall on and from ladder, fall from out of or through building or structure and other fall from one level to another) (5.8%)
o Fall involving chair (3.9%)
The cause of the fall was not specified in 25.2% of hospital separations.
Increases in frequency
Overall, fall injuries in buildings increased by 14.2% over the three year period 2000/01-2004/05.

RELATIONSHIP BETWEEN SLIPS, TRIPS & FALLS & THE DESIGN & CONSTRUCTION OF BUILDINGS xi
Falls coded as “other fall on same level” and stair and step fall injuries displayed the largest proportional increases of fall in buildings separations. The former increased by 25.2% between 2002/03 – 2004/05, and the latter increased by 17.2% across all age groups during the dame period.
Stair and step fall injuries also increased by 22.3% among those aged 65 years and over during this time.
Age
Persons 65 years and over accounted for 73.3% of all hospital separations for falls occurring in buildings, with persons aged 75 years and over accounting for 61.2 % of all hospital separations for falls occurring in buildings.
Those 85 years of age and over accounted for almost 30% of all hospital separations due to falls occurring in buildings nationally between 2002/3 and 2004/05.
Children under 9 years of age account for 5.3% in the home and have the highest proportion of slip, trip and fall injuries sustained in buildings of any broad age group under 65 years.
Gender
Females constituted 64.7% of hospital separations for falls in buildings from 2002/03 to 2004/05, while males accounted for 35.3% of hospital separations over the same period.
Location
The most common place of occurrence (location) was the home, which accounted for 62.0% of separations.
The next most common places of fall occurrence were aged care facilities (16.2 %), health service areas (11.3%), schools (2.9%) and cafés, hotels and restaurants (1.9%).
While slip, trip and fall injuries in all buildings have increased by 14.2% overall between 2002-03 and 2004-05, and home based slip, trip and fall injuries have increased by 16% across all age groups during this period; fall injuries in the home sustained by those aged 65 years and over have increased by 18.5% over the same time.
Hazardous building features and the Building Code of Australia
The most common hazards associated with building construction and design, as identified from the scientific literature and national injury and death data, are:

xii MONASH UNIVERSITY ACCIDENT RESEARCH CENTRE
o The non-attenuating and non-absorptive nature of many residential and institutional floor surfaces, particularly in wet areas and around beds in health service and aged care facilities.
o A lack of a definitive measurement or requirement for slip resistance of flooring surfaces in the Building Code of Australia 2007.
o The wide range of allowed stair riser/going measurements and the often insufficient illumination found in many domestic stairways.
o The lack of regulation for the accessing of heights for the purpose of residential maintenance, and the continuing need to access these heights.
o The BCA allowance of verandahs or projections from buildings of up to 1000mm in height without the provision of a balustrade.
o The BCA provision that window guards are not necessary in domestic settings for windows less than four metres in height.
o The allowance of climbable barriers for balconies, verandahs, porches and stair balustrades located up to four metres above the ground or floor.
o The possible absence of hand rails for stairways in domestic dwellings.
o The possible inadequate height of balustrades to prevent toppling-over in today’s taller population.
Nature of injuries and most frequently injured body regions
Injuries to the hip and lower limb (28.2%) and injuries not specified by body region (27.5%) are most prominent.
Injuries to the shoulder and upper limb constitute 16.1% of included fall separations and head injuries account for 13.4% of fall injuries occurring in buildings.
Fractures accounted for the highest proportion of slip, trip and fall injuries included in the study, totalling 63.1% of all injuries incurred from falls in buildings between 2002-03 and 2004-05.
Fatal falls in buildings
The National Coroners Information System (NCIS) reports 1713 fatalities due to falls in buildings over the five year period 2001-2005, and Australian Bureau of Statistics reports a total of 1832 over this time period. This report’s focus is on the NCIS fatality data as it contains greater detail than the equivalent ABS data.
The NCIS reports that those aged 65 years and over account for 71.3% of all fall fatalities in buildings in Australia.
COST OF SLIPS, TRIPS AND FALLS IN BUILDINGS
The method used for calculating the cost of a hospital bed day in this report is based on the cost per casemix-adjusted separation as used in the Australian Institute of Health and Welfare publication Australian Hospital Statistics and is described in Chapter 10. According to the AIHW Hospital Statistics 2005-2006, the average length of stay for acute

RELATIONSHIP BETWEEN SLIPS, TRIPS & FALLS & THE DESIGN & CONSTRUCTION OF BUILDINGS xiii
public hospital separations is 3.7 days, and the average cost per separation calculated according to the above formula is $3,698.
Given that the average acute public hospital separation cost is $3,698 and the average acute public hospital length of stay is 3.7 days, it has been determined that for the purpose of this analysis $999.46 is the average cost of an acute public hospital bed per day. This is a conservative estimate given that previous Australian studies have assigned values of up $6500 per fall related emergency department attendance for people aged over 65 years (who account for almost 75% hospital bed days) (Hendrie, Hall et al. 2003)
There was a total of 3,386,231 acute public hospital bed days resulting from falls most likely occurring in buildings for the years 2002-2005.
Using the formula described above, and applying a conservative estimate of an average cost per bed day of $999.46, the total acute public hospital expenditure on falls most likely occurring in buildings over this time period is estimated at $3,384,40,435.26 ($3.4 billion).
The average annual cost is $1,128,134,145($1.3billion)
Those aged 65 years and over account for almost 92% of acute public hospital costs per bed day. The total cost of bed days occupied by those in this age group due to falls most likely occurring in buildings is estimated at $3,112,093,561 ($3.1 billion)
Most costly injuries
Hip and thigh fractures
Among separations where injury nature was specified, injuries to the hip and thigh were most prevalent, and generally lead to longer periods of hospitalisation. Across all age groups injuries to the hip and thigh were responsible for a total of 694,544 acute public hospital bed days over the time covered by this analysis at an estimated total cost of $694,168,946.20.
Of all acute public hospital bed days resulting from injuries to the hip and thigh, almost 90% of these are fractures. According to this analysis, the estimated total cost of fractures of the hip and thigh resulting from falls most likely occurring in buildings from 2002-2005 is $622,562,634.50
Most costly injury locations
There was an estimated 1,871,722 accumulated bed days for home fall injury during 2002/03-2004/05. The total estimated cost of home-fall building related separations for this time is $1,870,711,270.00.
Although falls in health service areas constitute 11.2% of building related fall injury, the accumulated acute public hospital bed days required claims a much greater portion of the total health care cost. Falls in health service areas cost an estimated total of $822,874,407.70 for 2002-2005, representing 24.3% of the total cost for building related fall injury separations.
Falls in aged care facilities cost a total $493,905,147.10, representing 14.6% of the total building related fall injury expense for the period included in this analysis.

xiv MONASH UNIVERSITY ACCIDENT RESEARCH CENTRE
Cost of fall fatalities
The current assigned economic value of a life used in this study is $729,727.90. (PWC 2003)
The total estimated cost of fatalities included in the NCIS database of closed coroner’s cases for falls related to buildings from 2001 – 2005 is $1,250,023,892.
Over this time, building fall related fatalities referred to the coroner have increased 24.5% (n = 76). This represents a cost increase of $55,459,320.40.
Males account for 57.6% of building fall related fatalities included in the NCIS for the years 2001-2005. This constitutes a total cost of $720,241,437.30.
Female deaths from building related falls account for 42.4% of these deaths, and a total cost of $529,782,455.40 over this time.
Building fall related fatalities in the home (52.4%) and in hospitals or health service areas (30.9%) were the most costly. The combined cost of all home fall deaths in the period covered here is estimated at $655,295,654.20 and the total cost of all health service and hospital deaths (including nursing homes in this instance) is $386,755,787.00.
RECOMMENDATIONS
Recommendations for stair and step geometry
It is recommended that the ABCB consider narrowing the wide range of geometrical going and riser combinations currently allowed by BCA 2007 for non-spiral stairways from 115 to 190mm for risers and 240mm to 355mm for goings, to a riser/going combination of approximately 178mm x 280mm.
Particular attention should be paid to narrowing the acceptable lower range of measurements for stair goings, as up to 80% of stair and step injuries have been shown in the international literature and national data to occur during descent and insufficiently narrow goings are a major cause of mis-steps during descent.
These recommendations are made with particular relevance to Class 1 and 10 residential buildings as the majority of stair fall injuries and fatalities occur in the home.
Recommendations for the provision, design and optimal height of handrails and balustrades
It is recommended that the BCA be amended to require handrails for stairs in all domestic dwellings.
It is recommended that the ABCB consider raising the minimum stairway handrail height from 865mm as it currently stands in BCA 2007, to a height over 900mm (preferably 910-920mm) as has been shown to be the optimum height for the widest user demographic.
This recommendation is of particular importance considering the rapidly increasing centre of gravity of the Australian population, and the substantial injury and fall prevention benefits shown by previous studies to be provided by correctly positioned handrails.

RELATIONSHIP BETWEEN SLIPS, TRIPS & FALLS & THE DESIGN & CONSTRUCTION OF BUILDINGS xv
The adequacy of current standards, codes and regulations that govern the design and installation of verandah balustrades are particularly deserving of attention in future reviews of the BCA.
Of primary concern is the current BCA regulation that verandahs of less than 1000mm in height do not require a railing or balustrade. As shown in this study, falls from a height of less than one metre (as are the majority of verandah falls in Australia) can have severe injury consequences and are easily preventable through the provision of non-climbable barriers of a sufficient height.
Recommendations for slip resistance of flooring surfaces
It is recommended that the ABCB include a thorough definition of slip resistance in future editions of the BCA, rather than referring to the definition included in Standards Australia Handbook HB 197:2005. This definition should also include factors other than the dry coefficient of friction measurement deemed appropriate by the above Standard and should include other environmental factors that may increase a surface’s slipperiness.
It is recommended that manufacturers and retailers provide comparative information on slip resistance, and the slip resistive properties of different flooring surfaces, to consumers for consideration before purchase.
Alteration of the BCA should be considered to require the installation of slip-resistant surfaces in the internal wet areas and external pedestrian areas of all new homes and renovated homes, and that the Local Government and Shires Associations of NSW initiative, whereby certificates of occupancy are only issued to buildings where all flooring surfaces meet the recommendations on slip resistance of pedestrian surfaces as outlined in the revised Standards Australia Handbook HB 197:2005 is adopted and regulated nationally (Gunatilaka 2005).
Trip hazards
It is recommended that a provision to recess or “rebate” structural trip hazards such as door frames, shower door frames and other structural trip hazards in new or renovated domestic dwellings be considered for future editions of the BCA.
Falls from heights
It is recommended that the ABCB, the building industry, local councils and other stake holders investigate the possibility of limiting or removing the need to attain heights for domestic maintenance purposes. This could potentially be achieved through the provision of features such as hinged gutters and gutter guards, or through the subsidisation of skilled trades’ people for those vulnerable to fall from height injury.
The BCA should consider a provision for the required installation of window guards at second storey height in all domestic dwellings, irrespective of whether they exceed four metres in height. We also note that the current BCA requirement of window guards for heights over four metres offers substantial potential for injury, particularly in comparison with the stringent guard requirements in place for windows of any height opening to provide access to domestic swimming pool areas.
All balcony, stair and verandah balustrades, irrespective of height above ground level, should be of non-climbable design and adequate height to prevent toppling-over.

xvi MONASH UNIVERSITY ACCIDENT RESEARCH CENTRE
Aged Care Facilities and Health Service Areas
Given the high proportion of falls suffered by older persons, and the high proportion of these that occur in aged care facilities, particularly around beds and in bathrooms, the installation of force attenuating surfaces in the immediate vicinity of beds in aged care facilities is recommended.
It is recommended that the Department of Health and Ageing conduct a cost/benefit analysis based on the immediate and ongoing public health burden resulting from bed and bathroom falls in aged care facilities to determine the economic benefit of this suggested installation.
It is recommended that new or renovated aged care facilities feature recessed or “rebated” door frames, shower door frames and other structural trip hazards now present in many facilities.
Data recommendations
Attention is required to case capture for fall related fatalities in both the ABS and NCIS data sets.
It is also recommended that greater consistency be developed between the NCIS and ABS fatality data sets, with particular reference to the very large number of unspecified cause/mechanism and location values found in both datasets.
Measures should be taken by all state and territory Health Departments to improve the quality of hospital admissions data with regard to mechanism, activity and place of occurrence for all fall injuries.
It is recommended that states which collect emergency department injury surveillance data pay greater attention to the collection of accurate narrative data as this would allow easier identification of hazards and faster implementation of targeted prevention strategies.
Recommendations for continuing and future research
It is recommended that the ABCB undertake an in depth study of the building related fall fatality data available through the National Coroners Information System, including both level one and two analyses of all recent (within 5 years) fatal falls in buildings in Australia, and a thorough analysis of the available narrative data and related information for each case.
An in depth follow up study on balcony falls in Australia is suggested to fully explore the mechanism of these falls – including climbing, height and gaps in balustrades and railings.
Research is required to investigate the capacity of new technology flooring (or underlay material) to attenuate the level of energy generated in falls to a level below the fracture threshold for hip fractures. This research would need to select only materials with the capacity to meet other aspects of the BCA with regard to fire, hygiene and other relevant standards.
It is recommended that cost/benefit modelling be done on a range of potential interventions for a range of possible effects.

RELATIONSHIP BETWEEN SLIPS, TRIPS & FALLS & THE DESIGN & CONSTRUCTION OF BUILDINGS xvii
Recommendations for dissemination
It is recommended that an Australasian workshop be held in early 2008 to present the findings of this research to stakeholders and to discuss the implementation of the research recommendations.
That the study report be provided to Standards Australia and its “Safety in House Design” Committee to inform the current preparation of their revised guide.
The research should be published in the scientific literature.
Media releases should be prepared at the time of the workshop or the publication of the results in the scientific literature.
CONCLUSION
Slips, trips and falls in buildings constitute a large and costly public health problem, which is expected to grow in coming years due to the ageing of the Australian population and the increase in housing density, with associated trends to multi-storey dwellings. Although falls and injuries in buildings may be caused by a combination of factors including the design and construction of buildings, many potential solutions lie with the building industry and its regulators. Others with responsibility include the residential and community aged care sectors, the health sector, Standards makers and those responsible for death and injury data systems and research funding.
Given the enormous cost of the problem, investment in effective preventative solutions is imperative.
References
Hendrie, D., S. E. Hall, et al. (2003). Injury in Western Australia: the health system costs of falls in older adults in Western Australia. Perth, Western Australian Government.
Price Waterhouse Coopers, (2003) Victorian Institute of Forensic Medicine: Economic Benefits of the National Coroners Information System (NCIS).


RELATIONSHIP BETWEEN SLIPS, TRIPS & FALLS & THE DESIGN & CONSTRUCTION OF BUILDINGS 1
CHAPTER 1 INTRODUCTION
1.0 BACKGROUND
The economic, societal and personal costs associated with building related injuries are considerable and increasing in rate in some cases. However, in view of the potentially high implementation costs that may result from any change in building regulations, it is important that changes are based on strong evidence, including careful problem definition, and that adequate attention is paid to the development of cost-efficient solutions.
A number of studies have identified slips, trips and falls in buildings as the leading cause of serious injuries related to the design and construction of buildings. (Gunatilaka, Clapperton and Cassell, 2005; Ashe and Ozanne-Smith, 2005; Raw et al, 2000; Raw et al, 2001). This report investigates the relationship between slips, trips and falls and the design and construction of buildings.
A report considered at the 2003 Australian Building Codes Board (ABCB) National Technical Summit indicated that, based on available information, it was not possible to determine the actual contribution to risk by any number of relevant factors, including:
building design (or building component),
obstacles not forming part of the structure,
the presence or absence of surface contaminants,
the intrinsic condition of the person suffering the injury, and
the number of people exposed to each particular hazard
The ABCB commissioned the Monash University Accident Research Centre (MUARC) to investigate these issues. A centre of Monash University, MUARC was established in 1987 in recognition that injury is prevented through scientific methods and a commitment to implement and sustain change.
As Australia’s largest research institute specialising in the study of injury prevention and safety science, MUARC aims to challenge and support citizens, governments and industries to eliminate serious health losses due to injury. The Centre was designated as a World Health Organisation Collaborating Centre for Violence, Injuries and Disabilities in 2005.
This study aims to provide information to assist in determining the actual contribution of these factors.
1.1 PROJECT OBJECTIVES
To ascertain whether existing requirements of the Building Code of Australia (BCA) provide an acceptable minimum standard of safety relating to the incidence of slips, trips and falls in buildings for the community.

2 MONASH UNIVERSITY ACCIDENT RESEARCH CENTRE
Specific Objectives
(f) To determine the actual risk contribution of 'slips, trips and falls' in buildings, which are a direct result of any number of relevant factors including:
i. building design; ii. building construction; iii. obstacles not forming part of the structure that create a trip hazard; iv. the presence or absence of surface contaminants (water, oil or grease); v. the intrinsic condition of the person suffering the injury; and vi. the number of persons exposed to each particular hazard.
(g) Ascertain the level of risk in building classes (relevant to the BCA) in order to establish whether the inherent level of risk is acceptable.
(h) Identify and prioritise the incidence, frequency or severity of slips, trips and falls in relation to the design and construction of buildings in Australia.
(i) Identify the age group most at risk of incurring injury from slips, trips and falls in buildings in Australia.
(j) Provide information regarding the cost of slips, trips and falls, that would directly support a cost/benefit analysis of any proposed amendments to the BCA resulting from the research.
1.2 DEFINITIONS
Fall
A fall is an event which results in a person coming to rest inadvertently on the ground or floor or other lower level (World Health Organization 2005). The term ‘fall’ used in this report includes slips, trips and falls unless otherwise stated.
Injury
An internationally accepted and long standing definition of injury by Haddon is ‘damage to the body caused by (acute) exchanges with environmental energy that are beyond the body’s resilience’ (Ozanne-Smith and Williams 1995).
Classification of fall injuries
Fall-related hospitalisations and deaths analysed for this report are classified using codes from the International Statistical Classification of Diseases and Related Health Problems (ICD 10). The ICD 10-AM is an Australian modification of the international classification of specific conditions and groups of conditions determined by an internationally representative group of experts who advise the World Health Organization, which publishes a complete list periodically (Last 1995).

RELATIONSHIP BETWEEN SLIPS, TRIPS & FALLS & THE DESIGN & CONSTRUCTION OF BUILDINGS 3
1.3 REPORT OVERVIEW
The study methods are described in chapter 2. Chapter 3 provides an overview of fall injury mortality, morbidity and burden globally and in Australia. Burden of disease is commonly described by Disability Adjusted Life Years (DALYs). DALYS are a measure of the burden of disease on a defined population and are claimed to be a valid indicator of population health. DALYs are based on adjustment of life expectancy to allow for long-term disability as estimated from official statistics (Last 1995).
Fall injury biomechanics are also outlined in chapter 3. Subsequent chapters, 4 – 8, review the scientific literature on important aspects of falls in buildings. The most recently available Australian data on fall injuries in buildings is described in chapter 9, supplemented by Victorian data, as an example of state non-fatal data, and where national data is not available, such as longer term trends and non–admitted hospital treated falls. Chapter 10 examines the costs of building fall related injury and fatality and chapter 11 examines the evidence base available from current data and scientific literature on which to base attribution of the contribution of building design and structure to fall injuries. The outcomes of the deliberations of an expert panel and consequent recommendations are discussed in chapter 12, and recommendations for the prevention of slips, trips and falls and future research are found in chapter 13.
1.4 REFERENCES
Ashe, B. and J. Ozanne-Smith (2004). "The home- Making the home aged-proof", Australian Academy of Technological Science and Engineering.
Gunatilaka, A., A. Clapperton, et al. (2005). "Preventing home fall injuries: structural and design issues and solutions." Hazard, Victorian Injury Surveillance Unit: 1-18.
Last, J., Ed. (1995). A dictionary of epidemiology, Oxford, Oxford University Press.
Ozanne-Smith, J. and F. Williams, Eds. (1995). Injury research and prevention: a text, Clayton, Monash University Accident Research Centre.
Raw, G. J., S. M. Cayless, et al. (2000). A risk assessment procedure for health and safety in buildings, Watford, BRE.
Raw, G. J., C. E. Aizelwood, et al. (2001). Building regulation, health and safety. A report concerning the influence on the health and safety of building users of fabric and services controlled or controllable by regulation of buildings. Watford, BRE.
World Health Organization (2005). TEACH-VIP. Geneva, World Health Organisation.

4 MONASH UNIVERSITY ACCIDENT RESEARCH CENTRE
CHAPTER 2 METHODS
2.0 DATA COLLECTION AND ANALYSIS
Slip, trip and fall injuries were examined across three levels of severity: emergency department presentations (without admission), hospital admissions, and deaths. Data analysis for slip, trip and fall injuries in Victoria was conducted using the Victorian Emergency Minimum Dataset (VEMD), which includes all presentations to Victorian public hospitals with twenty-four hour emergency departments, and the Victorian Admitted Episodes Dataset (VAED) which includes all admissions to these hospitals. Admitted cases were excluded from the VEMD datasets to avoid duplication.
Overview VEMD and VAED (ICD 10 AM) data analysis covered the 6-year period 1999/2000-2004/2005. A more detailed analysis was then confined to the most recent 3 year period (2002/3-2004/5) when coding improvements allowed better identification of building related falls.
National deaths data was obtained from the National Coroners Information System for the 5 year period 2001-2005. In order to be consistent with hospital data analysis, detailed analysis covered the 3-year period 2002/3-2004/5.
This MUARC held Victorian data was analysed to determine the overall extent and pattern of slip, trip and fall injury and to determine the possible contribution of building design and construction to these injuries. The final dataset for analysis was determined as the result of an iterative process between MUARC and the ABCB to best represent aspects of buildings that fall within the jurisdiction of the ABCB. Aggregated national slip, trip and fall injury data (covering the same time period as the Victorian data) was obtained from the National Injury Surveillance Unit at Flinders University and analysed comparatively with the Victorian data. National death data was obtained from the National Coroners Information System (NCIS 2001-2005) following ethical approval by the Victorian Department of Justice and the Australian Bureau of Statistics. The presence of intrinsic conditions in the person suffering the injury was investigated for all hospital admitted fall injuries in Victoria for the period 2002/3-2004/5. External names of injury and co-morbidities (including intrinsic factors) were coded according to the ICD-10, with the exception of the VEMD and NCIS data which used comparable, but more detailed data systems.
2.1 LITERATURE REVIEW
Through a preliminary analysis of state, national and international data and as identified in similar studies conducted internationally, the most prevalent hazards and harms related to slips, trips and falls and the design and construction of buildings were identified.
It was determined in consultation with the ABCB that the areas of focus for the literature review would be: all aspects of the design and construction of stairs and steps, access to and falls from heights, other building features identified as particular hazards such as balconies, verandahs/porches and flooring surfaces, the particular vulnerability of the old and young to these hazards (with an emphasis on aged care and health service areas) and the resultant economic and societal costs of the above outlined hazards.

RELATIONSHIP BETWEEN SLIPS, TRIPS & FALLS & THE DESIGN & CONSTRUCTION OF BUILDINGS 5
Extensive keyword, author and journal title searches were conducted across numerous databases including Medline, The Cochrane Library, EMBASE and CINAHL. The full texts of all relevant articles were retrieved and have been reviewed.
2.2 HAZARDS AND HARMS RATING SYSTEM
A proposed rating system, based on British Housing Health and Safety Rating System (HHSRS) Operating Guidance (2004) has been developed to allow assessment of all the main potential housing related hazards. As the range of potential housing hazards have differing characteristics, the Rating System uses a formula to generate a numerical score which allows comparison of the full range of hazards. Whatever the hazard, the higher the score, the greater the risk.
For this formula, weightings have been given to the four Classes of Harm used by the HHSRS, the weightings reflecting the severity of incapacity resulting from the harm. The formula also uses the likelihood of a potentially harmful occurrence expressed as a ratio (eg. 1 in 100), and the spread of possible harm outcomes expressed as a percentage.
This Rating system was originally developed for application to individual home assessments. The intention of the present ABCB/MUARC study was to modify, extend and apply this method to:
a wider range of buildings
populations of buildings
separately factor the estimated contribution of the building design and structure into the safety rating formula (currently contained in the likelihood estimate).
2.2.1 Classes of Harm
The Classes of Harm used for the HHSRS and proposed for this study are based on the top four Classes of Harm as identified in A Risk Assessment Procedure for Health and Safety in Buildings (Raw et al 2000). While this work identified seven Classes of Harm, only the top four are used for the purposes of the HHSRS as these are harms of sufficient severity that they will either prove fatal or require medical attention and, therefore, are likely to be recorded in hospital admissions or GP records. A complete list of harms and their classes, as modified by MUARC for specificity to injury, is at Appendix 1.
Examples of injuries for each of the Classes of Harm
Class 1 -Extreme
Death
Permanent paralysis below the neck
Malignant lung cancer
Permanent loss of consciousness
80% or more burn injuries

6 MONASH UNIVERSITY ACCIDENT RESEARCH CENTRE
Class 2 - Severe
Stroke
Loss of a hand or foot
Serious fractures
Serious burns
Loss of consciousness for days
Class 3 - Serious
Loss of a finger
Malignant but treatable skin cancer
Fractured skull
Severe concussion
Serious puncture wound
Severe burns to hands
Class 4 - Moderate
Occasional severe discomfort.
Chronic skin irritation
Some benign tumours
Broken finger
Slight concussion
Moderate cute to the face or body
Severe bruising to body.
Weightings were given to the four Classes of Harm used by the HRRS, the weightings reflecting the severity of incapacity resulting from the harm. The four Classes of Harm adopted were based on those developed previously by the BRE (Raw et al 2000). The formula also uses the likelihood of a potentially harmful occurrence expressed as a ratio (e.g. 1 in 100), and the spread of possible harm outcomes expressed as a percentage.
MUARC expressed concerns about the list of Harms and their Classes, as these are not standard categories (although such categorizations do exist e.g. the Abbreviated Injury Scale), and they do not appear to have undergone validation. Some of the categories are specific, such as simple fracture of jaw, whereas others are vague, such as serious blisters on face and hands (which could be due to burns or skin disease). There are important omissions such as drowning and near-drowning, and some types of poisoning, though these are not necessarily relevant to the current ABCB/MUARC study.
2.2.2 Likelihood of Occurrence
Causes: - The potential sources of the hazard are discussed to help determine to what extent the contribution to a hazard can be attributed to dwelling features and to human

RELATIONSHIP BETWEEN SLIPS, TRIPS & FALLS & THE DESIGN & CONSTRUCTION OF BUILDINGS 7
behaviour or other factors, such as increased vulnerability due to co-morbidity. This should assist in assessing whether the deficiencies identified could mean that the likelihood or spread of harms deviates from the averages for the particular age and type of dwelling.
Relevant matters affecting likelihood and harm outcome: - A check-list of dwelling features which may affect the likelihood and the severity of the outcome is given. In many cases the same features can affect both the likelihood and the severity of the outcome. Where different dwelling features affect the likelihood and spread of harm outcomes, the lists are given separately. (See Appendix 2)
2.2.3 Hazard Formula & Generating a Hazard Score
Three sets of figures are used to generate a hazard score, these are;
a) a weighting for each Class of Harm reflecting the degree of incapacity to the victim resulting from the occurrence.
b) the likelihood of an occurrence involving a member of a vulnerable group, expressed as a ratio. This information is gathered from a variety of existing data sources, or from individual inspections.
c) the spread of possible harms resulting from an occurrence, expressed by percentage for each of the four Classes of Harm.
Class of Harm & Weighting
Likelihood 1 in
Spread of Harms (%) Product
1 10,000
÷ 1/L x O1 = P1
2 1,000
÷ 1/L x O2 = P2
3 300
÷ 1/L x O3 = P3
4 10
÷ 1/L x O4 = P4
Hazard Score = P1 + P2 + P3 + P4
Example Hazard Rating 1
Assessment of a fall out of a window to ground floor room.
Likelihood - 1 in 18
Spread of harm outcomes
o Class 1 – 0% death judged very unlikely
o Class 2 – 10% chance of serious fractures
o Class 3 – 31.6% chance of severe concussion

8 MONASH UNIVERSITY ACCIDENT RESEARCH CENTRE
o Class 4 – 58.4% chance of severe bruising
Example Hazard Rating – 1
Class of Harm Weighting
Likelihood 1 in
Spread of Harms (%)
Product
1 10,000
÷ 18 x O = 0
2 1,000
÷ 18 x 10 = 556
3 300
÷ 18 x 31.6 = 527
4 10
÷ 18 x 58.4 = 32
Hazard Score = 1,115
Example Hazard Rating 2
Assessment of a fall out of a window to fifth floor room.
Likelihood - 1 in 180
Spread of harm outcomes
o Class 1 – 46.9% chance of death
o Class 2 – 31.6% chance of serious fractures
o Class 3 – 21.5% chance of severe concussion
o Class 4 – 0% severe bruising very unlikely
Example Hazard Rating – 2
Class of Harm Weighting
Likelihood 1 in
Spread of Harms (%)
Product
1 10,000
÷ 180 x 46.9 = 2,606
2 1,000
÷ 180 x 31.6 = 176
3 300
÷ 180 x 21.5 = 36
4 10
÷ 180 x 0 = 0
Hazard Score = 2,817

RELATIONSHIP BETWEEN SLIPS, TRIPS & FALLS & THE DESIGN & CONSTRUCTION OF BUILDINGS 9
2.2.4 The Hazard Bands
The numerical Hazard Score can appear too specific. It can also falsely imply that the score is a precise statement of risk, rather than a representation from the data (or from housing inspections). Hazard Bands have been devised to avoid emphasis on what may appear to be a precise numerical Hazard Score, and also provide a simple means for handling the potentially wide range of scores. There are ten Hazard bands, with Band J being the safest, and Band A being the most dangerous.
Band Hazard Score Range
A
B
C
D
E
F
G
H
I
J
5,000 or more
2,000 to 4,999
1,000 to 1,999
500 to 999
200 to 499
100 to 199
50 to 99
20 to 49
10 to 19
9 or less
2.2.5 In consultation with the ABCB it was decided not to apply the Hazards and Harms rating System in this study for a number of reasons:
(1) The HHSRS scores are not based on standard categorisations (such as ICD) and severity coding systems (such as the Abbreviated Injury Scale).
(2) The HHSRS is designed for application to individual buildings rather than to populations of buildings or mass databases.
2.3 REFERENCES
Office of the Deputy Prime Minister (2006) Housing Health and Safety Rating System: Operating Guidance.
Office of the Deputy Prime Minister (2003) London, Statistical Evidence to Support the Housing Health and Safety Rating System Volume 1 – Project Report.
Raw, G.J., Aizelwood, C.E., & Hamilton, R.M., (2001) Building regulation, health and safety: A report concerning the influence on the health and safety of building users of fabric and services controlled or controllable by regulation of buildings, BRE, Watford, Raw, G.J., Cayless, S.M., Riley, J., Cox, S.J., & Cheyne, A. (2000) A risk assessment procedure for health and safety in buildings, BRE, Watford,

10 MONASH UNIVERSITY ACCIDENT RESEARCH CENTRE
2.4 EXPERT PANEL
The expert panel played an essential role in this project, and met in Melbourne on November 22nd, 2007. The expertise of the panel members (see appendix 4) provided regulatory, industry, architectural and design insights which informed the final recommendations of the study. Membership was decided by the ABCB and MUARC and would be expected to include the project researchers, ABCB representation and Federal Government representation, and representation of the building, architectural and design industries and aged care providers.
The researchers presented and discussed the key findings of the study with the panel, whose suggestions and recommendations are outlined in chapter 12.

RELATIONSHIP BETWEEN SLIPS, TRIPS & FALLS & THE DESIGN & CONSTRUCTION OF BUILDINGS 11
CHAPTER 3 LITERATURE REVIEW: OVERVIEW OF FALLS IN BUILDINGS
3.0 INTRODUCTION
This literature review is presented in a number of sections. This chapter presents background information on falls and fall related injury, and information on biomechanical forces involved in fall injury. For the most part it focuses on falls in general, particularly in those over 65 years of age, and is not specific to falls in buildings. The following chapters review the literature on the major themes identified by the project as important in the relationship between slips, trips and falls and the design and construction of buildings.
3.1 FALL RELATED HOSPITALISATIONS AND DEATHS IN AUSTRALIA
3.1.0 Injury and falls related mortality and morbidity globally
Falls are a neglected but substantial issue and have long been identified as a major injury problem in the epidemiological data. Globally falls are the 2nd largest cause of unintentional injury death after road traffic injuries, with an estimated 391 000 people dying due to falls in 2002 (World Health Organization 2007). High–income countries accounted for a quarter of all fatal falls with Europe and the Western Pacific region combined accounting for nearly 60 percent of the total number of fall-related deaths globally (World Health Organization 2007).
Adults over the age of 70 years, and in particular women, from all areas of the world have higher fall-related mortality rates due to falls than younger people (World Health Organization 2007). The increasing incidence of fatality with advancing age is evidenced world wide and is detailed by Pauls (1991). In the United States, approximately 75 percent of fall fatalities occur to people aged 65 and older (National Safety Council 1989, cited in Pauls 1991), suggesting over-representation by a factor of approximately six. In Europe, men over 65 are over-represented in fatality figures by a factor of at least four and women over 65 by at least a factor of six. In the UK, both men and women over 75 are shown to be particularly vulnerable, and over-represented in fatalities by a factor of eight and ten respectively.
Despite lower mortality rates for falls than adults, children have the largest burden with nearly 50 percent of the total number or disability adjusted life years (DALYs) lost worldwide to falls occurring in children under the age of 15 years (World Health Organization 2007).
3.2 INJURY AND FALLS RELATED DEATHS IN AUSTRALIA
In Australia, 9,924 injury deaths occurred in 2003-2004. Unintentional falls accounted for 30 percent of all community injury deaths during this time (Henley et al. 2007). Many of these fall related fatalities sustained fractures, with 80 percent of falls fatalities in 2003-2004 incurring at least one fracture (2,366 persons) and almost 73 percent (1,716 persons) incurring hip fractures (Henley et al. 2007) (see also chapter 9).

12 MONASH UNIVERSITY ACCIDENT RESEARCH CENTRE
3.2.1 Injury and falls – children in Australia
Injury and poisoning is the leading cause of death and a major cause of disability among Australian children 0-14 years of age (Australian Institute of Health and Welfare 2005). In Australia, 65,651 children aged 0-14 years were hospitalized in 2002-2003 due to injury. The most common external cause of hospitalization for injury in children aged 0-14 years in 2002-2003 was a fall related injury, with a rate of 628.1 per 100,000, with children aged 5-9 years of age having the highest hospitalisation rate for falls at 654.6 per 100,000 (Australian Institute of Health and Welfare 2005).
The injury death rate for Australian children aged 0-14 years for falls was 0.2 per 100,000 in 2001-2003, with 20 children dying due to fall related incidents in this time period (Australian Institute of Health and Welfare 2005).
3.3 FALLS AND FALL RELATED INJURIES IN OLDER PERSONS
Due to a combination of the high rate of fatalities in older persons related to fall injuries and the increasing proportion of older people in the population, further information on the epidemiology of falls and fall related injury follows.
3.3.1 Ageing population
The numbers of fatalities due to fall related injuries in older persons is expected to increase due to rises in the proportion of older persons. The United Nations estimates that by the year 2050 the number of older persons worldwide will for the first time in history exceed the number of younger persons, and that persons aged over 60 years will represent 21 percent of the world population, compared to only 10 percent in the year 2000. (UN, DESA 2002)
At a national level, the Australian Bureau of Statistics (ABS) population data shows that for the year ending June 2004, the number of Australians aged 65 years and over reached 2.6 million (Australian Bureau of Statistics 2004). This figure is projected to rise to between seven and nine million in 2051 (Australian Bureau of Statistics 2004). Whereas older people comprised 13 percent of the Australian population in 2004, the projected proportion by 2051 is 24 percent (Australian Bureau of Statistics 2004).
The number of people aged 85 years and over is projected to increase at a faster rate than those aged over 65 years, with the current population estimated to be at just under 300,000 growing to between 1.6 and 2.7 million people in 2051 (Australian Bureau of Statistics 2005). By 2051 the Australian population is expected to increase to between 25 million and 33 million, with about 44% to 48% being older than 50 years (Australian Bureau of Statistics 2005).
3.3.2 Incidence of falls in older people
Falls occur frequently in older persons. About 30 percent of persons aged 70 years and over living in the community have been found to fall at least once a year with 19% falling more than once (Luukinen et al. 1994; Kendig et al. 1996). The incidence of falls in older people has been found to vary depending on their type of residential accommodation, with those in residential care falling more than older persons in the community (Luukinen et al. 1994).

RELATIONSHIP BETWEEN SLIPS, TRIPS & FALLS & THE DESIGN & CONSTRUCTION OF BUILDINGS 13
3.3.3 Proportion of falls resulting in physical injury in older people
Despite older persons falling frequently, injury does not result from all falls. It has been estimated that between 3 and 10 percent of falls in persons aged 65 years or over living in the community result in serious injury (Gillespie 2004).
Two commonly reported indicators of fall related injury are data on hospitalisations and mortality. This type of data represents the tip of the injury iceberg, the most obvious impact of falls being deaths and is relatively easy to collect (World Health Organization 2005). It is important to take into account that many other injuries from falls do occur and are likely not to be captured in these databases. These fall related injuries will be treated by general practitioners, nurses, family and friends or by the individual themselves.
3.4 OTHER IMPORTANT CONSEQUENCES OF FALLS IN OLDER PEOPLE
It is also important to note that about 90 percent of falls in older people do not result in serious injury (Gillespie 2004). Falls that do not result in injury may have other major consequences though. Many of these falls are not so easily captured by data but may still result in a significant burden for the elderly and for the community.
One of these consequences is known as a ‘fear of falling’. Approximately 30 percent of persons living in the community and aged 65 years or older have a fear of falling (Kendig et al. 1996). Concerns about the risk of falling and the associated avoidance and restriction of activities is suspected as an important psychological variable in the development of physical frailty (Delbaere et al. 2004).
Falls are also a predictor of the likelihood of other events, for example, serious falls in the community are predictive of an increased likelihood of admission to an aged care residential facility in the future (Tinetti 1997).
3.4.1 Deaths and death rates in persons aged 65 years and older
In Australia, 2,735 persons aged 65 years or over died due to an unintentional fall in 2003-2004. This represents a rise in numbers of 17 percent from the 2000-2001 figure (Henley, Kreisfeld et al. 2007). This rise has occurred as a consequence of a rise in the numbers of older Australians and is not due to a rise in death rate. The death rate due to unintentional falls for this age group has fallen by 10 percent from 1997-1998 to 2003-2004 (Henley et al. 2007).
3.4.2 Hospitalisations due to falls in those aged 65 and over
Although only a small number of falls lead to injury, this results in a large number of hospitalisations. In Australia in 2003-2004, 60,497 fall incidents lead to hospitalisations for persons aged 65 years or over. This equates to an age standardised rate of fall injury incidents leading to hospitalisation of 2,295.3 per 100,000 population (Bradley and Harrison 2007). This rate rises strongly from the age of 75 years and peaks in the 90-94 year age group at 9,653.7 fall injury incidents per 100,000 population.

14 MONASH UNIVERSITY ACCIDENT RESEARCH CENTRE
3.4.3 Type of fall related injury in older persons hospitalised
The most common type of fall related injury event requiring hospitalisation of older persons was an injury to the thigh or hip region (33.5 percent). The next largest principal diagnosis was head injuries with 15 percent of hospitalisations recording this type of injury (Bradley and Harrison 2007).
3.4.4 The most common type of fractures sustained
Two-thirds of older persons who are hospitalised due to a fall related injury have sustained at least one fracture (Bradley and Harrison 2007). More woman than men sustained fractures, with 70 percent of women and 58% of men sustaining at least one fracture (Bradley and Harrison 2007).
3.4.5 Fall related hip fractures in older people
Most hip fractures in Australia occur in older age groups, with 91 percent of hip fractures occurring in persons aged 65 and over and 40 percent occurring in those aged 80 and over (Kreisfeld and Newson 2006). The rise in the proportions of hip fractures with age in Australia, is consistent with the exponential increase in incidence rates with aging that is seen in most developed countries (Melton 1996).
Ninety one percent of all hip fractures in Australia in 2002-2003 were associated with falls and 15,177 hospitalisations occurred in this same year in Australia due to fall related fractured hips in the 65 years or greater age group (Kreisfeld and Newson 2006).
For those aged 65 or over, the fall mechanism for 36 percent of fall related hip fractures was recorded as resulting from falling on the same level from slipping, tripping and stumbling. Of those older persons falling and sustaining hip fractures, 5.2 percent were recorded as a fall involving a bed and 3.7 percent were recorded as a fall on and from stairs and steps. Over 18 percent were recorded as other fall on same level and almost 30 percent recording an unspecified fall (Kreisfeld and Newson 2006).
3.4.6 Deaths from fall related hip fractures in older people
Death from hip fractures also occurs mainly in the oldest age groups, with 59 percent in persons aged 85 years and over with 98% of deaths occurring in the 65 years and over age group (Kreisfeld and Newson 2006).
More Australian women died as a consequence of fracturing their hips than men with over 1.7 times as many female cases as male cases, although the rates for women were less than for men with the age adjusted rate for males at 8.0 per 100,000 population compared with 7.6 per 100,000 for females (Kreisfeld and Newson 2006).
Mortality post surgery for hip fracture is high with 18 percent of patients dying within three months of surgery (Freeman et al. 2002), and one in three dying within 12 months of surgery (Keene et al. 1993).
Eighty seven percent of hip fracture deaths were certified by a medical practitioner rather than a coroner. This is in contrast to most other types of injuries where most deaths are certified by the coroner (Kreisfeld and Newson 2006). The way in which hip fracture deaths are treated by coroners in Australia is undergoing change.

RELATIONSHIP BETWEEN SLIPS, TRIPS & FALLS & THE DESIGN & CONSTRUCTION OF BUILDINGS 15
3.4.7 Trends in hip fractures in older people
The number of hip fractures occurring in Australia is rising and is predicted to continue to increase in the coming years, primarily because most hip fractures occur in the elderly and there is predicted to be a substantial rise in the number of persons aged over 85 years as a consequence of our aging population (Sanders et al. 1999). This rise is expected to correspond with a fourfold increase in hip fractures by 2051 from the 1996 level. This prediction assumes stable age and sex specific incidence rates of hip fractures in the elderly. Care needs to be taken with such predictions though as a number of developed countries are now seeing decreases in the incidence rates of hip fractures in older populations (Kannus 2006; Nymark et al. 2006).
It is hypothesised that the available data significantly underestimates the actual extent of hip fracture hospitalisations and deaths in Australia. It has been suggested that because hip fractures occur mainly in the elderly, who also commonly have co-morbidities, deaths associated with fall related hip fractures are classified as being caused by other factors. This may also be the case with hospitalisations (Sanders et al. 1999).
3.4.8 Location of hip fracture events
In Australia in 2002-2003, of the hip fractures in those aged 65 years or over, forty three percent of the incidents occurred in the home and 22 percent of males and 27 percent of females fractured their hip in a residential care facility (Kreisfeld and Newson 2006). Over 9 percent of hip fractures occurred in ‘ a school, other institution and public administrations area and in about 14 percent of cases the incident occurred in an ‘unspecified place of occurrence’ or ‘a place not reported’ (Kreisfeld and Newson 2006).
3.5 COSTS AND CONSEQUENCES ASSOCIATED WITH FALL RELATED INJURY IN OLDER PERSONS
The estimated medical cost of injury from accidental falls in Australia in 1993-94 was $806 million (Mathers, Vos, Stevenson 1999). The total annual lifetime cost of Victorian fall injuries for 1993/94 was estimated at $557 million with the cost for medical treatment alone measured at $270 million (Watson and Ozanne-Smith, 1997). Injuries from falls have many costs to the individual, the health care system and to society in general. These include financial, health, social and economic costs. Health costs include: pre-hospital, hospital transfers, acute care, rehabilitation and or residential care costs.
The large number of hospitalisations of older persons with fall related injury results in significant health service utilisation with fall related hospital admissions accounting for 1,246,214 bed-days or 10.9 percent of all hospital bed days in 2003-2004 for persons aged 65 years or over (Bradley and Harrison 2007).
The cost of fall related acute health care episodes alone in Australia for the fall incidents requiring hospitalization in the 65 and over age group was estimated to be $566 million for 2003-2004. This cost does not include the cost of rehabilitation inpatient care (Bradley and Harrison 2007).
A Western Australian study estimated an average health system cost of $6500 per emergency department attendance in the year 2001/2002 for a fall related injury in those aged 65 or over (Hendrie et al. 2003). The main components of the cost were hospital

16 MONASH UNIVERSITY ACCIDENT RESEARCH CENTRE
inpatient treatment (52%), high-level residential care (9%), hospital outpatient services (8%), ED presentations (6%); and allied health consultations (5%) (Hendrie et al. 2003).
A report for the National Falls Prevention for Older People Initiative predicted the overall health costs associated with falls for people aged 65 and over in Australia would increase 2.7 times between 2003 and 2051 (Moller 2003).
3.5.1 Costs and consequences associated with fall related hip fractures in older persons
Falls related hip fractures impose a heavy cost burden on the community, both in terms of acute care and rehabilitation (Kreisfeld and Newson 2006). Almost all persons who fracture a hip are hospitalised (Keene et al. 1993). The average length of stay for acute care is 10.8 days overall, with the average for those aged 85 and older being 11.2 (Sanders et al. 1999). The average length of stay in rehabilitation is 21 days, with the average length of stay being 22.8 for those aged 85 or older (Sanders et al. 1999).
Consequences of hip fracture may include decreased mobility and the need for increased social support (Keene et al. 1993). In one UK study, of the patients walking unaided prior to the study only 40 percent did so post fracture, with 34% requiring sticks and 23 percent using a walking frame. Twenty eight percent of elderly persons sustaining hip fracture were found to be house bound prior to fracture, rising to 46% after treatment. Fifty four percent of patients were able to do their shopping prior to the fracture with only 33 % able to go shopping 12 months post fracture.
In this same study 80 percent of elderly people who survived a hip fracture were discharged to their own homes and 55 percent of this population remained in their own homes one year later (Keene et al. 1993). That is, less than half of all survivors of hip fracture remained in their own homes one year post fracture.
3.6 BIOMECHANICS AND INJURY
Given that injury results from energy exchange to the human body which is greater than the body’s tolerance, it is essential to understand the thresholds for significant injuries. With this knowledge it is possible to design environments that absorb or attenuate energy to contain it below serious injury thresholds. These principles are applicable to fall injuries and fall related injury prevention interventions.
Hip fractures in older persons are a major cause of fall morbidity and mortality and will be used to demonstrate the biomechanical considerations in injury causation in the following discussion. Biomechanical factors in hip fracture aetiology include:
Bone mass density,
Type of fall,
- direction
- velocity
- height
- point of contact
Fracture forces,
Impact forces,

RELATIONSHIP BETWEEN SLIPS, TRIPS & FALLS & THE DESIGN & CONSTRUCTION OF BUILDINGS 17
Force absorption,
Force attenuation.
3.6.1 Hip fractures in older persons
Hip fractures result from a complex interplay of many factors (Melton 1996). Historically, there was controversy about whether hip fractures were disease or accident-related (Robinovitch et al. 1991), although there was agreement that the two most significant contributors to hip fractures are falls and a reduction in bone density that leads to bone fragility (Meunier 1993).
Type of fall : The likelihood of sustaining a fractured hip from a fall is strongly associated with the type of fall (Marshall and Johnell 1996), with falls in a posterolateral direction more likely to be associated with hip fractures (Nankaku 2005).
Bone mineral density (BMD): The frequency of hip fractures also increases as bone mineral density declines below ‘a densometric fracture threshold in the proximal femur’ (Robinovitch et al. 1991). Loss of bone density is associated with ageing , with men losing an estimated 38 percent and women an estimated 58 percent of their bone density of the femoral neck over a lifetime (Marshall and Johnell 1996) .
Femur fracture forces: When a dynamic load is placed on the bone, much of the kinetic energy must be absorbed by the relatively stiff skeletal structures of the body, resulting in large peak forces which may lead to bone fracture (Maki and Fernie 1990). Through finite element model testing of four femora from two males and two females aged between 55 and 74 years, Keyak (2001) found that for tests conducted to simulate a traumatic fall, the minimum average fracture load was 1.1 kN and the greatest average fracture load was 1.8 kN.
However, a wide range of fracture loads of the proximal femur have been found in various investigations, with fracture thresholds varying from 778 N to 10 kN (Fernandez, PhD Study in-process). Fracture thresholds of older cadaveric femora compiled from experiments in which femora were tested with the shaft at 10° to the horizontal and neck axis internally rotated 15° vary . Under loading rates of 2mm/s average fracture thresholds of 3.5 ± 1.2 kN (73.8 ±7.1 years) and 3.4 ± 1.3 (74 ± 7.4 years) were produced (Courtney et al. 1995).
The two most significant factors, found by fracture threshold investigators, to reduce the average fracture threshold are the direction of the impact and a decrease in bone mineral density. Furthermore, the loading rate of femora plays an important role. Bone is a rate dependant substance that becomes stronger when loaded faster. (Fernandez, PhD Study in-process).
Impact forces: Robinovitch and colleagues predicted persons falling from a height of 0.7m experience peak hip impact forces of between 5600N if falling in a muscle relaxed state and 8600 N if falling in the muscle-active state. Impact forces on falling can be reduced by both soft tissue compression and muscle relaxation (Robinovitch et al. 1991) .
Force attenuation: The peak forces created when an older person falls and their hip contacts/impacts a hard surface can exceed femoral bone fracture thresholds. Courtney and colleagues found that the impact forces on a hip exceeded the strength of the femora in older persons by approximately 50 percent (Courtney et al. 1994). Robinovitch and

18 MONASH UNIVERSITY ACCIDENT RESEARCH CENTRE
colleagues warned that the risk of fracture due to a female falling to the side with a lateral impact on the greater trochanter has the potential to fracture the hip (Robinovitch et al. 1991)
Due to the high impact forces created when older persons fall on their hips and direct contact to the greater trochanter is made, a number of interventions have focused on attenuating impact forces in order to decrease fall related injuries. One of the common interventions used to prevent hip fractures are hip protectors. These are discussed below. Landing surfaces are also important in force attenuation following a fall and are discussed in chapter 8.
The Hip protector: Hip protectors are a fall related injury prevention intervention often used by many acute care and residential care facilities. These devices aim to prevent fractures of the greater trochanter of the femur (Rooij 2006) and consist of either foam padding, a dome shaped hard shell or a combination of both. The hip protector is placed over the greater trochanter and usually secured in a special pocket of an undergarment. Kannus and colleagues have showed that the hard shell hip protectors are significantly more effective that the padding types (Kannus et al 1995).
A Cochrane systematic literature review into the effectiveness of hip protectors found the devices did reduce the incidence of hip fractures in older persons living in nursing or residential care, but there was no evidence for the effectiveness of their use in the community (Parker, Gillespie et al. 2005). A further study by Parker and colleagues updating the Cochrane systematic review suggests that previous findings of reductions in the numbers of hip fractures in elderly persons living in nursing or residential care may have been as a result of bias due to the cluster sampling methods used by a number of the studies (Parker et al. 2006).
Parker and colleagues warned of other problems in clinical studies on hip protectors relating to the numerous types of hip protectors and the compliance and acceptance of hip protectors by study participants, and the effect these two factors may have on interpreting evidence from studies (Parker et al. 2006). Another recent systematic review also stated that evidence on the effectiveness of hip protectors is inconclusive using meta-analysis due to the effects of clustering (Olive et al. 2006). Further research is recommended to identify whether hip protectors are an effective intervention (Parker et al. 2006).
3.7 REFERENCES
Australian Bureau of Statistics (2004), Population by Age and Sex, Australian States and Territories, June Catalogue 3201.0. Canberra: ABS.
Australian Institute of Health and Welfare (2005), A picture of Australia's children. Canberra, Australian Government.
Bradley, C. and J. Harrison (2007). Hospitalisation due to falls in older people, in Australia, 2003-2004. AIHW Injury research and statistics series AIHW. Canberra, Australian Institute of Health and Welfare.
Courtney, A. C., E. F. Wachtel, et al. (1995). "Age-related reductions in the strength of the femur tested in a fall-loading configuration." Journal of Bone & Joint Surgery. 77(3): 387-95.

RELATIONSHIP BETWEEN SLIPS, TRIPS & FALLS & THE DESIGN & CONSTRUCTION OF BUILDINGS 19
Delbaere, K. K., G. G. Crombez, et al. (2004). "Fear-related avoidance of activities, falls and physical frailty. A prospective community-based cohort study." Age and Ageing 33(4): 368-73.
Fernandez, R. (In-process). A novel approach to the prevention of hip fracture: feasibility of a novel fracture-preventing device. Monash University Accident Research Centre. Melbourne, Monash University. PhD.
Freeman, C., C., Todd, C. Camilleri-Ferante, et al. (2002). “Quality improvement for patients with hip fracture: experience from a multi site audit” Quality and safety in health care, 2002 11(3): 239-245.
Gillespie, L. (2004). "Preventing falls in elderly people: we need to target interventions at people most likely to benefit from them." British Medical Journal 328: 653-654.
Hendrie, D., S. E. Hall, et al. (2003). Injury in Western Australia: the health system costs of falls in older adults in Western Australia. Perth, Western Australian Government.
Henley, G., R. Kreisfeld, et al. (2007). Injury deaths in Australia in 2003-2004. Injury research statistics series no. 37, AIHW.
Kannus (2006). "Nationwide decline in incidence of hip fracture." Journal of Bone and Mineral Research 21(12): 1836-8.
Keene, G., M. Parker, et al. (1993). "Mortality and morbidity after hip fractures." British Medical Journal 307: 1248-1250.
Kendig, H., R. Helme, et al. (1996). Health status of older people project: preliminary findings from a survey of the health and lifestyles of older Australians. Melbourne, Victorian Health Promotion Foundation.
Keyak, J., H. Skinner, et al. (2001). "Effect of force direction on femoral fracture load for two types of loading conditions." Journal of Orthopaedic Research 19: 539- 544.
Kreisfeld, R. and R. Newson (2006). "Hip fracture injuries." NISU Briefing 8.
Luukinen, H., K. Koski, et al. (1994). "Incidence rate of falls in an aged population in northern Finland." Journal of Clinical Epidemiology 47(8): 843-850.
Maki and Fernie, B. E. and G. R. Ferni (1990). "Impact attenuation of floor coverings in simulated falling accidents." Applied Ergonomics 21(2): 107 - 114.
Marshall, D. and O. Johnell (1996). "Meta-analysis of how well measures of bone mineral density predict occurence of osteoporotic fractures." British Medical Journal 312(7041): 1254-1259.
Mathers C, Vos T, Stevenson C. (1999) The burden of disease and injury in Australia - summary report, Australian Institute of Health and Welfare.
Melton, L. J. (1996). "Epidemiology of hip fractures: implications of the exponential increase with age." Bone 18(3): 121S-125S.
Meunier, P. (1993). "Prevention of hip fractures." The American Journal of Medicine 95(Suppl 5A): 5A-75S-78S.
Moller, J. (2003). Projected costs of fall related injury to older persons due to demographic change in Australia: Report to the Commonwealth Department of Health and Ageing, under the National Falls Prevention for Older People Initiative.
Nankaku (2005). "Evaluation of hip fracture risk in relation to fall direction." Osteoporosis international 16(11): 1315-20.
20 MONASH UNIVERSITY ACCIDENT RESEARCH CENTRE
Nymark, T., J. Lauritsen, et al. (2006). "Decreasing incidence of hip fracture in the Funen County, Denmark." Acta Orthopaedica 77(1): 109-113.
Oliver, D., J. Connelly, et al. (2006). "Strategies to prevent falls and fractures in hospitals and care homes and effect of cognitive impairment: systematic review and meta-analyses." BMJ 334(7584): 82-87.
Parker, M., W. Gillespie, et al. (2005). "Hip protectors for preventing hip fractors in older people." Cochrane Database of Systematic Reviews(3).
Parker, M., W. Gillespie, et al. (2006). "Effectiveness of hip protectors for preventing hip fractures in elderly people: systematic review." British Medical Journal 332: 571-574.
Pauls, J. (1991). "Safety standards, requirements, and litigation in relation to building use and safety, especially safety from falls involving stairs." Safety Science 14: 125-154.
Robinovitch, S. N., W. C. Hayes, et al. (1991). "Prediction of femoral impact forces in falls on the hip." Journal of Biomechanical Engineering 113: 366-374.
Rooij, S. (2006). "Hip protectors to prevent femoral fracture." British Medical Journal 332: 559-560.
Sanders, K., G. Nicholson, et al. (1999). "Health burden of hip and other fractures in Australia beyone 2000. Projections based on the Geelong Osteoporosis Study." Medical Journal of Australia 170: 467-470.
Tinetti, S. F. P. J. (1997). "Falls, Injuries Due to Falls, and the Risk of Admission to a Nursing Home." The New England Journal of Medicine 337(18): 1279-1284.
United Nations, World Population Ageing: 1950-2050, Report by the Population Division, DESA, to the 2002 World Assembly on Ageing.
Watson W, & Ozanne-Smith, J. The cost of injury to Victoria, Monash University Accident Research Centre, Report No.124, 1997
World Health Organization (2005). TEACH-VIP. Geneva, World Health Organisation.
World Health Organization. (2007). "Injuries and violence prevention." Department of Injury and Violence Prevention, from http://www.who.int/violence_injury_prevention/other_injury/falls/en/index.html.

RELATIONSHIP BETWEEN SLIPS, TRIPS & FALLS & THE DESIGN & CONSTRUCTION OF BUILDINGS 21
CHAPTER 4 FALLS ON AND FROM STAIRS AND STEPS
As shown by Pauls (1998), falls outnumber fire related injuries by one or two orders of magnitude and injuries related to stairways outnumber civilian injuries from fire by a factor of approximately 35. Fall-related injuries have also outnumbered injuries related to motor vehicle accidents in the United States for quite some time (Pauls 1998), and in Australia stair and step fall injuries increased by over 70 percent during the decade 1993/4 to 2002/3 (Gunatilaka et al. 2005). In the U.S., Australia and many other countries, falls have been identified as the leading cause of non-fatal injuries and the second leading cause of spinal cord and brain injuries. In the U.S., for falls involving stairways where the location of the stairway is reported, 85% occur in residential settings. The annual cost of stair related falls in the U.S was estimated by Pauls (1998) to be approximately three times that of the annual stair construction cost. Falls account for over 80 percent of deaths possibly associated with building features, and falls on stairs account for over 60% of slip, trip and fall deaths in buildings. Cayless (2001) and Ragg et al.(2000) have both found that stairway falls also lead to increased mortality post hospital-admission over non-stairway falls, with 35 percent of stairway fall patients dying in hospital, compared to 19% of non-stairway fall patients.
Despite this, there has been minimal regulatory agreement on the design and construction of stairs. Slovic (1989) posits that this is because familiar risks, including pervasive risks in homes such as stairs, cause less dread and subsequently less demand for regulation than do unfamiliar less common risks, such as injury from fire or motor vehicle accidents (Slovic 1989, cited in Pauls 1998).
4.1 RISK FACTORS
4.1.0 Biomechanics
Walking on stairs requires an unusual gait whereby the toe is set down before the heel and involves a high rate of energy expenditure, and several studies have concluded that the risk of major injury per fall on stairs is far greater then that per fall on level surfaces. (Nevitt, Cummings, and Hyde 1991; Honkanen and Smith 1990 cited in Hemenway 1994).
Roys (2001,2002,2004) describes stair geometry in terms of “rise”, “going” and “pitch”. The rise is defined as the vertical distance between two consecutive treads or between a tread and a landing, and is determined from the floor to floor height where the stair is situated. The “going” is the horizontal distance between two consecutive nosings (the part of the tread which overlaps the tread below). The “pitch” is the angle between a line connecting consecutive nosings and the ground. He also asserts that since it is good design to have equally sized steps the floor-to-floor height should be an exact multiple of the rise.
The design, construction and regulation of the stairs present in many single family dwellings are based heavily on tradition, rather than the principals of ergonomics and universal design. Many architects apply a long established rule, first introduced in the 17th century, which states that tread depth should be one step length when walking on a flat surface minus two times the height of the rise (Fitch et al., 1974). This traditional rule is still embedded in many building and fire codes, and Pauls (2002) points out that as a result of this reliance on tradition, “huge parts of our economy, that significantly affect our wellbeing and safety, will be increasingly dysfunctional and not adequately responsive to

22 MONASH UNIVERSITY ACCIDENT RESEARCH CENTRE
individual and social needs”. In experiments testing perceived and actual levels of difficulty among male subject using mechanical stairs, Nagata (1995) found that the traditional formula outlined above cannot be universally relied upon to produce safe tread/rise combinations.
4.1.1.1 Ascent versus descent
In various studies conducted in the U.S. and U.K., between 73 – 80 percent of stair accidents were found to occur during stair descent (Jackson and Cohen 1995; Templer 1989; Roys and Wright 2003) and the primary causes of such accidents during descent were ranked by Templer as follows; Catching the heel on the stair nosing, the foot slipping off the stair nosing, overstepping: missing the step completely, under stepping: locking the heel against the riser, structural failure, and unintentional use: unaware of presence of steps(s).
There is general agreement in the literature that accidents on ascent, and the resulting injuries, tend to be less severe in nature (Templer 1992). This is because the centre of gravity of the user is slightly forward, so that most falls are relatively small and towards the higher steps. Furthermore, as demonstrated by Boulet and colleagues (1989) through the use of computer fall simulation, a fall during descent could potentially cause the stair user to descend a full flight, hitting steps, the balustrade or the wall on route. For these reasons, broken bones and head injuries are far more common when users fall while descending. The consequences of these forward falls, particularly for the elderly who often negotiate stairs at a reduced speed, is summarised by (Smeesters et al. 2001) thus:
“Trips and steps down usually resulted in forward falls, with frontal impacts regardless of gait speed. At fast gait speed, slips and faints also usually resulted in forward falls, with frontal impacts. As gait speed decreased, however, slips usually resulted in sideways or backward falls, with impact on the hip or buttocks, and faints resulted in a greater number of sideways falls, with impact near the hip. Therefore, compared to other disturbances and gait speeds, slipping or fainting while walking slowly was more likely to result in an impact on the hip, suggesting a greater risk for hip fracture. Furthermore, 56% of the impact velocities generated were within one standard deviation of the estimate of the mean impact velocity needed to fracture an elderly femur.”
Through the measurement of the ground reaction force exerted by test subjects stepping on level surfaces, ascending and descending stairs, Stacoff (2005) ascertained that not only are force values exerted during descent approximately 1.49 to 1.6 times the subjects body weight (compared to an exertion of just over one body weight for ascent), but also that step asymmetry increased significantly with steep stair ascent and increased even further with stair descent.
4.1.2 Vulnerable populations
According to Raw et al. (2001) slips, trips and falls on stairs account for 24% of fatal and non-fatal accidents in the home, and children and the elderly are most prone to injurious slip, trip and fall incidents.
4.1.2.1 Age
While the young most often receive cuts and bruises from stair falls in the home environment (Riley, Roys and Cayless 1998), the effect of slips, trips and falls on older

RELATIONSHIP BETWEEN SLIPS, TRIPS & FALLS & THE DESIGN & CONSTRUCTION OF BUILDINGS 23
people is much greater as they often experience injuries such as hip fractures. Similarly, the elderly are much more likely to suffer death or serious injury in falls regardless of the fall level.
While Pauls (1984) found that stairway accidents occurred mostly to young children and to younger adults aged between 21-25 years, the resulting injuries have been found to have a minimal societal and economic impact compared to injuries resulting from stairway falls suffered by older people. According to Raw et al. (2001) people aged over 65 years account for the vast majority of deaths from stairway falls and half of the serious injuries.
4.1.2.2 Physical decline
According to Hemenway et al. (1994) the typical stairway injury victim is an elderly woman who is unmarried and living alone. Due to decreased vision and balance, older people are more prone to falling on stairs, and resultant injuries are often significantly more severe due to the decreased bone density inherent with age. Women tend to have a greater incidence of stairway accidents than men (Templer 1992). This is most likely because women, particularly elderly women, have smaller and less dense bones, which may account for their increased incidence of fracture and stair fall injury. Additionally, anecdotal evidence suggests that the level of exposure to home stairways may be greater for women then men (Hemenway et al. 1994) and greater numbers of women than men live into old age, when stairs are likely to become a hazard (QISU 1992).
4.1.3 Alcohol
Alcohol is shown as a major contributing factor for falls suffered by younger people, and is reported in the literature as being involved in between 55-60% of falls in buildings for those less than fifty years of age in both the U.K. and Australia. (Cayless 2001;Ragg et al., 2000).
Conversely, the contribution of alcohol to stairway falls suffered by older persons is minimal and environmental and design factors play a much larger role in stairway injuries as age increases.
4.2 PREVENTION
Given the increased risk of stairway incident, accident, injury and fatality suffered by older persons as outlined in the literature and detailed above, there has been significant debate as to whether prevention if best achieved through the modification of user behaviour, or the alteration of environmental and design hazards. This debate has substantially affected the way in which design and construction have been regulated. Ulria and Sven (1995) contend that regulatory bodies are often reluctant to address inadequacies in construction and design as “unintentional injuries occurring in the home are regarded as natural consequences of victims’ inappropriate behaviour . . . With this perspective, systematic preventative efforts are not perceived as relevant.” Pauls (1998) laments that the expectation of increased fall prevention through attempted user behaviour modification is flawed in that it requires a consistent and diligent behavioural change, which is impractical and unlikely to occur. Furthermore, Templer (1992) has shown that fault for stair accidents may not necessarily lie with the user as is often claimed, and that the occurrence of stair accidents is increased when certain conditions exist and there is logical proof as to why these conditions are dangerous.

24 MONASH UNIVERSITY ACCIDENT RESEARCH CENTRE
4.2.1 Environmental factors
Haslam et al. (2001) designates environmental factors such as poor conditions of stair surfaces, objects on stairs, risers too high or too low, narrow goings, absent or poorly designed handrails, and poor lighting as a primary cause of stairway accidents, particularly among the “young elderly” (aged 65-74 years). This builds upon the position taken by Jackson and Cohen (1995) who hypothesised as a result of an investigation of forty stairway accidents and the stair safety literature that “the greatest problem with accident stairways is not the individual (i.e. user) or external variables, but dimensional inconsistency inherent in some stairways.” Here, the authors emphasise that modification of existing home stairways and stricter regulation of the construction of new stairways is the most effective preventive measure, and most likely to lead to a reduction in falls and fall injuries. This thesis is reiterated by (Salter et al. 2006) who conclude that “home hazard reduction is effective if targeted at older people with a history of falls and mobility limitations”, and by Tse (2005) who, upon reviewing the available literature regarding home and environmental modifications and falls prevention concluded that “there is some evidence to support the use of environmental modification as a strategy in multidisciplinary/ multifactorial programs targeted to those people with a history of falls.”
4.2.2 Stair design
The dimensional inconsistency prevalent in the design of many stairs (particularly in private dwellings) has been the focus of much analysis and debate for quite some time. Templer et al. (1985) concluded that, based on the analysis of video footage of stair ascent and descent that the safest stairs would have a maximum 15.2 cm (6”) rise and a minimum 27.9 cm (11”) tread. Ward and Randall (1967) recommended a tread of 29.2 cm (11.5”) for males and 26.7 cm (10.5”) for females, and a rise of 17.8 cm (7”) for both males and females from a physiological point of view. Irvine et al. (1990) suggested that the optimum rise was 18.3 cm (7.2”) and the optimum tread was 27.9 – 30.5 cm (11-12”). According to Irvine, these dimensions were acceptable to both males and females, young and old, and subjects of different physique.
These findings were later reasserted by Nagata (1995) who found that in tests with mechanical stairs, subjects experienced the least difficulty around 30cm tread and 18cm rise and that there were no notable differences between young and elderly subjects. Therefore, a tread/rise combination with the lowest degree of difficulty for all groups can be found around a tread depth of 30cm and a rise of 18cm. Perceived difficulty increases gradually as the measurements deviate from this combination.
As a result of much lobbying, as reported by Pauls (2002), the committees responsible for the new United States NFPA Building Code accepted the widely agreed minimum standard described above, the so-called “7-11” stair step geometry in the autumn of 2001 and the standard was mainstreamed and applied to new one and two family dwellings in the U.S. This standard, which has been the U.S. national standard for building usability and accessibility (ANSI A117.1) for decades, now limits risers to a maximum height of 7 inches (178mm) and tread depths to a minimum of 11 inches (280mm), with each measured nosing to nosing (Pauls 2002).
The number of risers in a stairway has been shown to substantially effect the likelihood of an accident occurring. Templer (1992) found that the probability of an accident decreased when the stairways had more than 6 risers. Pauls (1984) affirms this and notes that a

RELATIONSHIP BETWEEN SLIPS, TRIPS & FALLS & THE DESIGN & CONSTRUCTION OF BUILDINGS 25
failure to notice a one or two riser stairway in a user’s path is one of the leading causes of stair accidents.
4.2.3 Handrails
This problem is exacerbated by the lack of handrails in many short stairways with only a few risers. Handrails not only steady the stairway user and serve as a disruptive anchor during falls, but also act as important visual clues to indicate changes in elevation. (Templer 1992, Archea et al., 1979). In addition to this, Templer (1992) found that 70% of the accidents he examined occurred on the top or bottom three steps of a stairway. Nearly 60% of those cases occurred on either the last, or second last step.
According to Maki and Fernie, Barlett and Fernie (1985), the functional role of the handrail is to generate a stabilizing reaction force and moment on the body, and handrail height significantly influences the ability of the rail to generate these forces. Through a series of biomechanical tests involving subjects falling on a specially constructed mock stairway, Maki and Fernie demonstrated that a person falling is able to make contact with a handrail very quickly, within 0.5 seconds, and that once handrail contact is made it is nearly always maintained. Of 192 completed trials, there was only one instance where a subject was unable to maintain a grip on the handrail after it was established. Furthermore, subjects fell (defined as contacting the crash pad placed at the bottom of the stairs) in only 8% of valid tests when a handrail was present and in 54% of tests when a handrail was absent. (Maki and Fernie 1998) Through testing the responses of various age groups to handrail heights at three different stairway pitches (33, 41 and 49 degrees) Maki and Fernie ascertained that the most comfortable handrail height for both young and old was 0.91-0.92m, and that biomechanically the most effective height range across all age groups from 0.91m to 1.02 m.
The importance of proper handrail design and use is reiterated by Ishihara et al. (2002), who found that of 2,800 elderly respondents to a questionnaire concerning stair use, 34.2% reported being saved by a handrail when they nearly fell. The same investigation also found that handrails were particularly effective at preventing falls due to sub-standard illumination of stairwells, the effects of which are often exacerbated in the elderly by vision deterioration.
It is important to note that despite the strong evidence regarding the importance of handrails the Building Code does not require handrails for domestic houses.
4.2.4 Lighting
Lack of proper lighting in stairways has long been of concern. Carson et al. (1978) found that 95% of the residential stairways had illumination levels below 20 foot-candles, the minimum level recommended for stairways by the Illuminating Engineering Society.
4.2.5 Carpeting
The carpeting of stairways has been suggested as a possible means of reducing the severity of injuries resulting from stairway falls, and while thick carpet and underlay may provide some cushioning in the event of a fall, Pauls (1984) asserts that this is counterproductive and ultimately increases the misstep rate. The application of thick external materials such as carpet and padded underlay to stairs results in the loss of tread depth, which is critical to

26 MONASH UNIVERSITY ACCIDENT RESEARCH CENTRE
safe stair negotiation, and the use of these materials make the overstepping of a tread much more likely.
4.3 REFERENCES
Archea, J., B.L. Collins and F.I. Stahl. (1979) Washington D.C., National Bureau of Standards of Building Science Series: 120.
Boulet, J.A.M, Templer, J.A., Hanagud, S.(1989) Computer-based simulation of a human falling on a stairway, Proceedings of the Human Factors Society 33rd Annual Meeting, 1145-1149.
Carson, D.H., Archea, J.C., Margulis, S.T., and Carson, F.E. (1978) Safety on stairs. BSS 108. Washington, D.C., National Bureau of Standards, U.S. Department of Commerce.
Cayless, S. M. (2001). "Slip, trip and fall accidents: Relationship to building features and use of coroners' reports in ascribing cause." Applied Ergonomics 32(2): 155-162.
Courtney, A. C.; Wachtel, E. F.; Myers, E. R.; and Hayes, W. C. (1994) “Effects of loading rate on strength of the proximal femur” Calcified Tissue International, 55(1), 53-8.
Courtney, A. C.; Wachtel, E. F.; Myers, E. R.; and Hayes, W. C., (1995) “Age-related reductions in the strength of the femur tested in a fall-loading configuration”, Journal of Bone & Joint Surgery., 77(3), 387-95.
Fitch, J, Templer, JA, Corcoran, P, (1974) “The dimensions of stairs” Scientific American, No. 231, 82-90.
Ford, C. M.; Keaveny, T. M.; and Hayes, W. C., (1996) “The effect of impact direction on the structural capacity of the proximal femur during falls”, Journal of Bone & Mineral Research, 11(3), 377-83.
Gunatilaka, A., Clapperton, A., Cassell, E. (2005) “Preventing home fall injuries: structural and design issues and solutions” Hazard, 59: 1-17.
Haslam, R.A. Sloane, J., Hill, L.D., Brooke-Wavell, K., Howarth, P. (2001) “What do older people know about safety on stairs?” Aging and Society, 21, 759-776.
Hemenway, D, Solnick, SJ, Koeck, C, Kytir, J, (1994) “The incidence of stairway injuries in Austria.” Accident Analysis and Prevention, Vol. 26, No. 5. 675-679.
Irvine, C.H., Snook, S.H., Sparshatt, J.H. (1990). Stairway risers and treads: Acceptable and preferred dimensions. Applied Ergonomics, 21, 215-225.
Ishihara, K., Nagamachi M., Komatsu K., et al. (2002) Handrails for the elderly: A survey of the need for handrails and experiments to determine the optimal size of staircase handrails, Gerontechnology ;1(3):175-189.
Jackson, P.L., and Cohen H.H., (1995) “An in-depth investigation of 40 stairway accidents and the safety stair literature.” Journal of Safety Research; 26 (3):151-159
Keyak, J. H.; Rossi, S. A.; Jones, K. A.; and Skinner, H. B. (1998) “Prediction of femoral fracture load using automated finite element modelling.” Journal of Biomechanics, 31(2), 125-33.
Lord, S. R., H. B. Menz, et al. (2006). "Home environment risk factors for falls in older people and the efficacy of home modifications." Age and Ageing 35(SUPPL.2): ii55-ii59.

RELATIONSHIP BETWEEN SLIPS, TRIPS & FALLS & THE DESIGN & CONSTRUCTION OF BUILDINGS 27
Maki and Fernie, B.E., Barlett, S.A., Fernie G.R., (1984) “Influence of stairway handrail height on the ability to generate stabilizing forces and moments.” Human Factors; 26:705-714
Maki and Fernie, B.E., Bartlett, S.A., and Fernie, G.R., (1985). “Effect of Stairway Pitch on Optimal Handrail Height.” Human Factors 27(3) 355-359.
Maki and Fernie, B.E, and Fernie, G.R., (1990) “Impact attenuation of floor coverings in simulated falling accidents”, Applied Ergonomics, 21, (2), 107-114.
Maki and Fernie, B.E., Perry S.D., McIlroy W.E., (1998) “Efficacy of Handrails in preventing stairway falls: A new experimental approach.” Safety Science.;28(3):189-206.
Maki and Fernie, B.E., W.E. McIlroy and Fernie, G.R., (2003) Change-in-Support Reactions for Balance Recovery: Control mechanisms, age-related changes, and implications for fall prevention, IEEE Engineering in Medicine and Biology Magazine, March/April, 20-26.
Melton, L.J., (1996) “Epidemiology of Hip Fractures: Implications of the Exponential Increase with Age”, Bone, Vol 18, No.3. Supplement, March, 121S-125S.
Nagata, H. (1995) “Rational index for assessing perceived difficulty while descending stairs with various tread/rise combinations”, Safety Science; 21:37-49.
NAHB Research Centre (1992) Stair Safety: A review of the literature and data concerning stair geometry and other characteristics. Prepared for the U.S. Department of Housing and Urban Development, Upper Marlboro, MD.
Pauls, J. (1991) “Safety standards, requirements, and litigation in relation to building use and safety, especially safety from falls involving stairs.” Safety Science, 14, 125-154.
Pauls, J., (1998) “Benefit-cost analysis and housing affordability: The case of stairway useability, safety, design and related requirements and guidelines for new and existing homes”, Proceedings of the 1998 Pacific Rim Conference of Building Officials, Maui, Hawaii.
Pauls, J. (1984) “Stair Safety: Review of Research”, Proceedings of the International Conference on occupational ergonomics; 171-180.
Pauls, J., (2002) “Safer home stairways: Application of public health policies and research findings to the development of design codes in the USA.” Proceedings of 46th Annual Meeting of the Human Factors and Ergonomics Society, 834-838.
Queensland Injury Surveillance Unit, (1992), Injury Bulletin, No. 10 July 1-3.
Ragg, M., S. Hwang, et al. (2000). "Analysis of serious injuries caused by stairway falls." Emergency Medicine 12(1): 45-49.
Raw, GJ, et al. (2000) A risk Assessment procedure for health and safety in buildings, BRE.
Raw, GJ, et al. (2001) Building regulation, health and safety, BRE.
Riley, J.E., M.S. Roys and S.M. Cayless, (1998) “Initial Assessment of Children’s Ability to Climb Stair Guarding.” J R Social Health, Dec;118 (6):331-337.
Roys, M.S., (2001) “Serious stair injuries can be prevented by improved stair design.” Applied Ergonomics;32:135-139.
Roys, MS. (2002) The effect of changing going on stair. Proceedings of the 6th World Conference on Injury Prevention and Control; Ottawa, Canada.

28 MONASH UNIVERSITY ACCIDENT RESEARCH CENTRE
Roys, M., Wright, M., (2003) “Proprietry nosings for non-domestic stairs”, BRE Information paper 15/03, Office of the Deputy Prime Minister, 1-8.
Roys, MS, (2004) The influence of rise and going combinations on stair safety. Proceedings of the 7th World Conference on Injury Prevention and Safety Promotion; Vienna, Austria.
Salter, A. E., K. M. Khan, M. G. Donaldson et al. (2006) “Community-dwelling seniors who present to the emergency department with a fall do not receive Guideline care and their fall risk profile worsens significantly: a 6-month prospective study” Osteoporosis International, 17 (5) May, 672-683.
Smeesters, C., W. C. Hayes, et al. (2001). "Disturbance type and gait speed affect fall direction and impact location." Journal of Biomechanics 34(3): 309-317.
Stacoff, A, et al. (2005) “Ground reaction forces on stairs: effects of stair inclination and age.” Gait and Posture, 21: 24-38.
Templer, JA, (1992) The Staircase: Studies of hazards, falls and safer designs, Cambridge, MA: MIT Press, 1-185
Templer, J.A., Boulet, J.A.M., Hanagud, S., Hyde, D. (1989) “The soft stair: falls induced by a laboratory stair.” Proceedings of the Human Factors Society 33rd Annual Meeting, 1150-1152.
Tinetti, M, Speechley, M, Ginter, S.F., (1988) “Risk factors for falls among elderly persons living in the community.” New England Journal of Medicine, 319: 1701-1707.
Tse, T, (2005) “The environment and falls prevention: Do environmental modifications make a difference?” Australian Occupational Therapy Journal, 52 (4): 271-281.
Ulria, T., Sven, B. (1995) “Unintentional injuries: attribution, perceived preventability, and social norms”, Journal of Safety Research, Vol.26, No. 2. 63-73.
Ward, J.S. and Randall, P., (1967) “Optimum dimensions for domestic stairways: a preliminary study” Architects Journal, 5:29-34.

RELATIONSHIP BETWEEN SLIPS, TRIPS & FALLS & THE DESIGN & CONSTRUCTION OF BUILDINGS 29
CHAPTER 5 FALLS FROM HEIGHTS
5.0 INTRODUCTION
The majority of falls resulting in injury are from heights of less than one metre. However, falls from heights greater than one metre constitute 9.9 percent of all falls. Of these, approximately 45 percent are sustained in the home environment. In Australia, most of the falls sustained in the home environment occur during leisure activities or work other than working for income. The injuries sustained range from “no detectable injury” to serious head injuries. Of particular concern are the 6.3 percent of fall injuries that involve intra-cranial injuries and the 2.3% with multiple injuries (Mathers 1999).
Although only 10 percent of fall injuries are from heights, these include the majority of severe injuries. Falls from ladders account for a large proportion of the injuries sustained from falls from heights, and internationally falls from ladders rank second only to stairway falls as the most common cause of injurious falls from elevation (Cohen and Lin 1991).
5.1 FALLS FROM LADDERS
Data for ladder fall injury, as reported by the Victorian Injury Surveillance Unit, shows that over a two year period (2002/3-2003/4 for hospital-treated injury), there were 5,004 hospital treated ladder injury cases in the state (Cassell and Clapperton 2006). In 2000-2002 in Victoria, for persons > 5 years, there were 106 unintentional deaths from falls > 1 metre, with 16 of these falls from ladders or scaffolds (Cassell and Clapperton 2006).
Injuries resulting from ladder falls are among the most common injuries sustained in both the home and the workplace, with most injuries arising from the need to use ladders for building access and maintenance. Various international studies have reported that between half and two thirds of all ladder fall injuries are not occupationally related (Björnstig and Johnsson 1992, Faergemann and Larsen 2000, Partridge et al. 1998, Faergemann and Larsen 2001), and Australian studies (Tsipouras et al. 2001, Cassell and Clapperton 2006) have recorded a substantially higher rate of nonoccupational injury of 78 percent and 70% respectively. According to Häkkinen (1998) 1-2 percent of occupational injuries in industrialised countries are related to ladders, approximately one of every 2000 persons belonging to the active working population will have a ladder accident while at work each year and some 70% of the serious ladder accidents occur during installation, maintenance and construction operations. Furthermore, among commonly available consumer products, access equipment such as ladders and scaffolding hold the highest level of risk of accidents (apart from electrical cutting equipment) and result in the longest mean duration of incapacity and the highest resultant medical costs following injury (Hayward 1996). According to Partridge et al. (1998), people injured in a nonoccupational setting are generally more likely to fall due to poor or inappropriate ladder placement based in a lack of training such as that received by those who use ladders in a work environment.
A Danish study characterized the injuries but not the factors contributing to non-occupational falls from ladders and scaffolds (Mathers, Vos et al. 199). Another Danish study reported on the mechanism and severity of ladder falls and found tipping or tilting of the ladder while the person on the ladder leant too far sideways, was the main cause of falling (Faergmann and Larsen 2001). Tsipouras’ (2001) retrospective analysis of medical records was the first published Australian study that addressed falls from ladders. Data was

30 MONASH UNIVERSITY ACCIDENT RESEARCH CENTRE
collected by retrospective analysis of medical records between 1994 and 1997. Of the 163 falls identified, 78 percent were sustained in non-occupational settings and 43% involved ladder instability. Although the study identified a need for strategies to encourage safe ladder use, there were no recommendations for further research aimed at decreasing exposure to ladder use. Another Australian study by Driscoll et al. (2003) investigated fatal injuries resulting from unpaid work at home and found 83% of the deaths were males and that falls from inadequately braced ladders were among the most common causes.
Males account for the vast majority of fall from height injuries (primarily from ladders), in both the home and work environments. Various studies conducted in Australia and internationally have consistently shown that between 81-93% of those presenting to hospital emergency departments for ladder fall related injury are male (O’Sullivan et al. 2004, Tsipouras 2001, Partridge et al. 1998, Faergemann and Larsen 2001, Björnstig and Johnnson 1992, Cassell and Clapperton 2006). A similar consistency can be found among the mean ages of those injuries included in the above studies. O’Sullivan and Partridge both reported a mean age for those seeking treatment of 43 years, Björnstig’s mean age was 42 years, and studies of ladder injuries in Australia by Tsipouras and Cassell reported the mean age of the injured as 48 and 47 years respectively. Faergemann and Larsen (2001), whose study specifically addressed nonoccupational ladder and scaffold injuries, found a mean age of 53 years among their subjects.
5.1.1 Prevention of ladder falls
An Irish study of the patterns and cost of ladder fall morbidity (O'Sullivan et al. 2004), stresses the importance of investment in preventative measures since the injuries resulting from these falls are expensive to health services. Future preventative strategies could include adequate training in the use of ladders, appropriate use of protective gear and maintenance of ladders in good condition. A UK study which assessed safety devices for leaning ladders (Department of Trade and Industry 1999) was instigated due to the high number of serious injuries involving the use of leaning ladders around the home. The study consisted of a market survey of leaning ladder ‘safety’ devices, a product appraisal and the role of consumer education and safety standards. Each ladder tested showed some problems and the authors suggest any information or education about ladder ‘safety’ devices should be linked very closely to general ladder safety. It was also suggested that a General Standard to cover all types of ladder ‘safety’ devices would be necessary to guide manufactures and consumers. Although over the past few decades the design of ladders has improved, safety instructions are still lacking for private use (Department of Trade and Industry 1999).
5.2 FALLS FROM HEIGHTS: NATURE OF INJURY
Extremity fractures are widely reported in the literature as the most common injury arising from falls from heights. However, the specifics of this common finding are quite varied. Some studies have documented the lower extremity as the most commonly injured anatomical region (Lindblad 1988, von Wolf 1989, both cited in O’Sullivan et al. 2004), while others have demonstrated an equal incidence of upper and lower extremity injuries (Muir 1993, Partridge 1998), and others still report the upper extremity as the most injured anatomical region (O’Sullivan et al. 2004).

RELATIONSHIP BETWEEN SLIPS, TRIPS & FALLS & THE DESIGN & CONSTRUCTION OF BUILDINGS 31
5.3 FALLS FROM HEIGHTS IN DOMESTIC BUILDINGS: CIRCUMSTANCES OF INJURY
In 2005, MUARC completed an ecological study using a prospective case series of fifty people sustaining injuries attributable to falls from greater than one metre around domestic dwellings. In the absence of a pre-determined specific hypothesis regarding factors that contribute to falls around homes, an ecological study was deemed the most appropriate research design. Ninety percent of the fallers were males, with the majority of participants (70%) aged from 40-69 years. The most common building type where the fall occurred was the house (78%), followed by garage/carport (12%). The most common domestic activity at the time of the fall was cleaning (24%), with the roof and the spouting or gutter of the roof being most commonly involved.
The study found the most common distance fallen was 2 or 3 metres including 18 (36%) who fell 2 metres and 17 (34%) who fell 3 metres, with the majority, 28 (56%), landing on concrete. One respondent fell 5 metres. The self-reported height of the fall, from the position of the feet to the landing surface, varied between 0.2 and 7.0 m and the mean fall height was 2.0 m. Males fell, on average, from a significantly greater height than females (2.1 vs. 1.3 m, respectively; p=.0005).
The most common method of height attainment was a ladder (82%). A ladder was also the most common structure the respondents fell from (62%), followed by a roof (22%). Roof falls include slipping on wet tiles and falling through plastic sheeting.
Although studies characterizing falls from height around domestic buildings have been conducted, they often include both intentional and unintentional free-fall (Watson and Ozanne–Smith 1997; Mathers and Penm 1999; Mathers, Vos et al. 1999). The MUARC study of domestic falls from heights again reiterated the findings of the Australian and international studies outlined above, and found that 90 percent of the participants were male. The mean age for all respondents in this study was 51 years. By comparison a study of fatal work-related falls from roofs showed a lower mean age of 38.7 years for these victims (Saruda et al. 1995). O’Sullivan et al. (2004) also found the median age for work falls from ladders was 41.5 years.
5.4 AGEING
Accessing, and working from heights, becomes more dangerous with ageing due to reduced flexibility, mobility and reaction time, and poorer balance. The greater average age of those suffering fall from height injuries in domestic, non-work settings, indicates a likely increase in these injuries as the world population continues to age.
Australian government policy encourages older Australians to live independently at home for as long as possible. ABS data for 2002-03 show high rates of home ownership among older people (65 years and older), with outright ownership by far the most common tenure type. (ABS 2005). Maintaining their home, and the need to access heights that such maintenance requires, can place older persons at risk of injury (Ashby, Ozanne-Smith and Fox 2007).

32 MONASH UNIVERSITY ACCIDENT RESEARCH CENTRE
5.5 PREVENTION OF FALLS FROM HEIGHTS IN DOMESTIC BUILDINGS
Where there is a current need to attain a height for domestic and maintenance tasks, the development of interventions such as gutter guards, hinged gutters, and ladder hooks built-in to the building fabric, and fall guards on roofs, warrant further investigation and potential investment.
The implementation of preventative measures as described above are of particular importance for older persons as performing domestic maintenance from heights becomes increasingly dangerous with age as a result of reduced mobility, flexibility and poorer balance and reaction time. This is evidenced by the fact that, in Australia, those aged between 45 and 74 years account for nearly two thirds of ladder fall injury and middle aged to elderly males account for over ninety percent of ladder fall deaths recently recorded in Victoria.
The increased use of registered well-trained trades’ people is also a potential future direction, possibly through subsidized schemes for high risk groups such as older persons.
5.6 REMOVAL OF THE NEED TO ACCESS HEIGHTS
As Cassell and Clapperton (2006) point out, the lack of controls and preventative action on falls while working at height (usually from a ladder) in the home environment, where the majority of fatal and serious fall from height injuries occur, contrasts starkly with the strict work at height regulations recently introduced into Victorian workplaces. This lack of regulation in the home environment, coupled with the difficulties of attempting to regulate the frequency and manner in which heights are accessed for the purpose of domestic maintenance, means that removing or limiting the need to attain heights around homes may be the most effective alternative strategy for reducing the fall associated injury rate, severity and cost.
Over eighty percent of fall from height injuries included in Cassell’s (2006) analysis of Australian hospital separations occurred in a home environment. As demonstrated by Ashby (2007), design solutions to reduce or prevent the need to access heights to while performing home maintenance should also be investigated and potentially regulated to protect the whole community and to provide protection over the lifetime of the design feature, particularly as the greater average age of those suffering fall from height injuries in domestic, non-work settings indicates a likely increase in these injuries as the world population continues to age.
5.7 CHILD FALLS FROM HEIGHT
5.7.1 Introduction
Falls are the leading cause of non-fatal child injury in both Australia and internationally. In Victoria, falls represent 41 percent of all child hospitalisations and 42% of child emergency department presentations, with 12% of these presentations being for falls from a height of one metre or more (Ashby and Corbo 2000). In the United States, Lavelle (1998) found that falls accounted for 55% of childhood injury overall. The annual direct health care cost of child falls in Australia has been estimated as greater than $130 million, and in the United States, where three million children require emergency department treatment for fall related injury each year (AAP 2001) and historically 4 percent of child

RELATIONSHIP BETWEEN SLIPS, TRIPS & FALLS & THE DESIGN & CONSTRUCTION OF BUILDINGS 33
deaths were attributed to falls (Bergner et al. 1971), the annual cost of these injuries in Australia is estimated at close to $1 billion (McClure et al. 2005).
5.7.2 Falls from height
5.7.2.1 High falls
Falls from heights are generally regarded as those over one metre, and this is also the basis for the International Classification of Disease categorization of falls. Previous studies conducted both internationally and in Australia, show a high level of consistency regarding the gender breakdown among children sustaining serious injuries as a result of falls from heights. Injuries to male children are shown in the literature to outnumber those to female children by ratios of 1.5:1 to 2:1. (AAP 2001, Lehman 1993, Barker 2004, Bergner 1971, Benoit 2000, Musemeche 1991). In a thorough analysis of age and gender distribution and injury trends, the AAP (2001) found the age distribution of child high fall injuries to be bimodal; pre-school children usually fall from windows, and older boys fall from dangerous play areas, such as rooftops and fire escapes (AAP 2001).
There is also substantial agreement in the literature regarding the mean age of children injured as a result of a fall from height. Benoit et al. (2000) found 83% of all children injured in this way were less than or equal to 4 years of age, and the AAP found an average age of five years among children included in their study, as did Musemeche et al. (1991) and Balut et al. (2002). Although, in contrast to the above, Istre et al. (2003) and Bergener et al. (1971) have both found the mean age of injured children to be between two and three years, and the overall highest rate of paediatric injury to occur in children 0-4 years.
Morbidity from these injuries is significant, in Lehman’s study (1993) two thirds of children experienced at least one fracture and more than 30 percent of the children were admitted to the intensive care unit. Istre et al. (2003) recorded a 40% admission rate.
Although Barlow et al. (2004) found no correlation between the age of the injured and the likelihood of survival, various studies (AAP 2001, Demetriades 2005) have shown that children younger than three years are much less likely to incur serious injuries than older children who fall the same distance. Furthermore, the AAP (2001) contends that because younger children have more fat and cartilage and less muscle mass than older children, their bodies are better able to dissipate the energy transferred by the fall. This contention is supported by the increased incidence of spinal injury resulting from falls among older children. Demetriades (2005) found that in children and young adults who experienced a fall, spinal injuries increased more than six times after the age of 15 years. In this study, age was a major factor in determining the incidence of spinal trauma. According to Demetriades, the anatomy of the paediatric spine provides much better protection during major deceleration injuries than in older victims. However, this pattern of injury could also be due to greater exposure to higher energy exchanges.
Most published studies on high falls have also found great consistency in regards to the distance fallen by injured children. Both Lallier et al. (1999) and Musemeche et al. (1991) found that precisely 78 percent of injured children fell from a height of two stories (approximately 20 feet) or less, Istre (2003) found that 75% of injured children fell from the second story, and Lehman (1993) and Benoit (2000) both found that over 70% of children injured by falls fell from this height. Bertocci’s (2004) study on the impact of fall height and impact surface on the severity of injury reiterates the findings of several previous studies and asserts that since fall height influences free fall biomechanics it would

34 MONASH UNIVERSITY ACCIDENT RESEARCH CENTRE
therefore impact on injury risk. Stone et al. (2000) dispute this and found no correlation between fall height and severity of injury in a study of all recorded paediatric falls from windows in suburban/semi-rural Hamilton County, Ohio.
The most frequently incurred injuries to children from high falls are intracranial injury and fractures. In Barker’s (2004) analysis of Queensland data greater than 57 percent of child injuries presenting to hospital following falls from windows and balconies resulted in intracranial injury, and in an eight year retrospective study of paediatric window falls, Beniot (2000) found that 66% of recorded injuries were to the head. According to Park (2004) falls account for more than 35% of the total number of child head injuries. However, Barlow et al. (1983) found fractures exceeded head injuries as the most common injury. Numerous studies (Barlow et al. 1983, AAP 2001) have found that children who fall from three or less stories have a much greater chance of survival. Barlow et al. (1983) found that all children who fell three stories or less survived, and that mortality increased exponentially to 50 percent at a fall from between the fifth and sixth floors. In this New York City based study, the majority of included falls were from high rise public housing and the overall mortality rate was 23 percent.
As shown by Bertocci et al. (2004), the surface onto which a child falls greatly impacts the level of morbidity and possible mortality. As most of the U.S. studies discussed above focus on high level child falls in urban environments such as New York City and Chicago, the most common impact surface is concrete, which results in a much greater incidence of both fractures and head injury. Surfaces such as grass and garden beds, more often found in suburban, semi-rural and rural environments, offer increased protection in the instance of a fall and the positioning of these materials below windows and balconies can greatly reduce the severity of injuries resultant from potential falls.
The seasonal distribution of child fall injury is described by Bergener (1971) as “the most striking epidemiological characteristic of this problem.” The cases in his study of child falls in New York City were almost exclusively limited to the northern hemisphere’s warmest months from the end of May to mid-September. Furthermore, he found that during the hottest months (June to August) child fall from height deaths account for 29% of the accidental deaths in ages 0-14 and 42% of the accidental deaths in the 0-4 age group. These findings were reiterated by Lehman and Schonfeld (1993) who found that even in the relatively milder climate of Ohio, only 9% of injuries of this kind occurred during the cooler months of December through to February.
Similarly, various studies display uniformity in terms of the most common times of day for paediatric fall injury to occur. Both Istre et al. (2003) and Lehman and Schonfled (1993) found that falls from windows and balconies are clustered around meal times. Istre found that 17% of falls occurred between 11am and 2pm, and 34% occurred between 4pm and 8pm, while Lehman found that 23% occurred between 11am and 2pm and 40% between 4pm and 8pm. The most likely reason for the concentration of incidents at these times is that the parent or supervising adult is distracted by meal preparation and consequently less attentive or less aware of dangerous behaviour.
5.7.2.2 Balconies & Balustrades
In Australia, where high density multi-level housing has historically been less prevalent than in the United States and Europe, the most common mechanism for children falling from height is a fall from the balcony of a two story single family dwelling. In a study of paediatric high falls in Queensland between 1998 and 2002, Barker (2004) found that falls from balconies accounted for nearly 72% of balcony and window falls from height, and

RELATIONSHIP BETWEEN SLIPS, TRIPS & FALLS & THE DESIGN & CONSTRUCTION OF BUILDINGS 35
that combined these two mechanisms accounted for over 8% of all child falls from over one metre resulting in emergency department presentation in Queensland. Furthermore, Barker found the peak age for balcony or window falls to be younger than that recorded internationally for all child falls from heights, at 12-36 months with the majority (40%) of falls occurring at age 12-24 months. These falls most often resulted in intracranial injury (52%), followed in frequency by fractures (18%) and superficial injuries (15%).
Istre et al. (2003) found that most balcony falls occur as a result of a child slipping between the balcony rails, rather than climbing over the top of the railing. This finding is supported by the AAP (2001) who state that “widely spaced rails are ineffective barriers because they permit a child’s body to slip through. Virtually all children younger than 6 years can slip through a 6 inch [15.2cm] opening, and none older than 1 year can pass through a 4 inch [10.2 cm] opening.” As a result of these findings all three regional building code organisations in the U.S. have now adopted the minimum four inch spacing requirement for horizontal balcony members, although these horizontal bars are potentially climbable and generally not be to recommended. The AAP has now sought to encourage all local building codes in the U.S. dealing with new construction to conform with the national codes that currently recommend 4 inch openings between vertical (not horizontal) bars.
According to Barker (2004), the U.S. emphasis on the horizontal dimensions of balcony railings neglects the issue of children climbing the railings and toppling over the top. The narrative text descriptions analysed in QISU’s Australian study indicated that the majority of children injured in balcony falls were climbing on a balustrade railing just prior to falling, and that adjacent structures (such as furniture) were often used to gain access to the top of the railing. (Barker 2004) The Victorian Injury Surveillance Unit has reiterated the prevalence of this hazard and has recommended that balustrades should be specifically designed to prevent climbing, with vertical rather than horizontal railings, and that their height should exceed the centre of gravity of the average adult (approximately 1100mm) (Ashby 2000).
The 2007 Building Code of Australia requires that a continuous balustrade must be provided alongside all horizontal walkways that are more than 1,000 mm above the level below. This specification has seen little revision since the first uniform BCA was introduced in 1988 and does not fully address the changing safety requirements brought about by the trend in Australia towards the construction of larger multi-level single family dwellings. Section 3.9.2.3 (e) of the BCA states that “for floors more than 4 m above the surface beneath, any horizontal elements within the balustrade or other barriers between 150 mm and 760 mm above the floor must not facilitate climbing” (BCA 2007). The code does not specify what should be done to prevent climbing and does not detail any minimum construction requirement beyond the above. Additionally, as is pointed out by Barker (2004), the only Australian Standard which refers specifically to balcony safety (AS 1170-2002) is concerned only with the load bearing facility of balcony structures and makes no mention of impeding the climbability of balustrades or of the spacing of balcony railings. There is no Australian Standard for high structures, such as balconies, that specifically addresses child safety. Although AS-4226 1994 recommends that barriers alongside any walkway more than one metre above the level below should be no less than 900mm and no more than 1,100 in height (Caruana 2006) and the BCA does specify limitations in the acceptable width of balustrade members for balconies more than one metre from the ground, the recommended limitations on the climbability of balustrade members only become applicable once a balcony is higher than four metres from the level below.

36 MONASH UNIVERSITY ACCIDENT RESEARCH CENTRE
The BCA specifies that for balustrades on balconies greater than 1 metre off the ground, any members (vertical or horizontal) should not permit a 125mm sphere to pass between them. While this prevents children from slipping through balustrade members and falling, a horizontal gap of this size does little to discourage climbing. This problem is further exacerbated by design trends which favour the use of horizontal tension wires on the verandahs and balconies of modern homes. These wires, which are typically spaced 85 to 100mm apart, form an easily climbable ladder for toddlers, who are typically “top heavy” and have a tendency to topple head first once on top of a railing (Barker 2004).
While most building codes, both in Australia and internationally, require a maximum gap between horizontal balcony railings, a great deal of older housing stock is not subject to these regulations. For example, in Istre’s (2003) study of child balcony falls, none of the inspected railings at fall sites met the regulatory requirement of a maximum gap of four inches (10 cm), and the mean distance between railings was 7.5 inches (19 cm).
5.7.2.3 Verandahs
The BCA 2007 defines a verandah as “a permanent, roofed projection from a building, designed to be walked, stood or sat on” (BCA 2007). Currently, the BCA does not require railings or balustrades to be present for a verandah of less than one metre in height. The Code states that “a continuous balustrade or other barrier must be provided along the side of any roof to which public access is provided, any stairway or ramp, any floor, corridor, hallway, balcony, verandah, mezzanine, access bridge or the like and along the side path of any access to a building , if – (i) it is not bounded by a wall; and (ii) its level above the surface, is more than – (A) 4 m where it is possible for person to fall through a openable window, or (B) 1 m in any other case”(BCA 2007)
Despite this provision in the BCA, a large proportion of verandahs in Australian houses have been shown to have either no railings, railings of an insufficient height to prevent falls or easily climbable gaps between members. In a longitudinal cohort study involving 871 families and family homes, Turner et al. (2006) found that 37% of homes across all socio-economic status’ had balconies or verandahs above the ground with balustrades less than one metre high, and 48% of vertical balustrades had less than 100mm between vertical rails (Turner et al. 2006).
Furthermore, this minimum height at which a balustrade must be provisioned appears to have been relaxed from previous editions of the BCA, where a balustrade or railing was required at a height of 600mm.
As falls are classified as low or high level for triage purposes, a low-level fall code often dictates less urgency from hospital staff than a fall coded as high-level. This classification scheme has important implications, particularly for pediatric emergency care (Wang et al. 2001). It is currently difficult to ascertain the extent and severity of verandah fall injuries due to this vague nature of emergency department coding. However, In 2006 ICD-10-AM external cause codes were expanded to include the cause “Fall from, out of or through building or structure” with the specific sub-cause “Fall from or through balcony or verandah” (NISU 2006). This expansion of the generic fall code will allow for greater specificity in the future identification of the nature and location of injurious falls.
Due to the abovementioned current data constraints, it is difficult to ascertain the exact frequency of hospital presentation and admission for verandah falls in Australia. MUARC conducted an analysis of Victorian Emergency Minimum Dataset presentation text narratives between 2001 and 2006. This analysis reveals a total of 948 narratives where a

RELATIONSHIP BETWEEN SLIPS, TRIPS & FALLS & THE DESIGN & CONSTRUCTION OF BUILDINGS 37
fall from a verandah, patio, porch or household decking was specifically mentioned in the text description. Unlike other fall related injury, these falls do not see a substantial increase in frequency with advanced age and also unlike other fall injury categories such as falls from stairs and falls in the home, females do not constitute a large majority of verandah falls. This is likely an indication that the intrinsic health status of the injured person is not a primary determinant of the likelihood of injury. Intracranial injuries and lower limb fractures dominate among these injuries and the overall incidence of verandahs, porches, deckings and patios recorded in VEMD text narrative descriptions has increased by over eighty three percent over the five years included in this analysis. Additionally, sixty four percent of these verandah injuries are coded as falls from a height of less than one metre above ground level.
According to Hellinget al. (1999), low falls can cause significant injuries, particularly and most commonly to the head and spine. Additionally, there is a danger that patients injured in low falls might not be taken to hospital based on the mechanism of injury alone. It has been shown that many low fall patients sustain serious multisystem injuries, even though they are initially stable (Helling et al. 1999) and intracranial injury has been demonstrated as a major source of fall-related death in children and has been shown to be sustained with equal frequency from low-and high-level falls among child populations (Kim et al. 2000). Similarly, in a study of head injury from both low and high-level falls in pre-school children, Park, Cho and Oh (2004) identified sixty-eight cases among which falls accounted for 35.2% of head injuries. There were more boys than girls, and more low-level falls than high-level falls, particularly in the age group 0-3 years. Although more common in high level falls, significant intracranial injuries were also sustained from low-level falls. Calvarial fractures were the most frequent type of head injury and were more common in low level falls than high level falls (Park, Cho and Oh 2004).
Although intracranial injury accounts for the majority of deaths from both high and low level falls, Wang et al. (2001) found that children who suffered low-level falls were at similar risk for intracranial and abdominal injuries compared with those who fell from greater heights. This finding is supported by Murray et al. (2000) who found that “skull fractures were the most frequent injury and were associated with an increase in intracranial injuries in both subgroups. In conclusion low-level falls are associated with significant intracranial injuries. The evaluation of patients sustaining low-level falls should not be limited on the basis of the height of the fall.” (Murray et al. 2000)
The adequacy of current standards, codes and regulations that govern the design and installation of verandah balustrades are deserving of attention in future reviews of the BCA. Of particular concern is the current BCA regulation that verandahs of less than one metre in height do not require a railing or balustrade. As shown above, falls from a height of less than one metre (as are the majority of verandah falls in Australia) can have severe injury consequences and are easily preventable through the provision of non-climbable barriers of a sufficient height.
5.7 2.4 Windows
Istre et al. (2003) in the United States, found that 59 percent of child falls from windows were from bedroom windows and 41% occurred from windows in living rooms. Surprisingly, most falls were from low lying windows within two feet of the floor and not from climbed furniture out of higher windows as was expected. In 76 percent of window fall cases in Istre’s study, a screen was present but detached or broke as the child fell, and in none of the cases was a window guard installed.

38 MONASH UNIVERSITY ACCIDENT RESEARCH CENTRE
There is a great deal of contention regarding the effectiveness of using window screens and guards for the purpose of fall prevention. Most window screens, although easily removable to allow for egress during fires, do not provide a sufficient barrier to prevent falls. Security devices such as fixed window bars, designed to keep intruders out, can also greatly hinder egress or access by fire-fighters in an emergency. The AAP recommends the use of operable guards for windows that can be released or removed without the need for a key or the use of excessive force. Examples of the novel designs of the guards recommended by the AAP include built in bars that appear automatically as the window is raised, guards on a hinge that swing when a pin is released, and a slide out model that requires the simultaneous depression of two pins for removal (AAP 2001).
The “Children Can’t Fly” program, initiated by the New York City Department of Health in 1972, after a four year study of child mortality demonstrated that falls from heights represented 12 percent of all accidental deaths in children under 15 in NYC (Barlow et al. 1983). The success of the program, which resulted in the NYC Board of Health amending the Health Code to stipulate that all landlords must provide window guards in apartments where children 10 years old and younger live, was the first of its kind in the U.S. and resulted in a citywide 96 percent decrease in accidental falls through windows from 1972 to 1979, the year in which all landlords were required to fully comply with the window guard regulations (Barlow et al. 1983). There were four basic components of the study and subsequent public campaign:
1) Reporting of falls by hospital emergency rooms and police precincts, followed up by counselling, referral, and data collecting by public health nurses;
2) A media campaign to inform the public and elevate their awareness of the hazards;
3) Community education for prevention through door-to-door hazard identification, counselling by outreach workers, community organisation efforts with schools, tenant groups, clinics, churches, health care providers etc;
4) Provision of free, easily installed window guards to families with young children living in high-risk areas.
In total, more than 16,000 free window guards were provided to approximately 4,200 families each year of the program, with distribution guided by the incidence of reported falls of the previous year, and modified by a weekly reassessment based on the most current evidence of falls in health district areas (Spiegel and Lindaman 1977). Particular emphasis was placed on the city’s public housing, which previously accounted for approximately 90% of falls in NYC although it did not make up 90 percent of housing stock. This highlights the association between the incidence of falls and environmental factors such as aging and deteriorating housing (Spiegel and Lindaman 1977). Over thirty years after the introduction of the “Children Can’t Fly” program and twenty five years after mandatory compliance, despite having over four times the national average of the population residing in multifamily dwellings with ten or more units, the incidence of injury resulting from falls in buildings in NYC is nearly half that of the U.S. average. (Pressley and Barlow 2005). The success of the “Children Can’t Fly” program demonstrates that the most effective approach to reducing these types of injuries is a wide ranging program of physical removal and alteration of hazardous conditions coupled with an extensive community education and awareness campaign.

RELATIONSHIP BETWEEN SLIPS, TRIPS & FALLS & THE DESIGN & CONSTRUCTION OF BUILDINGS 39
The American Academy of Pediatrics (AAP 2001) has made several recommendations based on the success of the “Children Can’t Fly” program that would significantly reduce the incidence of children falling from windows, particularly in high density, high rise dwellings. These recommendations include the installation of locks on windows not intended for egress to prevent sliding windows from opening more than 4 inches, opening double hung windows from the top only and the installation of operable window guards on second and higher storey windows (provided such guards comply with local fire regulations.) In addition to reiterating the AAP’s statement on the importance of window guards, Lallier et al. (1999) emphasize the importance of actively involving the medical profession in the development of parental and community education strategies.
The success of regulatory or legislative intervention in reducing child fall from height injuries, coupled with increased community and parental awareness, is demonstrated by the success of the above study and its resulting prevention program. Regulatory and design intervention to remove or limit the possibility of children gaining access to potentially dangerous building features such as unguarded windows or balconies with insufficiently preventative railings or balustrades is most likely to have a lasting, positive impact in reducing the contribution of these particular building features to paediatric fall injury.
5.8 REFERENCES
American Academy of Pediatrics Committee on Injury and Poison Prevention, (2001) “Falls From Heights: Windows, Roofs, and Balconies”, Pediatrics, Vol. 107, No.5 May 1188-1191.
Ashby, K, & Corbo, M, ( 2000) “Child fall injuries: an overview”, Hazard, Victorian Injury Surveillance System, No.44, September, 1-16.
Ashby, K, Ozanne-Smith, J, & Fox, B, (2007) “Investigating the over-representation of older persons in do-it-yourself home maintenance injury and barriers to prevention” Injury Prevention, Oct; 13: 328 - 333.
Australian Building Codes Board (2007) Building Code of Australia.
Australian Bureau of Statistics. (2005) Year Book Australia- Housing, Housing and life cycle. Catalogue no. 1301.0. Canberra: ABS Barker, B., Hockey, R., & Miles, E., (2004) “Toddler falls from Balconies & Windows”, Injury Bulletin, Queensland Injury Surveillance Unit, No. 80, February, 1-4.
Barlow, B., Niemirska, M., Gandhi, R.P., & Leblanc, W., (1983) “Ten Years of Experience With Falls From a Height in Children”, Journal of Pediatric Surgery, Vol.18, No.4. (August), 509-511.
Benoit, R., Watts, D.D., Dwyer, K., Kaufmann, C., & Fakhry, S., (2000) “ Windows 99: A Source of Suburban Pediatric Trauma”, The Journal of Trauma, Injury, Infection and Critical Care, Vol. 49 (3), September 477-482.
Bergner, L., Mayer, S., Harris, D., (1971) “Falls from heights: A Childhood Epidemic in an Urban Area”, American Journal of Public Health, Vol. 61, No.1, January 90-96.
Bertocci, G.E., Pierce, M.C., Deemer, E., Aguel, F., Jonosky, J.E., Vogeley, E., (2004) “Influence of fall height and impact surface on biomechanics of feet-first free falls in children”, Injury: International Journal of the Care of the Injured, No. 35, 417-424.
Björnstig, U., & Johnsson, J., (1992) “Ladder Injuries: Mechanisms, Injuries and consequences”, Journal of Safety Research, Vol. 23, 9-18.

40 MONASH UNIVERSITY ACCIDENT RESEARCH CENTRE
Bulut, M., Korkmaz, A., Akkose, S., Balci, V., Ozguc, H., & Tokyay, R., (2002)“Epidemiological and clinical features of childhood falls”, Turkish Journal of Trauma & Emergency Surgery, 8(4), 220-223.
Caruana, E., (2006) “Building Better Balconies and Balustrades” Injury Issues Monitor, No.37, August, 4-6.
Cassell, E., & Clapperton, A., (2006) “Consumer product-related injury (3): Injury related to the use of ladders”, Hazard, Victorian Injury Surveillance Unit, Monash University Accident Research Centre, No. 63, 1-15.
Cohen, H.H., & Lin, L., (1991) “A Retrospective Case-Control Study of Ladder Fall Accidents”, Journal of Safety Research, Vol.22, 21-30.
Cohen, H.H., & Lin, L., (1991) “A Scenario Analysis of Ladder Fall Accidents”, Journal of Safety Research, Vol.22, 31-39.
Demetrios, D., Murray, J., Brown, C., Velmahos, G., Salim, A., Alo., K, Rhee, P., (2005) “High-Level Falls: Type and Severity of Injuries and Survival Outcome According to Age.” The Journal of Trauma, Injury, Infection and Critical Care, Vol. 58, 342-345.
Department of Trade and Industry. (1999) “Assessment of leaning ladder safety devices” In: Consumer Affairs Directorate, London
Driscoll, T.R., Mitchell, R.J., Hendrie, A.L., Healey, S.H., Mandryk, J.A., Hull, B.P., (2003) “Unintentional fatal injuries arising from unpaid work at home”, Injury Prevention, Vol. 9 15-19.
Faergemann, C., & Larsen, L.B., (2000) “Non-occupational ladder and scaffold fall injuries”, Accident Analysis and Prevention, 32, 745-750.
Faergemann, C., & Larsen, L.B., (2001),“The Mechanism and severity of nonoccupational ladder fall injuries”, Journal of Safety Research, 32 333-343.
Gunatilaka, A., Clapperton, A., & Cassell, E., (2005) “Preventing home fall injuries: structural and design issues and solutions”, Hazard, Victorian Injury Surveillance System, No.59, Summer, 1-18.
Häkkinen, K.K., Pesonen, J., Rajamäki, E, (1988),“Experiments on Safety in the Use of Portable Ladders”, Journal of Occupational Accidents, 101-19.
Hayward, G., (1996) “Fatal home accidents – a product database”, Accident Analysis & Prevention, 20, 399-410.
Helling, T. S.Watkins, M.Evans, L. L.Nelson, P. W.Shook, J. W.Van Way, C. W. (1999) “Low falls: an underappreciated mechanism of injury” 453-6, Mar. Journal of Trauma 46(3):453-6
Istre, G.R., McCoy, M.A., Stowe, M., Davies, K., Zane, D., Anderson, R.J., Wiebe, R., (2003) “Childhood injuries due to falls from apartment balconies and windows”, Injury Prevention, Vol. 9, 349-352.
Kim, K. A. Wang, M. Y. Griffith, P. M. Summers, S. Levy, M. L. (2000) “Analysis of pediatric head injury from falls” e3, Neurosurgical Focus. 8(1).
Lallier, M., Bouchard, S., St-Vil, D., Dupont, J., Tucci, M.,( 1999) “Falls From Heights Among Children: A Retrospective Review”, Journal of Pediatric Surgery, Vol. 34, No. 7 (July), 1606-1063.

RELATIONSHIP BETWEEN SLIPS, TRIPS & FALLS & THE DESIGN & CONSTRUCTION OF BUILDINGS 41
Lavelle, J.M., Shaw, K., (1998) “Evaluation of Head Injury in a Pediatric emergency Department: Pretrauma and Posttrauma System”, Pediatrics & Adolescent Medicine, Vol. 152 (12), December, 1220-1224.
Lehman, D., & Schonfeld, N., (1993) “Falls From Heights: A Problem Not Just in the Northeast”, Pediatrics, Vol. 92 (1), July, 121-124.
Mathers C, Penm R. (1999) Health system costs of injury, poisoning and musculoskeletal disorders in Australia 1993-94., Australian Institute of Health and Welfare.
Mathers C, Vos T, Stevenson C., (1999.) The burden of disease and injury in Australia - summary report, Australian Institute of Health and Welfare.
McClure, R., Nixon, J, Spinks, A., & Turner, C., (2005) “Community based programmes to prevent falls in children: a systematic review”, The Journal of Paediatric ChildHealth, Vol.41 (9-10), Sep-Oct, 465-470.
Muir, L., & Kanwar, S.(1993), “Ladder Injuries”, Injury, 24 (7), 485-487.
Murray, J. A.Chen, D.Velmahos, G. C.Alo, K.Belzberg, H.Asensio, J. A.Demetriades, D.Berne, T. V. (2006), Pediatric falls: is height a predictor of injury and outcome? 863-5, Sep. American Surgeon. 66(9)
Musemeche, C.A., Barthel, M., Cosentino, C, & Reynolds, M., (1991) “Pediatric Falls from Heights”, The Journal of Trauma, Injury, Infection and Critical Care, Vol. 31 (10), October, 1347-1349.
National Injury Surveillance Unit, “Changes to 5th Edition of ICD-10-AM” (2006) Injury Issues Monitor, May (36),1-12).
O’Sullivan, J., Wakai, A., O’Sullivan, R., Luke, C., Cusack, S., (2004), “Ladder fall injuries: patterns and cost of morbidity”, Injury: International Journal of the Care of the Injured, 35, 429-431.
Park, S.H., Cho, B.M. & Oh, S.M., (2004) “Head injuries from falls in preschool children”, Yonsei Medical Journal, 45(2), 229-32.
Partridge, R.A., Virk, A.S., Antosia, R.E., (1998) “Causes and Patterns of Injury from Ladder Falls”, Academic Emergency Medicine, Vol.5, No.1, Jan, 31-34.
Pillai, S.B., Bethel, C.A., Besner, G.E., Caniano, D.A., &Cooney, D.R., (2000) “Fall Injuries in the Pediatric Population: Safer and Most Cost-Effective Management” The Journal of Trauma, Injury, Infection and Critical Care, Vol. 46 (6), June, 1048-1051.
Pressley, J.C., & Barlow, B., (2005) “Child and adolescent injury as a result of falls from buildings and structures”, Injury Prevention, Vol. 11 (5), October, 267-273.
Saruda A, Fosbroke D, Braddee R. (1995) “Fatal work-related falls from roofs”, Journal of Safety Research; 26(1):1-8.
Spiegel, C.N., & Lindaman, F.C., ( 1977) “Children Can’t Fly: A Program to Prevent Childhood Morbidity and Mortality from Window Falls”, American Journal of Public Health, Vol. 67 (12), December, 1143-1147.
Standards Australia, (2005) AS 1170.0– 2002 (Incorporating Amendment Nos 1,2 and 4Structural design actions Part 0: General Principles, April, 1-31.
Standards Australia, (2006) AS 4226 – 1994 (Incorporating Amendment No.1) Guidelines for safe housing design, August, 1-43.

42 MONASH UNIVERSITY ACCIDENT RESEARCH CENTRE
Stone, K.E., Lanphear, B.P., Pomerantz, W.J., & Khoury, J., (2000) “Childhood Injuries and Deaths Due to Falls from Windows”, Journal of Urban Health, Bulletin of the New York Academy of Medicine, Vol. 77 (1), March, 26-33.
Tsipouras, S., Hendrie, J.M., Silvapulle, M.J., (2001) “Ladders: accidents waiting to happen”, MJA, Vol 174, 21 May, 516-519.
Turner JV, Spallek M, Najman JM, Bain C, Purdie DM, Nixon J, Scott d, McClure R, (2006)“Socio-economic distribution of environmental risk factors for childhood injury”, Australian and new Zealand Journal of Public Health, Dec; 30 (6), 514-08.
Watson W, & Ozanne-Smith, J. (1997) The cost of injury to Victoria, Monash University Accident Research Centre, Report No.124.
Wang, M. Y.Kim, K. A.Griffith, P. M.Summers, S.McComb, J. G.Levy, M. L.Mahour, G. H. (2001) Injuries from falls in the pediatric population: an analysis of 729 cases 1528-34, Oct. Journal of Pediatric Surgery. 36(10)

RELATIONSHIP BETWEEN SLIPS, TRIPS & FALLS & THE DESIGN & CONSTRUCTION OF BUILDINGS 43
CHAPTER 6 FALLS IN OLDER PERSONS IN RESIDENTIAL AGED CARE FACILITIES AND HOSPITALS
6.1 INTRODUCTION
This section reviews the risk factors for falls in older persons in general and for older persons in residential aged care facilities and acute hospitals. The epidemiology of falls and falls related injury is discussed.
6.1.1 Risk factors for falls in older persons
Risk factors associated with falls are frequently divided into intrinsic and extrinsic risk factors (National Ageing Research Institute 2004). Intrinsic factors are those that ‘relate to the individual’s health and functional status and physical characteristics’ whereas extrinsic factors ‘relate to an older person’s interaction with the environment’ (National Ageing Research Institute 2004).
The major intrinsic risk factors for one or more falls or injurious falls among community dwelling older persons are:
increased aged;
past history of falls;
chronic medical conditions such as stroke and Parkinson’s disease; multiple medication, and specific medication types such as long acting benzodiazepines and psychotropic medication;
impaired balance and mobility;
reduced muscle strength;
sensory problems, including impaired visual acuity and depth perception, and peripheral neuropathy;
dizziness;
impaired cognition;
depression;
low levels if physical activity;
low body mass index and osteoporosis (predictors of fracture risk)
fear of falling; and
female gender’ (National Ageing Research Institute 2004, p.6).

44 MONASH UNIVERSITY ACCIDENT RESEARCH CENTRE
6.2 FALLS AND FALL RELATED INJURY IN RESIDENTIAL AGED CARE FACILITIES
6.2.1 Incidence of falls in aged care facilities
Older persons living in residential aged care facilities have been found to fall more frequently than older persons living in community dwellings (Luukinen et al. 1994). Falls incidence in residential care populations in Sweden were reported at 1.8 falls per resident per year (Sadigh et al. 2004), with others reporting 1.5 falls per bed per year (Rubenstein 1994). Fall rates have been found to vary with different types of residential care and patient mixes, with higher rates of falls found in dementia units than those in aged care and senior citizen units (Jensen et al. 2002). Jensen et al. (2002) found a fall rate of persons living in a dementia unit to be twice that of people living in a senior citizen’s apartment or a residential aged care facility.
6.2.2 How many people living in residential aged care facilities in Australia?
In June 2006, there were 166,291 Australians living in residential aged care facilities (Australian Institute of Health and Welfare 2007), an increase from the 161,765 persons in June 2005 (Australian Institute of Health and Welfare 2006). There were 85.6 residential care places per 1000 people over the aged 70 and over in 2006. This equates to 8.67 precent of the Australian population aged 70 years or over.
Higher aged groups have the highest use of residential aged care facilities with those over 85 years of age having the highest rate of 237 persons per 1000 (Australian Institute of Health and Welfare 2006), decreasing to 33.3 per 1000 with the 75-79 years age group. In June 2006, 51.6 percent of the Australian residential aged care population were aged 85 years and over, with 95.6% aged 65 years and over (Australian Institute of Health and Welfare 2006).
Women make up 72 percent of the residential aged care population, with 58% of the female population aged 85 years and over compared with 38% of male residents (Australian Institute of Health and Welfare 2006). Residential aged care facilities refers to what were previously described by the Commonwealth Department of Health and Ageing as nursing homes and aged care hostels (Australian Institute of Health and Welfare 2006).
6.2.3 Fall related injury in residential aged care facilities
Two to four percent of falls in residential aged care facilities have been found to result in a fracture (Rubenstein et al. 1994; Sadigh et al. 2004), with about 11 percent of falls found to result in soft- tissue injury, severe lacerations or head trauma (Rubenstein et al. 1994).
The frequency of hip fractures in older persons in residential institutions has been noted to be high in relation to the proportion of the population living in these settings (Kreisfeld and Newson 2006). In 2002-2003, 954 (22 %) males and 3,453 (27%) females aged 65 years and over fractured their hips in a residential care institution (Kreisfeld and Newson 2006). As of June 2004 there were about 5 percent of the population aged 65 years and over residing in aged care facilities (Kreisfeld and Newson 2006).

RELATIONSHIP BETWEEN SLIPS, TRIPS & FALLS & THE DESIGN & CONSTRUCTION OF BUILDINGS 45
6.2.4 Risk factors associated with residential aged care falls
Intrinsic risk factors for falls in older persons in residential care include: increased age; acute health status, previous history of falls, wandering behaviour, cognitive impairment, maximal drop in post prandial systolic blood pressure, deterioration in activities of daily living performance, reduced lower extremity strength or balance, unsteady gait, independent transfers, use of antidepressant medication and polypharmacy, impaired vision and diabetes mellitus (National Ageing Research Institute 2004).
Extrinsic risk factors for falls in residential care include: relocation between settings and environmental hazards (National Ageing Research Institute 2004).
Research in 1994 suggested that falls in older persons living in residential care facilities are more likely to be caused by intrinsic factors than environmental factors, than falls in community dwelling older persons (Rubenstein et al. 1994). This is due to the frail nature of persons residing in nursing homes. However, this research does not appear to take into account the environmental factors with which energy is actually exchanged to cause the injury.
Most falls that occur in residential aged care facilities are not witnessed (Murray et al. 2007). Activities commonly being undertaken when falls occur include going to the toilet and rising up from sitting, or walking on a flat surface (Jensen et al. 2002). Going to the toilet was the activity found to be associated with 54 percent of falls at night and 19% of falls during the day (Jensen et al. 2002).
Most falls that occur in residential aged care occur in bedrooms (Sadigh, Reimers et al. 2004).
6.3 FALLS IN HOSPITALS
6.3.1 Introduction
Adverse events in hospital are a major concern for the health system. Large amounts of resources both financial and human are devoted to the consequences of adverse events, which could be used in other areas of health care. Poor patient outcomes and decreases in the quality of life may occur as a consequence of adverse events (Insight Economics Deloitte 2007).
Except for routine reporting of adverse events, such as falls reported in the ICD system, in Australia there is currently no national aggregation of hospital incident reports, although a number of Australian states do collect state-wide incident information (South Australia, New South Wales and Western Australia) (personal communication, Centre of Research Excellence in Patient Safety 2007). In contrast, the UK does have an aggregated hospital incident reporting system. A recent report from the UK Patient Safety Observatory titled “Slips, trips and falls in hospitals’ examined over 200,000 incident reports relating to inpatient falls from September 2005 to August 2006 (National Patient Safety Agency, 2007). Inpatient falls were the most common type of safety incident reported to authorities and made up two-fifths of all patient safety incidents (National Patient Safety Agency 2007).

46 MONASH UNIVERSITY ACCIDENT RESEARCH CENTRE
The report found an average of 4.8 falls for every 1000 hospital bed days (National Patient Safety Agency, 2007). This is the equivalent of 1,260 falls in an 800 acute bed hospital. Other studies have found rates of between 5 falls per 1000 bed days on general wards and up to 18 falls per 1000 bed days in specialist units with vulnerable patients (Oliver, 2006).
In the UK study, falls were directly responsible for 26 patient deaths, 530 hip fractures and about 1000 fractures (National Patient Safety Agency, 2007).
6.3.2 What proportion of falls in hospital resulted in injury?
Falls in hospitals that cause hip fractures are relatively common. A recent Danish study investigating 600 hip fractures found that 7.3 percent occurred in hospital (Foss and Kehlet 2005). Elderly patients who fracture their hips in hospitals have poorer outcomes than those who fracture their hip in the community (Murray et al. 2007). It is hypothesised that although community and hospital dwelling persons who fracture their hips have similar co-morbidities, the preoperative health status of persons who fracture their hips in hospitals is poorer than those who sustain their fracture in the community (Murray et al. 2007).
6.3.3 Risk factors for falls in hospitals
6.3.3.1 Intrinsic risk factors for falling in a hospital setting include impaired mental status, impaired mobility; history of falls; prescribed medications; special toileting needs; and advanced age (Evans et al. 2001).
Age has been found to be closely correlated with the risk of falling, with older patients falling more frequently than younger patients (National Patient Safety Agency, 2007). This is an important risk factor relevant to hospital patient populations, as older people are bigger users of hospitals than younger persons. On the night of the 30th June 2004, 53 percent (29,000) of persons who were inpatients in Australian hospitals were aged 65 years and over (Karmel et al. 2007).
Male inpatients were found to fall more frequently than female inpatients (National Patient Safety Agency, 2007).
6.3.3.2 Extrinsic risk factors associated with falling in a hospital setting include hospitalisation for greater than 19 days, environmental factors (including ward positions and hazards), time of day, restraints and drugs (Mitchell and Jones 1996; National Ageing Research Institute 2004).
Questions remain unanswered about whether the following components contribute to falls and fractures: bed heights, side of bed where mobility and transfer aids placed, clutter in ambulation pathways, number of turns required during walk (Murray et al. 2007). Knowledge on circumstances of injuries could allow for targeting of fracture prevention strategies (Murray et al. 2007). Murray has suggested that further research into the circumstances leading to fractures may inform future ergonomic strategies.
6.3.4 Were the falls witnessed?
Murray et al. (2007) reported that a major limitation of studies attempting to examine fracture injuries related to falls in hospitals and residential aged care facilities are that few are witnessed and elderly people have trouble recalling the circumstances of their fall (Cummings, Nevitt et al. 1988). Only five percent of falls in hospitals in the UK were

RELATIONSHIP BETWEEN SLIPS, TRIPS & FALLS & THE DESIGN & CONSTRUCTION OF BUILDINGS 47
reported to be witnessed by staff (National Patient Safety Agency 2007). Of 43 hospital acquired hip fractures in persons aged 75 years or older in public hospitals in the Illawarra district of New South Wales, only 12 percent of the falls were witnessed (Murray et al. 2007). Over fifty four percent of the bedroom falls in an older persons assessment, treatment and rehabilitation unit were unwitnessed (Hanger et al. 1999).
6.3.5 Where are older persons falling in hospitals?
One small Australian study examined the location of where fall related hip fractures in persons over the age of 75 years were sustained in acute care public hospitals. The main areas identified were: 58 percent of fractures occurred in bedrooms, 20% occurred in the lounge or corridor and 16% occurred in the bathroom or toilets (Murray et al. 2007).
6.3.5.1 Falls associated with beds in acute hospitals
In hospital most patients’ falls occur either from or near the patient’s bed. Other common places inpatients fall are in the corridor, bathroom and the toilet (Joanna Briggs Institute for Evidence Based Nursing 2007). In an analysis of 792 falls occurring in an older persons assessment, treatment and rehabilitation unit, 65.9 percent of falls occurred in the bedroom with 80.1% of these falls occurring around the bed (Hanger, Ball et al. 1999).
A UK report estimated 43 631 falls from beds in acute and community hospitals and mental health units in 2005-06 (National Patient Safety Agency, 2007). Over five percent of hip fractures for all age groups recorded a fall from bed as the mechanism of injury in Australia in the year 2002-2003 (Kreisfeld and Newson, 2006). Most of the persons who sustained hip fractures with falls from beds recorded as the mechanism of injury were aged 65 years and over (Kreisfeld and Newson, 2006).
6.3.6 Time of day of falls in hospitals
Fifty eight percent of hospital acquired hip fractures in a recent NSW study occurred between 2100 and 0600, with 42 percent of fractures between 0600 to 2100 (Murray, Cameron et al. 2007). Most of the falls in an older persons assessment, treatment and rehabilitation unit occurred between 6 pm and 10 am (Hanger, Ball et al. 1999).
In the NSW study 76 percent of the falls that occurred in the bedrooms occurred at night. The study found that the fractures in elderly people are likely to occur in a bedroom at night, when the patient is attempting to go to the toilet unsupervised (Murray et al. 2007).
The time of day persons fall in acute and residential care is different to the findings for older community dwelling persons in which 70 percent of falls were found to have occurred between 0700 and 2000 hours, with only 9% occurring between 2400 and 0500 (Tinetti et al. 1995).
6.3.7 Cause of the fall
Over forty percent of falls in an older persons’ assessment, treatment and rehabilitation unit appeared to be a slip (Hanger et al. 1999). About 5 percent of the over 200,000 falls reported on by the National Patient safety Agency in 2007 recorded environmental factors as contributing to the fall (National Patient Safety Agency 2007). One percent of reports

48 MONASH UNIVERSITY ACCIDENT RESEARCH CENTRE
nominated wet floors as having contributed to the fall. In these circumstances the floor was usually wet due to the patient’s urine (National Patient Safety Agency 2007).
6.3.8 Environmental aspects related to falls in the hospital environment
Many aspects of the hospital environment have been postulated as having an impact on the risk of falls or injury.
These include:
Floor surface, unevenness, how slippery when wet or dry
Flooring density, including how soft or hard a surface is to land on
Flooring pattern as this can create and illusion of slope or steps to impaired eyesight
Lighting, including poor lighting and sudden changes from dim to bright light and the position of light switches
The design of doors, handrails, toilets and bathrooms
The line of sight for staff observing patients
Trip hazards including steps, clutter and cables
Furniture and medical devices, including beds, trolleys, mattresses, chairs, commodes and wheelchairs.
(National Patient Safety Agency, 2007)
6.4 BEDS AND BEDRAILS
6.4.1 Beds
6.4.1.1 Hi-low beds
It has been hypothesized that the difference in heights between staff-working beds, hospital beds in the lowest positions and home beds may be a cause of hospital falls in older persons in hospital (Tzeng and Yin 2006). The height of hospital beds in ‘staff-working heights’ were found to be about 5-18cm cm higher than home beds. Tzeng and Yin (2006) have suggested that not only may high hospital beds cause falls, but that patients falling from high beds may sustain more serious injuries than those falling from a bed at a lower height. The study recommended nurses maintain hi-low beds at the lower height setting when not attending to patients and that more studies are undertaken in this area.
6.4.1.2 Side rail use
Bed rails otherwise known as cot sides, side rails and safety sides have been used for many years in health care and residential aged care facilities to prevent people falling from beds (Medicines and Healthcare Products Regulatory Agency 2006). Bedrails have not only been used for safety reasons but also as a method of restraint (Joanna Briggs Institute for Evidence Based Nursing 2007). The safety of these devices has now been questioned as bedrails have been involved with a number of adverse patient events. The effectiveness of the bedrails in preventing falls has also been questioned due to a lack of evidence.
The risk of patient entrapment and death due to bed rail use has been highlighted by a number of international safety authorities in recent years (Joint Commission on the

RELATIONSHIP BETWEEN SLIPS, TRIPS & FALLS & THE DESIGN & CONSTRUCTION OF BUILDINGS 49
Accreditation of Healthcare Organizations 2006; Medicines and Healthcare Products Regulatory Agency 2006; U.S. Drug and Food Administration 2006) (Hospital Bed Safety Working Group 2004; Medicines and Healthcare Products Regulatory Agency 2004).
There has not been a randomised trial of bed rail use (O'Keefe 2004) and the literature does not provide evidence of the benefits of bedrail use (O'Keefe 2004).
One study investigating whether decreased bed rail use reduced falls in an older persons assessment, treatment and rehabilitation unit found there was no reduction in fall rates with reduced bedrail use, but there was a reduction in serious injuries especially head injuries associated with falls (Hanger et al. 1999). Other studies have shown no increase in the severity of injury with raised bedrails, but this may have been due to a small sample size of those falling with elevated bedrails (van Leeuwen 2001).
There is a lack of evidence about the effectiveness of bedrail use in stopping falls and about which patients will benefit from the use of bedrails (Joanna Briggs Institute for Evidence Based Nursing 2007). Bedrails do not provide complete protection against falls from beds with one Australian study observing 60 percent of the patients who fell from bed, occurred from beds where the bedrails were up (van Leeuwen 2001). The Joanna Briggs Institute has made no recommendations about the use of bedrails to prevent patients falling due to a lack of evidence on the efficacy of bed rail use (Joanna Briggs Institute for Evidence Based Nursing 2007).
6.4.1.3 Methods used to prevent patient falls and fall related injury when bed rail use is reduced
The use of floor mats placed beside beds is advocated by some bed safety interventions programs to decrease the likelihood of injury when a patient falls from a bed (Hoffman et al. 2003). The mats are not used by some institutions as they are perceived as a tripping risk to staff and patients.
Force attenuating flooring would not only decrease the risk of fall related injuries on falling, but could also reduce the tripping risk posed by mats placed beside beds.
6.5 FOOTWEAR
Inappropriate footwear is a known risk factor for falls. The National Ageing Research Institute (2004) suggests that footwear in hospitals is often inadequate although there is very little published literature on the topic, with one study in sub-acute care identifying 86% of patients with inadequate footwear, with over half wearing slippers (Hill et al. 2002). Conditions of the feet such as foot pain, nail pathology and sensory impairment (for example peripheral neuropathy) also may have in impact on falls risk. No randomised control trials have been conducted evaluating footwear or foot care although one pre-post study did identify reduced falls with the introduction of treaded socks in an aged care residential facility, especially when urinary incontinence was present (National Ageing Research Institute 2004). Future research on interventions to address issues in this area is recommended by the National Ageing Research Institute (2004).

50 MONASH UNIVERSITY ACCIDENT RESEARCH CENTRE
6.6 MENTAL STATUS
Impaired cognitive status (acute or premorbid), especially confusion and impaired orientation has been found to be an intrinsic risk factors for falls in older persons in hospital (National Ageing Research Institute 2004). For example, a high proportion of the patients who fell over elevated bedrails were judged to be ‘not rational’ prior to falling (van Leeuwen 2001). Although many of the older persons hospitalised and living in residential aged care facilities have cognitive impairments, such as dementia, there is little evidence on the effectiveness of interventions to reduce the number of falls and injuries in persons with cognitive impairment in acute care and residential settings (Oliver et al. 2006).
6.7 CONTINENCE AND TOILETING
Incontinence and toileting have been suggested in the literature as factors associated with an increased risk of falling amongst older persons in hospital (National Ageing Research Institute 2004). Factors that may increase the risk of falling include: urinary frequency, urgency, and decreased mobility and balance when hurrying to the toilet and preparing for toileting (National Ageing Research Institute 2004). One study providing a toileting intervention for ‘high risk’ patients revealed significantly fewer falls in the ‘at risk’ group who were provided with a regular toileting intervention than those who were not provided with the intervention (Bakarich et al. 1997). The National Ageing Research Institute recommends that further investigation into toileting interventions to prevent falls in hospitalised older persons is undertaken.
6.8 GAPS IN EVIDENCE
It is possible that health care providers are using injury prevention interventions of uncertain effectiveness (Oliver et al. 2006). If this is the case falls may be costing health care providers in two ways: the cost of injury related falls and the opportunity and financial cost of implementing possibly ineffective interventions.
Gaps in the evidence for interventions for which future research is recommended include the effect of falls and fall related injury of changes or differences in the physical environment of hospitals, medication reviews and the use of alarms (Oliver et al. 2006).
Environmental audits and risk assessments have been suggested as important for identifying risk factors less likely to be seen in incident reports of falls in acute institutions such as spaces between beds, walking routes to toilets, lighting and grab rails (National Patient Safety Agency, 2007).
Like many other areas of public health there is much literature on the magnitude of the public health problem and few high quality reports and studies on the effectiveness of interventions to solve the problem (Lyratzopoulos and Harvey 2006).
Over a decade ago, the main devices that were used as interventions in falls prevention in the older residential care populations were physical restraints and bed rails (Capezuti 2004). As a result of changes in nursing practice and research evidence, interventions now concentrate on non-restraint and the least restrictive methods of falls prevention interventions in order to maintain mobility and dignity, and to prevent frailty in older persons (Capezuti 2004).

RELATIONSHIP BETWEEN SLIPS, TRIPS & FALLS & THE DESIGN & CONSTRUCTION OF BUILDINGS 51
With falls intervention programs concentrating on falls reduction, and a realisation that some falls are inevitable in the inpatient and residential environment, it seems clear that is a focus on fall injury reduction is now also required.
6.9 REFERENCES
Australian Institute of Health and Welfare (2006). Residential aged care in Australia 2004-05: a statistical overview. Aged care statistics series 22. Canberra, AIHW.
Australian Institute of Health and Welfare (2007). Residential aged care in Australia 2005-2006: a statistical overview. Aged care statistics series 24. Canberra, AIHW.
Bakarich, A., A. McMillan, et al. (1997). "The effect of a nursing intervention on the incidence of older patient falls." Australian Journal of Advanced Nursing 15: 26-31.
Capezuti, E. (2004). "Building the science of falls-prevention research." Journal of American Geriatric Society 52(3): 461-462.
Cummings, S. R., M. C. Nevitt, et al. (1988). "Forgetting falls. The limited accuracy of recall of falls in the elderly." Journal of American Geriatric Society 36: 613-616.
Evans, D., B. Hodgkinson, et al. (2001). "Falls risk factors in the hospital setting: a systematic review." International Journal of Nursing Practice 7: 38-45.
Foss, N. and H. Kehlet (2005). "In-hospital faractures: Prevalence, risk factors and outcome." Age and Aging 34: 642-645.
Hanger, H., M. Ball, et al. (1999). "An analysis of falls in the hospital: can we do without bedrails ?" Journal of the American Geriatrics Society 47(5): 529-531.
Henley, G., R. Kreisfeld, et al. (2007). Injury deaths in Australia in 2003-2004. Injury research statistics series no. 37, AIHW.
Hill, K., F. Vrantsidis, et al. (2002). Preventing adverse events in sub-acute care: changing practice to prevent falls, Melbourne, National Ageing Research Institute for Department of Human Services Victoria.
Hoffman, S., G. Powell-cope, et al. (2003). "BedSAFE A bed safety project for frail older adults." Journal of Gerontological Nursing, 29(11).
Hospital Bed Safety Working Group (2004). Clinical guidance for the assessment and implementation of bed rails in hospitals, long term care facilities and home care settings, U.S. Food and Drug Administration.
Insight Economics Deloitte (2007). Evaluating health outcomes in Australia's health care system: a scoping study of potential methods and new approaches, South Melbourne, Australian Centre for Health Research.
Jensen, J., L. Lundin-Olsson, et al. (2002). "Preventing falls in assisted living facilities." Annals of Internal Medicine 136: 733-741.
Joanna Briggs Institute for Evidence Based Nursing (2007). Falls in hospitals: fact sheet. Adelaide.
Joint Commission on the Accreditation of Healthcare Organizations (2006). Sentinel event alert: bed rail-related entrapment deaths.

52 MONASH UNIVERSITY ACCIDENT RESEARCH CENTRE
Karmel, R., J. Lloyd, et al. (2007). Older Australians in hospital, Australian Institute of Health and Welfare.
Kreisfeld, R. and R. Newson (2006). "Hip fracture injuries." NISU Briefing 8.
Luukinen, H., K. Koski, et al. (1994). "Incidence rate of falls in an aged population in northern Finland." Journal of Clinical Epidemiology 47(8): 843-850.
Lyratzopoulos, G. and I. Harvey (2006). Turning public health problems into answerable questions. Oxford Handbook of Public Health Practice. D. Pencheon, C. Guest, D. Melzer and J. Muir Gray. Oxford, Oxford University Press.
Medicines and Healthcare Products Regulatory Agency (2004). Medical Device Alert: bed rails: twin bar design. U. Government.
Medicines and Healthcare Products Regulatory Agency (2006). Safe use of bed rails, Department of Health.
Mitchell, A. and N. Jones (1996). "Striving to prevent falls in an acute care setting-action to enhance quality." Jounal of Clinical Nursing 5: 312-320.
Murray, G. R., I. D. Cameron, et al. (2007). "The consequences of falls in acute and subacute hospitals in Australia that cause proximal femoral fractures." Journal of the American Geriatrics Society 55(4): 577-82.
National Ageing Research Institute (2004). 'An analysis of research on preventing falls and falls injury in older people: community, residential and hospital settings' (2004 update)
National Patient Safety Agency (2007). The third report from the Patient Safety Observatory: Slips, trips and falls in hospital.
Oliver, D., J. Connelly, et al. (2006). "Strategies to prevent falls and fractures in hospitals and care homes and effect of cognitive impairment: systematic review and meta-analyses." BMJ 334(7584): 82-87
O'Keefe, S. (2004). "Down with the bedrails?" The Lancet 363(9406): 343.
Rubenstein, L. Z., K. R. Josephson, et al. (1994). "Falls in the nursing home." Annals of Internal Medicine 121: 442-451.
Sadigh, S., A. Reimers, et al. (2004). "Falls and fall-related injuries among the elderly: a survey of residential-care facilities in a Swedish municipality." Journal of community health 29(2).
Tinetti, M., J. Doucette, et al. (1995). "The contribution of predisposing and situational risk factors to serious fall injuries." Journal of the American Geriatrics Society 43(11): 1207-1213.
Tzeng, H. and C. Yin (2006). "The staff-working height and the designing-regulation height for patient beds as possible causes of patient falls." Nursing economics 24(6): 323-7, 279.
U.S. Drug and Food Administration (2006). Guidance on hospital bed design to reduce patient entrapment.
van Leeuwen, H. H. (2001). "Patient falls from bed and the role of bedrails in the acute care setting." The Australian journal of advanced nursing, 19(2): 8.

RELATIONSHIP BETWEEN SLIPS, TRIPS & FALLS & THE DESIGN & CONSTRUCTION OF BUILDINGS 53
CHAPTER 7 SLIPPING AND SLIP RESISTANCE
7.1 OVERVIEW
Slipping is recorded in injury data as one of the primary causes of falls (Manning 1988, Bentley 1998) and has been estimated to account for approximately 62% of underfoot accidents (Burnfield and Powers 2006). Victorian data shows that for the year 2002/2003 same level falls accounted for half of falls admissions and three-quarters of Emergency Department presentations, and that of the 4,140 same level falls coded to slips, trips and stumble admissions, slips (falls due to slipping on contaminated or polished surfaces) accounted for 42% (n=1200)(Gunatilaka, Clapperton and Cassell 2005). Slips, and the varying slip resistance of different flooring surfaces and other extrinsic factors also play a prominent role in workplace injury. According to the US National Health Interview Survey questionnaire, conducted in 1997, a clear majority of 64% of the work-related falls could be attributed to slipping, tripping or stumbling (Cham and Redfern 2002), and public liability claims show that at least 86% of falls have extrinsic causes that are preventable, with the risks being similar whether at home, at work or in public areas (Bowman, 2000).
7.2 HUMAN GAIT & COEFFICIENT OF FRICTION
The relationship between human gait and the incidence of slips and falls has been extensively investigated by Strandberg and Lanshammar (1981), Lanshammar and Strandberg (1983), Perkins and Wilson (1983), Leamon (1988), Leamon and Li (1990), and Myung et al. (1997). The findings of the above studies led to the accepted conclusion that a higher friction could potentially improve slip resistance and therefore reduce the incidence of such slips and falls (Chang 1998, 2001).
During walking, a slip usually occurs when an individual’s utilized coefficient of friction (COFu) (also referred to as ‘required’ coefficient of friction) is greater than the available friction of the foot-floor interface (Burnfield and Powers 2006). Australian/New Zealand Standards define the coefficient of friction as “the ratio of the tangential force required to move a body across a horizontal surface to the vertical load imposed on the surface by the body.” (AS 4663 and 4586) Although ground reaction forces at the shoe-floor interface have been extensively studied and are widely recognized as the most critical biomechanical factor in slips (Redfern and Cham 2001), according to Cham (2002), the interaction of human and environmental factors extends beyond the foot-floor interface to the effect of the frictional requirements of various tasks being performed, such as the pushing, pulling and carrying of loads. Therefore, Cham asserts, these factors should also be taken into consideration when determining whether an environment is ‘slip-safe’.
7.3 TRIBOMETERS & RESISTANCE TESTING
The slip resistance of flooring surfaces is usually measured through the use of a tribometer. Upwards of 50 different portable tribometers have been described in the literature and, in general, the primary purpose of these devices is to measure the dynamic friction (reflected by the force required to keep a sliding object in motion) or static friction (reflected by the force required to initiate motion between an object and the surface on which it is resting) of a surface (Burnfield and Powers 2006). As highlighted by Beschorner et al.(2007), these devices are inherently limited in that testing conditions cannot entirely recreate the impact

54 MONASH UNIVERSITY ACCIDENT RESEARCH CENTRE
of the many extrinsic factors such as loading rate, timing, normal force, speed and shoe angle that contribute to, and influence COF measurements and thus also influence the severity of a slipping incident.
An additional shortcoming of the tribometer frequently outlined in the literature is that it fails to properly account for the changes in gait that often result from human perception or anticipation of increased floor surface slipperiness. As Cham and Redfern (2002) have observed, “one of the challenges of biomechanical studies is reproducing the unexpected nature of real-life slipping accidents.” Anticipation of slippery surfaces can lead to significant changes in lower extremity joint moments, a reflection of overall muscle reactions, and substantially alter the outcome of a potential slip incident. Cham and Redfern (2002) found that trials conducted when test subjects were aware a floor’s surface had been lubricated prior to testing produced peak required coefficient of friction (RCOF peak) values that were on average 16-33% lower than those collected during baseline (dry) trials, which substantially reduced slip potential. Even though subjects were asked to walk as normally as possible, this study suggests that significant gait changes are made when there is a potential risk of slipping. Furthermore, Gronqvist (1995) concluded that slip resistance varies considerably according to contact pressure during the normal gait cycle and therefore, average friction readings (such as those given by a tribometer) cannot be relied on to give a decisive measurement of slip resistance. He suggests that an instantaneous coefficient of friction reading may be more relevant, as the time available to achieve a coefficient of friction sufficient to avoid a slip when walking is only a few tenths of a second.
In a later study, Gronqvist (2003) concluded that the results of extensive tribometer tests implied that a minimum friction coefficient of 0.25 was required to prevent a fall on wet floor surfaces, and a minimum measurement to prevent a slip (which may result in a fall) was in the range of 0.30-0.35. However, he also found that a more accurate control of the normal force during testing is needed for actual field use of the test method. (Gronqvist 2003)
7.4 BUILDING CODES & STANDARDS
Throughout his extensive writing on matters concerning the measurement and improvement of the slip resistance of flooring surfaces, which he defines as “that property of a surface which denotes its ability to withstand or give protection against a slip.” Bowman (1996) has asserted that there is an inherent risk in relying upon a single slip resistance result to provide an indication of the slip resistance characteristics of a flooring material. He also warns against the importance that researchers and manufacturers alike place on coefficient of friction measurements, stating that successful slip resistance “is a function of a number of parameters, among which the coefficient of friction is only one – albeit probably the most important Bowman (1996). According to Bowman, another issue that delays progress in this area is the terminological vagueness that pervades much of the literature. In summarising the shortcomings of this over-reliance on coefficient of friction measurements to the detriment of many other contributing factors Bowman (1997) states:
At best slip resistance is a descriptive term, encompassing all the critical material and human elements that may lead to a slip, and as such should not be used interchangeably with coefficient of friction. Slip resistance is neither a constant nor an intrinsic property of a given surface composition, be it flooring, floor coating or footwear but, instead, varies with texture, wear and contamination.

RELATIONSHIP BETWEEN SLIPS, TRIPS & FALLS & THE DESIGN & CONSTRUCTION OF BUILDINGS 55
Further, it is an ephemeral characteristic determined by the activities at the time, whether one is walking naturally, walking fast or running, turning sharply, pulling or pushing a load, or going up or down an inclined plane or steps, coupled with the physiological, perceptual and behavioural conditions of the individual. Frequently, it is merely an individual’s perception, a subjective, qualitative assessment of the degree to which a particular floor resists the movement of one’s shoe across its surface, wherein the coequal contribution of the footwear is either ignored or not even considered.
The problem described above also extends to the Building Code of Australia. As Bowman (1997) points out, the BCA uses the terms ‘non-slip’, non-skid’ and ‘slip resistant’ to describe the requirements of various surface finishes, but nowhere does it actually specify what constitutes a non-slip, non-skid or slip resistant surface finish. According to Bowman (2000), authorities often prefer to mandate using abstract terms such as no-slip and slip-resistant, rather than specifying requirements that might be subsequently found to be inappropriate. This is evident in the current Building Code of Australia (BCA 2007), where reference is frequently made to ‘slip resistant’ and ‘non-skid’ surfaces, but there is no definition of how these terms are defined within the code. While the BCA does refer to AS/NZS 4586:2004 – Slip resistance classification of new pedestrian surface materials and AS/NZS 4663:2004 – Slip resistance measurements of existing pedestrian surfaces, it does not explicitly define the above terms within the code itself. The above Australian /New Zealand Standards define slip resistance as the “frictional force opposing movement of an object across a surface, usually with reference to the sole or heel of a shoe on a floor”, and regards a pedestrian surface as “slip resistive if the available friction is sufficient to enable a person to traverse that surface without an unreasonable risk of slipping.”
AS/NZS 4663:2004 regards a coefficient of friction of 0.40 or greater as slip resistant, and states that this measurement constitutes a “moderate to very low notional contribution of the floor surface to the risk of slipping when dry”. According to the above Standard, a coefficient of friction less than 0.40 results in a “high to very high notional contribution of the floor surface to the risk of slipping when dry”.
7.5 AGE & GENDER
As has shown to be the case with most mobility related injury, the risk of slip and fall accidents increases with age. Thomas and Brennan (2000) reported a ten-fold increase in the incidence of falls in the elderly (65+ years) when compared to those aged 16-64 years, despite the elderly generally adopting safer gait styles such as walking more slowly and with smaller step distances, and Lloyd and Stevenson (1992 cited in Moyer) indicated that while slips and trips caused 32 percent of falls for young people, 67% of falls for the elderly were initiated by slips (Moyer 2006). In Victoria, seniors aged 75 years and older have been shown to account for more than 50% of hospital admissions for slip injuries (n=716, 52%), even though this age group accounts for only 10% of ED presentations (n=125). (Gunatilaka, Clapperton and Cassell 2005)
There is also evidence to suggest that not only does the increasing frailty of age lead to an increased risk of slip-related injury, but also that the homes of older persons could, on average, present greater intrinsic slipping hazards. A report on home inspections carried out by Archicentre from January 2000 to August 2002 in 11,264 homes in Melbourne metropolitan and 2,771 homes in rural Victoria occupied by residents over 60 years of age showed that most common structural slip and trip hazards found were shower bases,

56 MONASH UNIVERSITY ACCIDENT RESEARCH CENTRE
defective floor finishes, dangerous staircases and obstacles like protruding door thresholds. Unexpectedly, within the homes included in the inspection sample, the percentage of slip and trip hazards was greater in single story homes than multiple story dwellings. (Gunatilaka, Clapperton and Cassell 2005)
As with most slip, trip and fall injury data worldwide, women have been found to be at a substantially higher risk of slip-related injury than men. In the UK women have been found to have an increased relative risk of 2 of having an underfoot accident, compared with men. (Davies 2001) In Australia, during the year to June 2003, females accounted for 75% of slip-related hospital admissions in Victoria (n=1,033) and 57% of ED presentations (n=682) for slips. (Gunatilaka, Clapperton and Cassell 2005). Kemmlert and Lundholm’s (2001) study of work related accidents, it was noted that women reported substantially more underfoot accidents than men, and that the gender gap increased with age. Although slip and fall accidents generally have multifactorial causes (Bowman 2000), the effect of holding something and the gender of the injured person appear to be the greatest indicators of risk in relation to underfoot accidents. In one British study based on follow-up interviews of slip injury patients identified through an injury surveillance database, among all patients who reported holding something at the time injury, underfoot accidents accounted for 44.5% of these injuries to women and 16.5% of these injuries to men (Davies et al. 2001).
7.6 RECOMMENDATIONS
As well as clearly quantifying factors in addition to the required coefficient of friction which can be used to reliably measure and ensure the safety of a particular flooring surface, there are several recommendations from the literature that could be applied to encourage increased uniformity in regards to both measurements and definitions of slip-resistance. These include the provision of comparative information on slip resistance by manufacturers and retailers to consumers, the development of building codes to require the installation of slip-resistant surfaces in the internal wet areas and external pedestrian areas of all new homes and renovated homes, and the national adoption the Local Government and Shires Associations of NSW initiative whereby certificates of occupancy are only issued to buildings where all flooring surfaces meet the recommendations on slip resistance of pedestrian surfaces as outlined in the revised Standards Australia Handbook HB 197:2005 (Gunatilaka, Clapperton and Cassell 2005).
7.7 REFERENCES
Australian Building Codes Board (2007) Building Code of Australia, viewed at http://www.abcb.gov.au/abcbonline.
Australian/New Zealand Standard, Slip resistance measurement of existing pedestrian surfaces, AS/NZS 4663:2004.
Australian/New Zealand Standard, Slip resistance classification of new pedestrian surface materials, AS/NZS 4586:2004.
Davies J.C., Stevens G., Manning D.P, (2001) April “An investigation of underfoot accidents in a MAIM database” Applied Ergonomics, Vol. 32, 2: 141-147
Bentley, T.A., Haslam, R.A., (1998), "Slip, trip, and fall accidents occurring during the delivery of mail" Ergonomics 41: 1859-1872.

RELATIONSHIP BETWEEN SLIPS, TRIPS & FALLS & THE DESIGN & CONSTRUCTION OF BUILDINGS 57
Beschorner, K. E., M. S. Redfern, et al. (2007). "Effects of slip testing parameters on measured coefficient of friction." Applied Ergonomics 38(6): 773-780.
Bowman, R., (1996). "Resolving the grey areas of slip resistance", Tile Today No. 13, Nov-1996-Jan 1997.
Bowman, R., (1997). "Slip resistance standards provide no unconditional guarantees", Tile Today No. 14, Mar-Apr 1997.
Bowman, R., (2000). "Where to next with slip resistance standards", viewed at http://www.dbce.csiro.au/vb2/345/67/index.htm
Burnfield, J. M. and C. M. Powers (2006). "Prediction of slips: an evaluation of utilized coefficient of friction and available slip resistance." Ergonomics 49(10): 982 - 995.
Cham, R. and M. S. Redfern (2002). "Changes in gait when anticipating slippery floors." Gait & Posture 15(2): 159-171.
Chang, W.-R. (2001). "The effect of surface roughness and contaminant on the dynamic friction of porcelain tile." Applied Ergonomics 32(2): 173-184.
Chang, W.-R., R. Gronqvist, et al. (2001). "The role of friction in the measurement of slipperiness, Part 1: Friction mechanisms and definition of test conditions." Ergonomics 44(13): 1217 - 1232.
Chang, W.-R., I.-J. Kim, et al. (2001). "The role of surface roughness in the measurement of slipperiness." Ergonomics 44(13): 1200 - 1216.
Chang, W.-R. and S. Matz (2001). "The slip resistance of common footwear materials measured with two slipmeters." Applied Ergonomics 32(6): 549-558.
Davies, J. C., D. P. Manning, et al. (2001) Dec."The rising number of underfoot accidents after the menopause causes both fractures and non-fracture injuries." 699-707,
Gronqvist, R. (1995). "Mechanisms of friction and assessment of slip resistance of new and used footwear soles on contaminated floors." Ergonomics 38(2): 224 - 241.
Gronqvist, R., J. Abeysekera, et al. (2001). "Human-centred approaches in slipperiness measurement." Ergonomics 44(13): 1167 - 1199.
Gronqvist, R., W. R. Chang, et al. (2001) "Measurement of slipperiness: fundamental concepts and definitions." 1102-17, Oct 20.
Gronqvist, R., M. Hirvonen, et al. (2003) Mar."The validity and reliability of a portable slip meter for determining floor slipperiness during simulated heel strike." 211-25,
Gunatilaka, A., Clapperton, A. & Cassell, E., (2005) "Preventing home fall injuries: structural and design issues and solutions" Hazard, Victorian Injury Surveillance Unit, 59, Summer: 1-18.
Kemmlert, K. and L. Lundholm (2001). "Slips, trips and falls in different work groups -- with reference to age and from a preventive perspective." Applied Ergonomics 32(2): 149-153.
Lanshammar, H., Strandberg, L., (1983). Horizontal floor reaction forces and heel movements during the initial stance phase. In: Matsui, H., Kobayashi, K. (Eds.), Biomechanics VIII. University Park Press, 1123–1128.
Leamon, T.B., (1988) "Experimental study of falling" Proceedings of the 21st Annual Conference of the Human Factors Association of Canada.

58 MONASH UNIVERSITY ACCIDENT RESEARCH CENTRE
Leamon, T.B., Li, K.-K., (1990). “Microslip length and the perception of slipping”, Proceedings of 23rd International Congress on Occupational Health, September 22–28,
Lloyd, D.G., Stevenson, M.G., (1992) "Investigation of floor surface profile characteristics that will reduce the incidence of slips and falls", Mechanical Engineering Transactions Institutions of Engineers - Australia, ME17: 99-105.
Manning, D.P., Ayers, I.M., Jones, C., Bruce, M. & Cohen K., (1988) "The incidents of underfoot accidents during 1985 in a working population of 10,000 Merseyside people" Journal of Occupational Accidents, 10: 121-130.
Moyer, B. E., A. J. Chambers, et al. (2006). "Gait parameters as predictors of slip severity in younger and older adults." Ergonomics 49(4): 329 - 343.
Myung, R. and J. L. Smith (1997). "The effect of load carrying and floor contaminants on slip and fall parameters." Ergonomics 40(2): 235 - 246.
Perkins, P.J., Wilson, M.P., (1983) "Slip resistance testing of shoes - new developments" Ergonomics, 26: 73-82.
Redfern, M. S., R. e. Cham, et al. (2001). "Biomechanics of slips." Ergonomics 44(13): 1138 - 1166.
Strandberg, L., Lanshammar, H., (1981) "The dynamics of slipping accidents" Journal of Accidents, 3: 153-162.
Thomas, E.J., Brennan, T.A., (2000) "Incidence and types of preventable events in elderly patients: population based review of medical records" British Medical Journal, 320: 741-744.

RELATIONSHIP BETWEEN SLIPS, TRIPS & FALLS & THE DESIGN & CONSTRUCTION OF BUILDINGS 59
CHAPTER 8 LANDING SURFACES
8.1 INTRODUCTION
During a fall, the kinetic energy of the falling body is dissipated upon impact to the floor and the body resulting in the deformation of, soft tissue layers and flooring. Without energy absorbent padding, the majority of this kinetic energy is absorbed by the skeletal structures of the body. This results in the presentation of large peak forces which can often lead to bone fracture (Maki and Fernie 1990). The surface onto which a person lands after a fall can have a substantial impact on the likelihood and severity of injury. Healey (1994) found that among a random sample of 225 accidents among aged care residents, 17% of those who fell onto carpet sustained injuries while 46% of those who fell onto vinyl were injured. Furthermore, the value for a chi-squared test of this sample indicated that there was a less than 1% probability that the reduced rate of injury observed for those who fell on carpet was owing to chance. Carpet, even without underlay, has been shown to provide significantly greater impact attenuation than other, stiffer flooring materials. As would be expected, Maki and Fernie (1990) also found that the addition of an underlay to carpet provided better impact attenuation than carpet alone.
While it has been shown in various studies, and reinforced by the epidemiological data, that fractures are significantly reduced in falls onto surfaces classified as soft (such as grass, loose dirt, or padded carpets) (Nevitt, Cummings and Hudes 1991), these studies predominantly address the issue of child falls from height and do not necessarily address the balance between surface compliance and walking ease, which is of importance for the elderly population in general and of particular importance to those in aged care facilities. Despite this, some studies have attempted to compare flooring types in nursing homes and hospitals, to identify whether the flooring type contributes to the incidence and fracture rate of falls. One study found that wooden carpeted floors resulted in a lower number of fractures (2.31 per 100 falls) than wooden uncarpeted floors (4.14 fractures per 100 falls) and concrete with carpet floors (4.36 fractures per 100 falls) (Simpson et al. 2004). Another study investigating vinyl and carpeted floors was underpowered and did not find a result (Donald et al. 2000).
Surprisingly the research by Simpson et al. (2004) found a lower number of fractures (1.1 per 100 falls) on concrete uncarpeted surfaces than on carpeted concrete. It was suggested by the authors that uncovered concreted surfaces are generally found in bathrooms and toilets, and the way people fall in these areas and the crowded and smaller area of these rooms may have decreased the number of fractures per 100 falls (Simpson et al. 2004).
Investigators researching the aetiology of hip fractures have suggested that the impact forces of falls can exceed the strength of femurs in older individuals by as much as 50 percent (Courtney et al. 1995). The authors suggest that if a comparable reduction in impact force through energy-absorbing floors was in use, this may reduce the prevalence of hip fractures (Courtney et al. 1995)

60 MONASH UNIVERSITY ACCIDENT RESEARCH CENTRE
8.2 FLOORING SURFACES
Research into the impact attenuation of various types of floor coverings during simulated falls has been undertaken. Maki and Fernie (1990) tested 13 different types of floor coverings and found that carpet with or without padding underneath provided much greater impact attenuation than stiffer flooring materials such as terrazzo and wood tiles.
Their findings suggest that the floor covering type may change the mean impact force occurring during a fall significantly. This range between the highest and lowest mean impact attenuation during simulated hip impacts on hard to soft flooring was 3.2kN (23%).
This attenuation is a fair proportion of the estimated femur fracture threshold (5 to 25kN), and the authors suggests that many hip fractures may be prevented by use of the appropriate type of floor covering (Maki and Fernie 1990).
Floor coverings were predicted to be less important in the minimisation of wrist fractures or fractures of the humerus due to the importance of energy absorption of soft tissues and body structures during hand impacts (Maki and Fernie 1990).
Simpson and colleagues (2004) also investigated the mechanical properties of a number of types of flooring and found the mean impact attenuation of wooden carpeted floors at 11.9 kN was lower than all other floor types tested. Based on the findings of the research the authors recommended confirmation of the results by further studies and the careful consideration of floor types in institutions caring for the frail aged, particularly since overly soft flooring can effect the balance of an elderly person an may in fact encourage falls. (Simpson et al. 2004).
8.3 ENERGY ABSORBING FORCE ATTENUATING FLOOR TECHNOLOGY
New flooring types have been developed for possible use in hospital and residential aged care sectors. Research was found on the properties of the flooring and is described below, although research trialling the use of the new floor technology in acute care and residential facilities could not be found.
The new types of flooring have been designed and developed to remain fairly rigid when walked upon (Casalena et al. 1998) and to ‘deform elastically’ when fallen upon (Casalena et al. 1998). The aim of the flooring is to ‘reduce the peak force on the femoral neck during a lateral fall onto a hip’ (Casalena et al. 1998), and to provide a stable walking surface that does not increase the likelihood of falls in comparison to normal flooring (Casalena et al. 1998).
The new types of flooring aim to reduce injury through the use of “energy –absorbing’ materials. Kradal ™ is a new energy absorbing flooring technology developed in New Zealand that has been found to reduce mean peak force on impact to 33 percent lower than carpet and underlay over wood (Robertson, Milburn et al. 2006). The Kradal ™ product testing summary suggests the reduction is between 20 to 40 percent (Acme Industries 2007).
Hardness testing using an indenting testing machine and standard test protocols was undertaken on the Kradal product. The hardness testing found that the Kradal composite on a wooden floor indented less than carpet with standard rubber underlay on wood. Robertson et al. (2006) claim that the Kradal ™ provided a superior surface in terms of

RELATIONSHIP BETWEEN SLIPS, TRIPS & FALLS & THE DESIGN & CONSTRUCTION OF BUILDINGS 61
indentation. No claims are made about the product reducing falls although in concluding the authors do suggest that Kradal used under carpet in long term care facilities and hospitals would be safe, practical and result in a reduction in the rate of hip fractures from falls.
8.4 REFERENCES
Acme Industries (2007). Kradal ™ Product Testing Summary Report. Upper Hut, Acme Industries: 1-12.
Casalena, J., T. Ovaert, et al. (1998). "The Penn state Safety Floor: Part II -reduction of fall-related peak impact forces on the femur." Journal of Biomechanical Engineering 120: 527-532.
Casalena, J., T. Ovaert, et al. (1998). "The Penn State Safety Floor: Part 1- Design parameters associated with walking deflections." Journal of Biomechanical Engineering 120: 518-526.
Courtney, A. C., E. F. Wachtel, et al. (1995). "Age-related reductions in the strength of the femur tested in a fall-loading configuration." Journal of Bone & Joint Surgery. 77(3): 387-95.
Donald I.P., K. Pitt, E. Armstrong, H. Shuttleworth, (2000) “Preventing falls on an elderly care rehabilitation ward Clinical Rehabilitation, Apr.14(2):178-85.
Healey, F., “Does flooring type affect risk of injury in older in-patients” (1994) Nursing Times, Jul, 6-12; 90(27):40-1.
Maki and Fernie, B. E. and G. R. Fernie (1990). "Impact attenuation of floor coverings in simulated falling accidents." Applied Ergonomics 21(2): 107 - 114.
Nevitt M.C., S.R. Cummings, E.S. Hudes, (1991) “Risk factors for injurious falls: a prospective study, J Gerontal, Sept; 46(5) 164-170.
Robertson, C., P. Milburn, et al. (2006). Introducing Kradal™ - a new energy absorbing flooring technology to prevent fractures in elderly people (poster presentation). Australian Falls Prevention Conference. Brisbane.
Simpson AH., S. Lamb, PJ. Roberts, TN. Gardner, JG. Evans, (2004) “Does the type of flooring affect the risk of hip fracture?” Age & Ageing, May, 33 (3):242-6.

62 MONASH UNIVERSITY ACCIDENT RESEARCH CENTRE
CHAPTER 9 NATIONAL DATA ON HOSPITALISATION AND DEATHS DUE TO FALLS IN BUILDINGS
9.0 INTRODUCTION
This chapter presents the most recently available Australian data on fall injuries in general to provide a broader context, and fall injuries occurring in buildings that result in hospital admissions and deaths.
This national data is supplemented by Victorian data as an example of more detailed state non-fatal data and where national data is not available such as longer term trends and non-admitted hospital treated cases.
This chapter reports on analyses of data extracted from the following databases:
Australian Bureau of Statistics (ABS)
National Injury Surveillance Unit (NISU)
National Coroners Information System (NCIS)
Victorian Emergency Minimum Dataset (VEMD) and
Victorian Admitted Episodes Database (VAED).
Comparison between Australian Bureau of Statistics and National Coroners Information System fall fatality data
Table 9.0.1 All unintentional fall fatalities, Australia, 2001-2005
NCIS ABS n % n % State or territory Victoria 679 31.1 1957 26.3 New South Wales 655 30.0 2429 32.6 Queensland 403 18.4 1538 20.7 Western Australia 177 8.1 665 8.9 South Australia 128 5.9 430 5.8 Tasmania 86 3.9 274 3.7 Australian Capital Territory 26 1.2 98 1.3 Northern Territory 32 1.5 53 0.7 All 2186 100 7444 100 Year of death 2001 424 19.4 1348 18.1 2002 406 18.6 1473 19.8 2003 408 18.7 1467 19.7 2004 471 21.5 1534 20.6 2005 477 21.8 1622 21.8 All 2186 100 7444 100 Age group 0-14 39 1.8 39 <1 15-29 173 7.9 177 2.4 30-44 208 9.5 213 2.9 45-59 315 14.4 338 4.5 60-74 401 18.3 732 9.8 75+ 1047 47.9 5943 79.8 missing 3 0.1 2 <1 All 2186 100 7444 100

RELATIONSHIP BETWEEN SLIPS, TRIPS & FALLS & THE DESIGN & CONSTRUCTION OF BUILDINGS 63
NCIS ABS n % n % Gender Male 1399 64.0 3301 44.3 Female 787 36.0 4143 55.7 All 2186 100 7444 100 Cause (ABS) same level from slipping, tripping, stumbling 391 5.3 on and from stairs and steps 232 3.1 other fall on same level 227 3.0 from, out of or through building or structure 194 2.6 involving bed 126 1.7 on and from ladder 93 1.2 involving chair 54 <1 other fall from one level to another 112 1.5 involving other furniture 21 <1 involving wheelchair 24 <1 on same level -collision with pushing by another person 5 <1 while being carried or supported by other persons 3 <1 other specified fall 105 1.4 unspecified fall 2216 29.8 fracture unspecified, reclassified from X59 3641 48.9 All 7444 100 Mechanism (NCIS) Falling/jumping/pushed from a height: < 1m 399 18.3 Falling/jumping/pushed from a height: < 1m 724 33.1 Falling/stumbling by slipping on same level 121 5.5 Falling/stumbling by tripping on same level 222 10.2 Other falling/stumbling on the same level 222 10.2 Other specified falling/stumbling 71 3.2 Unspecified falling/stumbling 427 19.5 All 2186 100 Location Home 885 40.5 1038 13.9 School other institution or pub admin area (includes hospital)
16 0.7
203 2.7
Residential/Correctional facility 139 6.4 520 7.0 Trade or service area 101 4.6 83 1.1 Other specified place 1029 47.1 434 5.8 Unspecified place 16 0.7 5166 69.4 All 2186 100.0 7444 100.0
Note: coding differences make comparisons based on cause and location difficult. Data provided as a guide only.
There is a large discrepancy between the total numbers for all fall deaths found in the ABS and NCIS datasets. This is primarily due to recoding of some ABS deaths originally coded to ‘exposure to unspecified factor’ (n=3641). To enable continuity of trend data, Harrison and Steenkamp (2002) proposed a revised indicator definition of falls that has been followed in this report. This involves transferring those cases classified under X59 ‘exposure to unspecified factor’ in the ‘other unintentional’ group to the ‘falls’ group if they have at least one injury code denoting a fracture. This lack of specificity in the original dataset and subsequent recoding makes a comparative analysis of all fall fatalities included in these two datasets difficult, particularly in relation to the location and cause/mechanism of death.

64 MONASH UNIVERSITY ACCIDENT RESEARCH CENTRE
Narrowing down the datasets to the location and cause codes specified for inclusion by the ABCB (see TABLE 9.0.2) produces a total of 1832 unintentional fall fatalities in the ABS data and 1713 in the NCIS data over the same five year period (2001-2005).
The largest discrepancy is in the final year of the analysis, where the ABS has recorded 585 building fall related deaths while the NCIS shows 386.
ABS numbers are higher than NCIS numbers in 5 of the 8 states and territories (Victoria, New South Wales, Tasmania, Australian Capital Territory and Northern Territory) and in 3 of the 5 years (2001, 2004 and 2005).
Although the absolute numbers differ quite substantially between the datasets, the proportion of deaths in each age group is quite similar. For example, 77% of NCIS cases and 82% of ABS cases are persons aged 60 years or more. There is also a very clear pattern in both datasets of deaths increasing as age increases.
Almost 60% of NCIS cases are female compared with half of the ABS cases. Although causes and mechanisms are difficult to compare across datasets as coding inconsistencies exist, some of the data for deaths involving specific items such as beds, chairs and stairs and steps are quite similar and display common trends over time.
Both of these datasets are probably underestimated. Clearly, not all fall related fatalities are reported to Coroners in all states. Particularly, where a fall was not necessarily reported to the Coroner as the primary cause of death, but was a primary instigator of the eventual cause of death (eg Pneumonia). Cases from 2005/06 – 2006/07 are not included in this analysis as many cases from these years are not yet closed and the datasets are incomplete.
Again, inconsistencies in coding make comparison on locations difficult although the home is clearly the most common location for all cases (52% of NCIS cases and 56% of ABS cases).
A more detailed table can be found in Appendix 3 showing data by individual year.
Table 9.0.2 All unintentional fall fatalities occurring in buildings, Australia 2001-2005
NCIS ABS n % n %
State or territory Victoria 589 34.4 700 38.2 New South Wales 496 29.0 544 29.7 Queensland 297 17.3 241 13.2 Western Australia 145 8.5 119 6.5 South Australia 94 5.5 87 4.7 Tasmania 58 3.4 99 5.4 Australian Capital Territory 19 1.1 23 1.3 Northern Territory 15 0.9 19 1.0 All 1713 100.0 1832 100.0 Year of death 2001 310 18.1 334 18.2 2002 309 18.0 265 14.5 2003 319 18.6 212 11.6 2004 389 22.7 436 23.8 2005 386 22.5 585 31.9 All 1713 100.0 1832 100.0

RELATIONSHIP BETWEEN SLIPS, TRIPS & FALLS & THE DESIGN & CONSTRUCTION OF BUILDINGS 65
NCIS ABS n % n %
Age group 0-14 23 1.3 20 1.1 15-29 56 3.3 53 2.9 30-44 111 6.5 93 5.1 45-59 198 11.6 167 9.1 60-74 334 19.5 289 15.8 75+ 989 57.7 1209 66.0 Missing * * * * All 1713 100.0 1832 100.0 Gender Male 726 42.4 924 50.4 Female 987 57.6 908 49.6 All 1713 100.0 1832 100.0 Cause (ABS & some NCIS cases) same level from slipping, tripping, stumbling N/A 283 15.4 on and from stairs and steps 230 13.4 192 10.5 other fall on same level N/A 180 9.8 from, out of or through building or structure N/A 123 6.7 involving bed 116 6.8 109 5.9 on and from ladder 77 4.5 63 3.4 involving chair 38 2.2 48 2.6 other fall from one level to another N/A 35 1.9 involving other furniture N/A 19 1.0 involving wheelchair N/A 18 1.0 on same level -collision with pushing by another person N/A * * while being carried or supported by other persons N/A * * Unspecified fall N/A 716 39.1 fracture unspecified, reclassified from X59 N/A 40 2.2 All 1713 100.0 1832 100.0 Mechanism (NCIS) Falling/jumping/pushed from a height: < 1m 279 16.3 N/A Falling/jumping/pushed from a height: < 1m 465 27.1 N/A Falling/stumbling by slipping on same level 111 6.5 N/A Falling/stumbling by tripping on same level 190 11.1 N/A Other falling/stumbling on the same level 199 11.6 N/A Other specified falling/stumbling 59 3.4 N/A Unspecified falling/stumbling 410 23.9 N/A All 1713 100.0 1832 100.0 Location Home 898 52.4 1030 56.2 School other institution or pub admin area (includes hospital)
546 31.9
201 11.0
Residential/Correctional facility 146 8.5 519 28.3 Trade or service area 93 5.4 82 4.5 Other specified place 24 1.4 0 0.0 Unspecified place 6 0.4 0 0.0 All 1713 100.0 1832 100.0
Note: coding differences make comparisons based on cause and location difficult. Data provided as a guide only.
This report focuses on the NCIS fall fatality data as it contains much greater detail than the ABS data. The ABS data also lacks the narrative detail provided by the NCIS and suffers from inconsistent coding from year to year.

Table 9.0.3 State by state comparison- NCIS building fall deaths
VIC NSW QLD WA SA TAS ACT NT Total
n % n % n % n % n % n % n % n % n %
Product
Building Component or Fitting 374 63.5 304 61.3 176 59.3 39 26.9 24 25.5 31 53.4 8 42.1 6 40.0 962 56.2
Furnishing 83 14.1 50 10.1 23 7.7 18 12.4 7 7.4 4 6.9 1 5.3 3 20.0 189 11.0
Ground Surface and Conformations 47 8.0 64 12.9 42 14.1 44 30.3 19 20.2 11 19.0 7 36.8 1 6.7 235 13.7
Other and unspecified 85 14.4 78 15.7 56 18.9 44 30.3 44 46.8 12 20.7 3 15.8 5 33.3 327 19.1
All 589 100.0 496 100.0 297 100.0 145 100.0 94 100.0 58 100.0 19 100.0 15 100.0 1713 100.0
Detailed product
Bed 60 10.2 26 5.2 14 4.7 4 2.8 5 5.3 3 5.2 1 5.3 3 20.0 116 6.8
Floor 266 45.2 127 25.6 54 18.2 9 6.2 4 4.3 9 15.5 2 10.5 0 0.0 471 27.5
Ground surface 31 5.3 29 5.8 34 11.4 31 21.4 10 10.6 6 10.3 7 36.8 1 6.7 149 8.7
Stairs steps 58 9.8 85 17.1 54 18.2 12 8.3 8 8.5 9 15.5 2 10.5 2 13.3 230 13.4
Other and unspecified 174 29.5 229 46.2 141 47.5 89 61.4 67 71.3 31 53.4 7 36.8 9 60.0 747 43.6
All 589 100.0 496 100.0 297 100.0 145 100.0 94 100.0 58 100.0 19 100.0 15 100.0 1713 100.0

RELATIONSHIP BETWEEN SLIPS, TRIPS & FALLS & THE DESIGN & CONSTRUCTION OF BUILDINGS 67
Table 9.0.3 shows:
in 64% of Victorian cases a building component or fitting was implicated in the fall death; this is higher than the Australian overall proportion (56%) and higher than in every state or territory
ground surface and conformations were implicated in a further 8% of deaths in Victoria, this was much lower than the overall Australian proportion (14%) and lower than all state and territories except for the Northern Territory (7%).
Table 9.0.3 also shows:
in 10% of Victorian cases a bed was implicated in the fall death; this is well about the Australian overall proportion (7%) and higher than in every state or territory with the exception of the Northern Territory (20%)
the proportion of deaths in which the floor was implicated was much higher in Victoria (45%) than Australia overall (28%) and all other states and territories
the proportion of deaths in which the ground surface was implicated was lower in Victoria (5%) than Australia overall (9%) and all other states and territories
the proportion of deaths in which stairs and steps were implicated was lower in Victoria (9.8%) than Australia overall (13.4%) and lower than all other states and territories except WA (8.3%) and SA (8.5%).

68 MONASH UNIVERSITY ACCIDENT RESEARCH CENTRE
9.1 ANALYSIS OF VICTORIAN DEATHS FROM FALLS OCCURRING IN BUILDINGS: OVERVIEW
The data below includes all fall related deaths occurring in buildings between July 2000 and June 2005 investigated by the Victorian State Coroner and cases completed by December 2006. Cases still open in December 2006 were not able to be included in the data.
Cases were included and excluded based on criteria decided upon in consultation with the ABCB, as outlined in section 9.9.
The coding system for residential aged care for the National Coroners Information System (NCIS) differs from the national hospitalisations coding.
All Victorian building related fall fatalities
Table 9.1.1 Frequency and percentage of deaths related to falls occurring in buildings by age group, 2000/01-2004/05, Victoria.
N %
< 1 * *
1-9 * *
15-24 6 1.2
25-34 8 1.6
35-44 8 1.6
45-54 21 4.3
55-64 41 8.5
65-74 57 11.8
75+ 340 70.1
Total 485 100.0
The majority (70.1%, n=340) of deaths resulting from falls occurring in buildings were people aged 75 years and over.
Combined, persons aged 45 and over account for 94.6% (n=459) of deaths resulting from falls in buildings.
Table 9.1.2 Frequency and percentage of deaths related to falls occurring in buildings by sex, 2000/01-2004/05, Victoria.
N %
Female 216 44.5
Male 269 55.5
Total 485 100.0
Males account for 55.5% (N=269) building fall related deaths and females for 44.5% (n=216). These proportions contrast with the non-fatal injury data, where females account for the majority of all fall injury.

RELATIONSHIP BETWEEN SLIPS, TRIPS & FALLS & THE DESIGN & CONSTRUCTION OF BUILDINGS 69
Table 9.1.3 Frequency and percentage of deaths related to falls occurring in buildings by broad activity, 2000/01-2004/05, Victoria.
N %
Being nursed or cared for 209 43.1
Domestic duties 46 9.5
Leisure activity 5 1.0
Other specified activity 63 13.0
Resting sleeping eating other personal activity 86 17.7
Unspecified activity 71 14.6
Working for income 5 1.0
Total 485 100.0
Persons “being nursed or cared for” constitute the largest activity group (43.1%, n=209) among building fall related deaths in Victoria.
Resting, sleeping, eating and other personal activity accounts for 17.7% (n=86) of these fatalities.
Table 9.1.4 Frequency and percentage of deaths related to falls occurring in buildings by broad location, 2000/01-2004/05, Victoria.
N %
Home 227 46.8
Hospital or other health service 192 39.6
Other specified place * *
Recreation area place mainly for informal recreational activity * *
Residential or correctional facility (including residential aged care)
39 8.0
School other institution or public administrative area 6 1.2
Trade or service area 19 3.9
Total 485 100.0
Combined, 94.4% (n=458) of fatalities resulting from falls in buildings occurred in the home, a hospital or health service area or a residential or correctional facility (overwhelmingly nursing homes and aged care facilities).
Of these locations, the home (46.8%, n=227) is the most prominent site, followed by Hospital or other health service area (39.6%, n=192) and residential of correctional facility (8.0%, n=39) respectively.

70 MONASH UNIVERSITY ACCIDENT RESEARCH CENTRE
Table 9.1.5 Frequency and percentage of deaths related to falls occurring in buildings by specific location, 2000/01-2004/05, Victoria.
N %
Boarding house hostel private hotel * *
Bus or railway station * *
Caravan mobile home residential * *
Entertainment drinking place * *
Flat apartment terrace house 52 10.7
Free standing house 169 34.8
Holiday resort * *
Home for elderly frail 26 5.4
Hospital 98 20.2
Other specified home * *
Other specified hospital or other health service 94 19.4
Other specified place * *
Other specified residential correctional facility 13 2.7
Other specified school other institution or public administrative area * *
Other specified trade or service area 8 1.6
Primary school public private state * *
Public administration place * *
Shop 6 1.2
Unspecified home * *
Total 485 100.0
Over a third (34.8%, n=169) of fall related deaths occurring in buildings occurred in free standing houses and 10.7% (n=52) occurred in flats, apartments or terrace houses.
20.2% (n=98) of these falls leading to deaths occurred in a hospital, 19.4% (n= 94) in another specified health service area, and 5.4% (n=26) in a home for the elderly or frail.

RELATIONSHIP BETWEEN SLIPS, TRIPS & FALLS & THE DESIGN & CONSTRUCTION OF BUILDINGS 71
Table 9.1.6 Frequency of deaths related to falls occurring in buildings by detailed cause group, 2000/01-2004/05, Victoria.
N %
fall:from, out of or through building or structure 25 5.2
fall:involving bed 54 11.1
fall:involving chair 14 2.9
fall:involving other furniture 7 1.4
fall:involving wheelchair * *
fall:on and from ladder 22 4.5
fall:on and from scaffolding * *
fall:on and from stairs and steps 56 11.5
fall:other fall on same level 94 19.4
fall:same level from slipping, tripping, stumbling 9 1.9
fall:unspecified fall 196 40.4
fall:while being carried or supported by other persons * *
Total 485 100.0
The detailed cause of fall was unspecified in largest proportion (40.4%, 196) of fatalities related to falls occurring in buildings, and 19.4% (n=94) were coded as “other fall on same level”.
11.5% (n=560) of these fall fatalities occurred on and from stairs and steps, and 11.1% (n=54) of these fatalities involved a person falling out of, falling while getting out of, or falling onto a bed.
4.5% (n=22) of these fall fatalities were falls from ladders.
Table 9.1.7 Frequency and percentage of deaths related to falls occurring in buildings, age group by activity, 2000/01-2004/05, Victoria.
Being nursed
or cared
for Domestic
duties Leisure activity
Other specified activity
Resting sleeping eating other
personal activity
Unspecified activity
Working for
income Total
< 1 * 0 0 0 * 0 0 *
1-9 0 0 0 * 0 0 0 *
15-24 0 0 * * 0 0 * 6
25-34 * 0 * * * * 0 8
35-44 * 0 0 * * 0 * 8
45-54 * * 0 7 7 * 0 21
55-64 5 * * 13 9 11 0 41
65-74 17 15 0 * 11 8 * 57
75+ 181 28 * 31 53 46 0 340
Total 209 46 5 63 86 71 5 485

72 MONASH UNIVERSITY ACCIDENT RESEARCH CENTRE
As shown earlier, the vast majority of fatalities resulting from falls in buildings are to middle aged and elderly people, this is particularly evident among those who died from falls sustained while undertaking domestic duties.
There were no fatalities recorded in Victoria for those aged under 44 years undertaking domestic duties, and 93.5% of fatalities while undertaking domestic duties were aged 65 (n=43) years and over.
Table 9.1.8 Frequency and percentage of deaths related to falls occurring in buildings by age group by gender, 2000/01-2004/05, Victoria.
Female Male Total
< 1 * * *
1-9 * 0 *
15-24 0 6 6
25-34 0 8 8
35-44 0 8 8
45-54 * 18 21
55-64 10 31 41
65-74 17 40 57
75+ 183 157 340
Total 216 269 485
Male fatalities substantially exceed female fatalities in all adult age groups except for those aged over 75 years.
Table 9.1.9 Frequency of deaths related to falls occurring in buildings sex by location, 2000/01-2004/05, Victoria.
Home
Hospital or other health service
Other specified
place
Recreation area place mainly for informal
recreational activity
Residential or
correctional facility
(including residential aged care)
School other institution or
public administrative
area
Trade or
service area
Female 84 101 0 0 26 * * 216
Male 143 91 * * 13 5 15 269
Total 227 192 * * 39 6 19 485
Males account for 63.0% (n=143) of fall fatalities in the home, while females account for a slight majority of fall fatalities in hospitals and health service areas (52.65, n=101).
Females also account for 66.6% (n=26) of residential/correctional facilities, the vast majority of which occur in nursing homes and aged care facilities.

RELATIONSHIP BETWEEN SLIPS, TRIPS & FALLS & THE DESIGN & CONSTRUCTION OF BUILDINGS 73
Table 9.1.10 Frequency of deaths related to falls occurring in buildings detailed cause group by sex, 2000/01-2004/05, Victoria.
Female Male Total
fall:from, out of or through building or structure
* 21 25
fall:involving bed 34 20 54
fall:involving chair 9 5 14
fall:involving other furniture * * 7
fall:involving wheelchair 0 * *
fall:on and from ladder 0 22 22
fall:on and from scaffolding 0 * *
fall:on and from stairs and steps 16 40 56
fall:other fall on same level 47 47 94
fall:same level from slipping, tripping, stumbling
5 * 9
fall:unspecified fall 94 102 196
fall:while being carried or supported by other persons
* * *
216 269 485
Males account for the vast majority of fatalities incurred in circumstances that would usually be associated with home and building maintenance. Males constitute a combined total 91.7% (n=44) of all fall deaths from, out of or through building or structure, on and from ladders and on and from scaffolding in a home environment.
Males also account for 71.4% (n=40) of deaths from falls on and from stairs and steps.
“Other falls on same level” are evenly split between genders (50.0%, n=94 each) and males slightly exceed females in terms of fatalities arising from unspecified falls in buildings (52.0%, n=102).

74 MONASH UNIVERSITY ACCIDENT RESEARCH CENTRE
9.2 HOME FALL FATALITIES: VICTORIA
Table 9.2.1 Frequency and percentage of deaths related to falls occurring in the home by age group, 2000/01-2004/05, Victoria.
N %
< 1 * *
1-9 * *
15-24 * *
25-34 * *
35-44 5 2.2
45-54 17 7.5
55-64 33 14.5
65-74 38 16.7
75+ 125 55.1
Total 227 100.0
As with fatalities related to falls in buildings, fatalities arising from falls in the home are concentrated around those aged over 44 years (93.9%, n=213).
Table 9.2.2 Frequency and percentage of deaths related to falls occurring in the home by sex, 2000/01-2004/05, Victoria.
N %
Female 84 37.0
Male 143 63.0
Total 227 100.0
Males account for almost two thirds of Victorian home fall fatalities in the time period covered by this analysis (63.0%, n=143), this proportion of 7.5% higher than the percentage of all building fall fatalities that are males.
Table 9.2.4 Frequency and percentage of deaths related to falls occurring in the home by broad activity, 2000/01-2004/05, Victoria.
N %
Being nursed or cared for * *
Domestic duties 43 18.9
Leisure activity * *
Other specified activity 48 21.1
Resting sleeping eating other personal activity 67 29.5
Unspecified activity 60 26.4
Working for income * *
Total 227 100.0

RELATIONSHIP BETWEEN SLIPS, TRIPS & FALLS & THE DESIGN & CONSTRUCTION OF BUILDINGS 75
“Resting, sleeping, eating or other personal activity” (29.5%, n= 67), “unspecified activity” (26.4%, n=60) and “other specified activity” (21.1%, n=48) account for the majority of home fall fatalities.
Persons who fell while engaged in domestic duties constitute 18.9% (n=43) of home fall deaths recorded in Victoria between 2000/01-2004/05.
Table 9.2.5 Frequency and percentage of deaths related to falls occurring in the home by detailed cause group, 2000/01-2004/05, Victoria.
N %
Fall:from, out of or through building or structure 18 7.9
Fall:involving bed 13 5.7
Fall:involving chair * *
Fall:involving other furniture 5 2.2
Fall:involving wheelchair * *
Fall:on and from ladder 19 8.4
Fall:on and from scaffolding * *
Fall:on and from stairs and steps 41 18.1
Fall:other fall on same level 43 18.9
Fall:same level from slipping, tripping, stumbling 6 2.6
Fall:unspecified fall 76 33.5
Fall:while being carried or supported by other persons * *
Total 227 100.0
Over a third (33.5%, n=76) of fall fatalities in the home are cause coded as “unspecified”.
Same level falls account for 18.9% (n=43) and falls on and from stairs and steps account for 18.1% (n=41) of home fall fatalities.
Table 9.2.6 Frequency of deaths related to falls occurring in the home, activity by age group, 2000/01-2004/05, Victoria.
< 1 1-9 15-24
25-34
35-44
45-54
55-64
65-74
75+ Total
Being nursed or cared for 0 0 0 0 0 0 0 * 0 *
Domestic duties 0 0 0 0 0 * * 14 26 43
Leisure activity 0 0 * * 0 0 * 0 0 *
Other specified activity 0 * * 0 * 5 11 * 26 48
Resting sleeping eating other personal activity
* 0 0 * * 7 9 11 35 67
Unspecified activity 0 0 0 0 0 * 10 8 38 60
Working for income 0 0 * 0 * 0 0 * 0 *
Total * * * * 5 17 33 38 125 227

76 MONASH UNIVERSITY ACCIDENT RESEARCH CENTRE
While 71.8% (n=163) of all home fall fatalities are aged 65 years and over, 93.0% (n=40) of persons suffering fatal falls while undergoing domestic duties are aged 65 years and over.
In a large percentage of cases (26.4%, n=60) the person’s activity at the time of the fatal fall was coded as “unspecified”.
Table 9.2.7 Frequency of deaths related to falls occurring in the home, detailed cause group by age gender, 2000/01-2004/05, Victoria.
Female Male Total
fall:from, out of or through building or structure * 15 18
fall:involving bed 9 * 13
fall:involving chair 0 * *
fall:involving other furniture * * 5
fall:involving wheelchair 0 * *
fall:on and from ladder 0 19 19
fall:on and from scaffolding 0 * *
fall:on and from stairs and steps 11 30 41
fall:other fall on same level 26 17 43
fall:same level from slipping, tripping, stumbling * * 6
fall:unspecified fall 28 48 76
fall:while being carried or supported by other persons * * *
Total 84 143 227
92.1% (n=35) of fall fatalities from, out of or through a building or structure and on and from ladders or scaffolding in the home are males.
73.0% (n=30) of fatalities arising from falls on and from stairs and steps are males. This contrasts with national and Victorian hospital admission data, where females constitute the majority of stair and step fall injuries.

RELATIONSHIP BETWEEN SLIPS, TRIPS & FALLS & THE DESIGN & CONSTRUCTION OF BUILDINGS 77
9.3 BUILDING RELATED FALL FROM HEIGHTS FATALITIES: VICTORIA
9.3.1 Overview
Table 9.3.1 Frequency and percentage of deaths related to falls from height by age group, 2000/01-2004/05, Victoria
N %
1-9 * *
15-24 * *
25-34 6 5.8
35-44 5 4.8
45-54 7 6.7
55-64 14 13.5
65-74 21 20.2
75+ 47 45.2
Total 104 100.0
81.7% (n=89) of fatal falls from height are suffered by those aged 45 years and over.
Table 9.3.2 Frequency and percentage of deaths related to falls from height by sex, 2000/01-2004/05, Victoria
N %
Female 20 19.2
Male 84 80.8
Total 104 100.0
The proportion of male fatalities (80.8%, n=84) related to falls from height is much greater than for all fatal falls in buildings and fatal falls in the home.
Table 9.3.3 Frequency and percentage of deaths related to falls from height by broad activity, 2000/01-2004/05, Victoria
N %
Being nursed or cared for 6 5.8
Domestic duties 29 27.9
Leisure activity * *
Other specified activity 41 39.4
Resting sleeping eating other personal activity
14 13.5
Unspecified activity 8 7.7
Working for income * *
Total 104 100.0

78 MONASH UNIVERSITY ACCIDENT RESEARCH CENTRE
27.9% (n=29) of fall from height fatalities occurred while the person was undertaking domestic duties, 39.4% (n=41) of these fatalities were coded as being engaged in an “other specified activity”.
Table 9.3.4 Frequency and percentage of deaths related to falls from height by broad location, 2000/01-2004/05, Victoria
N %
Home 79 76.0
Hospital or other health service 5 4.8
Other specified place * *
Recreation area place mainly for informal recreational activity * *
Residential correctional facility * *
School other institution or public administrative area * *
Trade or service area 14 13.5
Total 104 100.0
A large majority of fall from height fatalities (76.0%, n= 79) occur in a home environment. This proportion is significantly greater than the 46.8% (n=227) of all building related fall fatalities that occur in homes.
Table 9.3.5 Frequency and percentage of deaths related to falls from height by mechanism, 2000/01-2004/05, Victoria
N %
Fall through roof 6 5.8
Fall from roof 11 10.6
Fall off balcony * *
Fall from window * *
Fall through skylight * *
Fall from ladder 22 21.2
Fall on/down stairs 57 54.8
Total 104 100.0
Over fifty percent (54.8%, n=57) of included fall from height fatalities were falls on or down stairs.
Falls from ladders constitute 21.2% (n=22) of these deaths, and falls through roofs account for 10.6% (n=11).
Activity
All fall from height fatalities while undertaking domestic duties included in this analysis are persons aged 45 years and over.

RELATIONSHIP BETWEEN SLIPS, TRIPS & FALLS & THE DESIGN & CONSTRUCTION OF BUILDINGS 79
Table 9.3.6 Frequency of deaths related to falls from height, age group by detailed cause, 2000/01-2004/05, Victoria.
fall:from, out of or through building
or structure
fall:on and from
ladder fall:on and from
scaffolding fall:on and from stairs and steps
Total
1-9 * 0 0 0 *
15-24 * 0 0 0 *
25-34 * 0 0 * 6
35-44 * * 0 * 5
45-54 * * 0 * 7
55-64 * * 0 10 14
65-74 6 8 0 7 21
75+ 6 10 * 30 47
Total 25 22 * 56 104
Over fifty percent (53.6%, n=30) of deaths resulting from falls on and from stairs and steps are aged 75 years and over.
Table 9.3.7 Frequency of deaths related to falls from height, location by sex, 2000/01-2004/05, Victoria.
Female Male Total
Home 14 65 79
Hospital or other health service * * 5
Other specified place 0 * *
Recreation area place mainly for informal recreational activity 0 * *
Residential correctional facility * 0 *
School other institution or public administrative area * * *
Trade or service area * 11 14
Total 20 84 104
76.0% (n=79) of fall from height fatalities occur in the home, and 82.3% (n=65) of these deaths are males.

80 MONASH UNIVERSITY ACCIDENT RESEARCH CENTRE
9.4.2 Stairs and Steps Fatalities: Victoria
Age
Table 9.4.1 * Frequency and percentage of deaths related to falls occurring on stairs and steps by age group, 2000/01-2004/05, Victoria.
N %
25-34 * *
35-44 * *
45-54 * *
55-64 10 17.9
65-74 7 12.5
75+ 30 53.6
Total 56 100.0
There were no fatalities from falls on and from stairs and steps aged less than 25 years.
Over eighty percent (83.9%, n=47) of Victorian stair and step fall fatalities are aged 55 years and over.
Sex
Table 9.4.2 Frequency and percentage of deaths related to falls occurring on stairs and steps by sex, 2000/01-2004/05, Victoria.
N %
Female 16 28.6
Male 40 71.4
Total 56 100.0
71.4% (n=40) of stair and step fall fatalities are male, this is substantially higher than the male proportion of all building related fall fatalities (55.5%) but less than that displayed in the analysis of all fall from height fatalities (80.8%).
Location
Table 9.4.3 Frequency and percentage of deaths related to falls occurring on stairs and steps by location, 2000/01-2004/05, Victoria.
N %
Home 41 73.2
Hospital or other health service * *
Recreation area place mainly for informal recreational activity * *
Residential correctional facility * *
School other institution or public administrative area * *
Trade or service area 9 16.1
Total 56 100.0

RELATIONSHIP BETWEEN SLIPS, TRIPS & FALLS & THE DESIGN & CONSTRUCTION OF BUILDINGS 81
73.2% (n=41) of Victorian stair and step fall related fatalities occurred in a home environment, and 16.1% (n=9) occurred in a trade or service area.
Activity
The majority of stair and step fall related fatalities are coded as “other specified activity” (55.4%, n=31).
23.2% (n=13) of these deaths are coded as occurring while the person was “resting, sleeping, eating or other personal activity”.
Age by Sex
All stair and step fall fatalities aged less than 45 years are males, and there are only a total of three female fatalities under the age of 75 years.
Location by Age Group
Table 9.4.4 Frequency of deaths related to falls occurring on stairs and steps, location by age group, 2000/01-2004/05, Victoria.
25-34 35-44 45-54
55-64
65-74
75+ Total
Home * * * 9 6 21 41
Hospital or other health service 0 0 0 0 0 * *
Recreation area place mainly for informal recreational activity
0 0 0 0 0 * *
Residential correctional facility 0 0 0 0 0 * *
School other institution or public administrative area
0 0 0 0 0 * *
Trade or service area * * * * * * 9
Total * * * 10 7 30 56
Nearly three quarters 73.2% (n=41) of all Victorian stair and step fall related fatalities included in this analysis occurred in the home.
9.5 RESIDENTIAL AGED CARE FACILITIES: FALL FATALITIES (NURSING HOMES & HOMES FOR THE ELDERLY)
Due to terminology used by National Coroners Information System (version 1) residential aged care facilities have been divided into two types of facilities for analysis: nursing homes and homes for the elderly.
In the analysis of fatal falls in nursing homes, residential aged care facilities and hospitals, the data aggregated under the location categories of “hospital or other health service” and “residential or correctional facility” in tables 9.30 – 9.43 have been recoded and analysed separately in order provide greater insight into the circumstances surrounding the fatal fall. The categories are as follows:
Nursing homes are assumed to include all locations coded as “hospital or other health service” with the activity code “being nursed or cared for”.

82 MONASH UNIVERSITY ACCIDENT RESEARCH CENTRE
Other residential aged care facilities are assumed to include all locations coded broadly coded as “residential/correctional facility”, and specifically coded as “home for the elderly, frail”.
Hospitals are assumed to include all locations broadly coded as “hospital or other health service” and specifically coded as “hospital”.
Nursing homes
A total of 94 deaths related to falls occurring in nursing homes were investigated by the Victorian Coroner in 2000/01 to 2004/05. Deaths related to falls in nursing homes accounted for over 19 percent of deaths related to falls occurring in buildings.
Age
Table 9.5.1 Frequency and percentage of deaths related to falls occurring in nursing homes by age group, 2000/01-2004/05, Victoria.
Age group N %
0- 44 0 0
45-54 * *
55-64 0 0
65-74 * *
75+ 89 94.68
Total 94 100
Persons aged 75 years and over were 95 percent of deaths related to falls occurring in nursing homes. Persons aged 65 years and over were 99 percent of all deaths.
Sex
Table 9.5.2 Frequency and percentage of deaths related to falls occurring in nursing homes by sex, 2000/01 – 2004/05, Victoria.
Sex N %
Female 51 54 .0%
Male 43 46.0%
Total 94 100.0%
Females were 54 percent of all deaths related to falls occurring in nursing homes and males were 46 percent of deaths.

RELATIONSHIP BETWEEN SLIPS, TRIPS & FALLS & THE DESIGN & CONSTRUCTION OF BUILDINGS 83
Table 9.5.3 Frequency of deaths related to falls occurring in nursing homes by age group and sex, 2000/01-2004/05, Victoria.
Age group Female Male Total
0- 44 0 0 0
45-54 0 * *
65-74 * * *
75+ 49 40 89
Total 51 43 94
Females aged 75 years and over were 52 percent (n=49) of all deaths and 96 percent of female deaths.
Males aged 75 years and over were 43 percent (n= 40) of all deaths and 93 percent of male deaths.
Cause of fall in nursing homes
Table 9.5.4 Frequency and percentage of deaths related to falls occurring in nursing homes by cause, 2000/01-2004/05, Victoria.
Cause of fall N %
Fall: involving bed 17 18.1
Fall: involving chair 6 6.4
Fall: involving other furniture * *
Fall: involving wheelchair * *
Fall: other fall on same level 19 20.2
Fall: unspecified fall 49 52.1
Total 94 100.0
The cause of the fall was unspecified in over 52% of deaths.
The most common specified causes of fall related deaths in nursing homes were: fall: other fall on same level (20% n=19), a fall involving a bed (18% n=17), and fall: involving a chair (6% n=6).
Activity at time of fall in nursing home
The activity at the time of fall for deaths related to falls occurring in nursing homes in Victoria in 2000/01-2004/05 was ‘being nursed or cared for’ for all cases (n=94).
Homes for the elderly
A total of 26 deaths related to falls occurring in homes for the elderly in 2000/01 to 2004/05 in Victoria were reported to the Victorian Coroner. Deaths related to falls in homes for the elderly accounted for over 5 percent of deaths related to falls occurring in buildings.

84 MONASH UNIVERSITY ACCIDENT RESEARCH CENTRE
Sex
Table 9.5.5 Frequency and percentage of deaths related to falls occurring in homes for the elderly by sex in 2000/01-2004/05, Victoria.
Sex N %
Female 18 69.2
Male 8 30.8
Total 26 100.0
Females were 69.0% (n=18) of all deaths related to falls occurring in homes for the elderly and males were 30% (n=8) of deaths.
Age
All deaths related to falls occurring in homes for the elderly in 2000/01 to 2004/05 in Victoria were in persons aged 75 years and over (n=26).
The mean age was 87.9 (standard deviation 5.74) and a minimum age of 76 years and a maximum age of 98 years.
Mean age for females was 89.7 years and for males 83.8 years.
Cause of falls in homes for the elderly
Table 9.5.6 Frequency and percentage of deaths related to falls occurring homes for the elderly by cause, 2000/01-2004/05, Victoria.
Cause of fall N %
Fall: involving bed * *
Fall: involving chair * *
Fall: on and from stairs and steps * *
Fall: other fall on same level 7 26.9
Fall: same level from slipping, tripping and stumbling * *
Fall: unspecified fall 12 46.2
Total 26 100.0
The cause of the fatal fall was unspecified in over 46% of deaths.
The most common specified cause of a fall related to deaths in homes for the elderly were: ‘other falls on the same level’ (27% n=7); fall: involving a bed (12% n=3) and fall: involving a chair (8% n=2).

RELATIONSHIP BETWEEN SLIPS, TRIPS & FALLS & THE DESIGN & CONSTRUCTION OF BUILDINGS 85
Activity at time of fall – falls in homes for the elderly
Table 9.5.7 Frequency and percentage of deaths related to falls occurring in homes for the elderly, by activity at time of fall, 2000/01-2004/05, Victoria.
Activity at time of fall N %
Being nursed or cared for 12 46.2
Resting, sleeping, eating or other personal activity 9 34.6
Unspecified activity 5 19.2
Total 26 100.0
Being nursed or cared for was the activity being undertaken when the fall incident occurred for 46 percent (n=12) of persons. The other major activity being undertaken at the time of the fall incident was ‘resting, sleeping, eating or other personal activity’ (35% n=9).
9.6 HOSPITALS FALL FATALITIES: VICTORIA
9.6.1 Overview
A total of ninety eight deaths related to falls occurring in hospitals in 2000/01 to 2004/05 in Victoria were reported to the Victorian Coroner. Deaths related to falls in hospitals accounted for over 20 percent of deaths related to falls occurring in buildings.
Age
Table 9.6.1.1 Frequency and percentage of deaths related to falls occurring in hospitals by age group, 2000/01-2004/05, Victoria.
Age group N %
< 1 * *
1-14 0 0
15-24 0 0
25-34 * *
35-44 * *
45-54 * *
55-64 5 5.1
65-74 12 12.2
75+ 76 77.6
Total 98 100.0
Over three quarters of deaths occurred in the 75 years and over age group (78% n=76). Persons aged 65 years and over were 90 percent of all deaths (n=88).
Mean age of deaths related to falls occurring in hospitals was 78.6 years with a maximum of 98 years and a minimum of 0 years (standard deviation =14.8).

86 MONASH UNIVERSITY ACCIDENT RESEARCH CENTRE
Sex
Table 9.6.1.2 Frequency and percentage of death related to falls occurring in hospitals by gender, 2000/01-2004/05, Victoria.
Gender N %
Female 50 51.0
Male 48 49.0
Total 98 100.00
Females accounted for 51.0% of the deaths and males 49%.
Table 9.6.1.3 Frequency of deaths related to falls occurring in hospitals by age group and sex, 2000/01-2004/05, Victoria.
Age group Female Male Total
< 1 * 0 *
25-34 0 * *
35-44 0 * *
45-54 0 * *
55-64 * * 5
65-74 5 7 12
75+ 42 34 76
Total 50 48 98
Females aged 75 years and over were 43 percent (n=42) of all fall related deaths occurring in hospitals and 84 percent of female deaths.
Males aged 75 years and over were 35 percent (n=34) of all fall related deaths occurring in hospitals and 71 percent of male deaths.

RELATIONSHIP BETWEEN SLIPS, TRIPS & FALLS & THE DESIGN & CONSTRUCTION OF BUILDINGS 87
Cause of fall in hospital
Table 9.6.1.4 Frequency and percentage of deaths related to falls occurring in hospitals by cause, 2000/01-2004/05, Victoria
Cause of fall N %
Fall: from, out of or through building or structure * *
Fall: involving bed 18 18.4
Fall: involving chair * *
Fall: on and from ladder * *
Fall: on and from stairs and steps * *
Fall: other fall on same level 16 16.3
Fall: same level from slipping, tripping, stumbling * *
Fall: unspecified fall 52 53.1
Fall: while being carried or supported by other persons * *
Total 98 100.0
The cause was unspecified in over 53% of these fatal falls.
The most common specified cause of falls related to deaths in hospitals was a fall from bed (18% n=18), followed by other falls on the same level (16% n=16) and a fall involving a chair (4% n=4).
Activity at time of fall
The activity at the time of fall for deaths related to falls occurring in hospitals in Victoria in 2000/01-2004/05 was ‘being nursed or cared for’ for all cases (n=98)
9.7 FALLS FROM BEDS FATALITIES: VICTORIA
9.7.1 OVERVIEW
A total of 54 deaths related to falls from beds in 2000/01 to 2004/05 were reported to the Victorian Coroner. Deaths related to falls from beds in buildings were over 11 percent of deaths related to falls occurring in buildings.
Age
Table 9.7.1.1 Frequency and percentage of deaths in buildings related to falls from bed by age group, 2000/01- 2004/05, Victoria
Age group N %
0- 44 0 0
45-54 * *
55-64 * *
65-74 * *
75+ 48 88.9
Total 54 100.0

88 MONASH UNIVERSITY ACCIDENT RESEARCH CENTRE
Eighty nine percent of deaths from falls from beds were persons aged 75 years and over (n= 48). Persons aged 65 years and over were 93 percent of all deaths. No deaths were recorded for persons under the age of 45 years.
Sex
Table 9.7.1.2 Frequency and percentage of deaths related to falls from beds in buildings by sex, 2000/01-2004/05, Victoria
Gender N %
Female 34 63.0
Male 20 37.0
Total 54 100.0
Females deaths were 63% (n=34) of all deaths due to falls from beds, with males 37% (n=20) of deaths.
Table 9.7.1.3 Frequency of deaths related to falls from beds by age group and sex, 2000/01-2004/05, Victoria
Age Group Female Male Total
45-54 * 0 *
55-64 * * *
65-74 * 0 *
75+ 29 19 48
Total 34 20 54
Females aged 75 years and greater were 54 percent (n=29) of all deaths related to falls from beds and 85 percent of female deaths.
Males aged 75 years and greater were 35% (n=19) of all deaths related to falls from beds and 95 percent of male deaths.
Table 9.7.1.4 Frequency and percentage of deaths related to falls from beds occurring in buildings by location of fall, 2000/01-2004/05, Victoria
Location of fall N %
Home 13 24.0
Hospital 18 33.0
Nursing Home 17 31.0
Home for the elderly * *
Residential correctional facility (not home for elderly) * *
Total 54 100.0
About a third of the deaths (33% n=18) were related to falls from beds in hospitals, 31 percent (n=18) falls from beds in nursing homes and a quarter of deaths (24% n=13) to falls from bed in the home.

RELATIONSHIP BETWEEN SLIPS, TRIPS & FALLS & THE DESIGN & CONSTRUCTION OF BUILDINGS 89
Activity at time of fall- falls from beds
Table 9.7.1.5 Frequency and percentage of deaths related to falls from beds in buildings by activity at time of fall, 2000/01-2004/05, Victoria
Activity at time of fall N %
Being nursed or cared for 40 74.1
Other specified & unspecified activity * *
Resting, sleeping, eating, other personal activity 12 22.2
Total 54 100.0
74% (n=40) of persons were being nursed or cared for at the time of the fall. 22% (n=12) were ‘resting, sleeping eating or other personal activity’.
9.8 FALL RELATED HOSPITAL SEPARATIONS IN AUSTRALIA
9.8.1 Introduction
The following data relates to national hospital utilisations due to fall related hospital admissions. One of the disadvantages of the national hospital utilisation data is that it records events as hospital separations and not as individuals. The data presented in the following section is national hospital separations. It is important to note that hospital separations do not equal fall events, as not all fall events result in injury or hospital admissions. Hospital separations do not directly equate with hospitals admissions either, as the number of hospital separations may be greater than the number of hospital admissions for fall related admissions due to the inclusion of transfers between hospitals in separation data. Hospital separations may also include multiple counting due to re-admissions for the same fall event.
In an attempt to quantify the possible difference between hospital admissions and hospital separations due to inter hospital transfers, the proportion of modes of admissions known to be ‘admitted patient transfers’ is provided for each type of data category in a box at the beginning of the appropriate sections. Currently no method of excluding readmissions is available for the national data. Overall, the factor by which hospital separations over-represents the actual number of hospitalised fall injury is approximately 10%.
Where data cell counts were less than 5, data has been either collapsed or suppressed (denoted by *) to prevent possible patient identification, and this is noted in relevant tables.
Injury severity has been coded using the International Classification of Diseases-based Injury Severity Score (ICISS). Further information on this code is provided at the end of this chapter.
The information presented in the following sections uses separations coded as other external causes of accidental injury - Falls W00-W19. This data excludes: assault, fall (in) (from): animal, burning building, into fire, into water, machinery, transport vehicle and intentional self-harm. Further information on data and coding is provided at the end of this chapter.

90 MONASH UNIVERSITY ACCIDENT RESEARCH CENTRE
9.8.2 Unintentional Fall Related Hospital Separations, Australia, 1999/00-2004/05 (n = 1,018,651)
There was a total of 1,018, 651 fall related hospital separations for the 6 years 1999/00 to 2004/05, an average of 169,775 fall related hospital separations per year. This overview data of all fall separations is presented here to provide a context for falls in buildings (see section 9.8).
Age and sex distribution
0
5,000
10,000
15,000
20,000
25,000
30,000
35,000
0–4
5–9
10–1
4
15–1
9
20–2
4
25–2
9
30–3
4
35–3
9
40–4
4
45–4
9
50–5
4
55–5
9
60–6
4
65–6
9
70–7
4
75–7
9
80–8
4
85+
Age group
Fre
qu
ency
of
adm
issi
on
Males
Females
Persons
Figure 9.8.2.1 Annual average frequency of fall related hospital separations by age and
sex (5 years groups to 85+), Australia, 1999/00-2004/05.
Age
Annual average fall related hospital separations increased in each age group over the 60-65 years age group, with annual average separations rising from 7,511 for the age group 65-69 years to 34,739 separations for the group aged 85 years or greater.
Annual average fall related hospital separations were higher in the 5-9 age group than all other age groups under the age group 70–74 years, with an annual average of 10, 345 fall related hospitalisations for persons aged 5-9 years.
Sex
Annual average fall related hospital separations were higher for males than females in each of the 5 year age groupings from 0-4 to 50-54. This situation was reversed in the 5 year age groupings from 55-59 to 85 +, with annual average fall related hospitalisations in females higher than in males.

RELATIONSHIP BETWEEN SLIPS, TRIPS & FALLS & THE DESIGN & CONSTRUCTION OF BUILDINGS 91
0
2,000
4,000
6,000
8,000
10,000
12,000
14,000
Age group
Rat
e p
er 1
00,0
00 p
op
ula
tio
n
Males
Females
Persons
Males 677.8 859.4 860.4 559.5 446.1 395.9 346.7 344.1 357.6 395.7 436.9 519.7 641.2 888.3 1414.7 2559.8 4790.7 9754.1
Females 543.6 678.6 366.3 170.7 193.0 199.8 202.0 211.2 242.2 302.8 417.8 604.3 821.0 1226.1 2155.6 4119.2 7651.1 13948.3
Persons 612.5 771.4 619.5 369.6 321.9 298.0 273.8 277.3 299.6 349.0 427.4 561.5 730.5 1059.8 1802.7 3429.6 6524.4 12637.9
0–4 5–9 10–14 15–19 20–24 25–29 30–34 35–39 40–44 45–49 50–54 55–59 60–64 65–69 70–74 75–79 80–84 85+
Figure 9.8.2.1 Annual average rate of fall related age specific hospital separations by age
and sex (5 year groups to 85+), Australia, 1999/00-2004/05.
Age
The rate of fall related hospital separations increases sharply from 1059.8 per 100,000 of population in the 65-69 age group to 12637.9 per 100,000 of population for persons aged 85 plus.
Rates for younger age groups were higher than those for adults less than 65 years of age, with rates over 600 per 100,000 for all 5 year age groupings under 15 years of age.
Sex
The sex specific rate per 100, 000 population for fall related hospital separations for all 5 year age groupings under 55 years was higher in males than females, however after the age of 55 the female age specific rates for all 5 year age groupings was higher than males.
9.8.3 Trend in the frequency and rate of fall related hospital separations
Trend analysis covers the 6 year period from July 1999 to June 2005. Age adjusted rates (Figure 9.8.3.1) were calculated using direct standardisation, taking the estimated resident population as the Australian population on the 30th June 2001.

92 MONASH UNIVERSITY ACCIDENT RESEARCH CENTRE
Frequency
0
20,000
40,000
60,000
80,000
100,000
120,000
140,000
160,000
180,000
200,000
Year of separation from hospital
Fre
qu
ency
of
adm
issi
on
0–14
15–29
30–44
45–59
60–74
0–14 27184 26727 25976 25909 26951 26816
15–29 14072 13400 13189 12869 13415 13821
30–44 12501 12473 12718 12230 12870 13181
45–59 15272 15476 15954 16024 17371 18595
60–74 23618 23960 24263 24667 26041 28171
75+ 63405 67981 72836 75920 82395 90392
All ages 156052 160020 164937 167623 179043 190976
1999–00 2000–01 2001–02 2002–03 2003–04 2004–05
Figure 9.8.3.1 Trend in the frequency of fall related hospital separations by broad age
group, Australia, 1999/00-2004/05
The frequency of separations for fall related hospitalisations for all ages increased by 22% (from 156,052 in 1999/00 to 190,976 separations in 2004/05).
The frequency of separations for fall related hospitalisations increased in the 60-74 age group by 19% (from 23,618 to 28,171) and in the 75+ age group by 43% (from 63,405 to 90,392).

RELATIONSHIP BETWEEN SLIPS, TRIPS & FALLS & THE DESIGN & CONSTRUCTION OF BUILDINGS 93
9.2.2.2 Rates
0
1,000
2,000
3,000
4,000
5,000
6,000
7,000
8,000
Year of separation from hospital
Rat
e p
er 1
00,0
00 p
op
ula
tio
n
0–14
15–29
30–44
45–59
60–74
75+
Age-std rate (all ages)
0–14 686.4 671.9 651.5 650.2 677.0 673.8
15–29 346.3 330.3 324.6 315.7 326.9 333.3
30–44 286.5 282.9 284.8 271.6 284.6 291.4
45–59 434.7 428.2 429.2 419.8 443.7 464.8
60–74 1128.9 1127.7 1121.7 1119.5 1156.5 1218.7
75+ 6058.5 6237.0 6429.8 6486.3 6810.9 7245.3
Age-std rate (all ages) 833.6 835.3 840.9 837.0 875.1 913.1
1999–00 2000–01 2001–02 2002–03 2003–04 2004–05
Figure 9.8.3.2 Trend in the rates of fall related hospital separations by broad age group,
Australia, 1999/00-2004/05/100,000 population
The all ages (age standardised) fall related hospital separations rate increased by 9.6 % over the 6 year period, from 833.6 separations per 100,000 population per year in 1999/00 to 913.1 separations per 100,000 population per year in 2004/05.
The fall related hospital separation rates for the age specific groups 1-14 years (686.4 to 673.8) and 15-29 years (345.3 to 333.3) decreased slightly with all other age groups rising for the 1990/00-2004/05 time period.
9.8.4 Causes of injury
All fall injury related hospital separations

94 MONASH UNIVERSITY ACCIDENT RESEARCH CENTRE
Table 9.8.4.1 Frequency and percentage of fall related hospital separations ranked by cause, Australia, 1999/00-2004/05 (n=1,018,651)
1999–00 2000–01 2001–02 2002–03 2003–04 2004–05 Total %
Fall on same level from slipping, tripping and stumbling
43,199 46,302 48,450 43,512 44,791 47,770 274,024 26.9%
Slipping NA NA NA 14,869 14,766 15,833 45,475 4.5%
Tripping NA NA NA 22,086 24,374 26,183 72,648 7.1%
Stumbling NA NA NA 6,519 5,651 5,754 17,929 1.8%
Other fall on same level 14,953 16,884 21,837 26,391 30,501 33,339 143,905 14.1%
Fall on and from stairs and steps
8,450 8,769 9,133 9,448 10,156 11,197 57,153 5.6%
Fall involving bed 6,093 6,376 6,763 7,119 7,295 7,675 41,321 4.1%
Other fall from one level to another
7,360 7,281 6,943 6,221 6,145 6,473 40,423 4.0%
Fall involving playground equipment
6,103 5,892 6,084 6,310 6,442 6,284 37,115 3.6%
Other fall on same level due to collision with, or pushing by, another person
5,667 4,952 5,108 4,916 5,410 4,792 30,845 3.0%
Fall involving chair 4,343 4,399 4,563 4,820 5,195 5,480 28,800 2.8%
Fall on and from ladder 3,989 4,119 4,217 4,058 4,428 4,744 25,555 2.5%
Fall from, out of or through building or structure
4,080 3,989 4,085 4,216 4,195 4,336 24,901 2.4%
Fall involving ice-skates, skis, roller-skates or skateboards
3,784 4,164 3,249 3,087 3,382 3,449 21,115 2.1%
Fall from tree 1,694 1,679 1,646 1,573 1,383 1,397 9,372 0.9%
Fall involving other furniture
970 957 1,090 1,058 1,174 1,125 6,374 0.6%
Fall involving wheelchair 762 735 793 853 890 996 5,029 0.5%
Diving or jumping into water causing injury other than drowning or submersion
474 525 524 453 549 559 3,084 0.3%
Fall while being carried or supported by other persons
469 442 463 549 556 532 3,011 0.3%
Fall on and from scaffolding
354 298 271 327 334 377 1,961 0.2%
Fall from cliff 220 217 209 423 407 407 1,883 0.2%
Fall on same level involving ice and snow
83 61 50 90 71 64 419 0.0%
Unspecified fall 43,005 41,979 39,459 42,199 45,739 49,980 262,361 25.8%
Total 156,052 160,020 164,937 167,623 179,043 190,976 1,018,651 100.0%

RELATIONSHIP BETWEEN SLIPS, TRIPS & FALLS & THE DESIGN & CONSTRUCTION OF BUILDINGS 95
Note: Almost 26% of hospital separations were coded as an unspecified fall. The proportions for slipping, tripping and stumbling shown separately are under estimates as these breakdowns were not separately available for 1999/00-2001/02.
The major causes in rank order were:
Fall on same level from slipping, tripping and stumbling (26.9%)
Other fall on same level (14.1 %)
Falls on and from stairs or steps (5.6%)
Fall involving bed (4.1%)
Other fall involving fall from one level to another (4.0%)
9.8.5 Location (place of occurrence of injury)
All fall injury related hospital separations
Broad location
Table 9.8.5.1 Frequency and percentage of fall related hospital separations by location of injury occurrence (broad), Australia, 1999/00-2004/05
1999–00 2000–01 2001–02 2002–03 2003–04 2004–05 Total %
Home 58482 60392 63446 63215 68594 72745 386874 38.00
Residential institution 13958 9795 9538 15612 18073 20091 87067 9.00
School, other institution & public
administration area 11669 19113 21678 18055 17517 17751 105783 10.0
Sports and athletics area 9185 7816 7640 7078 7502 7399 46620 5.0
Street and highway 5078 5628 5748 6026 6012 6383 34875 3.0
Trade and service area 5295 5090 5514 5384 5585 6042 32910 3.0
Industrial and construction area 2200 2072 1573 1368 1401 1197 9811 1.0
Farm 533 469 438 490 403 491 2824 0.0
Other specified place of occurrence 6057 6830 6713 5301 5981 5909 36791 0.40
Unspecified place of occurrence 43595 41880 42321 44471 47811 52905 272983 27.0
Place not reported/not applicable 0 935 328 623 164 63 2113 0.0
Total 156052 160020 164937 167623 179043 190976 1018651 100.0
The location of the fall was unspecified in 27% of all separations. The most common place of occurrence for falls was the home (38%), followed by schools and other institutions and public administration areas (10%), residential institutions (9%) and sports and athletics areas (5%).

96 MONASH UNIVERSITY ACCIDENT RESEARCH CENTRE
Specific location of fall related hospital separations of all falls
Table 9.8.5.2 Frequency and percentage of fall related hospital separations by specific fall locations of injury occurrence, Australia, 2002/03-2004/05
2002–03 2003–04 2004–05 Total %
Driveway to home 1065 989 1020 3074 0.6%
Other and unspecified place in home 62097 67605 71691 201393 37.5%
Prison 77 75 90 242 0.0%
Juvenile detention centre 13 8 7 28 0.0%
Military camp 9 6 13 28 0.0%
Aged care facilities 14870 17392 19260 51522 9.6%
Other specified residential institution 463 472 586 1521 0.3%
Unspecified residential institution 177 120 135 432 0.1%
School 4740 4769 4848 14357 2.7%
Health Service area 12161 11822 11930 35913 6.7%
Other specified institution and public administrative area 1153 926 973 3052 0.6%
Sporting grounds (outdoor) 4689 5060 4817 14566 2.7%
Sporting hall (indoor) 579 644 646 1869 0.3%
Swimming centre 155 164 146 465 0.1%
Racetrack and racecourse 62 70 76 208 0.0%
Skating rink 409 422 422 1253 0.2%
Skiing 510 416 562 1488 0.3%
Other specified sports and athletic areas 375 396 372 1143 0.2%
Sports and athletic areas, unspecified 295 329 358 982 0.2%
Roadway 1306 1675 1744 4725 0.9%
Sidewalk 4097 3974 4274 12345 2.3%
Cycleway 15 13 9 37 0.0%
Other specified public highway, street or road 223 182 220 625 0.1%
Unspecified public highway, street or road 381 168 135 684 0.1%
Shop and store 2316 2548 2711 7575 1.4%
Commercial garage 121 101 111 333 0.1%
Office building 113 98 96 307 0.1%
Cafe, hotel and restaurant 1924 1982 2189 6095 1.1%
Other specified trade and service area 774 704 782 2260 0.4%
Unspecified trade and service area 134 152 153 439 0.1%
Construction area 642 634 571 1847 0.3%
Demolition site 10 6 6 22 0.0%
Factory and plant 268 347 291 906 0.2%
Mine and quarry 83 95 71 249 0.0%
Shipyard 19 16 18 53 0.0%
Other specified industrial and construction area 160 109 93 362 0.1%
Unspecified industrial and construction area 186 194 147 527 0.1%
Farm 490 403 491 1384 0.3%
Area of still water 131 142 148 421 0.1%
Stream of water 245 305 260 810 0.2%
Large area of water 211 292 317 820 0.2%
Beach 616 666 637 1919 0.4%
Forest 154 190 177 521 0.1%
Other specified countryside 383 548 450 1381 0.3%
Parking lot 320 345 429 1094 0.2%
Other specified place of occurrence 3240 3493 3491 10224 1.9%
Unspecified place of occurrence 44471 47811 52905 145187 27.0%
Place not reported/not applicable 691 165 98 954 0.2%
Total 167623 179043 190976 537642 100.0%
The location was unspecified in 27% of separations.
The most common location was the home (37.5%), followed by residential aged care facility at (9.6%), health service area (6.7%) and school (2.7%).

RELATIONSHIP BETWEEN SLIPS, TRIPS & FALLS & THE DESIGN & CONSTRUCTION OF BUILDINGS 97
9.9 FALL RELATED HOSPITAL SEPARATIONS OCCURRING IN BUILDINGS
9.9.1 Overview of the fall related hospital separations that occurred in buildings, Australia 2002/3-2004/5.
The following data have been selected according to criteria determined in consultation with the ABCB. Instructions were to exclude the following locations: driveway to home, sporting grounds-outdoor, swimming centre, racetrack and racecourse, equestrian facility, sports and athletics area skating rink, sports and athletics area skiing, other specified sports & athletics area, sports and athletics area unspecified, street & highway roadway, street & highway sidewalk, street & highway cycleway, other specified public highway, street, road, unspecified public highway street road, unspecified trade and service area, construct area, industrial & construction area demolition site, industrial & construction area mine & quarry, industrial & construction area oil gas extraction, industrial & construction area shipyard, industrial & construction area power station, industrial & construction area factory and plant, other specified industrial & construction area, unspecified industrial & construction area, farm, area of still water, stream of water, large area of water, beach, forest, desert, other specified countryside, parking lot, other specified place of occurrence, unspecified place of occurrence. Falls from cliffs, playground equipment, trees, ice/ skates/ skis/ roller-skates/ skateboards, on and from scaffolding, diving or jumping into water and same level ice and snow have also been excluded.
NB: Admitted patient transfers make up 13.3 % of the total modes of admission in the data on national hospital separations for falls occurring in buildings for the 2002/03-2004/05 years. This results in an over-estimation of actual cases of falls.
9.9.2 Trend in the frequency and rate of hospital separations occurring in buildings
Frequency
Table 9.9.2.1 Frequency of fall related hospital separations occurring in buildings, Australia, 2002/03-2004/05.
2002–03 2003–04 2004–05 Total
Persons 98,862 106,138 112,905 317,905
The total number of separations for 2002/03 to 2004/05 was 317,905. Annual hospital separations increased by more than 14 percent over a three year period, from 98,862 separations in 2002/03 to 112,905 separations in 2004/05.
Table 9.9.2.2 Frequency and percentage of fall related hospital separations occurring in buildings separations by year and sex, Australia, 2002/03-2004/05.
2002–03 2003–04 2004–05 Total %
Males 34,832 37,333 39,999 112,164 35.3%
Females 64,029 68,804 72,903 205,736 64.7%
Persons 98,862 106,138 112,905 317,905 100.0%

98 MONASH UNIVERSITY ACCIDENT RESEARCH CENTRE
Females accounted for 65 percent of the hospital separations while males accounted for 35 percent of all hospital separations.
The frequency of male and female fall related hospital separations occurring in buildings increased, in males by 15 percent (from 34,832 hospital separations in 2002/03 to 39,999 in 2004/05) and 14 percent in females (from 64,029 separations in 2002/03 to 72,903 in 2004/05).
Rates
Table 9.9.2.3 Age standardised rates per 100,000 population of fall related hospital separations occurring in buildings by sex, Australia, 2002/03-2004/05
2002–03 2003–04 2004–05 Total
Males 405.1 422.4 439.5 422.8
Females 541.8 567.6 585.3 565.3
Persons 489.2 511.4 528.2 510.0
The rate of all ages, all person fall related hospital separations occurring in buildings increased from by 8 percent over the three year period, from 489.2 separations per 100,000 population in 2002/03 to 528.2 separations per 100,000 population in 2004/05.
The male fall related hospital separation rate increased by 8.5% percent from 405.1 separations per 100,000 population per year in 2002/03 to 439.5 separations per 100,000 population in 2004/05, and the female rate increased percent from 541.8 separations per 100,000 population in 2002/03 to 585.3 separations per 100,000 population in 2004/05.
9.9.3 Age and sex distribution
Frequency
Table 9.9.3.1 *Frequency of fall related hospital separations occurring in buildings by 5 year age groups and sex, Australia, 2002/03-2004/05.
0–4 5–9 10–14 15–19 20–24 25–29 30–34 35–39 40–44
Males 6,770 4,656 4,551 1,963 1,704 1,746 2,036 2,278 2,764
Females 5,292 3,474 2,250 1,251 1,450 1,629 1,992 2,204 2,591
Persons 12,062 8,130 6,801 3,214 3,154 3,375 4,028 4,482 5,356
45–49 50–54 55–59 60–64 65–69 70–74 75–79 80–84 85+ Total
Males 3,152 3,458 4,272 4,613 5,795 9,031 13,80
9 17,01
4 22,55
2 112,164
Females
3,191 4,110 5,587 6,294 8,702 14,698 27,82
8 41,09
4 72,09
7 205,736
Persons
6,343 7,568 9,859 10,907 14,497 23,730 41,63
7 58,10
9 94,65
0 317,905
The frequency of fall related hospital separations occurring in buildings for 5 year age groups between 2002/03-2004/05 is higher in males for all 5 year age groupings under

RELATIONSHIP BETWEEN SLIPS, TRIPS & FALLS & THE DESIGN & CONSTRUCTION OF BUILDINGS 99
45 years of age. The frequency of fall related hospitalisations is higher for females than males in all 5 year age groupings after the age of 45.
The frequency of fall related hospitalisations occurring in buildings peaks in the 85+ age group for both males and females.
Table 9.9.3.2 Frequency and percentage of fall related hospital separations occurring in buildings by 5 year age groups, Australia, 2002/03-2004/05.
2002/03 2003/04 2004/05 Total %
0–4 3,904 4,047 4,111 12,062 3.8
5–9 2,722 2,778 2,630 8,130 2.6
10–14 2,191 2,297 2,313 6,801 2.1
15–19 1,053 1,097 1,064 3,214 1.0
20–24 1,033 1,060 1,061 3,154 1.0
25–29 1,137 1,066 1,172 3,375 1.1
30–34 1,319 1,307 1,402 4,028 1.3
35–39 1,457 1,511 1,514 4,482 1.4
40–44 1,716 1,790 1,850 5,356 1.7
45–49 1,969 2,102 2,272 6,343 2.0
50–54 2,441 2,525 2,602 7,568 2.4
55–59 2,912 3,418 3,529 9,859 3.1
60–64 3,391 3,524 3,992 10,907 3.4
65–69 4,408 4,744 5,345 14,497 4.6
70–74 7,622 8,010 8,098 23,730 7.5
75–79 13,019 13,918 14,700 41,637 13.1
80–84 17,583 19,370 21,156 58,109 18.3
85+ 28,982 31,574 34,094 94,650 29.8
Total 98,862 106,138 112,905 317,905 100.0
The 85 years plus age group was responsible for almost 30 percent of all hospital separations due to falls occurring in buildings nationally.
The next largest proportion of hospital separations was in the 80-84 years age group (18%) and in the 75-79 years age group (13%).
Persons 65 years and over were responsible for 73.3 % of all hospital separations, with persons aged 75 years and over responsible for 61.2 % of all hospital separations.

100 MONASH UNIVERSITY ACCIDENT RESEARCH CENTRE
Rates
Table 9.9.3.3 Age specific rates per 100,000 population of fall related hospital separations occurring in buildings by 6 broad age groups and sex, Australia, 2002/03-2004/05.
0–14 15–29 30–44 45–59 60–74 75+
Males 260.8 86.3 105.1 185.6 581.7 3,665.7
Females 189.3 71.5 99.6 219.5 866.9 6,493.3
Persons 226.0 79.0 102.3 202.6 726.1 5,358.5
The all person fall related hospital separations rate per 100,000 population increases with age after the 0-14 age group and peaks in the 75+ age group.
Both males and females have very high rates of hospital separations for 2002/03 to 2004/05 in the 75 year plus age group (with males having a rate of 3, 665.7 hospital separations per 100,000 population and females having a rate of 5,358 hospital separations per 100,000 population).
9.9.4 Causes of fall related hospital separations occurring in buildings
Table 9.9.4.1 Frequency and percentage of fall related hospital separations occurring in buildings by cause and year of separation, Australia, 2002/03-2004/05.
2002–03 2003–04 2004–05 Total %
Fall on same level from slipping, tripping and stumbling
29,629 30,527 32,534 92,690 29.2
Slipping 10,523 10,470 11,300 32,293 10.2
Tripping 14,186 15,738 16,931 46,855 14.7
Stumbling 4,885 4,319 4,303 13,507 4.2
Other fall on same level due to collision with, or pushing by, another person
1,017 1,087 1,028 3,132 1.0
Fall while being carried or supported by other persons
321 322 276 919 0.3
Fall involving wheelchair 603 641 726 1,970 0.6
Fall involving bed 6,793 6,965 7,291 21,049 6.6
Fall involving chair 3,894 4,132 4,294 12,320 3.9
Fall involving other furniture 826 904 857 2,587 0.8
Fall on and from stairs and steps 5,859 6,296 6,866 19,021 6.0
Fall on and from ladder 1,937 2,050 2,170 6,157 1.9
Fall from, out of or through building or structure
2,133 1,974 2,049 6,156 1.9
Other fall from one level to another 2,117 2,094 2,021 6,232 2.0
Other fall on same level 19,187 22,250 24,019 65,456 20.6
Unspecified fall 24,546 26,896 28,774 80,216 25.2
Total 98,862 106,138 112,905 317,905 100.0

RELATIONSHIP BETWEEN SLIPS, TRIPS & FALLS & THE DESIGN & CONSTRUCTION OF BUILDINGS 101
The cause of the fall was not specified in 25.2 percent of hospital separations.
The major causes of hospital separations in rank order were:
o Slips, trips and stumbles on the same level (29.2%)
o Other fall on same level (20.6%)
o Fall involving bed (6.6%)
o Fall on and from stairs and steps (6.0%)
o Fall involving chair (3.9%)
9.9.5 Location of falls of hospital separations due to fall related events occurring in buildings
Table 9.9.5.1 Frequency and percentage of fall related hospital separations ranked by specific location of fall occurrence, Australia, 2002/03-2004/05.
Place of fall occurrence 2002–03 2003–04 2004–05 Total %
Other and unspecified place in home 60,661 66,108 70,341 197,110 62.0
Aged care facilities 14,869 17,389 19,255 51,513 16.0
Health Service area 12,144 11,808 11,908 35,860 11.3
School 3,011 3,148 3,147 9,306 2.9
Shop and store 2,289 2,521 2,675 7,485 2.4
Cafe, hotel and restaurant 1,875 1,943 2,132 5,950 1.9
Other specified institution and public administrative area
1,112 894 942 2,948 0.9
Other specified trade and service area 768 699 773 2,240 0.7
Sporting hall (indoor) 538 601 610 1,749 0.6
Other specified residential institution 460 463 579 1,502 0.5
Place not reported/not applicable 635 156 93 884 0.3
Prison 76 75 90 241 0.1
Commercial garage 119 101 111 331 0.1
Unspecified residential institution 172 120 133 425 0.1
Office building 113 98 96 307 0.1
Juvenile detention centre 12 8 7 27 0.0
Military camp 8 6 13 27 0.0
Total 98,862 106,138 112,905 317,905 100.0
The place of occurrence (location) was in the home for 62 percent of separations (n=197,110).
The next most common places of fall occurrence were aged care facilities (16%), health service areas (11%), schools (2.9%) and cafés, hotels and restaurants (2%).
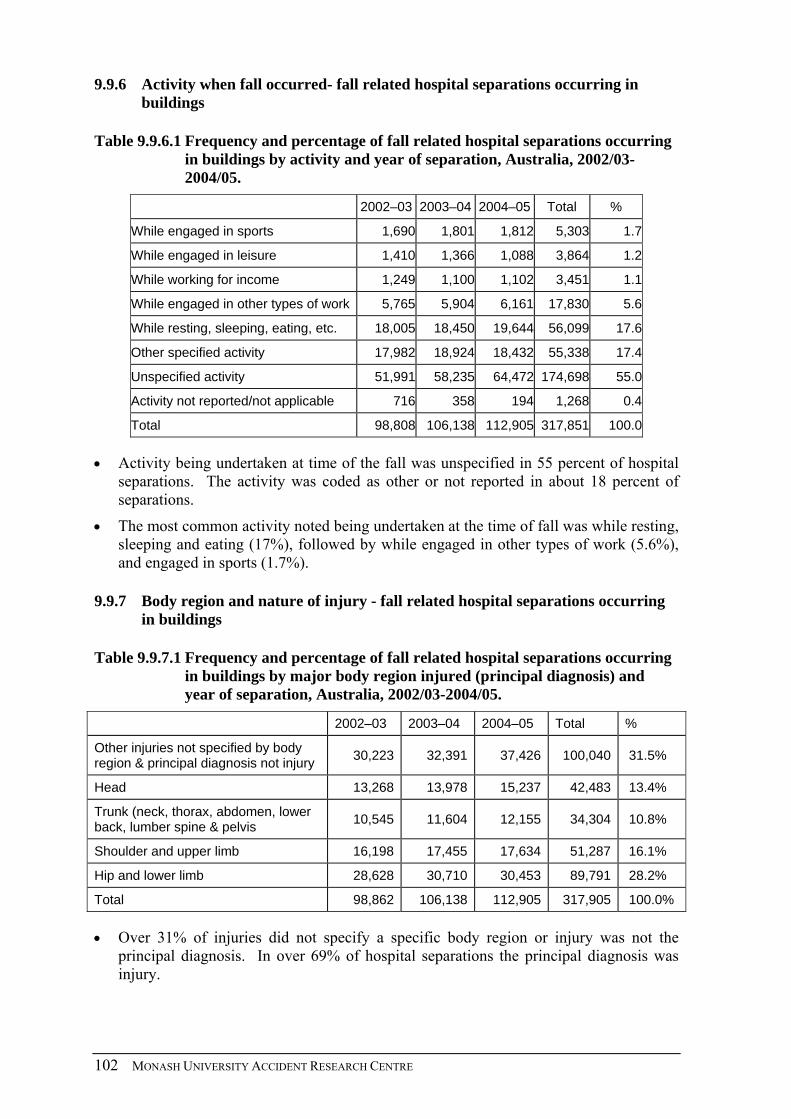
102 MONASH UNIVERSITY ACCIDENT RESEARCH CENTRE
9.9.6 Activity when fall occurred- fall related hospital separations occurring in buildings
Table 9.9.6.1 Frequency and percentage of fall related hospital separations occurring in buildings by activity and year of separation, Australia, 2002/03-2004/05.
2002–03 2003–04 2004–05 Total %
While engaged in sports 1,690 1,801 1,812 5,303 1.7
While engaged in leisure 1,410 1,366 1,088 3,864 1.2
While working for income 1,249 1,100 1,102 3,451 1.1
While engaged in other types of work 5,765 5,904 6,161 17,830 5.6
While resting, sleeping, eating, etc. 18,005 18,450 19,644 56,099 17.6
Other specified activity 17,982 18,924 18,432 55,338 17.4
Unspecified activity 51,991 58,235 64,472 174,698 55.0
Activity not reported/not applicable 716 358 194 1,268 0.4
Total 98,808 106,138 112,905 317,851 100.0
Activity being undertaken at time of the fall was unspecified in 55 percent of hospital separations. The activity was coded as other or not reported in about 18 percent of separations.
The most common activity noted being undertaken at the time of fall was while resting, sleeping and eating (17%), followed by while engaged in other types of work (5.6%), and engaged in sports (1.7%).
9.9.7 Body region and nature of injury - fall related hospital separations occurring in buildings
Table 9.9.7.1 Frequency and percentage of fall related hospital separations occurring in buildings by major body region injured (principal diagnosis) and year of separation, Australia, 2002/03-2004/05.
2002–03 2003–04 2004–05 Total %
Other injuries not specified by body region & principal diagnosis not injury
30,223 32,391 37,426 100,040 31.5%
Head 13,268 13,978 15,237 42,483 13.4%
Trunk (neck, thorax, abdomen, lower back, lumber spine & pelvis
10,545 11,604 12,155 34,304 10.8%
Shoulder and upper limb 16,198 17,455 17,634 51,287 16.1%
Hip and lower limb 28,628 30,710 30,453 89,791 28.2%
Total 98,862 106,138 112,905 317,905 100.0%
Over 31% of injuries did not specify a specific body region or injury was not the principal diagnosis. In over 69% of hospital separations the principal diagnosis was injury.

RELATIONSHIP BETWEEN SLIPS, TRIPS & FALLS & THE DESIGN & CONSTRUCTION OF BUILDINGS 103
The most common area injured was the hip and lower limb (28% of total hospital separations), followed by shoulder and upper limb (16%) and head (13%).
Table 9.9.7.2 Frequency and percentage of falls related hospital separations occurring in buildings by principal diagnosis groups by year of separation, Australia, 2002/03-2004/05
2002–03 2003–04 2004–05 Total %
Principal diagnosis not poisoning or injury
29,481 31,595 36,615 97,691 30.7%
Injuries to the head 13,268 13,978 15,237 42,483 13.4%
Injuries to the neck 759 965 998 2,722 0.9%
Injuries to the thorax 3,492 3,869 3,926 11,287 3.6%
Injuries to the abdomen, lower back, lumbar spine & pelvis
6,294 6,770 7,231 20,295 6.4%
Injuries to the shoulder & upper arm 6,174 6,809 6,889 19,872 6.3%
Injuries to the elbow & forearm 8,685 9,280 9,353 27,318 8.6%
Injuries to the wrist & hand 1,339 1,366 1,392 4,097 1.3%
Injuries to the hip & thigh 20,054 21,510 21,418 62,982 19.8%
Injuries to the knee & lower leg 7,347 7,885 7,727 22,959 7.2%
Injuries to the ankle & foot 1,227 1,315 1,308 3,850 1.2%
Injuries involving multiple body regions 52 68 72 192 0.1%
Injuries to unspecified parts of trunk, limb or body region
397 429 457 1,283 0.4%
Body type not relevant 293 299 282 874 0.3%
Total 98,862 106,138 112,905 317,905 100.0%
Over 30% of hospital separations did not have a principal diagnosis of injury or poisoning.
Of the 69% of hospitalisations with an injury related principal diagnosis:
o injuries were most common to the hip and thigh (20%), followed by injuries to the elbow and forearm (9%), the knee and lower leg (7%), the abdomen, lower back, lumber spine and pelvis (6%) and to the shoulder and upper arm (6%).

104 MONASH UNIVERSITY ACCIDENT RESEARCH CENTRE
Table 9.9.7.3 Frequency and percentage of falls related hospital separations occurring in buildings by nature of injury (principle diagnosis = injury), by year of separation, Australia, 2002/03-2004/05.
2002/03 2003/04 2004/05 Total %
Superficial (excluding eye) 4,201 4,328 4,766 13,295 6.0%
Open wound (excluding eye) 7,100 7,674 8,188 22,962 10.4%
Fracture (excluding tooth) 43,998 47,402 47,567 138,967 63.1%
Dislocation 1,582 1,745 1,723 5,050 2.3%
Sprain/strain 955 1,017 974 2,946 1.3%
Nerve (including spinal cord; excluding brain)
227 228 217 672 0.3%
Blood vessel 93 78 118 289 0.1%
Muscle/tendon 613 676 733 2,022 0.9%
Crush injury * * 7 13 0.0%
Amputation (including partial) 23 21 21 65 0.0%
Internal organ
362 399 393 1,154 0.5%
Burn/corrosion (excluding eye) 7 8 8 23 0.0%
Eye injury (excluding foreign body in external eye)
176 175 156 507 0.2%
Foreign body: external eye * * * *
Foreign body: aliment tract * * * *
Intracranial(including concussion) 3,154 3,314 3,758 10,226 4.6%
Dental (including fractured tooth) 149 137 138 424 0.2%
Drowning, immersion * * * *
Asphyxia/threat to breathing * * * *
Electrical injury * * * *
Poison/toxic effect (excluding bite) 30 8 5 43 0.0%
Bite (including invenomation) * * * *
Other specified nature of injury 1,271 1,331 1,398 4,000 1.8%
Unspecified nature of injury 5,388 5,939 6,065 17,392 7.9%
Injuries of more than one nature 39 54 52 145 0.1%
Total 69,376 74,538 76,289 220,203 100.0%
* denotes small numbers.
NB: These separations are a subset (69%) of all fall related hospital separations occurring in buildings, and include all separations where the principal diagnosis was injury (n=220,203).
The nature of the injuries was unspecified in 8% of cases.
The most common injury was a fracture (63%), followed by open wound (10%), superficial injury (6%) and intracranial injury (5%).

RELATIONSHIP BETWEEN SLIPS, TRIPS & FALLS & THE DESIGN & CONSTRUCTION OF BUILDINGS 105
9.9.8 Length of stay - fall related hospital separations occurring in buildings
Table 9.9.8.1 Frequency and percentage of fall related hospital separations occurring in buildings by length of stay and year of separation, Australia, 2002/03-2004/05.
2002–03 2003–04 2004–05 Total %
Length of stay is less than two days 32,853 34,767 36,455 104,075 32.7%
Length of stay is two to seven days 27,664 29,821 30,721 88,206 27.7%
Length of stay is eight to thirty days 31,320 33,826 37,459 102,605 32.3%
Length of stay is greater than thirty days 7,025 7,724 8,270 23,019 7.2%
Total 98,862 106,138 112,905 317,905 100.0%
Only 7 percent of hospital separations for falls in buildings had a length of stay greater than 30 days. Thirty three percent of separations had a length of stay of less than two days, with 28% a length of stay between 2-7 days and 32 percent a length of stay of between 8 and 30 days.
9.9.9 Injury severity - falls related hospital separations occurring in buildings
The New Zealand research group (Cryer et al.) used a threat-to-life severity scale when defining a serious injury and only included hospitalisations with an International Classification of Diseases-based Injury Severity Score (ICISS) of less than or equal to 0.941 (i.e. a probability of death at admission of at least 5.9%).
Serious injury definition for this table is based on ICISS and Cryer’s definition of serious injury.
Table 9.9.9.1 Frequency and percentage of fall related hospital separations occurring in buildings by injury severity and year, Australia, 2002/03-2004/05.
2002–03 2003–04 2004–05 Total %
Not severe injury, ICISS > 0.941 66,266 69,839 73,643 209,748 66.0%
Severe injury, ICISS <= 0.941 32,596 36,299 39,262 108,157 34.0%
Total 98,862 106,138 112,905 317,905 100.0%
Sixty six percent of the hospital separations resulting from falls most likely occurring in buildings were coded using ICISS classification as not a severe injury, with 34 percent of hospital separations injuries coded as a severe injury (threat to life of 5.9%).

106 MONASH UNIVERSITY ACCIDENT RESEARCH CENTRE
9.10 FALL RELATED HOSPITALISATIONS OCCURRING IN THE HOME
Table 9.10.1 Age standardised rates per 100,000 population of fall related hospital separations occurring in the home by sex, Australia, 2002/03-2004/05
2002–03 2003–04 2004–05 Total
Males 242.6733 255.4881 264.481 254.214
Females 340.7109 363.7784 377.2327 360.573
Persons 300.6487 319.271 330.3977 316.772
From 2002/03-2004/05 the age standardised rate per 100,000 population of fall related hospital separations occurring the home has increased by 9.9% percent overall, from a rate of 300.6 separations per 100,000 persons in 2002/03 to 330.4 separations per 100,000 persons in 2004-05.
The rate per 100,000 of population has increased by 10.7% among females over this time, from 340.7 per 100,000 females in 2002/03-2004/05 to 377.2 per 100,000 in 2004/05.
Among males, the rate has increased 9.0% over the same time period from 242.7 per 1000,000 males in 2002/03- to 264.5 in 2004/05.
The mean rate of home fall related hospital separations from 2002/03-2004/05 is 41.8% higher for females than for males (360.6 vs. 254.2).
9.4.* Sex
Table 9.10.2 Sex of fall related hospital separations occurring in the home by year of separation, Australia 2002-2005
Sex 2002–03 2003–04 2004–05 Total %
Males 21,121 22,874 24,297 68,292 34.6%
Females 39,540 43,234 46,042 128,816 65.4%
Persons 60,661 66,108 70,341 197,110 100.0%
Females accounted for over 65% (n = 128,816) of all admitted fall injuries in the home environment during the period 2002-03 to 2004-05.
This proportion has remained stable, varying less than 1% over the three years covered in this analysis.
The proportion of females suffering falls in the home is slightly higher than that recorded for all falls in buildings (65.4% vs. 64.7%).

RELATIONSHIP BETWEEN SLIPS, TRIPS & FALLS & THE DESIGN & CONSTRUCTION OF BUILDINGS 107
9.4 * Age
Table 9.10.3 Frequency and percentage of fall related hospital separations occurring in the home by 5 year age groups, Australia 2002-2005.
Age groups 2002–03 2003–04 2004–05 Total %
0–4 3346 3531 3497 10374 5.3%
5–9 1530 1572 1473 4575 2.3%
10–14 655 696 663 2014 1.0%
15–19 473 492 494 1459 0.7%
20–24 616 620 614 1850 0.9%
25–29 667 705 760 2132 1.1%
30–34 860 868 932 2660 1.3%
35–39 966 1034 1055 3055 1.5%
40–44 1160 1266 1284 3710 1.9%
45–49 1357 1550 1658 4565 2.3%
50–54 1726 1844 1923 5493 2.8%
55–59 2097 2567 2495 7159 3.6%
60–64 2542 2637 2953 8132 4.1%
65–69 3106 3472 3847 10425 5.3%
70–74 5315 5587 5706 16608 8.4%
75–79 8617 9191 9813 27621 14.0%
80–84 10587 11996 13055 35638 18.1%
85+ 15040 16480 18119 49639 25.2%
Total 60661 66108 70341 197110 100.0%
Older persons, aged ≥65 years account for 71% (n = 139,931) of all slip, trip and fall injuries occurring in the home.
While slip, trip and fall injuries in all buildings have increased by 14.2% between 2002-03 and 2004-05, and home based slip, trip and fall injuries have increased by 16% across all age groups during this period; injuries to those aged ≥65 have increased by 18.5% over the same time.
Children ≤4 years of age account for 5.3% (n= 10,374 from 2002-03 to 2004-05) and have the highest proportion of home based slip, trip and fall injuries of any age group under 65 years.

108 MONASH UNIVERSITY ACCIDENT RESEARCH CENTRE
9.4.* All falls occurring in the home Australia 2002-05: year by age, by sex
Table 9.10.4
Males 0-14 15-29 30-44 45-59 60-74 75+ Total
2002-03 3128 901 1537 2325 4076 9154 21121
2003-04 3247 942 1629 2716 4251 10089 22874
2004-05 3189 910 1620 2762 4643 11173 24297
Total 9564 2753 4786 7803 12970 30416 68292
Females 0-14 15-29 30-44 45-59 60-74 75+ Total
2002-03 2403 855 1449 2855 6887 25090 39540
2003-04 2552 875 1539 3245 7445 27578 43234
2004-05 2444 958 1651 3314 7862 29813 46042
Total 7399 2688 4639 9414 22194 82481 128816
Persons 0-14 15-29 30-44 45-59 60-74 75+ Total
2002-03 5531 1756 2986 5180 10963 34244 60661
2003-04 5799 1817 3168 5961 11696 37667 66108
2004-05 5633 1868 3271 6076 12506 40987 70341
Total 16963 5441 9425 17217 35165 112898 197110
Until the age of 44, males narrowly exceed females in the frequency of hospital separations for falls occurring in the home. In 0-14 years broad age group, the male separations exceed females by 29.3% (n=2,165), in the 15-29 years broad age group this gap falls to 2.4% (n = 65) and remains relatively small in the 30-44 years broad age group at 3.2% (n=147).
From the age of 45 years onwards, separations for falls at home among women exceed those of men. This peaks in the 75+ years broad age group, where there are 2.7 times more separations for females (n=82,481) than males (n=30,416).
While the majority of broad age groups have shown minor increases in the frequency of separations for home based injuries over the three years covered above, injuries to those aged 45 years and over have increased substantially. In the 45-59 years broad age group, these injuries have increased by 15.1% (n=896), by 14.0% (n=1543) in the 60-74 years broad age group and by 19.7% (n=6793) in the 75+ years broad age group.

RELATIONSHIP BETWEEN SLIPS, TRIPS & FALLS & THE DESIGN & CONSTRUCTION OF BUILDINGS 109
Body region and nature of injury - falls related hospital separations occurring in the home
Table 9.10.5 Frequency and percentage of body region of principal diagnosis of fall related hospital separations occurring in the home by year of separation, Australia 2002-2005
Broad Body region 2002–03 2003–04 2004–05 Total %
Other injuries not specified 15,839 17,433 21,010 54,282 27.5%
Head 8,746 9,209 9,922 27,877 14.1%
Trunk 7,681 8,592 8,778 25,051 12.7%
Shoulder and upper limb 10,774 11,745 11,620 34,139 17.3%
Hip and lower limb 17,621 19,129 19,011 55,761 28.3%
Total 60,661 66,108 70,341 197,110 100.0%
Injuries to the hip and lower limb (28.3%, n = 55,761) and injuries not specified by body region (27.5%, n = 54282) are most prominent.
The distributions for home based slip, trip and fall injury to the hip and lower limb are almost identical to that displayed for these injuries in all buildings (28.3% vs. 28.2%).
The distributions for home based injuries to the head, trunk and shoulder and upper limb follow similar patterns to those for all building falls, although slightly higher percentages are displayed for these categories, with a resultant decrease in the number of injuries where the body region was unspecified.
Table 9.10.6
Body region detailed 2002–03 2003–04 2004–05 Total %
Not poisoning/injury 15,284 16,833 20,387 52,504 26.6%
Injuries to the head 8,746 9,209 9,922 27,877 14.1%
Injuries to the neck 533 674 714 1,921 1.0%
Injuries to the thorax 2,717 3,096 3,057 8,870 4.5%
Injuries to the abdomen, lower back, lumbar spine & pelvis 4,431 4,822 5,007 14,260 7.2%
Injuries to the shoulder & upper arm 4,377 4,795 4,871 14,043 7.1%
Injuries to the elbow & forearm 5,517 6,060 5,880 17,457 8.9%
Injuries to the wrist & hand 880 890 869 2,639 1.3%
Injuries to the hip & thigh 11,372 12,336 12,242 35,950 18.2%
Injuries to the knee & lower leg 5,264 5,743 5,701 16,708 8.5%
Injuries to the ankle & foot 985 1,050 1,068 3,103 1.6%
Injuries involving multiple body regions 40 47 53 140 0.1%
Injuries to unspec parts of trunk, limb or body region 307 314 347 968 0.5%
Body type not relevant 208 239 223 670 0.3%
Total 60,661 66,108 70,341 197,110 100.0%

110 MONASH UNIVERSITY ACCIDENT RESEARCH CENTRE
All falls occurring in the home, Australia 2002-05: broad body region by age, by sex
Table 9.10.7
Males 0-14 15-29 30-44 45-59 60-74 75+ Total
Other injuries not specified 480 427 837 1611 3758 10972 18085
Head 4616 693 1086 1398 1863 3789 13445
Trunk 268 270 717 1397 2289 4611 9552
Shoulder and upper limb 3294 746 952 1398 1741 2898 11029
Hip and lower limb 906 617 1194 1999 3319 8146 16181
Total 9564 2753 4786 7803 12970 30416 68292
Females 0-14 15-29 30-44 45-59 60-74 75+ Total
Other injuries not specified 375 946 1077 1560 5298 26940 36196
Head 3557 502 742 1220 1856 6555 14432
Trunk 358 348 562 924 2368 10938 15499
Shoulder and upper limb 2492 381 919 2486 5163 11669 23110
Hip and lower limb 617 511 1339 3224 7509 26379 39579
Total 7399 2688 4639 9414 22194 82481 128816
Persons 0-14 15-29 30-44 45-59 60-74 75+ Total
Other injuries not specified 855 1373 1914 3171 9057 37912 54282
Head 8173 1195 1828 2618 3719 10344 27877
Trunk 626 618 1279 2321 4657 15549 25051
Shoulder and upper limb 5786 1127 1871 3884 6904 14567 34139
Hip and lower limb 1523 1128 2533 5223 10828 34526 55761
Total 16963 5441 9425 17217 35165 112898 197110
Overall, injuries to the hip and lower limb account for 28.3% (n=55,761) of home fall related separations and those aged 60 years and over account for 81.3% (45,354) of hip and lower limb injuries across both genders.
Women aged 60 years and over account for 85.6% of (n=33,888) of all hip and lower limb injuries to females, and women aged 60 years and over also account for 85.9% (n=13,306) of all trunk injuries to females.
Head injuries predominate among children for falls in a home environment, with 48.2% (n=8,173) of injuries to children aged 14 years and under being head injuries.
All falls occurring in the home, Australia 2002-05: nature of injury by principal diagnosis groups (detailed body region), by sex
NB: 52,509 cases where the principal diagnosis group was listed as “not poisoning/injury” have been removed from the analysis of stair and step related injuries by detailed body region.

RELATIONSHIP BETWEEN SLIPS, TRIPS & FALLS & THE DESIGN & CONSTRUCTION OF BUILDINGS 111
Table 9.10.8
Males head neck thorax
abdomen, lower back, lumbar spine & pelvis
shoulder & upper arm
elbow & forearm
wrist & hand
hip & thigh
knee & lower leg
ankle & foot
Other injuries not specified by body region
Total
Superficial 1229 30 396 387 178 142 44 363 256 39 125 3189
Open wound 5057 18 67 113 125 514 303 64 531 90 71 6953
Fracture 1405 369 3026 2452 2908 4429 564 8285 3232 891 20 27581
Dislocation * 50 * 19 605 103 125 274 99 45 0 1323
Sprain/strain 0 58 31 93 47 16 28 85 209 129 26 722
Nerve 6 138 34 23 11 28 66 * * 5 16 331
Blood vessel 34 * * 5 7 15 22 * 5 * * 102
Muscle/tendon 5 16 17 29 186 61 117 163 126 28 35 783
Crush injury * 0 * * 0 0 * * 0 0 0 6
Amputation (including partial)
* 0 0 * 0 0 22 0 0 10 0 35
Internal organ 0 * 398 189 0 * 0 0 0 0 * 588
Burn/corrosion 0 0 0 0 0 0 0 0 0 0 11 11
Eye injury 150 0 0 0 0 0 0 0 0 0 0 150
Foreign body: external eye
0 0 0 0 0 0 0 0 0 0 * *
Foreign body: aliment tract
0 0 0 0 0 0 0 0 0 0 * *
Intracranial(including concussion)
3508 0 0 0 0 0 0 0 0 0 0 3508
Dental 183 0 0 0 0 0 0 0 0 0 0 183
Drowning, immersion
0 0 0 0 0 0 0 0 0 0 * *
Asphyxia/threat to breathing
0 0 0 0 0 0 0 0 0 0 * *
Electrical injury 0 0 0 0 0 0 0 0 0 0 * *
Poison/toxic effect 0 0 0 0 0 0 0 0 0 0 9 9
Bite 0 0 0 0 0 0 0 0 0 0 * *
Other specified nature of injury
118 53 105 144 47 16 9 149 42 29 325 1037
Unspecified nature of injury
1734 171 227 879 202 41 35 670 266 70 102 4397
Injuries of more than one nature
* 0 * 5 6 * * 13 * * 0 38
Total 13440 907 4306 4339 4322 5368 1339 10072 4770 1339 752 50954

112 MONASH UNIVERSITY ACCIDENT RESEARCH CENTRE
Females head neck thorax
abdomen, lower back, lumbar spine & pelvis
shoulder & upper arm
elbow & forearm
wrist & hand
hip & thigh
knee & lower leg
ankle & foot
Other injuries not specified by body region
Total
Superficial 2192 52 521 686 263 183 91 764 689 92 219 5752
Open wound 5199 26 20 229 122 553 225 54 1565 88 85 8166
Fracture 1331 481 3314 6616 7459 11045 669 22304 8267 883 35 62404
Dislocation 5 27 0 36 1122 177 85 515 148 55 0 2170
Sprain/strain * 68 47 173 77 * 34 175 363 383 33 1363
Nerve 6 78 23 26 * 7 32 * * * 9 192
Blood vessel 47 0 * 6 6 5 9 * 14 * * 96
Muscle/tendon 9 18 21 67 221 20 45 141 76 28 34 680
Crush injury 0 0 0 * 0 0 * 0 * 0 * 5
Amputation (including partial)
* 0 * 0 * 0 11 0 * 6 0 19
Internal organ 0 0 191 137 0 0 0 0 0 0 0 328
Burn/corrosion 0 0 0 * 0 0 * 0 0 0 8 8
Eye injury 204 0 0 0 0 0 0 0 0 0 0 204
Foreign body: external eye
0 0 0 0 0 0 0 0 0 0 0 0
Foreign body: aliment tract
0 0 0 0 0 0 0 0 0 0 0 0
Intracranial(including concussion)
3200 0 0 0 0 0 0 0 0 0 0 3200
Dental 146 0 0 0 0 0 0 0 0 0 0 146
Drowning, immersion
0 0 0 0 0 0 0 0 0 0 0 0
Asphyxia/threat to breathing
0 0 0 0 0 0 0 0 0 0 0 0
Electrical injury 0 0 0 0 0 0 0 0 0 0 0 0
Poison/toxic effect 0 0 0 0 0 0 0 0 0 0 10 10
Bite 0 0 0 0 0 0 0 0 0 0 0 0
Other specified nature of injury
154 61 126 278 88 22 17 382 129 52 426 1735
Unspecified nature of injury
1933 203 300 1653 349 67 81 1513 681 172 164 7116
Injuries of more than one nature
* 0 0 12 10 * 0 22 * * 0 52
Total 14432 1014 4564 9921 9721 12089 1300 25877 11938 1764 1026 93646

RELATIONSHIP BETWEEN SLIPS, TRIPS & FALLS & THE DESIGN & CONSTRUCTION OF BUILDINGS 113
Persons head neck thorax
abdomen, lower back, lumbar spine & pelvis
shoulder & upper arm
elbow & forearm
wrist & hand
hip & thigh
knee & lower leg
ankle & foot
Other injuries not specified by body region
Total
Superficial 3421 82 917 1073 441 325 135 1127 945 131 344 8941
Open wound 10256 44 87 342 247 1067 528 118 2096 178 156 15119
Fracture 2736 850 6340 9068 10367 15474 1233 30590 11499 1774 55 89986
Dislocation 8 77 0 55 1727 280 210 789 247 100 0 3493
Sprain/strain * 126 78 266 124 24 * 260 572 512 59 2085
Nerve 12 216 57 49 15 35 98 * * 6 25 523
Blood vessel 81 * * 11 13 20 31 6 19 * 5 198
Muscle/tendon 14 34 38 96 407 81 162 304 202 56 69 1463
Crush injury * 0 * * 0 0 * * * 0 * 11
Amputation (including partial)
* 0 0 * 0 0 33 0 * 16 0 54
Internal organ 0 0 589 326 0 0 0 * 0 0 * 916
Burn/corrosion 0 0 0 0 0 0 0 0 0 0 19 19
Eye injury 354 0 0 0 0 0 0 0 0 0 0 354
Foreign body: external eye
0 0 0 0 0 0 0 0 0 0 * *
Foreign body: aliment tract
0 0 0 0 0 0 0 0 0 0 * *
Intracranial(including concussion)
6708 0 0 0 0 0 0 0 0 0 0 6708
Dental 329 0 0 0 0 0 0 0 0 0 0 329
Drowning, immersion
0 0 0 0 0 0 0 0 0 0 * *
Asphyxia/threat to breathing
0 0 0 0 0 0 0 0 0 0 * *
Electrical injury 0 0 0 0 0 0 0 0 0 0 * *
Poison/toxic effect 0 0 0 0 0 0 0 0 0 0 19 19
Bite 0 0 0 0 0 0 0 0 0 0 * *
Other specified nature of injury
272 114 231 422 135 38 26 531 171 81 751 2772
Unspecified nature of injury
3667 374 527 2532 551 108 116 2183 947 242 266 11513
Injuries of more than one nature
7 * * 17 16 5 * 35 * * 0 90
Total 27872 1921 8870 14260 14043 17457 2639 35950 16708 3103 1778 144601
Fractures (62.2%, n=89,986), open wounds (10.5%, n=15,119) and intracranial injuries (4.6%, n=6708) dominate among separations where the nature of injury was specified.
In total, fractures account for 66.6% (n=62,404) of home fall related injuries to women hip and thigh fractures account for 35.7% (n=22,304) of all fall related fractures suffered by women in the home. Among males, fractures account 54.1% (n=27,581) of home fall injuries and hip and thigh fractures account for 30.0% (n=8,285) of all fractures suffered by males in the home.

114 MONASH UNIVERSITY ACCIDENT RESEARCH CENTRE
For both males and females, the elbow and forearm were the next most prevalent fracture region, accounting for 17.7% (n=11,045) of fractures suffered by females and 16.1% (n=4,429) of fractures suffered by males in a home environment.
The nature of injury was unspecified for a large proportion of cases, in a total of 11,513 (8.0%) separations; the nature of injury was not specified.
9.4.* Nature of injury
Table 9.10.9 Nature of fall related hospital separations occurring in the home by frequency and year of separation, Australia 2002-2005
NB – In 11 cases, the nature of injury was not included.
Nature of injury 2002–03 2003–04 2004–05 Total %
Superficial (excluding eye) 2,830 2,950 3,161 8,941 4.5%
Open wound (excluding eye) 4,660 5,136 5,323 15,119 7.7%
Fracture (excluding tooth) 28,326 30,925 30,735 89,986 45.7%
Dislocation 1,117 1,225 1,151 3,493 1.8%
Sprain/strain 691 703 691 2,085 1.1%
Nerve (including spinal cord; excluding brain) 176 178 169 523 0.3%
Blood vessel 57 60 81 198 0.1%
Muscle/tendon 429 497 537 1,463 0.7%
Crush injury * * * 11 0.0%
Amputation (including partial) 22 17 15 54 0.0%
Internal organ 287 319 310 916 0.5%
Burn/corrosion (excluding eye) * * * 19 0.0%
Eye injury (excluding foreign body in external eye) 130 121 103 354 0.2%
Foreign body: external eye * * * * *
Foreign body: aliment tract * * * * *
Intracranial(including concussion) 2,076 2,149 2,483 6,708 3.4%
Dental (including fractured tooth) 111 116 102 329 0.2%
Drowning, immersion * * * * *
Asphyxia/threat to breathing * * * * *
Electrical injury * * * * *
Poison/toxic effect (excluding bite) * * * 19 0.0%
Bite (including invenomation) * * * * *
Other specified nature of injury 850 916 1,006 2,772 1.4%
Unspecified nature of injury 3,568 3,910 4,035 11,513 5.8%
Injuries of more than one nature 24 34 32 90 0.0%
Principal diagnosis not injury 15,284 16,833 20,387 52,504 26.6%
Total 60,661 66,108 70,341 197,110 100.0%

RELATIONSHIP BETWEEN SLIPS, TRIPS & FALLS & THE DESIGN & CONSTRUCTION OF BUILDINGS 115
Fractures accounted for the highest proportion of slip, trip and fall injuries in the home (45.7%, n= 89,986) between 2002-03 and 2004-05. While stable in 2002-03 (46.7%, n = 28,326) and 2003-04 (46.8%, n = 30,925) fractures fell slightly to 43.7% (n = 30,735) of slip, trip and fall related injuries in the home during 2004-05.
The percentage of fractures for home slip, trip and fall injury is slightly higher than that reported for these injuries in all buildings (45.7% vs. 43.7%).
As is also the case for slip, trip and fall injuries in all buildings, over the period covered by this analysis, the next most frequent injuries sustained in the home were open wounds (7.7%, n = 15,119), injuries of an unspecified nature (5.8%, n = 11,513) and superficial injuries (4.5%, n = 8,941).
All fractures resulting from falls most occurring in the home, Australia 2002-05: nature of injury by broad body region, by age
Table 9.10.10
Other injuries not specified
Head Trunk Shoulder and upper limb
Hip and lower limb
Total
0-14 * 751 * 5408 1161 7355
15-29 0 184 171 691 812 1858
30-44 0 262 506 1369 1905 4042
45-59 * * 1276 3197 4290 9115
60-74 9 395 3067 5559 8598 17628
75+ 43 794 11203 10850 27097 49987
Total 55 2736 16258 27074 43863 89986
Fractures of the hip and lower limb account for 48.7% (n=43,863) for fall separations occurring in the home, and 61.8% (n=27,097) of all fractures occurring in the home among those aged 75 years and over.
Those aged 75 years and over account for 55.6% (n=49,987) of all fractures incurred in a home environment.
Across all age groups, fractures of the shoulder and upper arm account for 30.1% (n=27,074) of all separations for home based fractures, and those aged 75 and over account for 40.1% (n=10,850) of all shoulder and upper arm fractures sustained in a home environment.

116 MONASH UNIVERSITY ACCIDENT RESEARCH CENTRE
Length of stay
Table 9.10.11 Length of stay - falls related hospital separations in the home, Australia 2002-2005 by Frequency and percentage
Length of stay 2002–03 2003–04 2004–05 Total %
Length of stay is less than two days
20,870 22,461 23,536 66,867 33.9%
Length of stay is two to seven days
17,339 18,796 19,366 55,501 28.2%
Length of stay is eight to thirty days
19,021 20,889 22,961 62,871 31.9%
Length of stay is greater than thirty days
3,431 3,962 4,478 11,871 6.0%
Total 60,661 66,108 70,341 197,110 100.0%
As shown in figure *, fall related injuries sustained in the home display a length of stay pattern very similar to that displayed for all falls most likely occurring in buildings.
This trend is displayed across all length of stay categories: <two days (33.9% vs. 32.7% respectively), two to seven days (28.2% vs. 27.7%), eight to thirty days (31.9% vs. 32.3%) and over thirty days (6.0% vs. 7.2% respectively).
Although a slightly smaller percentage of home fall injury patients fit into this longest length of stay category (in comparison to all building fall patients), the proportion of home fall admissions greater than thirty days has risen steadily over the three years covered in figure *, from 5.7% (n = 3,431) in 2002-03, to 6.4% (n = 4478) in 2004-05.
Injury severity – Frequency and percentage of falls related hospital separations most likely occurring in the home
Table 9.10.12 Injury severity – Frequency and percentage of falls related hospital separations occurring in the home, Australia 2002-2005
Severity of injury 2002–03 2003–04 2004–05 Total %
Not severe injury, ICISS > 0.941 40,916 43,848 45,905 130,669 66.3%
Severe injury, ICISS <= 0.941 19,745 22,260 24,436 66,441 33.7%
Total 60,661 66,108 70,341 197,110 100.0%
As shown above in figure *, 33.7% (n = 66,441) of home based fall injuries were considered severe according to Cryer’s definition and the ICISS (see section 9.3.8).
This percentage has increased steadily from 32.5% (n = 19,745) in 2002-03 to 34.7% (n = 24,436) in 2004-05.
Although less life threatening, the “not severe” injuries remain important because of their frequency, societal and economic cost and their impact on the health care system.

RELATIONSHIP BETWEEN SLIPS, TRIPS & FALLS & THE DESIGN & CONSTRUCTION OF BUILDINGS 117
9.11 FALL RELATED HOSPITAL SEPARATIONS MOST LIKELY OCCURRING ON STAIRS AND STEPS
Table 9.11.1 Age standardised rates per 100,000 population of fall related hospital separations occurring on stairs and steps by sex, Australia, 2002/03-2004/05
2002–03 2003–04 2004–05 Total
Males 23.504 24.425 25.915 24.614
Females 33.84174 35.91592 38.21712 35.992
Persons 29.18808 30.67096 32.58245 30.814
From 2002/03-2004/05 the age standardised rates per 100,000 population of fall related hospital separations occurring on stairs and steps as increased by 11.7% percent overall, from a rate of 29.2 separations per 100,000 persons in 2002/03 to 32.6 separations per 100,000 persons in 2004-05.
The rate of stair and step injuries per 100,000 of population has increased by 12.9% among females over this time, from 33.8 per 100,000 females in 2002/03-2004/05 to 38.2 per 100,000 in 2004/05.
Among males, the rate has increased 10.6% over the same time period from 23.5 per 1000,000 males in 2002/03 to 24.6 in 2004/05.
The mean rate of stair and step fall related hospital separations from 2002/03-2004/05 is 25.2% higher for females than for males (30.8 vs. 24.6).
Sex
Table 9.11.2 Sex of fall related hospital separations occurring on stairs and steps by year of separation, Australia 2002-2005 by Frequency and percentage
Sex 2002–03 2003–04 2004–05 Total %
Males 2,131 2,271 2,456 6,858 36.1%
Females 3,728 4,025 4,409 12,162 63.9%
Persons 5,859 6,296 6,866 19,021 100.0%
Figure * shows that females constituted nearly 64% (n = 12,162) of all hospital admissions involving stairs and steps from 2002-03 to 2004-05.
This proportion has remained stable, varying less than 1% over the three years covered in this analysis.
The gender distribution of stair and step injuries does not vary significantly from that of all falls in buildings.

118 MONASH UNIVERSITY ACCIDENT RESEARCH CENTRE
Age
Table 9.11.3 Frequency and percentage of fall related hospital separations occurring on stairs and steps by 5 year age groups, Australia 2002-2005
Age groups 2002–03 2003–04 2004–05 Total %
0–4 253 251 269 773 4.1%
5–9 116 110 104 330 1.7%
10–14 138 116 109 363 1.9%
15–19 101 110 84 295 1.6%
20–24 130 147 131 408 2.1%
25–29 141 159 132 432 2.3%
30–34 166 195 227 588 3.1%
35–39 174 195 208 577 3.0%
40–44 214 232 263 709 3.7%
45–49 271 298 292 861 4.5%
50–54 322 340 307 969 5.1%
55–59 316 378 408 1,102 5.8%
60–64 298 347 395 1,040 5.5%
65–69 324 386 478 1,188 6.2%
70–74 545 556 561 1,662 8.7%
75–79 710 746 815 2,271 11.9%
80–84 778 837 965 2,580 13.6%
85+ 862 893 1,118 2,873 15.1%
Total 5,859 6,296 6,866 19,021 100.0%
Figure * shows that older persons are most at risk from stair and step related fall injury. Those aged ≥ 65 years of age accounted for 56% (n = 12,716) of these injuries.
While stair and step injuries increased by 17.2% across all age groups during the period covered by this analysis, these injuries increased by 22.3% among those aged ≥ 65 years of age during the same period.
Children ≤14 years of age account for a combined total of 7.7% of stair and step related injury, with the youngest age group (0-4 years) representing the majority of these injuries (4.1% of all stair and step injuries, n = 773) and the highest proportion of any age group under 45 years.

RELATIONSHIP BETWEEN SLIPS, TRIPS & FALLS & THE DESIGN & CONSTRUCTION OF BUILDINGS 119
Falls due to stairs and steps, Australia 2002-05: year by age, by sex
Table 9.11.4
Males 0-14 15-29 30-44 45-59 60-74 75+ Total %
2002-03 300 182 253 326 388 682 2131 11.2
2003-04 295 189 279 396 401 711 2271 11.9
2004-05 277 167 297 403 468 844 2456 12.9
Total 872 538 829 1125 1257 2237 6858 36.1
Total % 59.5 47.4 44.2 38.4 32.3 29 36.1 36.1
Females 0-14 15-29 30-44 45-59 60-74 75+ Total %
2002-03 207 190 301 583 779 1668 3728 19.6
2003-04 182 227 343 620 888 1765 4025 21.2
2004-05 205 180 401 604 965 2054 4409 23.2
Total 594 597 1045 1807 2632 5487 12162 63.9
Total % 40.5 52.6 55.8 61.6 67.7 71 63.9 63.9
Persons 0-14 15-29 30-44 45-59 60-74 75+ Total %
2002-03 507 372 554 909 1167 2350 5859 30.8
2003-04 477 416 622 1016 1289 2476 6296 33.1
2004-05 482 347 698 1007 1434 2898 6866 36.1
Total 1466 1135 1874 2932 3890 7724 19021 100.0
Total % 100 100 100 100 100 100 100.0 100.0
Women aged ≥ 75 years account for over 45% (n = 5487) of all female stair and step injuries across all age groups, 71% of all injuries for this age group and 28.8% of all stair and step injuries in total.
Injuries to both men and women aged ≥ 75 years have increased by over 23% (from n = 2350 in 2002-03 to n = 2989 in 2004-05) while stair and step related injuries across all age groups have increased by 17.2% over the three years covered by this analysis (from n = 5859 in 2002-03 to n = 6866 in 2004-05).
Females outnumber males for hospital admission for falls due to stairs and steps across all broad age groups, except children aged 0-14 years, where males accounted for 59.5% ( n = 872) of stair and step related admissions and females accounted for 40.55 (n = 594) over the three years covered here.

120 MONASH UNIVERSITY ACCIDENT RESEARCH CENTRE
Falls due to stairs and steps, Australia 2002-05: place of occurrence by age
Table 9.11.5
0-14 15-29 30-44 45-59 60-74 75+ Total
Other and unspecified place in home 1034 674 1389 2207 3079 5948 14331
Prison * 5 12 * 8 * 31
Military camp 0 0 * 0 0 * *
Aged care facilities 0 0 * * 43 305 358
Other specified residential institution * * 15 12 10 12 58
Unspecified residential institution 0 0 0 * * * 5
School 335 75 30 73 22 13 548
Health Service area 5 25 30 59 55 158 332
Other specified institution and public admin area
16 35 35 75 122 237 520
Sporting hall (indoor) * 6 7 9 8 * 36
Shop and store 28 38 66 123 148 434 837
Commercial garage 0 0 * 11 8 * 27
Office building 0 14 20 22 13 16 85
Cafe, hotel and restaurant 20 193 182 222 265 388 1270
Other specified trade and service area 15 63 78 98 104 196 554
Place not reported/not applicable * * * 9 * 7 *
Total 1466 1135 1874 2932 3890 7724 19021
Injuries sustained in the home accounted for the vast majority of stair and step injury hospital separations, totalling 75.3% of separations (n = 14,331) across all age groups.
The proportion of stair and step related injuries occurring in the home varied from a low of 59.4% among those aged 15-29 years, to a high of 79.2% among those aged ≥ 75 years.
Those aged ≥ 60 years injured the home accounted for 47.5% (n = 6,255) of all stair and step injuries included in this analysis, and 63.0% of all stair and step injuries sustained in the home.
Cafes, hotels and restaurants were the next most frequent injury location at 6.7% of all stair and step injury (n = 1,270) across all age groups, followed by injuries sustained in shops and stores, which accounted for 4.4% (n = 837) of all separations.
Nearly 52% (n = 434) of stair and step injuries sustained in shops and stores were to people aged ≥ 75 years

RELATIONSHIP BETWEEN SLIPS, TRIPS & FALLS & THE DESIGN & CONSTRUCTION OF BUILDINGS 121
Body region and nature of injury - falls related hospital separations occurring on stairs and steps
Table 9.11.6 Frequency and percentage of body region of principal diagnosis of fall related hospital separations occurring on stairs and steps by year of separation, Australia 2002-2005
Broad body region 2002–03 2003–04 2004–05 Total % Other injuries not specified by body region 976 1,044 1,418 3,438 18.1% Head 1,177 1,168 1,393 3,738 19.7% Trunk (neck, thorax, abdomen, lwr back, lumb. spine & pelvis 641 758 770 2,169 11.4% Shoulder and upper limb 1,165 1,244 1,235 3,644 19.2% Hip and lower limb 1,900 2,082 2,050 6,032 31.7% Total 5,859 6,296 6,866 19,021 100.0%
As figure * shows, injuries to the hip and lower limb account for nearly a third of all stair and step related fall injuries (31.7%, n = 6,032) and have increased by 7.8% over the three years covered here.
19.7% (n = 3,738) of stair and step related injuries are to the head, a figure that has increased 18.4% between 2002-3 and 2004-5.
Injuries to the shoulder and upper limb make up 19.2% (n = 3,644) of these injuries, a proportion that has increased by 6.0% over this time period.
18.1% (n = 3,438) of stair and step related injuries are not specified by broad body region.
Table 9.11.7
Body region detailed
Not poisoning/injury 935 1,002 1,388 3,325 17.5%
Injuries to the head 1,177 1,168 1,393 3,738 19.7%
Injuries to the neck 69 128 112 309 1.6%
Injuries to the thorax 199 244 240 683 3.6%
Injuries to the abdomen, lower back, lumbar spine & pelvis 373 386 418 1,177 6.2%
Injuries to the shoulder & upper arm 426 500 467 1,393 7.3%
Injuries to the elbow & forearm 642 631 663 1,936 10.2%
Injuries to the wrist & hand 97 113 105 315 1.7%
Injuries to the hip & thigh 748 825 841 2,414 12.7%
Injuries to the knee & lower leg 976 1,097 1,015 3,088 16.2%
Injuries to the ankle & foot 176 160 194 530 2.8%
Injuries to unspec parts of trunk, limb or body region 27 27 20 74 0.4%
Body type not relevant 5 11 6 22 0.1%
Total 5,859 6,296 6,866 19,021 100.0%

Falls due to stairs and steps, Australia 2002-05: broad body region by age, by sex
Table 9.11.8
Males 0-14 % 15-29 % 30-44 % 45-59 % 60-74 % 75+ % Total %
Not specified 33 9.3 50 9.3 91 11.0 179 15.9 267 21.2 549 24.5 1169 17.0
Head 447 51.3 183 34.0 253 30.5 341 30.3 308 24.5 442 19.8 1974 28.8
Trunk 26 3.0 45 8.4 99 11.9 164 14.6 184 14.6 359 16.0 877 12.8
Shoulder and upper limb 268 30.7 115 21.4 157 18.9 150 13.3 210 16.7 303 13.5 1203 17.5
Hip and lower limb 98 11.2 145 27.0 229 27.6 291 25.9 288 22.9 584 26.1 1635 23.8
Total males 872 100.0 538 100.0 829 100.0 1125 100.0 1257 100.0 2237 100.0 6858 100.0
Females 0-14 % 15-29 % 30-44 % 45-59 % 60-74 % 75+ % Total %
Not specified 38 6.4 167 28.0 146 14.0 206 11.4 432 16.4 1279 23.3 2268 18.6
Head 307 51.7 101 16.9 155 14.8 252 13.9 299 11.4 650 11.8 1764 14.5
Trunk 23 3.9 84 14.1 141 13.5 155 8.6 236 9.0 653 11.9 1292 10.6
Shoulder and upper limb 169 28.5 70 11.7 159 15.2 374 20.7 642 24.4 1027 18.7 2441 20.1
Hip and lower limb 57 9.6 175 29.3 444 42.5 820 45.4 1023 38.9 1878 34.2 4397 36.2
Total 594 100.0 597 100.0 1045 100.0 1807 100.0 2632 100.0 5487 100.0 12162 100.0
All Persons 0-14 % 15-29 % 30-44 % 45-59 % 60-74 % 75+ % Total %
Not specified 71 4.8 217 19.1 237 12.6 385 13.1 700 18.0 1828 23.7 3438 18.1
Head 754 51.4 284 25.0 408 21.8 593 20.2 607 15.6 1092 14.1 3738 19.7
Trunk 49 3.3 129 11.4 240 12.8 319 10.9 420 10.8 1012 13.1 2169 11.4
Shoulder and upper limb 437 29.8 185 16.3 316 16.9 524 17.9 852 21.9 1330 17.2 3644 19.2
Hip and lower limb 155 10.6 320 28.2 673 35.9 1111 37.9 1311 33.7 2462 31.9 6032 31.7
Total 1466 100.0 1135 100.0 1874 100.0 2932 100.0 3890 100.0 7724 100.0 19021 100.0
Injuries to the hip and lower limb account for nearly a third (31.7%, n = 6032) of stair and step fall related injuries across all age groups. The proportion of injuries to this region is higher for females (36.2%, n = 4397) than for males (23.8%, n = 1635).

Females account for 72.9% (n = 4397) of hip and lower limb injuries overall, increasing from 36.8% (n = 155) among those aged ≤ 14 years, to 76.3% (n = 1878) among those aged ≥ 75 years.
For all age groups, hip and lower limb injuries are followed in frequency by injuries to the head (19.7%, n= 3738), shoulder and upper limb (19.2%, n = 3644), separations where the injury was not specified by body region (18.1%, n = 3438) and injuries to the trunk (11.4%, n = 2169).
Injuries to the head account for the majority of separations for children aged 0 – 14 years (51.4%, n = 754). This figure is similar for both male and female children, as is the proportional distribution for all broad body regions.
Stair and step fall related injuries to the head decrease steadily as age increases, comprising 14.1% (n = 1092) of these injuries to those aged ≥ 75 years and 19.7%
(n = 3738) of stair and step fall related injuries for all persons across all age groups.
Conversely, the proportion of injuries to the hip and lower limb increases with age, from 10.6% (n = 155) among those aged 0 – 14 years, and peaks with the 45-59 year age group at 37.9% (n = 1111).

124 MONASH UNIVERSITY ACCIDENT RESEARCH CENTRE
Falls due to stairs and steps, Australia 2002-05: nature of injury by detailed body region, by sex
NB: 3,325 cases where the principal diagnosis group was listed as “not poisoning/injury” have been removed from the analysis of stair and step related injuries by detailed body region.
Table 9.11.9
Males Head Neck Thorax
Abdomen, lower back,
lumbar spine & pelvis
Shoulder & upper arm
Elbow & forearm
Wrist & hand
Hip &
thigh
Knee &
lower leg
Ankle & foot
Other injuries
Total
Superficial (excluding eye)
200 6 27 46 26 15 * 26 23 * 8 385
Open wound (excluding eye)
610 * * * 7 44 24 * 50 6 5 754
Fracture (excluding tooth)
264 * 257 193 298 526 107 598 551 90 * 2941
Dislocation 0 * 0 * 54 16 16 * 20 12 0 128
Sprain/strain 0 12 6 8 * * * 6 31 23 * 92
Nerve (including spinal cord; excluding brain)
0 21 * * 0 * * 0 * 0 * 34
Blood vessel 5 0 0 0 * 0 * 0 0 * 0 8
Muscle /tendon
0 * * 5 12 * 5 57 21 * 7 114
Amputation (including partial)
0 0 0 0 0 0 0 0 0 0 0 0
Internal organ
0 0 24 21 0 0 0 0 0 0 0 45
Burn/corrosion (excluding eye)
0 0 0 0 0 0 0 0 0 0 * *
Eye injury (excluding foreign body in external eye)
17 0 0 0 0 0 0 0 0 0 0 17
Intracranial (including concussion)
615 0 0 0 0 0 0 0 0 0 0 615
Dental (including fractured tooth)
16 0 0 0 0 0 0 0 0 0 0 16
Other specified nature of injury
22 7 8 12 7 * * 12 * 6 13 92
Unspecified nature of injury
223 31 21 96 19 * * 45 23 16 8 489
Injuries of more than one nature
* 0 * 0 * * 0 0 0 0 0 *
Total Males 1974 139 348 390 427 613 163 751 724 160 47 5736

RELATIONSHIP BETWEEN SLIPS, TRIPS & FALLS & THE DESIGN & CONSTRUCTION OF BUILDINGS 125
Females
Superficial (excluding eye)
250 9 47 77 16 9 8 50 57 15 14 552
Open wound (excluding eye)
518 * 0 * 7 59 24 * 279 12 8 916
Fracture (excluding tooth)
217 * 225 488 777 1219 90 1476 1888 199 * 6650
Dislocation 0 6 0 5 107 24 13 5 24 13 0 197
Sprain/strain 0 17 * 16 8 0 0 10 40 88 * 186
Nerve (including spinal cord; excluding brain)
* 11 * * 0 * 0 0 0 0 * 22
Blood vessel 7 0 0 * 0 0 * 0 * 0 0 14
Muscle/tendon
0 * * 10 16 * 7 11 14 7 * 77
Amputation (including partial)
0 0 0 0 0 0 * 0 0 * 0 *
Internal organ
0 0 19 10 0 0 0 0 0 * * 30
Burn/corrosion (excluding eye)
0 0 0 0 0 0 0 0 0 0 0 0
Eye injury (excluding foreign body in external eye)
15 0 0 0 0 0 0 0 0 0 0 15
Intracranial(including concussion)
515 0 0 0 0 0 0 0 0 0 0 515
Dental (including fractured tooth)
10 0 0 0 0 0 0 0 0 0 0 10
Other specified nature of injury
24 9 10 30 15 * * 30 6 7 18 155
Unspecified nature of injury
207 43 26 139 18 * * 76 54 28 16 614
Injuries of more than one nature
* 0 0 * * 0 0 * * 0 0 *
Total Females
1764 170 335 787 966 1323 152 1663 2364 370 66 9960
All persons 3738 309 683 1177 1393 1936 315 2414 3088 530 113 15696
Fractures are by far the most common injury resulting from falls involving stairs and steps, accounting for 61.1% (n = 9,591) of principally diagnosed injuries. These are followed in frequency by open wounds (10.6%, n = 1670), intracranial injuries (7.2%, n = 1130), and injuries of an unspecified nature (7.1%, 1103).
More than two thirds (66.8%, n = 6,650) of injuries of stair and step related fall injuries to females recorded between 2002/3 – 2004/5 are fractures, as are 51.3% (n = 2,941) of injuries to males.
53.6% (n = 3563) of fractures suffered by females are to the lower extremities, as are 42.1% (n = 1239) of fractures suffered by males.

126 MONASH UNIVERSITY ACCIDENT RESEARCH CENTRE
Open wounds constitute 10.6% (n = 1,670) of stair and step related principal diagnoses, 13.1% (n = 754) of injuries to males and 9.2% (n = 916) of injuries to females.
Among males, wounds to the head accounted for 80.9% (n = 610) of open wound diagnoses, while wounds of this nature accounted for 56.6% (n = 518) of open wounds suffered by females. In contrast, 30.5% (n = 279) of open wounds suffered by females were to the knee and lower leg compared to 6.6% (n = 50) of open wounds suffered by males.
Intracranial injury was also higher among males, accounting for 10.7% (n = 615) of principal diagnoses, compared to 5.2% (n = 515) among females.

Table 9.11.10 Falls due to stairs and steps, Australia 2002-05: principal diagnosis groups (detailed body region) by place of occurrence, by sex
Males Not
poisoning /injury
Head Neck Thorax
Abdomen, lower back,
lumbar spine & pelvis
Shoulder & upper
arm
Elbow & forearm
Wrist & hand
Hip & thigh
Knee &
lower leg
Ankle & foot
Other injuries
Total
Other and unspecified place in home
810 1328 106 289 300 320 401 117 586 513 116 34 4920
Prison * 12 0 0 * * * 0 * * 0 0 21
Military camp 0 0 0 0 0 0 * 0 0 0 0 0 *
Aged care facilities
19 26 * * 5 * * 0 24 6 0 0 90
Other specified residential institution
* 9 * 0 * * 0 0 * * 0 * 28
Unspecified residential institution
0 * 0 0 0 0 0 0 0 0 0 0 *
School 6 76 * * 10 20 100 13 8 31 10 * 278
Health Service area
60 23 * * 5 5 * * 9 * 7 * 125
Other specified institution and public administrative area
43 48 * * 9 14 13 5 20 12 * * 172
Sporting hall (indoor)
* 5 0 0 0 0 * 0 * * 0 0 14

Males Not
poisoning /injury
Head Neck Thorax
Abdomen, lower back,
lumbar spine & pelvis
Shoulder & upper
arm
Elbow & forearm
Wrist & hand
Hip & thigh
Knee &
lower leg
Ankle & foot
Other injuries
Total
Shop and store
36 61 5 6 15 18 19 6 34 32 * * 235
Commercial garage
* 0 * 0 0 0 * 0 * 0 0 0 10
Office building
8 9 * 0 * * * 0 * 8 * 0 35
Cafe, hotel and restaurant
97 281 16 30 30 30 42 17 41 68 18 6 676
Other specified trade and service area
31 95 * 10 7 13 19 * 17 40 * * 244
Place not reported/not applicable
* * 0 0 * * * 0 * 0 0 0 9
All Males 1122 1974 139 348 390 427 613 163 751 724 160 47 6858
Females
Other and unspecified place in home
1726 1317 129 276 634 740 974 103 1323 1848 290 50 9410
Prison * 0 0 * 0 * 0 0 0 * 0 0 10
Military camp * 0 0 0 0 0 0 0 0 0 0 0 *
Aged care facilities
56 46 * 9 17 20 25 * 61 27 * 0 268

Males Not
poisoning /injury
Head Neck Thorax
Abdomen, lower back,
lumbar spine & pelvis
Shoulder & upper
arm
Elbow & forearm
Wrist & hand
Hip & thigh
Knee &
lower leg
Ankle & foot
Other injuries
Total
Other specified residential institution
6 5 * 0 * * * 0 * 6 * 0 30
Unspecified residential institution
* 0 0 0 0 * 0 0 * * 0 0 *
School 33 53 6 * 14 17 58 7 10 59 9 * 270
Health Service area
87 12 * * 9 14 13 * 30 26 7 0 207
Other specified institution and public administrative area
50 58 * 7 20 24 54 8 54 62 10 * 348
Sporting hall (indoor)
0 * 0 0 0 * 10 * * 7 0 0 22
Shop and store
107 84 14 9 33 56 66 11 72 131 16 * 602
Commercial garage
* * * 0 * * * 0 * * 0 0 17
Office building
15 8 * 0 0 * * * * 13 * 0 50
Cafe, hotel and restaurant
71 118 9 15 35 59 65 10 72 113 21 6 594

Males Not
poisoning /injury
Head Neck Thorax
Abdomen, lower back,
lumbar spine & pelvis
Shoulder & upper
arm
Elbow & forearm
Wrist & hand
Hip & thigh
Knee &
lower leg
Ankle & foot
Other injuries
Total
Other specified trade and service area
36 59 * 13 20 26 49 5 26 58 9 * 310
Place not reported/not applicable
* 0 0 0 0 * * 0 * 10 0 0 18
All Females 2202 1764 170 335 787 966 1323 152 1663 2364 370 66 12162
Total 3325 3738 309 683 1177 1393 1936 315 2414 3088 530 113 19021
Over three quarters (75.3%, n = 14,330) of hospital separations (including the principal diagnosis code of not poisoning/injury) occurred in a private home.
The proportion of home based stair and step injury was slightly higher for females (77.4%, n = 9,410) than for males (71.7%, n = 4,920).
While males recorded a much higher proportion of home based stair and step fall related injuries to the head (27.0%, n = 1328 vs. 14.0%, n = 1317), females showed a significantly higher proportion of injuries these injuries at home to the lower extremities (33.7%, n = 3,171 vs. 22.3%, n = 1,099).
Stair and step fall related injuries sustained in cafes, hotels and restaurants accounted for 6.7% (n = 1270) of all separations. The proportion of males injured in this location was higher among males (9.9%, n = 676) than among females (4.9%, n = 594).
Conversely, a higher proportion of females than males were injured by stairs and steps in shops and stores (4.9%, n = 602 vs. 3.4%, n = 235).

RELATIONSHIP BETWEEN SLIPS, TRIPS & FALLS & THE DESIGN & CONSTRUCTION OF BUILDINGS 131
Table 9.11.11 Fractures sustained from falls involving stairs and steps, Australia 2002-05, by broad body region and age group
Other
injuries Head Trunk
Shoulder and upper limb
Hip and lower limb
Total
0-14 0 70 7 410 121 608
15-29 0 38 22 133 247 440
30-44 0 63 80 251 504 898
45-59 * * 155 449 930 1645
60-74 0 71 258 711 1084 2124
75+ * * 767 1063 1916 3876
All Fractures * * 1289 3017 4802 9591
Nearly eighty percent (79.7%, n = 7,645) of stair and step fall related fractures are to those aged ≥ 45 years. Of these, 51.4% (n = 3,930) are hip and lower limb fractures.
62.5% (n = 3,000) of hip and lower limb fractures are to those aged ≥ 60 years.
Over two thirds (67.4%, n = 410) of stair and step fall related fractures incurred by children aged ≥ 14 years are fractures of the shoulder and upper limb. Injuries to this body region account for 31.5% (n = 3017) of all fractures across all age groups.
Nearly eighty percent (79.5%, n = 1,025) of stair and step fall related fractures to the trunk are to those aged ≥ 60 years, this age group accounts for 62.6% (n = 6,000) of fractures across all body regions.

132 MONASH UNIVERSITY ACCIDENT RESEARCH CENTRE
Nature of injury
Table 9.11.12 Nature of fall related hospital separations occurring on stairs and steps by year of separation, Australia 2002-2005
Nature of injury 2002–03 2003–04 2004–05 Total %
Superficial (excluding eye) 271 277 389 937 4.9%
Open wound (excluding eye) 523 550 597 1,670 8.8%
Fracture (excluding tooth) 3,034 3,288 3,269 9,591 50.4%
Dislocation 104 123 98 325 1.7%
Sprain/strain 75 102 101 278 1.5%
Nerve (including spinal cord; excluding brain) 20 20 16 56 0.3%
Blood vessel 5 7 10 22 0.1%
Muscle/tendon 63 53 75 191 1.0%
Amputation (including partial) * * * * *
Internal organ 24 26 25 75 0.4%
Burn/corrosion (excluding eye) * * * * *
Eye injury (excluding foreign body in external eye) 11 12 9 32 0.2%
Intracranial(including concussion) 343 366 421 1,130 5.9%
Dental (including fractured tooth) 9 8 9 26 0.1%
Other specified nature of injury 81 77 89 247 1.3%
Unspecified nature of injury 358 378 367 1,103 5.8%
Injuries of more than one nature * * * 10 0.1%
Principal diagnosis not injury group 935 1,002 1,388 3,325 17.5%
Total 5,859 6,296 6,866 19,021 100.0%
Over 50% (50.4%, n = 9,561) of hospital admitted stair and step fall injuries result in fractures, and 8.8% (n = 1,670) of these injuries were coded as open wounds.
Intracranial injuries (including concussion) account for 5.9% (n = 1,130) of nature of injury codes, a proportion that increased by 22.7% from 2002-03 to 2004-05.
The nature of injury was unspecified in 5.8% (n = 1,103) of cases.

RELATIONSHIP BETWEEN SLIPS, TRIPS & FALLS & THE DESIGN & CONSTRUCTION OF BUILDINGS 133
Length of stay
Table 9.11.13 Length of stay - falls related hospital separations occurring on stairs and steps 2002-2005 by frequency
Length of stay 2002–03 2003–04 2004–05 Total %
Length of stay is less than two days
2,458 2,589 2,857 7,904 41.6%
Length of stay is two to seven days
1,768 1,930 1,948 5,646 29.7%
Length of stay is eight to thirty days
1,422 1,521 1,748 4,691 24.7%
Length of stay is greater than thirty days
211 256 313 780 4.1%
Total 5,859 6,296 6,866 19,021 100.0%
The majority of stair and step injuries (58.4%, n = 11,117) resulted in a hospital stay of greater than two days, and 28.8% (n = 5,471) resulted in admission exceeding eight days.
While stair and step related injuries increased by 17.2% overall during the period covered by this analysis, the proportion of patients whose hospital stay exceeded eight days increased by 26.2% over the same period.
Injury severity - falls related hospital separations most likely occurring on stairs and steps
Table 9.11.14 Injury severity - falls related hospital separations occurring on stairs and steps 2002-2005 by Frequency and percentage
Injury Severity 2002–03 2003–04 2004–05 Total %
Not severe injury, ICISS > 0.941 4,235 4,448 4,750 13,433 70.6%
Severe injury, ICISS <= 0.941 1,624 1,848 2,116 5,588 29.4%
Total 5,859 6,296 6,866 19,021 100.0%
Overall, 29.4% (n = 5,588) of stair and step related fall injuries included in this analysis met Cryer’s definition of a serious injury (see section 9.3.8).
The percentage of severe stair and step related fall injury has increased from 27.7% (n = 1,624) in 2002-03 to 30.8% (n = 2,116) in 2004-05. This represents a greater proportional increase for severe injuries than is shown for all building fall injury, which has increased from 33.0% in 2002-03 to 34.8% in 2004-05.

134 MONASH UNIVERSITY ACCIDENT RESEARCH CENTRE
9.12 FALL RELATED HOSPITAL SEPARATIONS OCCURRING IN RESIDENTIAL AGED CARE
NB:
Residential aged care facilities includes: a nursing home, old people’s home and retirement villages.
Admitted patients transferred from another hospital make up 12% of all fall related hospital separations most likely occurring in buildings in residential aged care in Australia in 2002/03- 2004/05. This results in an over-estimation of actual cases of falls.
Cell counts <5 denoted by * have been suppressed for privacy reasons.
Trend in the frequency and rate of hospital separations occurring in buildings in residential aged care
Frequency
The number of fall related hospital separations occurring in buildings in residential aged care for all persons increased by 41% from 14,869 in 2002/03 to 51,513 in 2004/05. Female hospital separations increased by 26 percent from 11, 605 to 14, 669 and male hospital separations by 40 percent from 3,264 to 4,585 for the same period.
Rates
Table 9.12.1 Age standardised rates per 100,000 population of fall related hospital separations occurring in buildings in residential aged care by sex, and year of separation, Australia, 2002/03-2004/05.
2002–03 2003–04 2004–05 Total
Males 44.0 51.0 56.1 50.5
Females 88.1 99.1 104.6 97.4
Persons 72.5 82.0 87.1 80.7
The age standardised rate of hospital separations occurring in buildings in residential aged care has increased in all persons by 20 percent from 72.5 hospital separations per 100,000 population per year in 2002/03 to 87.1 per 100,000 population in 2004/5.
The age standardised rate for males has increased by 28 percent from 44 hospital separations per 100,000 population per year to 56.1 per 100,000 population in 2004/05, with the female age standardised rate increasing by 19 percent for this same period, from 88.1 to 104.6 hospital separations per 100,000 population per year.

RELATIONSHIP BETWEEN SLIPS, TRIPS & FALLS & THE DESIGN & CONSTRUCTION OF BUILDINGS 135
Age and sex fall related hospital separations that occurring in buildings in residential aged care
Frequency and percentage
Table 9.12.2 Frequency and percentage of fall related hospital separations occurring in buildings in residential aged care by sex, and year of separation, Australia, 2002/03-2004/05.
2002–03 2003–04 2004–05 Total %
Males 3,264 3,953 4,585 11,802 22.9%
Females 11,605 13,436 14,669 39,710 77.1%
Persons 14,869 17,389 19,255 51,513 100.0%
Females accounted for a total of 39,710 (77 %) of all hospital separations occurring in residential aged care in Australia in 2002/03-2004/05, and males 11,802 (23%).
Rates
Age standardised rates per 100,00 of population of fall related hospital separations occurring in buildings in residential aged care by sex, and year of separation in Australia in 2002/03 to 2004/05.
The age standardised rates for hospital separations for females in residential aged care for 2002/03 to 2004/05 are almost double that of males in residential aged care, with 97.4 hospital separations per 100,000 population for females and 50.5 hospital separations per 100,000 population for males.

136 MONASH UNIVERSITY ACCIDENT RESEARCH CENTRE
Table 9.12.3 Frequency and percentage of fall related hospital separations occurring in buildings in residential aged care by 5 year age groups to 85+, and year of separation, Australia, 2002/03-2004/05.
Age groups 2002–03 2003–04 2004–05 Total %
0–4 * * * *
5–9 * * * *
10–14 * * * *
15–19 * * * *
20–24 * * * 8 0.0%
25–29 * * * 9 0.0%
30–34 * * * 6 0.0%
35–39 * * * 17 0.0%
40–44 17 11 20 48 0.1%
45–49 20 19 29 68 0.1%
50–54 31 29 49 109 0.2%
55–59 56 71 118 245 0.5%
60–64 88 117 151 356 0.7%
65–69 260 253 317 830 1.6%
70–74 585 690 726 2,001 3.9%
75–79 1,517 1,980 2,000 5,497 10.7%
80–84 3,364 3,718 4,344 11,426 22.2%
85+ 8,917 10,490 11,479 30,886 60.0%
Total 14,869 17,389 19,255 51,513 100.0%
Persons 85 years and accounted for 60 percent of the residential aged care hospital separations, with 30,866 hospital separations from 2002/03-2004/05. Persons 65 years and over accounted for 98 percent of hospital separations for this same time period.

RELATIONSHIP BETWEEN SLIPS, TRIPS & FALLS & THE DESIGN & CONSTRUCTION OF BUILDINGS 137
Causes of fall related hospital separations that occurring in buildings in residential aged care
Table 9.12.4 Frequency and percentage of fall related hospital separations by cause occurring in residential aged care facilities, by year of separation, Australia 2002/03- 2004/05.
2002–03 2003–04 2004–05 Total %
Fall on same level from slipping, tripping and stumbling
3,545 3,703 4,074 11,322 22.0%
Slipping 1,147 1,218 1,360 3,725 7.2%
Tripping 1,663 1,850 2,030 5,543 10.8%
Stumbling 735 635 684 2,054 4.0%
Other fall on same level due to collision with, or pushing by, another person
80 100 96 276 0.5%
Fall while being carried or supported by other persons
* * 5 21 0.0%
Fall involving wheelchair 152 191 222 565 1.1%
Fall involving bed 1,342 1,561 1,699 4,602 8.9%
Fall involving chair 479 617 618 1,714 3.3%
Fall involving other furniture 27 40 37 104 0.2%
Fall on and from stairs and steps 105 116 137 358 0.7%
Fall on and from ladder * * 8 21 0.0%
Fall from, out of or through building or structure
13 15 24 52 0.1%
Other fall from one level to another 41 48 69 158 0.3%
Other fall on same level 3,215 4,106 4,587 11,908 23.1%
Unspecified fall 5,855 6,878 7,679 20,412 39.6%
Total 14,869 17,389 19,255 51,513 100.0%
Almost 40 percent of these separations did not specify the type of fall.
The major causes in rank order were:
-other same level falls (23%)
-slips, trips and stumbles (22 %)
-fall involving a bed (9%)
-fall involving a chair (3%)
-fall involving a wheelchair (1%).
Hospital separations from falls from beds in residential aged care occurred predominately in older residents with 93% of separations occurring in persons aged 75 years and over (n=4272) and 6% in persons aged between 60-74 years (n=274).

138 MONASH UNIVERSITY ACCIDENT RESEARCH CENTRE
Activity - fall related hospital separations occurring in buildings in residential aged care
The activity variable was unspecified or not reported on in 66 percent of separations in residential aged care. When this variable was reported on, the most common category of activity being undertaken at the time of the fall was ‘activities of daily living’.
Body region and nature of injury - fall related hospital separations occurring in buildings in residential aged care
Table 9.12.5 Frequency and percentage of fall related hospital separations occurring in buildings in residential aged care by major body region injured (principal diagnosis) and year of separation, Australia, 2002/03-2004/05.
2002/03 2003/04 2004/05 Total %
Other injuries not specified by body region & principal diagnosis not injury
3022 3493 4346 10861 21.10%
Head 1926 2338 2710 6974 13.50%
Trunk (neck, thorax, abdomen, lower back, lumbar. spine & pelvis)
1661 1938 2266 5865 11.40%
Shoulder and upper limbs 1537 1777 2053 5367 10.40%
Hip and lower limbs 6723 7843 7880 22446 43.60%
Total 14869 17389 19255 51513 100.00%
In over twenty one percent of hospital separations the body region of the injury was not specified or injury was not the principal diagnosis. In about 79% of hospital separations the principal diagnosis was injury.
The body region most commonly injured by broad category was the: hip and lower limbs with 22,446 separations (44%), followed by the head with 6,974 separations (14%), the trunk with 5,865 separations (11%) and the shoulders and upper limbs with 5,367 separations (10%).
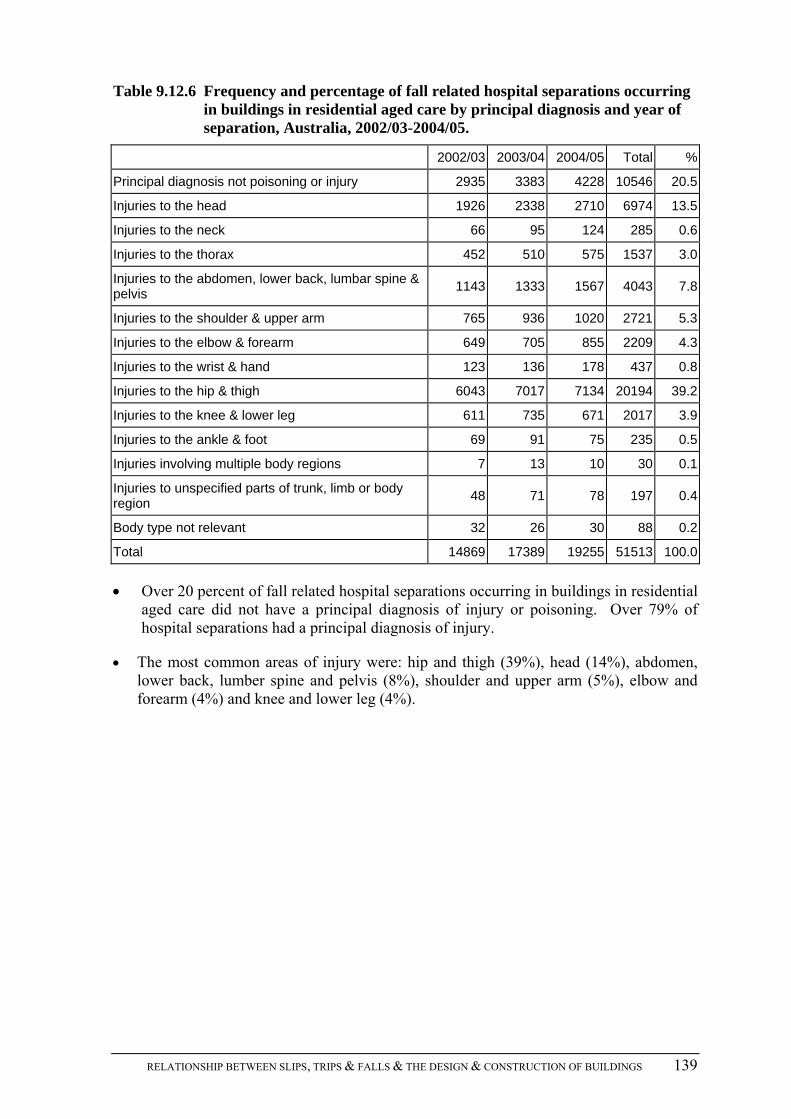
RELATIONSHIP BETWEEN SLIPS, TRIPS & FALLS & THE DESIGN & CONSTRUCTION OF BUILDINGS 139
Table 9.12.6 Frequency and percentage of fall related hospital separations occurring in buildings in residential aged care by principal diagnosis and year of separation, Australia, 2002/03-2004/05.
2002/03 2003/04 2004/05 Total %
Principal diagnosis not poisoning or injury 2935 3383 4228 10546 20.5
Injuries to the head 1926 2338 2710 6974 13.5
Injuries to the neck 66 95 124 285 0.6
Injuries to the thorax 452 510 575 1537 3.0
Injuries to the abdomen, lower back, lumbar spine & pelvis
1143 1333 1567 4043 7.8
Injuries to the shoulder & upper arm 765 936 1020 2721 5.3
Injuries to the elbow & forearm 649 705 855 2209 4.3
Injuries to the wrist & hand 123 136 178 437 0.8
Injuries to the hip & thigh 6043 7017 7134 20194 39.2
Injuries to the knee & lower leg 611 735 671 2017 3.9
Injuries to the ankle & foot 69 91 75 235 0.5
Injuries involving multiple body regions 7 13 10 30 0.1
Injuries to unspecified parts of trunk, limb or body region
48 71 78 197 0.4
Body type not relevant 32 26 30 88 0.2
Total 14869 17389 19255 51513 100.0
Over 20 percent of fall related hospital separations occurring in buildings in residential aged care did not have a principal diagnosis of injury or poisoning. Over 79% of hospital separations had a principal diagnosis of injury.
The most common areas of injury were: hip and thigh (39%), head (14%), abdomen, lower back, lumber spine and pelvis (8%), shoulder and upper arm (5%), elbow and forearm (4%) and knee and lower leg (4%).

140 MONASH UNIVERSITY ACCIDENT RESEARCH CENTRE
Table 9.12.7 Frequency and percentage of fall related hospital separations occurring in buildings in residential aged care by nature of injury by year of separation, Australia, 2002/03-2004/05.
2002/03 2003/04 2004/05 Total %
Superficial (excluding eye) 809 915 1,067 2,791 5.4%
Open wound (excluding eye) 1,350 1,540 1,780 4,670 9.1%
Fracture (excluding tooth) 7,944 9,217 9,741 26,902 52.2%
Dislocation 137 186 192 515 1.0%
Sprain/strain 90 121 106 317 0.6%
Nerve (including spinal cord; excluding brain) 13 7 11 31 0.1%
Blood vessel 14 12 19 45 0.1%
Muscle/tendon 46 37 62 145 0.3%
Amputation (including partial) * * * * *
Internal organ 20 32 33 85 0.2%
Burn/corrosion (excluding eye) * * * * *
Eye injury (excluding foreign body in external eye) 26 39 38 103 0.2%
Intracranial(including concussion) 288 393 461 1,142 2.2%
Dental (including fractured tooth) * * * * *
Poison/toxic effect (excluding bite) * * * * *
Other specified nature of injury 238 253 233 724 1.4%
Unspecified nature of injury 943 1,238 1,262 3,443 6.7%
Injuries of more than one nature 11 13 19 43 0.1%
Primary diagnosis not injury 2,935 3,383 4,228 10,546 20.5%
Total 14,869 17,389 19,255 51,513 100.0%
Over 20% of primary diagnosis of fall related hospital separations most likely occurring in residential aged care did not have a principal diagnosis as injury and in over 6 percent of separations the nature of the injury was not specified.
The most common injury was a fracture with 52 percent (26,902 hospital separations), followed by an open wound at 9 percent (4,670 hospital separations), superficial injury at 5 percent (2,791 hospital separations), and intracranial injury at 2 percent (1,142 hospital separations).
Females accounted for 79% (n=21,305) of fractures and males 21% (n=5597).

RELATIONSHIP BETWEEN SLIPS, TRIPS & FALLS & THE DESIGN & CONSTRUCTION OF BUILDINGS 141
Table 9.12.8 Frequency and percentage of fall related hospital separations occurring in buildings in residential aged care by nature of injury - fracture, by principal diagnosis group (detailed body region), Australia, 2002/03-2004/05.
Freq %
Injuries to the head 413 1.54
Injuries to the neck 171 0.64
Injuries to the thorax 1113 4.14
Injuries to the abdomen, lower back, lumbar spine & pelvis 3062 11.38
Injuries to the shoulder & upper arm 1948 7.24
Injuries to the elbow & forearm 1658 6.16
Injuries to the wrist & hand 170 0.63
Injuries to the hip & thigh 17307 64.33
Injuries to the knee & lower leg 974 3.62
Injuries to the ankle & foot * *
Other injuries not specified by body region * *
Total 26902 99.68
This data is a subset of fall related hospital separations occurring in residential aged care. Of the 52.2 % of hospital separations occurring in aged care facilities coded by nature of injury as fracture:
The most common region of fracture by principal diagnosis group was in the hip and thigh region (64%), followed by abdomen, lower back, lumbar spine and pelvis (11%) and elbow and forearm (6%).
Females accounted for 77% (n= 13,389) of fractures to the hip and thigh region and males 23% (n=3,918).
On examining the subset of fall related hospital separations occurring in residential aged care coded by nature of injury as an open wound (n=4670), 77% were injuries to the head (excluding the eye), 9% to the knee and lower leg and 8% to the elbow and forearm.
Length of stay- falls related hospital separations occurring in buildings in residential aged care
Table 9.12.9 Frequency and percentage of fall related hospital separations occurring in buildings in residential aged care by length of stay groups by year of separation, Australia, 2002/03- 2004/05.
2002/03 2003/04 2004/05 Total %
Length of stay is less than two days 4,377 4,937 5,398 14,712 28.6%
Length of stay is two to seven days 4,729 5,703 6,012 16,444 31.9%
Length of stay is eight to thirty days 5,012 5,805 6,814 17,631 34.2%
Length of stay is greater than thirty days 751 944 1,031 2,726 5.3%
Total 14,869 17,389 19,255 51,513 100.0%

142 MONASH UNIVERSITY ACCIDENT RESEARCH CENTRE
Almost 29% of hospital separations had lengths of stay less than two days, with 32% staying 2-7 days, 34% staying 8-30 days and 5% staying greater than thirty days.
Injury severity- falls related hospital separations occurring in buildings in residential aged care
Table 9.12.10 Frequency and percentage of fall related hospital separations occurring in buildings in residential aged care by severity of injury groups by year of separation, Australia, 2002/03- 2004/05.
2002/03 2003/04 2004/05 Total %
Not severe injury, ICISS > 0.941 7,397 8,368 9,454 25,219 49.0%
Severe injury, ICISS <= 0.941 7,472 9,021 9,801 26,294 51.0%
Total 14,869 17,389 19,255 51,513 100%
Hospital separations occurring as a result of a fall in a residential aged care facility were more likely to be classified as a serious injury, than separations associated with falls in acute health services or falls in other buildings. Of the hospital separations resulting from falls in residential aged care facilities, 49 % were coded using ICISS classification as not a severe injury, with about 51% of hospital separations injuries coded as a severe injury (see section 9.3.8).
9.13 FALL RELATED HOSPITAL SEPARATIONS OCCURRING IN HEALTH SERVICE AREAS
NB:
Health service area includes: day procedure centre, health centre, home for the sick, hospice, hospital and outpatient clinic.
Admitted patients transferred from another hospital make up 18.9% of all fall related hospital separations most likely occurring in buildings in acute health services in Australia in 2002/03-2004/05. This results in an over-estimation of actual cases of falls.
Unlike other categories of hospital admitted falls in buildings, those occurring in health service areas are not generally the primary reason for the hospital admission.
Cell counts <5 denoted by * have been suppressed for privacy reasons.
Trend in the frequency and rate of fall related hospital separations occurring in buildings in health service areas
Frequency
The frequency of fall related hospital separations occurring in buildings in health service areas for all persons decreased by 2 percent from 12,144 in 2002/03 to 11,908 in 2004/05. Female hospital separations decreased by 10 percent from 7,041 in 2002/03 to 6,346 in 2004/05, and male separations increased by 9 percent from 5,102 in 2002/03 to 5,561 in 2003/04.

RELATIONSHIP BETWEEN SLIPS, TRIPS & FALLS & THE DESIGN & CONSTRUCTION OF BUILDINGS 143
Rates
Table 9.13.1 Age standardised rates per 100,000 population of fall related hospital separations occurring in buildings in health service areas by sex, and year of separations, Australia, 2002/03-2004/05.
2002–03 2003–04 2004–05 Total
Males 62.2 61.8 62.4 62.1
Females 58.5 53.4 51.1 54.2
Persons 59.8 56.5 55.3 57.1
The age standardised rate of hospital separations occurring in buildings in health service areas has decreased in all persons by 8 percent from 59.8 hospital separations per 100,000 population per year in 2002/03 to 55.3 hospital separations per 100,000 population per year in 2004/05.
The age standardised rate for males has remained relatively stable with an increase of 0.3 percent from 62.2 hospital separations per 100,000 population per year in 2002/03 to 62.4 per 100,000 population per year, with the female age standardised rate decreasing by 13 percent for this same period, from 58.5 to 51.1 separations per 100,000 population per year.
Age and sex fall related hospital separations occurring in buildings in health service areas
Frequency and percentage
Table 9.13.2 Fall related hospital separations most likely occurring in buildings in health service areas by sex, and year of separation, Australia, 2002/03- 2004/05.
2002–03 2003–04 2004–05 Total %
Males 5,102 5,252 5,561 15,915 44.4%
Females 7,041 6,555 6,347 19,943 55.6%
Persons 12,144 11,808 11,908 35,860 100.0%
Females accounted for a total of 19,943 (56%) of all hospital separations occurring in health service areas in Australia in 2002/03 to 2004/05, and males 15,915 (44%).
Rates
The age standardised rates per 100,000 population for hospital separations for males in health service areas for 2002/03-2004/05 are 8 hospital separations per 100,000 population higher than those of females in health service areas, with 62.1 separations per 100,000 population for males and 54.2 separations for females per 100,000 population.

144 MONASH UNIVERSITY ACCIDENT RESEARCH CENTRE
Age
Table 9.13.3 Frequency and percentage of fall related hospital separations occurring in buildings in health service areas by 5 year age groups to 85+, and year of separation, Australia, 2002/03-2004/05.
2002–03 2003–04 2004–05 Total %
0–4 105 90 124 319 0.9%
5–9 15 29 27 71 0.2%
10–14 30 20 19 69 0.2%
15–19 50 48 47 145 0.4%
20–24 49 70 59 178 0.5%
25–29 117 81 88 286 0.8%
30–34 102 113 125 340 0.9%
35–39 126 138 129 393 1.1%
40–44 169 162 180 511 1.4%
45–49 189 204 206 599 1.7%
50–54 218 237 244 699 1.9%
55–59 307 343 396 1,046 2.9%
60–64 392 394 459 1,245 3.5%
65–69 617 577 734 1,928 5.4%
70–74 1,086 1,150 1,070 3,306 9.2%
75–79 2,015 1,898 2,034 5,947 16.6%
80–84 2,672 2,655 2,670 7,997 22.3%
85+ 3,884 3,599 3,297 10,780 30.1%
Total 12,144 11,808 11,908 35,860 100.0%
Persons aged 65 years and over accounted for 84 percent of the of the health service area hospital separations, with 29,958 separations occurring in the period 2002/03 to 2004/05, with persons 85 years and over accounting for 30 percent (10,780) of all hospital separations for this same time period.

RELATIONSHIP BETWEEN SLIPS, TRIPS & FALLS & THE DESIGN & CONSTRUCTION OF BUILDINGS 145
Causes of fall related hospital separations occurring in buildings in health service areas
Table 9.13.4 Frequency and percentage of fall related hospital separations occurring in health service areas, cause by year of separation, Australia, 2002/03-2004/05.
2002–03 2003–04 2004–05 Total %
Fall on same level from slipping, tripping and stumbling
2,686 2,386 2,505 7,577 21.1%
Slipping 1,329 1,228 1,284 3,841 10.7%
Tripping 763 666 718 2,147 6.0%
Stumbling 593 492 503 1,588 4.4%
Other fall on same level due to collision with, or pushing by, another person
31 22 27 80 0.2%
Fall while being carried or supported by other persons
15 13 6 34 0.1%
Fall involving wheelchair 134 133 129 396 1.1%
Fall involving bed 1,993 1,856 1,911 5,760 16.1%
Fall involving chair 498 506 479 1,483 4.1%
Fall involving other furniture 47 51 39 137 0.4%
Fall on and from stairs and steps 116 110 106 332 0.9%
Fall on and from ladder 16 21 7 44 0.1%
Fall from, out of or through building or structure
39 26 38 103 0.3%
Other fall from one level to another 72 76 56 204 0.6%
Other fall on same level 2,859 2,971 3,060 8,890 24.8%
Unspecified fall 3,638 3,637 3,545 10,820 30.2%
Total 12,144 11,808 11,908 35,860 100.0%
The cause of the fall was not specified in over 30 percent of separations.
The major causes of falls in rank order were:
-fall on same level (25%)
-slips, trips and stumbles on the same level (21%)
-fall involving a bed (16%)
-fall involving a chair (4%)
-fall involving a wheel chair (1%).

146 MONASH UNIVERSITY ACCIDENT RESEARCH CENTRE
Activity when fell occurred- falls related hospital separations occurring in buildings in health service areas
Table 9.13.5 Frequency and percentage of fall related hospital separations occurring in health service area, by activity being undertaken and year of separation, Australia, 2002/03-2004/05.
2002–03 2003–04 2004–05 Total %
While engaged in sports 34 25 10 69 0.2%
While engaged in leisure 12 8 13 33 0.1%
While working for income 163 134 136 433 1.2%
While engaged in other types of work 33 41 34 108 0.3%
While resting, sleeping, eating, etc. 4,039 3,733 3,965 11,737 32.7%
Other specified activity 2,241 2,326 2,166 6,733 18.8%
Unspecified activity 5,503 5,446 5,516 16,465 45.9%
Activity not reported/not applicable 115 95 68 278 0.8%
Total 12,140 11,808 11,908 35,856 100.0%
The activity variable is not well reported in the national data and was unspecified or not reported in over 46 percent of hospital separations, while a further 19 percent were coded to the category of ‘other specified activity’.
The activity being undertaken at the time of fall was listed as resting, sleeping, eating etc. in 33 percent of hospital separations, while working for an income in 1 percent of hospital separations, and while engaged in other types of work for 0.3 percent of hospital separations. The last two activities suggest falls by persons who were not inpatients of health services, possibly staff members, volunteers, visitors or persons working in health service areas.
Body region and nature of injury – Frequency and percentage of fall related hospital separations occurring in buildings in health service areas
Table 9.13.6 Frequency of fall related hospital separations occurring in buildings in health service areas by major body region injured (principal diagnosis) and year of separation, Australia, 2002/3-2004/5.
2002-03 2003–04 2004–05 Total %
Other injuries not specified by body region & principal diagnosis not injury
9,281 9,667 10,035 28,983 80.8%
Head 489 387 339 1,215 3.4%
Trunk (neck, thorax, abdomen, lower back, lumbar spine & pelvis
354 274 248 876 2.4%
Shoulder and upper limb 379 337 283 999 2.8%
Hip and lower limb 1,641 1,143 1,003 3,787 10.6%
Total 12,144 11,808 11,908 35,860 100.0%

RELATIONSHIP BETWEEN SLIPS, TRIPS & FALLS & THE DESIGN & CONSTRUCTION OF BUILDINGS 147
In over 80 percent of hospital separations the major body region injured was not specified or the principal diagnosis was not injury. Of the 19% of hospital separations with a principal diagnosis of injury:
The body region most commonly injured by broad category was the: hip and lower limb (11%), head (3%), shoulder and upper limb (3%) and the trunk (2%).
Table 9.13.7 Frequency and percentage of fall related hospital separations occurring in buildings in health service areas by principal diagnosis and year of separation, Australia, 2002/03-2004/05.
2002–03 2003–04 2004–05 Total %
Principal diagnosis not poisoning or injury
9,234 9,632 10,011 28,877 80.5%
Injuries to the head 489 387 339 1,215 3.4%
Injuries to the neck 20 31 27 78 0.2%
Injuries to the thorax 93 69 76 238 0.7%
Injuries to the abdomen, lower back, lumbar spine & pelvis
241 174 145 560 1.6%
Injuries to the shoulder & upper arm 168 163 133 464 1.3%
Injuries to the elbow & forearm 188 135 120 443 1.2%
Injuries to the wrist & hand 23 39 30 92 0.3%
Injuries to the hip & thigh 1,411 970 851 3,232 9.0%
Injuries to the knee & lower leg 199 152 129 480 1.3%
Injuries to the ankle & foot 31 21 23 75 0.2%
Injuries involving multiple body regions * * * 10 0.0%
Injuries to unspecified parts of trunk, limb or body region
* * * 24 0.1%
Body region not relevant 35 20 17 72 0.2%
Total 12,144 11,808 11,908 35,860 100.0%
Over 80 percent of hospital separations occurring in health service areas did not have a principal diagnosis of injury of poisoning. Of the 19.5 % of hospital separations with an injury related principal diagnosis:
The most common areas of injury coded were to the: hip and thigh (9%), head (3 %), abdomen, lower back, lumbar spine and pelvis (2%), shoulder and upper arm (1%), elbow and forearm (1%) and the knee and lower leg (1%).

148 MONASH UNIVERSITY ACCIDENT RESEARCH CENTRE
Table 9.13.8 Frequency and percentage of fall related hospital separations occurring in buildings in health service areas by nature of injury and year of separation (principle diagnosis = injury), Australia, 2002/03-2004/05.
2002–03 2003–04 2004–05 Total %
Superficial (excluding eye) 177 103 109 389 5.6%
Open wound (excluding eye) 234 185 153 572 8.2%
Fracture (excluding tooth) 1,969 1,458 1,260 4,687 67.1%
Dislocation 50 62 48 160 2.3%
Sprain/strain 24 23 21 68 1.0%
Nerve (including spinal cord; excluding brain)
* * 5 12 0.2%
Blood vessel 5 * * 10 0.1%
Muscle/tendon 16 15 17 48 0.7%
Crush injury * * * *
Internal organ 11 8 7 26 0.4%
Burn/corrosion (excluding eye) * * * *
Eye injury (excluding foreign body in external eye)
6 * 5 13 0.2%
Intracranial(including concussion) 135 129 111 375 5.4%
Dental (including fractured tooth) * * * 6 0.1%
Poison/toxic effect (excluding bite) 16 * * 19 0.3%
Other specified nature of injury 52 41 43 136 1.9%
Unspecified nature of injury 205 138 112 455 6.5%
Injuries of more than one nature * * * 5 0.1%
Total 2,910 2,176 1,897 6,983 100.0%
NB: This table refers to a sub-set of fall related hospital separations occurring in health service areas. Only 20 percent (n=6,983) of the total fall related hospital separations occurring in a health service area (n=35, 860) were coded with a principal diagnosis of injury. Of the 20% of separations:
Over 6% (n= 455) of the fall related hospital separations (principle diagnosis = injury) occurring in a health service area did not specify the nature of the injury.
The most common injury was a fracture (67%, n=4,687), followed by an open wound (8%, n=572), superficial injuries (6%, n=389), and intracranial injuries (5%, n=375).

RELATIONSHIP BETWEEN SLIPS, TRIPS & FALLS & THE DESIGN & CONSTRUCTION OF BUILDINGS 149
Table 9.13.9 Frequency of fall related hospital separations occurring in buildings in health service areas by ICD chapter (principal diagnosis groups =not injury), by year of separation, 2002/03-2004/05, Australia.
2002–03 2003–04 2004–05 Total %
Certain infectious and parasitic diseases 177 167 198 542 1.9
Neoplasms 961 1,066 1,100 3,127 10.8
Diseases of the blood, blood-forming organs, etc 70 80 75 225 0.8
Endocrine, nutritional and metabolic diseases 244 277 283 804 2.8
Mental and behavioural disorders 809 878 897 2,584 8.9
Diseases of the nervous system 452 471 462 1,385 4.8
Diseases of the eye and adnexa 19 28 22 69 0.2
Diseases of the ear and mastoid process 13 20 18 51 0.2
Diseases of the circulatory system 1,329 1,340 1,439 4,108 14.2
Diseases of the respiratory system 726 781 821 2,328 8.1
Diseases of the digestive system 455 463 517 1,435 5.0
Diseases of the skin and subcutaneous tissue 130 155 140 425 1.5
Diseases of the musculoskeletal system and connective tissue
544 525 489 1,558 5.4
Diseases of the genitourinary system 327 347 346 1,020 3.5
Pregnancy, childbirth and the puerperium 78 66 78 222 0.7
Certain conditions originating in the perinatal period 8 6 10 24 0.1
Congenital malformations, deformations etc 8 8 6 22 0.1
Symptoms, signs, abnormalities not elsewhere classified
566 598 626 1,790 6.2
Factors influencing health status - Z 2,318 2,356 2,484 7,158 24.8
Total 9,234 9,632 10,011 28,877 100.0
NB: As over 80% of fall related separations occurring in buildings in health service areas did not have a principal diagnosis of injury, it is important to examine the area of principle diagnosis of these hospital separations. The above table is a subset of all fall related hospital separations occurring in health service areas.
The most common ICD chapter group was factors influencing health status (25%), followed by diseases of the circulatory system (14%), neoplasms (11%), mental and behaviour disorders (9%) and disease of the respiratory system (8%).

150 MONASH UNIVERSITY ACCIDENT RESEARCH CENTRE
Length of stay-falls related hospital separations occurring in buildings in health service areas
Table 9.13.10 Frequency and percentage of fall related hospital separations occurring in buildings in health service areas by length of stay groups by year of separation, Australia, 2002/03- 2004/05.
2002–03 2003–04 2004–05 Total %
Length of stay is less than two days 1,218 1,067 1,028 3,313 9.2%
Length of stay is two to seven days 2,817 2,637 2,578 8,032 22.4%
Length of stay is eight to thirty days 5,615 5,531 5,822 16,968 47.3%
Length of stay is greater than thirty days 2,494 2,573 2,480 7,547 21.0%
Total 12,144 11,808 11,908 35,860 100.0%
Twenty one percent of hospital separations due to falls in health service areas had a length of stay greater than 30 days. This is a much larger proportion of separations in this category than for other building areas examined: residential aged care (5%), home (6%) and all building (7%) of separations.
Nine percent of separations had a length of stay of less than 2 days, with 22 % of separations with a length of stay of 2 -7 days and 47 percent with a length of stay of 8-30 days.
Injury severity- falls related hospital separations occurring in buildings in health service areas
Table 9.13.11 Frequency and percentage of fall related hospital separations occurring in buildings in health service areas by severity groups by year of separation, Australia, 2002/03-2004/05.
2002–03 2003–04 2004–05 Total %
Not severe injury, ICISS > 0.941 8,922 8,985 9,236 27,143 75.7%
Severe injury, ICISS <= 0.941 3,222 2,823 2,672 8,717 24.3%
Total 12,144 11,808 11,908 35,860 100.0%
Three quarters of the hospital separations resulting from falls in health service areas were coded using ICISS classification as not a severe injury, with about a quarter of hospital separations injuries coded as a severe (see section 9.3.8).

RELATIONSHIP BETWEEN SLIPS, TRIPS & FALLS & THE DESIGN & CONSTRUCTION OF BUILDINGS 151
9.14 FALLS FROM BEDS: HOSPITAL SEPARATIONS
NB:
Admitted patients transferred from another hospital make up 11.7% of all fall related hospital separations most likely occurring in buildings caused by falls from bed in Australia in 2002/03- 2004/05. This results in an over-estimation of actual cases of falls.
Cell counts <5 denoted by * have been suppressed for privacy reasons.
Trends in the frequency and rate of hospital separations resulting from falls from beds occurring in buildings
Frequency
The frequency of fall related hospital separations occurring in buildings caused by falls from beds for all persons increased by 7 percent from 6,793 in 2002/03 to 7,291 in 2004/05. Female hospital separations increased by 7 percent from 4,095 to 4,394 and male hospital separations by 7 percent from 2, 697 to 2,897 for the same period.
Rate
Table 9.14.1 Age standardised rates per 100,000 population of fall related hospital separations occurring in buildings from beds by sex, and year of separation, Australia, 2002/03-2004/05.
2002–03 2003–04 2004–05 Total
Males 32.2 31.9 32.4 32.1
Females 34.1 34.5 34.8 34.5
Persons 33.6 33.6 34.2 33.8
The age standardised rate of hospital separations for falls from beds has increased by 1.8 percent from 33.6 per 100,000 persons in 2002/03 to 34.2 per 100,000 persons in 2004/05.
Age standardised rates for falls from beds increased by 0.6 percent from 32.2 per 100,000 population in 2002/03 to 32.4 per 100,000 population in 2004/05, with the female rate increasing 2 percent from 34.1 per 100,000 population in 2002/2003 to 34.8 per 100,000 population in 2004/05.

152 MONASH UNIVERSITY ACCIDENT RESEARCH CENTRE
Age and sex of falls occurring in buildings separations from beds
Frequency
Table 9.14.2 Frequency and percentage of fall related hospital separations occurring in buildings from beds by sex, and year of separation, Australia, 2002/03- 2004/05.
2002–03 2003–04 2004–05 Total %
Males 2,697 2,751 2,897 8,345 39.6%
Females 4,095 4,214 4,394 12,703 60.3%
Persons 6,793 6,965 7,291 21,049 100.0%
Females accounted for a total of 12,703 (60%) of all fall related hospital separations occurring in buildings from beds in 2002/03 to 2004/05, and males 8,345 (40%).
Rates
The age standardised rate for hospital separations for females for 2002/03 to 2004/05 were 2.4 hospital separations per 100,000 population higher than the rate for males, with 34.5 hospital separations per 100,000 population for females and 32.1 hospital separations per 100,000 population for males.

RELATIONSHIP BETWEEN SLIPS, TRIPS & FALLS & THE DESIGN & CONSTRUCTION OF BUILDINGS 153
Table 9.14.3 Frequency and percentage of fall related hospital separations occurring in buildings from beds by 5 year age and year, Australia, 2002/03-2004/05.
2002–03 2003–04 2004–05 Total %
0–4 648 674 657 1,979 9.4%
5–9 326 346 283 955 4.5%
10–14 96 79 78 253 1.2%
15–19 31 19 39 89 0.4%
20–24 25 28 36 89 0.4%
25–29 31 24 34 89 0.4%
30–34 37 46 32 115 0.5%
35–39 39 53 34 126 0.6%
40–44 49 44 48 141 0.7%
45–49 64 69 78 211 1.0%
50–54 91 81 97 269 1.3%
55–59 131 152 129 412 2.0%
60–64 140 129 182 451 2.1%
65–69 251 244 239 734 3.5%
70–74 445 431 501 1,377 6.5%
75–79 795 875 926 2,596 12.3%
80–84 1,234 1,315 1,383 3,932 18.7%
85+ 2,359 2,356 2,515 7,230 34.3%
Total 6,793 6,965 7,291 21,049 100.0%
Persons aged 65 years and over accounted for 75.3% (n=15,869) of all hospital separations due to falls from beds in buildings, with persons aged 85 years and over accounting for 34.3 % (n= 7,230) of all separations.
Young children aged between 0 and 4 years (9.4%, n=1,979) were also over-represented compared with all age groups up to 75 years.

154 MONASH UNIVERSITY ACCIDENT RESEARCH CENTRE
Location of falls occurring in buildings hospital separations from beds
Table 9.14.4 Frequency and percentage of fall related hospital separations occurring in buildings from beds by place of occurrence by year, Australia, 2002/03-2004/05.
2002–03 2003–04 2004–05 Total %
Other and unspecified place in home 3,298 3,460 3,586 10,344 49.1%
Prison * * * 15 0.1%
Juvenile detention centre * * * *
Military camp * * * *
Orphanage * * * *
Aged care facilities 1,342 1,561 1,699 4,602 21.9%
Other specified residential institution 29 36 48 113 0.5%
Unspecified residential institution * * * 18 0.1%
School * * * 11 0.1%
Health Service area 1,993 1,856 1,911 5,760 27.4%
Other specified institution and public administrative area
46 21 16 83 0.4%
Sporting hall (indoor) * * * *
Shop and store * * * *
Cafe, hotel and restaurant 9 9 13 31 0.1%
Other specified trade and service area * * * 8 0.0%
Place not reported/not applicable 50 * * 55 0.3%
Total 6,793 6,965 7,291 21,049 100.0%
Over 49 percent of hospital separations due to falls from beds occurred in the home.
o Persons aged 75 years and over were 52% of hospital separations of falls from bed in the home and children aged 0-14 years were 29 %.
Health service areas were nominated as the place of occurrence in over 27% (n=5,760) of hospital separations, followed by aged care facilities in 22% (n=4,602) of separations in 2002/03 to 2004/05. Both settings accounting for almost 50 percent of hospital separations due to falls from beds.
o Persons aged 75 years and over were 69% of hospital separations of falls from bed in health service areas and persons aged 60-74 years 19%.
o Persons aged 75 years and over were 93% of hospital separation of falls from bed in residential aged facilities and persons aged 60-74 were 6%.

RELATIONSHIP BETWEEN SLIPS, TRIPS & FALLS & THE DESIGN & CONSTRUCTION OF BUILDINGS 155
Activity of falls most likely occurring in buildings hospital separations from beds
Table 9.14.5 Frequency and percentage of fall related hospital separations occurring in buildings from beds by broad activity by year, Australia, 2002/03-2004/05.
2002–03 2003–04 2004–05 Total %
While engaged in sports * * * 6 0.0%
While engaged in leisure 34 39 21 94 0.4%
While working for income * * * 13 0.1%
While engaged in other types of work 16 30 30 76 0.4%
While resting, sleeping, eating, etc. 3,738 3,620 3,818 11,176 53.1%
Other specified activity 1,052 1,063 1,055 3,170 15.1%
Unspecified activity 1,880 2,185 2,341 6,406 30.4%
Activity not reported/not applicable 61 21 22 104 0.5%
Total 6,789 6,965 7,291 21,045 100.0%
The activity was not specified or reported on in about 31 percent of hospital separations.
The activity was coded as ‘while resting, sleeping, eating, etc.’ in over 53 percent of cases with 15% of separations coded as ‘other specified activity’.
Body region and nature of injury – falls occurring in buildings hospital separations from beds
Table 9.14.6 Frequency and percentage of fall related hospital separations occurring in buildings from beds by major body region injured (principal diagnosis) by year, Australia, 2002/03-2004/05.
2002–03 2003–04 2004–05 Total %
Other injuries not specified by body region & principal diagnosis not injury
2,777 2,787 3,041 8,605 40.9%
Head 1,013 975 1,076 3,064 14.6%
Trunk (neck, thorax, abdomen, lower back, lumbar spine & pelvis
528 583 679 1,790 8.5%
Shoulder and upper limb 935 949 884 2,768 13.2%
Hip and lower limb 1,540 1,671 1,611 4,822 22.9%
Total 6,793 6,965 7,291 21,049 100.0%
Table* shows the frequency of fall related hospital separations occurring in buildings from beds by major body region injured (principal diagnosis) by year in Australia in 2002/03 to 2004/05. In over 40 percent of hospital separations the body region of the injury was not specified or injury was not the principal diagnosis. Over 59% of hospital separations had a principal diagnosis of injury.
The body region most commonly injured by broad category was the: hip and lower limb (23%), head (15%), shoulder and upper limb (13%) and trunk (9%).

156 MONASH UNIVERSITY ACCIDENT RESEARCH CENTRE
Table 9.14.7 Frequency and percentage of fall related hospital separations occurring in buildings from beds by principal diagnosis groups by year, Australia, 2002/03-2004/05.
2002–03 2003–04 2004–05 Total %
Principal diagnosis not poisoning or injury
2,726 2,724 2,985 8,435 40.1%
Injuries to the head 1,013 975 1,076 3,064 14.6%
Injuries to the neck 47 79 69 195 0.9%
Injuries to the thorax 161 181 194 536 2.5%
Injuries to the abdomen, lower back, lumbar spine & pelvis
320 323 416 1,059 5.0%
Injuries to the shoulder & upper arm 398 398 408 1,204 5.7%
Injuries to the elbow & forearm 492 513 417 1,422 6.8%
Injuries to the wrist & hand 45 38 59 142 0.7%
Injuries to the hip & thigh 1,274 1,385 1,313 3,972 18.9%
Injuries to the knee & lower leg 234 236 267 737 3.5%
Injuries to the ankle & foot 32 50 31 113 0.5%
Injuries to unspecified parts of trunk, limb or body region
30 28 30 88 0.4%
Body region not relevant 19 26 24 69 0.3%
Total 6,793 6,965 7,291 21,049 100.0%
Over 40% of hospital separations did not have a principal diagnosis of injury or poisoning.
Over 59% of hospital separations had an injury related principal diagnosis.
The most common areas of injury were: to the hip and thigh (19%), to the head (15%), to the elbow and forearm (7%), and to the shoulder and upper arm (6%).

RELATIONSHIP BETWEEN SLIPS, TRIPS & FALLS & THE DESIGN & CONSTRUCTION OF BUILDINGS 157
Table 9.14.8 Frequency and percentage of falls related hospital separations occurring in buildings from beds by nature of injury and year of separation, Australia, 2002/03-2004/05.
2002–03 2003–04 2004–05 Total %
Superficial (excluding eye) 288 321 333 942 7.5%
Open wound (excluding eye) 513 484 594 1,591 12.6%
Fracture (excluding tooth) 2,317 2,422 2,357 7,096 56.3%
Dislocation 82 108 79 269 2.1%
Sprain/strain 49 51 48 148 1.2%
Nerve (including spinal cord; excluding brain)
11 14 13 38 0.3%
Blood vessel * * 7 13 0.1%
Muscle/tendon 18 27 29 74 0.6%
Amputation (including partial) * * * *
Internal organ 19 15 6 40 0.3%
Burn/corrosion (excluding eye) * * * *
Eye injury (excluding foreign body in external eye)
13 9 15 37 0.3%
Intracranial (including concussion) 198 174 166 538 4.3%
Dental (including fractured tooth) 13 13 6 32 0.3%
Poison/toxic effect (excluding bite) 8 * * 12 0.1%
Other specified nature of injury 83 119 96 298 2.4%
Unspecified nature of injury 445 475 546 1,466 11.6%
Injuries of more than one nature 6 * * 15 0.1%
Total 4,067 4,241 4,306 12,614 100.0%
NB: The separations are a subset (59% n= 12,614) of all fall related hospital separations occurring from beds, and include all separations where the principal diagnosis was injury.
Over 11 percent of hospital separations did not specify the nature of the injury sustained.
The most common injury was a fracture (56%), followed by an open wound (13%), superficial injuries (8%), and intracranial injuries (4%).
On analysis of the subset of fall related hospital separations occurring from beds coded as fractures (n=7096).
The majority of fractures were injuries to: the hip and thigh region (46%, n=3229), elbow and forearm (17%, n=1238), shoulder and upper arm (13%, n=907) and abdomen, lower back, lumbar spine and pelvis (9%, n=631).
Females accounted for 68% of all fracture separations and 73 % of fracture separation to the hip and thigh region.

158 MONASH UNIVERSITY ACCIDENT RESEARCH CENTRE
Females and male proportions of separations due to fractures to the head region (n=227) were equal with females Maki and Fernieng up 49% and males 51% of separations.
Persons aged 75 years and over were 64% of all hospital separations due to fracture with persons aged 0-14 years 22% and persons aged 60-74 years 9% of hospital separations.
On analysis of the subset of fall related hospital separations occurring from beds coded as open wounds (n=1,591).
The majority of open wound injuries were to the following regions: head (77%), knee and lower leg (9%) and elbow and lower arm (6%).
Intracranial injuries were analysed as a subset due to the serious nature of this injury type. On analysis of the subset of fall related hospital separations occurring from beds coded as intracranial injury (n=538):
Equal proportions of males and females separations were found as a consequence of falls from beds resulting in intracranial injuries.
Persons aged 0-14 were 45% of hospital separations due to intracranial injuries, persons aged 60-74 were 10% and persons aged 75 years and older were 36% of hospital separations.
Length of stay falls occurring in buildings hospital separations from beds
Table 9.14.9 Frequency and percentage of falls related hospital separations occurring in buildings from beds by length of stay and year of separation, Australia, 2002/03-2004/05.
2002–03 2003–04 2004–05 Total %
Length of stay is less than two days 2,268 2,192 2,301 6,761 32.1%
Length of stay is two to seven days 1,685 1,855 1,834 5,374 25.5%
Length of stay is eight to thirty days 2,216 2,291 2,520 7,027 33.4%
Length of stay is greater than thirty days
624 627 636 1,887 9.0%
Total 6,793 6,965 7,291 21,049 100.0%
9% of hospital separations due to falls from beds had a length of stay over 30 days, where as 32% stayed less than 2 days, with 36% with a length of stay of 2 -7 days and 33 percent with a length of stay of 8-30 days.
Injury severity of falls occurring in buildings hospital separations from beds
Table 9.14.10 Falls related hospital separations occurring in buildings from beds by severity of injury and year of separation, Australia, 2002/03-2004/05.
2002–03 2003–04 2004–05 Total %
Not severe injury, ICISS > 0.941 4,849 4,909 5,253 15,011 71.3%
Severe injury, ICISS <= 0.941 1,944 2,056 2,038 6,038 28.7%
Total 6,793 6,965 7,291 21,049 100.0%

RELATIONSHIP BETWEEN SLIPS, TRIPS & FALLS & THE DESIGN & CONSTRUCTION OF BUILDINGS 159
Seventy one percent of the hospital separations resulting from falls from beds most likely occurring in a building were coded using ICISS classification as not a severe injury, with almost 29 percent of hospital separations injuries coded as a severe.
9.15 INTRINSIC CONDITION OF INJURED PERSON
9.15.1 Introduction
A difficult question to answer is in what proportion of falls did intrinsic condition of the person suffering the falls contribute to the fall or to the occurrence or severity of injury? Data from the final 3 years (July 2002-June 2005) were analysed to attempt to quantify how many persons had other conditions recorded on their hospital record. It is important to note that this analysis takes into account all other possible diagnosis codes and includes conditions that may not have contributed to the fall or its consequences, for example the ICD-10-AM (International Classification of Diseases Version 10: Australian Modification) coding system contains a chapter “Factors influencing health status and contact with health services” which includes codes such as ‘family history of malignant neoplasm’ or ‘personal history of allergy to drugs, medicaments or biological substances’.
9.15.2 Results
The following overview table gives some indication of commonly occurring co-morbid conditions in different settings (Table 9.10.1). The column totals do not add up to 100% as more than one condition could be reported for all cases. These in-depth analyses are limited to Victoria, as the available resources for this study did not permit wider analysis.
Overall, almost 30% of cases across all building locations had no additional ICD-10 codes recorded. Obviously the location of a fall influences this proportion as evidenced by only 6% of falls occurring in health service areas and 22% in residential services having no other codes recorded.
Some co-morbidities listed in Table 9.10.1 may actually have occurred as a consequence of the fall. This may be true for abnormal clinical findings not elsewhere classified (in total 43.6% of cases in Table 9.10.1)

160 MONASH UNIVERSITY ACCIDENT RESEARCH CENTRE
Table 9.15.1 Co-morbid conditions by location among all persons admitted to Victorian hospitals who were injured due to falls in buildings 2002/3-2004/5
Home Residential institution
Health service
area All other locations Total
n % n % n % n % n %
Certain infectious and parasitic diseases 4032 9.7 1822 13.5 2002 23.9 236 3.5 8092 11.5
Neoplasms 1519 3.7 309 2.3 2261 27.0 47 0.7 4136 5.9
Diseases of the blood and blood-forming organs and certain disorders involving the immune mechanism 3561 8.6 1732 12.8 1198 14.3 213 3.1 6704 9.5
Endocrine, nutritional and metabolic diseases 13175 31.7 4952 36.7 4994 59.6 853 12.5 23974 34.1
Mental and behavioural disorders 6283 15.1 5124 37.9 3650 43.6 803 11.8 15860 22.6
Diseases of the nervous system 3543 8.5 1654 12.2 2018 24.1 271 4.0 7486 10.6
Diseases of the eye and adnexa 1041 2.5 437 3.2 554 6.6 79 1.2 2111 3.0
Diseases of the ear and mastoid process 500 1.2 228 1.7 192 2.3 47 0.7 967 1.4
Diseases of the circulatory system 14935 35.9 5382 39.8 6483 77.4 977 14.3 27777 39.5
Diseases of the respiratory system 4696 11.3 1761 13.0 2343 28.0 254 3.7 9054 12.9
Diseases of the digestive system 3981 9.6 1280 9.5 2312 27.6 233 3.4 7806 11.1
Diseases of the skin and subcutaneous tissue 2600 6.2 982 7.3 1274 15.2 146 2.1 5002 7.1
Diseases of the musculoskeletal system and connective tissue 6466 15.5 1693 12.5 3766 45.0 384 5.6 12309 17.5
Diseases of the genitourinary system 6426 15.4 3172 23.5 2803 33.5 312 4.6 12713 18.1
Pregnancy, childbirth and the puerperium 214 0.5 2 0.0 173 2.1 12 0.2 401 0.6
Certain conditions originating in the perinatal period 2 0.0 0 0.0 37 0.4 0 0.0 39 0.1
Congenital malformations, deformations and chromosomal abnormalities 73 0.2 21 0.2 34 0.4 21 0.3 149 0.2
Symptoms, signs and abnormal clinical and laboratory findings, not elsewhere classified 14946 35.9 6329 46.9 8161 97.5 1219 17.9 30655 43.6
Factors influencing health status and contact with health services 17831 42.9 3838 28.4 6705 80.1 1546 22.7 29920 42.6
NO OTHER ICD-10 CODE ON MEDICAL RECORD 13090 31.5 3032 22.4 486 5.8 3886 57.0 20494 29.2
ALL CASES 41607 100 13506 100 8373 100 6819 100 70305 100
Age also has an influence as detailed in the following table (Table 9.10.2).

RELATIONSHIP BETWEEN SLIPS, TRIPS & FALLS & THE DESIGN & CONSTRUCTION OF BUILDINGS 161
Almost 90% of child fall cases across all building locations had no additional ICD-10 codes recorded compared with 39% of persons aged 15-64 years and just 21% of cases involving a person aged 65 years and older.
Falls that actually occurred in hospitals and residential care settings virtually, by definition, almost all had a pre-existing medical condition or frailty (only 5.8% did not) – though this condition may have been unrelated to the fall injury.

162 MONASH UNIVERSITY ACCIDENT RESEARCH CENTRE
Table 9.15.2 Co-morbid conditions by broad age group and location among all persons admitted to Victorian public and private hospitals who were injured due to falls in buildings 2002/3-2004/5
Home Residential institution
Health service area
All other locations Total
n % n % n % n % n %
0-14 years
Certain infectious and parasitic diseases 42 1.4 1 10.0 10 11.8 14 0.7 67 1.3
Neoplasms 5 0.2 0 0.0 0 0.0 2 0.1 7 0.1
Diseases of the blood and blood-forming organs and certain disorders involving the immune mechanism 17 0.6 0 0.0 0 0.0 6 0.3 23 0.4
Endocrine, nutritional and metabolic diseases 20 0.7 0 0.0 13 15.3 4 0.2 37 0.7
Mental and behavioural disorders 12 0.4 1 10.0 4 4.7 11 0.5 28 0.5
Diseases of the nervous system 36 1.2 0 0.0 6 7.1 14 0.7 56 1.1
Diseases of the eye and adnexa 7 0.2 0 0.0 2 2.4 6 0.3 15 0.3
Diseases of the ear and mastoid process 9 0.3 0 0.0 0 0.0 3 0.1 12 0.2
Diseases of the circulatory system 5 0.2 0 0.0 0 0.0 5 0.2 10 0.2
Diseases of the respiratory system 25 0.9 0 0.0 12 14.1 12 0.6 49 1.0
Diseases of the digestive system 16 0.5 0 0.0 3 3.5 10 0.5 29 0.6
Diseases of the skin and subcutaneous tissue 9 0.3 0 0.0 6 7.1 20 0.9 35 0.7
Diseases of the musculoskeletal system and connective tissue 19 0.7 0 0.0 4 4.7 30 1.4 53 1.0
Diseases of the genitourinary system 5 0.2 0 0.0 2 2.4 1 0.0 8 0.2
Certain conditions originating in the perinatal period 2 0.1 0 0.0 37 43.5 0 0.0 39 0.8
Congenital malformations, deformations and chromosomal abnormalities 21 0.7 0 0.0 5 5.9 12 0.6 38 0.7
Symptoms, signs and abnormal clinical and laboratory findings, not elsewhere classified 153 5.2 2 20.0 23 27.1 114 5.4 292 5.7

RELATIONSHIP BETWEEN SLIPS, TRIPS & FALLS & THE DESIGN & CONSTRUCTION OF BUILDINGS 163
Home Residential institution
Health service area
All other locations Total
n % n % n % n % n %
Factors influencing health status and contact with health services 82 2.8 1 10.0 51 60.0 25 1.2 159 3.1
NO OTHER ICD-10 CODE ON MEDICAL RECORD 2581 88.3 7 70.0 16 18.8 1893 89.8 4497 87.7
ALL CASES 2922 100 10 100 85 100 2109 100 5126 100
15-64 years
Certain infectious and parasitic diseases 378 4.3 29 6.7 230 19.0 40 1.6 677 5.2
Neoplasms 216 2.4 2 0.5 383 31.7 10 0.4 611 4.7
Diseases of the blood and blood-forming organs and certain disorders involving the immune mechanism 350 4.0 27 6.3 178 14.7 22 0.9 577 4.5
Endocrine, nutritional and metabolic diseases 1564 17.7 114 26.5 681 56.4 194 7.9 2553 19.8
Mental and behavioural disorders 1695 19.2 161 37.4 575 47.6 508 20.7 2939 22.7
Diseases of the nervous system 782 8.9 111 25.8 335 27.7 123 5.0 1351 10.5
Diseases of the eye and adnexa 98 1.1 16 3.7 60 5.0 22 0.9 196 1.5
Diseases of the ear and mastoid process 48 0.5 2 0.5 15 1.2 14 0.6 79 0.6
Diseases of the circulatory system 1138 12.9 66 15.3 573 47.4 137 5.6 1914 14.8
Diseases of the respiratory system 533 6.0 30 7.0 213 17.6 69 2.8 845 6.5
Diseases of the digestive system 499 5.7 33 7.7 423 35.0 48 2.0 1003 7.8
Diseases of the skin and subcutaneous tissue 224 2.5 20 4.6 120 9.9 30 1.2 394 3.0
Diseases of the musculoskeletal system and connective tissue 803 9.1 27 6.3 538 44.5 119 4.8 1487 11.5
Diseases of the genitourinary system 342 3.9 44 10.2 204 16.9 29 1.2 619 4.8
Pregnancy, childbirth and the puerperium 214 2.4 2 0.5 173 14.3 12 0.5 401 3.1
Congenital malformations, deformations and chromosomal abnormalities 25 0.3 12 2.8 10 0.8 9 0.4 56 0.4

164 MONASH UNIVERSITY ACCIDENT RESEARCH CENTRE
Home Residential institution
Health service area
All other locations Total
n % n % n % n % n %
Symptoms, signs and abnormal clinical and laboratory findings, not elsewhere classified 1885 21.4 120 27.8 1024 84.8 409 16.6 3438 26.6
Factors influencing health status and contact with health services 3389 38.4 152 35.3 1022 84.6 643 26.2 5206 40.3
NO OTHER ICD-10 CODE ON MEDICAL RECORD 3519 39.9 118 27.4 127 10.5 1224 49.8 4988 38.6
ALL CASES 8825 100 431 100 1208 100 2458 100 12922 100
65+ years
Certain infectious and parasitic diseases 3612 12.1 1792 13.7 1762 24.9 182 8.1 7348 14.1
Neoplasms 1298 4.3 307 2.3 1878 26.5 35 1.6 3518 6.7
Diseases of the blood and blood-forming organs and certain disorders involving the immune mechanism 3194 10.7 1705 13.1 1020 14.4 185 8.2 6104 11.7
Endocrine, nutritional and metabolic diseases 11591 38.8 4838 37.0 4300 60.7 655 29.1 21384 40.9
Mental and behavioural disorders 4576 15.3 4962 38.0 3071 43.4 284 12.6 12893 24.7
Diseases of the nervous system 2725 9.1 1543 11.8 1677 23.7 134 6.0 6079 11.6
Diseases of the eye and adnexa 936 3.1 421 3.2 492 6.9 51 2.3 1900 3.6
Diseases of the ear and mastoid process 443 1.5 226 1.7 177 2.5 30 1.3 876 1.7
Diseases of the circulatory system 13792 46.2 5316 40.7 5910 83.5 835 37.1 25853 49.5
Diseases of the respiratory system 4138 13.9 1731 13.2 2118 29.9 173 7.7 8160 15.6
Diseases of the digestive system 3466 11.6 1247 9.5 1886 26.6 175 7.8 6774 13.0
Diseases of the skin and subcutaneous tissue 2367 7.9 962 7.4 1148 16.2 96 4.3 4573 8.8
Diseases of the musculoskeletal system and connective tissue 5644 18.9 1666 12.8 3224 45.5 235 10.4 10769 20.6
Diseases of the genitourinary system 6079 20.4 3128 23.9 2597 36.7 282 12.5 12086 23.1

RELATIONSHIP BETWEEN SLIPS, TRIPS & FALLS & THE DESIGN & CONSTRUCTION OF BUILDINGS 165
Home Residential institution
Health service area
All other locations Total
n % n % n % n % n %
Congenital malformations, deformations and chromosomal abnormalities 27 0.1 9 0.1 19 0.3 0 0.0 55 0.1
Symptoms, signs and abnormal clinical and laboratory findings, not elsewhere classified 12908 43.2 6207 47.5 7114
100.5 696 30.9 26925 51.5
Factors influencing health status and contact with health services 14360 48.1 3685 28.2 5632 79.5 878 39.0 24555 47.0
NO OTHER ICD-10 CODE ON MEDICAL RECORD 6990 23.4 2907 22.3 343 4.8 769 34.1 11009 21.1
ALL CASES 29860 100 13065 100 7080 100 2252 100 52257 100
Another factor in interpreting these data is that the sequence of fall and co-morbidity cannot readily be determined from the available datasets. For some conditions, by their nature, it is reasonable to assume that the condition was pre-existing and may have contributed to the fall eg some diseases of the musculoskeletal system such as muscular dystrophy; endocrine conditions such as diabetes; and diseases of the nervous system such as Parkinson’s disease. Other conditions may have contributed to the severity of the fall outcome. For example, persons with diseases of the blood or blood forming organs, severely ill residents of aged care facilities or hospital patients, from any cause, may have suffered greater consequences of the fall because of these conditions.
9.15.3 Discussion
Clearly, co-morbidity, whether it occurred before or after a fall, is evident in many cases of injury related to falls in buildings. A specific major new research study would be necessary to attempt to identify the sequence of events and the actual contribution to the fall and its outcome of the co-morbidity versus the contribution of the building design and construction.
This finding could be interpreted to suggest that the co-morbidity may have contributed to the fall and its consequences, thereby exonerating the building. The counter-argument, and current federal government policy, is that many injurious falls in buildings are to vulnerable members of the community, particularly the aged and the young who should be protected from harm. Government policy on “ageing in place” and equity appear to particularly support the need for measures to protect the health and independence of vulnerable populations.
It could be argued that building design and construction need to be modified to avoid contributing to causing falls or the serious consequences of falls. No argument can be made for exclusion from the regulatory framework that governs safety in building design and construction of vulnerable populations (the old, the young, and the sick) who account for up to 80% of total fall injuries in buildings.

166 MONASH UNIVERSITY ACCIDENT RESEARCH CENTRE
Other players, such as sectors responsible for aged care facilities and hospitals also have a part to play in modifying building design and construction to avoid factors contributing to the initiation of a fall, and, most particularly, to diminishing the energy exchange to less than fracture threshold when the person falls onto a surface within the building. The development or adoption of new technology impact absorbing surface materials in high risk zones would be a logical outcome in both industry developments and regulatory terms. Laboratory testing and controlled trials of the implementation of such materials in high risk areas and fall injury outcomes (compared with control settings) would likely be needed.
9.16 DATA ISSUES
Data sources
National Coroners Information System (NCIS)
National Injury Surveillance Unit (NISU)
o Data analysis of fall related hospitalisations most likely occurring in buildings in Australia 199/00-2004/05 conducted by Research Centre for Injury Studies on behalf of the Monash University Accident Research Centre
Victorian Admitted Episodes Database (VAED)
Victorian Emergency Minimum Dataset (VEMD)
Australian Bureau of Statistics (ABS)
Population estimates of residents of aged care facilities were obtained from the AIHW report ‘Residential aged care in Australia 2005-2006: a statistical overview’ (Australian Institute of Health and Welfare 2007).
Relevant ICD-10-AM terms
Y92 Place of occurrence
*the following category is for use with categories V00-Y89m to identify the place where the injury or poisoning (external cause) occurred.
Y92.14 Aged care facilities include: nursing homes, old people’s homes and retirement villages
Y92.18 Other specified residential institution
Y92.19 Unspecified residential institution
Y92.22 Health service areas includes: day procedure centres, health centres, homes for the sick, hospice, hospitals and outpatient clinics.
W10 Fall on and from stairs and steps: includes fall (on)(from): escalator, incline, involving ice or snow on stairs and steps and ramp.

RELATIONSHIP BETWEEN SLIPS, TRIPS & FALLS & THE DESIGN & CONSTRUCTION OF BUILDINGS 167
Key terms
Admitted patient: A patient who undergoes a hospital’s formal admission process to receive treatment and/or care. This treatment and/or care is provided over a period of time and can occur in hospital and/or in the person’s home (for hospital in the home patients)(Australian Institute of Health and Welfare 2006).
Age standardisation: A set of techniques used to remove as far as possible the effects of differences in age when comparing two or more populations(Australian Institute of Health and Welfare 2006).
Emergency attendance (Victoria): *add definition
Emergency admission (Victoria): *add definition
Separation: An episode of care for an admitted patient, which can be a total hospital stay (from admission to discharge, transfer or death), or a portion of a hospital stay beginning or ending in a change of type of care (for example, from acute to rehabilitation). Separation also means the process by which an admitted patient completes an episode of care either by being discharged, dying, transferring to another hospital or changing type of care (Australian Institute of Health and Welfare 2006).
Hospitalisation: is an episode of care that starts with an admission in the hospital system (Karmel, Lloyd et al. 2007);(episodes of care resulting from transfer between hospitals are included in the data).
Length of stay: is derived for episodes of care. The length of stay of an overnight episode is calculated by subtracting the date the patient is admitted from the date of separation and deducting days the patient was on leave. A same-day episode is allocated a length of stay of 1 day (Karmel, Lloyd et al. 2007).
Injury Severity Classification
All hospital separations were classified as either less than or greater than or equal to an International Classification of Diseases-based Injury Severity Score (ICISS) of 0.941. A score of 0.941 or less indicates that patients on admission have injuries that give the patient a survival probability of 94.1% or a probability of death of 5.9% (on admission).
It is important to remember that some injuries may be judged as not serious, as they are classified as having a low threat to life, but that these same injuries may result in a high (threat-of) disability. For example penetrating eye injuries and finger amputations (Cryer and Langley 2006).
Calculations of rates
Data on Australian hospital separations
All rates used in the report are crude rates except for rates used in trend analysis. Rates used in trend analysis are age standardised. The age standardising population used for calculating age standardised rates was the Australian estimated resident population at the 30th June 2001.

168 MONASH UNIVERSITY ACCIDENT RESEARCH CENTRE
Population data used in rate and age standardised calculations for national hospital separations data was obtained from the Australian Bureau of Statistics via the Australian Institute of Health and Welfare.
Small case count issues
Data on Australian hospital separations
Where data cell counts were less than 5, data has been either collapsed or suppressed (denoted by *) to prevent patient identification. This has been made obvious when this had occurred.
Errors, inconsistencies and uncertainties
Data on Australian hospital separations
It is important to note that hospital separations do not equal fall incidents. The number of hospital separations presented in this report over estimates the number of actual fall events through multiple records being generated via inter-hospital transfers and re-admission.
Multiple counting due to re-admission cannot be avoided in the national data at present.
The proportion of modes of admissions known to be ‘admitted patient transfers’ is provided for each type of data category in a box at the beginning of the appropriate sections to give an indication of the proportion of presumed multiple records for patient transfers in the data set under discussion. No estimate of the number of readmissions has been made.
9.17 REFERENCES
Australian Institute of Health and Welfare (2006). Australian hospital statistics. AIHW Health services series, Canberra.
Australian Institute of Health and Welfare (2007). Residential aged care in Australia 2005-2006: a statistical overview. Aged care statistics series 24, Canberra, AIHW.
Cryer, C. and J. Langley (2006). "Developing valid indicators of injury incidence for 'all injury'." Injury Prevention 12: 2002-207.
Harrison, J.E., Steenkamp, M., (2002) “Technical review and documentation of current NHPA injury indicators and data sources” Injury Research and Statistics Series, No.14, Adelaide: AIHW (AIHW cat. No. INJCAT 47).
Karmel, R., J. Lloyd, et al. (2007). Older Australians in hospital, Australian Institute of Health and Welfare.

RELATIONSHIP BETWEEN SLIPS, TRIPS & FALLS & THE DESIGN & CONSTRUCTION OF BUILDINGS 169
CHAPTER 10 HOSPITAL TREATMENT COSTS OF FALL INJURIES AND FATALITIES MOST LIKELY OCCURRING IN BUILDINGS, AUSTRALIA, 2002-2005
10.1.1 COST PER CASEMIX-ADJUSTED SEPARATION
The method used for calculating the cost of a hospital bed day in this report is based on the cost per casemix-adjusted separation as used in the Australian Institute of Health and Welfare publication Australian Hospital Statistics. This annual report has been published since 1996–97 (AIHW 1998), and is included within frameworks of indicators by the National Health Ministers’ Benchmarking Working Group (NHMBWG 1999), the Steering Committee for the Review of Government Service Provision (SCRGSP 2006) and the NHPC (NHPC 2004). It is a measure of the average recurrent expenditure for each admitted patient, adjusted using ARDRG cost weights for the relative complexity of the patient’s clinical condition and for the hospital services provided.
Hospitals excluded from this analysis
Small non-acute hospitals, Multi-purpose services, Hospices, Rehabilitation hospitals, Mothercraft hospitals, other non-acute hospitals, Psychiatric hospitals, and hospitals in the Unpeered and other hospitals peer group have been excluded from this calculation of costs. Also excluded are hospitals for which expenditure or separation data were incomplete, although most of these hospitals would have been excluded for other reasons (for example, they are small non-acute hospitals).
10.1.2 COST PER CASEMIX-ADJUSTED SEPARATION/COST PER DAY
Definition & Calculation of costs
The formula used to calculate the cost per casemix-adjusted separation is:
Recurrent expenditure x IFRAC
Total separations x Average cost weight
where:
Recurrent expenditure is defined by the AIHW as “expenditure on goods and services which are used up during the year, for example, salaries and wages expenditure and non-salary expenditure such as payments to visiting medical officers.” (AIHW 2006 p. 361)
IFRAC (admitted patient cost proportion) is the estimated proportion of total hospital expenditure that relates to admitted patients.
Total separations exclude patients with no qualified days and records that do not relate to admitted patients.
Average cost weight is a single number representing the relative expected resource use for the separations.

170 MONASH UNIVERSITY ACCIDENT RESEARCH CENTRE
10.1.3 AVERAGE COST PER ACUTE PUBLIC HOSPITAL BED PER DAY
According to the AIHW Hospital Statistics 2005-2006, the average length of stay for acute public hospital separations is 3.7 days, and the average cost per separation calculated according to the above formula is $3,698. This average cost per separation consists of an average of $1,921 for non-medical labour expenditure, $745 for medical labour expenditure and $1, 032 for other recurrent expenses such as domestic services, repairs and maintenance, administration, and medical, drug and food supplies.
Given that the average acute public hospital separation cost is $3,698 and the average acute public hospital length of stay is 3.7 days, it has been determined that for the purpose of this analysis $999.46 is the average cost of an acute public hospital bed per day.
Table 10.1.1 All falls most likely occurring in buildings, Australia 2002-05: Age groups by length of stay (days)
0-14 15-29 30-44 45-59 60-74 75+ Total
1 22860 6692 7836 10374 14749 41562 104075
2 2201 968 1427 2390 3648 8967 19601
3 708 556 1045 1776 2817 8745 15647
4 331 351 716 1358 2557 9127 14441
5 195 227 481 1068 2328 9160 13459
6 119 163 350 825 2104 9047 12608
7-9 221 273 690 1762 5371 24473 32790
10-12 89 150 360 1059 3679 17774 23111
13-15 59 66 185 710 2790 14498 18308
16-18 36 36 164 463 1791 9985 12475
19-21 33 45 97 366 1448 8349 10338
22-24 20 34 84 258 1015 5825 7236
25-27 13 22 68 200 798 4764 5865
28-30 20 20 48 167 638 4039 4932
31-60 78 91 227 683 2551 14584 18214
61-90 5 28 42 166 511 2354 3106
91-120 * * 16 66 190 599 880
121-150 * * 10 27 64 226 328
151-180 * * 6 18 19 90 137
181-364 * 5 * 25 33 149 227
365+ 0 * * 9 33 79 127
Total 26993 9743 13866 23770 49134 194396 317905
The above table shows a total of 3,386,231 acute public hospital bed days resulting from fall most likely occurring in buildings for the years 2002-2005.

RELATIONSHIP BETWEEN SLIPS, TRIPS & FALLS & THE DESIGN & CONSTRUCTION OF BUILDINGS 171
Using the formula described above, and applying an average cost per bed day of $999.46, the total acute public hospital expenditure on falls most likely occurring in buildings over this time period is $3,384,402,435.20.
Age
Those aged ≥65 years account for almost 92% (91.95%, n= 3,113,775) of acute public hospital costs per bed day. The total cost of bed days occupied by those in this age group due to falls most likely occurring in buildings is $3,112,093,561.

Table 10.1.2 All falls most likely occurring in buildings, Australia 2002-05: principal diagnosis groups (detailed body region) by length of stay (days)
Not poisoni
ng/ injury
head neck thorax
abdomen, lower back,
lumbar spine & pelvis
shoulder & upper
arm
elbow & forearm
wrist &
hand
hip & thigh
knee & lower
leg
ankle & foot
Other injuries not specified by body region
Total
1 15643 29556 1253 3034 5116 8561 17315 2888 11470 6837 1607 795 104075
2 4216 2598 180 909 1073 1788 3581 341 2240 2127 391 157 19601
3 3815 1637 148 845 980 1180 1595 188 2755 2086 291 127 15647
4 3706 1261 111 810 1012 964 891 104 3486 1709 252 135 14441
5 3656 974 96 690 1036 840 616 82 3773 1358 227 111 13459
6 3566 859 97 621 983 714 409 64 3900 1141 159 95 12608
7-9 10408 1846 215 1442 2631 1682 922 145 10434 2451 326 288 32790
10-12 8161 1114 158 900 1936 1082 612 84 7222 1472 219 151 23111
13-15 8006 675 90 663 1373 793 397 68 4972 1008 126 137 18308
16-18 5653 468 86 338 1005 545 255 39 3283 652 68 83 12475
19-21 5359 356 54 315 777 366 189 23 2262 524 52 61 10338
22-24 3952 251 36 166 524 276 101 15 1505 330 31 49 7236
25-27 3394 202 37 125 392 211 92 11 1130 224 16 31 5865
28-30 2998 128 28 99 308 179 64 8 900 180 13 27 4932
31-60 11540 475 91 288 1032 600 250 35 3060 692 62 89 18214
61-90 2233 59 14 29 97 71 21 * 439 122 * 11 3106
91-120 683 10 13 9 15 8 7 * 99 34 0 * 880
121-150 264 8 5 * * 7 * 0 33 * * * 328
151-180 117 * * 0 * * * 0 7 6 0 0 137
181-364 206 * * * * * 0 0 6 * 0 0 227
365+ 115 * * 0 * * 0 0 6 0 0 0 127
Total 97691 42483 2722 11287 20295 19872 27318 4097 62982 22959 3850 2349 317905

RELATIONSHIP BETWEEN SLIPS, TRIPS & FALLS & THE DESIGN & CONSTRUCTION OF BUILDINGS 173
10.1.4 Most costly injuries
Among separations where injury nature was specified, injuries to the hip and thigh were most prevalent, and generally lead to longer periods of hospitalisation. Across all age groups injuries to the hip and thigh were responsible for a total of 694,544 acute public hospital bed days over the time covered by this analysis at an estimated total cost of $694,168,946.20.
Of all acute public hospital bed days resulting from injuries to the hip and thigh, almost 90% (89.7%, n= 622,899) of these are fractures. According to this analysis, the estimated total cost of fractures of the hip and thigh resulting from falls most likely occurring in buildings from 2002-2005 is $622,562,634.50
10.1.5 Most costly injury locations
Fall injuries in the home resulted in a total of 197,110 (62.0% of separations for falls in buildings) hospital separations for the years 2002-2005. There was an estimated 1871722 accumulated bed days for home building fall injury during this time. The total estimated cost of home fall building related separations for 2002-2005 is $1,870,711,270.
Although falls in health service areas constitute 11.2% (n=35,860) of building related fall injury, the accumulated acute public hospital bed days required claims a much greater portion of the total health care cost. Fall in health service areas cost an estimated total of $822,874,407.70 for 2002-2005, representing 24.3% of the total cost for building related fall injury separations.
Falls in aged care facilities cost a total $493,905,147.10, representing 14.6% of the total building related fall injury expense for the period included in this analysis.
10.2.1 Economic cost of slip, trip and fall fatalities
Estimates of the value of life vary substantially between disciplines and across nations, an example of the wide range of values and methods for assigning value is shown in the table below, extracted from the Price Waterhouse Coopers report Victorian Institute of Forensic Medicine: Economic Benefits of the National Coroners Information System (2003).

174 MONASH UNIVERSITY ACCIDENT RESEARCH CENTRE
Table 10.2.1 Values of Life – Selected studies
Method Used Source Value
($AUD) Comment
Various US studies Valuations of Health Benefits and Identification of Beneficiary Impact
636,840 Based on automobile air bag purchase
Various US studies Valuations of Health Benefits and Identification of Beneficiary Impact
659,837 Based on smoke detector purchase (1987)
Various US studies Valuations of Health Benefits and Identification of Beneficiary Impact
1,503,650 Based on wage premiums for dangerous police work (1987)
Net National Product (NNP) per head of the country under study. NNP = GNP less Depreciation
Valuations of Health Benefits and Identification of Beneficiary Impact
450,000 - 800,000
NNP range over an average lifetime of 70 years (actual amount is largely dependant on the real rate of interest)
Human Capital Approach
"What do we mean by valuing life and health" article. Dr Peter Abelson
827,000 Not applicable for non-earners
Willing to pay
"Value of Life and Health" by Dr P Abelson, for Cost of Injury Symposium, Macquarie University.
1,769,000 - 26,535,000
Results for a wide range of US studies
Willing to pay
"Value of Life and Health" by Dr P Abelson, for Cost of Injury Symposium, Macquarie University.
1,794,000
US EPA (Guidelines for Preparing Economic Analyses) recommendation (in 1996 prices)
Value of a Life Year (VOLY or perfect QALY). Derived from VSL
"Value of Life and Health" by Dr P Abelson, for Cost of Injury Symposium, Macquarie University.
106,140
If VSL is US$1 million, with 40 years of life and a discount rate of 5.0%, VOLY is about US$60,000
Valuing a person's lost productivity
Anatomy of a road fatality, Sydney Morning Herald. Estimates of transport economists
859,030 Comprised of $319,030 for quality and $540,000 in lost labour to the economy.
The principal reasons for the wide ranging variations of the economic value of life outlined in this table are the differing methodologies used. The main methodologies used in determining these values are:
Implied value in the reduction of the risk of death
Net National Product (NNP) per head of the country;
The Human Capital Approach
Willingness to Pay Approach (i.e. the maximum amount of money that an individual is willing to spend in order to reduce the risk and be no worse off than before); and
Valuing a person’s lost productivity.
Through the use of revealed preference data contained in the table above (the Human Capital Approach, the NPP approach and the Individual Productivity Approach) rather than

RELATIONSHIP BETWEEN SLIPS, TRIPS & FALLS & THE DESIGN & CONSTRUCTION OF BUILDINGS 175
relying on elicited and hypothetical responses as collected in the willingness to pay studies, Price Waterhouse Coopers determined the median value of life for Australians (in March 2003) to be $650,000 AUD (Price Waterhouse Coopers, 2003).
Adjusted to account for Consumer Price Index increases between the March 2003 and September 2007 Quarters, this value is currently $729,727.90 AUD (ABS, 2007).
10.2.2 NCIS BUILDING RELATED FALL SLIP, TRIP AND FALL FATALITIES, 2001-2005
(Full years and closed cases only)
Table 10.2.2 Year by State, 2001 – 2005
Note: Cases for the years 2000 (n=108), 2006 (n=274) and 2007 (n = 69) have been removed from this analysis of the NCIS database due to incomplete data collection.
2001 2002 2003 2004 2005 Total %
VIC 69 76 127 159 158 589 34.4
NSW 130 119 86 78 83 496 29.0
QLD 53 44 32 79 89 297 17.3
WA 23 31 27 31 33 145 8.5
SA 19 20 33 16 6 94 5.5
TAS 10 11 9 17 11 58 3.4
ACT 3 6 3 6 1 19 1.1
NT 3 2 2 3 5 15 0.9
ALL 310 309 319 389 386 1713 100.0
Based on the value assigned to life as outlined above, the total cost of fatalities included in the NCIS database of closed coroner’s cases for falls related to buildings from 2001 – 2005 is $1,250,023,892.
Over the five years covered here, building fall related fatalities referred to the coroner have increased 24.5% (n = 76). This represents a cost increase of $55,459,320.40.
Victoria displays the greatest proportion of building fall deaths referred to the coroner over the five year period (34.4%, n=589, total cost $429,809,733.10), followed by New South Wales (29.0%, n=496, total cost $361,945,038.40) and Queensland (17.3%, n=297, total cost $216,729,186.30).
Table 10.2.3 Gender
2001 2002 2003 2004 2005 Total
Male 186 176 194 217 214 987
Female 124 133 125 172 172 726
ALL 310 309 319 389 386 1713

176 MONASH UNIVERSITY ACCIDENT RESEARCH CENTRE
Males account for 57.6% (n=987) of building fall related fatalities included in the NCIS for the years 2001-2005. This constitutes a total cost of $720,241,437.30 over this time.
Female deaths from building related falls (42.4%, n=726) account for a total cost of $529,782,455.40 over this time.
Table 10.2.4 Object involved in fall in building fatality, 2001-2005
ACT NSW NT QLD SA TAS VIC WA ALL %
Infant's or Child's Product
0 0 1 0 0 0 0 0 1 0.1
Furnishing 1 50 3 23 7 4 83 18 189 11.0
Household Appliance 0 4 0 0 0 1 0 0 5 0.3
Utensil or Container 0 0 1 1 1 0 2 1 6 0.4
Special Purpose Vehicles Mobile Machinery
0 1 0 2 0 0 0 0 3 0.2
Sporting Equipment 0 0 0 0 0 0 3 0 3 0.2
Tool Machine Apparatus
0 24 1 14 8 2 35 2 86 5.0
Animal Plant Person 1 4 0 3 4 0 3 1 16 0.9
Ground Surface and Conformations
7 64 1 42 19 11 47 44 235 13.7
Personal Use Item 1 4 1 3 2 1 20 4 36 2.1
Drugs (inc Alcohol and Pharmaceuticals)
0 1 0 0 1 0 0 3 5 0.3
Building Component or Fitting
8 304 6 176 24 31 374 39 962 56.2
Material 1 0 0 1 0 1 1 1 5 0.3
Medical / Surgical Devices and Procedures
0 2 0 0 0 0 0 0 2 0.1
Miscellaneous Object Substance
0 15 1 9 3 2 15 3 48 2.8
Missing 0 23 0 23 25 5 6 29 111 6.5
ALL 19 496 15 297 94 58 589 145 1,713 100.0

Table 10.2.5 Detailed objects contributing to deaths by location
Home
Hospital or other health service
Industrial or construction
area
Recreation area (place mainly for informal
recreational activity)
Residential
/Correctional facility
School other institution or
public administrative
area
Sports or athletics
area
Trade or
service area
Unspecified place
Total
Floor 177 222 2 0 58 1 0 10 1 471
Stairs steps 173 12 0 3 6 5 2 28 1 230
Ground surface 73 44 0 1 19 0 0 11 1 149
Other specified ground surface& conformations
18 6 0 0 4 0 0 1 0 29
Ground surface other specified
9 4 0 0 1 0 0 0 0 14
Building 82 17 6 3 3 5 0 16 1 133
Other specified building component or fitting
40 8 1 0 3 0 0 3 0 55
Bed 29 74 0 0 13 0 0 0 0 116
Ladder/ movable step
68 2 1 0 0 0 0 6 0 77
Chair stool 17 16 0 0 4 1 0 0 0 38
Toilet 7 7 0 0 0 1 0 0 0 15
Bitumen 5 4 1 0 1 0 0 3 1 15
Shower 8 4 0 0 1 0 0 1 0 14

Home
Hospital or other health service
Industrial or construction
area
Recreation area (place mainly for informal
recreational activity)
Residential
/Correctional facility
School other institution or
public administrative
area
Sports or athletics
area
Trade or
service area
Unspecified place
Total
Bathtub - (including internal spa bath)
10 1 0 0 0 0 0 0 0 11
Table desk bench etc
7 1 0 0 2 1 0 0 0 11
Wheelchair 4 3 0 0 1 1 0 1 0 10
Window 5 2 0 0 0 0 0 0 0 7
Gutters drains kerbs
3 2 0 0 0 0 0 0 0 5
Handrail railing banister
2 0 0 0 1 0 0 2 0 5
Rug mat loose carpet
5 0 0 0 0 0 0 0 0 5
Fence gate 5 0 0 0 0 0 0 0 0 5
Alcohol 3 0 0 0 0 0 0 1 0 4
Scaffolding 3 0 0 0 0 0 0 0 0 3
Brick concrete block
0 0 1 0 0 0 0 0 0 1
Other and Unspecified
93 60 0 3 13 1 0 9 0 179
missing 52 41 0 0 16 0 0 1 1 111
ALL 898 530 12 10 146 16 2 93 6 1713

RELATIONSHIP BETWEEN SLIPS, TRIPS & FALLS & THE DESIGN & CONSTRUCTION OF BUILDINGS 179
Building fall related fatalities in the home (52.4%, n=898) and in hospitals or health service areas (30.9%, n=530) were the most costly. The combined cost of all home fall deaths in the period covered here is estimated at $655,295,654.20 and the total cost of all health service and hospital deaths (including nursing homes in this instance) is $386,755,787.00.
75.2% (n=173) of stair fall related fatalities occur in the home, the total cost of which is estimated at $126,242,926.70.
63.8% (n=74) of bed related fall deaths occur in hospitals and health service areas, which the NCIS codes to include nursing homes. These fatalities have an estimated cost over the five years covered in this analysis of $53,999,864.60.
88.3% (n=68) of ladder fall fatalities occur in a domestic environment. The estimated cost of these deaths from 2001 to 2005 is $49,621,497.20.
10.3 SUMMARY COST OF FALLS IN BUILDINGS
The following costs are conservative estimates based solely on medical and non-medical labour costs and medical and food supply costs and do not include ongoing costs such as patient rehabilitation, depreciation of hospital assets and loss of patients and carers productivity due to injury. The total costs shown here likely underestimate the total costs of injuries and fatalities from falls in buildings in Australia.
NB: Counting hospital costs by bed days rather than separations overcomes the problem of multiple counting of patient transfers as seen in the injury admission data.
Total average annual cost of hospital admitted cases
The total estimated annual mean cost of hospital bed days for admitted cases between 2002/03 and 2004/05 is $1,128,134,145.09 ($1.28 billion).
Total average annual cost of fatalities
The total estimated annual mean cost of fatalities from falls in buildings between 2001 and 2005 is $250,004,778.40 ($250 million).
Although it is not ascertainable precisely what contribution the design and construction of buildings makes to these injuries and deaths, even if the contribution of buildings were as little as 20% (a highly conservative estimate) the total estimated costs would be $250,627,784.70 ($250.6 million) annually, excluding indirect costs for non-fatal falls cases.
10.4 REFERENCES
Australian Bureau of Statistics, Consumer Price Index http://www.abs.gov.au/AUSSTATS/[email protected]/Lookup/6401.0Main+Features1Mar%202007?OpenDocument , accessed Monday 03/12/2007.
Australian Institute of Health and Welfare, Australian Hospital Statistics, May 2007, 1-393.
Price Waterhouse Coopers, Victorian Institute of Forensic Medicine: Economic Benefits of the National Coroners Information System (NCIS), March 2003, 1-22.

180 MONASH UNIVERSITY ACCIDENT RESEARCH CENTRE
CHAPTER 11 DISCUSSION OF EVIDENCE BASE FROM CURRENT DATA AND SCIENTIFIC LITERATURE
11.1 OVERVIEW
The major building structural and design components identified as being associated with fall injuries in this study were flooring surfaces, stairs, windows, balconies, verandahs and, indirectly, guttering and roofs in residential settings. Fall related hospital separations that most likely occurred in buildings account for 59.1% (n = 317,705) of all fall related hospital separations for the period 2002/03 – 2004/05. As shown by the epidemiological data in this study, many of the victims of fall injuries in buildings are from vulnerable populations, particularly the elderly, the sick and children. Adults over the age of 70 years, and in particular women, have higher mortality rates due to falls than younger people and the increasing incidence of fatality with advancing age is evidenced world wide. The major causes of building fall hospital separations in rank order were: Slips, trips and stumbles on the same level, other fall on same level and combined falls from heights including stairs and steps.
Overall, fall injuries in buildings increased by 14.2 percent over the three year period 2000/01-2004/05. Persons 65 years and over accounted for 73.3% of all hospital separations for falls occurring in buildings, with persons aged 75 years and over accounting for 61.2 % of all hospital separations for falls occurring in buildings. The most common place of occurrence for these injuries was the home, which accounted for 62.0% of hospital separations. While fall injuries in all buildings have increased by 14.2% overall between 2002-03 and 2004-05, and home based slip, trip and fall injuries have increased by 16% across all age groups during this period; fall injuries in the home sustained by those aged 65 years and over have increased by 18.5% over the same time.
11.2 DISCUSSION OF PROJECT OBJECTIVES
The broad objective of this study was to ascertain whether existing requirements of the Building Code of Australia (BCA) provide an acceptable minimum standard of safety relating to the incidence of slips, trips and falls in buildings for the community. Specifically, the aims were to:
(a) Determine the actual risk contribution of several relevant factors to the incidence of “slips, trips and falls” in buildings, including:
i. building design;
ii. building construction;
The contribution of building design and construction to the incidence of slip, trip and fall injury was determined primarily through a critical examination of the scientific literature and the frequencies and trends shown in the national and state injury and fatality data. A building design and construction risk factor rating system based on the HHSRS Operating Guidance (2004, see section 2.2) was developed, but it was decided in consultation with the ABCB not to quantify the risk contribution of various building design and construction related hazards and harms based on this system, and instead to use the injury and fatality data as a guide to determining the greatest hazards.

RELATIONSHIP BETWEEN SLIPS, TRIPS & FALLS & THE DESIGN & CONSTRUCTION OF BUILDINGS 181
iii. obstacles not forming part of the structure that create a trip hazard;
iv. the presence or absence of surface contaminants (water, oil or grease);
Through the analysis of VEMD free text narratives we have identified several items external to building structures that constitute significant trip and fall hazards. The most prominent of these are beds, chairs, phone cords, loose carpet and other floor coverings such as runners and rugs. This study has also identified the impact of surface contaminants on the slip resistance of flooring surfaces, particularly in the aged care and health service environments, and has made recommendations regarding the provision of increased slip resistant flooring materials in these environments, along with recommendations for the installation of flooring with greater force attenuation and absorptive properties in areas of particularly high fall risk, such as around beds and possibly in bathrooms and toilets.
v. the intrinsic condition of the person suffering the injury; and
The intrinsic health status and existing co-morbidities contribute to the risk of falling, and have a significant impact on the likelihood of resultant injury and its potential severity, and this is evidenced by the predominance of those aged over sixty five years across all categories of fall related injury. Details are provided in section 9.15. However, this report takes the view that it is the responsibility of the ABCB and state governments to consider the safety requirements of all parts of the community which utilise the buildings they regulate, and that the BCA should be designed to consider the most vulnerable parts of the population including children and the rapidly increasing aged population.
It should be noted here that the initiating factors involved in a fall, and any intrinsic characteristics that may influence these, should also be considered along with the actual final cause of the injury, most often contact with a hard surface.
vi. the number of persons exposed to each particular hazard.
This study has determined the main populations affected by each particular hazard associated with the design and construction of buildings through an analysis of the frequency and rates of falls in buildings. The total age specific population groups have, for he most part, been considered as the exposed populations since many of the hazards are ubiquitous, such as the home and public buildings. Where relevant, such as aged care, the number of persons in care has been taken as the exposed population.
(b) Ascertain the level of risk in building classes (relevant to the BCA) in order to establish whether the inherent level of risk is acceptable.
Through a review of the scientific literature and analysis of state and national injury and fatality data, this study has shown that the inherent level of risk allowed by the provisions of the BCA 2007 is clearly not acceptable, particularly in regards to the existing requirements for stair and step going and riser dimensions, lack of requirements for hand rails for stairs in domestic residential buildings, allowable minimum stair and step handrail heights, the minimum height at which verandahs must have a railing or balustrade installed and the four metre above ground level height at which window guards must be installed. There is also concern about the hardness of landing surfaces, though further research is required on effective and acceptable design solutions.

182 MONASH UNIVERSITY ACCIDENT RESEARCH CENTRE
(c) Identify and prioritise the incidence, frequency or severity of slips, trips and falls in relation to the design and construction of buildings in Australia.
The study has identified the incidence, frequency and severity of slips, trips and falls occurring in buildings in Australia, and has ascertained that these falls account for almost 60% of all fall admissions to Australian public hospitals. Furthermore, we have identified the most common mechanisms of falls in buildings as slips, trips and stumbles on the same level (29.2% of all admissions for falls in buildings), other falls on the same level (20.6%), fall involving beds (6.6%), falls on and from stairs and steps (6.0%), combined falls from heights in buildings (5.8%).
Further in depth analysis of falls in buildings using individual state injury databases could be conducted, as could an in depth national study of fatal falls in buildings.
The high level of unspecified coding in both Victorian and national injury and death data, particularly amongst activity, location, cause and mechanism codes means that it is still not possible to determine the exact frequency or circumstances of falls in buildings.
Increased specificity is sought in the application of codes as is the provision of more precise cause and mechanism codes. For example, the recent expansion of the generic ICD-10AM fall code to allow for the specific coding of verandah falls will provide new information regarding these falls and assist prevention efforts substantially. A review of hospital admission and presentation data after one year of collection is suggested and will provide a much more precise indication of the frequency and severity of verandah falls.
(d) Identify the age group most at risk of incurring injury from slips, trips and falls in buildings in Australia.
Those aged over sixty five years have been identified as the age group most at risk overall for sustaining injury resulting from falls in buildings and account for almost 75% of these injurious falls. Older persons are most notably over represented in falls on the same level, falls involving beds and in falls on and from stairs and steps (which increased 22.3% among those aged 65 years and over during the period 2002/3 – 2004/05). Children are the next most frequently injured age group from falls in buildings.
(e) Provide information regarding the cost of slips, trips and falls, hat would directly support a cost/benefit analysis of any proposed amendments to the BCA resulting from the research.
Although it is difficult to ascertain a single average cost per hospital admission or bed day, and many organisations use widely varying estimates for these cost calculations, we have been able to provide credible conservative information on estimated costs for non-fatal hospital admissions and the cost of death. The estimates used for hospital bed day costs in this study were based on the formula developed the Australian Institute of Health and Welfare and deliberately erred on the side of conservatism in the calculation of bed days costs and the assignment of bed days to particular fall injuries and the building features deemed to be (at least partially) responsible for the injury event. The cost estimates also only included the cost of medication and treatment, food and medical and non-medical labour during admission and did not include substantial ongoing costs such as continued required medical treatment and public health system burden, depreciation of hospital assets and lost productivity. Assigned economic value of life, reported from a study by Price Waterhouse Coopers, enabled estimates of costs of fall fatalities in buildings.

RELATIONSHIP BETWEEN SLIPS, TRIPS & FALLS & THE DESIGN & CONSTRUCTION OF BUILDINGS 183
CHAPTER 12 OUTCOMES FROM EXPERT PANEL
12.1 INTRODUCTION
An Expert Panel (see Appendix 4 for participant list) was convened to review the assembled information and to assign values to the contribution of building design and construction to hazards and harms based on all of the available evidence presented from the study findings. The specific purpose of the meeting was to guide MUARC in the recommendations to be formulated for preventive measures based on the scoping of controllable hazards relevant to the Building Code of Australia and to other sectors. Unfortunately, the Department of Health and Ageing representative on the Panel was a late withdrawal from the meeting.
During the meeting, held in Melbourne on November 22nd, 2007, members of the MUARC research team presented the study findings to date on the following topics:
1. An overview of falls in buildings and the principals of prevention,
2. Stair and step falls,
3. Surfaces: impact absorption and slip resistance,
4. Falls from heights: windows, balconies and verandahs
5. Residential building maintenance and access to heights.
Discussion about these specific aspects of building design and construction was followed by further discussion of the Building Code of Australia and suggestions from the panel on how possible shortcomings in the BCA could be identified and addressed in future editions of the code.
12.2 STAIR AND STEP FALLS
Geometry
Although the deemed to satisfy provisions for BCA 2007 (Class 1 & 10 buildings) specify that stair construction must be consistent throughout one flight and must satisfy the quantity requirement 2 x Riser + Going, the panel noted that the BCA does not strictly conform to the internationally recognised standard of “7-11” (177.8mm riser x 279.4mm going) for stair geometry as the optimum riser/going measurement.
The BCA allows for risers of between 115mm and 190mm and goings of between 240mm and 355mm for non-spiral stairs. The panel agreed that a riser/going combination of approximately 178mm x 280mm was the optimum for ease of use and safety and suggested that the current minimum requirement of the BCA allows for stairs that are practically too steep in some instances. It was subsequently noted that as up to 80% of stairway falls have been shown in both the literature and MUARC’s data analysis to occur during descent, and that the narrow going width currently allowed by the BCA could potentially encourage falls during descent.

184 MONASH UNIVERSITY ACCIDENT RESEARCH CENTRE
Members of the panel suggested that the flexibility within the BCA in regards to the geometry of stair riser/going combinations may be an area for review. It was also suggested that the wide range of acceptable measurements currently allowable in both Volume 1 (Class 1 & 10 Buildings) and Volume 2 (Class 2 to 9 Buildings) of the BCA can have a positive application, in that this flexibility allows for maximum usage and by all sectors of society.
Handrails
MUARC commented that various international studies (as reported in the literature in chapter 4) have found a handrail height of between 910-920mm to provide the greatest ease of use for all users. Members of the panel commented that the current BCA deemed to satisfy provision of a minimum handrail height of 865mm is below the recommended height and may fail to take into account the increase in the average person’s centre of gravity as average heights have increased. The panel suggested that as 910-920mm has been shown through previous studies to be the optimum height, then the ABCB should consider increasing the minimum handrail height requirements of the BCA.
It was noted that the BCA allows for a stair 2 metres wide without providing a handrail as long as a balustrade of any kind (including a solid wall) is present on either side. The panel emphasised the potential for injury that this allows, as while a wall might prevent a person from falling over a flight of stairs, the anchoring function provided by a handrail is absent. The potential for injury on stairs bound by solid walls is also increased by the possibility of colliding with those walls during a fall.
Expert panel recommendations for preventing stair and step injury
The prevalence of many different kinds of hazards on different stairs was noted by the panel and it was suggested that improvements to many stairs can be made easily, particularly in the areas of maintaining adequate lighting, improving contrast between stairs, suitable carpeting and increasing slip resistance. The panel agreed that the only real option for repairing stairs that are constructed dangerously is to rebuild, which can be prohibitively costly.
12.3 SURFACES: IMPACT ABSORPTION, SLIP RESISTANCE
The panel noted that while the current BCA refers to the terms ‘non-slip’, non-skid’ and ‘slip resistant’ to describe the requirements of various surface finishes, nowhere does it actually specify what constitutes a non-slip, non-skid or slip resistant surface finish. It was also noted that there is generally an over reliance on a surfaces’ coefficient of friction measurement when ascertaining slip resistance.
It was noted that the recommendations from HB 197 are included in a new draft appendix to the informative requirements of AS 4586 and the panel enquired as to whether these informative requirements could be used to update the BCA. The panel were informed that any proposal for change to the BCA would have to be approved by the ABCB board.
The panel discussed how increasing flooring slip resistance would increase the cost of flooring and it was suggested that the provision of suitable slip resistance is, and should be, the responsibility of the manufacturer.

RELATIONSHIP BETWEEN SLIPS, TRIPS & FALLS & THE DESIGN & CONSTRUCTION OF BUILDINGS 185
The panel also discussed the design trend towards floor water waste drains in many wet areas and it was suggested that the gradients of floors to drain water (particularly in apartment buildings) are too steep. It was also noted that the encouragement of water onto the bathroom floor waste drain creates a slip hazard.
12.4 EXPERT PANEL RECOMMENDATIONS FOR IMPROVING SLIP RESISTANCE AND IMPACT ABSORPTION OF FLOORING
The panel suggested that the provision of impact absorptive flooring in wet areas was not feasible due to the requirement that floors in wet areas must be impervious to water.
The panel suggested that a greater focus on factors other than the coefficient of friction could improve the general slip resistance of flooring. It was noted that flooring slip resistance was particularly important in aged care environments due to the greater likelihood of the elderly falling and the increased injury consequences of such falls.
The panel suggested that many design changes which could potentially reduce slips and trips could be implemented quite easily during the construction phase. These include measures such as recessing (or rebating) aluminium sliding door frames into a building’s concrete slab to minimise the trip hazard of the protruding door frame, and limiting slip and trip hazards in wet areas, such as steps and ledges surrounding showers and baths.
12.5 FALLS FROM HEIGHTS: WINDOWS, BALCONIES, VERANDAHS
Members of the panel stated that the BCA requires that a 125mm sphere cannot pass through balcony railings. MUARC emphasised to the panel that the anthropometric data on the centre of gravity on which this regulation is based is very old and measurements taken from it may no longer be applicable, particularly in relation to the required height of verandah balustrades and the acceptable minimum space between horizontal and vertical balcony railings. Climbability of balcony and verandah railings was also considered to be unacceptable from a safety perspective and New Zealand leads Australia on this issue.
The panel noted that the requirement that verandahs could be up to 1000mm from ground level before verandah railings are required by the BCA was quite high, and that severe injury was still possible from a fall of less than one metre. Members of the panel stated that railings were required at 600mm from ground level in previous versions of the BCA and that it seemed odd that this requirement has now been relaxed.
12.6 EXPERT PANEL RECOMMENDATIONS ON FALLS FROM HEIGHTS: WINDOWS, BALCONIES, VERANDAHS
Members of the panel noted that there are regulations in place for window openings (locks, heights) around pools, but these or similar regulations have not as yet been applied to window fall hazards, which are more prevalent and have greater immediate injury consequences.
The panel recommended that the current maximum tolerance of 1000mm be reviewed by the ABCB for future building codes with a view to reducing the minimum height at which verandahs must have a balustrade installed.

186 MONASH UNIVERSITY ACCIDENT RESEARCH CENTRE
MUARC suggested that the balustrade requirements for window and balcony heights above 4 metres be reviewed, and that the BCA’s current deemed to satisfy provision that “horizontal/near horizontal [balustrade] members between 150mm and 760mm above floors that are more than 4 metres above the surface beneath must not facilitate climbing” for buildings of all classes was insufficient and would not be tolerated in the workplace. This height tolerance should be greatly reduced.
A panel member stated that this has been recognised with regard to windows and that there is a proposal to regulate for the introduction of window guards for openings above 4 metres in the BCA 2008. It was also noted that that this issue will become more important with the current tendency towards construction of a greater number of multi storey dwellings.
12.7 RESIDENTIAL BUILDING MAINTENANCE AND ACCESS TO HEIGHTS
The panel suggested that in addition to gutter cleaning and maintenance, there is anecdotal evidence of an increasing frequency of domestic roof installations that require ongoing user maintenance: these include air conditioning units, heaters, solar panels, and aerials. The panel concluded that it is impossible to regulate domestic maintenance activity and that elimination of hazards is the then only practical prevention strategy for hazards associated with domestic building maintenance and the accompanying need to access heights and this issue should be addressed.
12.8 EXPERT PANEL RECOMMENDATIONS FOR RESIDENTIAL BUILDING MAINTENANCE AND ACCESS TO HEIGHTS
Provisions regarding gutters in the BCA are principally to address potential fire hazards, and the panel recognised that the ABCB needs to expand its focus to include an emphasis on preventing the need to access heights domestically. The panel discussed whether it was possible to regulate for preventative materials such as gutter guards, hinged gutters and ladder hooks through the BCA.
It was suggested that recommendations could be made through the accompanying guidance materials, although it was noted that since guidance materials do not require legal adherence, this would open designers up to potential litigation and potentially create confusion among designers and builders.
12.9 CONCLUSION AND SUMMARY
The principal recommendations of the ABCB/MUARC expert panel are outlined below:
Slip resistance
The panel concluded that the BCA needs to be improved in regards to its definition and measurement of slip resistance, and that other factors affecting slip resistance beyond the coefficient of friction need to be taken into account.
It was stated that slip resistance is a complex area with large cost implications, and that the guidelines in HB 197 and AS 4586 could be inserted into the performance requirements of the BCA. The panel recommended that industry groups and business could be consulted for cost implications of this.

RELATIONSHIP BETWEEN SLIPS, TRIPS & FALLS & THE DESIGN & CONSTRUCTION OF BUILDINGS 187
Trip hazards
The panel concluded that the BCA also needs to define structural trip hazards around the house and methodically address them.
It was suggested that adequate mechanisms to deal with falls need to be found, that we must identify the parts of the BCA that deal with falls (handrails, balustrades etc), review these against the data and literature and suggest positive changes.
The Building Code of Australia
The members of the expert panel collectively agreed that given the evidence presented in the scientific literature and national injury and death data, that there was a sufficient case presented for action on low or moderate cost changes where the evidence is already strong and further research to be conducted with a view to informing changes to the BCA.
The panel discussed possible methods of diverting additional manufacturing and construction costs that would be incurred as a result of implementing the discussed changes to the BCA.
It was noted that it is more expensive to install safety features after construction than it is to build preventative measures originally, so the later is preferable both economically and in terms of improved safety.
The panel discussed the possibility of encouraging State or Federal Government subsidies for preventative measures such as the installation of handrails, slip resistant and impact attenuating flooring and the recessing of removal of building features that can present a trip hazard.
It was suggested that health care costs saved by implementing positive and preventative changes to the BCA could potentially be redirected towards possible subsidies for safer construction, and that these could be primarily directed towards businesses for the cost of retooling, or as a consumer rebate to offset increased prices (as is the case with the installation of water tanks in existing homes).
The panel agreed that, in their collective opinion, the building industry would likely be receptive to implementing some preventative changes to construction practice or BCA regulations providing a clear public benefit could be shown and the cost of doing so was not prohibitive.
Residential Aged Care
The panel agreed that impact absorbing flooring designs should be further investigated where the material properties would be capable of averting serious fractures resulting from falls, whilst maintaining adequate stiffness for a firm surface.
Assuming no other unwanted properties in these materials (i.e. suitably fire and contamination resistant), they should be trialled as replacement flooring (or underlay) in high risk areas such as residential aged care, most particularly in the area surrounding residents beds.

188 MONASH UNIVERSITY ACCIDENT RESEARCH CENTRE
CHAPTER 13 RECOMMENDATIONS FOR THE PREVENTION OF SLIPS, TRIPS AND FALLS IN BUILDINGS AND FUTURE RESEARCH
13.1 INTRODUCTION
This chapter brings together recommendations based on the literature review, data analyses and cost estimates, and expert panel discussion, from the various chapters of this report. The recommendations are grouped according to the sectors that would need to take action for their implementation or further action.
13.2 RECOMMENDATIONS TO THE ABCB AND BUILDING INDUSTRY
13.2.1 Recommendations for stair and step geometry
It is recommended that the ABCB consider narrowing the wide range of geometrical going and riser combinations currently allowed by BCA 2007 for non-spiral stairways from 115 to 190mm for risers and 240mm to 355mm for goings, to a riser/going combination of approximately 178mm x 280mm.
Particular attention should be paid to narrowing the acceptable lower range of measurements for stair goings, as up to 80% of stair and step injuries have been shown in the international literature and national data to occur during descent and insufficiently narrow goings are a major cause of mis-steps during descent.
These recommendations are made with particular relevance to Class 1 and 10 residential buildings as the majority of stair fall injuries and fatalities occur in the home.
13.2.2 Recommendations for the provision, design and optimal height of handrails and balustrades
It is recommended that the ABCB consider raising the minimum stairway handrail height from 865mm as it currently stands in BCA 2007, to a height over 900mm (preferably 910-920mm) as has been shown to be the optimum height for the widest user demographic.
This recommendation is of particular importance considering the rapidly increasing centre of gravity of the Australian population, and the substantial injury and fall prevention benefits shown by previous studies to be provided by correctly positioned handrails.
The adequacy of current standards, codes and regulations that govern the design and installation of verandah balustrades are particularly deserving of attention in future reviews of the BCA.
Of primary concern is the current BCA regulation that verandahs of less than 1000mm in height do not require a railing or balustrade. As shown in this study, falls from a height of less than one metre (as are the majority of verandah falls in Australia) can have severe injury consequences and are easily preventable through the provision of non-climbable barriers of a sufficient height.
RELATIONSHIP BETWEEN SLIPS, TRIPS & FALLS & THE DESIGN & CONSTRUCTION OF BUILDINGS 189
13.2.3 Recommendations for slip resistance of flooring surfaces
It is recommended that the ABCB include a thorough definition of slip resistance in future editions of the BCA, rather than referring to the definition included in Standards Australia Handbook HB 197:2005. This definition should also include factors other than the dry coefficient of friction measurement deemed appropriate by the above Standard and should include other environmental factors that may increase a surface’s slipperiness.
It is recommended that manufacturers and retailers provide comparative information on slip resistance, and the slip resistive properties of different flooring surfaces, to consumers for consideration before purchase.
Alteration of the BCA should be considered to require the installation of slip-resistant surfaces in the internal wet areas and external pedestrian areas of all new homes and renovated homes, and that the Local Government and Shires Associations of NSW initiative, whereby certificates of occupancy are only issued to buildings where all flooring surfaces meet the recommendations on slip resistance of pedestrian surfaces as outlined in the revised Standards Australia Handbook HB 197:2005 is adopted and regulated nationally (Gunatilaka 2005).
13.2.4 Trip hazards
It is recommended that a provision to recess or “rebate” structural trip hazards such as door frames, shower door frames and other structural trip hazards in new or renovated domestic dwellings be considered for future editions of the BCA.
13.2.5 Falls from heights
It is recommended that the ABCB, the building industry, local councils and other stake holders investigate the possibility of limiting or removing the need to attain heights for domestic maintenance purposes. This could potentially be achieved through the provision of features such as hinged gutters and gutter guards, or through the subsidisation of skilled trades’ people for those vulnerable to fall from height injury.
The BCA should consider a provision for the required installation of window guards at second storey height in all domestic dwellings, irrespective of whether they exceed four metres in height. We also note that the current BCA requirement of window guards for heights over four metres offers substantial potential for injury, particularly in comparison with the stringent guard requirements in place for windows of any height opening to provide access to domestic swimming pool areas.
It is recommended that the BCA be amended to require handrails for stairs in all domestic dwellings.
All balcony, stair and verandah balustrades, irrespective of height above ground level, should be of non-climbable design and adequate height to prevent toppling-over.
13.3 AGED CARE FACILITIES AND HEALTH SERVICE AREAS
Given the high proportion of falls suffered by older persons, and the high proportion of these that occur in aged care facilities, particularly around beds and in bathrooms, the installation of force attenuating surfaces in the immediate vicinity of beds in aged care facilities is recommended.
190 MONASH UNIVERSITY ACCIDENT RESEARCH CENTRE
It is recommended that the Department of Health and Ageing conduct a cost/benefit analysis based on the immediate and ongoing public health burden resulting from bed and bathroom falls in aged care facilities to determine the economic benefit of this suggested installation.
It is recommended that new or renovated aged care facilities feature recessed or “rebated” door frames, shower door frames and other structural trip hazards now present in many facilities.
13.4 DATA RECOMMENDATIONS
Attention is required to case capture for fall related fatalities in both the ABS and NCIS data sets.
It is also recommended that greater consistency be developed between the NCIS and ABS fatality data sets, with particular reference to the very large number of unspecified cause/mechanism and location values found in both datasets.
Measures should be taken by all state and territory Health Departments to improve the quality of hospital admissions data with regard to mechanism, activity and place of occurrence for all fall injuries.
It is recommended that states which collect emergency department injury surveillance data pay greater attention to the collection of accurate narrative data as this would allow easier identification of hazards and faster implementation of targeted prevention strategies.
13.5 RECOMMENDATIONS FOR CONTINUING AND FUTURE RESEARCH
It is recommended that the ABCB undertake an in depth study of the building related fall fatality data available through the National Coroners Information System, including both level one and two analyses of all recent (within 5 years) fatal falls in buildings in Australia, and a thorough analysis of the available narrative data and related information for each case.
An in depth follow up study on balcony falls in Australia is suggested to fully explore the mechanism of these falls – including climbing, height and gaps in balustrades and railings.
Research is required to investigate the capacity of new technology flooring (or underlay material) to attenuate the level of energy generated in falls to a level below the fracture threshold for hip fractures. This research would need to select only materials with the capacity to meet other aspects of the BCA with regard to fire, hygiene and other relevant standards.
It is recommended that cost/benefit modelling be done on a range of potential interventions for a range of possible effects.
13.6 RECOMMENDATIONS FOR DISSEMINATION
It is recommended that an Australasian workshop be held in early 2008 to present the findings of this research to stakeholders and to discuss the implementation of the research recommendations.

RELATIONSHIP BETWEEN SLIPS, TRIPS & FALLS & THE DESIGN & CONSTRUCTION OF BUILDINGS 191
That the study report be provided to Standards Australia and its “Safety in House Design” to inform the preparation of their revised guide.
The research should be published in the scientific literature.
Media releases should be prepared at the time of the workshop or the publication of the results in the scientific literature.
13.7 CONCLUSION
Slips, trips and falls in buildings constitute a large and costly public health problem, which is expected to grow in coming years due to the ageing of the Australian population and the increase in housing density, with associated trends to multi-storey dwellings. Although falls and injuries in buildings may be caused by a combination of factors including the design and construction of buildings, many potential solutions lie with the building industry and its regulators. Others with responsibility include the residential and community aged care sectors, the health sector, Standards makers and those responsible for death and injury data systems and research funding.
Given the enormous cost of the problem, investment in effective preventative solutions is imperative.

192 MONASH UNIVERSITY ACCIDENT RESEARCH CENTRE

RELATIONSHIP BETWEEN SLIPS, TRIPS & FALLS & THE DESIGN & CONSTRUCTION OF BUILDINGS 193
APPENDIX 1
RAW ET AL. – “A RISK ASSESSMENT PROCEDURE FOR HEALTH AND SAFETY IN
BUILDINGS”
List of harms and mean ratings in ascending order (revised by MUARC)
HARM MEAN VAR RANGE
109 Slight graze to hand 1.06 0.06 1.00
108 Slight graze to arm/leg 1.22 0.24 2.00
36 Occasional insect bites 1.78 0.56 3.00
200 Minor puncture/cuts to hands 2.16 1.10 5.00
202 Minor puncture/cuts to leg 2.25 0.65 4.00
67 Minor dislocated finger 2.28 1.37 3.00
110 Bad graze to face 2.37 1.02 4.00
41 Superficial blisters other than on face 2.38 0.50 3.00
46 Moderate bruising to legs 2.44 1.03 4.00
18 Temporary slight backache 2.47 0.58 3.00
66 Minor dislocated toe 2.53 1.16 4.00
154 Temporary/occasional slight irritation of eyes 2.66 1.65 5.00
230 Slight ligament injury in ankle 2.66 0.49 3.00
85 Slight electric shock 2.75 1.94 5.00
198 Moderate puncture/cuts to ankles/feet 2.81 0.80 3.00
240 Strained muscle/tendon in foot/leg 2.81 1.00 3.00
45 Moderate bruising to face 2.88 1.53 4.00
182 Temporary/occasional slight muscle weakness 2.88 1.53 4.00
50 Minor burns/scalds to legs/ankles 2.94 1.09 5.00
123 Hairline fracture of nose 3.00 2.13 5.00
122 Hairline fracture of toes 3.12 1.02 3.00
241 Strained abdominal muscle 3.25 0.97 3.00

194 MONASH UNIVERSITY ACCIDENT RESEARCH CENTRE
266 Slight ligament injury in wrist 3.33 0.24 1.00
68 Minor dislocated shoulder 3.44 0.90 3.00
232 Moderate ligament injury in elbow 3.44 0.77 3.00
121 Simple fracture of fingers 3.63 1.53 4.00
201 Moderate puncture/cuts to head/face 3.66 0.75 4.00
204 Moderate puncture/cuts to torso 3.69 1.00 5.00
24 Loss of finger/thumb/toe nail by surgical removal 3.72 1.89 5.00
149 Minor hernia 3.72 0.66 3.00
228 Slight slipped disc 3.78 1.34 5.00
56 Slight concussion 3.88 0.89 3.00
231 Moderate ligament injury in hip 3.91 0.54 3.00
48 Severe bruising to torso 4.00 1.55 4.00
124 Simple fracture of jaw 4.06 1.61 4.00
54 10% burns/scalds 4.13 1.85 4.00
113 Simple fracture of ankles/feet 4.13 1.02 4.00
51 Moderate burns/scalds to feet 4.16 1.10 4.00
37 Immediate temporary impaired vision in one eye 4.25 0.71 3.00
90 Brief loss of consciousness 4.25 1.61 5.00
42 Serious blisters on face or hands 4.28 0.85 3.00
131 Mild hyperthermia 4.28 1.37 4.00
118 Hairline fracture of pelvis 4.34 0.81 3.00
185 Temporary paralysis of foot/feet 4.41 0.96 4.00
199 Serious puncture/cuts to arm/wrist 4.50 0.97 4.00
53 Moderate burns/scalds to torso 4.53 0.97 3.00
116 Compound, complicated or comminuted fracture of wrist/hands
4.62 0.89 3.00
203 Serious puncture/cuts to neck 4.63 1.21 3.00
211 Slight retinol haemorrhage 4.66 1.39 5.00
49 Severe multiple bruising 4.72 1.24 4.00

RELATIONSHIP BETWEEN SLIPS, TRIPS & FALLS & THE DESIGN & CONSTRUCTION OF BUILDINGS 195
183 Chronic/regular moderate muscular weakness 4.72 1.05 3.00
85 Serious dislocated jaw 4.75 0.20 1.00
23 Loss of finger 4.78 2.69 6.00
47 Severe bruising to head/neck 4.78 1.27 4.00
233 Serious ligament injury in knee 4.78 0.50 3.00
205 Multiple serious puncture/cuts 4.84 2.33 4.00
27 Permanent loss of hair because of burns 4.88 1.60 4.00
69 Serious dislocated knee 4.88 1.08 3.00
133 Moderate hypothermia 4.94 1.03 3.00
150 Major hernia 5.00 0.26 2.00
15 Asphyxiation with full recovery 5.03 1.19 4.00
38 Gradual permanent impaired vision in one eye 5.09 0.67 3.00
52 Severe burns/scalds to hands 5.16 1.10 3.00
120 Simple fracture of skull 5.34 0.81 3.00
169 Moderate internal abdominal damage 5.38 0.37 3.00
186 Temporary paralysis of arms 5.39 1.18 4.00
114 Compound, complicated or comminuted fracture of arms/shoulder
5.41 0.70 4.00
184 Chronic/regular severe muscle weakness 5.41 0.77 4.00
229 Serious slipped disc 5.41 0.38 3.00
57 Severe concussion 5.44 0.90 3.00
270 Serious ligament injury in neck 5.58 0.27 1.00
117 Simple fracture of legs 5.63 1.92 4.00
119 Compound, complicated or comminuted fracture of ribs 5.66 0.56 3.00
115 Simple fracture of back without damage to spinal cord 5.75 0.71 3.00
242 Attempted suicide with full recovery 5.78 0.37 3.00
91 Loss of consciousness for hours/days 5.81 0.74 3.00
125 Multiple compound, complicated or comminuted fractures
5.81 0.35 3.00
187 Permanent paralysis of leg 5.91 0.67 2.00

196 MONASH UNIVERSITY ACCIDENT RESEARCH CENTRE
25 Loss of foot 6.00 0.58 2.00
134 Severe hypothermia 6.00 0.77 4.00
22 Loss of dominant hand 6.03 0.61 2.00
137 Immediate permanent deafness in both ears 6.12 0.89 5.00
245 Severe retinol haemorrhage 6.25 0.20 1.00
55 Minor immediate brain damage 6.33 0.24 1.00
84 Serious dislocated spine 6.42 0.27 1.00
105 Severe electric shock 6.42 0.27 1.00
20 Loss of arms 6.44 0.25 1.00
55 80% burns/scalds 6.50 0.77 3.00
39 Immediate permanent blindness in both eyes 6.72 0.21 1.00
64 Severe burns/scalds to face 6.75 0.20 1.00
141 Fracture of neck with damage to spinal cord 6.83 0.15 1.00
21 Loss of arms and legs 6.84 0.14 1.00
188 Permanent paralysis below neck 6.91 0.09 1.00
16 Asphyxiation resulting in major brain damage/death 7.00 0.00 0.00
44 Fatal immediate brain damage 7.00 0.00 0.00
86 Fatal electric shock 7.00 0.00 0.00
92 Permanent loss of consciousness 7.00 0.00 0.00
132 Fatal hypothermia 7.00 0.00 0.00
170 Fatal abdominal damage 7.00 0.00 0.00
227 Fatal stroke/heart attack 7.00 0.00 0.00
243 Suicide 7.00 0.00 0.00

RELATIONSHIP BETWEEN SLIPS, TRIPS & FALLS & THE DESIGN & CONSTRUCTION OF BUILDINGS 197
APPENDIX 2
RELEVANT MATTERS AFFECTING LIKELIHOOD AND HARM OUTCOME
Falls associated with baths etc.
Matters relevant to the likelihood of an occurrence include:
a) Poor friction – of the internal surface of a bath or shower.
b) Siting of taps, wastes, light switches and other controls– inappropriate sitings increasing the risk of falls.
c) Handles and grab rails – lack of, or insecurely fitted.
d) Unstable appliance – unstable fitting of bath, shower, WC basin, or wash hand basin.
e) Inadequate space – for the functional area immediately adjacent to the appliance.
f) Inadequate lighting – lack of adequate natural or artificial lighting.
g) Glare – from natural or artificial lighting.
h) Space heating – inadequate means of heating the bathroom.
Matters relevant to the severity of the outcomes include:
a) Projections – the presence of sharp edges, heating installations, or glass.
b) Inadequate space – functional space and space between appliances.
c) Space heating – inadequate means of heating the bathroom.
Falls on level surfaces etc.
Matters relevant to the likelihood of an occurrence include:
a) Lack of floor surface – no properly constructed floor, path, or yard where needed.
b) Excessive slope – to the floor, path or yard.
c) Uneven surface – to the floor, path, or yard.
d) Trip steps/threshold – the presence of such steps or projecting thresholds.
e) Disrepair – to the structure and surface of the floor, path or yard.
f) Poor slip resistance – to the surface of the floor, path or yard.
g) Inadequate drainage – of surface water from the path or yard.
h) Inadequate space – for the carrying out of appropriate tasks and manoeuvres.

198 MONASH UNIVERSITY ACCIDENT RESEARCH CENTRE
i) Poor lighting or glare – both artificial and natural.
j) Thermal efficiency – inadequate heating and insulation at the dwelling.
Matters relevant to the severity of the outcome include:
a) Hard surfaces – unforgiving or abrasive surface to the floor, path or yard.
b) Projections etc – the presence of sharp edges, heat producing appliances, or glass, in the area where a fall might occur.
c) Nature of area – and of the activities which will be undertaken in the area where a fall might occur.
d) Thermal efficiency – inadequate heating and insulation at for the dwelling.
Falls on stairs etc.
Matters relevant to the likelihood of an occurrence include:
a) Tread lengths – of less than 280mm or greater than 360mm.
b) Riser heights – of less than 100mm or greater than 180mm.
c) Variation in tread or riser – dimensional variation producing an uneven pitch.
d) Nosing length – projecting more than 18mm beyond any riser.
e) Poor friction quality – of treads and nosings.
f) Openings – in stairs or guarding through which a 100mm diameter sphere can pass.
g) Alternating treads – stairs so constructed, particularly those not conforming to current regulations.
h) Lack of handrails – the absence to both sides of the staircase.
i) Height of handrails – set below 900mm or above 1,000mm.
j) Lack of guarding – the absence where there is no wall to both sides of the staircase.
k) Height of guarding – not extending to at least 900mm above the treads.
l) Easily climbed guarding – constructed so as to facilitate climbing.
m) Stair width – less than 1,000mm.
n) Length of flight – long flights may increase the likelihood of a fall.
o) Inadequate lighting – natural and/or artificial, particularly to the top and foot of a flight.
p) Lighting controls – inadequate or inconvenient means of controlling the artificial lighting.
q) Glare from lighting – whether natural or artificial.
r) Door(s) onto stairs – doors opening directly onto the stairs.

RELATIONSHIP BETWEEN SLIPS, TRIPS & FALLS & THE DESIGN & CONSTRUCTION OF BUILDINGS 199
s) Inadequate landing – inadequate floor space leading to the stairs.
t) Construction/disrepair – inadequate construction or disrepair to any element of the stairs.
u) Thermal efficiency – inadequate heating and insulation of the dwelling.
Matters relevant to the severity of the outcome include:
a) Length of flight – long flights increase the severity of the outcome.
b) Pitch of stairs – stairs which are of above average steepness or shallowness.
c) Projections etc – the presence of sharp edges, heating installations, or glass, to the stairs or at the foot of the flight.
d) Hard surfaces – unforgiving surfaces at the foot of the flight.
e) Construction/disrepair – inadequate construction of, or disrepair to, any element of the stairs.
f) Thermal efficiency –inadequate heating and insulation of the dwelling.
Falling between levels
For windows, matters relevant to the likelihood of an occurrence include:
a) Ease of window operation – degree of difficulty to use window catches and opening lights.
b) Safety catches – lack of such catches or features to catches.
c) Opening limiters – no restriction preventing windows being opened more than 100mm.
d) Sill heights – less than 1,100mm above floor level and/or lack of safety glass or guarding.
e) Disrepair of window – to frame, catches, hinges, sashes, safety devices and opening lights.
f) Ease of cleaning – outer surfaces that are difficult to clean.
For balconies, landings, roof parapets, basement wells, etc, matters relevant to the likelihood of an occurrence include:
a) Height of guarding – extending less than 1,100mm above the balcony, roof surface or floor.
b) Easily climbed guarding – constructed so as to facilitate climbing by young children.
c) Openings in guarding –openings greater than 100mm.
d) Construction/repair of guarding – insufficient strength and fixing.

200 MONASH UNIVERSITY ACCIDENT RESEARCH CENTRE
For windows, balconies, landings, roof parapets, basement wells, etc, matters relevant to the severity of the outcome include:
a) Height above ground – the distance of a fall to the ground or next level.
b) Nature of ground – the nature of the surface and any features which may be collided with.
c) Non-safety glass – the lack of safety glass where appropriate in the window or guarding.

APPENDIX 3
COMPARISON OF NCIS AND ABS BUILDING FALL FATALITY DATABASES, AUSTRALIA, 2005-2005.
2001 2002 2003 2004 2005 All
NCIS ABS NCIS ABS NCIS ABS NCIS ABS NCIS ABS NCIS ABS
State or territory
Victoria 69 46 76 43 127 78 159 220 158 313 589 700
New South Wales 130 157 119 108 86 62 78 106 83 111 496 544
Queensland 53 62 44 55 32 25 79 41 89 58 297 241
Western Australia 23 15 31 15 27 19 31 24 33 46 145 119
South Australia 19 12 20 11 33 12 16 18 6 34 94 87
Tasmania 10 27 11 25 9 10 17 24 11 13 58 99
Australian Capital Territory * 9 6 * * * 6 * * * 19 23
Northern Territory * 6 2 * * * * * 5 7 15 19
All 310 334 309 265 319 212 389 436 386 585 1713 1832

Age group
0-14 6 * 5 5 * * * * 5 7 23 20
15-29 16 15 14 16 9 8 9 5 8 9 56 53
30-44 28 25 25 21 25 20 16 15 15 12 111 93
45-59 46 43 39 32 45 28 36 29 32 35 198 167
60-74 127 65 71 58 56 41 73 58 67 67 334 289
75+ 147 183 154 133 180 111 249 327 259 455 989 1209
missing * * * * * * * * * * * *
All 310 334 309 265 319 212 389 436 386 585 1713 1832
Gender
Male 124 179 133 147 125 118 172 205 172 275 726 924
Female 186 155 176 118 194 94 217 231 217 310 987 908
All 310 334 309 265 319 212 389 436 386 585 1713 1832

Cause (ABS)
same level from slipping, tripping, stumbling
N/A 49 N/A 53 N/A 32 N/A 93 N/A 56 N/A 283
on and from stairs and steps 56 50 47 32 37 30 49 44 41 36 230 192
other fall on same level N/A 17 N/A 12 N/A 14 N/A 111 N/A 26 N/A 180
from, out of or through building or structure
N/A 38 N/A 29 N/A 24 N/A 13 N/A 19 N/A 123
involving bed 22 19 23 12 17 14 27 33 27 31 116 109
on and from ladder 16 10 14 18 20 14 9 7 18 14 77 63
involving chair * * 6 6 8 * 15 21 8 14 38 48
other fall from one level to another N/A * N/A * N/A * N/A 10 N/A 9 N/A 35
involving other furniture N/A * N/A * N/A * N/A 6 N/A 4 N/A 19
involving wheelchair N/A * N/A * N/A * N/A 6 N/A 8 N/A 18
on same level -collision with pushing by another person
N/A * N/A * N/A * N/A 0 N/A * N/A *
while being carried or supported by other persons
N/A 0 N/A * N/A 0 N/A * N/A * N/A *
unspecified fall N/A 131 N/A 83 N/A 64 N/A 91 N/A 347 N/A 716
fracture unspecified, reclassified from X59
N/A 7 N/A 6 N/A 8 N/A 0 N/A 19 N/A 40
All 310 334 309 265 319 212 389 436 386 585 1713 1832

Cause (NCIS)
Falling/jumping/pushed from a height: < 1m
60 N/A 65 N/A 47 N/A 67 N/A 40 N/A 279 N/A
Falling/jumping/pushed from a height: < 1m
113 N/A 90 N/A 92 N/A 81 N/A 89 N/A 465 N/A
Falling/stumbling by slipping on same level
21 N/A 18 N/A 14 N/A 33 N/A 25 N/A 111 N/A
Falling/stumbling by tripping on same level
38 N/A 42 N/A 38 N/A 36 N/A 36 N/A 190 N/A
Other falling/stumbling on the same level
43 N/A 54 N/A 41 N/A 36 N/A 25 N/A 199 N/A
Other specified falling/stumbling 5 N/A 10 N/A 15 N/A 10 N/A 19 N/A 59 N/A
Unspecified falling/stumbling 30 N/A 30 N/A 72 N/A 126 N/A 152 N/A 410 N/A
All 310 334 309 265 319 212 389 436 386 585 1713 1832
Location
Home 180 210 158 169 177 137 189 209 194 305 898 1030
School other institution or public administrative area (includes hospital)
74 37 93 26 100 23 133 57 147 58 546 201
Residential/Correctional facility 21 69 30 48 26 44 40 154 29 204 146 519
Trade or service area 25 18 24 22 11 8 21 16 12 18 93 82
Other specified place 10 0 * 0 * 0 5 0 * 0 24 0
Unspecified place 0 0 * 0 * 0 * 0 * 0 6 0
All 310 334 309 265 319 212 389 436 386 585 1713 1832
Note: coding differences make comparisons based on cause and location difficult. Data provided as a guide only.

RELATIONSHIP BETWEEN SLIPS, TRIPS & FALLS & THE DESIGN & CONSTRUCTION OF BUILDINGS 205
APPENDIX 4
OVERVIEW OF HOSPITAL ADMITTED FALLS, VICTORIA 1998/9-2004/5
Age and gender (frequency)
Average annual frequency of hospital admitted falls by age group and gender, Victoria 1998/9-2004/5
0
2,000
4,000
6,000
8,000
10,000
age group
fre
qu
en
cy
of
ad
mis
sio
n male
female
all
male 927 1380 1405 1166 954 826 737 657 679 660 661 635 626 702 955 1308 1425 1915
female 689 1056 581 303 332 349 380 397 436 507 643 751 817 1081 1688 2817 3692 6115
all 1616 2437 1986 1469 1286 1175 1117 1054 1116 1167 1305 1386 1443 1783 2642 4125 5117 8031
0-4 5-9 10-14 15-19 20-24 25-29 30-34 35-39 40-44 45-49 50-54 55-59 60-64 65-69 70-74 75-79 80-84 85+

206 MONASH UNIVERSITY ACCIDENT RESEARCH CENTRE
Age and gender (rates)
Average annual rate of hospital admitted falls by age group and gender, Victoria 1998/9-2004/5
0
2,000
4,000
6,000
8,000
10,000
12,000
14,000
age group
rate
per
100
,00
0
male
female
all
male 588.4 830.8 842.4 705.8 564.4 470.6 399.0 358.5 374.8 395.2 426.8 487.2 603.1 807.0 1254.3 2234.7 4205.4 8702.3
female 459.6 670.1 363.4 190.4 201.4 196.8 199.2 211.5 235.8 296.5 407.6 578.6 780.4 1176.9 1969.0 3712.2 6921.1 12533.6
all 525.6 752.6 608.0 452.9 385.2 333.0 297.5 284.1 304.6 345.3 417.1 532.8 692.0 997.0 1633.0 3069.6 5870.2 11346.0
0-4 5-9 10-14 15-19 20-24 25-29 30-34 35-39 40-44 45-49 50-54 55-59 60-64 65-69 70-74 75-79 80-84 85+
Age and gender (frequency)
Average annual frequency of hospital admitted falls by broad age group and gender, Victoria 1998/9-2004/5
0
4,000
8,000
12,000
16,000
20,000
age group
fre
qu
en
cy
of
ad
mis
sio
n male
female
all
male 3712 2946 2073 1956 2283 4648
female 2326 984 1213 1901 3585 12625
all 6038 3930 3286 3857 5868 17273
0-14 years 15-29 years 30-44 years 45-59 years 60-74 years 75+ years

RELATIONSHIP BETWEEN SLIPS, TRIPS & FALLS & THE DESIGN & CONSTRUCTION OF BUILDINGS 207
Age and gender (rates)
Average annual rate of hospital admitted falls by broad age group and gender, Victoria 1998/9-2004/5
0
2,000
4,000
6,000
8,000
age group
rate
per
100
,00
0
male
female
all
male 756.9 577.9 377.5 432.5 855.2 4058.7
female 497.7 196.3 215.4 414.5 1271.5 7086.5
all 630.4 388.7 295.4 423.4 1069.2 5904.2
0-14 years 15-29 years 30-44 years 45-59 years 60-74 years 75+ years

208 MONASH UNIVERSITY ACCIDENT RESEARCH CENTRE
Trend (frequency)
Trend in the frequency of hospital admitted falls by broad age group, Victoria 1998/9-2004/5
0
10,000
20,000
30,000
40,000
50,000
year of admission
fre
qu
enc
y o
f a
dm
issi
on
all ages
75+ years
0-14 years
60-74 years
15-29 years
45-59 years
30-44 years
all ages 34286 36692 39187 40618 41545 43325 46119
75+ years 13823 15298 16288 17502 17863 19461 20674
0-14 years 5626 5741 6119 5978 6324 6066 6414
60-74 years 5184 5426 5763 5958 5942 6144 6660
15-29 years 3587 3793 3915 4049 4024 3918 4225
45-59 years 3186 3327 3784 3803 4074 4273 4555
30-44 years 2880 3107 3318 3328 3318 3463 3591
98/99 99/00 00/01 01/02 02/03 03/04 04/05
Trend (rates)
Trend in the rate of hospital admitted falls by broad age group, Victoria 1998/9-2004/5
0
2,000
4,000
6,000
8,000
year of admission
rate
per
100
,000
75+ years
60-74 years
all ages
0-14 years
45-59 years
15-29 years
30-44 years
75+ years 5319 5658 5785 5985 5911 6243 6429
60-74 years 982 1017 1068 1091 1074 1093 1160
all ages 735 778 821 841 851 878 924
0-14 years 591 601 638 622 659 632 669
45-59 years 380 386 428 419 437 448 467
15-29 years 356 378 390 403 398 385 411
30-44 years 267 285 301 298 294 306 317
98/99 99/00 00/01 01/02 02/03 03/04 04/05

RELATIONSHIP BETWEEN SLIPS, TRIPS & FALLS & THE DESIGN & CONSTRUCTION OF BUILDINGS 209
Cause
Hospital admitted falls by mechanism, Victoria 1998/9-2004/5
98/99 99/00 00/01 01/02 02/03 03/04 04/05 ALL % same level from slipping, tripping, stumbling 8,108 8,543 9,146 9,863 9,130 9,775 10,464 65,029 23.1
slip N/A N/A N/A N/A 2,882 2,956 3,235 trip N/A N/A N/A N/A 5,183 5,888 6,127
stumble N/A N/A N/A N/A 1,065 931 1,102 other fall on same level 3,637 3,550 3,722 4,752 5,651 6,171 6,590 34,073 12.1 on and from stairs and steps 1,491 1,603 1,739 1,903 2,053 2,066 2,291 13,146 4.7 involving playground equipment 1,454 1,456 1,467 1,543 1,632 1,547 1,658 10,757 3.8 involving bed 1,283 1,385 1,488 1,546 1,609 1,706 1,678 10,695 3.8 other fall from one level to another 1,382 1,301 1,239 1,188 1,177 1,138 1,293 8,718 3.1 involving chair 876 945 1,005 1,103 1,118 1,179 1,234 7,460 2.6 on and from ladder 916 931 1,017 1,064 1,078 1,153 1,263 7,422 2.6 from, out of or through building or structure 680 689 755 767 837 818 807 5,353 1.9 same level, collision with or pushing by other person 956 711 644 699 776 751 733 5,270 1.9 involving ice skates, skis, roller-skates or skateboard 588 723 853 753 736 749 739 5,141 1.8 from tree 303 293 295 268 266 236 247 1,908 0.7 involving other furniture 197 265 243 241 258 299 283 1,786 0.6 involving wheelchair 129 157 166 173 184 188 208 1,205 0.4 while being carried or supported by other persons 75 79 90 92 108 110 102 656 0.2 diving or jumping into water 66 60 91 58 67 73 65 480 0.2 on and from scaffolding 62 79 61 39 75 63 50 429 0.2 from cliff 34 27 33 26 74 55 61 310 0.1 same level involving ice and snow 23 40 23 20 47 29 20 202 0.1 fracture unspecified, reclassified from X59 3,560 3,804 4,324 4,226 4,396 4,075 4,252 28,637 10.2 unspecified fall 8,466 10,051 10,786 10,294 10,273 11,144 12,081 73,095 25.9 ALL 34,286 36,692 39,187 40,618 41,545 43,325 46,119 281,772 100 * note X59
Location (broad)
Hospital admitted falls by location of injury occurrence, Victoria 1998/9-2004/5
98/99 99/00 00/01 01/02 02/03 03/04 04/05 ALL % Home 11,790 11,947 12,098 13,402 13,288 14,367 15,166 92,058 32.7 School, public buildings 2,212 2,856 4,860 5,102 4,284 4,307 4,112 27,733 9.8 Residential Institution 2,757 2,920 2,335 2,347 3,868 4,704 4,942 23,873 8.5 Sports & athletic areas 1,852 1,853 1,690 1,689 1,737 1,620 1,876 12,317 4.4 Road, street & highway 1,212 1,316 1,410 1,602 1,592 1,536 1,617 10,285 3.7 Trade & service area 891 982 1,113 1,162 1,163 1,189 1,323 7,823 2.8 Industrial & construction area 379 359 344 252 273 285 252 2,144 0.8 Farm 75 89 94 87 100 91 101 637 0.2 Other specified places 1,240 1,231 1,365 1,248 1,107 1,138 1,130 8,459 3.0 Unspecified places 11,878 13,139 13,878 13,727 14,133 14,088 15,600 96,443 34.2 ALL 34,286 36,692 39,187 40,618 41,545 43,325 46,119 281,772 100.0

210 MONASH UNIVERSITY ACCIDENT RESEARCH CENTRE
Location final three years (more specific)
Hospital admitted falls by specific location of injury occurrence, Victoria 2002/3-2004/5
02/03 03/04 04/05 ALL % Driveway to home 194 186 199 579 0.4 Other and unspecified place in home 13,094 14,181 14,967 42,242 32.2 Residential institution prison 15 15 18 48 0.0 Residential institution juvenile detention centre 0 * * * * Residential institution, military camp * 0 * * * Residential institution, orphanage 0 * * * * Residential inst aged care facilities 3,675 4,502 4,716 12,893 9.8 Other specified residential institution 154 144 159 457 0.3 Unspecified residential institution 23 41 43 107 0.1 School 1,213 1,165 1,297 3,675 2.8 Health service area 2,814 2,960 2,611 8,385 6.4 Other specified institution & public admin area 262 182 204 648 0.5 Sporting grounds-outdoor 1,050 954 1,126 3,130 2.4 Sporting hall-indoor 194 218 202 614 0.5 Swimming centre 27 35 35 97 0.1 Racetrack and racecourse 21 19 23 63 0.0 Equestrian facility * * * * * Sports and athletics area, skating rink 76 70 75 221 0.2 Sports and athletics area, skiing 171 155 204 530 0.4 Other spec sports & athletics area 83 79 90 252 0.2 Sports and athletics area, unspecified 113 89 120 322 0.2 Street & highway roadway 312 356 390 1,058 0.8 Street & highway, sidewalk 1,139 1,087 1,122 3,348 2.6 Street & highway cycleway * * * 7 0.0 Other specified public highway, street, road 56 40 58 154 0.1 Unspecified public highway street road 82 52 44 178 0.1 Trade and service area, shop and store 546 559 603 1,708 1.3 Trade service area commercial garage 18 16 25 59 0.0 Trade and service area, office building 10 18 22 50 0.0 Trade service area café hotel restaurant 401 391 433 1,225 0.9 Other specified trade and service area 162 166 212 540 0.4 Unspecified trade and service area 26 39 28 93 0.1 Construct area 127 132 104 363 0.3 Industrial & construction area demolition site * * * 5 0.0 Industrial & construction area factory & plant 71 70 80 221 0.2 Industrial & construction area mine & quarry * 5 * 10 0.0 Industrial & construction area oil gas extraction * 0 * * * Industrial & construction area shipyard 8 * * 12 0.0 Industrial & construction area power station * 0 0 * * Other specified industrial & construction area 20 23 15 58 0.0 Unspecified industrial & construction area 39 52 42 133 0.1 Farm 100 91 101 292 0.2 Area of still water 24 19 23 66 0.1 Stream of water 41 53 49 143 0.1 Large area of water 36 50 52 138 0.1 Beach 90 82 97 269 0.2 Forest 33 29 25 87 0.1 Desert 0 0 * * * Other specified countryside 122 150 112 384 0.3 Parking lot 84 63 71 218 0.2 Other specified place of occurrence 677 692 700 2,069 1.6 Unspecified place of occurrence 14,128 14,088 15,600 43,836 33.5 41,545 43,325 46,119 130,989 100.0

RELATIONSHIP BETWEEN SLIPS, TRIPS & FALLS & THE DESIGN & CONSTRUCTION OF BUILDINGS 211
Overview of hospital admitted falls occurring in buildings, Victoria 2002/3-2004/5
Following data have been selected according to instructions from ABCB. Instructions were to exclude the following locations: driveway to home, sporting grounds-outdoor, swimming centre, racetrack and racecourse, equestrian facility, sports and athletics area skating rink, sports and athletics area skiing, other specified sports & athletics area, sports and athletics area unspecified, street & highway roadway, street & highway sidewalk, street & highway cycleway, other specified public highway, street, road, unspecified public highway street road, unspecified trade and service area, construct area, industrial & construction area demolition site, industrial & construction area mine & quarry, industrial & construction area oil gas extraction, industrial & construction area shipyard, industrial & construction area power station, industrial & construction area factory and plant, other specified industrial & construction area, unspecified industrial & construction area, farm, area of still water, stream of water, large area of water, beach, forest, desert, other specified countryside, parking lot, other specified place of occurrence, unspecified place of occurrence.
Falls from cliffs, playground equipment, trees, ice/skates/skis/roller-skates/skateboards, on and from scaffolding, diving or jumping into water and same level ice and snow have also been excluded.
Location
Hospital admitted falls by specific location of injury occurrence, Victoria 2002/3-2004/5
02/03 03/04 04/05 ALL % Other and unspecified place in home 12885 13954 14768 41607 59.2 Residential institution prison 15 15 18 48 0.1 Residential institution, juvenile detention centre 0 * * * * Residential institution, military camp * 0 * * * Residential institution, orphanage 0 * * * * Residential institution, aged care facilities 3675 4500 4713 12888 18.3 Other specified residential institution 153 142 159 454 0.6 Unspecified residential institution 23 41 43 107 0.2 School 670 676 726 2072 2.9 Health service area 2812 2956 2605 8373 11.9 Other specified institution & public administration area 253 173 200 626 0.9 Sporting hall-indoor 188 205 198 591 0.8 Trade and service area, shop and store 543 555 597 1695 2.4 Trade service area commercial garage 18 16 25 59 0.1 Trade and service area, office building 10 18 22 50 0.1 Trade service area café hotel restaurant 381 383 426 1190 1.7 Other specified trade and service area 161 164 211 536 0.8 21788 23800 24717 70305 100.0

212 MONASH UNIVERSITY ACCIDENT RESEARCH CENTRE
Cause
Hospital admitted falls by specific cause, Victoria 2002/3-2004/5
02/03 03/04 04/05 ALL % same level from slipping, tripping, stumbling 27.6
slip 2018 2073 2241 6332 9.0 trip 3161 3744 3891 10796 15.4
stumble 793 698 818 2309 3.3 other fall on same level 4027 4494 4669 13190 18.8 involving bed 1527 1614 1582 4723 6.7 on and from stairs and steps 1224 1224 1338 3786 5.4 involving chair 845 922 922 2689 3.8 on and from ladder 492 543 562 1597 2.3 other fall from one level to another 365 372 414 1151 1.6 from, out of or through building or structure 383 371 375 1129 1.6 on same level -collision with or pushing by other person 202 229 203 634 0.9 involving other furniture 181 209 197 587 0.8 involving wheelchair 127 128 153 408 0.6 while being carried or supported by other persons 56 53 48 157 0.2 fracture unspecified, reclassified from X59 6034 6795 7073 19902 28.3 unspecified fall 353 331 231 915 1.3 21788 23800 24717 70305 100.0 Note: Admissions originally classified to X59 (exposure to unspecified factor) are classified as ‘falls’ rather than ‘other unintentional’ if they have at least one injury diagnosis coded as a ‘fracture’.

RELATIONSHIP BETWEEN SLIPS, TRIPS & FALLS & THE DESIGN & CONSTRUCTION OF BUILDINGS 213
Detailed analysis of final set
Trend
Age groups
Co-morbidity
The New Zealand research group (Cryer et al.) used a threat-to-life severity scale when defining a serious injury and only included hospitalisations with an International Classification of Diseases-based Injury Severity Score (ICISS) of less than or equal to 0.941 (i.e. a probability of death at admission of at least 5.9%).
Serious injury definition for this table is based on ICISS score and Cryer’s definition of what a serious injury is.
02/03 03/04 04/05 ALL %
Gender male 7560 8207 8665 24432 34.8 female 14228 15593 16052 45873 65.2 21788 23800 24717 70305 100.0 Age group 0-4yrs 684 688 757 2129 3.0 5-9yrs 542 527 564 1633 2.3 10-14yrs 442 453 469 1364 1.9 15-19yrs 210 263 238 711 1.0 20-24yrs 214 239 224 677 1.0 25-29yrs 241 232 256 729 1.0 30-34yrs 274 306 344 924 1.3 35-39yrs 304 345 339 988 1.4 40-44yrs 361 408 408 1177 1.7 45-49yrs 451 466 516 1433 2.0 50-54yrs 538 590 559 1687 2.4 55-59yrs 651 744 764 2159 3.1 60-64yrs 758 804 875 2437 3.5 65-69yrs 1037 1076 1164 3277 4.7 70-74yrs 1608 1755 1763 5126 7.3 75-79yrs 2900 3096 3243 9239 13.1 80-84yrs 3819 4366 4647 12832 18.3 85+ yrs 6754 7442 7587 21783 31.0 21788 23800 24717 70305 100.0 Broad body region head/face/neck 4980 5345 5698 16023 22.8 trunk 3145 3428 3679 10252 14.6 upper extremity 4719 5112 5261 15092 21.5 lower extremity 8318 9157 9376 26851 38.2 multiple body regions 18 21 13 52 0.1 body region not relevant 95 125 109 329 0.5 unspecified body region 150 181 145 476 0.7 missing body region 363 431 436 1230 1.7 21788 23800 24717 70305 100.0 Detailed body region head 4731 4996 5319 15046 21.4 neck 248 349 377 974 1.4 thorax 1084 1262 1331 3677 5.2 abdomen, lowerback, lumbar spine & pelvis 2061 2165 2348 6574 9.4 shoulder & upper arm 1972 2157 2130 6259 8.9 elbow & forearm 2281 2416 2565 7262 10.3 wrist & hand 465 539 563 1567 2.2 hip & thigh 5676 6236 6433 18345 26.1 knee & lower leg 2251 2449 2469 7169 10.2 ankle & foot 391 471 473 1335 1.9 multiple body regions 18 21 13 52 0.1

214 MONASH UNIVERSITY ACCIDENT RESEARCH CENTRE
02/03 03/04 04/05 ALL % unspecified body region 150 181 145 476 0.7 body region not relevant 95 125 109 329 0.5 missing injury code 365 433 442 1240 1.7 21788 23800 24717 70305 100.0 Injury type superficial injury 2007 2068 2132 6207 8.8 open wound 3021 3299 3495 9815 14.0 eye injury- excl foreign body 69 71 71 211 0.3 intracranial injury 865 924 992 2781 4.0 injury to internal organs 81 111 101 293 0.4 burns * * 6 10 0.0 poisoning- drugs, medicaments & bio subs * * 0 * * toxic effects- subs nonmedicinal * 0 0 * * other & unspec effects of ext causes 7 12 10 29 0.0 early and other complications of trauma 57 69 81 207 0.3 fracture 11713 12819 13340 37872 53.9 sequelae of injuries, poisoning & ext cause * 8 * 12 0.0 dislocation, sprain & strain 688 782 769 2239 3.2 injury to nerves & spinal cord 68 72 62 202 0.3 injury to blood vessels 5 11 22 38 0.1 injury to muscle & tendon 148 185 195 528 0.8 crushing injury 0 * * 5 0.0 traumatic amputation 5 * 5 14 0.0 other & unspecified injury 2658 2895 2978 8531 12.1 missing injury code 363 431 436 1230 1.7 21788 23800 24717 70305 100.0 Location Home 12885 13954 14768 41607 59.2 Residential Institution 3867 4700 4939 13506 19.2 School, public buildings 3730 3805 3531 11066 15.7 Sports & athletic areas 188 205 198 591 0.8 Trade & service area 1113 1136 1281 3530 5.0 Legal intervention & medical cause codes 5 0 0 5 0.0 21788 23800 24717 70305 100.0 Detailed location Other and unspecified place in home 12885 13954 14768 41607 59.2 Residential institution prison 15 15 18 48 0.1 Residential inst juvnle detention centre 0 * * * * Residential institution, military camp * 0 * * * Residential institution, orphanage 0 * * * * Residential inst aged care facilities 3675 4500 4713 12888 18.3 Other specified residential institution 153 142 159 454 0.6 Unspecified residential institution 23 41 43 107 0.2 School 670 676 726 2072 2.9 Health service area 2812 2956 2605 8373 11.9 Oth spec institution & public admin area 253 173 200 626 0.9 Sporting hall-indoor 188 205 198 591 0.8 Trade and service area, shop and store 543 555 597 1695 2.4 Trade service area commercial garage 18 16 25 59 0.1 Trade and service area, office building 10 18 22 50 0.1 Trade service area café hotel restaurant 381 383 426 1190 1.7 Other specified trade and service area 161 164 211 536 0.8 21788 23800 24717 70305 100.0 Length of stay < 2 days 8200 8276 8701 25177 35.8 2-7 days 5954 6449 6582 18985 27.0 8-30 days 6453 7308 7873 21634 30.8 31+ days 1181 1767 1561 4509 6.4 21788 23800 24717 70305 100.0 Severity of injury serious injury 6712 7555 7907 22174 31.5 non-serious injury 15076 16245 16810 48131 68.5 21788 23800 24717 70305 100.0

RELATIONSHIP BETWEEN SLIPS, TRIPS & FALLS & THE DESIGN & CONSTRUCTION OF BUILDINGS 215
STAIRS AND STEPS
Trend
Age group rates
Co-morbidity
02/03 03/04 04/05 ALL %
Gender male 428 407 470 1305 34.5 female 796 817 868 2481 65.5 1224 1224 1338 3786 100.0 Age group 0-4yrs 47 24 35 106 2.8 5-9yrs 21 21 18 60 1.6 10-14yrs 20 19 8 47 1.2 15-19yrs 17 26 11 54 1.4 20-24yrs 27 27 27 81 2.1 25-29yrs 22 38 28 88 2.3 30-34yrs 30 29 46 105 2.8 35-39yrs 33 31 42 106 2.8 40-44yrs 48 52 62 162 4.3 45-49yrs 55 55 64 174 4.6 50-54yrs 52 71 48 171 4.5 55-59yrs 73 73 98 244 6.4 60-64yrs 72 67 66 205 5.4 65-69yrs 68 85 97 250 6.6 70-74yrs 105 110 114 329 8.7 75-79yrs 166 151 165 482 12.7 80-84yrs 176 158 189 523 13.8 85+ yrs 192 187 220 599 15.8 1224 1224 1338 3786 100.0 Broad body region head/face/neck 280 261 339 880 23.2 trunk 156 161 146 463 12.2 upper extremity 260 250 294 804 21.2 lower extremity 510 530 542 1582 41.8 multiple body regions * * * * * body region not relevant * * * 5 0.1 unspecified body region * * * 8 0.2 missing body region 14 15 12 41 1.1 1224 1224 1338 3786 100.0 Detailed body region head 264 228 308 800 21.1 neck 16 33 31 80 2.1 thorax 44 48 53 145 3.8 abdomen, lowerback, lumbar spine & pelvis 112 113 93 318 8.4 shoulder & upper arm 118 107 112 337 8.9 elbow & forearm 125 117 149 391 10.3 wrist & hand 17 26 33 76 2.0 hip & thigh 215 210 237 662 17.5 knee & lower leg 253 281 243 777 20.5 ankle & foot 42 39 62 143 3.8 multiple body regions * * * * * unspecified body region * * * 8 0.2 body region not relevant * * * 5 0.1 missing injury code 14 15 12 41 1.1 1224 1224 1338 3786 100.0 Injury type superficial injury 76 69 81 226 6.0 open wound 130 136 156 422 11.1 eye injury- excl foreign body * * * * * intracranial injury 86 83 105 274 7.2 injury to internal organs * 8 7 18 0.5

216 MONASH UNIVERSITY ACCIDENT RESEARCH CENTRE
02/03 03/04 04/05 ALL % early and other complications of trauma * * * * * fracture 702 723 766 2191 57.9 sequelae of injuries, poisoning & ext cause 0 * 0 * * dislocation, sprain & strain 51 51 50 152 4.0 injury to nerves & spinal cord * * 5 9 0.2 injury to blood vessels 0 0 * * * injury to muscle & tendon 13 13 17 43 1.1 traumatic amputation * 0 0 * * other & unspecified injury 142 121 135 398 10.5 missing injury code 14 15 12 41 1.1 1224 1224 1338 3786 100.0 Location Home 899 928 990 2817 74.4 Residential Institution 24 28 30 82 2.2 School, public buildings 123 73 100 296 7.8 Sports & athletic areas 0 5 * 8 0.2 Trade & service area 177 190 215 582 15.4 Legal intervention & medical cause codes * 0 0 * 1224 1224 1338 3786 100.0 Detailed location Other and unspecified place in home 899 928 990 2817 74.4 Residential institution prison * 0 * * * Residential inst aged care facilities 19 22 23 64 1.7 Other specified residential institution * * 5 12 0.3 Unspecified residential institution 0 * 0 * * School 48 35 29 112 3.0 Health service area 31 15 23 69 1.8 Oth spec institution & public admin area 45 23 48 116 3.1 Sporting hall-indoor 0 5 * 8 0.2 Trade and service area, shop and store 50 59 61 170 4.5 Trade service area commercial garage * * * * * Trade and service area, office building * * 7 12 0.3 Trade service area café hotel restaurant 82 92 95 269 7.1 Other specified trade and service area 41 36 50 127 3.4 1224 1224 1338 3786 100.0 Length of stay < 2 days 568 527 576 1671 44.1 2-7 days 362 384 392 1138 30.1 8-30 days 267 274 327 868 22.9 31+ days 27 39 43 109 2.9 1224 1224 1338 3786 100.0 Severity of injury serious injury 321 329 373 1023.0 27.0 non-serious injury 903 895 965 2763.0 73.0 1224 1224 1338 3786 100.0

RELATIONSHIP BETWEEN SLIPS, TRIPS & FALLS & THE DESIGN & CONSTRUCTION OF BUILDINGS 217
HOME
Trend
Age group rates
Severity
Co-morbidity
02/03 03/04 04/05 ALL %
Gender male 4390 4714 5050 14154 34.0 female 8495 9240 9718 27453 66.0 12885 13954 14768 41607 100.0 Age group 0-4yrs 566 590 630 1786 4.3 5-9yrs 266 270 266 802 1.9 10-14yrs 94 125 115 334 0.8 15-19yrs 77 100 97 274 0.7 20-24yrs 116 126 114 356 0.9 25-29yrs 149 153 151 453 1.1 30-34yrs 181 195 224 600 1.4 35-39yrs 205 252 229 686 1.6 40-44yrs 246 290 278 814 2.0 45-49yrs 304 346 373 1023 2.5 50-54yrs 391 419 405 1215 2.9 55-59yrs 495 565 557 1617 3.9 60-64yrs 570 590 627 1787 4.3 65-69yrs 716 758 849 2323 5.6 70-74yrs 1092 1190 1201 3483 8.4 75-79yrs 1849 1928 2127 5904 14.2 80-84yrs 2236 2565 2777 7578 18.2 85+ yrs 3332 3492 3748 10572 25.4 12885 13954 14768 41607 100.0 Broad body region head/face/neck 2701 2754 3067 8522 20.5 trunk 2155 2332 2500 6987 16.8 upper extremity 2829 3084 3113 9026 21.7 lower extremity 4859 5388 5675 15922 38.3 multiple body regions 11 10 5 26 0.1 body region not relevant 68 85 91 244 0.6 unspecified body region 73 86 82 241 0.6 missing body region 189 215 235 639 1.5 12885 13954 14768 41607 100.0 Detailed body region head 2550 2525 2798 7873 18.9 neck 151 229 268 648 1.6 thorax 778 933 976 2687 6.5 abdomen, lowerback, lumbar spine & pelvis 1377 1398 1524 4299 10.3 shoulder & upper arm 1267 1373 1376 4016 9.7 elbow & forearm 1301 1434 1452 4187 10.1 wrist & hand 260 277 283 820 2.0 hip & thigh 3129 3397 3635 10161 24.4 knee & lower leg 1460 1658 1707 4825 11.6 ankle & foot 270 332 332 934 2.2 multiple body regions 11 10 5 26 0.1 unspecified body region 73 86 82 241 0.6 body region not relevant 68 85 91 244 0.6 missing injury code 190 217 239 646 1.6 12885 13954 14768 41607 100.0 Injury type superficial injury 982 951 993 2926 7.0 open wound 1531 1633 1822 4986 12.0 eye injury- excl foreign body 48 37 32 117 0.3

218 MONASH UNIVERSITY ACCIDENT RESEARCH CENTRE
02/03 03/04 04/05 ALL % intracranial injury 535 542 605 1682 4.0 injury to internal organs 67 85 82 234 0.6 burns * * * 7 0.0 poisoning- drugs, medicaments & bio subs * * 0 * * toxic effects- subs nonmedicinal * 0 0 * * other & unspec effects of ext causes 7 10 9 26 0.1 early and other complications of trauma 48 59 72 179 0.4 fracture 7336 8032 8504 23872 57.4 complications of surgical & med care NEC 9 10 9 28 0.1 sequelae of injuries, poisoning & ext cause * * * 7 0.0 dislocation, sprain & strain 458 508 494 1460 3.5 injury to nerves & spinal cord 55 60 49 164 0.4 injury to blood vessels 4 11 14 29 0.1 injury to muscle & tendon 94 132 128 354 0.9 crushing injury 0 * * * * traumatic amputation 5 * * 11 0.0 other & unspecified injury 1512 1658 1708 4878 11.7 missing injury code 189 215 235 639 1.5 12885 13954 14768 41607 100.0 Length of stay < 2 days 4899 5010 5183 15092 36.3 2-7 days 3705 3981 4160 11846 28.5 8-30 days 3815 4201 4659 12675 30.5 31+ days 466 762 766 1994 4.8 12885 13954 14768 41607 100.0 Severity of injury serious injury 4007 4327 4770 13104 31.5 non-serious injury 8878 9627 9998 28503 68.5 12885 13954 14768 41607 100.0

RELATIONSHIP BETWEEN SLIPS, TRIPS & FALLS & THE DESIGN & CONSTRUCTION OF BUILDINGS 219
AGED CARE
Trend
Age group rates
Severity
Co-morbidity
02/03 03/04 04/05 ALL %
Gender male 817 1033 1145 2995 23.2 female 2858 3467 3568 9893 76.8 3675 4500 4713 12888 100.0 Age group 5-9yrs 0 * 0 * * 10-14yrs 0 0 * * * 20-24yrs 0 0 * * * 25-29yrs 0 0 * * * 30-34yrs * * 0 * * 35-39yrs * * * 7 0.1 40-44yrs * * * 9 0.1 45-49yrs 7 7 9 23 0.2 50-54yrs 9 9 9 27 0.2 55-59yrs 17 16 17 50 0.4 60-64yrs 21 36 37 94 0.7 65-69yrs 67 70 66 203 1.6 70-74yrs 138 166 191 495 3.8 75-79yrs 345 477 497 1319 10.2 80-84yrs 802 952 1032 2786 21.6 85+ yrs 2264 2759 2842 7865 61.0 3675 4500 4713 12888 100.0 Broad body region head/face/neck 736 881 984 2601 20.2 trunk 494 591 690 1775 13.8 upper extremity 506 628 688 1822 14.1 lower extremity 1863 2293 2267 6423 49.8 multiple body regions * * * 6 0.0 body region not relevant 6 11 7 24 0.2 unspecified body region 18 24 20 62 0.5 missing body region 51 68 56 175 1.4 3675 4500 4713 12888 100.0 Detailed body region head 707 847 941 2495 19.4 neck 28 34 42 104 0.8 thorax 135 160 191 486 3.8 abdomen, lowerback, lumbar spine & pelvis 359 431 499 1289 10.0 shoulder & upper arm 256 359 346 961 7.5 elbow & forearm 209 220 273 702 5.4 wrist & hand 41 49 69 159 1.2 hip & thigh 1601 1990 1977 5568 43.2 knee & lower leg 231 266 257 754 5.9 ankle & foot 31 37 33 101 0.8 multiple body regions * * * 6 0.0 unspecified body region 18 24 20 62 0.5 body region not relevant 6 11 7 24 0.2 missing injury code 52 68 47 177 1.4 3675 4500 4713 12888 100.0 Injury type superficial injury 328 382 401 1111 8.6 open wound 541 586 658 1785 13.9 eye injury- excl foreign body 10 17 18 45 0.3 intracranial injury 77 103 120 300 2.3 burns * 0 * * *

220 MONASH UNIVERSITY ACCIDENT RESEARCH CENTRE
02/03 03/04 04/05 ALL % early and other complications of trauma 5 5 5 15 0.1 fracture 2088 2579 2670 7337 56.9 complications of surgical & med care NEC * 6 * 9 0.1 dislocation, sprain & strain 53 94 80 227 1.8 injury to nerves & spinal cord * * * 11 0.1 injury to blood vessels * 0 * * * injury to muscle & tendon 14 7 21 42 0.3 traumatic amputation 0 * 0 * * other & unspecified injury 495 639 671 1805 14.0 missing injury code 51 68 56 175 1.4 3675 4500 4713 12888 100.0 Length of stay < 2 days 1423 1557 1678 4658 36.1 2-7 days 1021 1291 1294 3606 28.0 8-30 days 1083 1377 1529 3989 31.0 31+ days 148 275 212 635 4.9 3675 4500 4713 12888 100.0 Severity of injury serious injury 1600 2080 2123 5803 45.0 non-serious injury 2075 2420 2590 7085 55.0 3675 4500 4713 12888 100.0

RELATIONSHIP BETWEEN SLIPS, TRIPS & FALLS & THE DESIGN & CONSTRUCTION OF BUILDINGS 221
BEDS
Trend
Age group rates
Severity
Co-morbidity
02/03 03/04 04/05 ALL %
Gender male 599 624 603 1826 38.7 female 928 990 979 2897 61.3 1527 1614 1582 4723 100.0 Age group 0-4yrs 116 115 106 337 7.1 5-9yrs 58 61 50 169 3.6 10-14yrs 14 16 15 45 1.0 15-19yrs 6 * 6 14 0.3 20-24yrs 5 7 10 22 0.5 25-29yrs 5 5 12 22 0.5 30-34yrs 7 13 8 28 0.6 35-39yrs 12 9 8 29 0.6 40-44yrs 11 11 11 33 0.7 45-49yrs 15 10 16 41 0.9 50-54yrs 25 20 20 65 1.4 55-59yrs 27 32 30 89 1.9 60-64yrs 31 38 40 109 2.3 65-69yrs 53 58 45 156 3.3 70-74yrs 86 98 112 296 6.3 75-79yrs 169 214 194 577 12.2 80-84yrs 300 309 300 909 19.2 85+ yrs 587 596 599 1782 37.7 1527 1614 1582 4723 100.0 Broad body region head/face/neck 457 441 427 1325 28.1 trunk 181 184 242 607 12.9 upper extremity 331 331 304 966 20.5 lower extremity 496 570 540 1606 34.0 multiple body regions * * * 7 0.1 body region not relevant * 14 8 24 0.5 unspecified body region 22 22 10 54 1.1 missing body region 35 49 50 134 2.8 1527 1614 1582 4723 100.0 Detailed body region head 435 406 393 1234 26.1 neck 22 35 34 91 1.9 thorax 70 62 73 205 4.3 abdomen, lowerback, lumbar spine & pelvis 111 122 169 402 8.5 shoulder & upper arm 142 142 116 400 8.5 elbow & forearm 163 157 155 475 10.1 wrist & hand 26 32 33 91 1.9 hip & thigh 365 442 391 1198 25.4 knee & lower leg 109 109 123 341 7.2 ankle & foot 22 19 25 66 1.4 multiple body regions * * * 7 0.1 unspecified body region 22 22 10 54 1.1 body region not relevant * 14 9 25 0.5 missing injury code 35 49 50 134 2.8 1527 1614 1582 4723 100.0 Injury type superficial injury 209 210 193 612 13.0 open wound 291 300 303 894 18.9 eye injury- excl foreign body * 5 6 13 0.3

222 MONASH UNIVERSITY ACCIDENT RESEARCH CENTRE
02/03 03/04 04/05 ALL % intracranial injury 55 45 33 133 2.8 injury to internal organs 5 * * 9 0.2 burns 0 0 * * * other & unspec effects of ext causes 0 * 0 * * early and other complications of trauma * 8 7 16 0.3 fracture 645 682 650 1977 41.9 complications of surgical & med care NEC * * * * * sequelae of injuries, poisoning & ext cause 0 * 0 * * dislocation, sprain & strain 36 41 42 119 2.5 injury to nerves & spinal cord * 5 5 13 0.3 injury to blood vessels 0 0 * * * injury to muscle & tendon 7 11 7 25 0.5 other & unspecified injury 237 250 281 768 16.3 missing injury code 35 49 50 134 2.8 1527 1614 1582 4723 100.0 Location 659 699 697 2055 43.5 Home 389 457 479 1325 28.1 Residential Institution 475 454 406 1335 28.3 School, public buildings 0 * 0 * * Sports & athletic areas * * 0 7 0.1 Trade & service area 1527 1614 1582 4723 100.0 Detailed location 659 699 697 2055 43.5 Other and unspecified place in home * * * 5 0.1 Residential institution prison 0 0 * * * Residential inst juvnle detention centre * 0 0 * * Residential institution, military camp 375 446 461 1282 27.1 Residential inst aged care facilities 11 6 16 33 0.7 Other specified residential institution 0 * 0 * * Unspecified residential institution * * 0 * * School 459 449 404 1312 27.8 Health service area 14 * * 19 0.4 Oth spec institution & public admin area 0 * 0 * * Sporting hall-indoor * 0 0 * * Trade and service area, shop and store * * 0 * * Trade service area café hotel restaurant * * 0 * * Other specified trade and service area 1527 1614 1582 4723 100.0 Length of stay 572 525 546 1643 34.8 < 2 days 362 396 383 1141 24.2 2-7 days 465 535 541 1541 32.6 8-30 days 128 158 112 398 8.4 31+ days 1527 1614 1582 4723 100.0 Severity of injury 405 459 407 1271 26.9 serious injury 1122 1155 1175 3452 73.1 non-serious injury 1527 1614 1582 4723 100.0

RELATIONSHIP BETWEEN SLIPS, TRIPS & FALLS & THE DESIGN & CONSTRUCTION OF BUILDINGS 223
APPENDIX 5 EXPERT PANEL
Brian Ashe (Manager, Major Projects and Research, ABCB - Chair)
Ivan Donaldson (General Manager, ABCB)
Megumi Hata (Project Officer, ABCB)
Neil Evans (National Director, Technical and Regulatory Policy, Master Builders Australia)
David Hallett (General Manager, Business Development & Delivery Archicentre)
Tom Fisher (Federal Safety Commissioner, Office of the Federal Safety Commissioner)
Andrea Novak (Office of the Federal Safety Commissioner)
Rod Johnson (Association of Consulting Engineers/Electronic Blueprint)
Ken Gordon (Building Designers Association of Australia)
Stephen Greenwood (Assistant Director Technical Services, Housing Industry Association)
Joan Ozanne-Smith (Principal Research Fellow, MUARC)
Jonathon Guy (Research Assistant, MUARC)
Mary Kelly (Public Health Trainee, MUARC