the relationship between perfectionism and multidimensional life satisfaction among croatian and...
TRANSCRIPT

www.elsevier.com/locate/paid
Personality and Individual Differences 39 (2005) 155–166
The relationship between perfectionism andmultidimensional life satisfaction among
Croatian and American youth
Rich Gilman a,*, Jeffrey S. Ashby b, Dina Sverko c, Dan Florell d, Kristen Varjas b
a Department of Educational and Counseling Psychology, 245 Dickey Hall, College of Education,
University of Kentucky, Lexington, KY 40503, USAb Georgia State University, USAc University of Zagreb, Croatia
d Eastern Kentucky University, USA
Received 24 November 2003; received in revised form 28 August 2004; accepted 13 December 2004
Available online 3 February 2005
Abstract
Although much research investigating multidimensional perfectionism has been conducted among adults
from various cultures, little is known of the cross-cultural manifestation of perfectionism among school-age
youth. In addition, no cross-cultural studies have compared the perceived life quality of youth identified as
adaptive perfectionists (i.e., high personal standards but low distress when the standards are not met), mal-
adaptive perfectionists (i.e., high personal standards, high distress), and non-perfectionists (i.e., significantly
lower personal standards). In this study, Croatian youth completed the Almost Perfect Scale-Revised and
the Multidimensional Students� Life Satisfaction Scale. Reports from this group were compared to a group
of American youth. Results found differential predictive values of personal standards and discrepancyacross satisfaction domains for both groups. Further, adaptive perfectionists reported significantly higher
satisfaction across many life domains for both groups than maladaptive perfectionists and non-perfection-
ists. Males and females reported statistically equivalent satisfaction levels across most life domains-with the
exception of friendship satisfaction. Implications of these findings and suggestions for future research con-
clude the paper.
� 2005 Elsevier Ltd. All rights reserved.
0191-8869/$ - see front matter � 2005 Elsevier Ltd. All rights reserved.
doi:10.1016/j.paid.2004.12.014
* Corresponding author.
E-mail address: [email protected] (R. Gilman).

156 R. Gilman et al. / Personality and Individual Differences 39 (2005) 155–166
Keywords: Multidimensional perfectionism; Life satisfaction; Youth; Cross-cultural
1. Introduction
Although a precise definition of perfectionism remains elusive, the setting of especially high per-sonal standards is a universally accepted characteristic (Flett & Hewitt, 2002). Historically, per-fectionism has been conceptualized as a unidimensional construct with some authors viewingperfectionism as synonymous with psychological distress (e.g., Ellis, 1962; Missildine, 1963).Conversely, other authors believed that having high personal standards was necessary for positivemental health (e.g., Adler, 1956). To reconcile these disparate views, Hamachek (1978) proposeda multidimensional model of perfectionism consisting of two separate but related subtypes.Normal perfectionists are individuals who report excessively high standards but neverthelessaccept the fact that these standards will not always be attained. In contrast, neurotic perfection-ists set similarly high standards but have difficulty accepting instances when their standards can-not be accomplished. Individuals in this latter group often find it difficult to feel satisfied withthemselves or their performance and are often driven by the fear of failure more than the desireto succeed.
Empirical studies among adults have supported Hamachek�s (1978) conceptualization. Forexample, normal (or adaptive) perfectionism has been significantly and positively related toself-esteem (Ashby & Rice, 2002), internal locus of control (Perisamy & Ashby, 2002), and posi-tive affect (Rice & Mirzadeh, 2000). Conversely, neurotic (or maladaptive) perfectionism has beensignificantly related to depression (Bieling, Israeli, & Antony, 2004) and anxiety (Kawamura,Hunt, Frost, & DiBartolo, 2001).
Although extant findings have effectively challenged the view that perfectionism is unilaterallypathological, the majority of research continues to focus on maladaptive cognitions (Slaney, Rice,& Ashby, 2002). Very little research has investigated how the dimensions of perfectionism maycontribute to positive psychological well-being, or life satisfaction (Bieling et al., 2004; Chang,2000). Life satisfaction is defined as an individual�s conscious, cognitive appraisal of the qualityof his or her life (Headey & Wearing, 1992) and may reflect a global (i.e., overall) appraisal aswell as appraisals within specific life domains (e.g., family, self). Given that multidimensional lifesatisfaction reports are differentially related to a number of important psychological states andbehaviors, including depression (Lewinsohn, Redner, & Seeley, 1991), self-esteem (Arrindell, Hee-sink, & Feij, 1999), and hope (Chang, 2003), the construct is considered to be a key indicator of anindividuals� successful adaptation to changes in life circumstances (Diener, Suh, Lucas, & Smith,1999).
Goal striving is one such circumstance that is significantly and positively related to life satisfac-tion reports (Diener, 2000), with these reports varying depending upon how well an individual canadapt to instances when goals cannot be attained (Emmons, 1986). Such findings are salient toperfectionistic individuals. That is, considering their cognitive flexibility adaptive perfectionistsmay report significantly higher life satisfaction than their maladaptive perfectionistic peers. Assupport for this hypothesis, Chang, Watkins, and Banks (2004) found that college students iden-tified as adaptive perfectionists reported significantly higher global life satisfaction than maladap-
R. Gilman et al. / Personality and Individual Differences 39 (2005) 155–166 157
tive perfectionists. However, only global satisfaction was assessed in that study. Given that per-fectionism can be manifested across a number of life domains (Flett & Hewitt, 2002), additionalresearch is necessary to determine how multidimensional life satisfaction may differ with respect toadaptive and maladaptive subtypes.
School-aged youth were the group of interest in this study considering the overall sense of com-petitiveness stressed in many schools that has lead to a shift in perfectionistic thinking (Rice &Preusser, 2002). As Brown et al. (1999) noted, the prospect of evaluation is a ubiquitous experi-ence for youth, and these prolonged and repeated experiences may lead to different perceptions oflife quality among youth who establish high personal standards. Unfortunately, very little isknown of how youth identified as either adaptive or maladaptive perfectionists perceive their lifesatisfaction across various domains. Further, these perceptions may be fundamentally differentfrom youth who report comparatively lower personal standards (i.e., non-perfectionists), as hasbeen documented among adult samples (Slaney et al., 2002). A recent study (Gilman & Ashby,2003) found that adaptive perfectionists reported higher self-satisfaction than maladaptive perfec-tionists. Further, both perfectionistic groups reported higher self-satisfaction than non-perfection-ists, suggesting that setting high standards maintains a level of self-worth that transcends distresswhen such standards are not met. Nevertheless, the Gilman and Ashby (2003) study is the onlypublished study to date on this topic. Additional research is necessary to understand how perfec-tionistic subtypes may differentially report multidimensional life satisfaction, as well as to inves-tigate unexplored but important areas.
One unexplored area focuses on cultural experiences and their influence on perceptions of lifequality. While some research has reported cross-cultural differences in both life satisfaction (e.g.,Park, Huebner, Laughlin, Valois, & Gilman, 2004) and perfectionism constructs among youth(Parker, Portesova, & Stumpf, 2001), cross-cultural studies have yet to investigate how multidi-mensional life satisfaction may differ across perfectionism subtypes. Further, although studieshave investigated gender differences in perfectionism, most have investigated this relationshipwithin the larger context of clinical syndromes such as eating disorders (Sherry, Hewitt, Besser,McGee, & Flett, 2004) and suicide risk (Gould, King, & Greenwald, 1998), or have utilized highlyspecific samples such as gifted youth (Siegle & Schuler, 2000). To our knowledge, no studies per-taining to this topic have been conducted among general samples of youth.
In this study, Croatian and American youth were administered the Almost Perfect Scale-Re-vised (APS-R: Slaney et al., 2002) and the Multidimensional Students� Life Satisfaction Scale
(MSLSS: Huebner, 1994). Croatian youth were chosen given the decades-long war that has re-sulted in debilitating economic, social, and occupational stressors. Such stressors have forcedhigher education to impose stricter college admission standards among students, which has leadto greater emphasis on high achievement at the middle and high school level (Knezevic & Ovse-nik, 2001; Rijavec & Brdar, 2002). Given the similarly high expectations held for Americanyouth (Rice & Preusser, 2002), and considering previous findings among this group (Gilman& Ashby, 2003), some similarity in life satisfaction reporting was expected among perfection-istic youth in both cultures. In particular, it was expected that youth identified as adaptiveperfectionists would report significantly higher multidimensional satisfaction ratings thanyouth identified as maladaptive perfectionists. It was also expected that both perfectionistic sub-types would report significantly higher life satisfaction ratings than youth identified as non-perfectionists.

158 R. Gilman et al. / Personality and Individual Differences 39 (2005) 155–166
2. Method
2.1. Participants
For the American sample, 341 students in one school district in the Southeast completed theresearch instruments. Permission to obtain individual socioeconomic status (SES) was notgranted, although the school populations were known to include a wide range of SES levels.The sample was comprised of 57% female and 87% Caucasian (vs. 4% Asian–American, 2% Afri-can–American, 3% Hispanic–American, and 4% ‘‘Other’’) students. The mean grade was 8.95(SD = 1.98) and the mean age was 14.59 (SD = 2.14).
A total of 291 students comprised the Croatian sample. The sample was obtained from fourseparate schools across three cities in Croatia. Analyses of responses for each location revealedno significant departure from the mean total responses, thus the data were treated as one unifiedgroup. The mean grade was 9.76 (SD = 1.20) and the mean age of the Croatian sample wasslightly older than the American sample (M = 15.14, SD = 1.56). Similar to the American sample,females comprised the majority (63%). Considering the economic constraints faced by most Cro-atian families, reported household income ranged from $7200 to $50,000 per year. Nevertheless,roughly 70% of the sample was considered to be in the ‘‘middle-income’’ range.
2.2. Procedure
For the American sample, approval to collect data was secured through the Superintendent�soffice and the school�s principal. One of the requirements for enrollment in the school districtwas active participation in research projects, thus all students participated in the study. The stu-dents were administered the instruments (presented in counterbalanced order) in the classroomsand they were also instructed to sit at least two seats apart from each other. Further, at leastone teacher/administrator was assigned to a specific testing location in order to monitor the stu-dents� behavior and to help answer questions. Similar methodological procedures were used forthe Croatian sample. After receiving administrative approval, all students completed a Croatianversion of the instruments, translated by the third author, in their classrooms. All students whowere solicited to participate in the study gave their consent.
2.3. Measures
The Almost Perfect Scale-Revised (APS-R; Slaney et al., 2002) is a 23-item self-report designedto measure adaptive and maladaptive components of perfectionism. Participants respond to theitems using a 7-point Likert rating scale (ranging from 1 = ‘‘strongly disagree’’ to 7 = ‘‘stronglyagree’’). Seven items comprise the Standards subscale and 12 items comprise the Discrepancy sub-scale (i.e., distress caused from not being able to achieve established standards, such as ‘‘My bestjust never seems to be good enough’’). Cronbach�s coefficient alphas among school-aged studentshave been reported as .82 for the Standards scale and .87 for the Discrepancy scale (Gilman &Ashby, 2003). The readability of the APS-R (using the Flesch-Kincaid analysis: Microsoft Word,2000) was determined to be at the fourth-grade level, suggesting that the items were easily inter-pretable for most middle school and high school students. Support for the convergent and dis-

R. Gilman et al. / Personality and Individual Differences 39 (2005) 155–166 159
criminant validity of the APS-R has also been obtained via significant and expected correlationsrelated to the two factors (see Slaney et al., 2002).
The Multidimensional Students� Life Satisfaction Scale (MSLSS: Huebner, 1994) is a 47-itemself-report instrument that assesses satisfaction across five specific life domains: Family, Friends,School, Living Environment, and Self, as well as a global subtest (i.e., questions not pertaining toa specific life domain). All questions on the MSLSS are responded to on a six-point rating scaleformat (1 = strongly disagree through 6 = strongly agree). Item comprising each domain aresummed and averaged to yield a mean satisfaction domain score. Studies of the MSLSS have con-sistently demonstrated acceptable psychometric properties across grades 3–12, including stabilitycoefficients ranging from .77 to .86 for the domain scores and strong evidence of construct validity(see Gilman & Huebner, 2000 for a review).
Given that neither the MSLSS nor the APS-R has been administered to Croatian youth, and toaddress concerns regarding the translation of psychological instruments into non-native languages(Brislin, 2000), mean scores, coefficient alphas and bivariate correlations for each group were firstcomputed (see Tables 1 and 2). The mean scores were statistically equivalent across culturalgroup, with the exception of the MSLSS Self-satisfaction domain, F(1,612) = 13.39, p < .01, effectsize = .30, and the APS-R Standards subscale, F(1,623) = 80.60, p < .01, effect size = .68. Theinternal consistency of all variables met the .70 criteria considered adequate for research purposes(Salvia & Ysseldyke, 1988). Similar to previous findings (Gilman & Ashby, 2003), correlationsbetween the APS-R and MSLSS domains were in the expected direction for both groups, withpositive relationships found between the Standards subscale and all life satisfaction domains.Negative relationships were also found between the Discrepancy subscale and MSLSS domains.It is to be noted that of the 56 correlations in the matrix, Steiger�s (1980) test of the differencebetween independent correlations found 11 that were statistically different between the Americanand Croatian samples. The largest difference was found between the MSLSS Self and Schooldomains, t(df = 529) = 5.51, p < .01. Nevertheless, while cultural determinants may have influ-enced the amount of variance shared between some satisfaction domains, the difference betweenmost of the correlations across cultures (approximately 80%) was statistically equal. Finally, the
Table 1
Descriptive statistics of APS-R and MSLSS domains for each group
Domain Croatian sample (n = 291) American sample (n = 341)
M SD a M SD a
MSLSS
Global 4.29 1.03 .87 4.52 .97 .88
Family 4.44 1.05 .87 4.53 1.13 .91
Friends 5.27 .68 .88 5.16 .72 .86
School 3.44 1.06 .82 3.70 1.07 .84
Living Environment 4.11 .94 .72 4.24 .94 .83
Self 4.69 .66 .70 4.91 .73 .83
APS-R
Standards 34.56 6.43 .75 39.29 6.86 .83
Discrepancy 43.32 11.91 .86 41.40 14.98 .91
Note: MSLSS = Multidimensional Students� Life Satisfaction Scale, APS-R = Almost Perfect Scale-Revised.

Table 2
Intra-domain correlations of all variables (in parentheses) across group
Global Family Friends School Living Environment Self Standards Discrepancy
Global – .64* .38** .41** .48** .60** .30** �.34**
Family .59** – .35** .46** .51** .50** .36** �.29**
Friends .32** .18** – .31** .35** .47** .19** �.23**
School .31** .32** .09 – .42** .44** .34** �.28**
Living .49** .44** .31** .24** – .46** .32** �.26**
Self .41** .25** .29** .18** .20** – .36** �.39**
Standards .24** .21** �.03 .37** .13* .22** – �.10**
Discrepancy �.31** �.16* �.16* �.12* �.13** �.32** .02 –
Note: Correlations in the lower and upper diagonal are from the Croatian and American samples, respectively.* p < .05.** p < .01.
160 R. Gilman et al. / Personality and Individual Differences 39 (2005) 155–166
relationship between the APS-R Standards and Discrepancy scales for both groups was small andnon-significant, suggesting that each subscale captured a unique aspect of perfectionism. In gen-eral, preliminary psychometric data provided some evidence that the APS-R and MSLSS itemswere readily interpreted by Croatian youth.
3. Results
Separate multiple regression analyses were first conducted to determine how the APS-R sub-scales may predict the MSLSS domains before specifically identifying perfectionistic youth. Giventhe number of variables analyzed, criterion for significance was set at .01 and only significant find-ings will be reported. As reported in Table 3, the Standards subscale was a positive and uniquepredictor of school satisfaction for the Croatian sample, while the Discrepancy subscale was a un-ique negative predictor of self-satisfaction and global satisfaction. Similar to Croatian youth, the
Table 3
Multiple regression analyses for the APS-R standards and discrepancy scales predicting life satisfaction domains
Croatian sample American sample
Standards Discrepancy Standards Discrepancy
B SE B ß B SE B ß B SE B ß B SE B ß
Global .11 .08 .11 �.23** .08 �.24 .01 .08 .01 �.13 .08 �.13
Family .04 .07 .04 �.05 .08 �.06 .17** .07 .17 �.02 .07 �.02
Friends �.16 .07 �.15 .01 .07 .01 �.02 .06 .02 �.05 .06 �.05
School .32** .06 .32 �.03 .06 �.04 .19** .06 .19 �.07 .06 �.07
Living Environment .04 .07 .04 .00 .07 .00 .09 .07 .09 �.07 �.07 �.07
Self .14 .07 .14 �.24** .07 �.24 .19** .07 .18 �.19** .07 �.19
R2 R2adj R2 R2
adj R2 R2adj R2 R2
adj
.43 .19 .39 .15 .46 .21 .42 .18
** p < .01.
R. Gilman et al. / Personality and Individual Differences 39 (2005) 155–166 161
Standards subscale was a unique and positive predictor of school satisfaction for American youthand both APS-R scales differentially predicted self-satisfaction. Unlike what was found among theCroatian sample, the Standards subscale for the American sample was a positive and unique pre-dictor of family satisfaction.
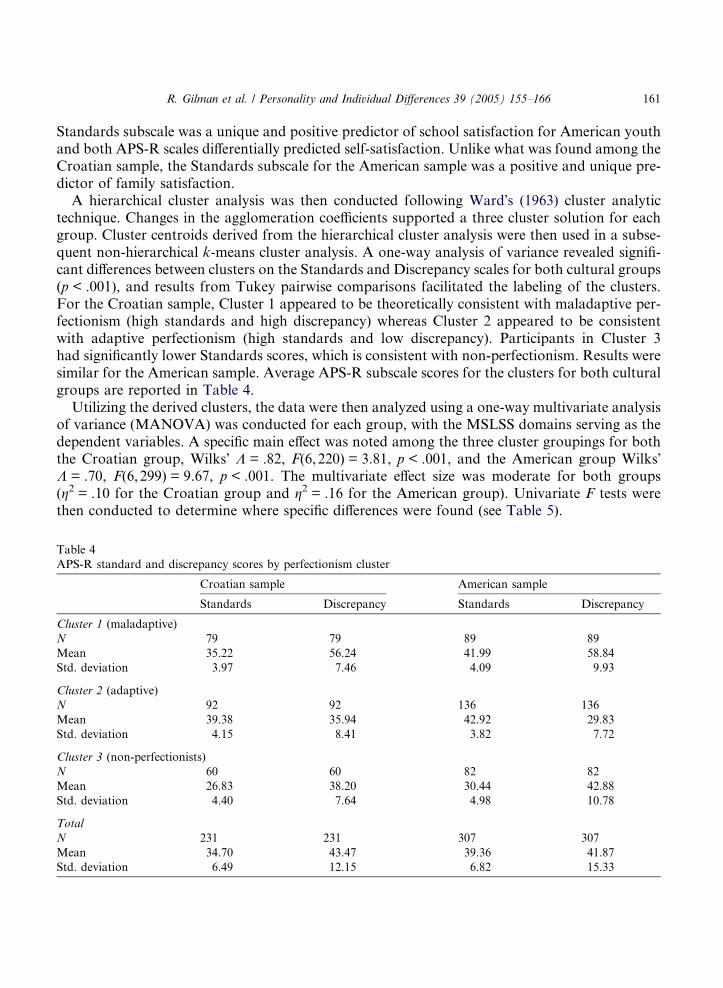
A hierarchical cluster analysis was then conducted following Ward�s (1963) cluster analytictechnique. Changes in the agglomeration coefficients supported a three cluster solution for eachgroup. Cluster centroids derived from the hierarchical cluster analysis were then used in a subse-quent non-hierarchical k-means cluster analysis. A one-way analysis of variance revealed signifi-cant differences between clusters on the Standards and Discrepancy scales for both cultural groups(p < .001), and results from Tukey pairwise comparisons facilitated the labeling of the clusters.For the Croatian sample, Cluster 1 appeared to be theoretically consistent with maladaptive per-fectionism (high standards and high discrepancy) whereas Cluster 2 appeared to be consistentwith adaptive perfectionism (high standards and low discrepancy). Participants in Cluster 3had significantly lower Standards scores, which is consistent with non-perfectionism. Results weresimilar for the American sample. Average APS-R subscale scores for the clusters for both culturalgroups are reported in Table 4.
Utilizing the derived clusters, the data were then analyzed using a one-way multivariate analysisof variance (MANOVA) was conducted for each group, with the MSLSS domains serving as thedependent variables. A specific main effect was noted among the three cluster groupings for boththe Croatian group, Wilks� K = .82, F(6,220) = 3.81, p < .001, and the American group Wilks�K = .70, F(6,299) = 9.67, p < .001. The multivariate effect size was moderate for both groups(g2 = .10 for the Croatian group and g2 = .16 for the American group). Univariate F tests werethen conducted to determine where specific differences were found (see Table 5).
Table 4
APS-R standard and discrepancy scores by perfectionism cluster
Croatian sample American sample
Standards Discrepancy Standards Discrepancy
Cluster 1 (maladaptive)
N 79 79 89 89
Mean 35.22 56.24 41.99 58.84
Std. deviation 3.97 7.46 4.09 9.93
Cluster 2 (adaptive)
N 92 92 136 136
Mean 39.38 35.94 42.92 29.83
Std. deviation 4.15 8.41 3.82 7.72
Cluster 3 (non-perfectionists)
N 60 60 82 82
Mean 26.83 38.20 30.44 42.88
Std. deviation 4.40 7.64 4.98 10.78
Total
N 231 231 307 307
Mean 34.70 43.47 39.36 41.87
Std. deviation 6.49 12.15 6.82 15.33
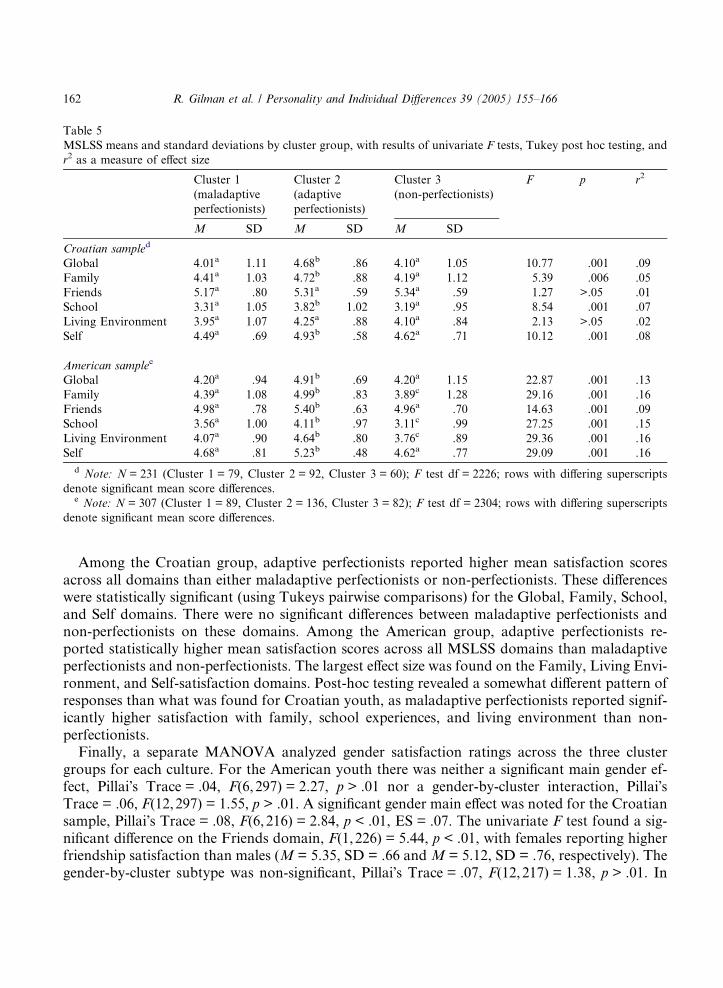
Table 5
MSLSS means and standard deviations by cluster group, with results of univariate F tests, Tukey post hoc testing, and
r2 as a measure of effect size
Cluster 1
(maladaptive
perfectionists)
Cluster 2
(adaptive
perfectionists)
Cluster 3
(non-perfectionists)
F p r2
M SD M SD M SD
Croatian sampled
Global 4.01a 1.11 4.68b .86 4.10a 1.05 10.77 .001 .09
Family 4.41a 1.03 4.72b .88 4.19a 1.12 5.39 .006 .05
Friends 5.17a .80 5.31a .59 5.34a .59 1.27 >.05 .01
School 3.31a 1.05 3.82b 1.02 3.19a .95 8.54 .001 .07
Living Environment 3.95a 1.07 4.25a .88 4.10a .84 2.13 >.05 .02
Self 4.49a .69 4.93b .58 4.62a .71 10.12 .001 .08
American samplee
Global 4.20a .94 4.91b .69 4.20a 1.15 22.87 .001 .13
Family 4.39a 1.08 4.99b .83 3.89c 1.28 29.16 .001 .16
Friends 4.98a .78 5.40b .63 4.96a .70 14.63 .001 .09
School 3.56a 1.00 4.11b .97 3.11c .99 27.25 .001 .15
Living Environment 4.07a .90 4.64b .80 3.76c .89 29.36 .001 .16
Self 4.68a .81 5.23b .48 4.62a .77 29.09 .001 .16
d Note: N = 231 (Cluster 1 = 79, Cluster 2 = 92, Cluster 3 = 60); F test df = 2226; rows with differing superscripts
denote significant mean score differences.e Note: N = 307 (Cluster 1 = 89, Cluster 2 = 136, Cluster 3 = 82); F test df = 2304; rows with differing superscripts
denote significant mean score differences.
162 R. Gilman et al. / Personality and Individual Differences 39 (2005) 155–166
Among the Croatian group, adaptive perfectionists reported higher mean satisfaction scoresacross all domains than either maladaptive perfectionists or non-perfectionists. These differenceswere statistically significant (using Tukeys pairwise comparisons) for the Global, Family, School,and Self domains. There were no significant differences between maladaptive perfectionists andnon-perfectionists on these domains. Among the American group, adaptive perfectionists re-ported statistically higher mean satisfaction scores across all MSLSS domains than maladaptiveperfectionists and non-perfectionists. The largest effect size was found on the Family, Living Envi-ronment, and Self-satisfaction domains. Post-hoc testing revealed a somewhat different pattern ofresponses than what was found for Croatian youth, as maladaptive perfectionists reported signif-icantly higher satisfaction with family, school experiences, and living environment than non-perfectionists.
Finally, a separate MANOVA analyzed gender satisfaction ratings across the three clustergroups for each culture. For the American youth there was neither a significant main gender ef-fect, Pillai�s Trace = .04, F(6,297) = 2.27, p > .01 nor a gender-by-cluster interaction, Pillai�sTrace = .06, F(12,297) = 1.55, p > .01. A significant gender main effect was noted for the Croatiansample, Pillai�s Trace = .08, F(6,216) = 2.84, p < .01, ES = .07. The univariate F test found a sig-nificant difference on the Friends domain, F(1,226) = 5.44, p < .01, with females reporting higherfriendship satisfaction than males (M = 5.35, SD = .66 and M = 5.12, SD = .76, respectively). Thegender-by-cluster subtype was non-significant, Pillai�s Trace = .07, F(12,217) = 1.38, p > .01. In
R. Gilman et al. / Personality and Individual Differences 39 (2005) 155–166 163
general, and with the exception of satisfaction with friends, males and females reported equivalentmean satisfaction scores across the MSLSS domains regardless of culture and perfectionismcluster.
4. Discussion
The results of this study found that holding high personal standards was a positive and uniquepredictor of school satisfaction for both cultural groups, suggesting that youth who maintain highstandards perceive their school experiences in a more positive fashion. Further, satisfaction withself was the only domain in which the Standards and Discrepancy subscales contributed differen-tial predictive values for both cultural groups. Considering that self-satisfaction closely parallelsself-esteem among American youth (Huebner, 1994), and the relationship between holding highstandards and maintaining positive self-esteem has been documented (Benning, Tracz, Sparks,& Solomon, 1991), holding high standards appears to contribute to a positive sense of self for thiscultural group. On the other hand, holding high standards was not a significant predictor of self-satisfaction for Croatian youth. However, the APS-R Discrepancy scale was a significant and neg-ative predictor of self-satisfaction for both Croatian and American samples. Thus, it appears thatdifficulties accepting instances when one�s standards cannot be met predicts a diminished sense ofself regardless of cultural characteristics. Nevertheless, it should not be construed that perfection-ism is invariant with respect to culture, as the Standards scale was a positive predictor of familysatisfaction for the American but not Croatian sample. An equally important finding was that theDiscrepancy scale was a significant and negative predictor of global satisfaction for Croatianyouth, but not among American youth. Future studies are necessary to explore potential reasonsfor this particular finding considering that global satisfaction can reflect changes in coping withlife stressors (Diener et al., 1999). For example, some studies have noted different coping stylesbetween Croatian and American samples (e.g., Hudek-Knezevic, Kardum, & Vukmirovic,1999) and it may be that Croatian (but not American) youth who report distress when their stan-dards are not attained may also display a maladaptive coping style that directly influences theiroverall perceived life quality. Cross-cultural research to assess the possibility of different copingstyles among perfectionistic youth would directly test this speculation.
Further, results of the cluster analysis revealed that youth identified as adaptive perfectionistsin both cultural groups consistently reported higher satisfaction levels than either maladaptiveperfectionists or non-perfectionistic youth. These differences were statistically significant for manydomains. For example, Croatian adaptive perfectionists reported significantly higher global sat-isfaction, as well as satisfaction with school experiences and self-satisfaction than either maladap-tive perfectionists or non-perfectionists. Similar patterns of responses were found for theAmerican group, as adaptive perfectionists consistently reported higher satisfaction levels acrossall MSLSS domains than the other two groups. Nevertheless, unlike Croatian youth, Americanyouth identified as maladaptive perfectionists reported higher mean levels of family, school,and living environment satisfaction than non-perfectionists. These findings suggest that for Amer-ican youth, holding high standards, even in the presence of cognitive discord when these stan-dards are not met, may nevertheless correspond to greater perceived life quality among thesedomains.

164 R. Gilman et al. / Personality and Individual Differences 39 (2005) 155–166
Finally, males and females reported mean satisfaction scores that were essentially invariantacross culture and cluster grouping. The only significant difference was found among Croatianfemales, who reported significantly higher satisfaction with friends than Croatian males. It shouldbe noted that the effect size of this difference was statistically small, suggesting minimal practicalsignificance. Considering that this was the first study to investigate possible gender differences onsatisfaction reports across perfectionistic subtypes, the results should be treated tentatively pend-ing future empirical scrutiny. Nevertheless, the results suggest that perfectionism as a multidimen-sional construct is manifested equally among both gender groups regardless of culture.
4.1. Limitations
Although the present study was the first to investigate the cross-cultural manifestations of per-fectionism among general samples of youth, several limitations must be noted. Perhaps the mostimportant limitation is the administration of psychological instruments, normed on Americansamples, to Croatian youth. Misinterpretation of the survey items must be acknowledged as a lim-itation. Although the relatively equivalent psychometric properties of the instruments may helpattenuate methodological concerns, the use of additional samples of Croatian youth is clearlyneeded to determine generalizability of the findings. Second, the results reported herein are basedon self-report measures obtained in one setting, thus possibly introducing method variance. Asnoted by Diener (2003), exploratory investigations (such as the present study) often initially relyon self-reports to describe a phenomenon before more complex methodology can be utilized.Thus, the data reported herein are considered to be a necessary first step towards further under-standing perceived life quality and perfectionistic youth. Future studies that assess perfectionismacross time, using multiple raters (e.g., parents, teachers) will likely yield important informationon the potential developmental progression of the construct and its vicissitudes in response to lifecircumstances. Such findings will also yield important relationships with related variables such ascoping and social support, which can be used to construct models to test mediational hypotheses.Finally, the findings reported from American youth are based on a sample derived from oneschool district. Additional samples from various locations are needed to support external validity.
References
Adler, A. (1956). Striving for superiority. In H. L. Ansbacher & R. Ansbacher (Eds.), The individual psychology of
Alfred Adler: A systematic presentation in selections from his writings (pp. 101–125). New York: Harper & Row.
Arrindell, W. A., Heesink, J., & Feij, J. A. (1999). The satisfaction with life scale (SWLS): Appraisal with 1700 healthy
young adults in The Netherlands. Personality and Individual Differences, 26, 815–826.
Ashby, J. S., & Rice, K. G. (2002). Perfectionism, dysfunctional attitudes, and self-esteem: A structural equations
analysis. Journal of Counseling and Development, 80, 197–203.
Benning, J. S., Tracz, S. M., Sparks, R. K., Solomon, D., et al. (1991). Effects of two contrasting school task and
incentive structures on children�s social development. Elementary School Journal, 92, 149–167.
Bieling, P. J., Israeli, A. L., & Antony, M. M. (2004). Is perfectionism good, bad, or both? Examining models of the
perfectionism construct. Personality and Individual Differences, 36, 1373–1385.
Brislin, R. W. (2000). Some methodological concerns in intercultural and cross-cultural research. In R. W. Brislin (Ed.),
Understanding culture�s influence on behavior (2nd ed.). Fort Worth, TX: Harcourt.

R. Gilman et al. / Personality and Individual Differences 39 (2005) 155–166 165
Brown, E. J., Heimberg, R. G., Frost, R. O., Makris, G. S., Juster, H. R., & Leung, A. W. (1999). Relationship of
perfectionism to affect, expectations, attributions and performance in the classroom. Journal of Social and Clinical
Psychology, 18, 98–120.
Chang, E. C. (2000). Perfectionism as a predictor of positive and negative psychological outcomes: Examining a
mediation model in younger and older adults. Journal of Counseling Psychology, 47, 18–26.
Chang, E. C. (2003). A critical appraisal and extension of hope theory in middle-aged men and women: Is it important
to distinguish agency and pathways components? Journal of Social and Clinical Psychology, 22, 121–143.
Chang, E. C., Watkins, A., & Banks, K. H. (2004). How adaptive and maladaptive perfectionism relate to positive and
negative psychological functioning: Testing a stress-mediation model in black and white female college students.
Journal of Counseling Psychology, 51, 93–102.
Diener, E. (2000). Subjective well-being: The science of happiness and a proposal for a national index. American
Psychologist, 55, 34–43.
Diener, E. (2003). What is positive about positive psychology? The Curmudgeon and Pollyanna. Psychological Inquiry,
14, 115–120.
Diener, E., Suh, E. M., Lucas, R. E., & Smith, H. L. (1999). Subjective well-being: Three decades of progress.
Psychological Bulletin, 125, 276–302.
Ellis, A. (1962). Reason and emotion in psychotherapy. New York: Lyle Stuart.
Emmons, R. A. (1986). Personal strivings: An approach to personality and subjective well-being. Journal of Personality
and Social Psychology, 51, 1058–1068.
Flett, G. L., & Hewitt, P. L. (2002). Perfectionism: Theory, research, and treatment. Washington, DC: American
Psychological Association.
Gilman, R., & Ashby, J. S. (2003). Multidimensional perfectionism in a sample of middle school students: An
exploratory investigation. Psychology in the Schools.
Gilman, R., & Huebner, E. S. (2000). Review of life satisfaction measures for adolescents. Behaviour Change, 17,
178–195.
Gould, M. S., King, R., Greenwald, S., et al. (1998). Psychopathology associated with suicidal ideation and attempts
among children and adolescents. Journal of the American Academic of Child & Adolescent Psychiatry, 37, 915–923.
Hamachek, D. E. (1978). Psychodynamics of normal and neurotic perfectionism. Psychology, 15, 27–33.
Headey, B., & Wearing, A. (1992). Understanding happiness: A theory of subjective well-being. Melbourne, Victoria,
Australia: Longman Cheshire.
Hudek-Knezevic, J., Kardum, I., & Vukmirovic, Z. (1999). The structure of coping styles: A comparative study of
Croatian sample. European Journal of Personality, 13, 149–161.
Huebner, E. S. (1994). Preliminary development and validation of a multidimensional life satisfaction scale for children.
Psychological Assessment, 6, 149–158.
Kawamura, K. Y., Hunt, S. L., Frost, R. O., & DiBartolo, P. M. (2001). Perfectionism, anxiety, and depression: Are the
relationships independent? Cognitive Therapy and Research, 25, 291–301.
Knezevic, M., & Ovsenik, M. (2001). Work values of students and their success in studying at the study centre for social
work in Zagreb, Croatia. Journal of Sociology & Social Welfare, 28, 37–51.
Lewinsohn, P., Redner, J., & Seeley, J. (1991). The relationship between life satisfaction and psychosocial variables:
New perspectives. In F. Strack, M. Argyle, & N. Schwartz (Eds.), Subjective well-being (pp. 193–212). New York:
Plenum Press.
Microsoft Word 2000, (2000) [computer software]. Redmond, WA: Microsoft Corporation.
Missildine, W. H. (1963). Your inner child of the past. New York: Simon & Schuster.
Park, N., Huebner, E. S., Laughlin, J. E., Valois, R. F., & Gilman, R. (2004). A cross-cultural comparison of the
dimensions of child and adolescent life satisfaction reports. Social Indicators Research, 66, 61–79.
Parker, D. W., Portesova, S., & Stumpf, H. (2001). Perfectionism in mathematically gifted and typical Czech students.
Journal for the Education of the Gifted, 25, 138–152.
Perisamy, S., & Ashby, J. S. (2002). Multidimensional perfectionism and locus of control. Journal of College Student
Psychotherapy, 17, 75–86.
Rice, K. G., & Mirzadeh, S. A. (2000). Perfectionism, attachment, and adjustment. Journal of Counseling Psychology,
47, 238–250.

166 R. Gilman et al. / Personality and Individual Differences 39 (2005) 155–166
Rice, K. G., & Preusser, K. J. (2002). The adaptive/maladaptive perfectionism scale. Measurement and Evaluation in
Counseling and Development, 34, 210–222.
Rijavec, M., & Brdar, I. (2002). Coping with school failure and self-regulated learning. European Journal of Psychology
of Education, 17, 177–194.
Salvia, J., & Ysseldyke, J. E. (1988). Assessment in special and remedial education (3rd ed.). Boston, MA: Houghton
Mifflin.
Sherry, S. B., Hewitt, P. L., Besser, A., McGee, B. J., & Flett, G. L. (2004). Self-oriented and socially prescribed
perfectionism in the eating disorder inventory perfectionism subscale. International Journal of Eating Disorders, 35,
69–79.
Siegle, D., & Schuler, P. A. (2000). Perfectionism differences in gifted middle school students. Roeper Review, 23, 39–44.
Slaney, R. B., Rice, K. G., & Ashby, J. S. (2002). A programmatic approach to measuring perfectionism: The almost
perfect scales. In G. L. Flett & R. Hewitt (Eds.), Perfectionism (pp. 63–88). Washington, DC: American
Psychological Association.
Steiger, J. H. (1980). Tests for comparing elements of a correlation matrix. Psychological Bulletin, 87, 245–251.
Ward, J. H. (1963). Hierarchical grouping to optimize function. Journal of the American Statistical Association, 58,
236–244.