the relationship between national brand and private label food
TRANSCRIPT
United States Department of Agriculture
EconomicResearchService
EconomicResearchReportNumber 129
December 2011Richard Volpe
The Relationship Between National Brand and Private Label Food ProductsPrices, Promotions, Recessions, and Recoveries
ww
w.er
s.usda.gov
Visit Our Website To Learn More!
The U.S. Department of Agriculture (USDA) prohibits discrimination in all its programs and activities on the basis of race, color, national origin, age, disability, and, where applicable, sex, marital status, familial status, parental status, religion, sexual orientation, genetic information, political beliefs, reprisal, or because all or a part of an individual’s income is derived from any public assistance program. (Not all prohibited bases apply to all programs.) Persons with disabilities who require alternative means for communication of program information (Braille, large print, audiotape, etc.) should contact USDA’s TARGET Center at (202) 720-2600 (voice and TDD).
To file a complaint of discrimination write to USDA, Director, Office of Civil Rights, 1400 Independence Avenue, S.W., Washington, D.C. 20250-9410 or call (800) 795-3272 (voice) or (202) 720-6382 (TDD). USDA is an equal opportunity provider and employer.
Cover photo credit: Thinkstock.
http://www.ers.usda.gov/Find additional information :
Use of commercial and trade names does not imply approval or constitute endorsement by USDA.
Recommended citation format for this publication:
Volpe, Richard. The Relationship Between National Brand and Private Label Food Products: Prices, Promotions, Recessions, and Recoveries ERR-129, U.S. Department of Agriculture, Economic Research Service. December 2011.

United StatesDepartmentof Agriculture
www.ers.usda.gov
A Report from the Economic Research Service
Abstract
Over the past two decades, private label food products have grown steadily in sales and often directly compete for market share with national brands. This competition lowers prices and increases product choices for consumers. This report analyzes the relationship between private label and national brand product prices and in-store promotions for two major U.S. grocery store chains during the 2007-2009 recession and the year following the recession (2010). Retailers promote private label products (offer price discounts) stra-tegically in response to national brand pricing promotions to protect private label market share during national brand promotions. However, the extent of the retailer response varies widely across supermarket departments and is also affected by both the density of food stores and the market share of supercenters within a market area. These findings hold true regardless of the state of the economy, although the magnitude of the interaction between national brands and private labels differs in times of recession and recovery.
Keywords: retail food prices, supermarket pricing strategy, private labels, national brands, promotions, recession
Acknowledgments
The author thanks Richard Sexton, Rachael Goodhue, James Chalfant, Kathy Edgington, Jeff Goettsch, and Laurie Warren from the University of California, Davis. He also thanks colleagues Abebayehu Tegene, Ephraim Leibtag, Laurian Unnevehr, Elise Golan, and Rosanna Mentzer-Morrison from the Economic Research Service of USDA. He appreciates the reviews provided by Dermot J. Hayes, Alessandro Bonanno, and Patrick Canning, who provided suggestions that substantially improved this manuscript. Thanks are also due to Courtney Knauth for editing the manuscript and Victor B. Phillips for design and layout.
Richard Volpe, [email protected]
The Relationship Between National Brand and Private Label Food ProductsPrices, Promotions, Recessions, and Recoveries
Economic Research Report Number 129
December 2011

iiThe Relationship Between National Brand and Private Label Food Products / ERR-129
Economic Research Service/USDA
Contents
Summary. . . . . . . . . . . . . . . . . . . . . . . . . . . . . . . . . . . . . . . . . . . . . . . . . . . iii
Introduction . . . . . . . . . . . . . . . . . . . . . . . . . . . . . . . . . . . . . . . . . . . . . . . . . 1
Private Label Trends . . . . . . . . . . . . . . . . . . . . . . . . . . . . . . . . . . . . . . . . . . 2
Data and Statistics . . . . . . . . . . . . . . . . . . . . . . . . . . . . . . . . . . . . . . . . . . . . 4
National Brand/Private Label Price Differences . . . . . . . . . . . . . . . . . . . 6
Recession Versus Recovery Effects . . . . . . . . . . . . . . . . . . . . . . . . . . . . . . . 8
Heavy Private Label Promotion . . . . . . . . . . . . . . . . . . . . . . . . . . . . . . . . 10
Promotional Interaction Between National Brand and Private Label Substitutes . . . . . . . . . . . . . . . . . . . . . . . . . . . . . . . . . 12 Simultaneous NB/PL Promotions: Expected Versus Observed . . . . . . . 12 Modeling Promotional Interaction . . . . . . . . . . . . . . . . . . . . . . . . . . . . . 15
Regression Results . . . . . . . . . . . . . . . . . . . . . . . . . . . . . . . . . . . . . . . . . . . 18 Examining the Entire Time Series . . . . . . . . . . . . . . . . . . . . . . . . . . . . . 18 Examining the Recession and Recovery Periods Separately . . . . . . . . . 21
Implications . . . . . . . . . . . . . . . . . . . . . . . . . . . . . . . . . . . . . . . . . . . . . . . . 23
References . . . . . . . . . . . . . . . . . . . . . . . . . . . . . . . . . . . . . . . . . . . . . . . . . . 24

iii The Relationship Between National Brand and Private Label Food Products / ERR-129
Economic Research Service/USDA
Summary
What Is the Issue?
One of the most striking changes in U.S. food retailing over the past two decades has been the rise of private labels (PLs), also known as store brands. Retailers have expanded PL product offerings across the supermarket, and PLs have increased in popularity, as measured by both dollar sales and shares within product categories. Since promotional competition between PLs and national brands (NBs) has the potential to benefit consumers through lower prices and expanded product choices, this report quantifies the magnitude and dynamics of PL price discounts and then tests for NB/PL strategic promo-tional interaction. Particular attention is paid to how the 2007-09 recession and subsequent recovery affected NB/PL interaction, showing how price dynamics evolved from recession to recovery.
What Did the Study Find?
Retailers promote private label products (offer price discounts) strategi-cally in response to national brand pricing promotions to protect PL sales during NB promotions. However, the extent of the retailer response varies widely across supermarket departments and is also affected by both the density of food stores and the market share of supercenters within a market area.
• On average, PLs are priced about 23 percent lower than NBs, both with and without promotions. This gap is smaller than that found in previous analyses using older data, suggesting that these items may have become more comparable in price and quality over time.
• NB/PL promotional interaction was strongest among processed, storable products, but much weaker for produce, fresh meat, and seafood.
• In general, as market concentration increased within an area, the intensity of within-store NB/PL promotional interaction also increased.
• NB/PL promotional interaction lessened, however, as the market share of supercenters increased, which may be due to supermarkets focusing on everyday low prices generally, rather than on promotions, when competing with supercenters.
• Promotional activity for NBs changed very little during the recession, while PL promotional activity increased.
How Was the Study Conducted?
This study used 2008-10 data on prices and promotions for two major supermarket chains that operate primarily in the Western United States. The data were gathered directly from the corporate web sites of the chains. The broad scope of the data, covering thousands of the products available in each supermarket and over 250 product categories in every major department, allowed for the study of NB/PL interaction across a wide range of product dimensions. The intrastore promotional interac-tion between NBs and PLs was analyzed using contingency tables and

ivThe Relationship Between National Brand and Private Label Food Products / ERR-129
Economic Research Service/USDA
then regression analysis was used to identify key determinants of NB/PL promotional timing. Because the time series included a part of the recent recession as well as the subsequent recovery, the analysis allowed for NB/PL interaction to vary across these economic phases.
1 The Relationship Between National Brand and Private Label Food Products / ERR-129
Economic Research Service/USDA
Introduction
In studies of food retailing, private label foods (PLs) generate interest because of the ways in which they differ from national brands (NBs). NB products, regardless of the departments in which they are sold, travel from the farm gate to the consumer’s dinner plate by way of branded food manufac-turers and distributors. For example, Heinz Ketchup is a homogenous product across every chain throughout the country in terms of taste and appearance. In contrast, supermarkets obtain PLs through a form of vertical coordination or from manufacturers specializing in private label products (Berges-Sennou et al., 2004). PLs are unique to the chains at which they are sold, or at least are so marketed. Nearly every supermarket chain in the country offers at least one PL ketchup in addition to NB ketchups.
Recent trends illustrate the evolution of PLs and their importance in food retailing. For example, the Food Institute Report (2009) notes that PL sales grew an average of 4.5 percent per year from 2003 through 2008. Sales for packaged NBs fell during the same period. PLs have improved in quality relative to NBs (Consumer Reports, 2009). They have also increased in total product offerings, as most supermarkets today offer at least one PL option in nearly all product categories (The Food Institute, 2010).
Private labels have been the subject of economic research for nearly a century.1 Much of the PL-related research focuses on consumer welfare effects. Steiner (2004) summarizes a subset of the literature that argues that intrastore competition between NBs and PLs is important for generating consumer welfare through lower overall prices and increased quality and variety in supermarkets. Several studies have argued against the profit-ability of PL promotions (Tellis and Zufryden, 1995; Ailawadi et al., 2001). However, the data used in this study show that PLs are promoted more frequently than NBs, with the average PL on sale 54 percent of the time and the average NB 36 percent of the time. Using a unique dataset with super-market prices and promotions, the author examines the NB/PL relationship in today’s food retailing environment, as measured by the timing and incidence of promotions.2
This report details the nature of intrastore promotional interaction between NBs and PLs using econometric methods based upon contingency table analysis. The results demonstrate the magnitude of NB/PL promotional interaction, while showing the effect of various market and departmental factors. In addition, since this analysis uses 2008-10 data, an analysis was conducted of retail market trends both during and after a recession. A confluence of factors was responsible for accelerating U.S. retail food prices from mid-2007 through March 2009. Concurrently, the United States fell into a recession in December 2007 that lasted until June 2009. The combi-nation of a recession and a retail food price spike was unique, as retailers faced both higher costs and weaker demand. The timing of the data used here is therefore important in attempting to measure the effects of PLs on supermarket practices and prices.
1Research on PLs dates back at least to Braithwaite (1928), who showed that PL prices are lower than those for advertised brands and attributed the difference to a reputation premium for the latter.
2It should be noted that this study focuses entirely on the timing of NB and PL promotions that come from a single manager and does not examine competitive effects across stores.

2The Relationship Between National Brand and Private Label Food Products / ERR-129
Economic Research Service/USDA
Private Label Trends
The motivation for studying NB/PL interaction comes from the changes in PL products in American supermarkets over the last two decades. As a point of reference, Connor and Peterson (1992) examined the major determinants of the NB/PL price difference in supermarkets. The main working assumptions of that report are worth noting, as they are indicative of the nature of PLs at that time. The authors assumed that the market share of PLs within product categories was very small, that there was no product differentiation among PLs, and that PLs were subject to no advertising in newspapers or any other media outlets. Each of these assumptions was likely plausible in the 1990s, but could be considered farfetched in today’s food retailing environment. With respect to the brands it sells and promotes, the supermarket industry has changed over the last two decades.
A number of studies, including Corstjens and Lal (2000) and Cotterill and Putsis (2000), as well as several summarized by Steiner (2004), have shown that the penetration as well as the quality of PLs has shown a consider-able increase within product categories. The food retailing publication Progressive Grocer (2010) has dedicated at least a dozen articles from the years 2007 through 2010 to the rise in popularity of PLs and the concerted efforts of grocers to promote them to consumers and increase sales.
As mentioned above, total PL sales grew at an annual rate of 4.5 percent per year from 2003 through 2008 (The Food Institute Report (2009), using Nielsen Scantrack data). The Food Industry Review (The Food Institute, 2010) demonstrates that much of this growth comes at the expense of NB sales. Food product categories with the most gains relative to NBs in 2009 include baking ingredients and snacks. From 2005 through 2009, total channel sales (those involving NBs) increased by $24 billion, or about 8 percent, while PL sales increased by $10 billion, or 18 percent. Hence, PLs gained over 2 percent of the NB market share during the 5-year span (fig. 1).
Figure 1
Five-year dollar trend sales for supermarkets
Billion dollars
2005
350
300
250
200
150
100
50
0
Source: The Food Institute.
Private label Total channel
2006
45 45.7
273.1 277.4 287.2 295 297.1
49.2 53.9 55.5
2007 2008 2009

3 The Relationship Between National Brand and Private Label Food Products / ERR-129
Economic Research Service/USDA
Much of the recent PL increase in market share and sales can be explained by the 2007-08 food price spike and 2007-09 recession. Lamey et al. (2007) showed that PL demand increases and NB demand decreases during economic downturns, owing mostly to lower PL prices for comparable prod-ucts. Confirming this pattern for the recent recession, Straczynski (2009) found that PL dollar sales increased by 7.4 percent from July 2008 through July 2009. This increase significantly outpaced the average PL growth of the previous 5 years.
Retailers are increasingly using PLs as a means to differentiate them-selves from competitors. In addition to standard flagship PLs that bear firm names, supermarkets are offering more premium and organic brands, such as Safeway’s SELECT and O Organics, Kroger’s Private Selections and Naturally Preferred, and Giant’s Nature’s Promise (Martinez, 2007). These premium PLs serve not only to distinguish supermarket chains’ product lines from one another but also to place NBs and PLs more directly in price and quality competition.

4The Relationship Between National Brand and Private Label Food Products / ERR-129
Economic Research Service/USDA
Data and Statistics
Weekly price and promotion data from two major supermarket chains (herein referred to as Chain 1 and Chain 2), both of which operate mostly in the Western United States, were used in this analysis.3 The data come from the companies’ respective corporate web sites, span June 2008 through August 2010,4 and cover 17 cities for which online retail data were available at the time of collection (table 1).
The cities sampled range from large (Los Angeles) to small (Palm Springs) and from relatively high income (San Jose) to relatively low income (Baltimore). Conversations with professionals from both chains, as well as preliminary analyses of the data, indicated that the prices retrieved online closely matched those within the brick-and-mortar supermarkets. Moreover, price variation within a chain in a given metropolitan area was minimal, occurring only during instances of unexpected inventory shortages.
The data include only products for which very close pairings were possible across NBs and PLs. The criteria for matching across labels follow Connor and Peterson (1992) and require that potential substitutes be within the same product category and have the same characteristics as descriptors in the product names (e.g., chocolate flavor or low-salt). Each pair of products is matched according to size (for example, 12-oz Heinz Ketchup is paired with the PL 12-oz ketchup for each of the two retailers), as well as by taste and
3Chain names, which have no bear-ing on the analysis or the empirical outcomes, are kept confidential.
4In each of the cities sampled, either Chain 1, Chain 2, or both offered consumers the option of purchasing their groceries online. Consumers can then opt for home delivery or in-store pickup of their purchased goods. In order to browse prices and observe promotions, consumers need to input their ZIP Codes. The data were gath-ered weekly using a technique known as “screen scraping,” whereby the appropriate ZIP Codes were entered automatically into the two corporate web sites once per week and the breadth of prices and promotions was downloaded.
Table 1
Cities sampled
City ZIP Code Chain Population
Median household
income
Number Dollars
Boise, ID 83705 Chain 2 185,787 42,432
Palm Springs, CA 92262 Chain 2 42,807 43,800
Salt Lake City, UT 84101 Chain 2 178,858 37,287
Los Angeles, CA 90023 Both 3,849,378 42,667
Las Vegas, NV 89103 Both 478,434 47,863
Portland, OR 97213 Both 537,081 42,287
San Diego, CA 92114 Both 1,256,951 55,637
Seattle, WA 98101 Both 582,424 49,297
Vancouver, WA 98660 Chain 1 158,855 40,743
Sacramento, CA 95815 Chain 1 453,781 44,867
San Jose, CA 95113 Chain 1 929,936 70,291
San Francisco, CA 94102 Chain 1 744,041 57,496
Washington, DC 20001 Chain 1 581,531 47,221
Tucson, AZ 85701 Chain 1 518,956 34,241
Philadelphia, PA 08026 Chain 1 1,448,394 32,573
Baltimore, MD 21075 Chain 1 631,366 32,456
Fresno, CA 93650 Chain 1 466,714 37,800
Source: ERS estimates from the U.S Census Bureau, 2005.

5 The Relationship Between National Brand and Private Label Food Products / ERR-129
Economic Research Service/USDA
nutritional attributes, such as flavor or low-sodium content, that are included in the product description. In total, the analysis includes the pricing and promotional behavior of over 5,800 unique NB products, each paired with an appropriate PL substitute. Many PL products are paired with more than one NB, as most product categories contain multiple NBs with similar char-acteristics. The products span 257 product categories and cover every major department in the supermarket.5 5The complete list of paired products
is available from the author upon request.

6The Relationship Between National Brand and Private Label Food Products / ERR-129
Economic Research Service/USDA
National Brand/Private Label Price Differences
Any prospective measurement of a PL welfare effect for consumers must consider the price differences between NBs and PLs as a measure of potential savings (Ward et al., 2002). The difference between NBs and PLs in price, with and without promotions, varies from 17 percent for salad dressing to 33 percent for packaged bread (table 2). The NB/PL price margin for product pair i during week t is given by:
i ,t i ,ti ,t
i ,t
NB Pr ice PL Pr icePr iceDif
NB Pr ice
-=
The shelf price is the price printed on the supermarket shelves and does not include promotional discounts. The promotional price represents the price paid by consumers who take advantage of promotions, either by using a loyalty card or by any other method used by the supermarket for promotions. For products not on sale, the promotional price equals the shelf price.
The NB/PL price difference is fairly similar with or without promotions, as the average difference among NB and PL shelf prices is 23 percent and rises to only 25 percent during PL promotions. However, Volpe (2010) shows that the average difference between NB promotional prices and PL shelf prices is about 3 percent, which implies that PL promotions are instrumental in determining the overall NB/PL price differences. This finding suggests that retailers may set NB and PL promotions simultaneously in order to manage brand-level shares, a possibility that is investigated here using a contingency table analysis.
As table 2 shows, the differences for shelf prices and promotional prices vary considerably across supermarket departments. Among shelf prices, the greatest difference is in the beverage department, at 29 percent, and the smallest difference occurs for the baking and cooking and the dressing and salad toppings departments, at about 17 percent. For some departments, the promotional price difference is wider than for the shelf price, while for others it is smaller. The overall average NB/PL price differences presented here are lower than the 40 percent found by Dhar and Hoch (1997) or the 30 percent found by Ailawadi et al. (2001), and imply that PL and NB prices may be converging.6
6Such a convergence may be due to decreases in average NB prices, increases in average PL prices, or both. Identifying which of these is the cause of the convergence is beyond the scope of this study, but may be a fruitful direction for future NB/PL research.

7 The Relationship Between National Brand and Private Label Food Products / ERR-129
Economic Research Service/USDA
Table 2
Average percentage differences in national brand (NB) and private label (PL) pricing, by department
Department
Percentage difference, NB-PL
Shelf pricePromotional
price
Percent
Baking and cooking 17.24 17.56
Boxed dinners 28.45 26.83
Beverages 28.95 27.30
Breakfast foods 26.59 26.46
Canned goods 23.35 24.82
Condiments 19.25 24.47
Coffee and tea 18.83 19.45
Dairy 20.58 25.51
Salad dressing 16.88 21.08
Frozen food 19.13 22.77
Mexican 24.61 26.25
Meat and seafood 18.13 12.06
Packaged bread 33.62 34.54
Pasta, rice, and beans 22.64 22.33
Snacks 22.98 20.87
Soup and chili 25.06 28.39
Total 22.89 24.53
Source: ERS/USDA, from retail prices and promotions from 2008 to 2010 for two major supermarket chains, collected online by the author.
8The Relationship Between National Brand and Private Label Food Products / ERR-129
Economic Research Service/USDA
Recession Versus Recovery Effects
As noted, the demand for NBs and PLs can change significantly depending on economic conditions. Moreover, the differences in the supply channel for NBs and PLs suggest that the macroeconomic drivers of food prices may impact NBs and PLs differently. The timespan of the data includes part of a recession, so the data are divided into two time series for analysis: June 2008 through June 2009 is labeled the recession and July 2009 through August 2011 the recovery.7 This division enables a statistical comparison of the NB/PL landscape between the two economic conditions. Assuming that super-markets seek to maximize profit, then PL prices should be relatively higher during the recession than NB prices due to increased demand, all else equal.
To compare average prices across time, some measure of relative or weighted prices is necessary. Yu and Connor (2002) demonstrate that using raw prices for averaging across products results in intrinsically more expensive prod-ucts receiving high weights. For that reason, relative prices were calculated by normalizing each observed price to the mean value of the price over the entire time series. Hence, the relative price for product j at time t is
jtjt
j
prp
p=
where jp is the mean price of product j over the time series. By this normal-
ization, deviations from the mean price can be interpreted as percentages. Other valuable comparisons across the recession and recovery include the percentage of time that products are on promotion (frequency) and the average percentage discount offered during promotions (depth).
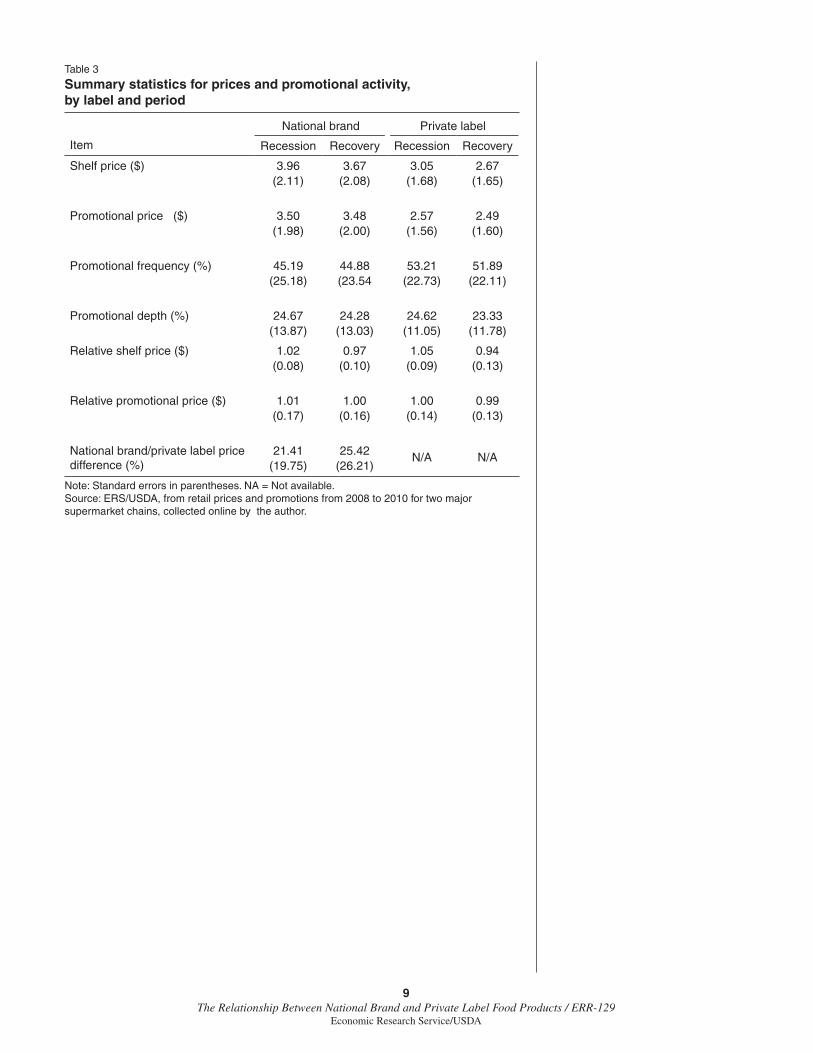
Statistically, prices for both NBs and PLs were significantly higher during the recession, when high commodity prices and fuel prices drove food prices upward (table 3). However, shelf prices reveal that NB prices were 5 percent higher during the recession, while PL prices were 11 percent higher. The NB/PL price difference, or the potential savings consumers can achieve by purchasing PLs, was 21 percent during the recession compared with 25 percent during the recovery. The increase in PL prices relative to NB prices during the recession likely reflects the response of supermarkets to increased and more inelastic demand for PLs and suggests that store managers may have less incentive to promote PLs competitively with NBs during a recession.
Another finding is that, for NBs and PLs, promotional frequency and depth both increased slightly during the recession. The relative promotional prices indicate that these increases were almost exactly enough to maintain consis-tent deal prices regardless of economic conditions. That is, the average price of items on sale was approximately the same between the recession and recovery. This pricing strategy has important implications for consumers facing budget constraints during economic downturns. By purchasing PLs and seeking out promotions, consumers may be able to prevent their food expenditures from increasing dramatically during times of rising food prices.
7This break point is consistent with the official National Bureau of Eco-nomic Research designation of June 2009 as the ending of this recession. In addition, using quarterly Gross Do-mestic Product numbers, the economy shrank by 4 percent during the first period of this analysis and grew by almost 5 percent in the second period, lending credence to the choice of when to divide the data.
9 The Relationship Between National Brand and Private Label Food Products / ERR-129
Economic Research Service/USDA
Table 3
Summary statistics for prices and promotional activity, by label and period
Item
National brand Private label
Recession Recovery Recession Recovery
Shelf price ($) 3.96(2.11)
3.67(2.08)
3.05(1.68)
2.67(1.65)
Promotional price ($) 3.50(1.98)
3.48(2.00)
2.57(1.56)
2.49(1.60)
Promotional frequency (%) 45.19(25.18)
44.88(23.54
53.21(22.73)
51.89(22.11)
Promotional depth (%) 24.67(13.87)
24.28(13.03)
24.62(11.05)
23.33(11.78)
Relative shelf price ($) 1.02(0.08)
0.97(0.10)
1.05(0.09)
0.94(0.13)
Relative promotional price ($) 1.01(0.17)
1.00(0.16)
1.00(0.14)
0.99(0.13)
National brand/private label price difference (%)
21.41(19.75)
25.42(26.21)
N/A N/A
Note: Standard errors in parentheses. NA = Not available. Source: ERS/USDA, from retail prices and promotions from 2008 to 2010 for two major supermarket chains, collected online by the author.

10The Relationship Between National Brand and Private Label Food Products / ERR-129
Economic Research Service/USDA
Heavy Private Label Promotion
Certain PL products are virtually always on promotion. In examining the entire data set for all products sold online at Chain 1 or Chain 2, the author found that nearly 7,200 different products were on promotion at least 85 percent of the time.8 Products with the highest promotional frequencies in the data set are more likely to be PLs than NBs. For example, 74 percent of all products on promotion at least half the time are NBs. Given that slightly over 80 percent of all products are NBs, PLs are only marginally overrepre-sented among those products on promotion more often than not. However, if we consider only those products on promotion at least 85 percent of the time, only 28 percent of the remaining products are NBs. Therefore, PLs are considerably more likely to be placed on constant or near-constant promotion than are NBs.
One intuitive explanation of this phenomenon is that retailers face a difficult balancing act when setting PL promotions relative to NBs (Steiner, 2004). A price difference between substitutes that is too high may signal to consumers that the PL is of low quality. However if the difference is too narrow, then consumers will always purchase the NB because NBs enjoy a “reputation premium” drawn from familiarity and longevity on the shelves. The nearly perpetual PL price promotion may represent a solution to this pricing conun-drum. Under this strategy, PLs are given a clearly visible shelf price that is relatively close to the price of respective NB substitutes, communicating the message that the PL and NB product are of comparable quality. However, the promotional price provides a wider price difference, increasing the prob-ability that the consumer who would always choose the NB at equal pricing will purchase the PL.
In order to assess this explanation, the relationship between NB and PL promotions was examined. Figure 2 shows how the average promotional frequency for NBs and PLs varies according to the number of competing NBs within product categories. In general, the PL promotional frequency follows a clear and direct relationship with the number of NBs—that is, supermarkets promote their PLs more heavily in product categories with more NB substitutes. When the number of NBs is low, between one and four, average PL promotional frequency is slightly below 60 percent. However, the average PL promotional frequency is nearly 80 percent for product categories with 17 or 18 NBs, such as ice cream and shredded cheese.9 This suggests that retailers make a more determined effort to promote and expand the market share of PLs when they are competing with more NBs. Promotional prices are, on average, 20 percent lower than shelf prices, so consumers see deeper and more frequent price discounts on PLs in categories featuring many competing NBs.
The average price difference between NBs and PLs, in percentage terms, widens when promotions are taken into account, and PL promotional frequency increases with the number of competing NBs within categories. Therefore, conventional supermarkets may be using their PL promotions to achieve the goal of maintaining NB/PL price differences wide enough to overcome the reputation premium of NBs without signaling low PL quality to consumers. This possibility is explored more fully in the next section.
8A product is defined entirely by its name in this data set, which is in turn provided by the chain in which it is sold. Therefore, an identical NB product sold at both Chain 1 and Chain 2 is counted as two unique products in the data set. The entire data set collected from both chains includes approximately 70,000 unique products by this definition, after the requisite data cleaning.
9PL promotional frequency drops off for categories featuring 19 or 20 NBs, but those categories are quite rare in the data.

11 The Relationship Between National Brand and Private Label Food Products / ERR-129
Economic Research Service/USDA
Figure 2
Average promotional frequency by the number of national brandproducts within categories
Percent
Number of national brand products
1-2 3-4 5-6 7-8 9-10 11-12 13-14 15-16 17-18 19-20
0.9
0.8
0.7
0.6
0.5
0.4
0.3
0.2
0.1
0
Source: ERS/USDA, from retail prices and promotions from 2008 to 2010 for two major supermarket chains, collected online by the author.
PL Promotional frequency NB Promotional frequency
12The Relationship Between National Brand and Private Label Food Products / ERR-129
Economic Research Service/USDA
Promotional Interaction Between National Brand and Private Label Substitutes
The nature of the interaction between NBs and PLs was examined by using a two-stage process that focuses upon promotional timing. First, the contin-gency tables were used to measure the extent to which the expected coinci-dence of NB/PL promotions compares with the observed coincidence. Then, in the second stage, an econometric model based on the findings drawn from contingency tables was used.
Simultaneous NB/PL Promotions: Expected Versus Observed
Contingency tables are useful for examining the extent to which competing chains interact with one another in promotional activity. They are statistical tools that perform the cross tabulation of categorical variables. Hence, contin-gency tables use the binary variables for NB and PL promotions to enable the classification of promotional interaction as either retaliatory or accommo-dating. As noted, one of the main reasons for focusing on PLs is that they are components of both interstore and intrastore competition.
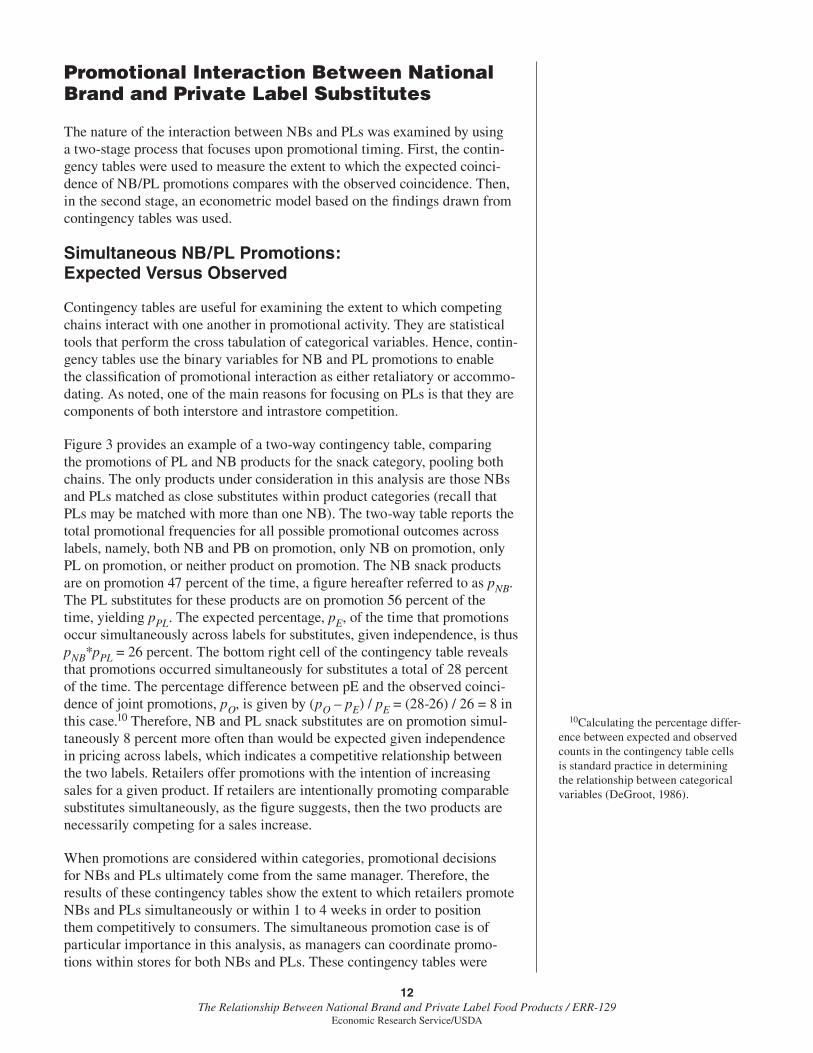
Figure 3 provides an example of a two-way contingency table, comparing the promotions of PL and NB products for the snack category, pooling both chains. The only products under consideration in this analysis are those NBs and PLs matched as close substitutes within product categories (recall that PLs may be matched with more than one NB). The two-way table reports the total promotional frequencies for all possible promotional outcomes across labels, namely, both NB and PB on promotion, only NB on promotion, only PL on promotion, or neither product on promotion. The NB snack products are on promotion 47 percent of the time, a figure hereafter referred to as pNB. The PL substitutes for these products are on promotion 56 percent of the time, yielding pPL. The expected percentage, pE, of the time that promotions occur simultaneously across labels for substitutes, given independence, is thus pNB*pPL = 26 percent. The bottom right cell of the contingency table reveals that promotions occurred simultaneously for substitutes a total of 28 percent of the time. The percentage difference between pE and the observed coinci-dence of joint promotions, pO, is given by (pO – pE) / pE = (28-26) / 26 = 8 in this case.10 Therefore, NB and PL snack substitutes are on promotion simul-taneously 8 percent more often than would be expected given independence in pricing across labels, which indicates a competitive relationship between the two labels. Retailers offer promotions with the intention of increasing sales for a given product. If retailers are intentionally promoting comparable substitutes simultaneously, as the figure suggests, then the two products are necessarily competing for a sales increase.
When promotions are considered within categories, promotional decisions for NBs and PLs ultimately come from the same manager. Therefore, the results of these contingency tables show the extent to which retailers promote NBs and PLs simultaneously or within 1 to 4 weeks in order to position them competitively to consumers. The simultaneous promotion case is of particular importance in this analysis, as managers can coordinate promo-tions within stores for both NBs and PLs. These contingency tables were
10Calculating the percentage differ-ence between expected and observed counts in the contingency table cells is standard practice in determining the relationship between categorical variables (DeGroot, 1986).
13 The Relationship Between National Brand and Private Label Food Products / ERR-129
Economic Research Service/USDA
constructed for the entire time series, and also separately for the recession and recovery periods, to examine the role of the economic downturn on NB/PL competitiveness.
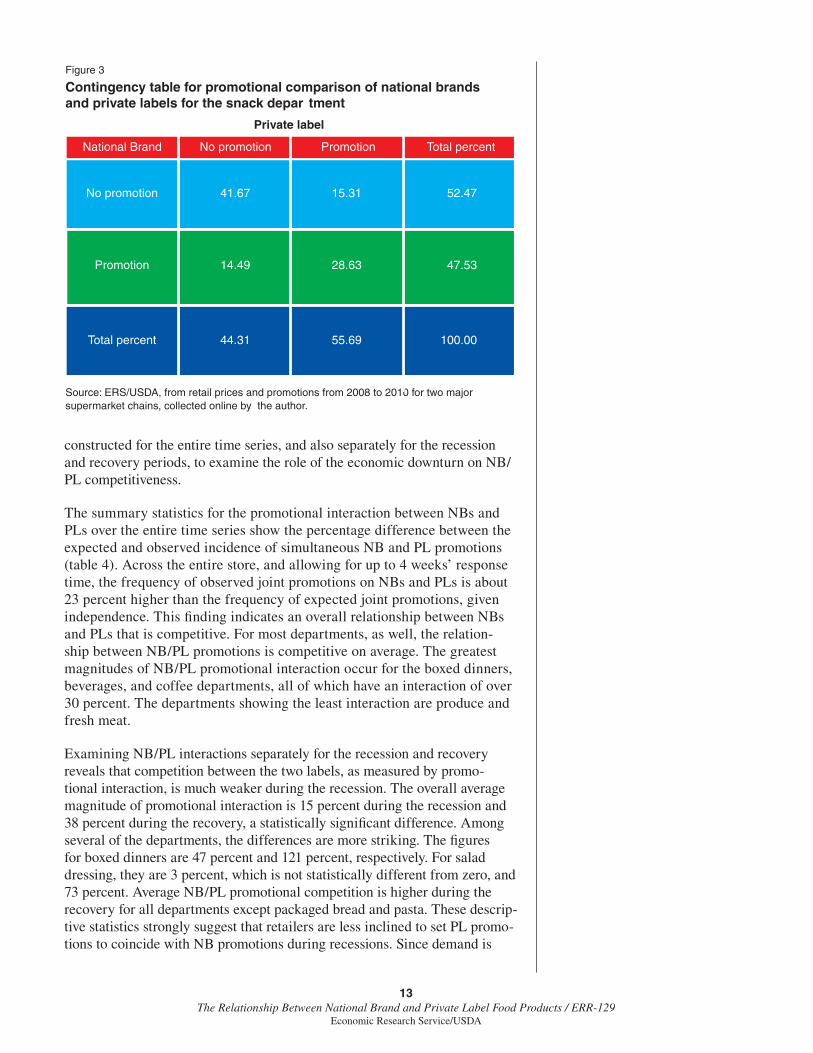
The summary statistics for the promotional interaction between NBs and PLs over the entire time series show the percentage difference between the expected and observed incidence of simultaneous NB and PL promotions (table 4). Across the entire store, and allowing for up to 4 weeks’ response time, the frequency of observed joint promotions on NBs and PLs is about 23 percent higher than the frequency of expected joint promotions, given independence. This finding indicates an overall relationship between NBs and PLs that is competitive. For most departments, as well, the relation-ship between NB/PL promotions is competitive on average. The greatest magnitudes of NB/PL promotional interaction occur for the boxed dinners, beverages, and coffee departments, all of which have an interaction of over 30 percent. The departments showing the least interaction are produce and fresh meat.
Examining NB/PL interactions separately for the recession and recovery reveals that competition between the two labels, as measured by promo-tional interaction, is much weaker during the recession. The overall average magnitude of promotional interaction is 15 percent during the recession and 38 percent during the recovery, a statistically significant difference. Among several of the departments, the differences are more striking. The figures for boxed dinners are 47 percent and 121 percent, respectively. For salad dressing, they are 3 percent, which is not statistically different from zero, and 73 percent. Average NB/PL promotional competition is higher during the recovery for all departments except packaged bread and pasta. These descrip-tive statistics strongly suggest that retailers are less inclined to set PL promo-tions to coincide with NB promotions during recessions. Since demand is
Figure 3
Contingency table for promotional comparison of national brandsand private labels for the snack depar tment
Source: ERS/USDA, from retail prices and promotions from 2008 to 2010 for two major supermarket chains, collected online by the author.
Private label
National Brand
No promotion
Promotion
Total percent
41.67
14.49
44.31
15.31
28.63
55.69
52.47
47.53
100.00
No promotion Promotion Total percent
14The Relationship Between National Brand and Private Label Food Products / ERR-129
Economic Research Service/USDA
Table 4
Summary statistics on promotional interaction between national brand and private label substitutes, by department
Department Total1 Recession Recovery
Percent
Baking and cooking 24.11(11.83)
22.29(10.65)
28.28(49.98)
Boxed dinners 62.79(38.96)
46.55(39.74)
120.84(85.81)
Beverages 33.76(10.31)
15.79(5.28)
58.49(24.40)
Breakfast foods 26.75(10.49)
11.11(8.17)
24.98(25.00)
Canned goods 32.00(11.10)
24.36(11.45)
43.97(19.14)
Condiments 23.26(9.31)
10.96(6.89)
47.58(30.77)
Coffee and tea 35.50(11.52)
21.01(8.14)
50.76(21.56)
Dairy 20.31(8.00)
3.68(3.53)
48.00(21.30)
Salad dressing 25.64(8.65)
3.09(1.98)
72.73(35.13)
Frozen food 23.17(7.57)
11.66(4.48)
42.53(18.76)
Meat and seafood 4.18(9.27)
-2.51(10.13)
6.16(30.29)
Packaged bread 12.48(7.81)
15.84(9.67)
7.34(8.52)
Produce and floral 2.43(17.03)
0.90(19.47)
4.04 (26.95)
Pasta, rice, and beans 25.81(10.68)
24.03(11.07)
24.03(34.94)
Snacks 14.58(9.96)
13.37(11.86)
15.72(22.65)
Soup and chili 12.88(9.86)
11.26(5.60)
20.15(13.35)
Total 23.28(19.25)
14.66(17.34)
38.05(43.35)
Note: Standard errors in parentheses.1The promotional interaction is the percentage difference between the observed incidence of simultaneous national brand/private label promotions and the expected incidence given independence.Source: ERS/USDA, from retail prices and promotions from 2008 to 2010 for two major supermarket chains, collected online by the author.
15 The Relationship Between National Brand and Private Label Food Products / ERR-129
Economic Research Service/USDA
up then for PLs, retailers have less incentive to protect or expand PL market share strategically at that time.
Trade promotions, or price discounts from upstream manufacturers, may play a role in shaping NB/PL interaction. Trade promotions can affect the timing of NB promotions, but a body of empirical evidence suggests that retailers have control over the timing and extent to which trade promotions affect in-store prices. For example, Levy et al. (1998) found that supermar-kets change an average of 4,000 prices per week, although only an average of 1,000 upstream prices change per week.
Retailers have little incentive to pass trade promotions on to consumers unless manufacturers require some passthrough of the wholesale price discount. A wholesaler’s ability to impose terms upon retailers is directly related to its market power. NB products for the produce, meat, and dairy departments tend to come from regional producers and cooperatives with limited market power with which to offer trade promotions or enforce passthroughs. This limitation may explain why retailers simultaneously promote NBs and PLs with relatively low frequency in these departments. These departments also feature perishable products, and many promotions may be timed to move fresh products rather than for strategic or competitive reasons.
Modeling Promotional Interaction
To quantify the nature and the determinants of NB/PL promotional inter-action, a regression model was used to explain the percentage difference between expected and observed joint promotions, as calculated by the two-way contingency tables. The explanatory variables are drawn from a review of the largely descriptive literature on NB/PL interaction, although formulating ex ante expectations on most coefficient signs is difficult, as the nature of NB/PL promotional interaction has not been considered or quanti-fied to any significant degree. The estimated model is:
1) PromoResponseij = 1Lag1i + 2Lag2i + 3Lag3i+ 4Lag4i + 5NBi + 6Herfi,j + 7WalSharei,j + 8MHIi,j + 9PopDensi,j + 10Onlinei + DDepartments i +ui,j
where PromoResponse is the percentage difference between the observed frequency of joint promotions and the expected frequency of joint promo-tions, given independence between labels, for product pairing i in city j, as calculated from the contingency tables. Lag1, Lag2, Lag3, and Lag4, are binary variables equal to one if the response time given to the labels is equal to 1, 2, 3, or 4 weeks, respectively. This model thus allows for the possibility that retailers set promotions in order to mitigate unintended brand switching resulting from advertised promotions.
NB is a binary variable equal to one for the cases in which PL promotions are responding to NB promotions—that is, the NB promotions are lagged when applicable. Blattberg, Briesch, and Fox (1995) showed that the amount of brand switching that occurs is asymmetric with respect to labeling, in that more consumers switch from PL to NB during an NB promotion than the converse. Leeflang and Wittink (1996) showed empirically that brand switching increases with total market share, a finding in line with the work

16The Relationship Between National Brand and Private Label Food Products / ERR-129
Economic Research Service/USDA
of Blattberg et al. Thus, retailers have a stronger motivation to set promotions to minimize brand switching away from PLs than from NBs, resulting in a predicted positive sign for the variable.
Herf gives the market concentration of the city in which the promotional response is calculated, as measured by the Herfindahl Index.11 The relation-ship between price and concentration has been explored extensively, and the overwhelming consensus is that prices rise—and, in general, supermarkets set prices less competitively—as concentration increases (Lamm, 1981; Cotterill, 1986). Volpe and Lavoie (2008) showed that the direct relation-ship between prices and concentration applies much more strongly to NBs, as PL prices rise only marginally in concentrated markets. Given that the NB/PL price difference is likely to increase with concentration, competi-tion between the labels is expected to decrease with concentration. The intuition is most clear with regard to PLs: retailers have less incentive to closely manage their PL promotions with respect to NB promotions if the difference is great enough to preclude the loss of PL market share to higher priced NB substitutes.
WalShare is the market share of Walmart, as measured by supercenters and Sam’s Club warehouse stores in increments of 10 percent. Several researchers have stressed the importance of considering the presence of Walmart when examining supermarket behavior and food retailing in general. Supercenters are most popular among low-income consumers (Franklin, 2001), which is also the demographic most likely to purchase PLs. Therefore, it stands to reason that PLs are priced more competitively in cities in which Walmart is strongest, but price competition across stores would not be captured by this analysis since only intrastore effects were examined. The effect of Walmart Supercenters on NB/PL interaction is unclear, although Jones (2003) argues that conventional supermarkets would do best to minimize promotions in general when faced with direct competition from Supercenters. Less promo-tional activity would likely result in weaker measurable competition between NBs and PLs overall, as measured by promotional interaction.
MHI is median household income. Low-income consumers have historically been the target demographic for PLs. Therefore, as MHI increases, firms tend to have less incentive to promote their PLs competitively with NBs, resulting in weaker NB/PL interaction overall.
PopDens is population density, a control commonly used in studies of retailer sales and profits, measured in thousands of people per square mile.
Finally, Online is a binary variable equal to one for those cities in which both Chain 1 and Chain 2 offer online retail. In this data set, those cities are Las Vegas, Los Angeles, San Diego, Portland, and Seattle. Given that the presence of two online retailers increases the ease of competitive price moni-toring, interstore competition is expected to be higher in these cities. However the anticipated effect of both chains offering online retail is negative in the intrastore case, as retailers are more likely to focus their promotions toward competitive goals. The model also includes a complete set of departmental fixed effects in the vector Departments. The model is estimated without an intercept to facilitate the interpretation of the departmental binaries.
11The Herfindahl Index is calculated as the sum of squared market shares for all of the food retailers operating in metropolitan areas. The market shares are expressed as fractions, and therefore a value of one denotes the monopoly setting.

17 The Relationship Between National Brand and Private Label Food Products / ERR-129
Economic Research Service/USDA
All demographic and market condition variables were calculated using data from Market Scope, a publication of Trade Dimensions. Table 5 provides selected summary statistics for the continuous explanatory variables of equa-tion 1 and shows that across the cities examined, the regressors show signifi-cant variation.
Table 5
Summary statistics for the determinants of promotional interaction
Variable MeanStandard deviation Minimum Maximum
Herfindahl 0.18 0.04 0.10 0.27
WalShare (%) 8.47 9.84 0.00 29.50
MHI (1000s USD) 45.47 9.12 32.46 70.29
PopDens (1000s/sq. mile) 4.30 2.05 0.45 8.51
WalShare = Walmart Share; MHI = Median Household Income; PopDens = Population Density.Source: Market Scope, 2006.

18The Relationship Between National Brand and Private Label Food Products / ERR-129
Economic Research Service/USDA
Regression Results
The time series nature of the data provides an opportunity to examine how intrastore NB/PL dynamics may differ according to economic conditions. As a result, the discussion looks at the overall results and the differences across the recession and recovery in turn. While using the entire time series takes advantage of the most information from the two chains, analyzing the data during and after the recession helps to identify a potentially key determinant of retailer strategy.
Examining the Entire Time Series
Table 6 reports the results of the estimation of equation 1.12 Overall, promo-tions are more likely to overlap across labels than we would expect given independence. In the parlance of promotional interaction (e.g., Steenkamp et al., 2005), this relationship is described as competitive. This finding is drawn from the positive and significant departmental binaries. For all departments except meat and seafood, packaged breads, produce, soups, and snacks, the observed coincidence of simultaneous NB/PL promotions is significantly higher than expected, given independence, when we control for several market, demographic, and departmental factors. The binaries for lags of 1 and 2 weeks are positive and significant, which means that managers are most likely to set NB (PL) promotions 1 to 2 weeks following PL (NB) promo-tions. After 2 weeks, the likelihood of promotional activity decreases.
To properly interpret the binary terms, it is necessary to consider promo-tional frequency. The percentage of time a product is on promotion can be thought of as the probability that a product is on promotion at any given time. Consider the beverages category, which has a coefficient of 0.22. When a PL (NB) beverage product goes on promotion at a conventional supermarket, the probability of seeing a comparable NB (PL) beverage product on promotion at the same time increases by about 22 percent over the average promotional frequency. The increase in probability the following week for such a promo-tion is closer to 24 percent, factoring in the coefficient on Lag1Week, and about 23 percent in 2 weeks’ time.
Market concentration, as measured by the Herfindahl, has a strong and significant positive effect on NB/PL promotional interaction, which may be because, as concentration increases, markets become less competitive. Therefore, retailers have less incentive to respond to competitive promotions, and they focus more intently on intrastore pricing considerations. Strong NB/PL interaction, as measured in this report, is indicative of retailer efforts to manage brand-level market share as a means of profit maximization. (This finding is revisited when the effect of the recession is considered.) The pres-ence and market share of Walmart has a significant negative effect on NB/PL competition. This may be because supermarkets focus more on everyday low prices and offer fewer promotions overall when competing with supercenters, a possibility that calls for further research.
In perhaps the most counterintuitive result in this analysis, the coefficient on NB is insignificant, meaning that there is no significant difference between NB responses to PL promotions and PL responses to NB promotions. Given
12Equation 1 for the whole time series is estimated using ordinary least squares (OLS). Preliminary diagnostics indicated the presence of heteroskedasticity in the errors, and the standard errors are corrected for het-eroskedasticity using White’s method.

19 The Relationship Between National Brand and Private Label Food Products / ERR-129
Economic Research Service/USDA
—Continued
Item Total1 Recession2 Recovery
Lag1week 0.0231***(2.80)
0.0171*(1.65)
0.0408(1.54)
Lag2weeks 0.0162**(1.97)
0.0101(0.96)
0.0120(0.45)
Lag3weeks 0.0086(1.05)
-0.0006(0.06)
-0.0187(0.70)
Lag4weeks 0.0027(0.32)
-0.0058(0.55)
-0.0410(1.55)
NB 0.0041(0.91)
-0.0108*(1.86)
-0.0181(1.23)
Herfindahl 0.3557***(4.49)
0.1592(1.58)
-0.4732*(1.81)
WalShare -0.2220***(8.45)
-0.1132***(3.36)
-0.2641***(3.10)
MHI 0.0488*(1.84)
0.4440(1.32)
0.3749***(4.42)
PopDens 0.0733***(6.03)
0.0052***(3.38)
-0.0021(0.51)
Online 0.0144***(3.06)
-0.0172***(2.87)
0.0441***(2.92)
Baking & cooking 0.1245***(5.78)
0.2070***(7.53)
0.2214***(3.11)
Boxed dinners 0.2345***(10.19)
0.4096***(14.90)
1.1470***(15.90)
Beverages 0.2209***(10.27)
0.1020(1.41)
0.5234***(7.35)
Breakfast foods 0.1510***(7.02)
0.0552**(2.01)
0.1883***(2.64)
Canned goods 0.2034***(9.45)
0.1877***(6.83)
0.3783***(5.31)
Table 6
Regression results for the determinants of national brand/private label promotional interaction

20The Relationship Between National Brand and Private Label Food Products / ERR-129
Economic Research Service/USDA
that retailers have several incentives to offer and promote PLs and that NB promotions typically result in more brand switching away from PLs than the converse, this coefficient was expected to be positive and significant. The most plausible explanation for this, however, is that supermarkets set promo-tions across products simultaneously. The act of setting PL promotions in
Table 6
Regression results for the determinants of national brand/private label promotional interaction—(continued)
Item Total1 Recession2 Recovery
Condiments 0.1159***(5.29)
0.0538(1.15)
0.4145***(5.80)
Coffee & tea 0.2357***(10.93)
0.1542***(5.61)
0.4466***(6.18)
Dairy 0.0865***(4.02)
-0.0190(0.69)
0.4186***(5.88)
Salad dressing 0.1398***(6.50)
-0.0249(0.91)
0.6658***(9.35)
Frozen foods 0.1150***(5.35)
0.0608(0.98)
0.3638***(5.11)
Meat & seafood -0.0733***(3.41)
-0.0810***(2.94)
0.0006(0.01)
Packaged breads 0.0053(0.24)
0.1013(1.25)
0.0123(0.17)
Produce & floral -0.0830***(3.72)
-0.0508*(1.79)
-0.0275(0.38)
Pasta, rice, & beans 0.1414***(6.57)
0.1845***(6.71)
0.1788**(2.51)
Soup & chili 0.0122(0.56)
0.0567(1.06)
0.1404*(1.93)
Snacks 0.0292(1.35)
0.0778***(2.83)
0.0956(1.34)
F statistic 447.80*** 173.05*** 181.38***
Adjusted R2 0.846 0.672 0.677
Number of observations 2,195 2,267 2,235
Note: Absolute value of t-statistics in parentheses. ***Coefficient is significant at the 0.01 level; **at the 0.05 level; *at the 0.10 level.1Results for the entire time series are estimated using Ordinary Least Squares. 2Results for the different time periods are estimated using Seemingly Unrelated Regression. WalShare = Walmart Share; MHI = Median Household Income; Online = Online retail; PopDens = Population Density per 1,000 square miles. Source: ERS/USDA, from retail prices and promotions from 2008 to 2010 for two major supermarket chains, collected online by the author.

21 The Relationship Between National Brand and Private Label Food Products / ERR-129
Economic Research Service/USDA
order to defend market share against NB promotions, which may be due to factors such as interstore competition or trade promotions, is captured by the contemporaneous case, where we frequently observe highly comparable prod-ucts on sale at the same time. Given the large number of products examined, managers may be simply promoting those PLs most in need of market share protection more or less constantly, and therefore, the effect is not captured by the model. Regardless of the reason, the results indicate that retailers are promoting NBs and PLs as strong and nearly equal competitors, which bodes well for the vigor of NB/PL competition and consumer welfare.
Seasonality is a potential concern in deciphering the timing of super-market promotions. Certainly seasonal peaks and troughs in demand can drive the frequency of observed NB/PL promotions to exceed the expected frequency. However, the departmental binaries indicate that promotional competition is particularly strong for several departments that are not affected by seasonal swings in demand. These include boxed dinners, breakfast foods, and canned goods.
Median household income has a small but significant positive effect on NB/PL competition. This finding runs contrary to ex ante expectations and may reflect the ongoing effort on the part of retailers to improve the quality and penetration of PLs. PLs are likely to have strong sales in cities with relatively low incomes, and therefore supermarket managers today may be engaging in more intensive efforts to coordinate promotions in order to maximize PL sales in areas of higher income.
In sum, the regression results indicate that PL promotions are significantly more likely to be in sync with NB promotions than we would expect if the two labels were priced and promoted independently of each other. The results support the notion that retailers are aware that NB promotions, while effec-tive for a number of competitive objectives, can be harmful to PL sales and can in turn reduce profits. Therefore, the results indicate that retailers are setting PL promotions simultaneously with NB promotions in order to protect PL sales.
Examining the Recession and Recovery Periods Separately
The nature of NB/PL promotional interaction differs considerably depending on the period during which it is examined (table 6).13 Again, the key coefficients to examine in order to understand the differences are those for the departmental binaries. During the recession, the NB/PL relation-ship was significantly competitive for only 6 of the 16 departments: snacks, baking and cooking, boxed dinners, canned goods, coffee, and pasta prod-ucts. Hypothesis tests reveal that NB/PL interaction was more competitive during the recovery for boxed dinners, beverages, breakfast foods, canned goods, condiments, coffee, dairy, salad dressing, frozen foods, and fresh meat and seafood.
As explained previously, this disparity in NB/PL competition is likely because strong PL demand during the recession induces retailers to raise PL prices rather than to price and promote them competitively with NBs. Supporting this notion is the positive coefficient on NB that indicates that
13The separate estimations for the recession and recovery were performed using seemingly unrelated regression (SUR), a systems approach. This strat-egy enables the testing of coefficients across equations.
22The Relationship Between National Brand and Private Label Food Products / ERR-129
Economic Research Service/USDA
during the recession, retailers were over 1 percent more likely to promote NBs in response to PL promotions than the converse. This suggests that the surge in PL demand, as documented by a number of trade publications, was strong enough that retailers set promotions to protect NB sales from PL promotions. During the recovery, NB is insignificant.
During the recovery, the coefficient on the Herfindahl index is negative and significant, and thus in line with a priori expectations. Therefore, during periods of relative economic health, NB prices appear to rise with market concentration and reduce overall NB/PL competitiveness. The effect of Walmart stores remains negative during both the recession and the recovery, although the magnitude of the effect is significantly higher during the recovery. Hence, standard market structure factors appeared to matter less in shaping NB/PL dynamics during the recession.
23 The Relationship Between National Brand and Private Label Food Products / ERR-129
Economic Research Service/USDA
Implications
The price difference between NBs and PLs has fallen significantly over time, possibly because PLs are increasing in both quality and market share rela-tive to NBs. PLs are now promoted heavily, and promotions are more likely to occur in product categories with a large number of competing NB brands, suggesting that in many cases, PLs are priced and promoted to maximize market share within product categories.
In terms of promotional interaction, NB and PL substitutes are considerably more likely to be on promotion simultaneously than would be expected if they were priced independently. In general, such a practice does not conform to standard category management on the part of food retailers, as research has shown that simultaneous promotion of brands within categories can lead to unprofitable cannibalization (Chintagunta and Halder, 1998). This provides further evidence that managers seek to maximize sales on PLs irrespective of considerations for the category overall.
While this study does not measure consumer welfare, several studies, as summarized by Steiner (2004), show that NB/PL competition increases consumer welfare by expanding product choices and lowering prices for all brands. Since the analysis finds that the presence of supercenters significantly decreases NB/PL competition, increased competition from these kinds of stores changes the retail environment for consumers beyond simple price effects.
Finally, the food price spike of 2008 and the 2007-09 recession significantly affected the nature of NB/PL interaction. While all of the empirical findings discussed above hold true throughout the recent swings of the U.S. busi-ness cycle, specific magnitudes vary considerably between the recession and recovery. NB/PL promotional competition was lower during the recession. Moreover, although all food prices increased as a result of both higher costs and lower demand, PL prices increased significantly more than NB prices. These findings imply that any positive effect PLs may have on consumer welfare, in terms of lower food prices, increased quality, or greater variety, may be mitigated during times of cost and/or demand shocks. The findings also show that attempts to measure a PL consumer welfare effect will depend heavily on when that measurement is taken.

24The Relationship Between National Brand and Private Label Food Products / ERR-129
Economic Research Service/USDA
References
Ailawadi, K.L., S.A. Neslin, and K. Gedenk. 2001. “Pursuing the Value-Conscious Consumer: Store Brands versus National Brands Promotions,” Journal of Marketing 65(1):71-89.
Berges-Sennou, F., P. Bontems, and V. Requillart. 2004. “Economics of Private Labels: A Survey of Literature,” Journal of Agricultural & Food Industrial Organization 2(3):1-23.
Blattberg, R.C., R. Briesch, and E.J. Fox. 1995. “How Promotions Work,” Marketing Science 14(3):G122-G132.
Braithwaite, D. 1928. “The Economic Effects of Advertising,” Economic Journal 38:16-37.
Chintagunta, P.K., and S. Haldar. 1998. “Investigating Purchase Timing Behavior in Two Related Categories,” Journal of Marketing Research 35(1):45-53.
Connor, J.M., and E.B. Peterson. 1992. “Market-Structure Determinants of National Brand-Private Label Price Differences of Manufactured Food Products,” The Journal of Industrial Economics 40(2):157-71.
Consumer Reports. 2009. “It Pays To Buy Store Brands.” http://www.consumerreports.org/cro/magazine-archive/october-2009/shopping/buying-store-brands/overview/buying-store-brands-ov.htm.
Corstjens, M., and R. Lal. 2000. “Building Store Loyalty through Store Brands,” Journal of Marketing Research 37(3):281-91.
Cotterill, R.W. 1986. “Market Power in the Retail Food Industry: Evidence from Vermont,” The Review of Economics and Statistics 68(3):379-86.
Cotterill, R.W., and W.P. Putsis. 2000. “Market Share and Price Setting Behavior for Private Labels and National Brands,” Review of Industrial Organization 17(1):17-39.
DeGroot, M.H. 1986. Probability and Statistics, Second Edition. Addison Wesley, Reading, MA.
Dhar, S.K., and S.J. Hoch. 1997. “Why Store Brand Penetration Varies by Retailer,” Marketing Science 16(3):208-27.
The Food Institute. “2009 Brands Need Solid Positioning to Fend Off Private Label Encroachment,” The Food Institute Report, Dec. 21.
The Food Institute. 2010. Food Industry Review.
Franklin, A.W. 2001. “The Impact of Walmart Supercenters on Supermarket Concentration in U.S. Metropolitan Areas,” Agribusiness 17(1):105-14.

25 The Relationship Between National Brand and Private Label Food Products / ERR-129
Economic Research Service/USDA
Jones, E. 2003. “An Application of Game Theory to Supermarket Pricing,” Journal of Food Distribution Research 34(1):56-62.
Lamey, L., B. Deleersnyder, M.G. Dekimpe, and J.E.M. Steenkamp. 2007. “How Business Cycles Contribute to Private-Label Success: Evidence from the United States and Europe,” Journal of Marketing 71(1):1-15.
Lamm, R.M. 1981. “Prices and Concentration in the Food Retailing Industry,” The Journal of Industrial Economics 30(1):67-78.
Leeflang, P.S.H., and D.R. Wittink. 1996. “Competitive Reaction Versus Consumer Response: Do Managers Overreact?” International Journal of Research in Marketing 13:103-19.
Levy, D., S. Dutta, M. Bergen, and R. Venable. 1998. “Price Adjustment at Multiproduct Retailers,” Managerial and Decision Economics 19(2):81-120.
Martinez, S.W. 2007. The U.S. Food Marketing System: Recent Developments, 1997-2006, Economic Research Report No. 42, U.S. Department of Agriculture, Economic Research Service, May.
Progressive Grocer. 2010. “Are Store Brands the Brands of the Future?” Stagnito Media Publications, December 7.
Steenkamp, J.E.M., V.R. Nijs, D.M. Hanssens, and M.G. Dekimpe. 2005. “Competitive Reactions to Advertising and Promotion Attacks,” Marketing Science 24(1):35-54.
Steiner, R.L. 2004. “The Nature and Benefits of National Brand/Private Label Competition,” Review of Industrial Organization 24(2):105-27.
Straczynski, S. 2009. “Nielsen: U.S. Private Label Sales up 7.4%,” Brandweek, Nielsen Business Media. http://www.adweek.com/news/advertising-branding/nielsen-us-private-label-sales-74-106253
Tellis, G.J., and F.S. Zufryden. 1995. “Tackling the Retailer Decision Maze: Which Brands to Discount, How Much,When, and Why?” Marketing Science 14(3):271-99.
Volpe, R.J., and N. Lavoie. 2008. “The Effect of Walmart Supercenters on Grocery Prices in New England,” Review of Agricultural Economics 30(1):4-26.
Volpe, R.J. 2010. “Price and Promotional Patterns of Major US Supermarkets,” Doctoral dissertation, University of California, Davis.
Ward, M.B., J.P. Shimshack, J.M. Perloff, and J.M. Harris. 2002. “Effects of the Private-Label Invasion in Food Industries,” American Journal of Agricultural Economics 84(4):961-73.
Yu, C.-c., and J.M. Connor. 2002. “The Price-Concentration Relationship in Retailing: Retesting Newmark,” Agribusiness 18(4):413-26.