the relationship between grief and personality...
TRANSCRIPT

THE RELATIONSHIP BETWEEN GRIEF AND PERSONALITY –
A QUANTITATIVE STUDY
by
Lisa Prosser-Dodds
LOUIS KAVAR, Ph.D, Faculty Mentor and Chair
DIANE MALPASS, Ph.D, Committee Member
CESAR GONZALEZ, Ph.D, Committee Member
Curtis R. Brandt, Ph.D., Dean
Harold Abel School of Social and Behavioral Sciences
A Dissertation Presented in Partial Fulfillment
Of the Requirements for the Degree
Doctor of Philosophy
Capella University
April, 2013

© Lisa Prosser-Dodds, 2013

Abstract
The relationship between personality, as defined by Myers Briggs Personality Type Indicator and
grief is the focus of this quantitative study. The intent of this study was to show evidence that
differences in grief response can be seen in differing personalities. The 271 participants of this
study were bereaved individuals from three sites across the United States. They were recruited
by a memorial chapel, a faith community and the researcher’s seminar company. The
participants completed an online survey which included the MBTI, and four grief measures.
Twelve hypothesis were tested which resulted in strong robust differences between five of the
relationships. The predictor variables included the attitude of the personality
(extraversion/introversion), the dominant function of the personality (sensing, intuiting, thinking,
and feeling) and the functional pairs of the personality (combinations of sensing, intuiting,
thinking, and feeling). Quantitative methodology was applied utilizing multivariate regression
analysis to analyze multiple dependent variables and independent variables for each hypothesis.
At a confidence level of 95%, the null hypotheses were rejected if the p values were greater than
0.005, indicating a significant difference between the groups of measured independent and
dependent variables.

Dedication
This work is lovingly dedicated to my mother and father, Evelyn Curtis Prosser and
Norman Eugene Prosser, whose life and passing set me so clearly on this path, I feel you all
around me.
To Kelvin, Bary, Rick and Steve the brothers I have lost along the journey, but whose
continual presence keeps me on the trail.
To my husband Tim, whose selfless and sacrificial nature made it possible to dream, and
whose dreams make me want to be a better woman. To Bethany, as my daughter, you were the
one watching, cheering and always knowing. To Zac, for being the soul mate of her life and the
father of the two absolute best reasons to live, Sophia Renee and Jude Joseph, the reason I smile
in the darkest of hours, the reminder life and love goes on.
To Jeff, my soul brother, who kept quietly saying “of course you will” and loved me
through it all. To “big” Tim for seeing beyond where I could see. And to, Hedy, Wendy, Juli,
Adina, Debbie, Nelda, Stacey Jo, Tess, and to Smack and Sabrina and Kristen Whitney, you
ARE phenomenal women and your strength is inspirational.
Thank you to Greg and Hedy, Bill and Wendy, Anny and Winston, Stan and Ruthann for
shelter in the storm.
Deborah Yvonne, you are the sister of my soul. Words cannot express my love and
gratitude. You are what I dreamed a sister would be.
And lastly, I dedicate this work to all those who have shared their story with me, I am
honored to have been a companion in grief.

iii
Acknowledgements
I extend my heartfelt gratitude to Dr. Louis Kavar, my dissertation mentor and guide.
How patient, sturdy and understanding you have been through a process that included the ugly
sides of life beyond school. I want to also acknowledge Dr. Shana Pack whose revisions and
insight into the methodology was critical to provide best practices for my study. In addition, Dr.
Malpass and Gonzalez for their continued effort on my committee, thank you for your additions
and expertise in the methodology of a quantitative research done right!
Without the inspirational work of Dr. Robert Neimeyer, I would still be wandering in the
wilderness of my thoughts and dreams. Your tangible support is priceless. To Dr. Ken Doka, I
never could have gotten to this place if you and Dr. Martin had not gone boldly before, thank you
for my “daily dose of Doka”! Dr. Hogan and Dr. Prigerson your generous support and
willingness to contribute to this work through the use of your assessments is so helpful and
greatly appreciated. To Scott Spiegel, the stats tutor extraordinaire, who did more in a 45 minute
consult than three stats classes combined.
Lastly, Dr. Linda Sangster, the mentor and friend whose love is constant.
iv
iii
Table of Contents
Acknowledgements ....................................................................................................................... iv
List of Tables ................................................................................................................................ vi
CHAPTER 1. INTRODUCTION ...................................................................................................1
Background of the Problem ................................................................................................1
Statement of the Problem ....................................................................................................2
Purpose of the Study ...........................................................................................................3
Significance of the Study ....................................................................................................4
Research Design ..................................................................................................................5
Data Analysis ....................................................................................................................10
Research Questions ...........................................................................................................11
Assumptions and Limitations ...........................................................................................12
Definitions .........................................................................................................................13
Expected Outcomes ..........................................................................................................13
Organization of the Remainder of the Study ....................................................................15
CHAPTER 2. LITERATURE REVIEW .......................................................................................17
Historical Perspective on Grief Theory ............................................................................24
Historical Perspective on Personality Theory ...................................................................25
Grief and Personality Literature ........................................................................................27
MBTI and Grief ................................................................................................................29
CHAPTER 3. METHODOLOGY ................................................................................................32
Statement of Purpose ........................................................................................................32

iv
Research Design ................................................................................................................32
Target Population and Participant Selection .....................................................................33
Sample Size .......................................................................................................................34
Procedures .........................................................................................................................34
Instruments ........................................................................................................................36
Myers-Briggs Personality Type Indicator ....................................................................36
Hogan Grief Reaction Checklist ..................................................................................38
Prolonged Grief 13 .......................................................................................................39
Grief Pattern Inventory ................................................................................................40
ISLES ...........................................................................................................................41
Research Questions and Hypotheses ................................................................................42
Data Analysis ....................................................................................................................43
Expected Findings .............................................................................................................45
CHAPTER 4. DATA COLLECTION AND ANALYSIS ............................................................47
Introduction .......................................................................................................................47
Description of the Sample .................................................................................................47
Summary of the Results ....................................................................................................51
Conclusion ........................................................................................................................57
CHAPTER 5. RESULTS, CONCLUSIONS AND RECOMMENDATIONS .............................59
Introduction .......................................................................................................................59
Summary of the Results ....................................................................................................59
Discussion of the Results ..................................................................................................62
Discussion of the Conclusions ..........................................................................................64

v
Limitations ........................................................................................................................64
Recommendations for Future Research or Interventions ..................................................65
Conclusion ........................................................................................................................65
REFERENCES ..............................................................................................................................67
APPENDIX A. STATEMENT OF ORIGINAL WORK .............................................................75
APPENDIX B. PARTICIPANT SCREENING ............................................................................77

vi
List of Tables
Table 1. Description of Sample: Gender, Age Range and Ethnicity .............................................47 Table 2. Frequencies of MBTI 16 Types ......................................................................................48 Table 3. Percentage of Extraversion and Introversion in Sample and General Population ..........49 Table 4. Percentage of MBTI Dominant Functions ......................................................................49 Table 5. Percentages of MBTI Functional Pairs ...........................................................................49 Table 6. Means, Standard Deviations, Skew, Standard Error, Kurtosis and Standard Error of Total Scores ...............................................................................................................................51 Table 7. Outcomes of Hogan Grief Reaction Checklist with Functional Pair as Predictor Variable .........................................................................................................................................53 Table 8. Significant Differences Between Functional Pairs on the ISLES ...................................55 Table 9. Significant Differences in Intuitive Scores of the GPI with Functional Pairs ................56 Table 10. P values of significant results with Functional Pairs ...................................................58
1
CHAPTER 1. INTRODUCTION
Background of the Problem
The pattern of life suggests if we live long enough, someone we love will die. How one
responds to that death has been the topic of psychological study for hundreds of years (Granek,
2010). Response to the death of a loved one has been called by many names; grief, mourning,
melancholia, bereavement or adjustment and recovery to the loss. The expectations of response
to death has changed over the decades, it has evolved, become complex, shifted to the simple,
included steps or tasks or stages, and repositioned away from stages. The categorization of the
response has grown to include, normal, pathological, complicated, extended, acute, chronic and
many more labels used to describe the response to the death of a loved one. Why has the study of
grief, this study’s preferred term, become so complex, so polarizing at times? Because grief is
elusive to define, complex in its nature and unpredictable in its symptoms and at times
irresolvable. The study of grief has become increasingly popular as the topic came out of the
shadows in a culture that for many decades regarded it as taboo to discuss. In the early 1970’s,
the heralded work of Elisabeth Kubler Ross (1969) brought death, dying and grief into the open
for the American culture to discuss. Since that time, the conversation in America has bloomed
into an ever changing, growing discussion of how we respond when someone we love dies.
The metaphor of grief as a journey is popular and accurate. Grief is a journey through
emotional and cognitive changes as we live life without the loved one who has died. The journey
to new self-definition, new self-identity and new meanings in life is at times demanding and
difficult, at other times fairly smooth and natural. The ringing truth in the metaphor of grief as a
journey is that each person facing grief is on a personal and individual journey. In the twists and

2
turns of the journey, Rando (1988) suggests people respond to loss in much the same manner as
they live their lives, “using the responses with which they have become familiar.” The
individualized nature of grief is at the center of the present study.
Statement of the Problem
If the process of grief is not a universal, stage-oriented journey as suggested by Kubler
Ross (1969) or a defined set of tasks to be completed (Worden, 1999) or a “one way to grieve”
approach presented by Staudacher (1991) or even the reordering and restructuring brought to the
fore by Rando (1988), then what can we determine about the individualized grief process? The
newest thought in the field of thanatology suggests several possibilities, including grief as a
process of individual meaning making (Neimeyer, 2001). This meaning making approach
requires a redefinition of self-identity in the world. A strong emphasis is placed upon the
narrative role of creating one’s life story with the death of loved ones placed within the
reconstruction. Another possibility exists within the theory of individual grief styles (Martin and
Doka, 2010) which asserts that at least two prominent styles of grief, instrumental and intuitive,
guides the griever through different behaviors or patterns of grief response. Lastly,
individualized grief is characterized by Wolfelt (1998) as a truly personal journey taken step-by-
step, alone, without predetermined guidelines of right or wrong. This view of grief holds that
grief is natural and not to be pathologized by the field of psychology. Wolfelt suggests
practitioners’ best help is to be simply a companion on the journey, not a guide.
In light of this view of individualized grief, the question arises as to whether there are any
markers or determinants to point the possible route one might take. While grief is a deeply
individual process, are there determining factors that contribute to a possible grief response?

3
Many theories suggest the answer is yes. Within the context of individualized grief there are
some markers influencing the griever’s response. For example, Worden (2009), Rando (1985)
and Sanders (1999) include such markers as relationship to the deceased, lifestyle prior to the
death, the type of death, the bereaved person’s social system and the personality of the bereaved
as strong influences on grief response. However, even though many practitioners agree with
these assumptions, empirical evidence does not exist to support the influence of personality. This
study seeks to explore one of the possible powerful influences on individual grieving;
personality.
Purpose of the Study
This study will examine the possible impact of personality type on grief response. The
intent of this study is to provide empirical evidence to bridge the gap in existing literature
relating personality to grief response. As noted by Martin and Doka (2011) the need for a theory
of grief style that is supported by empirical evidence is clear. It is expected that this study will
provide the much needed empirical evidence to support the Martin and Doka (1998) theory,
which Doughty (2009) found in a large Delphi Study practitioners have generally accepted as
accurate and helpful.
Very little empirical data exists exploring this important relationship between personality
type as an influence in individualized grief response. While many studies explore personality as
a predictor to chronic or maladaptive grief (McRae and Costa, 1988; Bailley, 1999; Bonnano,
Wortman and Neece, 2004 and Prigerson, 2004) and only two (Jelly, 1990 and Fraser-Beekman,
1999) studied the relationship between normative personality type (MBTI) and normal grief or
adaptive grief. This is a clear indication of the need for further study. This study is designed to

4
answer the call to fill “the need to understand this critical aspect of individualized grief” (R.A.
Neimeyer, personal communication, July 14, 2011).
The price we pay in life for loving someone is the grief we experience when they die. For
some individuals, the emotional price of grief seems extremely high, while others seem to spend
a minimal emotional amount. The vastly different responses to grief is at the core of this study
which seeks to provide a closer look at why each individual faces the death of a loved one in a
certain manner. This study sets forth the idea that our individualized grief response is related to
and informed by our personality type. This idea follows the statement by Rando (2000) as the
person has lived prior to the loss is a predictor of how they will live following the loss. This
study seeks to provide information for those who work with the grieving population.
Significance of the Study
Justification for this study lies in the applicability of its findings to a large group of
people. It is estimated that within the United States 741 persons per 100,000 died in 2009
(National Center for Health Statistics, 2011). Meaning overall, there were 2,436,682 deaths in
the United States in 2009. When one considers the number of people each death affects, at any
given time, millions of people in the United States are grieving. With millions of people grieving
in the United States, the need to understand why people respond to grief in a variety of ways is
essential to the field of bereavement. From those who are personally touched by a death to the
professionals, ministers, friends and family working to build a social network of support,
information on the individualized nature of grief is needed. Additionally, as Granek (2010, p. 66)
states “grief is slowly morphing from a difficult, but necessary condition of living, into a
psychological disorder that can be observed, diagnosed, and treated”. This study seeks to provide
5
information that might help to normalize grief response from psychological disorder to normal
reaction to loss in life. Specifically, the call is to expand the literature regarding how one’s
personality impacts grief. Understanding this relationship between grief and personality will help
both grievers and those who strive to companion with them in their grief journey (Wolfelt,
1998).
Research Design
Within a non-experimental, quantitative design, the study seeks to survey persons who
have experienced the death of a loved one in order to measure the differences between group
responses according to personality type. The participants’ personalities will be determined by the
Myers Briggs Personality Type Indicator (MBTI). Once the type has been determined, groups
will be formed by certain aspects of type dynamics. To explain further the first group will be
divided by their preferred attitude (Extroversion or Introversion), known as the attitude in which
a person’s source of energy is acquired, externally or internally. The second way in which the
population will be divided is through their preferred functional pair (ST, SF, NT, NF). These
letters represent the person’s preference in Sensing or Intuition (used to acquire information) and
Thinking or Feeling (used to make decisions). When combined the two letters comprise the
information gathering and decision making functions of the personality. Lastly, the population
will be divided into groups formed by the personality’s dominant function (Se, Ne, Te, Fe, Si, Ni, Ti,
Fi). The dominant function is determined by the personality’s combination of Attitude (E or I)
and the Lifestyle (J or P). The lifestyle aspect of the personality refers to how structured or
unstructured the person prefers to plan their life. That points to a personality that seeks to decide
or seeks more information before deciding. When combined, a personality then has at the core, a

6
dominant aspect, known as the dominant function. By definition, it is the first and favorite
function; the one Myers (1995) refers to as the captain of a ship, having the most important role
in guiding us, and ultimately becoming the core of our conscious personality. The decision to
observe and compare the groups in this manner reflects the importance of type dynamics, which
is where the subtle nuances of type can be seen (Martin, 1997).
Once the MBTI groups are established, an analysis of their grief responses, as measured
by the Hogan Grief Reaction Checklist (HGRC, 2001), the Grief Pattern Inventory (GPI, 2010),
the Prolonged Grief 13 (PG13, Prigerson and Maciejewski, 2008) and the Integration of Stressful
Life Events Scale (ISLES, 2010) will take place. Each of these measures provides a different
perspective on grief response. The Hogan is a more traditional assessment of adult reaction to the
loss of a loved one, with six subscales. The six subscales begin with Denial, which measures the
emotional response to the death in questions regarding sadness, heaviness, shock, and
hopelessness. The second scale is titled Panic Behavior and refers to several physical and
emotional responses including increased heart rate, muscle tension, excessive worry and fear.
The third scale is Personal Growth and questions the participant on the aspects of grief, which
include being a better person, understanding others better, more tolerance, better outlook on life,
and having hope for the future. The fourth scale is titled Blame and Anger and concentrates on
those feelings regarding the death. The questions on this scale include feeling revengeful, hostile,
bitter and resentful. The fifth scale is Detachment and centers on questions of feeling detached
from the world since the death with questions about coping, control, lack of confidence and
confusion about identity. The sixth scale is Disorganization and gives participant opportunity to
rank issues of forgetfulness, memory issues, concentration, and overwhelmed by tasks. Overall
scores and scale scores will be compared in the analysis. The Prolonged Grief 13 (Prigerson and

7
Maciejewski, 2008) is a thirteen question assessment designed to diagnose the relatively new
category of grief now called prolonged grief disorder (PGD). This assessment is included in the
study to determine if a participant is suffering from PGD, if a participant scores in the range
indicating PGD, their data will be removed from the sample and reviewed individually. The PG
13 assesses the five criterion established for the existence of prolonged grief, those five include:
1) a death event, 2) separation distress, 3) duration criterion, 4) cognitive, emotional and
behavioral symptoms and 5) impairment criterion. The PG-13 is designed to assess a wide
variety of potential PGD symptoms, using five-point scales to represent increasing levels of
symptom severity. The PG-13 is a modification of the Inventory of Complicated Grief (ICG) that
includes all the symptoms proposed by the consensus panel and additional symptoms enabling
the testing of alternative diagnostic algorithms. The PG-13 and the original ICG have both
proven highly reliable (e.g., Cronbach’s a.0.90; test-retest reliability coefficient = 0.80) and to
possess criterion validity. (Prigerson & Maciejewski, 2008). Holland, Neimeyer, Bolen and
Prigerson (2009), report the PG-13 has been found to assess detrimental outcomes of grief more
reliably than the Texas Revised Inventory of Grief and found to assess the sensitivities of those
affected by traumatic grief more accurately than the Core Bereavement Instrument. The Grief
Pattern Inventory (2010) is a measure of Doka and Martin’s theory of grief styles. The inventory
is designed to distinguish between the participants preference for intuitive, instrumental or
blended grief style. As an overview of these two styles beginning with the intuitive griever, the
authors define the intuitive style as the more emotionally expressivethe intuitive griever
experiences the loss deeply. Emotional expressions of the traditionally held appropriate feelings
are common for the intuitive griever. The intuitive griever expresses outwardly what is being felt
by their inner self. They do not distance themselves from the feelings of grief for themselves or
8
others. The primary adaptive strategy identified by the authors is a going with the experience of
grief. The instrumental griever preference is, by nature, on the other end of the expression scale.
In many ways, the instrumental griever focuses on the cognitive process of grief not the emotive.
The instrumental griever works to master the feelings, not give way to them. Problem solving
often becomes the primary focus for the instrumental griever. While the outer expression is not
feeling oriented, the instrumental griever finds ways to work through the grief as a means of
expression. Tangible, physical forms of problem solving are the ultimate form of expression for
the instrumental. The blended style is, as one would expect a blend of the two styles. The
blended style is found in those who are expressive with the emotive and cognitive styles and are
not exclusive in preference. The authors also discuss the dissonant response in which a griever is
forced to act upon the non-natural preference as a result of expectations by gender, culture or
other sociological influences. The Grief Pattern Inventory will provide an interesting current
theory contrast to the traditional assessments. The ISLES is a scale measuring the meaning
making construct of grief. In the meaning making theory of grief, the focus is not on the
immediate physical, emotional and cognitive responses to the death, but on the ability of the
griever to adaptively incorporate the death into a broader life story (Neimeyer, 2011). The ISLES
scale is comprised of a total score and two subscale scores. The two subscales are Footing in the
World and Comprehensibility. The Footing in the World scale refers to the griever’s sense of
being oriented or disoriented in the world around them. Several items ask about this in terms of
the world making sense, my place in the world, faith and hopes for the future. The second
subscale, Comprehensibility, measures the griever’s sense of integrating meaning making
surrounding the loss. The making of meaning items center around beliefs, values and self-
awareness. The inclusion of the four measures, HGRC, PG13, GPI, and ISLES, will provide a

9
strong foundational basis for the analysis of the relationship between grief response and
personality type.
The population from which the sample will be drawn is people living in the within the
United States who read English at a sixth grade level to understand the four measures, between
the ages of 24 and 75, who have experienced the death of a significant person more than 3
months prior to study and less than 10 years prior to the study. The researcher will obtain a
sample size of 250, this number is based on a power analysis estimating a rough MBTI effect
size of .25 (e.g., Huntington, 2009), alpha level of .05, desired power of .80, a design with 8
cells, and differing population incidences of the personality groups represented by these 8 cells.
The eight groups to be studied differ in their incidence in the general population, with the ratio of
the largest to the smallest group being about 4:1. The percentages are as follows: Extroverted
Thinking (12%), Introverted Thinking (9%), Extroverted Feeling (11%), Introverted Feeling
(11%), Extroverted Sensing (22%), Introverted Sensing (20%), Extroverted Intuiting (10%), and
Introverted Intuiting (5%). This can also be broken down by Extroverted (55%) and Introverted
(45%); or by Thinking (21%), Feeling (22%), Sensing (42%), and Intuiting (15%). Thus,
Extroversion and Sensing are overrepresented in the population, whereas Introversion and
Intuiting are underrepresented. Due to the difficulty in prescreening participants by personality
group, overall sample size has been calculated so as to achieve 80% power in detecting
differences among the smallest groups in the sample—i.e., Introverted Intuiting vs. Introverted
Thinking.
The study will utilize a convenience purposeful sampling strategy. The rationale for
selecting a purposeful sample from a variety of sources is to obtain a group of individuals who
have experienced the death of a loved one. Purposeful Sampling as stated in Creswell (2007) is

10
chosen in order for the researcher to select participants for study because they purposefully
inform an understanding of the research problem and central phenomenon in the study.
Recruiting of the sample will take place through the president of the memorial chapel, the
minister of the mission center and the researcher’s email. The researcher will extend an online
invitation to these three communities. The invitation will outline the purpose of the study and
lead perspective participants to the online website where all consent forms and surveys are
available. The website will be designed to introduce participants to the study, to determine if
participants meet the criterion of having experienced the death of a loved one in the time period
being studied and to seek informed consent. After giving informed consent, participants will be
asked basic demographic information. Participants will be instructed to respond with regard to
only one death of a loved one. If they have experienced multiple losses, participants will be
asked to choose the death that has had the greatest impact. Participants will then complete the
two measures (MBTI and Combined Grief Questions) using an online system, with each
participant issued a unique username and password to ensure the participant only completes the
survey once. Once the surveys are completed, the participants will be advised of resources
available to them if the answering of the questions has cause any emotional concerns.
Participants will be invited to sign up for a copy of the study results through email. The email list
will be kept separately and not attached to participants’ information, protecting confidentiality of
the participants. The participants will also be invited to sign up for a summary webinar to be
given by the researcher to discuss the findings of the study.
Data Analysis
The study will use a non-experimental design in which respondents’ personality, grief
responses, and demographic information will be collected and analyzed. The data will be

11
analyzed using a series of Multiple Analyses of Variance (MANOVAs). Survey data will be
collected online.
Quantitative data will be compiled in an SPSS file, cleaned, coded and labeled, checked
for normality and outliers, and analyzed using a series of multivariate Analyses of Variance
(MANOVAs). Two sets of analyses will be performed. In the first set of analyses, each 2 x 2 x 2
MANOVA will include the independent variables Attitude (Extroverted, Introverted), Perceiving
Function (Sensing, Intuiting), and Judging Function (Thinking, Feeling). In the second set of
analyses, each 2 x 4 MANOVA will include the independent variables Attitude and Dominant
Function (Sensing, Intuiting, Thinking, and Feeling). For both sets of analyses, each of the three
MANOVAs will use the subscales of one of the grief scales—HGRC, GPI, PG13 or ISLES—as
its dependent variables (in fact, ISLES has only one global scale and thus will be analyzed using
a simple ANOVA). Finally, any demographic control variables deemed relevant to the analyses
will be included as control factors. Post-hoc analyses—corrected to account for inflated Type I
error—will be conducted on any significant effects to test for differences among Functional Pairs
(ST, SF, NT, NF) and among Dominant Functions (Se, Ne, Te, Fe, Si, Ni, Ti, Fi). Data will be
identified using only code numbers associated with participants; the file associating participants’
identifying information with their code numbers will be stored separately in a secure facility and
destroyed after the research is completed.
Research Questions
The research question states: Is there a difference in grief response between groups with
differing MBTI personality types? Beyond the basic research question are the nine sub questions
relating to each group and each grief assessment. The sub-questions are:
12
Subquestion 1: Is there a difference between groups with an introverted attitude and an extroverted attitude on the HGRC and its subscales? Subquestion 2: Is there a difference between groups with differing functional pairs (ST,SF,NT,NF) on the HGRC and its subscales? Subquestion 3: Are there differences between any of the 8 dominant function groups that indicate an interaction between attitude and function on the HGRC? Subquestion 4: Is there a difference between groups with an introverted attitude and an extroverted attitude on the ISLES and its subscales? Subquestion 5: Is there a difference between groups with differing functional pairs (ST,SF,NT,NF) on the ISLES and its subscales? Subquestion 6: Are there differences between any of the 8 dominant function groups that indicate an interaction between attitude and function on the ISLES and its subscales? Subquestion 7: Is there a difference between groups with an introverted attitude and an extroverted attitude on the GPI? Subquestion 8: Is there a difference between groups with differing functional pairs (ST,SF,NT,NF) on the GPI? Subquestion 9: Are there differences between any of the 8 dominant function groups that indicate an interaction between attitude and function on the GPI? Subquestion 10: Do any patterns emerge regarding Prolonged Grief between groups? Is there a higher incidence of prolonged grief within this sample?
Assumptions and Limitations
The most general assumption in this study is there are no good or bad grief styles. While
some grief responses may seem maladaptive, this study is not seeking to discriminate on the
quality of the grief experience. It is assumed that the measuring instruments are valid and
reliable, and that they will measure exactly what they were designed to measure. Another
assumption is the participants will be honest in their responses to the MBTI and to the grief
questions. The theoretical assumptions include the ability of the MBTI to give an accurate and

13
reliable Jungian personality type for each of the participants. Another theoretical assumption
concerns the approach to grief style by Martin and Doka (1998). This study assumes an
anecdotal validity to this theory, while it has yet to be tested with empirical data. That is also one
of the most significant reasons for this study. A topic specific assumption in this study is the
variable of time. This study assumes the experience of grief is not measured in the amount of
time that has passed since the loss. This study will include people whose loss happened between
3 months to 10 years prior to the study.
Limitations to this study include using the selected assessments (MBTI, HGRS, PG13,
ISLES and GPI) as each one is a self-report tool. If the respondent does not answer the questions
fully or does not answer them accurately or honestly, this will negatively impact the results.
Additionally, since participation in this research study is voluntary, participants may be different
from nonparticipants. It is assumed the study will have enough participants to mirror the known
percentage of each type in the general population. It is assumed their results, collectively, will
provide accurate and reliable data.
Definitions
In order to have a clearer understanding of the concepts being examined in the study, the
following terms need to be defined:
Grief – this study will use the term grief in reference to “reactions to loss…physical,
behavioral, psychological, cognitive or affective, social or spiritual in nature” (Corr and Corr,
2007).
Hogan Grief Reaction Checklist- (HGRC), developed by Hogan, Greenfield, and Schmidt
(2001), designed to measure the multidimensional nature of the bereavement process,
specifically for use with individuals that have suffered the loss of a loved one through death.

14
Integration of Stressful Life Events Scale (ISLES): As Holland, Currier, Coleman, and
Neimeyer (2009, p. 328) state “The ISLES assesses the degree to which a stressful life
experience has been adaptively incorporated into a broader life story that may promote a sense of
internal coherence and foster a secure and hopeful view of the future.”
Myers-Briggs Personality Type Indicator (MBTI). A well-established questionnaire
developed to identify an examinee’s personality preference based on four dimensions derived
from the research of Carl Jung. It assesses the relative strength of the processes of introversion
versus extraversion, sensing versus intuition, thinking versus feeling, and judging versus
perception (McCaulley, 1990).
Personality type – a collection of dynamic and organized characteristics that influence a
person’s cognitions, motivations and behaviors (Myers and McCaulley, 1985).
Prolonged Grief Disorder – this term is used to describe a newly defined mental disorder
that is a specific reaction to the loss of a loved one through death. A particular set of PGD
symptoms – feelings, thoughts, actions – must be elevated at 6 months post-loss and must be
associated with significant functional impairment in order for a person to meet criteria for PGD
(Prigerson and Maciejewski, 2008).
Expected Outcomes
In each of the measures (HGRC, GPI and ISLES) it is expected that the mean test scores
will show significant differences among the two personality attitudes (Extroverted and
Introverted), the four personality functional pairs (ST, SF, NT, NF) and the eight personality
dominant function groups (Se, Ne, Te, Fe, Si, Ni, Ti, Fi).
Specific expectations for each of the measures are as follows:

15
It is expected that the HGRC subscale scores for Panic Behavior, Blame and Anger, and
Despair will be lower for dominant Thinkers compared to dominant Feelers. It is also expected
that the subscale scores for Personal Growth will be lower for dominant Sensors than dominant
Intuitives. It is also expected that the subscale scores for Detachment will be lower for dominant
Thinkers than for dominant Feelers.
It is expected that on the ISLES subscale “Comprehensibility” those with a preference for
Intuition will score higher than those with a Sensing preference. Additionally, those types that
include Sensors or Thinkers will score higher on “Footing in the World” subscale than those that
include Intuitive and Feeling.
It is expected that those whose dominant functional pair is Sensing/Thinking will fall into
the instrumental style of the GPI. Conversely, those whose dominant functional pair is
Intuition/Feeling (extraverted or introverted) will fall into the intuitive style.
It is expected that between 8% and 10% of the sample with score above 25 on the PG13
scale which qualifies for prolonged grief disorder, this is the current expected rate within the
general population.
Organization of the Remainder of the Study
The written presentation of this study is made up of five chapters. Chapter 1, the
introduction to the study, has subsections addressing the following topics: background of the
study, statement of the problem, purpose of the study, research questions, definition of terms,
and assumptions and limitations of the research. The second chapter will include a
comprehensive review of the existing literature on grief and personality theory. That chapter is

16
followed by the methodology discussion in Chapter 3, which includes a detailed explanation of
the chosen research method, sampling methods, data collection method, and statistical methods
used to interpret the data. That chapter also describes and defines the variables used in the study,
as well as discusses the various hypotheses derived from the research questions. Finally, that
chapter includes some discussion on the expected findings of the research. Chapter 4 presents the
analysis of the collected data and discusses the results of the study. In Chapter 5, the results of
the study are further discussed in terms of how the results relate to the hypotheses and direction
for future studies on the research topic.

17
CHAPTER 2. REVIEW OF THE LITERATURE
In reviewing the literature on the relationship between grief and personality, the scarcity
of work becomes obvious. An exhaustive search of the literature in both the areas of personality
psychology and thanatology (the study of death, dying and bereavement) utilizing ProQuest,
PsychArticles, Sage Journals and ERIC computer searches with a manual search through
journals of specific interest, yielded only two studies aimed at the measurement of personality
through MBTI and normal, individualized grief response. This is another clear indicator of the
need to fill the gap in the literature regarding this important relationship. In the following review,
historical perspectives on the development of grief theory, and personality theory will be
presented. Both fields provide a rich and often times controversial debate during which the
views, cultural shifts and pathology of these topics has been revealed. This chapter is intended to
provide a basic review of how we came to our current understanding of grief, as varied as it
might be and our current understanding of Jungian personality type psychology, with its
proponents’ and opponents’ views. This chapter will highlight literature concerning the study of
the relationship between personality and grief response, while not in the same light as the
proposed study, as a helpful comparison. A review of the literature when both personality and
grief have been the topic of a study will also be included. Additionally, this review will discuss
the methodology of this study as well as the literature supporting this methodological approach.
Historical Perspective on Grief Theory
Since Burton’s The Anatomy of Melancholy (1651) introduced the study of grief as
melancholia, psychology continues to develop an understanding of the grief response. Grief as a
psychological construct has gone from being considered a normal response regarding a loved

18
one’s death to at one point considered a pathological illness to be treated solely by psychologists
(Parkes, 1971). In the last decade, grief has begun to be categorized or classified with such
distinctions as prolonged grief, acute grief or complicated grief, with complicated grief currently
being considered for the DSM5 inclusion (Prigerson, 2004).
From the earliest of recorded time, grief has been the subject of many theorists,
philosophers, theologians and eventually psychologists. For grief is one of few universal
experiences, if you live long enough, someone you love will die and you will grieve. The genesis
of psychological study of grief is most often credited to the seminal work of Sigmund Freud
(1917) whose writings on grief led to the idea of grief as a form of melancholia. He also
introduced the concept of “grief as work” to be resolved, or if left unresolved, leaving the person
at risk of mental illness. It is important to note that prior to Freud, in the 19th century, grief was
seen as a condition of the human spirit or soul. Which might sometimes be viewed as a cause of
insanity, but it was not itself a mental illness (Walter, 2005–2006, p. 73). Freud is credited with
bringing it into the realm of psychological study.
However, prior to Freud, in 1651, Burton in his book, The Anatomy of Melancholy
described grief as a kind of transitory melancholy which all people experience at some point in
life. Burton also distinguished the difference between melancholy as a disease, and melancholy
as a normal reaction to events such as death of a loved one. Additionally, he observed that some
have a melancholic character and others have situational melancholy. Archer (1999) suggests
Burton was, in fact, the first to define the concept of grief in psychological terms. Following
Freud, the first to author a thorough study in the psychology of grief was A. F. Shand (1920).
One of the major contributions by Shand was the establishment of four distinct reactions to grief:
the first was active and directed aggressively to the outside world; the second was depressive and

19
lacking in energy; the third suppressed through self-control; and the fourth involved frenzied and
frantic activity (Granek, 2010). Additionally, Shand (1920) discussed the need for social support,
the continued relationship with the deceased, and the trauma associated with sudden death.
However, in the shadow of Freud’s continued influence, those coping strategies did not come to
the fore. Historically, it was the influence of Freud, not only in the area of grief, but in the
overall field of psychology, that impacted the continuation of “grief as pathology” theories.
Freud’s impact on the United States popular thought regarding mental or psychological health
introduced a continuum between normality and abnormality. The idea of a continuum versus the
presence or absence of pathology was a completely new way of looking at mental health. This
was the foundation upon which the “construct of grief as a psychological object of study was
born (Granek, 2010).” It was also Freud who clearly influenced the idea of detaching emotional
energy from the one who had died. If this detachment was not completed, the griever was at risk
of what has been termed pathological grieving. This concept was to influence the coming
decades of grief theory in the Western world. It is also important to note that Freud would most
likely disagree with the interpretation of his ideas on grief as a process to work through to
completion. As he wrote in 1917, grief is a slow and laborious process and that it is never
completely resolved (Granek, 2010). Yet, out of Freud’s original concepts sprang various
theories of grief “work” (Abraham, 1924; Deutsch, 1937; Klein, 1940).
Helene Deutsch (1937), in her essay The Absence of Grief observed there is not one
normal course for mourning. She described the possibility of responses ranging from violent to
prolonged or intense and ongoing. It is assumed she was basing this upon her clinical experience,
as she cited no other authors when staking these claims. She also used the phrase “normal course
of mourning” which was counter to the theorists of her day, and might have been a rhetorical

20
statement to support her argument that grief must produce a reaction in the bereaved, and that the
absence of such grief is a sign of pathology (Granek, 2010). This idea of unmanifested grief as a
sign of illness became a commonly held supposition and many still hold the lack of emotional
expression as abnormal.
Another step in the ongoing evolution of grief theory occurred when Lindemann (1944)
published Symptomatology and the Management of Acute Grief. In this landmark publication,
Lindemann claimed that he could articulate the actual grieving process, and explain the role of
the psychiatrist in assisting the mourner in their grief work. In this study, Lindemann interviewed
101 recently bereaved individuals and established that grief was a disease or syndrome, that
normal and abnormal grief could be determined through symptomology, and that the role of the
psychiatrist was to assist in the management of the grief since they now had the knowledge and
expertise to help mourners in their grief work. Lindemann identified three basic stages of grief.
The first stage, defined as an over-riding denial of the loss, Lindemann declared as shock and
disbelief. The second stage, characterized by a person’s lack of acceptance of the loss, was
named acute mourning, which involved a disinterest in daily life, inability to sleep or eat, and
feelings of tearfulness, loneliness, and intensified thoughts of images of the deaths were
considered aspects of stage two. The third stage was resolution, which Lindemann described as a
person’s gradual reentry into life with a less interest in the deceased. Lindemann was the first to
dictate the idea that grief involved the completion of tasks, and it was Lindemann who placed the
context of time into the success of a person’s grief work. Lindemann’s theory stated it was work
was only through diligent work on themselves with the aid of a psychiatrist that someone could
get through their grief. Gilbert (2006), pinpoints this mandate from Lindemann as one of the
causes for anxiety in Western cultures over the question am I doing my grief work fast enough?

21
It was following Lindemann that grief theorists began to separate into two distinct
groups; the linear, time oriented theories or the circular theories, non structured and reoccurring
as waves of grief. Up to this day, the two camps struggle with finding a blend between the two
(Worden, 2011).
In the 1970’s, the work of John Bowlby (1969) brought the focus of loss and attachment
in infants to the forefront. His work centered on the relationship between infants and mothers,
but included children of all ages whose primary relationships had been disrupted. Prior to his
work, it was widely held that infants sought only to be fed from caregivers and no other needs
were present. Yet as Kraemer, Steele and Holmes (2007) emphasized, “it is impossible for us to
now imagine that a child would not seek to be looked after as much as it wants to be fed.”
However, Bowlby’s studies have strong limitations that require comment. From the beginning of
his development of the attachment theory, Bowlby worked exclusively with infants, youth, and
adolescents with disruptive and delinquent lives, and primarily institutionalized children. His
first study was based upon 44 juveniles who had been placed into the system for stealing. His
control group was then 44 children who were “unstable or neurotic” (Bowlby, 1944) but had not
been caught stealing. This population leads to an extremely limited ability to generalize the
observations to all children. However, when the cases are reviewed through the current lens of
child psychiatry, the subjects might share similar diagnoses such as Reactive Attachment
Disorder (Follan and Minnis, 2010). Additionally, his lack of empirical evidence to show cause
and effect has been challenged repeatedly over the decades since the writing of his trilogy (1969,
1972, 1980). Child development specialists have spent the decades since Bowlby’s work in
testing and supporting the needs of the child. While many of Bowlby’s original ideas have been
left behind (Rutter, 1995), Bowlby brought the importance of attachment and the repercussions

22
of loss into the field of child development and also inspired a new theory of grief and loss. It is
out of the noted limitations in Bowlby’s population and the generalizations regarding loss to all
relationships that this study proposes to find a sample population which will represent more
grievers to fill a gap in the literature of individualized grief.
Parkes (1964) taking up the continuation of Bowlby’s attachment theory, but in work
with bereaved adults brought a more scientific, empirically based approach to defining grief.
Parkes analyzed the case studies of 3,245 adults who were admitted to two psychiatric units
during 1949-1951. Out of those case studies, he found 94 patients who had experienced the death
of a loved one in the six months prior to admittance. This was one of his self-defined quantitative
studies that yielded outcomes to support his claim that grief was indeed an illness and
psychological intervention was a necessity. Parkes followed up this case study with a study of 21
psychiatric patients in Bethlehem (1965) who had experienced loss and then 22 London widows
under the age of 65 (1970). In both studies, the populations were by no means a representative
sample, therefore the generalization of their grief responses to a non-pathological population is
suspect. While Parkes work brought forth attention to the aspects of protest and despair in grief,
many of the assumptions of the theory are based upon case study, narrative and qualitative study
that are drawn from non-representative populations.
During this same time frame, a profound work was evolving out of a population of
individuals who were facing the impending loss of their own life. In 1969, Elizabeth Kubler-
Ross published her book On Death and Dying. Kubler-Ross identified the five stages of grief for
the dying as denial, anger, bargaining, depression and acceptance. While her work was with
those who had received a terminal diagnosis and were facing their own death, Kubler-Ross’
theory became a “a model for understanding and normalizing not only the experiences of those

23
who are dying but also the reactions of individuals who have survived a variety of losses”
(Lamb, 1988). The stages of grief are probably the most recognizable theory of grief in the U.S.
culture to date. The popularity of a way of “doing” grief met with the Western idea of needing to
know how to do everything right. Throughout her dedicated life, Kubler-Ross continued to refine
and shape the message and interpretation of the stages of grief she had set forth (Kessler, 2005).
Her focus upon stages, or a lock-step pattern of grief shifted to the meanings and implications of
the loss, ultimately deciding that grief may never be completely resolved which has the effect of
normalizing these experiences. Her last written words (2005) she stated “I am so much more than
five stages. And so are you. It is not just about knowing the stages. It is not just about the life lost
but also about the life lived.” Kubler-Ross’ personal transition from a 1969 theory of stages to a
2005 overarching search for meaning in life and in death, parallels what has happened in the
American field of grief studies in the past thirty years. However, a gap exists between popular
usage of the theory and understanding of the theory in its context within and evolving field.
John Worden (1977), adapting the research of Bowlby (1969) and other earlier theorists
introduced a specific set of tasks to accomplish in grief. This continued the idea of grief as a
process of recovery through work. Worden’s tasks include:
1) Accepting the reality of the loss.
2) To work through the pain of grief.
3) To adjust to an environment in which the deceased is missing.
4) To emotionally relocate the deceased and move on with life.
Worden (2011) currently holds a more flexible view than originally proposed, stating the
tasks were not intended to be concrete or linear, but flexible guides of psychological work to be
completed. Therese Rando (1988), who began studying trauma in the early 1980’s, introduced

24
the Six R’s model of recovery with the bereaved moving from recognizing the loss to
reinvesting in life. She too, added to the linear process of the grief response and met with
opposition to the idea that recovery is an appropriate word to use in grief, as one may never
recover from loss, (Balk, 2008, Kauffman 2008).
A nonlinear approach to grief was brought to the field with the dual process model of
Stroebe and Schut (1999). The dual process model, based upon two separate psychological
processes occurring simultaneously, suggests that the griever moves, or oscillates, between a loss
orientation and a restoration orientation This idea of oscillation between coping and moving
forward, which differs for each individual brought to the fore the idea of grief as cyclical rather
than linear.
As the new millennium approached, several grief theorists (Brooks, 1999, Levang, 1998,
Neimeyer, 1999, Attig 1996) as well as practitioners (Wolfelt 1998) became more adamant in the
circular approach to grief rather than the linear, lock-step stages of the past. At the same time, the
lines were being drawn between the camps who view grief from a more pathological point and
those seeing grief as a normal human reaction to loss, not dependent upon improvement,
resolution or time frames (Peters, 2008). This battle continues with an open, professional
discussion of whether or not to include such terms as complicated grief, prolonged grief or post
traumatic grief in the most recent edition of the DSM (Prigerson, Neimeyer, & Davies, 2002).
After an exhaustive review of the historical perspective of grief theory, two things remain clear;
grieving will continue and the struggle to understand, define and approach the griever will
continue as well.

25
Historical Perspective on Personality Theory
The construct of personality, as with grief, has also gone through a development and
maturation process within the field of psychology. From the earliest work of Carl Jung (1927) to
the current use of the newest form of the NEO PI-R (2010), an ongoing debate regarding the
origins of personality, the categorization of personality, the inherent versus learned aspects of
personality have filled journals of psychiatry, psychology and sociology. Personality as a
construct has been studied from the earliest days of psychology. Beginning with the seminal
work of Carl Jung (1927), who saw the personality as a set of specific attitudes and functions
which form a predisposition to act or react in a characteristic direction (Martin, 1997). The
attitudes are extraversion and introversion, which have to do with energy and orientation to the
world. In the most basic of terms, the introverted attitude is a turning inward of psychic energy
while extraversion is a turning outward of psychic energy. The functions include sensing and
intuiting, as a way of taking in information, A sensing function is one that takes in information
through the physical senses, while the intuitive function is drawn to the big picture of a situation
through a sense of knowing. Additionally, the functions include thinking and feeling. These
functions pertain to how one makes decisions, with logic and reason, or through relationships
and harmony. A complete description of these personality aspects will be discussed in depth later
in this paper. Jung (as cited in McCaulley, 2000) put forth his work on typology of the
personality as a “critical tool for the research worker, who needs definite points of view and
guidelines if he is to reduce the chaotic profusion of individual experiences to any kind of order.”
The American popularity of Jung’s work began in 1927, when his work was translated into
English. In that year, Elizabeth Briggs and her daughter Isabel began to develop an assessment of
personality related to Jung’s attitudes and functions. After 35 years of testing, adapting and

26
refining, in 1962, Isabel Briggs-Myers published the first Myers Briggs Personality Type
Indicator (MBTI). Currently, the 1998 edition of the MBTI is used widely to measure the
attitudes and functions defined by Jung (CAPT, 2011). According to research (Gardner &
Martinko, 1996; McCrae & Costa, 2007; Myers, 1993; Thunholm, 2004; Wheeler et al., 2004)
Jungian personality theory is the most popular in terms of explaining mental cognition and
personality types.
In addition to Jungian typology, personality theorists of note include Gordon Allport
(1933) who did not agree with the popular environmental argument of influence at the time.
Lombardo and Foschi (2002) consider Gordon Allport the American father of modern
personality psychology and trace some of Allport’s theory to earlier European influences. As the
leading American spokesman in the development of personality trait psychology in the 1930’s
Gordon Allport advanced personality psychology to a discipline that scientifically studies the
individual through the dispositional construct of personality (Nicholson, 1998). Instead of an
inherent typology, he saw personality as a predisposed determinant of how one reacts to the
environment, through a trait perspective. Out of Allport’s decades of prolific work, came an
understanding of traits as individual strands that when put together, as in a bundle, make up a
personality, and that each person has a unique and individual bundle (1955). The actual
definition of personality was ever changing for Allport, who as late as 1961 was redefining the
context, with an intentional and deliberate wordsmithing of each phrase. Another important
aspect of Allport’s dispositional theory is the proprium of the personality. The proprium is
described as the central core of self, the phenomenal self, and the emergent mental construct of
self (Sheldon & Elliot, 1999). Allport (1955) described the proprium as that which is “peculiarly
mine.” As the center of the individual personality, the proprium is the home of values, beliefs,
27
identity and conscience. In 1961, Allport compiled a list of 17,000 words used to describe people
and this list became the foundation of traits used by the trait theorist to follow: Cattell (1949),
Eysenk (1952) and McRae and Costa (1989). Each of these trait theorists adapted from the
17,000 traits, their own number of important traits. The number was reduced to 16 (Cattell,
1949), then to 5 (Eysenk, 1952) and then to the 3 traits of Neuroticism, Extraversion and
Openness (McRae and Costa, 1989). The major shift between these theories has to do with the
actual measure of the trait or the type. Within Jungian typology, the use of a dichotomous scale
indicates preference of type an either/or perspective. McCaulley, a major contributor to the
MBTI stated in 2000 “type development is a lifelong journey toward consciousness and greater
differentiation along the inborn pathway for one’s type” (p 118). However, as trait theory gained
popularity and the number of traits were reduced to three, concerns arose regarding the limited
and often negative connotation of the words used to describe the traits (Salter, Evans and Forney,
2006). The use of trait theory began to take on a more pathological or clinical nature, rather than
typology’s desire to understand oneself and others. In 2010, the NEO PI-R by McRae and Costa
was updated to downplay the use of words such as neuroticism, in order to be more palatable to
the user. However, due to these concerns, and other user-friendly attributes, the MBTI remains
the most frequently used personality measure in nonclinical settings (CAPT, 2011). One
consistent agreement in this debate is that persons are unique, whether you refer to it as an
individual set of personality characteristics, the proprium, types, traits or bundles, the fact we are
unique has never been questioned.
Grief and Personality Literature
While Rando (1988), Worden (1977), Martin and Doka (2000) and Strobe and Schut
(1999) have expanded the body of knowledge in the understanding the individual nature of the

28
grief process, each theory falls short in explaining the role of personality in differences to the
grief response. Personality as a factor in the grief response was considered in early theories by
Bowlby (1969), and Parkes (1972), both mention personality as a possible factor or determinant
that might lead to a more intense or pronounced grief response. Over the past two decades, a
number of studies have examined grief responses with personality as one of many possible
determinants (Stroebe , Schut & Stroebe, 2008; Staudacher, 1991; Bonanno, 1999 and Corr,
Nabe & Corr, 2009). However, most of these studies relied upon trait psychology or the
pathological dimensions of personality disorders.
In one personality and grief study, Bailley (1999) studied a group of college aged
grievers and found high neuroticism and low agreeableness scores were predictors of grief
outcomes. The three outcomes measured include highly internalized distress, stigmatized grief
and existential anxiety. This study also found personality disorders such as borderline,
narcissistic and schizoid as strong determinants of “significant associations” with heightened
grief responses. Bailley asserts these findings support Lindemann’s claim that some of these
types might lead to poorer grief outcomes. In analysis of this study, some of the assumptions
made by the study include a judgment on quality of grief, with a presumed best outcome. The
three measures are negatively worded and there is no room for individualized grief to take on a
more positive meaning making approach to grief. The parameters of personality are also more
clinical in nature, with pathologies such as borderline and schizoid, not representative of a
normal population. The study did not pretest for any diagnosis of the 170 college age
participants. This narrow age range is also a limitation for the measure of grief in the normal
population.

29
Myers Briggs and Grief
There is limited empirical data looking at the relationship between normative personality
type utilizing MBTI and normal grief or adaptive grief ( Jelly, 1990 and Fraser-Beekman, 1999).
The first known study to utilize Myers Briggs as an instrument to measure grief response was
conducted in 1990 by Jelly. This study, which utilized a mix of qualitative, quantitative and
retrospective measures, centered on bereaved mothers and the relationship between their
personality type and coping resources. The group was comprised of 51 bereaved mothers from a
cross-section of the country. The participants were recruited through Compassionate Friends, a
support group for bereaved parents. Each participant completed the MBTI, the Coping Resources
Inventory (CRI) and a questionnaire developed by the researcher. The strongest analytical
outcome was the difference in coping resources between Extroverts and Introverts. Extroverts
reported higher levels of coping resources and focused on Social, Cognitive, Emotional and
Spiritual resources. The population was not evenly distributed, nor did the distribution mirror
that in the greater population. A high percentage of the participants preferred the Feeling
function and the Extraverted attitude. Jelly did go on to articulate that the ongoing study between
personality and grief coping resources was vital to understanding this component of grief
response.
The second known study was a qualitative research (Frasier-Beekman, 1999) in which 14
bereaved individuals who had experienced the death of a spouse were studied. These subjects
were given the Myers Briggs Type Indicator and then asked to verbally share, in a grief support
group that they were already attending, directed questions from the researcher. The researcher
then observed the participants in these groups and followed up with individual interviews. The
researcher’s central question was related to type dynamics. The researcher wanted to know if the

30
reaction to the experience of grief was based in the usage of the inferior function or dominant
function of the personality. The inferior function is the one least utilized and the one in which we
are the least skilled. The work of Quenk (1993) suggests that in times of stress, conflict or
trauma, people become “in the grip of our inferior function.” While Fraser-Beekman found
differences in styles of grieving between varying personality types, she did not find a significant
use of inferior function. Some concerns with this research design include the use of an extant
group of individuals, rather than a wider, yet purposeful sample. The researched did find rich and
meaningful sharing with these respondents, but the purely qualitative method and small related
sample size limit the application of the data. Fraser-Beekman was encouraged by the potential in
the research and expressed the need for further research.
In addition to the two known studies using MBTI to measure grief response, there are
two works published by the Center for Applied Psychological Type. The first is Recovery From
Loss (Tagliaferre and Harbaugh, 1990) which combines the personal experience of a widower,
Tagliaferre, with the clinical skill of a grief practitioner and MBTI expert (Harbaugh). The
outcome is a 20-step model of grief work. While this model seems to fit the ideas of
individualized grief process, the 20 steps and the language of the psychology of personality seem
burdensome for the griever. The book intends to give grievers a pathway to recovery, but does so
at a level of intellectual requirement that most grievers might become unable to digest. The book
is also not grounded in empirical data.
The Voices of Loss (Ginn, 1994) is a compilation of hypothetical first person explanations
of how each of the 16 MBTI types might explain how they grieve. This author enlisted the work
of over 40 persons “familiar with MBTI and with a personal experience of loss”(pg VII) to
review the narrative he had written to explain each type’s reaction to loss. The outcome is a

31
rather vague description of each type as they might respond to loss. It is also important to note
the term loss is not restricted to death, but also encompasses other forms of loss such as divorce.
The most positive aspect of this resource might be the guidelines to help those grieving. Each
type is followed by helpful ideas for those companioning someone who is grieving. This book is
not based upon empirical data.
Martin and Doka (2011) in their theory of grief styles, specifically name MBTI and type
psychology as a strong possible area for further research in understanding individualized grief
from a non-pathological view. In a recent review of their theory, Martin and Doka (2011) point
towards personality (MBTI) as a factor in grief style and indicate a need for empirically based
evidence to determine the differences shown in personality type and grief response. This study
seeks to answer the call to provide further knowledge on the impact of personality to grief
response and to be the first empirically evidenced study regarding Martin and Doka’s work.
32
CHAPTER 3. METHODOLOGY
Purpose of the Study
As noted in prior chapters, the purpose of this study was to fill a specific gap in the
literature regarding the influence of personality type on the individualized grief response. While
much has been assumed regarding grief and the possible influence of personality type, very little
empirical data exists to support or refute these assumptions. Personality has been mentioned by
many grief researchers and theorists prior to this study (Bonanno & Kaltman, 1999; McCrae &
Costa, 1987; Bailley, 1999; Worden, 2009; Martin & Doka, 2011), but only two looked
specifically at MBTI and grief response (Jelly, 1990; Frasier-Beekman, 1999). This proposed
study looked closely at the influence of MBTI personality type and individualized grief.
Specifically, the study worked to validate Martin and Doka (1998, 2010) who developed the
theory of grief styles, namely instrumental and intuitive, which are based upon behaviors,
personalities and patterns of grief response. Again, a gap exists in the research to support the
theory of grief styles, even though it is widely accepted among grief practitioners and researchers
(Doughty, 2003). This study sought to provide empirical data regarding not only Martin and
Doka’s styles, but also a broader range of styles of grief. The chief purpose therefore was to
provide for the gap in the literature regarding personality’s influence on grief response. This
chapter presents an overview of the research design, population, instrumentation, data collection
and analysis of this study, and concludes with a summary.
Research Design
When working with the bereaved, researchers must take the utmost care to do no harm
and to follow a strict code of ethics in conducting research. Stroebe, Hansson, Schut, & Stroebe

33
(2008) cite several issues to be aware of in designing research with the bereaved. They include
recruitment methods, recruitment timing, accurate informed consent, threats of confidentiality,
possible stress for the participant as a result of involvement, violation of cultural norms, and
unethical use of study results. With that in mind, this study worked to provide safeguards of the
highest standards of research ethics. After a lengthy consideration of the methods of research
available, this study was based upon a non-experimental, quantitative approach. This non-
experimental approach was utilized to obtain the needed data, with the least level of harm
possible. This approach asked participants to complete a personality inventory and answer
questions related to their individual response to grief. This information gathering took place
online in a volunteer capacity, with no reward or incentive to the participant. The study utilized
three independent variables and three dependent variables and utilized a series of factorial
analyses designed to determine if differences exist within groups.
Target Population and Participant Selection
The target population for this study consisted of individuals over the age of 25, living
within the United States, who read English at a sixth grade level, were able to understand the
four measures being utilized, and who have experienced the death of a loved one more than 6
months prior to the study. The rationale for these parameters has to do with the specific purpose
of the study. When using personality type as a measure, it is important to consider psychological
maturation. Choosing the lower age limit of 25 is significant in that it is generally held that
personality is firmly rooted by young adulthood (Roberts & DelVecchio 2000, McGue, Bacon, &
Lykken 1993, McCrae & Costa, 1987) therefore, 25 as the age of eligibility is preferred. The
limitations upon the time in which the death has occurred was intentionally chosen to abide by

34
the ethical standards put forth by Cook (2001). This study was not intended to reach beyond
those living in the United States or non-English speaking individuals and the generalizations
made regarding the outcomes will reflect this limitation.
The study utilized a convenience purposeful sampling strategy. The rationale for
selecting a purposeful sample from a variety of sources was to obtain a group of individuals who
have experienced the death of a loved one. Purposeful Sampling as stated in Creswell (2007) was
chosen in order for the researcher to select participants for study because they purposefully
inform an understanding of the research problem and central phenomenon in the study.
Participants were recruited from three groups of individuals. The first group comprised of
bereavement clients from a suburban memorial chapel in a large, Midwest metropolitan area.
The second group was from a diverse faith community comprised of several urban and suburban
areas in the Northeast United States. The third group was from the researcher’s web-based
community. This online community was comprised of people all around the country who have
attended seminars delivered by the researcher. The seminar’s content was based on emotional
intelligence and not grief related. It was anticipated these three groups would provide a diverse
and representative sample of normal, grieving people in America. The groups were contacted
through a written recruitment invitation or an online invitation.
Sample Size
The proposed study sought to obtain a sample size of 250. This determination was based
on a power analysis estimating a rough MBTI effect size of .25 (e.g., Huntington, 2009), alpha
level of .05, desired power of .80, a 2x4 design with 8 cells, and differing population incidences
of the personality groups represented by these 8 cells. The groups studied differed in their
incidence in the general population, with the ratio of the largest to the smallest group being about
35
4:1. The percentages were as follows: Extroverted Thinking (12%), Introverted Thinking (9%),
Extroverted Feeling (11%), Introverted Feeling (11%), Extroverted Sensing (22%), Introverted
Sensing (20%), Extroverted Intuiting (10%), and Introverted Intuiting (5%). This can also be
broken down by Extroverted (55%) and Introverted (45%); or by Thinking (21%), Feeling
(22%), Sensing (42%), and Intuiting (15%). Thus, Extroversion and Sensing were
overrepresented in the population, whereas Introversion and Intuiting were underrepresented.
Due to the difficulty in prescreening participants by personality group, overall sample size has
been calculated so as to achieve 80% power in detecting differences among the smallest groups
in the sample—i.e., Introverted Intuiting vs. Introverted Thinking.
Procedures
This non-experimental study began by recruiting participants from three diverse settings.
First the researcher extended an online invitation to individuals who attended seminars and
workshops from the researcher in the past 5 years. This online invitation introduced the topic and
the estimated amount of time required to complete the surveys. The invitation directed the
participants to the online research website. The second online invitation was extended to the
membership of a large urban faith community in the Northeast United States. The invitation was
from the Senior Administrator, explaining the topic and the estimated amount of time required to
complete the survey. The invitation directed the participants to the online research website. The
third invitation, a letter sent through the mail, was extended to the bereavement clients of a
Midwest memorial chapel. The invitation came from the President of the company, explaining
the topic and the estimated amount of time required to complete the survey. The invitation
directed the participants to the online research website. Once participants entered the research

36
website, they were introduced more fully to the research topic and asked the qualifying questions
found in appendix B. If the respondents answered the questions affirmatively, meaning they met
the requirements for the study, they were then directed to the Informed Consent page. Once they
accepted the conditions of the research study, the respondents were directed to the survey which
gathered demographic information used to describe the population. Once that information was
gathered, the respondents were directed to a website to complete the MBTI. Once completed, the
respondents were directed to the grief response survey. Once the survey was completed, the
respondents were asked if they wished to have a copy of the results of the survey, or if they
wanted to attend the webinar discussing the results of the study, or both. If they indicated they
were interested, they were directed to enter their email address and to indicate a preference of
receiving results. The respondents were also given information regarding emotional assistance, if
needed, through the researcher’s website.
Once the data was collected, it was compiled in an SPSS file, coded and labeled, checked
for normality and outliers, and analyzed using a series of Analyses of Variance (ANOVAs). The
specifics of the data analysis will be discussed later in this chapter.
Instruments
Myers-Briggs Personality Type Indicator
The first measure used was the Myers Briggs Personality Type Indicator: MBTI®
Manual, third edition (Consulting Psychologists Press, Inc. 1998). Myers-Briggs Personality
Type Indicator (MBTI). The MBTI is a measure of personality based on the psychological
teachings of Carl Jung (McCaulley,1980). To introduce this measure, it must be understood the
MBTI is not a test. There are no right or wrong answers; there are no better personalities or
weaker personalities. The MBTI is not designed to assess personality disorders or
37
psychopathology. As Sears, Kennedy & Kaye (1997) lift up “A person’s type is a shorthand way
of describing four sets of mental processes. Types are not pigeonholes, but describe preferred
ways of functioning in the world” (p.197). The MBTI assesses the relative strength of four
distinct psychological processes, with four dichotomous scales. Those scales are labeled
introversion versus extraversion, sensing versus intuition, thinking versus feeling, and judging
versus perception. The MBTI provides data on these four sets of preferences that result 16
combinations or types. The four dichotomous scales measure what Jung described as a person’s
pattern of perceiving and pattern of judging events in life. These distinct patterns then influence
how one takes in information and makes decisions (Hammer & Quenk, 1993).
To further explain this theory of personality type, a closer look at each of the scales is
warranted. The first scale, extroversion versus introversion, describes how the individual prefers
to acquire energy. The extrovert is focused on the outer world and takes in energy from external
sources, other people and activities. The introvert, conversely, is energized by the inner world
and prefers reflection and solitude (Myers & McCaulley, 1985). The second scale, sensing versus
intuition, focuses on how individuals acquire information. Those with a preference for sensing
utilized the concrete now to take in information around them, focusing on the physical realities
of the specific, detail oriented present moment. While those with a preference for intuition look
to all of the possibilities of what might be, taking in the creative “what if” approach to the future
more than the present (Myers & McCaulley, 1985). The third scale, thinking versus feeling,
refers to the individual’s decision-making preferences. The thinking preference is grounded in
the objective and rational methodology of decision-making, relying upon analysis. While the
feeling preference makes decisions out of personal, subjective and a values-oriented perspective.
The need for interpersonal harmony drives the decision making for the feeler (Myers &

38
McCaulley, 1985). Lastly, the fourth scale is focused on the organizational needs of the
individual. The judging preference has a high need for organization and seeks closure, while the
perceiver prefers open-ended structure and spontaneous approaches to life. (Myers &
McCaulley, 1985).
While the four scales make up the individual preferences of type, the interaction of those
preferences, referred to as type dynamics (Martin, 1997), shows how each of the sixteen types
yield more than just a “sum of the parts” (Myers and McCaulley 1998). The interaction of the
attitudes (E/I and J/P) and the functions (S,N,T,F) can explain the depth and richness of human
behavior. Hammer (1993) lifts up the need for researchers to focus more upon the interaction of
the preferences and whole types, rather than the four scales individually. It is due to this aspect
of type dynamics, the proposed study believes MBTI to be the best fit for evaluating and
comparing grief response.
The MBTI has undergone decades of tests, providing strong evidence for the reliability of
scores produced by the instrument. Wheeler (2001) found internal consistency with reliability
studies typically resulting in correlations and coefficient alpha scores in the 0.80s and 0.90s, with
some low scores in the high 0.50s and 0.60s. Myers and McCaulley (1985) reported when
individuals retake the MBTI, the percentages of agreement for the four categories are typically
higher than 80%. Sears and Kennedy (1997), state the MBTI is a useful tool to expand self-
knowledge and deepen our understanding of behavior.
Hogan Grief Reaction Checklist
The second measure used in this study was the Hogan Grief Reaction Checklist (HGRC),
developed by Hogan, Greenfield, and Schmidt (2001), designed to measure the multidimensional

39
nature of the bereavement process, specifically for use with individuals that have suffered the
loss of a loved one through death. The HGRC was developed out of the need to assess a normal
trajectory of grief, partly to understand what is to be considered out of the norm (Hogan et al,
2001). This instrument was developed utilizing an empirical method of item creation, rather than
the commonly used method of researcher reasoning of what should be measured. The items
comprising the HGRC were reviewed by focus groups made up of bereaved individuals
representing a variety of types of death and relationships to the deceased. Additionally,
information was gathered from nursing students who served as the expert panel for assessment
construction (Hogan et al, 2001).
The HGRC has 61 items scored on a 5–point Likert type scale. The HGRC also contains
six subscales including Panic Behavior, Blame and Anger, Despair, Personal Growth,
Detachment, and Disorganization. The number of items and Cronbach’s alpha coefficient for the
six factors in the analysis of the assessment were Despair, α= 5 .89, 13 items ; Panic Behavior,
α= 5 .90, 14 items ; Personal Growth, α= 5 .82, 11 items ; Blame and Anger, α= 5 .79, 7 items ;
Detachment, a= 5 .87, 8 items ; and Disorganization, α= 5 .84, 8 items. Internal consistency for
the total instrument was .90. Alphas of this magnitude and consistency suggest that the six
subscales contain items that constitute relatively homogeneous response patterns. The HGRC is
an empirically founded measure of the multidimensional aspects of grief, and “shows
considerable promise as a tool that can be used to gather reliable and valid data on the
bereavement process” (as cited in Horrocks, 2006).
Prolonged Grief 13
The third measure is the PG13, developed by Prigerson and Maciejewski (2008). This
assessment is designed to assist in the diagnosis of Prolonged Grief Disorder and it measures the

40
five criteria required to qualify for diagnosis. Those criteria are A. Event Criterion: the
respondent must have experienced bereavement (i.e., the loss of a loved person). B. Separation
Distress: The respondent must experience PG-13 questions #1 or 2 at least daily. C. Duration
Criterion: The symptoms of separation distress must be elevated at least 6 months after the loss.
That is, PG-13 question #3 must be answered as “Yes”. D. Cognitive, Emotional, and
Behavioral Symptoms: The respondent must experience 5 of the PG-13 questions #4-12 at least
“once a day” or “quite a bit”. E. Impairment Criterion: The respondent must have significant
impairment in social, occupational, or other important areas of functioning (e.g., domestic
responsibilities). That is, PG-13 question #13 must be answered as “Yes”. (Prigerson and
Maciejewski, 2008). The PG13 was utilized in this research to screen participants for PGD, if
they met this criteria, their other scores would have been analyzed separately.
Grief Pattern Inventory
The third measure was the Grief Pattern Inventory (Martin & Doka, 2010). This
instrument was designed to determine the dominant grief style of the bereaved individual. The
authors of the assessment are also the authors of the theory of grief styles, which posits the
existence of two distinct styles of grief. The first style is named instrumental and is described as
more cognitive, less emotional in their expression of grief. The instrumental griever finds ways
of acting upon their grief. The second style of grief in this theory is the intuitive style, which the
authors point out is more traditionally accepted in this culture. The intuitive style embraces the
emotive aspects of grief, and is generally extroverted in expressing that emotional reality. The
intuitive griever also has the tendency to experience grief as “waves of acutely painful emotions”
(pg 57). The GPI is a 30 item questionnaire which produces two scores, one for instrumental
style of grieving and one for intuitive style of grieving. The assessment also provides seven items

41
to assess dissonant responses. This is a relatively new instrument and the proposed study is the
first empirically based use of the measure (personal communication with Dr. Doka, July 18,
2011).
Integration of Stressful Life Events Scale
The fourth measure was the Integration of Stressful Life Events Scale (ISLES): Holland,
Currier, Coleman and Neimeyer. As Holland, Currier, Coleman, and Neimeyer (2009, p. 328)
state “The ISLES assesses the degree to which a stressful life experience has been adaptively
incorporated into a broader life story that may promote a sense of internal coherence and foster a
secure and hopeful view of the future.” One of the more recent trends in thanatology is the idea
that grief experiences are central to the making of meaning in life. This theory, brought to the
fore by Neimeyer (2011), exerts that bereaved individuals are often thrust into a journey to find
or make meaning practically, relationally and existentially out of the loss. This search for
meaning brings a new dimension to the process of grieving, allowing for such terms as personal
growth, transcendence and increased compassion in relation to bereavement. The creation of a
life narrative or life story including the loss of loved ones is at the center of meaning
reconstruction for the bereaved. The ISLES is developed to measure the bereaved individual’s
capacity to adapt to the loss.
The reliability and validity of scores for the Integration of Stressful Life Experiences
Scale (ISLES) were shown to have strong internal consistency and, among a subsample of
participants, also exhibited moderate test-retest reliability (Holland, 2009). The scale contains
two subsets, the first measuring Footing in the World following the stressful life event and the
other gauging the Comprehensibility of the stressor. This measure is utilized to measure the
meaning making context of the grief experience, an important aspect of grief response.

42
Research Questions and Hypotheses
The central question driving this research stated: Is there a difference in grief response
between groups with differing MBTI personality types? While researchers have studied many
aspects of personality’s influence on behavior, decisions and functioning in the world (Myer &
McCaulley, 1995), and many studies have been conducted surrounding the phenomenon known
as grief (Granek, 2010), there still exists a gap in the literature regarding the influence of
personality on grief response. Martin and Doka (2010) have suggested a relationship between
ones personality, specifically MBTI, but have yet to see empirical data to support that thought.
These theorists have also developed two distinct styles of grief, instrumental and intuitive, but
have yet to see the theory tested empirically. As a result, this study sought to fill that gap with
empirical evidence to determine if differences in grief response can be found between groups
with differing personality types.
Subquestions
The following subquestions stemmed from the hypothesis that there would be differences
between groups on each of the three scales being measured in the study:
Subquestion 1: Is there a difference between groups with an introverted attitude and an extroverted attitude on the HGRC and its subscales? Subquestion 2: Is there a difference between groups with differing functional pairs (ST,SF,NT,NF) on the HGRC and its subscales? Subquestion 3: Are there differences between any of the 8 dominant function groups that indicate an interaction between attitude and function on the HGRC? Subquestion 4: Is there a difference between groups with an introverted attitude and an extroverted attitude on the ISLES and its subscales? Subquestion 5: Is there a difference between groups with differing functional pairs (ST,SF,NT,NF) on the ISLES and its subscales?

43
Subquestion 6: Are there differences between any of the 8 dominant function groups that indicate an interaction between attitude and function on the ISLES? Subquestion 7: Is there a difference between groups with an introverted attitude and an extroverted attitude on the GPI? Subquestion 8: Is there a difference between groups with differing functional pairs (ST,SF,NT,NF) on the GPI? Subquestion 9: Are there differences between any of the 8 dominant function groups that indicate an interaction between attitude and function on the GPI? Subquestion 10: Do any patterns emerge regarding Prolonged Grief between groups? Is there a higher incidence of prolonged grief within this sample?
Hypothesis
For each of the sub questions, the null hypothesis states no differences will exist, and the
alternative hypothesis states a difference will exist between groups on each of the scales.
Data Analyses
All quantitative data was compiled (downloaded from an online survey program) in an
SPSS file, checked for errors and cleaned, coded using dummy values where appropriate, and
labeled. Two sets of analyses were performed. In the first set of analyses, the predictor or
independent variables were Attitude (Extroverted, Introverted), Perceiving Function (Sensing,
Intuiting), and Judging Function (Thinking, Feeling). All three of these variables were
categorical and dichotomous. After participants were categorized as Extroverted or Introverted,
Sensing or Intuiting, and Thinking or Feeling, Judging or Perceiving frequencies were generated
by variable. Two- and three-way crosstabulations were also conducted so the researcher could

44
examine the percentages of various subgroups and whether these were roughly equal across the
sample.
The outcome or dependent variables were the six subscales of the HGRC (Panic
Behavior, Blame and Anger, Despair, Personal Growth, Detachment, and Disorganization), the
two subscales of the GPI (Intuitive and Instrumental), and the ISLES scale. All of these variables
were continuous, scale data. After means were computed for all participants for all subscales, the
researcher checked for high (or low) outliers and replaced any such scores with values that were
three standard deviations above (or below) the mean. Next, descriptive statistics were computed
for all subscales, including means, medians, ranges, and standard deviations. After this,
histograms were produced, and tests for normality were conducted (skew-to-standard error of
skew ratios, and kurtosis-to-standard error of kurtosis ratios, whose absolute values are 2 or less).
Non-normal distributions were transformed via square root, natural log, or inverse
transformations to approximate normality. Finally, all subscales were correlated with one another
using Pearson’s r to examine the interrelationships among the dependent variables. Two-tailed
tests with a significance level of p < .05 were used for correlations, and all other analyses, in this
study.
The control variables to be used included all demographic variables the researcher deems
relevant. These included a combination of categorical, continuous, and scale variables.
Frequencies were computed for the categorical and continuous data; descriptives were computed
for the scale data.
Finally, the statistical tests to be performed for the first set of analyses included: (1) a
2x2x2 MANOVA, followed by six 2x2x2 ANOVAs, using the dependent variables the HGRC
subscales; (2) a 2x2x2 MANOVA, followed by two 2x2x2 ANOVAs, using the dependent

45
variables the GPI subscales; and (3) a 2x2x2 ANOVA with the ISLES scale. Follow-up tests for
each MANOVA included comparisons of all four functional pairs (ST, SF, NT, NF) with one
another.
For the second set of analyses, the predictor variables were Attitude (as in the first set)
and Dominant Function (Sensing, Intuiting, Thinking, Feeling). All variables were categorical
and dichotomous and had frequencies and crosstabulations generated for them. The outcome and
control variables were identical to those used in the first set of analyses.
The statistical tests performed for the second set of analyses included: (1) a 2x4
MANOVA, followed by six 2x4 ANOVAs, using the dependent variables the HGRC subscales;
(2) a 2x4 MANOVA, followed by two 2x4 ANOVAs, using the dependent variables the GPI
subscales; and (3) a 2x4 ANOVA with the ISLES scale. Follow-up tests for each MANOVA
included comparisons of all eight cells (Se, Ne, Te, Fe, Si, Ni, Ti, Fi) with one another.
Expected Findings
To begin, it was expected that differences would be seen in the grief response of groups
with differing MBTI types. In each of the measures (HGRC, GPI and ISLES) it was expected
that the group scores would show significant differences among the two attitudes, the four
functional pairs and the eight dominant function groups. Specific expectations for each of the
measures were as follows: It was expected that the HGRC subscale scores for Panic Behavior,
Blame and Anger, and Despair would be lower for functional pairs comprised of Thinkers
compared to functional pairs comprised of Feelers. It was also expected that the subscale scores
for Personal Growth would be lower for dominant Sensors than dominant Intuitives. It was also

46
expected that the subscale scores for Detachment would be lower for dominant Thinkers than for
dominant Feelers.
It was expected that on the ISLES subscale “Comprehensibility” the dominant Intuitives
would score higher than the dominant Sensors. Additionally, the dominant Thinkers would score
higher on “Footing in the World” subscale than those whose dominant function is Feeling. It was
expected that those whose dominant function is Sensing or Thinking (extraverted and
introverted) would fall into the instrumental style of the GPI. Conversely, those whose dominant
function is Intuition or Feeling (extraverted or introverted) would fall into the intuitive style.
With regard to the PG13, the expectation was that the incidence of Prolonged Grief
Disorder would occur within MBTI type at the same percentage as in the general population and
that personality type does not affect the rate of incidence.
47
CHAPTER 4. DATA COLLECTION AND ANALYSIS
Introduction
The purpose of the study is to provide empirical evidence to address the relationship
between grief and personality type. Specifically, the research question asks, “What is the
relationship between personality type and the experience of grief and bereavement?” The study
utilized four grief measures, Hogan Grief Reaction Checklist (Hogan, Greenfield, and Schmidt,
2001), the Grief Pattern Inventory (Martin & Doka, 2010), Integration of Stressful Life Events
Scale (Holland, Currier, Coleman and Neimeyer, 2009) and the Prolonged Grief Disorder 13
(Prigerson and Maciejewski, 2008). The study measured the participant’s personality type with
the Myers-Briggs Personality Type Indicator (Consulting Psychologists Press, Inc. 1998). The
hypothesis was that differences in the scores on the grief measures would be found between
personality types utilizing three predictive variables, extraversion and introversion, functional
pairs, and dominant functions on each of the scales and subscales.
The current chapter provides the results of the analysis used to test these hypotheses.
First, the chapter details the sampling procedures used in the study and the characteristics of the
sample. Second, the chapter provides a detailed description of the analyses. Finally, it provides a
summary of the results of each hypothesis. A critical discussion of the findings and limitations
can be found in chapter 5.
Description of the Sample
Participants for the study were recruited from three sites around the United States: a large
memorial chapel in a metropolitan area of a Midwest city, a faith community in the Northeast
United States and the researcher’s seminars on Emotional Intelligence from around the United

48
States. The participants met three criteria to be involved in the study which included: being
bereaved due to the death of a loved one more than six months prior to the study, being over the
age of 25 and being able to read and comprehend English at a 6th grade level. A total of 856
recruitment letters were mailed and 435 were emailed. Over a period of 9 weeks, 532 persons
logged on to the website, 407 completed the qualifying questions, 317 qualified for the study and
271 respondents completed the survey. Of these 271, 32 incomplete MBTI responses were
eliminated from the sample, leaving 239 completed MBTI surveys. Of these 239 respondents, all
239 completed the ISLES and HOGAN measures, 234 completed the PG13 and the GPI scales.
The sample size of 271 meets the expectation of the proposed size of 250 that was determined
based on a power analysis estimating an MBTI effect size of .25 (e.g., Huntington, 2009), alpha
level of .05, a desired power of .80. Table 1 shows the gender, age range, and ethnicity
descriptions of the sample by percentage.
Table 1. Description of Sample: Gender, Age Range and Ethnicity
Gender n % Females 191 70 Males 80 30 Age Range 24-30 24 9 31-40 41 15 41-50 54 20 51-60 95 35 61-70 46 17 71 and over 11 4 Ethnicity White 254 94 Hispanic 4 1 Black 9 3 Hawaiian 1 <1 Other 3 1 N = 271

49
Next, the MBTI classification of the sample was determined. It was anticipated that the
distribution of the MBTI types would mirror that in the general population, which differ in their
incidence in the general population, with the ratio of the largest to the smallest group being about
4:1. Table 2 shows the frequency of the MBTI types in the study and in the general population
(CAPT, 2012).
Table 2. Frequencies of MBTI 16 Types
Type n Study % General Population % ENFJ 17 7.1 2-5 ENFP 28 11.7 6-8 ENTJ 11 4.6 2-5 ENTP 12 5.0 2-5 ESFJ 16 6.7 9-13 ESFP 12 5.0 4-9 ESTJ 12 5.0 8-12 ESTP 16 6.7 4-5 INFJ 15 6.3 1-3 INFP 17 7.1 4-5 INTJ 10 4.2 2-4 INTP 8 3.3 3-5 ISFJ 18 7.5 9-14 ISFP 15 6.3 5-9 ISTJ 23 9.6 11-14 ISTP 9 3.8 4-6 Total 239 100.0
Three predictor variables were utilized for the study; attitude, functional pair and
dominant function. The first of the predictor variables in the study was the MBTI attitude,
extraversion and introversion. The sample percentages and general population percentages of this
breakdown are found in Table 3.

50
Table 3. Percentage of Extraversion and Introversion in Sample and General Population
Attitude n % in sample % in population
Extraversion 124 51.9 45-53
Introversion 115 48.1 47-55
Total 239 100
The second predicted variable used in the study was the MBTI Dominant Function and Table 4
below shows frequencies and percentages of dominant functions within the study sample.
Table 4. Percentage of MBTI Dominant Functions
Dominant n % Ne 40 16.7 Se 28 11.7 Te 23 9.6 Fe 33 13.8 Ni 25 10.5 Si 41 17.1 Ti 17 7.2 Fi 32 13.4 239 100
The third and final predictor variable used for comparison was the functional pairs of the MBTI.
Table 5 below shows frequencies and percentages of functional pairs within the study sample.
Table 5. Percentages of MBTI Functional Pairs
n % ST 60 25.1 SF 61 25.5 NT 41 17.2 NF 77 32.2 Total 239 100.0

51
Summary of Results
Data from the Psychdata website was imported into SPSS 18. Each variable was then
coded. The results of the Prigerson Prolonged Grief Instrument (PG13) found only 1 participant
out of 234 who completed the instrument met the criterion needed to suggest the presence of
Prolonged Grief; therefore no further analysis was completed for that instrument. A discussion of
this result will be found in Chapter 5 of this study. For each of the remaining scales and
subscales, several high outliers were identified for the outcome measure scales and subscales,
including: ISLES Total (2 respondents), ISLES Footing in the World (2 respondents), and ISLES
Comprehensibility (3 respondents); Hogan Total (2 respondents), Hogan Despair (5
respondents), Hogan Panic Behavior (3 respondents), Hogan Blame and Anger (3 respondents),
Hogan Detachment (4 respondents), and Hogan Disorganization (3 respondents); and GPI
Instrumental Scale (1 respondent ); and GPI Dissonant Scale (1 respondent). Each of the outlier
scores were adjusted to a score with a value three standard deviations above the means for those
scales. After high outliers were rescored, complete descriptive statistics for the ISLES, Hogan,
and GPI were computed. Table 6 details the minimum, maximum, median and mean scores and
the standard deviation, skew with standard error, and kurtosis with standard error for each scale
and subscale. Because some scales and subscales demonstrated excessive skew or kurtosis,
appropriate transformations were attempted where appropriate as described below.
Table 6. Means, Standard Deviations, Skew, Standard Error, Kurtosis and Standard Error of Total Scores Min Max Median M SD Skew SE Kurt SE ISLES Total 16 65 29 30.84 11.27 0.87 0.16 .32 .31 ISLES Footing in the World
11 44 19 20.85 7.67 0.83 0.16 .14 .31
ISLES Comprehensibility
5 23 9 9.98 4.20 0.93 0.16 .49 .31
Hogan Total 37 210 115 117.39 30.82 0.53 0.16 .40 .31

52
Min Max Median M SD Skew SE Kurt SE Hogan 1: Despair 7 35 15 16.40 5.65 1.27 0.16 1.44 .31 Hogan 2: Panic Behavior 8 53 21 23.66 9.72 1.08 0.16 .77 .31 Hogan 3: Personal Growth
12 57 39 38.54 9.74 -0.34 0.16 -.39 .31
Hogan 4: Blame and Anger
3 21 9 10.13 3.59 1.20 0.16 1.35 .31
Hogan 5: Detachment 4 29 10 12.43 5.43 1.30 0.16 1.06 .31 Hogan 6: Disorganization
2 29 12 12.28 5.35 0.88 0.16 .35 .31
GPI Intuitive Pattern 12 45 28 27.86 6.06 0.18 0.17 -0.02 0.35GPI Instrumental Pattern 14 54 30 30.30 6.96 0.42 0.17 0.14 0.35GPI Dissonant Responses
9 29 15 15.89 4.10 0.71 0.17 0.21 0.35
Hogan Grief Reaction Checklist Outcomes
A series of Multivariate Analyses of Variance (MANOVAs) were performed on the
outcome measures, with three sets of predictor variables being crossed with the subscales of the
three outcome measures. The MANOVA with the predictor variable Extraversion/Introversion
conducted on the six Hogan subscales was not significant, F(6,232) = 1.280, λ = .968, p = .267
(µ = .032; observed power = .498; note: observed power in these analyses indicates estimated
power, as calculated based on significance level, degrees of freedom, and sample size).
However, the Detachment subscale approached significance, F(1,237) = 3.178, p = .076 (µ =
.013; observed power = .427), with Introverts scoring higher (13.08) than Extraverts (11.83). The
ANOVA conducted on the Hogan Total scale did not approach significance, nor did the
ANOVA, the MANOVA, or the MANOVA one-way follow-up tests using outcome measures
transformed via inverse, natural log, or square root transformations (though the aforementioned
marginal Detachment effect reached significance using inverse and natural log transformations).
The MANOVA with the predictor variable Dominant Function conducted on the six
Hogan subscales was not significant, F(42,1063) = 1.053, λ = .826, p = .381 (µ = .031; observed

53
power = .887), nor were any of the subscale scores (see Table 11). The Despair subscale effect
was not significant, F(7,231) = .689, p = .682 (µ = .020; observed power = .294). The Panic
Behavior subscale effect was not significant, F(7,231) = .903, p = .505 (µ = .027; observed
power = .386). The Personal Growth subscale effect was not significant, F(7,231) = 1.251, p =
.276 (µ = .037; observed power = .531). The Blame and Anger subscale effect was not
significant, F(7,231) = .999, p = .433 (µ = .029; observed power = .427). The Detachment
subscale effect was not significant, F(7,231) = 1.661, p = .119 (µ = .048; observed power =
.678). Finally, the Disorganization subscale effect was not significant, F(7,231) = .564, p = .785
(µ = .017; observed power = .242). Additionally, the ANOVA conducted on the Hogan Total
scale did not approach significance, nor did the ANOVA, the MANOVA, or the MANOVA one-
way follow-up tests using outcome measures transformed via inverse, natural log, or square-root
transformations.
Functional pairs as a predictor variable revealed significant differences for the Hogan
Total scale, F(18,651) = 1.725, λ = .877, p = .031 (µ = .043; observed power = .941), and four of
the six subscale scores. The Despair, Detachment, and Disorganization subscales all
demonstrated similar effects, whereas the Personal Growth subscale revealed a different pattern
(see below). In order to correct for Type I error, the Bonferroni correction method was used, and
the p-value for pairwise comparisons was set to .008 (.05/6). The Despair subscale scores
difference approached significance, F(3,235) = 3.369, p = .019 (µ = .041; observed power =
.758), with NF (17.72) scoring higher than NT (14.37), and SF (16.50) and ST (16.00) falling in
between. The Panic Behavior effect was not significant, F(3,235) = 1.517, p = .211 (µ = .019;
observed power = .398). The Personal Growth effect approached significance, F(3,235) = 3.614,
p = .014 (µ = .044; observed power = .790), with NT (39.98), SF (39.67), and NF (39.61) all

54
scoring higher than ST (35.02). The Blame and Anger effect was not significant, F(3,235) =
1.523, p = .209 (µ = .019; observed power = .399). The Detachment effect approached
significance, F(3,235) = 3.382, p = .019 (µ = .041; observed power = .760), with NF (13.61)
scoring higher than NT (10.37), and SF (12.64) and ST (12.12) falling in between. Finally, the
Disorganization effect approached significance, F(3,235) = 2.566, p = .055 (µ = .032; observed
power = .627), with NF (13.33) scoring higher than NT (10.51), and SF (12.34) and ST (12.07)
falling in between. The outcomes of the significant results with the functional pairs as the
predictor variable can be found in table 7.
Table 7. Outcomes of Hogan Grief Reaction Checklist with Functional Pair as Predictor Variable
Integration of Stressful Life Events Scale
A MANOVA with the predictor variable Extraversion/Introversion conducted on the two
ISLES subscales was not significant, F(2,236) = .490, λ = .996, p = .613 (µ = .004; observed
power = .130). In addition, the Footing in the World subscale effect was not significant,
F(1,237) = .129, p = .720 (µ = .001; observed power = .065) nor was the Comprehensibility
effect, F(1,237) = .739, p = .391 (µ = .003; observed power = .137). It should also be noted, an
ANOVA conducted on the ISLES Total scale did not approach significance, nor did the
ANOVA, the MANOVA, or the MANOVA one-way follow-up tests using outcome measures
transformed via inverse, natural log, or square-root transformations.
Despair Personal Growth Detachment Disorganization ST 16.00 35.02 12.12 12.07 SF 16.50 39.67 12.64 12.34 NT 14.37 39.98 10.37 10.51 NF 17.72 39.61 13.61 13.33

55
When the dominant function (Se, Si, Ne, Ni, Te, Ti, Fe, Fi) was used as the predictor
variable no significant differences were found on the ISLES total score or subscales. A
MANOVA with the predictor variable Dominant Function conducted on the two ISLES
subscales was not significant, F(14,460) = .623, λ = .963, p = .846 (µ = .019; observed power =
.399). The Footing in the World effect was not significant, F(7,231) = .585, p = .768 (µ = .017;
observed power = .251). The Comprehensibility effect was not significant, F(7,231) = .841, p =
.554 (µ = .025; observed power = .360). Additionally the ANOVA conducted on the ISLES
Total scale did not approach significance, nor did the MANOVA or the MANOVA one-way
follow-up tests using outcome measures transformed via inverse, natural log, or square-root
transformations. However, The ANOVA using inverse transformation approached significance,
though none of the pairwise contrasts among dominant functions did.
A MANOVA using the functional pairs (ST, SF, NT, NF) as the predictor variables
revealed significant differences on ISLES total scale scores, F(6,468) = 3.780, λ = .910, p = .001
(µ = .046; observed power = .964). The Footing in the World and Comprehensibility subscales
demonstrated similar effects (see below). In order to correct for Type I error, the Bonferroni
correction method was used, and the p-value for pairwise comparisons was set to .025 (.05/2).
Both the Footing in the World and Comprehensibility subscales revealed significant differences.
The Footing in the World effect was significant, F(3,235) = 4.581, p = .004 (µ = .055; observed
power = .884), with SF (22.38) and NF (22.03) both scoring higher than NT (17.37; both ps <
.05); ST scored 20.171. The Comprehensibility effect was also significant, F(3,235) = 7.691, p <
.001 (µ = .089; observed power = .988), with NF(10.94) and SF (10.92) both scoring higher than
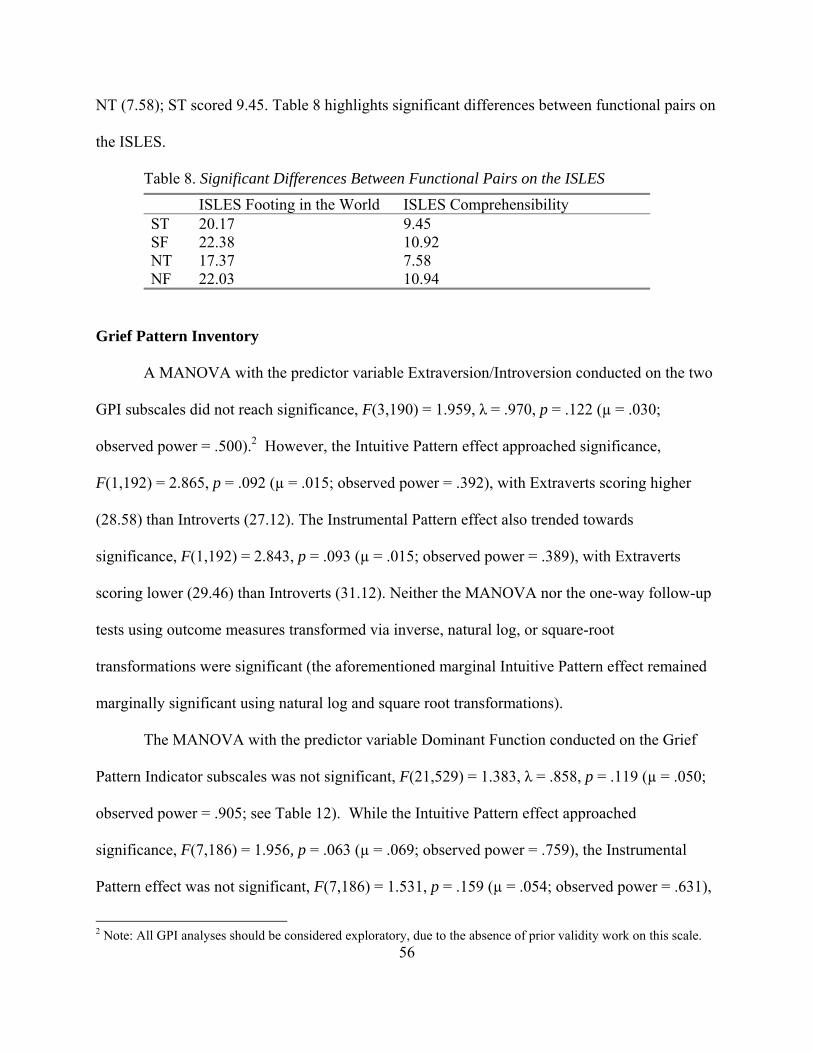
56
NT (7.58); ST scored 9.45. Table 8 highlights significant differences between functional pairs on
the ISLES.
Table 8. Significant Differences Between Functional Pairs on the ISLES
Grief Pattern Inventory
A MANOVA with the predictor variable Extraversion/Introversion conducted on the two
GPI subscales did not reach significance, F(3,190) = 1.959, λ = .970, p = .122 (µ = .030;
observed power = .500).2 However, the Intuitive Pattern effect approached significance,
F(1,192) = 2.865, p = .092 (µ = .015; observed power = .392), with Extraverts scoring higher
(28.58) than Introverts (27.12). The Instrumental Pattern effect also trended towards
significance, F(1,192) = 2.843, p = .093 (µ = .015; observed power = .389), with Extraverts
scoring lower (29.46) than Introverts (31.12). Neither the MANOVA nor the one-way follow-up
tests using outcome measures transformed via inverse, natural log, or square-root
transformations were significant (the aforementioned marginal Intuitive Pattern effect remained
marginally significant using natural log and square root transformations).
The MANOVA with the predictor variable Dominant Function conducted on the Grief
Pattern Indicator subscales was not significant, F(21,529) = 1.383, λ = .858, p = .119 (µ = .050;
observed power = .905; see Table 12). While the Intuitive Pattern effect approached
significance, F(7,186) = 1.956, p = .063 (µ = .069; observed power = .759), the Instrumental
Pattern effect was not significant, F(7,186) = 1.531, p = .159 (µ = .054; observed power = .631),
2 Note: All GPI analyses should be considered exploratory, due to the absence of prior validity work on this scale.
ISLES Footing in the World ISLES Comprehensibility ST 20.17 9.45 SF 22.38 10.92 NT 17.37 7.58 NF 22.03 10.94

57
nor was the Dissonant Responses effect significant, F(7,186) = 1.207, p = .301 (µ = .043;
observed power = .510).
Finally, the MANOVA with the predictor variable Functional Pair conducted on the three
GPI subscales did reach significance, F(9,458) = 3.559, λ = .848, p < .001 (µ = .053; observed
power = .965). In order to correct for Type I error, the Bonferroni correction method was used,
and the p-value for pairwise comparisons was set to .017 (.05/3). The Intuitive Pattern effect was
significant, F(3,190) = 8.930, p < .001 (µ = .124; observed power = .995), with NF (29.84) and
SF (29.32) both scoring higher than ST (25.00), and NF scoring higher than NT (25.88). The
Instrumental Pattern effect was not significant, F(3,190) = 1.297, p = .277 (µ = .020; observed
power = .343). The Dissonant Responses effect was not significant, F(3,190) = 1.175, p = .320
(µ = .018; observed power = .313). Table 9 highlights significant differences between functional
pair’s scores on the GPI.
Table 9. Significant Differences in Intuitive Scores of the GPI with Functional Pairs
Intuitive ST 25.00 SF 29.32 NT 25.88 NF 29.84
Conclusion
To conclude, the analysis of data demonstrates that one of the three aspects of personality
used to measure grief reactions resulted in significant differences in all three of the measures
used. The mental functional pair (ST, SF, NT, NF) scores showed statistically significant
differences in mean scores, indicating a variety of grief responses related to mental functional

58
pair. In summary, the p values for comparisons that showed significant differences are shown in
table 10.
Table 10. p values for significant results.
Assessment Predictor Variable p value Observed power Hogan Total Scale Functional Pair p = .031 Op = .941 Despair Functional Pair p = .019 OP = .758 Personal Growth Functional Pair p = .014 OP = .790 Detachment Functional Pair p = .019 OP = .627 ISLES Total Score Functional Pair p = .001 OP = .974 Footing in the World Functional Pair p = .004 OP = .884 Comprehensibility Functional Pair p = >.001 OP = .988 GPI Intuitive Functional Pair p = >.001 OP = .986
Within this analysis, the other two aspects of personality (attitude and dominant function) did
not present significant differences in the measures used to compare grief responses. These results
will be discussed further in Chapter 5 of this study.

59
CHAPTER 5. RESULTS, CONCLUSIONS AND RECOMMENDATIONS
Introduction
This study began with the aim of providing new literature to address the need for
understanding the possible relationship between personality type and grief response. While many
theorists in thanatology have suggested a relationship between personality and how a person
responds to the death of a loved one, very little empirical data exists to influence that claim. This
study examined the grief responses of 239 individuals, in four grief measures and compared
them by three predictor variables having to do with their personality type, as measured by the
Myers Briggs Personality Type Indicator. The hypotheses were that grief response would vary
significantly by type, as measured by attitude, functional pairs and dominant function. In this
chapter, I will discuss the summary of the results of the study, extend the discussion of those
results, provide an explanation of the limitations of the study, make recommendation for further
research and interventions and finally conclude the study.
Summary of the Results
Upon completion of the web-based survey, the data from the 239 participants was
analyzed and multiple MANOVAs and ANOVAs were conducted. For the purposes of
consistency with the way in which the results were delivered in chapter 4, the organization will
proceed by grief indicator, reporting how each comparison yielded significant or non-significant
results.
The Hogan Grief Reaction Checklist
The Hogan Grief Reaction Checklist, an instrument designed to measure the
multidimensional nature of the bereavement process, contains 61 self-report items. The

60
responses are answered with a likert scale score of 1 to 5, with the descriptions ranging from
describes me very well to does not describe me at all. As reported in chapter 4 of this study, the
HGRC contains six subscales as well as a total score. When the scores were compared using the
attitude of the personality (Extraversion/Introversion) as the predictor variable, only one subscale
trended toward significant differences: The Detachment subscale approached significance, with
Introverts scoring higher (13.08) than Extraverts (11.83) showing a p=.076. This result would
seem likely as Introverts tend to gain energy through solitude and separating themselves from
others rather than the engaging choices made by extraverts.
When the dominant function aspect of the personality was compared, none of the results
showed significant differences. All six subscales and the total scale scores failed to support the
hypothesis. Surprisingly, these results showed no measurable differences in grief reactions, as
the dominant function is seen as the guiding part of the personality, and it was anticipated that
differences would arise in these comparisons. Future study will need to look at how the dominant
function might give way to the inferior function in times of stress as proposed by Quenk (1999).
On the HGRC, the results that showed the most significant differences were with the
predictor variable functional pairs (NT, ST, NF and SF). These middle components of the
personality indicate how one prefers to take in information and how one chooses to process that
information and make decisions. Within the results of the functional pairs, the total scale scores
showed a power of .031 and four of the six subscales showed significant differences.
These strong, robust effects show the ways in which differing functional pairs respond in
significantly different ways to the grief experience. The NF, intuitive feelers score highest on
three of the four subscales, with higher levels of despair, disorganization and detachment and
slightly less personal growth. McCaulley (2000) who worked closely with Isabel Briggs Myers

61
for over 25 years referred to the “NF” type as the insightful types, those with the ability to see
possibilities and nuances in meaning. They use feeling to weigh the value of the situation
presented to them. It seems logical that this feeling and intuitive type might have deeper levels of
despair, disorganization and detachment following the death of a loved one, as their preferred
method of taking in information and processing it falls to the more affective side.
The Integration of Stressful Life Events Scale is a 16 item self-report instrument that
measures the meaning making associated with grief or similar stressful life events. In addition to
the total scale score, the measure has two subscales, Footing in the World and
Comprehensibility. This scale shared similar results with the predictor variables. When
comparing the attitudes (extraversion and introversion) neither the total score nor subscale scores
approach significant differences. In comparing the dominant functions, no significant differences
were found, in any of the scales. However, once again the differences were found in comparing
the functional pairs. Strong effects were found in both the total scores and subscales. With the
NT, intuitive thinkers, scoring lowest on all three scales. When one considers the NT in the way
McCauley (1999) describes them as the logical and strategic types, it would follow they might
struggle with a comprehension of the loss in general and perhaps find it difficult to regain their
footing in world following a loss.
The Prolonged Grief 13, a measure of Prolonged Grief, was administered to 234
participants and 1 participant’s score reached the level needed to suggest the presence of
Prolonged Grief. This is a surprising statistic as most literature suggests a minimum of 3% would
have reached a score that suggested the presence of Prolonged Grief Disorder (Majewski and
Prigerson, 2008). Further discussion of this finding will be found later in this chapter.
The results of the Grief Pattern Inventory are exploratory in nature due to the need for

62
pyschometric validity of the measure. However, the measure did produce significant results and
it is expected the validity of the measure will follow with the continued use in latter analysis of
this data. The GPI scores for attitude (E/I) trended toward significance with extraverts scoring
higher on the Intuitive pattern and introverts scoring higher than extraverts on the Instrumental
pattern. When comparing dominant functions, the scores trended toward significance with
Extroverted Feelers scoring higher on the Intuitive Pattern. And as with the other measures, the
highest level of differences was found when comparing the Functional Pairs. When looking at
the Intuitive Pattern, a strong, robust effect was found between the Pairs, with NFs scoring
highest, followed by the SFs, with the STs and NTs scoring lower. Once again, the trend
indicates the Intuitive Pattern can be associated with a higher preference for the feeling function
in the MBTI, as well as the extraverted tendency to express outwardly the grief response.
Discussion of the Results
When the results are looked at individually, it seems as though several of the hypotheses
must be rejected. Significant differences were not obtained by all of the type configurations.
However, when you break the results down, some common threads of significant differences
emerge. While the attitude of the personality (Extroversion and Introversion) did not reveal
significant differences in the three measures, they did trend toward significance in critical areas
of outward expression of grief response. This leads the researcher to wonder if the right measures
were chosen to allow the Extroversion/Introversion differences to be seen. This point can
certainly yield a recommendation for further research. As we move to the dominant function of
the personality ( Te F e S e N e T I F I S I N I), once again, little significance found in the comparison
of this category of type. With the exception of the Extraverted Feeler trending towards a more
63
Intuitive pattern on the GPI. This outcome leads the researcher to question if the theory of
inferior verses dominance in time of trauma might be accurate. This theory by Quenk (1999)
suggests that in times of high stress or trauma, the personality shifts to the less dominant
function, the one called the inferior function, and decisions are made through that lens. Once
again, these outcomes point to many possible further studies.
The most promising of the results are those connected to the functional pair dynamic of
the personality. In each of the measures, the functional pair emerged with significant differences.
The functional pair is the aspect of the personality responsible for perception and judgment. It
seems clear through these results, bereaved persons respond to grief differently according to their
preferred way of perceiving and deciding or judging the information regarding their loss. These
results call for deeper study into how the functional pairs impact the grief response. Isabel Briggs
Myers (McCalley, 1999) refer to these combinations with the following names “ST- Practical
and Matter of Fact Types”, “SF – Sympathetic and Friendly Types”, “NF – Enthusiastic and
Insightful Types”, “NT – Logical and Ingenious Types”. It appears these monikers can be
applied to how these combinations approach grief.
The results of the Prolonged Grief 13 were surprising. Most proponents of the inclusion
of prolonged grief in the diagnostic manual argue that somewhere between 8% to 10% and
perhaps 12% of grievers are at risk of developing prolonged grief disorder (Shear, Boelen and
Neimeyer, 2011, Schaal, Jacob, Dusingizemugu and Elbert, 2010, Marques, Bui, Leblanc et al,
2013). Within this study of 234 bereaved individuals, only one participant met the criterion for a
possible diagnosis of Prolonged Grief. While it was not an objective of this study to support or
discourage the pathology of grief, these outcomes lend themselves to continued research in this
area of concern. It will be important to dig deeper into the data to determine if other variables

64
might have affected this outcome. For now, continued cautious debate should continue.
When added to the limited literature questioning the relationship between grief and
personality as measured by MBTI (Jelly, 1990 and Fraser-Beekman, 1999), this first empirical
evidence is optimistic and calls for further research. The data supports the long-held anecdotal
belief that personality type and grief response is related and that perhaps we will see the
emergence of more research supporting the theory of “grief type”.
Discussion of the Conclusions
The conclusions of this study do what good research before it has done; they create new
questions for further research. This study aimed to discover if a relationship exists between
personality and grief response, as many theorists and clinicians have suggested, and with strong,
robust effects, the conclusion is yes. However, that conclusion leads to a whole new field of
study. While the conclusions indicate the functional pairs in the personality show the greatest
level of difference, the researcher believes with further analysis the dominant function and other
dichotomies will bear out further differences in grief response. One of the goals of this project
was to empirically validate the theory of Martin and Doka’s grief styles of Intuitive and
Instrumental patterns. While the outcomes of the measure need to go through the process of
validation, this researcher believes that goal will eventually be accomplished.
Limitations
The first limitation to be discussed in this study is the fact all of the data was compiled
with self-report measures. It is always possible the participants are less than honest in their
responses to these measures. Another limitation to the study is the ethnic makeup of the sample.
This lack of diversity impacts the generalization to the greater population, and calls for a more
65
ethnically diverse population in future studies. In addition, few parameters were placed upon the
participants. The cause of death, the relationship to the deceased and the time since death are all
variables that have been shown to impact grief response. In future analysis these variables need
to be considered. The use of the Grief Pattern Inventory can also be seen as a limitation, since the
assessment does not have a set validity and reliability to draw upon. Finally, the observed power
for a number of the statistical tests—in particular the follow-up pairwise comparisons—was
inadequate to detect small differences between means. This should be remedied in future
research using larger samples.
Recommendations for Future Research or Interventions
While this study adds to the literature regarding personality and grief, there still exists a
gap to continue to fill. Further research is needed to support the results of this study. Additionally
the need to use other methods and measures to find rich outcomes exists. Beyond the value of the
research to fill the gap in the literature, another value lies in the possible impact to clinical
interventions with those grieving. When clinicians understand how personality impacts grief,
interventions can be tailored to meet the individualized nature of client’s personality.
Conclusion
When entering into this study, the researcher had an intuitive sense that difference in personality
impacts grief response. Years of clinical work provided ample anecdotal evidence of that
intuitive sense. Now, empirical evidence supports that intuitive sense. The robust effects of
comparing the mean scores of differing MBTI types and dynamics of type bears out the
conclusion that, yes, those differences exist. While the heading states conclusion, the researcher

66
feels no sense of closure, only a wealth of information with which to move forward. It is with
great anticipation that further research and new interventions will be inspired by this study.

67
REFERENCES
Abraham, K. ( 1924/1927). A short study of the development of the libido, viewed in the light of
mental disorders. In Bryan, K. & Strachey, A. (eds.) , Selected papers of Karl Abraham MD. London: Hogarth Press.
Allport, G. (1955). Becoming: Basic consideration for a personality psychology. New Haven,
CN: Yale University Press. American Psychiatric Association. (1994). Diagnostic and statistical manual of mental disorders.
(4th Ed.). Washington, D.C.: Author. Archer, J. (1999). The nature of grief: The evolution and psychology of reactions to loss.
Florence, KY: Routledge. Attig, T. (1996). Relearning the world: The process of grieving. New York: Oxford Press. Bailley, S. (1999). Personality and grieving in a university student population. University of
Windsor (Canada). Retrieved from ProQuest Dissertations and Thesis database. Balk, D. (2008). A modest proposal about bereavement and recovery. Death Studies, 32(1), 84-
93. doi:10.1080/07481180701743448 Bayne, R. (2005). Ideas and evidence: Critical reflections on MBTI theory and practice.
Gainesville, FL: Center for Applications of Psychological Type. Bonanno, G. A.. (2004). Loss, trauma and human resilience. American Psychologist. 59(1) 20-
28. doi:10.1037003-066.59.1.20 Bonanno, G., & Kaltman, S. (1999). Toward an integrative perspective on bereavement.
Psychological Bulletin, 125, 760-776. Bonanno, G., & Kaltman, S. (2001). The varieties of grief experience. Clinical Psychology
Review, 21, 705-734. Bonanno, G., Wortman, C., & Nesse, R. (2004). Prospective patterns of resilience and
maladjustment during widowhood. Psychology and Aging, 19, 260-271 Bowlby, J. (1969). Attachment and loss. New York, NY: Basic Books. Bowlby, J. (1973). Attachment and loss. Vol. 2: Separation. New York, NY: Basic Books. Bowlby, J. (1980). Attachment and loss. Vol. 3: Loss, sadness and depression. New York, NY: Basic Books.

68
Breakwell, G. M., Hammond, S., Fife-Schaw, C., & Smith, J. (Eds.). (2006). Research methods in psychology (3rd Ed.). Thousand Oaks, CA: Sage.
Brooks, A. M. (1999). Grieving Time: A Year's Account of Recovery from Loss. New York, NY:
Herodias. Burton, R. (1938). The anatomy of melancholy (6th ed.). New York, NY: Tudor Publishing
Corporation. (Original published 1651) Cattell, R. (1949). Manual for forms A and B: Sixteen personality factors. Champaign, IL: IPAT. Cook, A. (2001). The dynamics of ethical decision making in bereavement research. In Stroebe,
Margaret S. (ed); Hansson, Robert O. (ed); Stroebe, Wolfgang (ed); Schut, Henk (ed) Handbook of Bereavement Research: Consequences, Coping, and Care. Washington DC: APA.
Corr, C. & Corr, D. (2007). Culture, socialization, and dying. In Balk, D. E., Wogrin, C.,
Thornton, G., & Meagher, D. K. Handbook of thanatology: The essential body of knowledge for the study of death, dying, and bereavement. Deerfield, IL: Association for Death Education and Counseling.
Corr, C. A., Nabe, C. M., & Corr, D. M. (2006). Death & dying, life & living (5th Ed.). Belmont,
CA: Thomson Wadsworth. Costa, P. & McRae, R., (1987). Neuroticism, somatic complaints, and disease: Is the bark worse
than the bite? Journal of Personality, 55, 299-316. Costa, P., McRae, R. & Dembroski, T., (1989). Agreeableness versus antagonism: Explication of
a potential risk for CHD. In search of coronary prone behavior: Beyond type A, 41-64. Hillsdale, NJ: Lawrence Erhlbaum.
Cowles, K and Rogers, B. (1991). The concept of grief: a foundation for nursing research and
practice. Research in Nursing and Health, 14, 119-127. Creswell, J. W. (2007). Qualitative inquiry and research design: Choosing among five
approaches (2nd Ed.). Thousand Oaks, CA: Sage Publications, Inc. Deutsch, H. ( 1937). Absence of grief. Psychoanalytic Quarterly, 6, 12– 22. Doka, K. (2006). Fulfillment as Sander’s sixth phase of bereavement: The unfinished work of
Catherine Sanders. Omega, 52(2), 143-151. Doughty, E. A. (2009). Investigating adaptive grieving styles: A delphi study. Death Studies. 33,
462-480. doi: 10.1080/07481180902805715

69
Elliott, K. M. (2006) The effects of personality and learning style on the achievement of adult learners in community college online education: An investigation based on the Meyers-Briggs type indicator and the Kolb learning styles inventory. (Doctoral dissertation). Retrieved from ProQuest Dissertations and Theses database.
Follan, M. M., & Minnis, H. H. (2010). Forty-four juvenile thieves revisited: From Bowlby to
reactive attachment disorder. Child: Care, Health and Development 36(5), 639-645. Fraser-Beekman, S. M. (1999). The recovery journey: A study of the role of personality type
dynamics in the recovery from the loss of a spouse. (Doctoral dissertation). Retrieved from ProQuest Dissertations and Theses.
Freud, S. (1917). Mourning and melancholia. Standard Edition of the complete psychological
works of Sigmund Freud, (Vol. 14). New York, NY: WW Norton. Gardner, W. L., & Martinko, M. J. (1996). Using the Myers-Briggs Type Indicator to study
managers: A literature review and research agenda. Journal of Management, 22(1), 45-83.
Gilbert, S. ( 2006). Death’s door: Modern dying and the ways we grieve. New York, NY: W.W.
Norton & Co. Ginn, C. (1994). Voices of Loss, Looking at Type Series, Gainesville, FL: Center for Applications
of Psychological Type. Granek, L. (2010). Grief as pathology: The evolution of grief theory in psychology from Freud to
the present. History Of Psychology, 13(1), 46-73. Hammer, A., (1993). Introduction to Type and Careers, Palo Alto, CA: Consulting Psychologists
Press, Inc. Higgs, M. (2001). Is there a relationship between the Myers Briggs type indicator and emotional
intelligence? Journal of Managerial Psychology. 16(7/8), 509-533. Hogan, N.S., Greenfield, D.B., Schmidt, L.A. (2001). Development and validation of the Hogan
Grief Reaction Checklist. Death Studies. 25, 1-32. Holland, J. M., Currier, J. M., Coleman, R. A., & Neimeyer, R. A. (2009). Integration of
Stressful Life Events Scale. First edition 2009, Center for Health Care Evaluation (152-MPD), VA Palo Alto Health Care System, 795 Willow Rd., Menlo Park, CA 94025.
Holland, J. M., Currier, J. M., Coleman, R. A., & Neimeyer, R. A. (2010). The Integration of
Stressful Life Experiences Scale (ISLES): Development and initial validation of a new measure. International Journal of Stress Management. 17(4), 325-352. doi:

70
Holland, J., Neimeyer, R., Boelen, P., Prigerson, H. (2009). The underlying structure of grief: A taxometric investigation of prolonged and normal reactions to loss. Journal of Psychopathology and Behavioral Assessment 31, 190-201.
Horrocks, S. L. (2006). A compendium of measurement instruments assessing grief,
bereavement and loss. (Doctoral dissertation). Retrieved from ProQuest Dissertations and Thesis database.
Huntington, S. L. (2009). Correlational study between emotional intelligence scores and specific
personality traits of professionals working in the nonprofit sector in the northwest. (Doctoral Dissertation). Pepperdine University, ProQuest, UMI Dissertations Publishing.
Jelly, J.F. (1992).The relationship of identified coping resources to personality type of bereaved
mothers and the relationship of their symbolic losses surrounding the death of their child to the life stage of these women. Retrieved from ProQuest Dissertations and Theses database.
Jung, C. (1921). Psychological Types. In Collected Works, (Vol. 6). Princeton, NJ: Princeton
University Press. Kauffman. (2008). What is 'no recovery?'. Death Studies, 32(1), 74-83. Kessler, D., & Kübler-Ross, E. (2005). On grief and grieving: Finding the meaning of grief
through the five stages of loss. New York, NY: Scribner. Klein, M. (1965). Mourning and its relation to manic-depressive states. Contributions to
psychoanalysis 1921–1945, 311– 418. New York, NY: Hillary. Kraemer, S., Steele, H., & Holmes, J. (2007). A tribute to the legacy of John Bowlby at the
centenary of his birth. Attachment & Human Development 9(4) 303-306. Kubler-Ross, E. (1969). On death and dying. New York: Scribner. Kubler-Ross, E (2005). On grief and grieving. New York: Scribner. Kummerow, J. & Quenk, L., (2003) A step–by-step guide to your unique expression of type, Palo
Alto, CA: Consulting Psychologists Press. Lamb, D. (1988). Loss and grief: Psychotherapy strategies and interventions. Psychotherapy:
Theory, Research, Practice, Training, 25(4), 561. Levang, E. (1998). When men grieve: Why men grieve differently and how you can help.
Minneapolis, MN: Fairview Press. Lindemann, E., (1944). The symptomology and management of acute grief. American Journal of
Psychiatry 101, 141-148.
71
Lombardo, G., & Foschi, R. (2003). The concept of personality in 19th-century French and 20th-century American psychology. History of Psychology, 6(2), 123.
Maciejewski, P. K., Zhang, B., Block, S. D., & Prigerson, H. G. ( 2007). An empirical
examination of the stage theory of grief. Journal of the American Medical Association 297, 716– 723.
Marques, L., Bui, E., LeBlanc, N., Porter, E., Robinaugh, D., Dryman, M. T., & Simon, N.
(2013). Complicated grief symptoms in anxiety disorders: Prevalence and associated impairment. Depression and Anxiety.
Martin, C. R. (1997). Looking at type: the fundamentals. Gainsville, Florida: Center for
Applications of Psychological Type. Martin, T. & Doka, K. (1996). Masculine grief. In K.J. Doka (ed.) Living with grief after sudden
loss (pp. 161-172) Washington, DC: Hospice Foundation of America. Martin, T. L., & Doka, K. J. (2000). Men don’t cry . . . women do: Transcending gender stereotypes of grief. Philadelphia, PA: Brunner & Mazel. Martin, T. L., & Doka, K. J. (2010). Grieving beyond gender: Understanding the ways men and
women mourn. New York, NY: Routledge. Martin, T. L., & Doka, K. J. (2011). The influence of gender and socialization on grieving styles.
In R.A. Neimeyer, D.L. Harris, H.R. Winokuer and G.F. Thornton (eds.), Grief and bereavement in contemporary society. (pp. 69-77). New York, NY: Routledge.
Myers, I. B., (1962). The Myers-Briggs Type Indicator (manual). Princeton, NJ: Educational
Testing Service. Myers, I. & Myers, P. (1980) Gifts differing. Palo Alto, CA: Consulting Psychologists Press. Myers, I.B. & McCaulley, M.H. (1985). Manual: A guide to the development and use of the
Myers-Briggs Type Indicator. Palo Alto, CA: Consulting Psychologists Press. McCaulley, M. (1980) The life of Isabela Myers, Gainesville, FL: Center for Applied
Psychological Type. McCrae, R., & Costa, P. (2007). Brief versions of the NEO-PI-3. Journal of Individual
Differences, 28(3), 116-128. Retrieved February 16, 2009, doi:10.1027/1614-0001.28.3.116
McGue, M., Bacon, S. & Lykken, D. (1993). Personality stability and change in early adulthood:
A behavioral genetic analysis. Developmental Psychology 29, 96-109. National Center for Health Statistics, (2011) Health, United States 2009: With Chartbook on Trends in the Health of Americans. Washington, DC: US Government.

72
Nicholson, I. (1998). Gordon Allport, character, and the 'culture of personality,' 1897-
1937. History of Psychology, 1(1), 52-68. doi:10.1037/1093-4510.1.1.52 Neimeyer, R.A. (1998). Lessons of loss: A guide to coping. New York, NY: McGraw-Hill. Neimeyer, R. Ed. (2001). Meaning reconstruction and the experience of loss. Washington, DC:
American Psychological Association. Niemeyer, R., Prigerson, H. & Davies, B. (2002). Mourning and meaning. American
Behavioral Scientist,4, 235-251. Neimeyer, R., Harris, D., Winokuer, H. & Thornton, G. Eds. (2011). Grief and bereavement in
contemporary society. New York, NY: Routledge. Parkes, C. M. ( 1964). Recent bereavement as a cause of mental illness. British Journal of
Psychiatry, 110, 198– 204. Parkes, C. M. ( 1965). Bereavement and mental illness? A classification of bereavement
reactions. British Journal of Medical Psychology, 38, 13– 26. Parkes, C. M. ( 1970). The first year of bereavement. A longitudinal study of the reaction of
London widows to the death of their husbands. Psychiatry,33, 444– 467. Parkes, C. M. ( 1971). Determination of outcome of bereavement. Proceedings of the Royal
Society of Medicine, 64, 279. Parkes, C.M. (1972). Bereavement, studies in adult grief. London: Tavistock Publishing. Peters, N. (2008). The interrelationship of grief and adult Attachment Prior to and Following the
Death of a Partner. Doctoral Dissertation. Retrieved from Proquest Disterations and Thesis databased.
Prigerson, H. G. (2004). Complicated grief: When the path of adjustment leads to a dead-
end. Bereavement Care, 23, 38–40. Prigerson, H. G., Frank, E., Kasl, S., Reynolds, C., Anderson, B., Zubenko, G. S., et al. (1995).
Complicated grief and bereavement related depression as distinct disorders: Preliminary empirical validation in elderly bereaved spouses. American Journal of Psychiatry, 152, 22-30.
Prigerson, H., Horowitz, M., Jacobs, S., Parkes, C., Aslan, M., Goodkin, K., et al. (2009).
Prolonged grief disorder: Psychometric validation of criteria proposed for DSM-V and ICD-11. PLos Medicine, 6, 1-12.

73
Quenk, N. (1993) Beside Ourselves: Our Hidden Personality in Everyday Life, Palo Alto, CA: Consulting Psychologists Press, 1993.
Rando, T. (1985). Creating therapeutic rituals in the psychotherapy of the
bereaved. Psychotherapy: Theory, Research, Practice, Training, 22(2), 236-240. Rando, T. (1988). How to go on living when someone you love dies. New York, NY: Bantam
Books. Rando, T. (2000). Clinical dimensions of anticipatory mourning: Theory and practice in working
with the dying, their loved ones and their caregivers. Warwick, RI: Institute for the Study and Treatment of Loss.
Roberts, B., DelVecchio, W., (2000). The rank-order consistency of personality traits from
childhood to old age: A quantitative review of longitudinal studies. Psychological Bulletin 126(1) 3-25.
Rutter, M (1995). "Clinical Implications of Attachment Concepts: Retrospect and
Prospect". Journal of Child Psychology and Psychiatry 36(4): 549–571. Rutter, M. (2010). Child and adolescent psychiatry: Past scientific achievements and challenges
for the future. European Child & Adolescent Psychiatry, 19(9), 689-703. Salter, D., Evans, N., & Forney, D. (2006). A longitudinal study of learning style preferences on
the Myers-Briggs type indicator and learning style inventory. Journal of College Student Development, 47(2), 173-184.
Sanders, C. (1999). Grief: The mourning after – dealing with adult bereavement. New York,
NY: Wiley. Sears, S. J., Kennedy, J. J., & Kaye, G. L. (1997). Myers-Briggs personality profiles of
prospective educators. The Journal of Educational Research, 90(4), 195-202. Schaal, S., Jacob, N., Dusingizemungu, J. P., & Elbert, T. (2010). Rates and risks for prolonged
grief disorder in a sample of orphaned and widowed genocide survivors. BMC psychiatry, 10(1), 55.
Shand, A.(1914/1920). The foundations of character (2nd ed.). London: Macmillan. Shear, K., Boelen, P., & Neimeyer, R. A. (2011). Treating complicated grief: Converging
approaches. Grief and bereavement in contemporary society: Bridging research and practice, 139-162.
Sheldon, K., & Elliot, A. (1999). Goal striving, need satisfaction, and longitudinal well-being:
The self-concordance model. Journal of Personality and Social Psychology, 76(3), 482-497.

74
Silcox, N. (2007). Types of grief. Typeface. 18(1), 34. Silverman, P. (2004). Living with dying. New York: Columbia University Press. Staudacher, C. (1991). Men and grief. Oakland, CA: New Harbinger. Stroebe, M., Hansson, R., Schut, H. & Stroebe W. (Editors). (2008) Handbook of bereavement
research and practice: advances in theory and intervention. Washington, DC: APA Books.
Stroebe, M., & Schut, H. (1999). The dual process model of coping with bereavement: Rationale
and description. Death Studies, 23(3), 197-224. doi:10.1080/074811899201046 Stroebe, W., & Stroebe, M. (1987). Bereavement and health: The psychological and physical
consequences of partner loss. New York, NY: Cambridge University Press. Thunholm, P. (2004). Decision-making style: habit, style or both? Personality and individual
differences, 36(4), 931-944. Tiagliaferre, L. & Harbaugh, G. (2001). A Personalized Guide to the Grieving Process,
Gainesville, FL: Center for Applied Psychological Type. Walter, T. (2005–2006). What is complicated grief? A social constructionist perspective.
Omega: Journal of Death and Dying, 52(1), 71–79. Wheeler, P. (2001). The Myers-Briggs Type Indicator and applications to accounting education
and research. Issues in Accounting Education, 16(1), 125-150. Wolfelt, A. (1998). “Companioning vs. Treating: Beyond the Medical Model of Bereavement
Caregiving– Part 1.” The Forum Newsletter. Association of Death Education and Counseling.
Wolfelt, A. (1998). “Companioning vs. Treating: Beyond the Medical Model of Bereavement
Caregiving– Part 2.” The Forum Newsletter. Association of Death Education and Counseling.
Wolfelt, A. (1998). “Companioning vs. Treating: Beyond the Medical Model of Bereavement
Caregiving– Part 3.” The Forum Newsletter. Association of Death Education and Counseling.
Worden, J.W. (2001) Grief counseling and grief therapy: A handbook for the mental health
professional. (3rd Ed) New York, NY: Springer Publishing Co. Worden, J. (2009). Grief counseling and grief therapy: A handbook for the mental health
practitioner. New York, NY: Springer.
75
APPENDIX A. STATEMENT OF ORIGINAL WORK
AcademicHonestyPolicy
CapellaUniversity’sAcademicHonestyPolicy(3.01.01)holdslearnersaccountablefortheintegrityofworktheysubmit,whichincludesbutisnotlimitedtodiscussionpostings,assignments,comprehensiveexams,andthedissertationorcapstoneproject.
EstablishedinthePolicyaretheexpectationsfororiginalwork,rationaleforthepolicy,definitionoftermsthatpertaintoacademichonestyandoriginalwork,anddisciplinaryconsequencesofacademicdishonesty.AlsostatedinthePolicyistheexpectationthatlearnerswillfollowAPArulesforcitinganotherperson’sideasorworks.
ThefollowingstandardsfororiginalworkanddefinitionofplagiarismarediscussedinthePolicy:
Learnersareexpectedtobethesoleauthorsoftheirworkandtoacknowledgetheauthorshipofothers’workthroughpropercitationandreference.Useofanotherperson’sideas,includinganotherlearner’s,withoutproperreferenceorcitationconstitutesplagiarismandacademicdishonestyandisprohibitedconduct.(p.1)
Plagiarismisoneexampleofacademicdishonesty.Plagiarismispresentingsomeoneelse’sideasorworkasyourown.Plagiarismalsoincludescopyingverbatimorrephrasingideaswithoutproperlyacknowledgingthesourcebyauthor,date,andpublicationmedium.(p.2)
CapellaUniversity’sResearchMisconductPolicy(3.03.06)holdslearnersaccountableforresearchintegrity.WhatconstitutesresearchmisconductisdiscussedinthePolicy:
Researchmisconductincludesbutisnotlimitedtofalsification,fabrication,plagiarism,misappropriation,orotherpracticesthatseriouslydeviatefromthosethatarecommonlyacceptedwithintheacademiccommunityforproposing,conducting,orreviewingresearch,orinreportingresearchresults.(p.1)
Learnersfailingtoabidebythesepoliciesaresubjecttoconsequences,includingbutnotlimitedtodismissalorrevocationofthedegree.
Statement of Original Work and Signature

76
Ihaveread,understood,andabidedbyCapellaUniversity’sAcademicHonestyPolicy(3.01.01)andResearchMisconductPolicy(3.03.06),includingthePolicyStatements,Rationale,andDefinitions.
Iattestthatthisdissertationorcapstoneprojectismyownwork.WhereIhaveusedtheideasorwordsofothers,Ihaveparaphrased,summarized,oruseddirectquotesfollowingtheguidelinessetforthintheAPAPublicationManual.
Learner name Lisa Prosser-Dodds
Mentor name and school
Louis Kavar, PhD Harold Abel School of Social Behavior and Psychology

77
APPENDIX B.
QUALIFYING QUESTIONS PARTICIPANT DEMOGRAPHIC DATA
Are you over the age of 24? Do you read and comprehend English at or above a 6th grade level? Have you experienced the death of a loved one over 6 months ago? Age Range: 24-30 31-40 41-50 51-60 61-70 70 and over Gender: Male Female Relationship to deceased Number of years since death? Number of years you had known the deceased? How often were you in contact with this person? Was this death anticipated, unanticipated, traumatic? Were you present at the time of the death? How many loved ones have you lost to death in the past 3 years? What term describes your ethnicity? Caucasian Hispanic Asian Black or African American Hawaiian or Pacific Islander Native American Other Did you seek grief counseling after the death?