the relationship between food security and violent conflict: summary of a report to fao
TRANSCRIPT

The Relationship betweenFood Security and Violent Conflict:
Summary of a Report to FAO
Tilman Brück, Negar Habibi, Charles Martin-Shields,Astrid Sneyers, Wolfgang Stojetz and Stijn van Weezel
ISDC – International Security and Development Center, [email protected]
www.isd-center.org
FAO, Rome7 March 2017
ISDC
policies for
peace and
prosperity

Overview
1. Introduction2. Conflict-affected and Fragile Countries3. Correlating Food Security, Conflict and Fragility4. From Conflict to Food Security5. From Food Security to Conflict6. Need for New Data7. Policy Implications
ISDC
policies for
peace and
prosperity

Project Overview
Objective– to explore and map the analytical and empirical relationships
between food security and conflictTeam
– ISDC (with advice from FAO)Duration
– August 2016 – February 2017Outputs
– joint FAO-Households in Conflict Network workshop in 10/2016– 5 working papers and 1 policy report by ISDC (not yet online)– various products by FAO
Further details– www.isd-center.org and www.hicn.org
ISDC
policies for
peace and
prosperity


Call for Papers on Conflict, Aid and Humanitarian Assistance.Papers due 15 May 2017. HiCN Workshop on 15-16 Nov 2017.

hunger
peacewar
target
➢ Conflict and food insecurity are highly endogenous!
foodsecurity

1: War leads to hunger.***2: Rising food prices cause political instability.**3: Improved food security may strengthen peace.*4: Across all settings: institutions matter!**
foodsecurity
hunger
peacewar
1
3
4
target
KeyFindings
2

Overview
1. Introduction2. Conflict-affected and Fragile Countries3. Correlating Food Security, Conflict and Fragility4. From Conflict to Food Security5. From Food Security to Conflict6. Need for New Data7. Policy Implications
ISDC
policies for
peace and
prosperity

Key Questions
Which conflict parties?– interstate, intrastate and internationalized intrastate conflicts
Which conflict intensity and duration?– high (above 1000 battle deaths) or low (25-1000 battle deaths)– some conflicts are extremely sticky
Which direction of violence?– one-sided violence
Beyond violence: fragility– strength of formal and informal institutions
Overlap of categories possible

Global Conflict Trends, 1996-2014
0
5
10
15
20
25
30
35
40
1996 1997 1998 1999 2000 2001 2002 2003 2004 2005 2006 2007 2008 2009 2010 2011 2012 2013 2014
Intrastate conflict Interstate conflict Internationalized Intrastate conflict
This series includes a high share of countriesexperiencing very long intrastate conflicts.

11
Conflict Types 2011-17
Inter Intra Int. Intra One-sided Years Conflict2011-14
# Types
Afghanistan Yes Yes 4 2Burundi 0 3CAR Yes Yes Yes 4 3Chad 0 0North Korea 0 0DRC Yes Yes Yes 3 3Djibouti 0 0Eritrea 0 0Ethiopia Yes Yes 4 2Haiti 0 0Kenya 0 0Liberia 0 0Niger 0 0Somalia Yes Yes 4 2South Sudan Yes Yes Yes 4 3Sudan Yes Yes Yes 4 3Syria Yes Yes 4 2Yemen Yes Yes 4 2Zimbabwe 0 0Total/Mean 2 6 6 8 1,84 1,32
FAO Protracted Crisis List, 2017 Update

Deconstructing Fragility: The Macro Level
• Traditional focus on ‘the state’ and the aggregate level of observation in discussing ‘fragility’
• Yet, no clear definition of what constitutes a ‘failed’ or ‘fragile’ state
• And, obviously, the experience of fragility varies across groups or even individuals
• OECD (2015: 40) argues for precisely such a multidimensional approach, based on a range of different indicators
• 3 key domains, from our perspective:• human security • economic inclusion• social cohesion
including subjective indicators

Deconstructing Fragility: The Micro Level
Source: Brück et al (2017), Microeconomic Foundations of Fragility, AERC, Nairobi.
Individual-level Fragility Indicators in Kenya, 2016
gove
rnan
ce g
apce
ntra
l gov
ernm
ent

Overview
1. Introduction2. Conflict-affected and Fragile Countries3. Correlating Food Security, Conflict and Fragility4. From Conflict to Food Security5. From Food Security to Conflict6. Need for New Data7. Policy Implications
ISDC
policies for
peace and
prosperity

Key Messages
Over time, countries in Protracted Crisis shift between different categories of conflict, but rarely achieve full peace:
– Shifts could be in intensity of the conflict or in the actors involved.*
As the scale of a conflict increases, the impacts on food security tend to be felt at different levels:
– Low intensity, localized conflict is related to low Utilization and Availability.*– Larger scale conflict is related to Access as well as Utilization and Availability.*– Fragility correlates with low Availability.*
There is a polarisation around some very conflicted, food insecure countries and other protracted crises.*
Variables that matter are conflict type, duration and intensity, conflict-fragility interactions, level of observation, and food security dimension.*

Correlating Food Security and Conflict
Yes No
Sam
ple
Diff
Yes No
Sam
ple
Diff
Yes No
Sam
ple
Diff
Yes No
Sam
ple
Diff
Yes No
Sam
ple
Diff
Yes No
Sam
ple
Diff
Prevalence of Undernourishment 29
,0%
19,7
%
19,8
%
9.4%
****
23,4
%
19,5
%
19,8
%
3,1%
24,1
%
19,0
%
19,8
%
5.1%
*
27,6
%
19,3
%
19,8
%
8,3%
25,3
%
18,8
%
19,8
%
6.5%
**
24,7
%
19,1
%
19,8
%
5,6%
Depth of Food Deficit 21
4
136
141
78**
**
173
139
141 34 177
134
141
43*
195
138
141 57 185
133
141
57**
183
135
141 48
Food Price Volatility Index 11
,7
10,4
10,5
1,3
10,5
7,5
10,5
3.0*
*
12,4
10,2
10,5
2.2*
*
16,8
10,3
10,5
6.3*
*
11,8
10,3
10,5
1.5*
13,2
10,3
10,5
2,9
Dietary energy supply 58
,06
49,4
6
49,8
6
8.6*
***
56,7
49,7
6
49,8
6
6,94
57,0
8
49,0
5
49,8
6
8.03
***
56,6
7
49,7
1
49,8
6
6.96
*
58,7
5
48,8
5
49,8
6
9.9*
***
60,0
5
49,2
6
49,8
6
10.7
9***
*
Cereal Import Dependency 36
,1
31,8
32,1
4,3
3,27
37,5
32,1
34,2
24,2 33 32,1
8,8
33,6
32,1
32,1
1,5
26,1
32,8
32,1
6,7
41,9
31,6
32,1
10,3
Total Countries 51 150
201
15 186
201
53 148
201
25 176
201
68 133
201
51 150
201
Comparisons of Average Food Security Indicators: All years, All countries
Low
Inte
nsity
Co
nflic
t
Inte
rsta
te C
onfli
ct
Intra
state
Con
flict
Inte
rnat
iona
lized
In
trasta
te C
onfli
ct
One
-sid
ed V
iole
nce
Frag
ile S
tate
s

• Ability to distribute food nationwide.
• Organize imports and exports.
• Capacity to balance import versus domestic production.
• Domestic infrastructure for food distribution.
• Health and state services to address malnutrition.
• Government extension services for household food security.
• Inability to distribute food.
• Exposure to global price shocks.
• Lack of coherent foodproduction or import policies.
• Inability to manage food distribution.
• Low/limited infrastructure.• Lack of capacity to meet
nutritional public health needs.• No extension services.
Hig
hFr
agilit
y
Hig
h Ad
min
istra
tive
Cap
acity
SystemicFood Security
IndividualFood Security
Correlating Food Security, Fragility and the Level of Observation

Low-intensity Conflict
Internationalized Intrastate Conflict
Fragility
Exposure to GlobalPrice Shocks
Food Insecurity + Domestic Price
ShocksFood Insecurity
Type 3:Country is functional insome other ways, but at highrisk of price shocks beyondits control that could lead toconflict
Type 2:Conflict is intensive enough toinclude external actors; impactson population (under-nourishment) and domesticfood prices are noticeable.
Type 1:Conflict is localized enoughthat impacts are not felt innationwide food prices; onlyimpact is on people local tothe violence, expressed inthe form of under-nourishment.
Scenario is likely if a civilconflict is increasingly drawingin external actors, exposing thecountry to wider global priceissues, plus destruction ofdomestic crop capacity
Conflict is lower intensity and anyexternal participation is at a smallscale; total scope of violence isnot larger enough to impactnational food markets.
Administrative capacity is verylow, and aside from distributionproblems, policy or economicissues have led to food shortages.Risks include food riots, and urbanviolence.
Administrative capacity is low, andfood security is a problem ofdistribution instead of supply. Anypotential violence would belocalized and due to relativedeprivation.
Country is fragile, and hasnoticeable levels of localized orlow intensity violence, but foodsecurity issues are only noticeablein terms of exposure to globalmarkets.
Localized conflict leads toundernourishment in affectedareas, while food price issuesare more likely due to policy oradministrative issues asopposed to the low intensityconflict.
Typology of Conflict, Fragility and Food Security

Low-intensity Conflict
Internationalized Intrastate Conflict
Fragility
Exposure to GlobalPrice Shocks
Food Insecurity + Domestic Price
ShocksFood Insecurity
Type 3:Country is functional in allother ways, but at high risk ofprice shocks beyond its controlthat could lead to conflict
Type 2:Conflict is intensive enough toinclude external actors; impactson population(undernourishment) anddomestic food prices arenoticeable.
Type 1:Conflict is localized enoughthat impacts are not felt innationwide food prices; onlyimpact in on people local tothe violence, felt in the formof undernourishment.
Scenario is likely if a civilconflict is increasingly drawingin external actors, exposing thecountry to wider global priceissues, plus destruction ofdomestic crop capacity
Conflict is lower intensity and anyexternal participation is at a smallscale; total scope of violence isnot larger enough to impactnational food markets.
Administrative capacity is verylow, and aside from distributionproblems, policy or economicissues have led to food shortages.Risks include food riots, and urbanviolence.
Administrative capacity is low, andfood security is a problem ofdistribution instead of supply. Anypotential violence would belocalized and due to relativedeprivation.
Country is fragile, and hasnoticeable levels of localized orlow intensity violence, but foodsecurity issues are only noticeablein terms of exposure to globalmarkets.
Localized conflict leads toundernourishment in affectedareas, while food price issuesare more likely due to policy oradministrative issues asopposed to the low intensityconflict.
Conflict, Fragility and Food Security
For example: Rwanda, Angola, Haiti, Myanmar, Djibouti, Ethiopia, Chad, Georgia, Afghanistan, Rep. of Congo
For example: Angola, Iraq, Uganda, Rep. of Congo, Rwanda, Sierra Leone, Yemen
For example: Djibouti, Papua New Guinea, Solomon Islands, Vanuatu, Yemen, Mauritania, Comoros, Somalia, Liberia

Overview
1. Introduction2. Conflict-affected and Fragile Countries3. Correlating Food Security, Conflict and Fragility4. From Conflict to Food Security5. From Food Security to Conflict6. Need for New Data7. Policy Implications
ISDC
policies for
peace and
prosperity

Key Messages
Conflict has a significant negative impact on food security, whether measured in terms of access, utilization, stability or availability.***
The reason for fighting has a statistically significant impact on the severity of conflict-induced food insecurity.**
– Conflicts over control of the government tend to show wider impact on food insecurity than conflicts over control of territory.
– Conflicts over control of the entire country will have larger effects on food systems than conflicts over a specific geographic region.
Intrastate conflict in drought-affected settings has a significant impact on increases in the number of underweight individuals.**
Conflict may have negative impact on access to food.*– For example, fighting itself often destroys existing infrastructure. While already
weak states may also lack infrastructure and are more likely to suffer conflict, these trends are accentuated by fighting, which in turn worsens food security.

Literature on Conflict → Food Security
Key literatures– Violent conflict → Short-term anthropometric impacts– Violent conflict → Long-term impacts– Violent conflict → Agricultural coping strategies
Key evidence– Micro-level– Civil war– Violent conflict → Nutritional status → Impacts
22

Case Study: Macro-level Trends
Data on food supply– calorie intake per day per capita (FAO Food Balance Sheets)
Data on conflict– country-years with at least 25 battle-related fatalities
(UCDP/PRIO)Coverage
– 106 countries in the Global South (Africa, Asia, Latin America) in the period 1961-2011
Methods– regression analysis to establish causality

Case Study: Weak Positive Association Peace Duration and Food Supply Levels

Case Study: Findings
• On average, conflict is negatively associated with food supply levels.
• Conflict onset is associated with 65% drop in growth of food supply.
• This effect is larger for conflicts with high intensity and about power.
• Small differences in food supplies during conflict and non-conflict years.
• But there is some empirical evidence that longer peace durations are associated with higher food supply levels.
• And not all countries seem to suffer the same negative effect of conflict on food supply levels.

Case Study: Disclaimers
• Using data aggregate at the national level provides some useful insights into the macro-level trends, but this comes at the cost of missing sub-national variation both in food security and conflict.
• This makes it hard to pin down the exact channels and mechanisms.
• Moreover, the data used might be biased towards urban consumers.

Overview
1. Introduction2. Conflict-affected and Fragile Countries3. Correlating Food Security, Conflict and Fragility4. From Conflict to Food Security5. From Food Security to Conflict6. Need for New Data7. Policy Implications
ISDC
policies for
peace and
prosperity

Key MessagesGenerally speaking, the impact of variations in food security on the likelihood of violent conflict are difficult to identify statistically.*
National level indicators of food security tend to change relatively slowly and thus lack the variance necessary to demonstrate statistically how they can lead to conflict (even if they do in practice).*
Sub-national analyses of food security and violence show promising results for understanding how anthropometric and production measures of food security can impact conflict.**
– For example, evidence from subnational analysis of rainfall and production in Ethiopiaindicates that variation in food production and access has a significant effect on the likelihood of local violence.**
– For example, analysis at the household-level in Somalia indicates that food production and availability pressures, such as drought, have a statistically significant impact on conflict likelihood. This relationship is not observed at the district level, indicating that understanding channels from food security to conflict may be best observed at the household level.**

Literature on Food Security → Conflict
Key literatures– Food insecurity → Anti-social behavior– Food prices → Violent conflict– Food production → Violent conflict– Climate → Violent conflict– Food aid → Violent conflict
Key evidence– Aggregate/macro-levels– Food prices → Urban riots – Climate → Agricultural production → Conflict
29

Tackle Endogeneity Food Security ↔ Conflict
Key strategies– Cross-sectional analysis– Panel data analysis (incl. lag specifications)– Exploit exogenous variation in treatment
• Controlled experiments• Natural experiments
– Exploit exogenous variation correlated with treatment (IV)
Key issues– Main concern: omitted variable and simultaneity bias– For key questions controlled experiments are not available
• Can‘t randomize conflict• Can‘t randomize climate
30
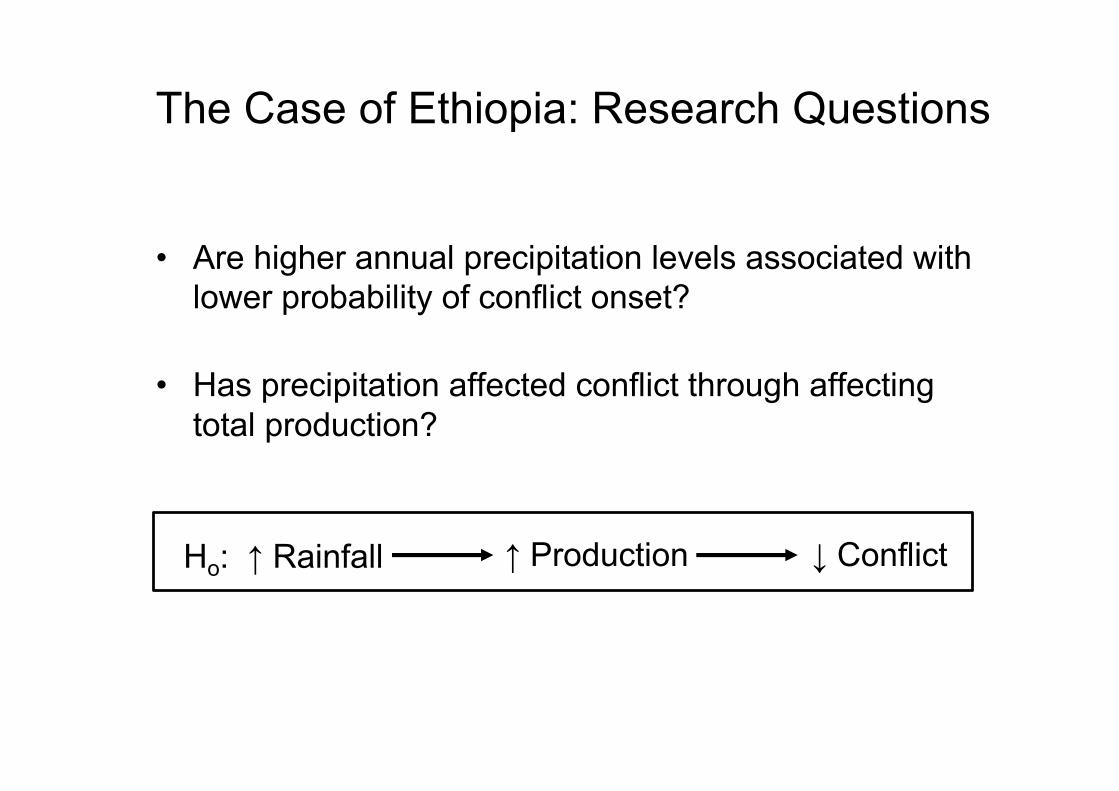
The Case of Ethiopia: Research Questions
• Are higher annual precipitation levels associated with lower probability of conflict onset?
• Has precipitation affected conflict through affecting total production?
Ho: ↑ Rainfall ↑ Production ↓ Conflict

Case Study: Methodology and Data
Method:– Variations in precipitation used as a proxy for exogenous
shocks to food security
Data:– Conflict: Geo-coded data from the Armed Conflict Location and
Event Data (ACLED)– Annual Precipitation: Geo-coded data from PRIO-GRID at
0.5×0.5 decimal degrees resolution (55km×55km)

Case Study: Main Results
Precipitation levels have a negative and statistically significant effect on the probability of conflict onsetThe same result holds across different types
– low intensity, intra-state and non-state conflict events
Precipitation affects probability of conflict onset through affecting production levels
Other variables affecting conflict:– Higher percentage of agricultural area in a geographic unit is
associated with higher probability of low intensity conflict– Political exclusion of ethnic groups has a positive and
statistically significant impact on probability of conflict– More populated areas are more likely to experience conflict

Case Study: Discussion
Lack of precipitation results in lower production levels which in turn increases the probability of conflict.
Agriculture dependent areas are– more vulnerable to weather conditions– more likely to experience low intensity conflict during low
precipitation periods
Diversification of production sources and lower reliance on rainfall dependent agriculture will decrease the sensitivity of total production levels to weather conditions and in turn reduce the risk of violent conflict.

Overview
1. Introduction2. Conflict-affected and Fragile Countries3. Correlating Food Security, Conflict and Fragility4. From Conflict to Food Security5. From Food Security to Conflict6. Need for New Data7. Policy Implications
ISDC
policies for
peace and
prosperity

AddressingData Challenges
Hard to collect complete and consistent global cross-sectional data for understanding conflict
Add conflict variables to standard survey tools to correlate C and FS within surveys (Brück et al 2016a)
Match and merge multiple data sets from different sources
Strengthen the capacity of food security experts on conflict and of conflict experts working on food security, also with a view to strengthening multi-disciplinary data (Brück et al 2016b)
Explore and analyze administrative (or project) data from emergency settings, e.g. from enhanced M&E frameworks
Statistical Capacity
Micro
Macro
Meso
Use geo-coded remote sensing data to track socio-economic developments and conflict
Conduct RCTs on interventions for peace and food security (Brück et al 2015)
Learn from case studies to build up robust evidence base
Use data from mobile phones to overcome data collection challenges
Strengthen statistical capacity will also reduce fragility and improve accountability

Overview
1. Introduction2. Conflict-affected and Fragile Countries3. Correlating Food Security, Conflict and Fragility4. From Conflict to Food Security5. From Food Security to Conflict6. Need for New Data7. Policy Implications
ISDC
policies for
peace and
prosperity

