the relationship between external reserves and …
TRANSCRIPT

International Journal of Economics, Commerce and Management United Kingdom Vol. VI, Issue 5, May 2018
Licensed under Creative Common Page 213
http://ijecm.co.uk/ ISSN 2348 0386
THE RELATIONSHIP BETWEEN EXTERNAL RESERVES AND
ECONOMIC GROWTH IN NIGERIA (1980-2016)
Nelson Johnny
Department of Finance and Accountancy, Niger Delta University, Nigeria
Wilberforce Johnnywalker
Department of Finance and Accountancy, Niger Delta University, Nigeria
Abstract
The study examined the relationship between external reserve and economic growth in Nigeria
from 1980 to 2016. The study used three explanatory variables (real gross domestic product,
market capitalization and agricultural output) and one explained variable (external reserve). Test
carried out include unit root test, co-integration test, ordinary least square and Granger causality
test. The study revealed that: There is positive and significant relationship between external
reserve and real gross domestic product in Nigeria; there is positive and significant relationship
between external reserve and market capitalization in Nigeria; and there is negative and
insignificant relationship between external reserve and agricultural output in Nigeria. Based on the
findings, the study recommends that, Government should implement policies that will promote the
level of real gross domestic product in Nigeria; government should ensure that our capital market
is well capitalized and improve upon so as to enable boast the international reserves.
Keywords: External reserve, RGDP, market capitalization and agricultural output
INTRODUCTION
International reserves have expanded rapidly in recent years due to the felt benefits nations
attached in holding adequate level of external reserves. Foreign reserve is the nation’s external
stock of assets. Nzotta (2014) sees foreign reserve as balances of foreign exchange surpluses
of a country that accumulated over time. And these international reserves could be held in

©Author(s)
Licensed under Creative Common Page 214
foreign currencies and international financial assets. IMF (2000) described foreign reserves as
official public foreign assets that are readily available to and controlled by the monetary
authorities for direct financing of imbalances, and directly regulating the magnitude of such
imbalances, through the intervention in the international markets to affect the currency
exchange rate or for other purposes. According to Kashif, Sridharan and Thiyagarajan (2017),
international reserves are the country’s external assets that include gold, special drawing right,
foreign currency deposits and bond by the apex banks and monetary authorities. Akaninyene
(2016) implies that foreign reserves serves as a means of assisting the monetary and foreign
exchange policies, among other several uses in order to meet the macroeconomic objectives in
safeguarding the currency stability and to smoothen the normal functioning of the domestic and
external payment system.
A proper management of international reserves could be a key to economic growth and
development. Akinwunmi and Adekoya (2016) maintained that, no nation will allow its currency
to float in the foreign exchange market without an adequate intervention. Several times, the
monetary authorities in Nigeria have influenced the country’s exchange rates by buying and
selling currencies in order to manage the exchange rates. This is due to the fact that currency
rates affect the economy through the trade balances which automatically determine the value
and quality of exchange reserves holding of a country.
Over forty years, the Nigerian economy has been experiencing unfavorable exchange
rate and fluctuating international reserves that are considered not adequate. Previous studies
felt the level of external reserves in a country are influenced by external sector developments
such as international trade transactions and other related issues, therefore do not consider
domestic issues that could possibly influence the exchange rates and determine the position of
international reserves. This study will concentrate on domestic factors that could influence the
international reserves; particularly the causal relationship and fill the existing gap in literature
and for policy implementation.
LITERATURE REVIEW
International exchange is a means of affecting payments for international transactions. When
foreign expenditures are lower than foreign exchange incomes, the gain gives rise to foreign
reserves. Nzota(2014) explained that foreign reserves represent balances of foreign exchange
surpluses of a country that accumulated over time. Nneka (2012) opined that, foreign reserves
of a country determines the country’s rating in the global market and a good level international
reserves will make a country appear financially responsible and credit worthy. Osuji and
Ebiringa (2012) opined that, the purpose of holding foreign reserves is to allow the central bank

International Journal of Economics, Commerce and Management, United Kingdom
Licensed under Creative Common Page 215
an additional means to stabilize the issued currencies from shocks. The precautionary theory
explains this fact for holding foreign reserves to meet unforeseen contingencies. Awoderu,
Ochalibe and Hephziba (2017) concur that, when applied to the concept of international
reserves, it aids savings, investment and generate output for potential times of crises, especially
balance of payment crises. Solow’s model of economic growth is based on the premise that
output in an economy is produced by a combination of labor (L) and capital (K), under constant
returns, so that doubling input results in doubling output. Contemporary versions distinguish
between physical and human capital. Thus, the quantity of output (Y) is also determined by the
efficiency (A) with which capital and labor is used. Solow sees output as a whole, the only
resource of the nation’s economy. Its yearly rate of production is designated as Y(t) which
represents the real income of the country, part of it is consumed and the rest is saved and
reinvested. That which is saved is a constant s, and the rate of saving is sY(t). K(t) is the stock of
capital. Thus net investment is the rate of increase of this stock of capital.
Therefore the basic identity K = sY since output is produced by capital and labor,
technical possibilities are represented by the production function Y = f(K,L) (Jhingan 2005). It
means increase in savings leads to investment and that leads to greater output in turn leads to
higher external reserves. According to Fukuda and Kon (2007), when persistent increases of
foreign reserves prevail, consumption declines because permanent income decline. But when
increased international reserves are temporal, consumption does not decline because of the
permanent income hypothesis. They emphasized that temporary increase of foreign exchange
reserves could reduce domestic savings and have a negative impact on the domestic
investment and economic growth.
EMPIRICAL REVIEW
Awoderu, Ochalibe and Hephziba (2017) ascertained the implications of long run relationship
between external reserves and economic growth in Nigeria between 1980 and 2014. The study
employed multiple regressions to measure real gross domestic product, external reserves,
exchange rate, export and import. The results revealed among others that real gross domestic
product and external reserves was positive and significantly related, also indicated a long run
relationship. Evans and Egwakhe (2008) ascertained the relationship between external reserves
and the Nigerian economy; the dual folded debate from 1994 to 2005 by using regression
model, the result shows a positive but insignificant relationship between external reserves and
exports. In another similar study carried out by Akinwunmi and Adekoya (2016), investigating
the relationship between external reserves management and its effect on Nigeria economic
growth, with external reserves, exchange rate, monetary policy rate, inflation rate, gross

©Author(s)
Licensed under Creative Common Page 216
domestic product and foreign direct investment from 1985 to 2013. With the aid of the multiple
regressions, the results found a significant relationship among the variables. Gross domestic
product, monetary policy rate and foreign direct investment were highly statistically significant,
while inflation rate and exchange rate were statistically insignificant. Umeora (2013) investigated
the influence of external reserves accumulation on exchange rate and inflation rate in Nigeria
from 1986 to 2010. The regression result shows a negative and significant relationship between
the explained variable and inflation rate. While the explained variable and exchange rate was
found to be positive and significant. In using ordinary least square and Granger causality test,
Wlliams (2016) from 1996 to 2015 measured external reserves, corruption index, exchange
rate, real interest rate and gross domestic product in Nigeria. The study revealed unidirectional
relationship between corruption and external reserves. Corruption and exchange rate were
found to be positively related with external reserves.
In another development, Ngozi, Abdulkadir, Ismaila, Mohammed, Solomon, Bola and
Michael (2016) with a threshold vector error correction model ascertained the relationship
between exchange rate and external reserves in Nigeria from January 1, 2014 to July 31, 2015.
The error correction coefficients for both the bureau de change exchange rate and external
reserves equations were not statistically significant at the 5% significant level. Francis and
ThankGod (2016) examined external reserve management and economic growth in Nigeria,
using real gross domestic product as dependent variable while external reserve and exchange
rate were used as independent variables. The ordinary least square result indicated a negative
relationship between real gross domestic product and external reserve. Osuji and Ebiringa
(2012) analyzed the effect of external reserves management on macroeconomic stability in
Nigeria from 1980 to 2009. In using the var model and granger causality test, the tests pointed
out that external reserves was significant in the current year but ends to converge in the
previous years. The value of the joint significance indicated that the current values of gross
domestic product, capital goods, non capital goods and exchange rate are most influencing
factors that determine the current value. Udo and Antai (2014) examined the opportunity cost of
Nigeria’s external reserves from 1970 to 2011. In measuring external reserves, gross domestic
product, private consumption, net international trade, government expenditure and domestic
investment with greenspan-guidott and multiple regressions, the results show that external
reserves negatively influenced the level of domestic economic productivity and investment. It
was therefore recommended that, government should reduce the level of excess reserves and
rather used it for investment in the domestic economy. Also from Usman and Ibrahim (2010)
that examined external reserve holding in Nigeria; implications for investment, inflation and
exchange rate from 1986 to 2006 by using ordinary least square and vector error correction

International Journal of Economics, Commerce and Management, United Kingdom
Licensed under Creative Common Page 217
found that external reserves in the country only influences foreign direct investment and
exchange rate but no influence on domestic investment and inflation rates.
Victoria, Emmanuel, Obinna, Esther and Akinde (2016) investigated the relationship
between public debt and external reserves in Nigeria from 1981 to 2013. The results from fully
modified ordinary least square method show that public debt has a positive and significant effect
on external reserve shock. Akaninyene (2016) ascertained the long run relationship between
foreign reserve accumulation and macroeconomic environment in Nigeria from 2004 to 2014
with the use of co-integration technique. In measuring gross domestic product, inflation rate,
exchange rate, unemployment rate, investment, external debt, and foreign reserves, the results
indicated the existence of a long run relationship between foreign reserves and the explanatory
variables. Saheed, Sani and Idakwoji (2015) look at the impact of public extended debt on
exchange rate in Nigeria from 1981 to 2013. With the aid of the ordinary least square method,
the results found among others that foreign reserves proved to be positive and significantly
related with exchange rate. Lugman and Adeola (2016) also look at the effect of external
reserves and balance of payment changes on economic growth in Nigeria between 1970 and
2011. Gross domestic product, exchange rate and inflation rate were used as explanatory
variables while external reserves and balance of payment were used as explained variables.
The ordinary least square result revealed a positive and significant relationship between
external reserves and gross domestic product for the period. In a wider coverage, Alasan and
Shaib (2011) examined the relationship between external reserves management and economic
development in Nigeria from 1980 to 2008. The study employed ordinary least square to
measure external reserves, gross domestic product, oil export, non oil export, non oil import,
capital good, non capital good and political stability. External reserve was found to be positive
and significantly related with gross domestic product, oil export and capital goods. External
reserve was found to be negatively related with non oil export, non capital goods, non import
and political stability. In conclusion external reserve was found to be negatively related with
macroeconomic stability.
In foreign experience, Kashif, Sridharan and Thiyagarajan (2017) used error correction
mechanism to examined impact of economic growth on international reserve holding in Brazil
from 1980 to 2014. Real gross domestic product was used as explained variable while external
reserve was used as independent variable. The results revealed that economic growth was
highly significant; that economic growth and international reserves indicated positive long run
relationship. Borivoje and Tina (2015) empirically analyzed the impact of foreign exchange
reserves on economic growth in emerging economies from 1993 to 2012. With the use of ONK
method, the results show that an increase in foreign exchange reserves caused the growth of
©Author(s)
Licensed under Creative Common Page 218
gross domestic product in Brazil, China and Russia. Isaac (2014) investigated the relationship
between international reserves accumulation and economic growth in the West African
monetary zone. Lowess technique was used to measure foreign reserves, civil liberty, political
rights, labor force, remittances, financial development and foreign direct investment. The
outcome indicated a U-shaped relationship between economic growth and international
reserves. Emmanuel and Moses (2016) investigated foreign exchange reserve and its impact on
stock market in Ghana between 2001 and 2015 with the aid of regression and granger causality
test methods. The results show a significant positive impact on stock market capitalization and
also indicated a causal relationship among the variables. Kashif and Sridharan (2015) look at
the Indian experience on the subject and measured external reserves and gross domestic
product between 1993 and 2013. The ordinary least square results show that international
reserve was found positive and significantly related with gross domestic product. Kashif,
Sridharan and Thiyagarajan (2016) look at the Chinese experience and empirically analyzed the
international reserves demand function by measuring real gross domestic product, import, real
effective exchange rate, trade openness and international reserves from 1985 to 2014. The
ordinary least square and co-integration results indicated a long run relationship among the
variables and found a positive significant relationship among the variables. Kashif (2016) also
look at the Algerian economy by using Granger causality test and measured international
reserves and real gross domestic product from 1985 to 2014. Bidirectional causality between
the international reserves and economic growth was noticed. Sarbapriya (2012) concentrated
on stock market capitalization and international reserves in India from 1990 to 2010. With the
use of Granger causality test, the results show that causality was unidirectional and it runs from
foreign exchange reserves to stock market capitalization.
Summary
The debate on the subject is still on as scholarly consensus having not been reached. Close
scrutiny of the reviewed papers indicated different results and conclusion on the subject.
Awoderu, Ochalibe and Hephziba (2017), Victoria, Emmanuel, Obinna, Esther and Akinnde
(2008), Kashif, Sridharan and Thiyagarajan (2017), Saheed, Sani and Idakwoji (2015),
Emmanuel and Moses (2016), Lugman and Adeola (2016), and Kashif and Sridharan (2015)
found a positive significant relationship between external reserves and economic growth, Udo
and Antai (2014), Isaac (2014), found a negative relationship between external reserve and
economic growth, etc. Majority of the reviewed studies felt the level of external reserves in a
country are influenced by external sector developments such as international trade transactions
and other related sectors, therefore do not consider domestic issues that could possibly

International Journal of Economics, Commerce and Management, United Kingdom
Licensed under Creative Common Page 219
influence the exchange rates and determine the position of international reserves. Though
Victoria and Ibrahim (2016), Alasan and Shaib (2011) and Udo and Antai (2014) covered some
of such domestic sectors but did not include agricultural output and market capitalization. This
study will concentrate on domestic factors that could influence the international reserves and fill
the existing gap in literature and for policy implementation.
METHODOLOGY
Research design
The study adopted an ex-post facto research design which is a form of descriptive research in
which investigator starts with the observation of the explained variable then studies the
explanatory variable in retrospect for possible relationship and effects on the dependent
variable.
Data collection method
This study collected data from secondary sources. Secondary data were collected from the
central bank of Nigeria and as well as journal publications with the scope of 1980 to 2016.
Model specification
In order to achieve the objectives of this work, a linear regression model was formulated and the
Granger causality tests were conducted on the formulated model. The model is stated as
follows:
ER = f(RGDP, MCAP, AGR) (l)
This equation can be transformed into a linear function thus:
ER = Ţ0 + Ţ1RGDP + Ţ2MCAP + Ţ3AGR + Œ (2)
where;
ER = External reserves
RGDP= Real gross domestic product
MCAP= Market capitalization
AGR= Agricultural output
Ţ0 = the constant
Ţ1- Ţ3 = the coefficients of the explanatory variables
Π= Error term

©Author(s)
Licensed under Creative Common Page 220
Estimation Methods
Different econometric analysis tools have been employed in this study to analyze the
relationship between external reserves and economic growth in Nigeria.
Descriptive statistic
The study employed descriptive statistics for the calculation of mean, median, mode,
frequencies, variances and standard deviations.
Linear regression
The linear regression is an econometric technique which correlates the changes in the variables
to other variables. Regression analysis is used to show the accuracy and appropriateness of
model and how much independent variable influence on the dependent variable in the current
study.
Correlation analysis
This shows the direction of the relation. The signs – or + will show whether the relationship is in
positive direction or in the negative direction.
Unit root test
This test is a pre test that shows the stationarity or otherwise of the variables specified and a
yardstick for chosen further investigation approaches. The essence is to determine the
nonstationary property of each variable. We must test each of the series in the levels. All
variables will be tested in levels using the Augmented Dickey-Fuller (ADF).
Co-integration
The co-integration test is conducted to look at the long run linear relationship using the
Johansen co-integrating model, and find out if there is a possibility of an existence of a co-
integrating relationship among the variables.
Error Correction Mechanism
The reason for error correction mechanism is to measure the speed of adjustment of the
dependent variables to the changes in the independent variables on the short run and to their
equilibrium levels. This study expects a negative coefficient as a sign, suggesting an automatic
adjustment mechanism and that the capital formation responds to deviations from equilibrium in
a balancing manner.

International Journal of Economics, Commerce and Management, United Kingdom
Licensed under Creative Common Page 221
ANALYSIS AND FINDINGS
Data presentation
It shows the variables used for this study on yearly basis from 1980 to 2016. ER represents
external reserves, RGDP represents real gross domestic product, MCAP represents market
capitalization and AGR represent agricultural output. Data is in the appendix.
Descriptive Statistics
Table 1. Descriptive Statistics
ER RGDP MCAP AGR
Mean 16422.08 30972.22 4007.191 5083.271
Median 7415.000 22332.87 285.8000 1341.040
Maximum 53599.00 69023.93 19077.40 21523.51
Minimum 933.0000 2244.410 4.460000 10.01000
Std. Dev. 17941.94 18537.92 6177.604 6675.873
Skewness 0.860951 0.813939 1.291866 1.135292
Kurtosis 2.131913 2.382087 3.111188 2.902714
Jarque-Bera 5.732723 4.674028 10.31072 7.962738
Probability 0.056906 0.096616 0.005768 0.018660
Sum 607617.0 1145972. 148266.1 188081.0
Sum Sq. Dev. 1.16E+10 1.24E+10 1.37E+09 1.60E+09
Observations 37 37 37 37
The descriptive statistics on table 1 shows that external reserve (ER) has a mean value of
16422.08, while the maximum and minimum values are 53599 and 933 respectively. Real
gross domestic product (RGDP) has a mean value of 30972.22, while the maximum and
minimum values are 69023.93 and 2244.41 respectively. Market capitalization (MCAP) has a
mean value of 4007.191, while the maximum and minimum values are 19077.40 and 4.46
respectively. Agriculturral output (AGR) has a mean value of 5083.271, while the maximum and
minimum values are 21523.51 and 10.01 respectively.
The Jarque-Bera statistic indicated that real gross domestic product (RGDP) and
external reserve are normally distributed with the p-value (RGDP = 0.10), (ER =0.06), while
market capitalization (MCAP = 0.01), and agricultural output (AGR = 0.02).

©Author(s)
Licensed under Creative Common Page 222
Correlation matrix
Table 2. Correlation Output
ER RGDP MCAP AGR
ER 1 0.8570 0.8522 0.8334
RGDP 0.8570 1 0.9385 0.9757
MCAP 0.8522 0.9385 1 0.9592
AGR 0.8334 0.9757 0.9592 1
The correlation matrix on table 2 shows the correlation among the variables. ER is shown to
have a strong positive correlation of 0.8570 with RGDP, strong positive correlation of 0.8522
with MCAP and strong positive correlation of 0.8334 with AGR. RGDP has a positive strong
correlation of 0.8570 with ER, a strong positive correlation of 0.9385 with MCAP and a strong
positive correlation of 0.9757 with AGR. MCAP has a strong positive correlation of 0.8522 with
ER, a strong positive correlation of 0.9385 with RGDP and a strong positive correlation of
0.9592 with AGR. AGR is shown to have a strong positive correlation of 0.8334 with ER, a
strong positive correlation of 0.9757 with RGDP and strong positive correlation of 0.9592 with
MCAP.
Augumented Dicky-Fuller Unit Root Test
Table 3. Augmented Dickey-Fuller Unit Root test results
Source: Extracted from Unit Root Test Result (Appendix )
The Augmented Dickey-Fuller Unit Root test result as summarized above shows that all the
variables are stationary at first difference.
Variable
ADF value
Critical Values
1% 5% 10%
Conclusion
ER -4.947583 -4.252879 -3.548490 -3.207094 Stationary @ 1st dif.
RGDP -9.091193 -4.243644 -3.544284 -3.204699 Stationary @ Ist dif.
MCAP -6.082384 -4.273277 -3.557759 -3.212361 Stationary @ 1st dif.
AGR -5.038311 -4.252879 -3.548490 -3.207094 Stationary @ 1st dif.

International Journal of Economics, Commerce and Management, United Kingdom
Licensed under Creative Common Page 223
Johansen Co-integration
Table 4. Johansen Co-integration test results
Date: 04/05/18 Time: 06:40
Sample (adjusted): 1982 2016
Included observations: 35 after adjustments
Trend assumption: Linear deterministic trend
Series: ER RGDP MCAP AGR
Lags interval (in first differences): 1 to 1
Unrestricted Cointegration Rank Test (Trace)
Hypothesized Trace 0.05
No. of CE(s) Eigenvalue Statistic Critical Value Prob.**
None * 0.709021 79.42583 47.85613 0.0000
At most 1 * 0.464511 36.21812 29.79707 0.0079
At most 2 0.329742 14.35800 15.49471 0.0736
At most 3 0.010085 0.354759 3.841466 0.5514
Trace test indicates 2 cointegrating eqn(s) at the 0.05 level
* denotes rejection of the hypothesis at the 0.05 level
**MacKinnon-Haug-Michelis (1999) p-values
Unrestricted Cointegration Rank Test (Maximum Eigenvalue)
Hypothesized Max-Eigen 0.05
No. of CE(s) Eigenvalue Statistic Critical Value Prob.**
None * 0.709021 43.20770 27.58434 0.0002
At most 1 * 0.464511 21.86013 21.13162 0.0395
At most 2 0.329742 14.00324 14.26460 0.0549
At most 3 0.010085 0.354759 3.841466 0.5514
Max-eigenvalue test indicates 2 cointegrating eqn(s) at the 0.05 level
* denotes rejection of the hypothesis at the 0.05 level
**MacKinnon-Haug-Michelis (1999) p-values
Unrestricted Cointegrating Coefficients (normalized by b'*S11*b=I):
ER RGDP MCAP AGR
1.00E-05 -4.06E-05 0.000711 -0.000651
-2.87E-05 -0.000234 -8.79E-05 0.000591
8.37E-05 -0.000312 -0.000234 0.001018
-0.000123 -7.83E-05 0.000336 0.000288

©Author(s)
Licensed under Creative Common Page 224
Unrestricted Adjustment Coefficients (alpha):
D(ER) -3204.038 512.8518 -292.4422 183.7083
D(RGDP) -72.57321 925.0771 2398.437 153.6530
D(MCAP) -1098.002 53.97382 168.9951 -107.5323
D(AGR) -37.34610 -331.4623 116.6216 14.81044
1 Cointegrating Equation(s): Log likelihood -1243.233
Normalized cointegrating coefficients (standard error in parentheses)
ER RGDP MCAP AGR
1.000000 -4.045516 70.91608 -64.92290
(4.67537) (8.93261) (16.1941)
Adjustment coefficients (standard error in parentheses)
D(ER) -0.032120
(0.00539)
D(RGDP) -0.000728
(0.00866)
D(MCAP) -0.011007
(0.00245)
D(AGR) -0.000374
(0.00102)
2 Cointegrating Equation(s): Log likelihood -1232.303
Normalized cointegrating coefficients (standard error in parentheses)
ER RGDP MCAP AGR
1.000000 0.000000 48.39451 -50.19621
(6.20547) (6.46929)
0.000000 1.000000 -5.567044 3.640251
(0.84763) (0.88367)
Adjustment coefficients (standard error in parentheses)
D(ER) -0.046860 0.009901
(0.01611) (0.12572)
D(RGDP) -0.027316 -0.213583
(0.02576) (0.20106)
D(MCAP) -0.012559 0.031897
(0.00744) (0.05804)
D(AGR) 0.009153 0.079098
(0.00247) (0.01924)
3 Cointegrating Equation(s): Log likelihood -1225.301

International Journal of Economics, Commerce and Management, United Kingdom
Licensed under Creative Common Page 225
Normalized cointegrating coefficients (standard error in parentheses)
ER RGDP MCAP AGR
1.000000 0.000000 0.000000 0.891619
(0.82515)
0.000000 1.000000 0.000000 -2.236618
(0.17247)
0.000000 0.000000 1.000000 -1.055653
(0.04506)
Adjustment coefficients (standard error in parentheses)
D(ER) -0.071330 0.101003 -2.254553
(0.04687) (0.20623) (0.39665)
D(RGDP) 0.173371 -0.960745 -0.693381
(0.06408) (0.28196) (0.54231)
D(MCAP) 0.001582 -0.020749 -0.824823
(0.02158) (0.09493) (0.18258)
D(AGR) 0.018911 0.042768 -0.024662
(0.00695) (0.03057) (0.05880)
Both trace test and Maximum Eigenvalue test indicated two co-integrating equation existing
between the dependent and independent variables. This reveals that there is a long-run
equilibrium relationship between the dependent and independent variables.
Regression estimation
Table 5. Regression output
Dependent Variable: D(ER)
Method: Least Squares
Date: 04/05/18 Time: 07:24 Sample (adjusted): 1981 2015
Included observations: 35 after adjustments
Variable Coefficient Std. Error t-Statistic Prob.
C 680.2572 922.7893 0.737175 0.4667
D(RGDP) 0.156780 0.135647 1.155793 0.0256
D(MCAP) 0.197894 0.367038 2.667160 0.0122
D(AGR) -0.379763 1.080158 -1.277371 0.2113
ECM(1) -0.312603 0.083084 -3.762476 0.0007
R-squared 0.480706 Mean dependent var 591.2857
Adjusted R-squared 0.411467 S.D. dependent var 5476.073
S.E. of regression 4201.020 Akaike info criterion 19.65561
Sum squared resid 5.29E+08 Schwarz criterion 19.87780
Log likelihood -338.9731 Hannan-Quinn criter. 19.73231
F-statistic 6.942683 Durbin-Watson stat 1.715805
Prob(F-statistic) 0.000442

©Author(s)
Licensed under Creative Common Page 226
The result above shows that, RGDP has a coefficient of 0.16 meaning that one percentage
change in real gross domestic product leads to 16 percent change in external reserves in the
positive direction in Nigeria. This indicates that there is a high response of external reserves to
changes in real gross domestic product in the positive direction, and this is statistically
significant at 5% level.
The result above shows that, MCAP has a coefficient of 0.20 meaning that one
percentage change in market capitalization leads to 20 percent change in external reserves in
the positive direction in Nigeria. This indicates that there is a high response of external reserves
to changes in market capitalization in the positive direction, and this is also statistically
significant at 5% level.
The result above shows that, AGR has a coefficient of 0.38 meaning that one percentage
change in agricultural output leads to 38 percent change in external reserves in the negative
direction in Nigeria. This indicates that there is a high response of external reserves to changes in
agricultural output in the negative direction, and this is statistically insignificant at 5% level.
The results further show that r-squared is 0.48 while adjusted r-squared is 0.41 indicating
that 41 percent of changes in external reserves is attributable to the combined effect of real gross
domestic product, market capitalization and agricultural output in Nigeria.
Overall, the results show that F-statistic is 6.942683 with a probability of 0.000442
indicating that the combined impact of the explanatory variables on the explained variable is
statistically significant.
Furthermore, Error Correction Co-efficient is appropriately signed with a value of -0.31
with a probability of 0.0007, which is significant at 5% level of significance. It indicates that the
model has a 31 percent speed of adjustment from equilibrium position on the long run.
Granger Causality Test
Table 6. Granger Causality test result
Null Hypothesis: Obs F-Statistic Prob.
RGDP does not Granger Cause ER 35 2.76450 0.0541
ER does not Granger Cause RGDP 1.57326 0.2240
MCAP does not Granger Cause ER 35 0.05573 0.0459
ER does not Granger Cause MCAP 4.30786 0.0227
AGR does not Granger Cause ER 35 1.96532 0.1577
ER does not Granger Cause AGR 2.16668 0.1322

International Journal of Economics, Commerce and Management, United Kingdom
Licensed under Creative Common Page 227
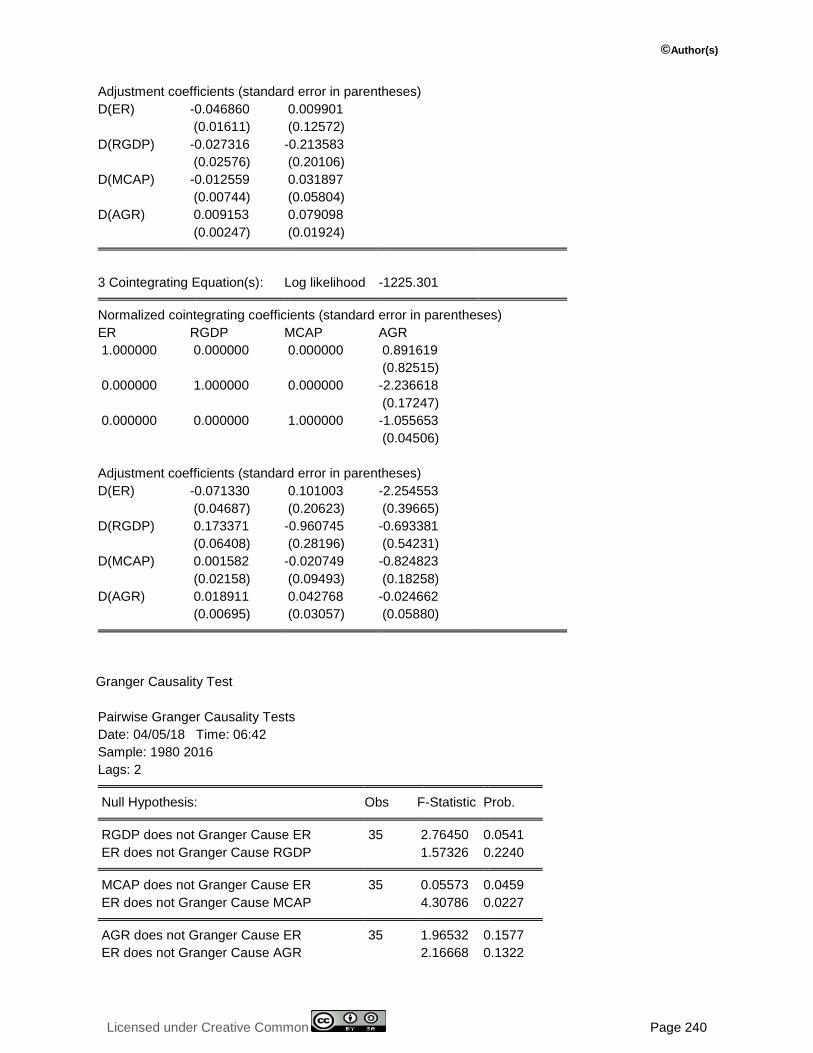
The result above indicated a unidirectional causation running from real gross domestic product
to Nigeria’s external reserves; also a bidirectional relationship running between market
capitalization and external reserves but indicated non causation between Agricultural output and
external reserves.
DISCUSSION AND SUMMARY OF RESULTS
The relationship between real gross domestic product and external reserve is found to be
positive; also the relationship between market capitalization and external reserve is found to be
positive while the relationship between agricultural output and external reserve is found to be
negative.
Generally, our model suggests a significant relationship between real gross domestic
product, market capitalization, agricultural output and external reserves using the f-statistics.
The coefficient of determination (R2) 41% Meaning 41% change in external reserves is
influenced by the predictor variables while the remaining 59% is explained by other variables
not captured in the model. The result also indicated a unidirectional causation running from real
gross domestic product to Nigeria’s external reserves; also a bidirectional relationship running
between market capitalization and external reserves but indicated non causation between
Agricultural output and external reserves.
The findings of this study concur with that of Kashif, Sridharan and Thiyagarajan (2017),
Awoderu, Ochalibe and Hephziba (2017), Kashif and Sridharan (2015), Lugman and Adeola
(2016), that real gross domestic product and international reserves are positive and significantly
related. It is also line with the findings of Emmanuel and Moses (2016) that international
reserves and stock market capitalization are positive and significantly related.
To summarized, the research work investigated the relationship between external
reserve and economic growth in Nigeria from 1980 to 2016. The following were the findings:
1. There is a positive and significant relationship between external reserve and real gross
domestic product in Nigeria.
2. There is a positive and significant relationship between external reserve and market
capitalization in Nigeria.
3. There is a negative and insignificant relationship between external reserve and agricultural
output in Nigeria.
CONCLUSION
Nigeria is currently facing economic challenges such as high unemployment rate, high inflation
rate, unstable exchange rate, etc. This has led to government initiative of different measures

©Author(s)
Licensed under Creative Common Page 228
with the purpose of solving these challenges. The rationales for holding external reserves are
enormous. These include: to maintain favorable exchange rate, to safeguard the value of the
domestic currency, timely meeting of international obligations, to boast the country’s credit
worthiness, to provide a fall back for the rainy days, to provide a buffer against external shocks,
etc. Anything that can contribute to external reserve improvement in this case should be
revealed and encouraged. This called for more empirical evidence in providing more
understanding of the pattern of economic growth in Nigeria. This motivates the study to examine
the relationship between external reserve and economic growth in Nigeria from 1980 to 2016.
The variables used in the study include real gross domestic product (RGDP), market
capitalization (MCAP) and agricultural output (AGR) as explanatory variables, while external
reserve (ER) was used as explained variable. The relationship between external reserve and
real gross domestic product is found to be positive and significant. It means if real gross
domestic product is increasing, external reserve will also increase. Also the relationship
between market capitalization and external reserve is found to be positive and significant.
Meaning if market capitalization improves, it will lead to increase in external reserve.
This empirical finding followed fairly close to what economic theory will have suggested.
Whenever domestic economic activities improve, it leads to more savings, investments,
employments and greater output which will in turn leads to more exports which lead to an
increase of international reserve. The results suggest that for a significant increase in external
reserve, the focus of policy and strategy should be on measures to increase real gross domestic
product and market capitalization.
RECOMMENDATIONS
Based on the findings of the study, we therefore recommend the following;
- There is need for government to restore investor confidence, so as to attain well
functioning capital market. Capital market cannot flourish without investors. This is
because capital markets thrive on investor interest in the investment opportunities that
the markets have to offer. Increase the depth, breadth and sophistication of the market.
Improve efficiency and competitiveness in all aspects of the market. Disclosure,
transparency and accountability in the capital market. These will boast the capital market
operations and will in turn aid improve the nation’s external reserves.
- Since real gross domestic products enhances and increase the level of external reserves
position of a country, government is therefore encouraged to implement policies that will
promote the level of real gross domestic product in Nigeria, so as to increase the level of
the nation’s external reserves.

International Journal of Economics, Commerce and Management, United Kingdom
Licensed under Creative Common Page 229
SUGGESTIONS FOR FURTHER STUDIES
The study looked at the relationship between external reserve and economic growth in Nigeria
from 1980 to 2016. The variables used in the study include real gross domestic product
(RGDP), market capitalization (MCAP) and agricultural output (AGR) as explanatory variables,
while external reserve (ER) was used as explained variable, using descriptive statistics and
normality test, regression analysis, ADF unit root tests, Johansen co-integration, error correction
model and causality test. Further studies could increase the time bound (scope) or employ other
economic growth indicators as dependent variables, or still, utilize other statistical techniques.
This will enable comparison and increase reliance on and robustness of the results of this study.
This will also confirm the validity of the findings of this study, since different methods, variables
and time horizons will be used. It will also widen the body of existing literature on the subject
matter. Also, further study should be conducted on the determinants of external reserves in
Nigeria.
REFERENCES
Akaninyene, U. A. (2016). Foreign reserves accumulation and macroeconomic environment: The Nigerian experience. International Journal of Economics and Finance Studies, 8(1), 26-47.
Akinwunmi, A. A. and Adekoya, R. B. (2016). External reserves management and its effect on economic growth of Nigeria. International Journal of Business and Financial Management Research, 4(1), 36-46.
Alasan, A. B. and Shaib, I. O. (2011). External reserves management and economic development in Nigeria. European Journal of Business and Management, 3(11), 1-9.
Awoderu, B. K., Ochalibe, A. I. and Hephziba, O. O. (2017). Policy implications of long run relationship between external reserves and economic growth in Nigeria. International Journal of academic research and reflection, 5(1), 82-95.
Borivoje, D. K. and Tina, M. (2015). Empirical analysis of the impact of foreign exchange reserves to economic growth in emerging economies. Applied Economics and Finance, 2(1), 102-109.
Emmanuel, J. A. A. and Moses, K. A. (2016). Foreign exchange reserves and its impact on stock market: Evidence from Ghana. Journal of Finance and Economics, 4(5), 136-141.
Evans, S. C. O. and Egwakhe, A. J. (2008). External reserves and the Nigerian economy: The dual folded debate. African Journal of Business and Economic Research, 3(2) 28-41.
Francia and ThankGod (2016). External reserve management and economic growth in Nigeria. International Journal of Empirical Finance, Research Academy of Social Sciences, 5(2), 101-111.
Fukuda, S. and Kon, Y. (2007). Macroeconomic Impacts of Foreign Exchange Reserve Accumulation: A Theory and Some International Evidence. A paper prepared as a background paper for ACE International Conference, Faculty of Economics, University of Tokyo, p. 70.
IMF, (2000). Debt-and Reserves-Related Indicators of External Vulnerability, a paper prepared by the Policy Development and Review Department in Consultation with other Departments, IMF, 33-35.
Isaac, B. E. (2014). International reserves accumulation and economic growth in the West African Monetary Zone. International Research Journal of Marketing and Economics, 1(9), 31-56.
Jhingan, M. L. (2005). The economics of development and planning (38th ed.). Delhi, India: Vrinda Publications.
Kashif, M. (2016). Linear and nonlinear relationship between international reserves and economic growth: Evidence from Algeria. International Journal of Marketing and Financial Management, 4(9) 44-52.

©Author(s)
Licensed under Creative Common Page 230
Kashif, M. and Sridharan, P. (2015). International reserves accumulation and economic growth: Evidence from India. International Journal of Engineering and Management Research, 5(2), 583-589.
Kashif, M. Sridharan, P. and Thiyagarajan, S. (2016). An empirical analysis of China’s international reserves demand function. Management Studies and Economic Systems, 3(1), 1-10.
Kashif, M., Sridharan, P. and Thiyagarajan, S. (2017). Impact of economic growth on international reserve holding in Brazil. Brazilian Journal of Political Economy, 37(3), 605-614.
Lugman, A. S. and Adeola, O. A. (2016). Effects of external reserves and balance of payment changes on economic growth in Nigeria. The Journal of Economics and Social studies, 150-160.
Ngozi, E. N., Abdulkadir, I. A., Ismaila, S. A., Mohammed, A. S., Solomon, S. Z., Bola, S. F. and Michael, J. A. (2016). Exchange rate and external reserves in Nigeria: A threshold co-integration analysis. CBN Journal of Applied Statistics, 7(1), 233-254.
Nneka, B. (2012). External Reserves: Causality Effect Of Macro Economic Variables In Nigeria: Department of Banking and Finance, Imo State Polytechnic, Umuagwo, 19-21.
Nzotta, S. M. (2014). Money, banking and finance (2nded.). Owerri, Nigeria: Osprey Publishers.
Osuji, C. C. and Ebiringa, O. T. (2012). Analysis of effect of external reserves management on macroeconomic stability in Nigeria. International Journal of business management and economic research, 3(6), 646-654.
Saheed, Z. S., Sani, I. E. and Idakwoji, B. O. (2015). Impact of public external debt on exchange rate in Nigeria. European Journal of Business and Management, 7(21), 51-57.
Sarbapriya, R. (2012). Foreign exchange reserve and its impact on stock market capitalization: Evidence from India. Research on Humanities and Social Sciences, 2(2), 46-60.
Udo, A. B. and Antai, A. S. (2014). Opportunity cost of Nigeria’s external reserves. IOSR Journal of economics and Finance, 3(5), 7-16.
Umeoru, C. E. (2013). Accumulation of external reserves and effects on exchange rate and inflation rates in Nigeria. International Business and Management, 6(2), 105-114.
Usman, A. and Ibrahim, W. (2010). Exchange reserves holding in Nigeria: implications for investment, inflation and exchange rate. Journal of Economics and International Finance, 2(9), 183-189.
Victoria, S., Emmanuel, O., Obinna, U., Esther, S. and Akinde, O. (2016). Public debt and external reserve: The Nigeria experience. Economics Research International, 1-7.
Williams, A. (2016). Corruption and the Nigerian external reserves management. International Journal of Economics and Management Sciences, 5(6), 1-5.
APPENDIX
ADF @ level AGR
Null Hypothesis: AGR has a unit root Exogenous: Constant, Linear Trend Lag Length: 0 (Automatic - based on SIC, maxlag=9) t-Statistic Prob.* Augmented Dickey-Fuller test statistic 1.085041 0.9999
Test critical values: 1% level -4.234972 5% level -3.540328 10% level -3.202445 *MacKinnon (1996) one-sided p-values. Augmented Dickey-Fuller Test Equation Dependent Variable: D(AGR) Method: Least Squares

International Journal of Economics, Commerce and Management, United Kingdom
Licensed under Creative Common Page 231
Date: 04/05/18 Time: 06:16 Sample (adjusted): 1981 2016 Included observations: 36 after adjustments Variable Coefficient Std. Error t-Statistic Prob. AGR(-1) 0.028211 0.026000 1.085041 0.2858 C -266.5455 199.5415 -1.335789 0.1908 @TREND(1980) 39.65515 15.19349 2.610010 0.0135 R-squared 0.631483 Mean dependent var 597.5972 Adjusted R-squared 0.609149 S.D. dependent var 725.2286 S.E. of regression 453.3989 Akaike info criterion 15.15108 Sum squared resid 6783829. Schwarz criterion 15.28304 Log likelihood -269.7194 Hannan-Quinn criter. 15.19713 F-statistic 28.27411 Durbin-Watson stat 1.964131 Prob(F-statistic) 0.000000
ADF @ 1st Dif. AGR
Null Hypothesis: D(AGR) has a unit root
Exogenous: Constant, Linear Trend
Lag Length: 1 (Automatic - based on SIC, maxlag=9)
t-Statistic Prob.*
Augmented Dickey-Fuller test statistic -5.038311 0.0014
Test critical values: 1% level -4.252879
5% level -3.548490
10% level -3.207094
*MacKinnon (1996) one-sided p-values.
Augmented Dickey-Fuller Test Equation
Dependent Variable: D(AGR,2)
Method: Least Squares
Date: 04/05/18 Time: 06:19
Sample (adjusted): 1983 2016
Included observations: 34 after adjustments
Variable Coefficient Std. Error t-Statistic Prob.
D(AGR(-1)) -1.213163 0.240788 -5.038311 0.0000
D(AGR(-1),2) 0.270638 0.174324 1.552499 0.1310
C -594.4383 208.5782 -2.849954 0.0078
@TREND(1980) 68.56779 15.02507 4.563560 0.0001
R-squared 0.519221 Mean dependent var 55.39618
Adjusted R-squared 0.471143 S.D. dependent var 627.1467
S.E. of regression 456.0773 Akaike info criterion 15.19333

©Author(s)
Licensed under Creative Common Page 232
Sum squared resid 6240194. Schwarz criterion 15.37290
Log likelihood -254.2867 Hannan-Quinn criter. 15.25457
F-statistic 10.79956 Durbin-Watson stat 1.944209
Prob(F-statistic) 0.000056
ADF @ level MCAP
Null Hypothesis: MCAP has a unit root
Exogenous: Constant, Linear Trend
Lag Length: 9 (Automatic - based on SIC, maxlag=9)
t-Statistic Prob.*
Augmented Dickey-Fuller test statistic 3.511460 1.0000
Test critical values: 1% level -4.339330
5% level -3.587527
10% level -3.229230
*MacKinnon (1996) one-sided p-values.
Augmented Dickey-Fuller Test Equation
Dependent Variable: D(MCAP)
Method: Least Squares
Date: 04/05/18 Time: 06:21
Sample (adjusted): 1990 2016
Included observations: 27 after adjustments
Variable Coefficient Std. Error t-Statistic Prob.
MCAP(-1) 19.28411 5.491765 3.511460 0.0031
D(MCAP(-1)) -19.81728 5.565255 -3.560893 0.0028
D(MCAP(-2)) -19.99493 5.512240 -3.627369 0.0025
D(MCAP(-3)) -19.73936 5.567719 -3.545322 0.0029
D(MCAP(-4)) -20.54325 5.668627 -3.624027 0.0025
D(MCAP(-5)) -19.38075 5.530238 -3.504506 0.0032
D(MCAP(-6)) -19.86154 5.690953 -3.490020 0.0033
D(MCAP(-7)) -21.48414 6.150457 -3.493096 0.0033
D(MCAP(-8)) -23.22723 6.622667 -3.507232 0.0032
D(MCAP(-9)) -33.27406 9.392125 -3.542761 0.0030
C -1278.317 1589.228 -0.804363 0.4338
@TREND(1980) 88.17056 91.04012 0.968480 0.3482
R-squared 0.747183 Mean dependent var 598.9963
Adjusted R-squared 0.561783 S.D. dependent var 2319.621
S.E. of regression 1535.541 Akaike info criterion 17.81226
Sum squared resid 35368314 Schwarz criterion 18.38818
Log likelihood -228.4655 Hannan-Quinn criter. 17.98351
F-statistic 4.030126 Durbin-Watson stat 2.884344
Prob(F-statistic) 0.007017

International Journal of Economics, Commerce and Management, United Kingdom
Licensed under Creative Common Page 233
ADF @ 1st dif. MCAP
Null Hypothesis: D(MCAP) has a unit root
Exogenous: Constant, Linear Trend
Lag Length: 3 (Automatic - based on SIC, maxlag=9)
t-Statistic Prob.*
Augmented Dickey-Fuller test statistic -6.082384 0.0001
Test critical values: 1% level -4.273277
5% level -3.557759
10% level -3.212361
*MacKinnon (1996) one-sided p-values.
Augmented Dickey-Fuller Test Equation
Dependent Variable: D(MCAP,2)
Method: Least Squares
Date: 04/05/18
Time: 06:22
Sample (adjusted): 1985 2016
Included observations: 32 after adjustments
Variable Coefficient Std. Error t-Statistic Prob.
D(MCAP(-1)) -2.735086 0.449673 -6.082384 0.0000
D(MCAP(-1),2) 1.540179 0.372051 4.139697 0.0003
D(MCAP(-2),2) 0.931999 0.269077 3.463683 0.0019
D(MCAP(-3),2) 0.710104 0.177140 4.008712 0.0005
C -1710.454 810.9470 -2.109206 0.0447
@TREND(1980) 151.2604 43.49209 3.477883 0.0018
R-squared 0.744113 Mean dependent var -25.54688
Adjusted R-squared 0.694904 S.D. dependent var 3064.651
S.E. of regression 1692.775 Akaike info criterion 17.87349
Sum squared resid 74502629 Schwarz criterion 18.14831
Log likelihood -279.9758 Hannan-Quinn criter. 17.96458
F-statistic 15.12149 Durbin-Watson stat 1.957386
Prob(F-statistic) 0.000001
ADF @ level RGDP
Null Hypothesis: RGDP has a unit root
Exogenous: Constant, Linear Trend
Lag Length: 0 (Automatic - based on SIC, maxlag=9)

©Author(s)
Licensed under Creative Common Page 234
t-Statistic Prob.*
Augmented Dickey-Fuller test statistic -2.450226 0.3493
Test critical values: 1% level -4.234972
5% level -3.540328
10% level -3.202445
*MacKinnon (1996) one-sided p-values.
Augmented Dickey-Fuller Test Equation
Dependent Variable: D(RGDP)
Method: Least Squares
Date: 04/05/18 Time: 06:23
Sample (adjusted): 1981 2016
Included observations: 36 after adjustments
Variable Coefficient Std. Error t-Statistic Prob.
RGDP(-1) -0.234083 0.095535 -2.450226 0.0197
C -615.7132 1703.481 -0.361444 0.7201
@TREND(1980) 479.7629 160.5185 2.988832 0.0053
R-squared 0.214748 Mean dependent var 1250.146
Adjusted R-squared 0.167157 S.D. dependent var 5410.057
S.E. of regression 4937.231 Akaike info criterion 19.92665
Sum squared resid 8.04E+08 Schwarz criterion 20.05861
Log likelihood -355.6797 Hannan-Quinn criter. 19.97271
F-statistic 4.512354 Durbin-Watson stat 2.556823
Prob(F-statistic) 0.018520
ADF @ 1st dif. RGDP
Null Hypothesis: D(RGDP) has a unit root
Exogenous: Constant, Linear Trend
Lag Length: 0 (Automatic - based on SIC, maxlag=9)
t-Statistic Prob.*
Augmented Dickey-Fuller test statistic -9.091193 0.0000
Test critical values: 1% level -4.243644
5% level -3.544284
10% level -3.204699
*MacKinnon (1996) one-sided p-values.

International Journal of Economics, Commerce and Management, United Kingdom
Licensed under Creative Common Page 235
Augmented Dickey-Fuller Test Equation
Dependent Variable: D(RGDP,2)
Method: Least Squares
Date: 04/05/18 Time: 06:24
Sample (adjusted): 1982 2016
Included observations: 35 after adjustments
Variable Coefficient Std. Error t-Statistic Prob.
D(RGDP(-1)) -1.429716 0.157264 -9.091193 0.0000
C -1241.203 1744.881 -0.711340 0.4820
@TREND(1980) 174.3224 84.00991 2.075022 0.0461
R-squared 0.722108 Mean dependent var 187.8660
Adjusted R-squared 0.704740 S.D. dependent var 8804.618
S.E. of regression 4784.242 Akaike info criterion 19.86586
Sum squared resid 7.32E+08 Schwarz criterion 19.99917
Log likelihood -344.6525 Hannan-Quinn criter. 19.91188
F-statistic 41.57630 Durbin-Watson stat 2.157683
Prob(F-statistic) 0.000000
ADF @ level ER
Null Hypothesis: ER has a unit root
Exogenous: Constant, Linear Trend
Lag Length: 2 (Automatic - based on SIC, maxlag=9)
t-Statistic Prob.*
Augmented Dickey-Fuller test statistic -2.028077 0.5656
Test critical values: 1% level -4.252879
5% level -3.548490
10% level -3.207094
*MacKinnon (1996) one-sided p-values.
Augmented Dickey-Fuller Test Equation
Dependent Variable: D(ER)
Method: Least Squares
Date: 04/05/18 Time: 06:25
Sample (adjusted): 1983 2016
Included observations: 34 after adjustments
Variable Coefficient Std. Error t-Statistic Prob.
ER(-1) -0.151417 0.074660 -2.028077 0.0518
D(ER(-1)) 0.844129 0.144910 5.825210 0.0000
D(ER(-2)) -0.439683 0.158837 -2.768134 0.0097

©Author(s)
Licensed under Creative Common Page 236
C -1916.339 1754.591 -1.092186 0.2837
@TREND(1980) 252.4140 129.9309 1.942679 0.0618
R-squared 0.570682 Mean dependent var 826.5882
Adjusted R-squared 0.511465 S.D. dependent var 5403.072
S.E. of regression 3776.490 Akaike info criterion 19.44603
Sum squared resid 4.14E+08 Schwarz criterion 19.67050
Log likelihood -325.5825 Hannan-Quinn criter. 19.52258
F-statistic 9.637239 Durbin-Watson stat 1.804812
Prob(F-statistic) 0.000044
ADF @ 1st dif. ER
Null Hypothesis: D(ER) has a unit root
Exogenous: Constant, Linear Trend
Lag Length: 1 (Automatic - based on SIC, maxlag=9)
t-Statistic Prob.*
Augmented Dickey-Fuller test statistic -4.947583 0.0017
Test critical values: 1% level -4.252879
5% level -3.548490
10% level -3.207094
*MacKinnon (1996) one-sided p-values.
Augmented Dickey-Fuller Test Equation
Dependent Variable: D(ER,2)
Method: Least Squares
Date: 04/05/18 Time: 06:26
Sample (adjusted): 1983 2016
Included observations: 34 after adjustments
Variable Coefficient Std. Error t-Statistic Prob.
D(ER(-1)) -0.722023 0.145934 -4.947583 0.0000
D(ER(-1),2) 0.563949 0.153959 3.662978 0.0010
C 77.04608 1526.998 0.050456 0.9601
@TREND(1980) 26.78529 70.51515 0.379852 0.7067
R-squared 0.470963 Mean dependent var 27.58824
Adjusted R-squared 0.418059 S.D. dependent var 5201.015
S.E. of regression 3967.598 Akaike info criterion 19.51984
Sum squared resid 4.72E+08 Schwarz criterion 19.69941
Log likelihood -327.8373 Hannan-Quinn criter. 19.58108
F-statistic 8.902257 Durbin-Watson stat 1.816169
Prob(F-statistic) 0.000226
International Journal of Economics, Commerce and Management, United Kingdom
Licensed under Creative Common Page 237
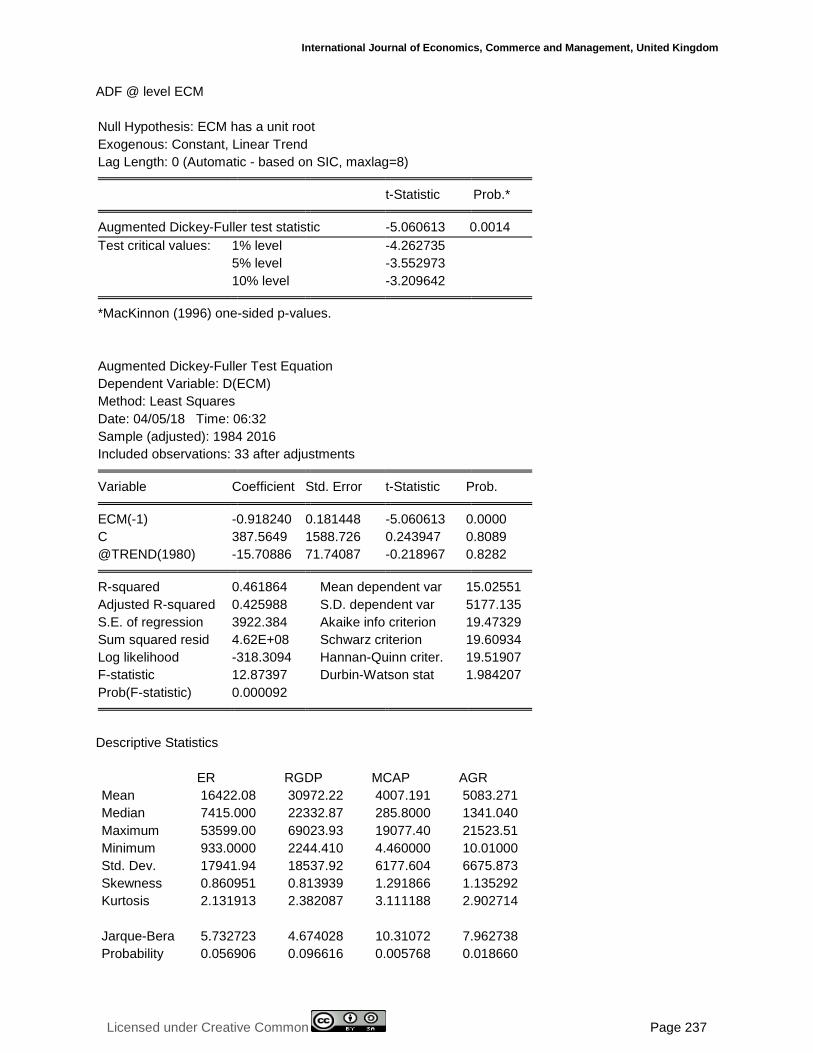
ADF @ level ECM
Null Hypothesis: ECM has a unit root
Exogenous: Constant, Linear Trend
Lag Length: 0 (Automatic - based on SIC, maxlag=8)
t-Statistic Prob.*
Augmented Dickey-Fuller test statistic -5.060613 0.0014
Test critical values: 1% level -4.262735
5% level -3.552973
10% level -3.209642
*MacKinnon (1996) one-sided p-values.
Augmented Dickey-Fuller Test Equation
Dependent Variable: D(ECM)
Method: Least Squares
Date: 04/05/18 Time: 06:32
Sample (adjusted): 1984 2016
Included observations: 33 after adjustments
Variable Coefficient Std. Error t-Statistic Prob.
ECM(-1) -0.918240 0.181448 -5.060613 0.0000
C 387.5649 1588.726 0.243947 0.8089
@TREND(1980) -15.70886 71.74087 -0.218967 0.8282
R-squared 0.461864 Mean dependent var 15.02551
Adjusted R-squared 0.425988 S.D. dependent var 5177.135
S.E. of regression 3922.384 Akaike info criterion 19.47329
Sum squared resid 4.62E+08 Schwarz criterion 19.60934
Log likelihood -318.3094 Hannan-Quinn criter. 19.51907
F-statistic 12.87397 Durbin-Watson stat 1.984207
Prob(F-statistic) 0.000092
Descriptive Statistics
ER RGDP MCAP AGR
Mean 16422.08 30972.22 4007.191 5083.271
Median 7415.000 22332.87 285.8000 1341.040
Maximum 53599.00 69023.93 19077.40 21523.51
Minimum 933.0000 2244.410 4.460000 10.01000
Std. Dev. 17941.94 18537.92 6177.604 6675.873
Skewness 0.860951 0.813939 1.291866 1.135292
Kurtosis 2.131913 2.382087 3.111188 2.902714
Jarque-Bera 5.732723 4.674028 10.31072 7.962738
Probability 0.056906 0.096616 0.005768 0.018660
©Author(s)
Licensed under Creative Common Page 238
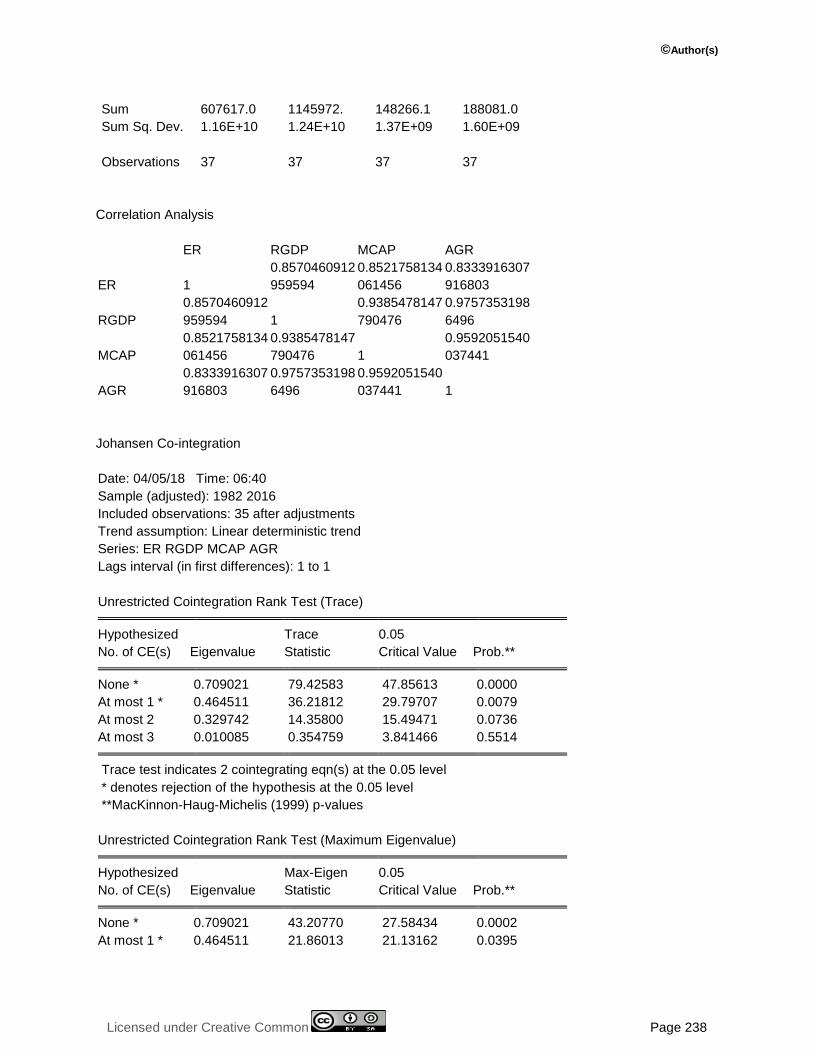
Sum 607617.0 1145972. 148266.1 188081.0
Sum Sq. Dev. 1.16E+10 1.24E+10 1.37E+09 1.60E+09
Observations 37 37 37 37
Correlation Analysis
ER RGDP MCAP AGR
ER 1
0.8570460912
959594
0.8521758134
061456
0.8333916307
916803
RGDP
0.8570460912
959594 1
0.9385478147
790476
0.9757353198
6496
MCAP
0.8521758134
061456
0.9385478147
790476 1
0.9592051540
037441
AGR
0.8333916307
916803
0.9757353198
6496
0.9592051540
037441 1
Johansen Co-integration
Date: 04/05/18 Time: 06:40
Sample (adjusted): 1982 2016
Included observations: 35 after adjustments
Trend assumption: Linear deterministic trend
Series: ER RGDP MCAP AGR
Lags interval (in first differences): 1 to 1
Unrestricted Cointegration Rank Test (Trace)
Hypothesized Trace 0.05
No. of CE(s) Eigenvalue Statistic Critical Value Prob.**
None * 0.709021 79.42583 47.85613 0.0000
At most 1 * 0.464511 36.21812 29.79707 0.0079
At most 2 0.329742 14.35800 15.49471 0.0736
At most 3 0.010085 0.354759 3.841466 0.5514
Trace test indicates 2 cointegrating eqn(s) at the 0.05 level
* denotes rejection of the hypothesis at the 0.05 level
**MacKinnon-Haug-Michelis (1999) p-values
Unrestricted Cointegration Rank Test (Maximum Eigenvalue)
Hypothesized Max-Eigen 0.05
No. of CE(s) Eigenvalue Statistic Critical Value Prob.**
None * 0.709021 43.20770 27.58434 0.0002
At most 1 * 0.464511 21.86013 21.13162 0.0395

International Journal of Economics, Commerce and Management, United Kingdom
Licensed under Creative Common Page 239
At most 2 0.329742 14.00324 14.26460 0.0549
At most 3 0.010085 0.354759 3.841466 0.5514
Max-eigenvalue test indicates 2 cointegrating eqn(s) at the 0.05 level
* denotes rejection of the hypothesis at the 0.05 level
**MacKinnon-Haug-Michelis (1999) p-values
Unrestricted Cointegrating Coefficients (normalized by b'*S11*b=I):
ER RGDP MCAP AGR
1.00E-05 -4.06E-05 0.000711 -0.000651
-2.87E-05 -0.000234 -8.79E-05 0.000591
8.37E-05 -0.000312 -0.000234 0.001018
-0.000123 -7.83E-05 0.000336 0.000288
Unrestricted Adjustment Coefficients (alpha):
D(ER) -3204.038 512.8518 -292.4422 183.7083
D(RGDP) -72.57321 925.0771 2398.437 153.6530
D(MCAP) -1098.002 53.97382 168.9951 -107.5323
D(AGR) -37.34610 -331.4623 116.6216 14.81044
1 Cointegrating Equation(s): Log likelihood -1243.233
Normalized cointegrating coefficients (standard error in parentheses)
ER RGDP MCAP AGR
1.000000 -4.045516 70.91608 -64.92290
(4.67537) (8.93261) (16.1941)
Adjustment coefficients (standard error in parentheses)
D(ER) -0.032120
(0.00539)
D(RGDP) -0.000728
(0.00866)
D(MCAP) -0.011007
(0.00245)
D(AGR) -0.000374
(0.00102)
2 Cointegrating Equation(s): Log likelihood -1232.303
Normalized cointegrating coefficients (standard error in parentheses)
ER RGDP MCAP AGR
1.000000 0.000000 48.39451 -50.19621
(6.20547) (6.46929)
0.000000 1.000000 -5.567044 3.640251
(0.84763) (0.88367)
©Author(s)
Licensed under Creative Common Page 240
Adjustment coefficients (standard error in parentheses)
D(ER) -0.046860 0.009901
(0.01611) (0.12572)
D(RGDP) -0.027316 -0.213583
(0.02576) (0.20106)
D(MCAP) -0.012559 0.031897
(0.00744) (0.05804)
D(AGR) 0.009153 0.079098
(0.00247) (0.01924)
3 Cointegrating Equation(s): Log likelihood -1225.301
Normalized cointegrating coefficients (standard error in parentheses)
ER RGDP MCAP AGR
1.000000 0.000000 0.000000 0.891619
(0.82515)
0.000000 1.000000 0.000000 -2.236618
(0.17247)
0.000000 0.000000 1.000000 -1.055653
(0.04506)
Adjustment coefficients (standard error in parentheses)
D(ER) -0.071330 0.101003 -2.254553
(0.04687) (0.20623) (0.39665)
D(RGDP) 0.173371 -0.960745 -0.693381
(0.06408) (0.28196) (0.54231)
D(MCAP) 0.001582 -0.020749 -0.824823
(0.02158) (0.09493) (0.18258)
D(AGR) 0.018911 0.042768 -0.024662
(0.00695) (0.03057) (0.05880)
Granger Causality Test
Pairwise Granger Causality Tests
Date: 04/05/18 Time: 06:42
Sample: 1980 2016
Lags: 2
Null Hypothesis: Obs F-Statistic Prob.
RGDP does not Granger Cause ER 35 2.76450 0.0541
ER does not Granger Cause RGDP 1.57326 0.2240
MCAP does not Granger Cause ER 35 0.05573 0.0459
ER does not Granger Cause MCAP 4.30786 0.0227
AGR does not Granger Cause ER 35 1.96532 0.1577
ER does not Granger Cause AGR 2.16668 0.1322

International Journal of Economics, Commerce and Management, United Kingdom
Licensed under Creative Common Page 241
MCAP does not Granger Cause RGDP 35 0.32749 0.7233
RGDP does not Granger Cause MCAP 8.72278 0.0010
AGR does not Granger Cause RGDP 35 4.73080 0.0164
RGDP does not Granger Cause AGR 1.87604 0.1707
AGR does not Granger Cause MCAP 35 11.9086 0.0002
MCAP does not Granger Cause AGR 0.04011 0.9607
Regression Estimation 1
Dependent Variable: D(ER)
Method: Least Squares
Date: 04/05/18 Time: 07:24
Sample (adjusted): 1981 2015
Included observations: 35 after adjustments
Variable Coefficient Std. Error t-Statistic Prob.
C 680.2572 922.7893 0.737175 0.4667
D(RGDP) 0.156780 0.135647 1.155793 0.0256
D(MCAP) 0.197894 0.367038 2.667160 0.0122
D(AGR) -0.379763 1.080158 -1.277371 0.2113
ECM(1) -0.312603 0.083084 -3.762476 0.0007
R-squared 0.480706 Mean dependent var 591.2857
Adjusted R-squared 0.411467 S.D. dependent var 5476.073
S.E. of regression 4201.020 Akaike info criterion 19.65561
Sum squared resid 5.29E+08 Schwarz criterion 19.87780
Log likelihood -338.9731 Hannan-Quinn criter. 19.73231
F-statistic 6.942683 Durbin-Watson stat 1.715805
Prob(F-statistic) 0.000442