the relationship between emission intensity and firm growth. micro
TRANSCRIPT

1
The relationship between emission intensity and firm growth. Micro-evidence from Italy
Giulio Cainelli(a), Massimiliano Mazzanti(b) and Roberto Zoboli(c)
(a) University of Bari and CERIS-CNR, Milan (b) University of Ferrara and CERIS-CNR, Milan ([email protected])
(c) Catholic University of Milan and CERIS-CNR, Milan
Abstract
This paper investigates the empirical link between emission intensity and economic growth, using a very large data set of thousands of Italian manufacturing firms over 2000-2004. As a measure of lagged environmental performance (efficiency) at firm level we exploit NAMEA sector for CO2, NOx, SOx data over 1990-1999. The paper tests the extent to which (past) environmental efficiency/intensity, which is driven by structural features and firm strategic actions, including responses to policies, influences firms growth. Our results show, first, a typical trade off generally appearing for the three core environmental emissions we analyse: lower environmentally efficiency in the recent past allows higher degrees of freedom to firms and relax the constraints for growth, at least in this short/medium term scenario. Nevertheless, the size of the estimated coefficients is not large:. Trade off are significant for two emission indicators out of two, but quite negligible in terms of impacts, besides the case of CO2. For example, growth is reduced by far less than 0.1% in association to a 1% increase of environmental efficiency. Environmental efficiency does not seem a primary cost factor and constraint to growth if compared to other factors affecting firm targets and firm competitiveness. In addition, non linearity seems to characterise the economic growth- environmental performance relationship. Signals of inverted U shape appears: this may be a signal that both firm strategies and recent policy efforts are affecting the dynamic relationship between environmental efficiency and economic productivity, turning it from an usual trade off to a possible joint complementary/co-dynamics, where bad environmental performances hamper firm growth and investments in greener technologies may be associated to positive economic performances of firms and sectors . JEL: C23, D21, O32, Q55 Keywords: firm growth, manufacturing, emission intensity, economic performance, environmental performance
This Version: August 31th, 2008

2
1. Introduction
Over the last few years, the relationship between environmental performance (emission intensity, environmental
efficiency, eco-strategies, etc.) and economic performance has received increased attention, also thanks to its role
within the ‘Lisbon Objectives’ on growth and innovation and the ‘Gothenburg priorities’ on sustainable
development.
Within this debate, manufacturing has received much attention, given its relatively high impacts on the
environment, and higher innovation potential. The research directions of higher added value are currently three:
(i) the effects of environmental performances and innovations on economic performances, given the relatively
wider space the drivers of environmental innovations have occupied (Mazzanti and Zoboli, 2008a,b); (ii) an
increasing attention to the dynamics of relationships in the short run and medium/long run; (iii), extending at
micro and meso levels the analyses from manufacturing to other industries, as recently proposed by Cainelli et al.
(2007) and Mazzanti and Zoboli (2009).
This paper aims at providing a contribution on points (i) and (ii) above. It focuses on manufacturing industry;
nevertheless, it uses a very large data set, compared to predominant survey-based analyses relying on often small
scale samples. It does not suffer from cross-sectional biases, often plaguing ad hoc survey data which rarely
escape the ‘cross section trap’, if not by repeated surveys over time, since it models a dynamic relationship
between emission intensity1 and firm-level economic growth, in others words environmental and economic
performances at the firm level.
More specifically, this paper investigates the empirical link between firms economic growth and emission
intensity, using a very large data set of more than 60,000 Italian manufacturing firms. Economic data refer to the
period 2000-2004. In order to circumvent the unavailability of data on environmental performance indicators at
this level of microeconomic detail, we use as a measure of environmental efficiency by exploiting sector based
NAMEA data. The Italian NAMEA provides detailed data at two digit level on main emissions, value added and
employees over 1990-2003. Taking data for the period 1990-1999 in order to impose a lag structure to the
modelled relationship, we reconstruct emission per employees ratios at firm level by using sector coefficients of
emission/employees, as a pragmatic and only available proxy of environmental efficiency from official data at
frim level..
Using this approach, the paper specifically tests the extent to which (past) environmental efficiency/intensity,
which is driven by structural features and firm strategic actions, including eventual responses to policies,
influences firms economic growth in a short-medium term scenario if we consider the lag we are able to
structure between environmental and economic performances.
The paper is organised as follows. Section 2 presents a short summary of the literature that aims at synthesising
the state of the art of various research directions focusing on environmental innovation, environmental
performances and economic performances at firm level. Section 3 is first addressed to the definition of the
conceptual framework on which research hypotheses are based, and then consequently discusses data sources,
1 ‘Emission intensity’, namely emissions per unit of labour, is the proxy for ‘environmental efficiency’ we here exploit. Further analyses may be carried out by using alternatively ‘emissions per unit of value added’. This is actually the inverse of ‘environmental efficiency’ as a ratio, but we follow this standard form, widely used in NAMEA analyses (Femia and Panfili, 2005).

3
the empirical model and the econometric methodology. Section 4 presents and comments on empirical
outcomes. Section 5 concludes and suggests lines of future research.
2. Related literature
A first main stream of research deals with the drivers of eco-innovation strategies. The seminal work by Jaffe and Palmer
(1997), which studies environmental innovation (R&D and patents) at industry level, was followed by
Brunnermeier and Cohen (2003), which employs panel data on manufacturing industries to provide new
evidence on the determinants of environmental innovation, measured by number of patents. The European
setting has recently been the source of some interesting evidence: Rennings et al., (2003) exploit OECD survey
data in order to investigate whether environmental auditing schemes and pollution abatement innovation are
correlated, similarly to the more recent work by Arimura et al. (2008) on Japan. Mazzanti and Zoboli (2005,
2008a,b) present evidence for the manufacturing sector at a district level, focussing on an extended set of drivers
(environmental R&D, policy induced costs, EMS, industrial relations, other innovations). Frondel et al., (2004)
use an OECD survey dataset on manufacturing firms and study internal firm-based strategies, external policy
variables, and test drivers for end-of-pipe measures or integrated cleaner production processes. For a recent
comprehensive analysis of all works on innovation drivers we refer to Johnstone (2007).
A second stream of research is focussed on environmental innovation and (its) employment effects. The main contributions in this
stream include Rennings and Zwick (2001), Rennings et al. (2001), Pfeiffer and Rennings (1999). What is relevant
to our study is the main hypothesis that increasing environmental efficiency by environmental innovations
strengthens competitiveness and the firm performance, with or without policy stimulus. An ancillary hypothesis
is that eco-efficiency investments require higher amounts of labour. The reasoning is that, on the one hand,
product innovation spurs employment since it creates new demand, while, on the other hand, process
innovations decrease employment since they are usually labour saving. Some employment compensation may
occur as a result of indirect price/market driven effects. It should be noted that this is a two stage process in
which first the firm decides whether or not to invest in innovation, and second optimizes the volume of labour
following the innovation process.
Rennings and Zwick (2001) is based on a sample of eco-innovative firms for five EU countries, in the
manufacturing and service sectors. This is a rather unique study which provides evidence related to the
manufacturing sector but also includes some evidence concerning eco-innovations in the service sector. They
find that in most firms employment does not change as a consequence of innovation, but this may be due to the
limited period covered by the survey. Econometric results show that, apart from some effects registered for
product innovations, eco-innovation typologies do not influence the level of employment, though as expected
(Caroli and van Reenen, 2001), according to their evidence environmentally oriented innovations seem to lead to
a skills bias effect. Also, end of pipe innovations are related to a higher probability of job losses, while
innovations in recycling have a positive effect on employment.
Employment effects may be thus be unevenly distributed, with strong negative effects from environmental
strategies/policies on low skills intensive industries and potentially positive effects on other industries. It could
also be argued that product and process eco-innovation strategies may bring about (potentially negative) net

4
effects on employment, attributable to a destruction of the low skilled labour force (administrative staff) and a
creation of high skilled positions (R&D).
Third, there is a complementary stream of literature that has focused on the various static and dynamic relationships between eco-
innovation, environmental performances and firm performances2. Konar and Cohen (2001) investigated the effect on firm
market performance of tangible and intangible assets, including two environmental performance-related elements
as explanatory factors. Cohen et al. (1997) also analysed the relationship between environmental and financial
performances. Overall, these authors found that investing in a ‘green’ portfolio did not incur a penalty and even
produced positive returns.
Less recent works by Gray and Shadbegian (1995) used total factor productivity and growth rates for plants over
1979-1990 as performance indicators to test the impact of environmental regulation and pollution abatement
expenditures. They found that $1 more expenditure on abatement is associated with more than 1$ worth of
productivity losses. They found that, when analysing variation over time or growth rates, the relationship
between abatement costs and productivity is not significant. Greenstone (2001) estimates the effects of
environmental regulations, using data for 1,75 million observations of plants in the 1967-87 US censuses of
manufacturers. Environmental regulations negatively affect growth in employment, output and capital
shipments.
Finally, we would point to recent EU based studies, that focus on the (short term) effects of environmental
strategies on the stock performances of corporations, using standard cross section/panel approaches (Ziegler,
Schroeder, Rennings, 2008) and ‘event’ studies that analyse whether there are exogenous unexpected policy
effects on the short term performance of environmentally minded firms. The latter are criticized for their
intrinsic very short term focus. Although valuable, and based on official datasets, we believe that the value of
evidence focusing on stock market performance is limited since the majority of firms, especially in Italy, are of
medium or small sized, and do not appear in stock market data. Innovation dynamics are close to productivity
trends which, in the end, are the main engines of firm performance.
Our paper is embedded in the third research directions, focusing on the effects of environmental (emission)
intensity on firms economic performance here measured by firms turnover growth. The possible contribution of
our work stems from: the focus on a dynamic perspective, the use of real firm performance indicators, the lagged
structure of the data set and the very large number of firms. The main ‘limit’ is the exploitation of sector data
instead of micro data for proxing environmental emissions, depending on the general unavailability of real
environmental performances measures at the microeconomic level, for large sample of firms in Italy. This is
confirmed by the recent paper by Arimura et al. (2008) who study the ISO/EMS (voluntary agreements) effects
on environmental performances on the basis of an OECD survey on environmental performance of firms. It is
striking that the dependent variable ‘environmental performances’ is constructed by means of self reported data
using an ordered format (no change, decrease or increase in emissions). Though the authors carry out some test
and external validity checking for assuring data credibility, the answers seem to be affected by the typical bias
2 A fourth correlated stream of research focuses on the ‘drivers of firm environmental performance’ including, among others, Foulon et al. (2002), Cole at al (2005), Collins and Harris (2003). This is minor in scale given the paucity of data and the difficulty of eliciting such data on real environmental outcomes (non monetary quantification of externalities) even by surveys

5
that may arise when likert scale are offered, with in addition the fact that the issue is highly critical from a firm’s
perspective. Thus, though the first best would to use real environmental performance data at the firm level
(challenge for future research in the future), and the exploitation of self reported survey data is a plausible second
best, the (panel) nature of NAMEA data disaggregated at two digit level offer a robust framework that hybridize
firma and sector data to analyse economic-environment relationship.
3. Conceptual framework, data and methodology
3.1 The theoretical framework
This section briefly sketches the main elements of the conceptual framework on which the set of hypothesis
tested in the empirical part is rooted, trying to discuss what factors may support ‘joint’ economic-environmental
performances at firm level (Mazzanti and Zoboli, 2009).
A first set of factors revolve around the ‘Porter’s hypothesis’ (Jaffe et al., 1995). Environmental regulation may
influence innovation and market (rent) creation. In the long run, regulation costs, or environmental R&D
expenditures, are more than compensated for by the benefits of innovation in terms of higher efficiency and/or
higher value added. This conclusion seems to run counter to the conventional wisdom that environmental
regulation (like any other regulation, of course) or spontaneous investments in green firm performances impose
significant direct and indirect costs on firms and industries, with the primary effect of impacting negatively on
economic performance, and especially (labour and total factor) productivity.
Following the mainstream reasoning, if the firm is optimising resource in production, before the implementation
of (new) environmental regulation, any additional abatement cost or innovation cost deriving from policy
enforcement will lead, at least in the short run, to an equivalent reduction in productivity/performance, since
labour and capital inputs are re-allocated from ‘usual’ or scheduled production output to ‘environmental output’
(pollution reduction).
This emphasis on substitution may stem from the roles in neoclassic reasoning of the assumption of optimal
allocation of resources in the status quo and of input prices (and green taxes) as innovation levers. In fact,
resource prices have been the main driver of change only in specific conditions of strong relative price changes
coupled with structural economic transformations. More generally it is technology that affects prices by changing
factor combinations and capital intensity. In other approaches, the development of new production processes is
viewed as an ongoing process within firms and sectors less reliant on input prices, except in particular
circumstances (Kemp, 1997; Krozer and Nentjes, 2006).
Economies of scale and scope are another argument leading to depart from conventional view..
Complementarity and economies of scale and scope, among other factors, might lead to states where the
productivity effect of environmental investments or compliance becomes positive (plausibly in the medium long
run) 3.
3 “The choice to invest in either change in production process or end of pipe will be used to evaluate the extent to which production and abatement is undertaken jointly. End of pipe technologies are considered to reflect evidence of the existence of a separable production function, with production the conventional output and abatement of pollution as essentially separate plants within a single facility. Different resources are used for each plant. Production process is considered to reflect a production process in which abatement and production of the conventional output are integrated, allowing for the complementary use of inputs in both abatement and production” (Labonne and Johnstone, 2007, p.3).

6
A more general question is whether it is possible to separate eco-innovation from other typologies of innovation.
In practice it is often not easy to separate the two (Rennings, 2000). With or without policy aimed at innovations,
cost-saving motivations and demand-related product market objectives could work as innovation drivers. All
could be complementary in the ultimate aim of enhancing firm productivity, and no sharply defined difference
between them may be possible, in that (i) eco-innovations may generate low or high eco-impacts depending on
their nature and their integration with other innovations; (ii) standard innovations may also provide eco-
innovations. Much of the current empirical research is aimed at disentangling intended and unintended (e.g. mere
cost savings in the more general meaning) eco-effects stemming from innovations: in these approaches, only
those innovations linked to intended ‘proper’ environmental strategies and effects are classified as eco-
innovations. A broad definition of eco-innovations encompasses intentional and unintentional actions. This may
lead to a framework in which economic and environmental goals are more easily identified as being
complementary, and are integrated. Jaffe et al. (1995, 2003) note that firms can engage in some or a great deal of
pollution control “Besides end of pipe technologies, firms usually have strong difficulties in accounting for
specific capital and current environmental expenditures”. As discussed above, it might also be due to the
entangled nature of many environmental and ‘normal’ innovations.
This likely ‘jointness’ of ‘eco’ and ‘normal’ innovations has some connections with the evolutionary perspective
on industrial dynamics, where the balance between firms’ entries and exits is the main driver of development.
Along these lines, environmental pressures could constitute an increasing wedge between innovative firms
(sectors) and less innovative firms, which could in the end, disappear. The former may demonstrate higher
performance on all-inclusive innovative grounds, positively integrating and correlating environmental and non-
environmental dynamics. According to evolutionary theory, interlinked technologies evolve along a dynamic
path, generating positive spillovers and effects on productivity. This discussion can also be positioned with the
analysis of complementarity regarding input factors in the production of innovation and higher performance
practices (Milgrom and Roberts, 1990, 1995; Mohnen and Roller, 2005; Laursen and Foss, 2003; Mazzanti and
Zoboli, 2008b). Complementarity generates increasing returns and non-appropriable innovation rents.
Another motivation is related to the issue of rent generation and appropriability. The production of some
‘environmental goods’ is associated with rents that are appropriable, at least partially, by firms. They are in fact
correctly defined as the private share of an impure public good, which encompasses other entangled pure public
features. Many environmental innovations combine an environmental benefit with a benefit for the company or
user. The gaps between environmentally accounted and standard productivity often emerges in the differences
between natural resources and correlated externalities (Bruvoll et al., 2003). Thus, the innovation potential of
policies, and the associated innovative endogenous strategy of firms depend on the features of the environmental
goods. Those goods may be characterised by private appropriable rents and by public good elements. This
complementarity in production, i.e. a technologically-based positive correlation between the private (fully
appropriable) and the public good elements is potentially linked both to the kind of externalities we are dealing
with, e.g. local/global emissions, private or public product/process (Kotchen, 2005; Rubbelke, 2003; Loschel
and Rubbelke, 2005), and to technological factors, e.g. the relationships existing among apparently separate
technological dynamics.

7
Technology and externalities are in any case theoretically interrelated environments; and non-convexities in
production could be an important element for the joint production of private and public values, depending on
fixed costs and technological constraints (Papandreou, 2000; Boscolo and Vincent, 2003).
To sum up, the key question revolves around the possibility that firms may adopt some environmental strategies
even on an endogenous market-based path. Starting with the Porter’s framework we discussed elements that
might enrich the set of motivations behind a possible joint path of environmental and labour productivity in the
medium-long run, even in the absence of direct policy intervention. Evolutionary theories and borderline issues,
such as complementarity, could constitute some conceptual pillars that extend the intrinsically static neoclassic
reasoning.
The ‘pessimistic’ view of a trade-off between firms’ environmental and non-environmental strategies may be
mitigated by a framework in which those complementarities, which at heart involve different technological
innovations (labour-oriented, environmentally-oriented), might explain, at least in part, why sustained increasing
environmental efficiency is compatible with sustained increasing labour productivity in the ex post setting.
3.2 The set of tested hypotheses
We now specify the main research hypotheses we are testing, that arise from the above discussion.
[H.1]. The sign of the dynamic relationship between emission intensity at time t-1 and economic performance
specified as firm growth, at time t, is investigated, by using two different time lags: emission intensity per unit of
labour averaged over 92-94 and over 95-99. We do expect the closer the lag is the more probable that
environmental efficiency and economic performances are characterised by a trade off rather than complementary
dynamics. Disentangled dynamics (statistical insignificance) are also a possibility if economic performance is
independent on environmental elements.
[H.2]. The shape of the relationship is also investigated by specifying quadratic forms for emission intensity. Non
linearity is a real world feature that is analysed in both mainstream and alternative perspectives, but that assumes
special relevance in dynamic scenarios. Were the relationship is non linear, that is not only the cross-section
(sector) heterogeneity and the lag difference between the two ‘productivities’ that matter, but also the level of the
environmental performances matters. Critical thresholds may exist, and we do expect non linear dynamics to
represent the real world situation of many environmental-economic co-dynamics. It is nevertheless difficult to
assess ex ante which shape is the more likely one, given empirical evidence is still scarce. If the non linear
relationship assumes a U shape, this would mean that at low emission intensity the relationship with economic
performance is associated to a complementary content, then trade off emerge when the environmental efficiency
worsen. Otherwise, in presence of an inverted U shape, the trade off between economic and environmental
performances is mitigated at higher environmental intensity. Further increases in environmental intensity
hampers growth and leads to a co-dynamics between the two sides of firm objectives. In other words, it may be
that only at quite high, or comparatively high, environmental pressures, firms (sectors) endogenously implement
(innovative) strategies or are subject to policies, that help achieving a joint dynamic relationship between
environmental and economic performances.

8
Summing up, we carry out various tests on whether environmental efficiency, deriving from innovation and
structural changes leading to emission reduction is, following technology-based and externality-based
complementarities relationships (Mazzanti and Zoboli, 2008a,b), positively associated with firms growth. The
hypothesis we implicitly assume in the empirical model is that environmental impacts (environmental efficiency)
are also dependent on the core dynamics of innovation, driven by structural factors (e.g. firm size), policy levers,
and idiosyncratic strategic factors (R&D). In other words, we explicitly test whether the two objectives of the
firm: environmental and economic performances, are disentangled (no significant correlation), positively related
(correlation/complementarity between the two), or negatively correlated (substitution or trade-off framework).
As discussed in Section 3.1, this ‘complementarity’ may be opposed to the ‘substitution hypothesis’ which often
derives from a usual neoclassic reasoning, which tends to hide the possibility that firms adopt environmental
innovation in a non policy scenario. In fact, if the firm is optimizing resource allocation in production (before
environmental regulations), any additional abatement cost or innovation cost deriving from policy enforcement
leads, at least in the short run, to an equal reduction in productivity. .
3.3. The data set
3.3.1. Economic performances
The data-set used in this paper was drawn from AIDA: a commercial database collected by Bureau Van Dijck.
This large data set of Italian joint stock companies reports balance sheets data such as sales, value added, number
of employees, labour cost, technical assets, etc. Using this statistical source, for the period 2000-2004, we built a
panel composed of more than 61,000 Italian manufacturing firms. For all these firms we have the following
information: (i) the industry in which they operate; (ii) the geographic location; (iii) a size variable measured
through the number of employees over the period 2000-2004. In addition, we have, for a sub-sample of these
firms, other two information: i.e., (i) sales and (ii) age. This second sample is composed of 36,312 firms. We use
these two data sets in relation to the stage of the Heckman procedure we consider below. Specifically, the first
larger data set is used to estimate the selection equation where the dependent variable is constituted by a dummy
variable that takes the value 1 whether all information on sales and age are available for the period 2000-2004
and the value 0 otherwise. The second smaller data set is used to estimate the growth equations which allow us
to investigate on the empirical link between environmental and economic performances, respectively emission
per employees and turnover. In Tables 1-3 we report the distribution of firms and employees refereed to the
second data set by geographic areas (Table 1), employees classes (Table 2 ) and industry (Table 3).
A potential problem with these kinds of samples is that firms are not randomly chosen (Cingano and Schivardi,
2004). However, a comparison with the whole population in terms of frequency distribution both by industry
and by geographical areas show that our sample is not far from being representative.

9
Table 1 – Distribution of sample firms by geographic areas
Firms Employees N. % N. % North-West 15,164 41.8 1,182,367 50.3 North-East 11,214 30.9 702,696 29.9 Centre 6,968 19.2 355,228 15.1 South 2,966 8.2 110,993 4.7 Total 36,312 100.0 2,351,284 100.0
Table 2 – Distribution of sample firms by employee classes
Firms Employees N. % N. % 0-19 15,607 43.0 169,333 7.2 20-49 12,260 33.8 377,556 16.1 50-249 7,149 19.7 733,364 31.2 >249 1,296 3.6 1,071,032 45.6 Total 36,312 100.0 2,351,284 100.0
Table 3 – Distribution of sample firms by industry (see keys in Appendix)
Firms Employees N. % N. % DA 2,584 7.1 158,617 6.7 DB 3,976 10.9 235,098 10.0 DC 1,398 3.8 54,027 2.3 DD 903 2.5 30,123 1.3 DE 2,306 6.4 118,442 5.0 DF 127 0.3 14,069 0.6 DG 1,633 4.5 189,105 8.0 DH 2,003 5.5 118,953 5.1 DI 2,179 6.0 143,185 6.1 DJ 6,895 19.0 365,674 15.6 DK 5,308 14.6 365,321 15.5 DL 3,205 8.8 289,120 12.3 DM 895 2.5 151,985 6.5 DN 2,900 8.0 117,564 5.0 Total 36,312 100.0 2,351,284 100.0
3.3.2. Emission intensity (environmental technical efficiency performance)
Environmental performances are taken from the NAMEA source4. The Italian NAMEA provides detailed data
at two digit level on main emissions, value added and employees over 1990-2003. Here we focus on 1990-1999
for establishing a lagged structure to the analysis (see below).
Taking data for the period 1990-1999 in order to impose a lag structure to the modelled relationship, and
focusing on some primary environmental efficiency measures of industries (tons of emission for CO2, SOx,
NOX per unit of labour, full time equivalent jobs (FTEJ)), we reconstruct environmental technical efficiency ratios at
firm level by using sector-level coefficients of emission/FTEJ, i.e. the only available proxy for environmental
efficiency at sector level, and our AIDA data on firm employees5. This is the only plausible way to recover firm-
4 The main source of data on sectors-pollutants is NAMEA, published by ISTAT (Italian National Statistical Institute, www.istat.it). The NAMEA is deriving from real observations carried out on point emission sources year by year. The first NAMEA, referring to 1990 data, was published in ISTAT (2001). 5 Average units of the pollutant produced per employee in the branch. Being based on quantity, and not value, it can be taken as an indicator of ‘technical emission efficiency’, thus reflecting the production technology of the branch. Given the

10
level data on environmental performances in order to exploit the very rich information contained respectively in
the Italian NAMEA and AIDA.
We set up average emission/employee for the two periods 1992-1994 and 1995-1999 for assessing relationships
at different lag distances between environmental performances and firm’s growth6. Years 1990 and 1991 were in
the end discarded given problems with sector comparability over time within different NAMEA. Average values
are taken both for testing the technical efficiency effects using two different time periods, and since emission
data are characterised by yearly-specific volatility that is mitigated and smoothed by taking averages.
Table 4 presents summary estimates for the main variables we use in the econometric analysis.
Table 4 – Descriptive analysis of variables
Variable and acronym Description Mean Std. Dev. Min. Max. Y
Turnover growth 2000-2004 0.120 0.590 -6.689 10.137
Turnover 2000 Value of sales in 2000 15.250 1.208 5.860 23.081 Age Age of the firm in years 3.089 0.496 1.386 4.955
CO2 Environmental efficiency (CO2 on FTEJ,
average value 1995-999) 12.779 1.655 7.826 21.658
NOx Environmental efficiency (NOx on FTEJ,
average value 1995-1999) 6.640 1.489 2.079 15.797
SOx Environmental efficiency (SOx on FTEJ,
average value 1995-1999) 6.184 1.776 0.693 16.781
All variables are to be intended in logs
3.3. Empirical model and methodological issues
The empirical specification used in this paper is within the established and well developed literature based on
Gibrat’s law on proportionate effects. This hypothesis states that the probability of a given proportionate change
in size during a specified period of time is the same for all firms in a given industry, regardless of their size at the
beginning of the period (Mansfield, 1962). Following Evans (1987a,b), we adopt a ‘growth version’ of this model,
specifying the dependent variable as firm size growth and not firm size at time t. The independent variable
remains size at time t-1. We test this hypothesis for sales/turnover7. Although most studies focus on employment
as a proxy for size, there are an (increasing) number of investigations on the literature based on other measures
of size and performances, from profitability to asset value8.
level of aggregation of NAMEA production branches, E/N can also reflect composition effects, i.e. the combination of different E/N in, for example, different industries in the branch DK ‘Machinery’ of NAMEA. 6 This is a proxy of technical efficiency. As alternative, for future research or further test on same data, we might use emissions on value added as a proxy of environmental economic efficiency (Mazzanti and Zoboli, 2009). The latter may grow less than the former if labour productivity increases more than emission per employee (and vice versa). It signifies that more value added is generated out from the same or lower emissions. We may then face very different dynamics regarding Emissions/employees and E missions/VA depending on the labour productivity dynamics. 7 We use turnover instead of productivity (turnover / employees) for two reasons. First, it is coherent with most Gibrat’s literature. Secondly, though it might be of interest an investigation between environmental and economic efficiency correlation (Mazzanti and Zoboli, 2009), the period 2000-2004 is atypical, witnessing in Italy a decrease or a stagnation of labour productivity for many industrial sectors, partly due to an increase of the workforce and employment (mainly women, immigrants, atypical contracts) in association with a low growth of value added. 8 For a recent work which like ours uses size measures such as real gross output, employment and real value added, see Harris and Trainor (2005), who analyse manufacturing sectors in a panel framework to study the relationship between growth and size, rejecting the law in all observed cases. Other recent works dealing with measures other or in addition to employment size are Dunne and Hughes (1994), Delmar et al. (2003), Audretsch et al. (2004), Del Monte and Papagni

11
We opt for the Gibrat model for a variety of reasons. In absence of a panel of data framework, we deal with a
hybrid cross section environment with a lag structure in the empirical model that circumvents endogeneity.
Instead of relying on a simple cross section specification, we prefer using such model given that it has shown
good performances in previous studies (Cainelli et al., 2007) and are related to a well developed and consolidated
literature, mainly established in the evolutionary economics environment. Panel analyses may be scope for future
(more valuable) research though we remark that our lagged model is specifically aimed at coping with
endogeneity that would be a methodological and conceptual issue in a panel world.
According to this literature, it is also relevant to deal with exit/entry flows over the period. Gibrat’s law could
also be valid for certain defined sub-samples of firms (young, innovative, etc.). From a methodological point of
view, this calls for econometric techniques that tackle sample selection bias.
Finally, some recent papers (Lotti et al., 2007) argue that while the law may fail on an ex ante basis (that is on the
total firms) since small and medium sized firms (SMEs) grow faster, in an ex post ‘equilibrium’, after the market
has cleaned the industry through competition pressures, this law may hold for the core of survivor firms. Short
run and long run differences in the validity of Gibrat’s law may thus occur, and they can be associated with
exit/entry flows and the evolution of industry towards a core set of firms. The period of observation is generally
not so long as to detect these differences in the short to long run. In any case our study is not primarily focused
on testing Gibrat’s law, which is the framework in which we test out hypotheses. Nevertheless, our result should
be interpreted as biased towards the short to medium term9.
The specification we used to empirically test the relationship between environmental performances and firms
size growth is (Evans, 1988a, 1988b):
(1) ( ) ( ) ( ) ( ) ( ) iggiiiiiiiti vageYYYY ++++=−=∆ βX 'i,2000,2000,2004,,4 lnlnlnlnln δγα
where 2004,iY and 2000,iY are sales of firm i in 2004 and 2000 on employees, iage denotes the age of firm, iX is a
set of variables, including the emission intensity at sector level, and finally iv is the error term with the usual
statistical properties.
It is worth noting that this relationship is also investigated by specifying quadratic terms both for sales and age
and for emission intensity indicators. This is done in order to capture potential non-linear effects among these
covariates and the dependent variable.
To overcome potential selection bias, we estimated equation (1) using the Heckman two-step procedure (Cainelli
et al., 2007)10. The residuals of this regression were used to construct a selection bias factor, which is equivalent
(2003), who deal with Italian manufacturing firms in 1989-1997. A very detailed and comprehensive survey in this literature is presented by Santarelli et al., (2006), to which we refer the reader. 9 Here we cannot directly assess the role of policies as the driver of innovation, or consequently performance. Nevertheless, if we exclude anticipation strategies, the period under observation is one when major policies were still not implemented at EU and national levels. We can assume therefore that such innovation strategies are purely endogenous and depend on firms’ strategic management, as (discussed) in Mazzanti and Zoboli (2009). This could explain in part the coherent but reduced number of first mover firms focussing on innovation for environmental purposes. 10 In our case, the dependent variable in the first stage takes the value 1 if all information (including sales and age) on firm i are available, and 0 otherwise. The covariates used in the first stage to estimate the selection equation are the following: (i) a

12
to the Inverse Mill’s Ratio. This factor accounts for the effects of all unmeasured characteristics which are related
to the selection variable. The Inverse Mill’s Ratio is introduced as an extra explanatory variable in the second
stage of the Heckman procedure, which consists of estimating the growth equation (1) using Maximum
Likelihood estimators and using the selection bias control factor as an additional independent variable. In this
way, we obtain efficient and consistent estimates of the unknown coefficients of the equations. Finally, since
emission intensity data are available at the industry level, we estimate standard errors, that are robust to arbitrary
cluster correlation. This procedure allows us to account for clustering in emission intensity data derived from
NAMEA (Wooldridge, 2003, 2006) 11.
4. Empirical results We sum up the main results of our investigations. First, we find expected result in the first step, that shows the
relevant influence by size, industry and geographic location.
Secondly, we focus on the core aspects of second stage regressions, where the proper Gibrat model is
investigated (tables 5-7 for the three different categories of emissions).
As far as the regressions without environmental performances (not shown) indicates significant and negative
signs attached to age and turnover: firm growth is more likely to be experienced by small firms, an expected
plausible result, and by younger firms, again as expected.
The relationship appears to be nevertheless non linear: quadratic forms show U shapes for both factors. This
may signify that (very) young and (very) old firms are the ones experiencing higher growth over 2000-200412. The
same holds regarding the scale/size of firms: low and high turnovers per employee are associated to higher
growths. All in all, non linearity is empirically relevant. Those outcomes do not change when we include
environmental efficiency indicators (see below).
As a third step, regarding the core analyses of environmental – economic relationships, we first note that linear
forms in tables 5-7 seem to support a positive and significant coefficient for all the 3 emission categories. Thus,
recalling H1, we would be in front of a (usual) ‘trade off’ between different kinds of performance: the higher
emission intensity per employee (over 1995-99), the higher firm growth is (over 2000-2004). Firm growth thus
appears ‘not constrained’ by bad environmental performances; on the reversal side, more environmental efficient
firms (perhaps within greener sectors) do not touch with hand the payoffs of ‘greener investments’.
Motivations may be many and various. In part this evidence may be linked to weak policy pressures on more
polluting firms, mainly when focusing on a global externality like CO2 which has been regulated from early-2000s
on through the IPPC directive and the the emission trading (EU ETS) scheme for CO2. In any case we do not
find here evidence of proactive co-dynamics between environmental and economic realms13. A positive sign in
constant term, (ii) four geographic dummies (North-West; North-East, South and Centre), (iii) four size dummies (D19, D20_49, D50_249 and D250), and finally (iv) nine industry dummies. 11 As additional analysis, in order to circumvent the problem of facing sector base data, we might have estimated predicted values for environmental efficiency, instead of calculating it through merging sector and firm data sources. In the end, looking at methodological oriented literature and comparing results, we opted for the specific technique we use here for estimation of parameters. 12 We note that this period is one of the most critical, in negative terms, for the Italian economy. 13 We stress this is the ‘average’ figure regarding manufacturing firms.

13
the estimated coefficient here means that increasing environmental efficiency leads to some economic costs in
terms of lower growth. Those are the ‘implied cost’ of eventual improvements in environmental performances,
that should be weighted against market (appropriable) and non market benefits accruing from such
improvements. Viceversa, being less environmentally benign relax the constraints to growth.
It is worth noting, nevertheless, that the size of the estimated coefficients is not large, besides that for CO2: trade
off are statistically significant, but quite negligible in terms of impacts for SOx and NOx. Since also the size of
coefficients matter as well as its statistical significance (Ziliak and Mcloskey, 2004), environmental performance
does not seem a primary cost and constraint to growth if compared to other factors affecting firm targets14. The
result for CO2 emissions seems to highlight that, by being CO2 emission related to energy consumption and
end-of-pipe solutions for CO2 emissions being limited, to reduce CO2 emissions may result in a stronger
negative effect on firm growth compared to other air pollutants.
Those outcomes also do not mirror the environmental-economic ‘efficiency’ co-dynamics found by Mazzanti
and Zoboli (2009) who use panel NAMEA data over 1990-2001 for emission intensity of value added and value
added per employee at the NAMEA-sector level. Nevertheless, the two studies, though conceptually close, are
hardly comparable from an empirical point of view: We here exploit a lagged model instead of a panel, with
some differences in the considered period, and the analysis was there on the all macro NAMEA sectors, not just
manufacturing. Both studies point out the importance of non linear paths characterising the links and evolution
of economic and environmental performances.
Finally, the ‘non linear’ (quadratic models at right hand columns of tables 5-7) analyses on the income-
environment relationship here envisaged tells us additional insights {H2}. In fact, regarding CO2, a robust
inverted U, or bell shaped15, endogenous dynamics seem to signal the possibility of experiencing a reduction of
growth after a threshold is reached. The income-environment relationship is not similar across the range of
environmental performances/efficiency. Very inefficient performances in terms of emissions per unit of labour
penalise firms even in the core performances. An explanation among others may be that pollution effects are
(fully) externalized up to a point, then, when a threshold is surpassed, bad environmental performances present
negative effects on firm performances.
Putting it under a different perspective, a potential co-dynamics between economic and environmental
performances emerges when the relationship is non linear. The negative sign of the quadratic term means that
higher emissions per unit of labour hamper growth potential, and vice versa, thus, improvements in
environmental performances are associated to higher growth for firms. We remark that the non linear shape is
here to be interpreted, though embedded in a dynamic relationship, on the basis of the cross section dimension.
The weight is thus on cross firm/sector heterogeneity, not temporal heterogeneity that could be captured in
panel analysis (Mazzanti and Zoboli, 2009; Mazzanti et al., 2007).
Much of it may depend on our eyes on complementarity between ‘private and public elements’ of the emission
abatement that could be targeted by the same technological dynamics. Environmental innovations often give rise
14 At least for SOx and NOx, the growth decrease that ‘follows’ an environmental improvement of 1% in efficiency is less than 0.1%, but half percentage point of growth when considering CO2.. 15 We remark that the estimation of standard errors, that are robust to arbitrary cluster correlation has improved CO2 results. The bell shape was just weakly significant without such a correction. Even for NOx, the quadratic specification was completely insignificant.

14
to a ‘dual externality’, providing the typical R&D spillovers and also reducing environmental externalities (Jaffe et
al., 2003; Rennings, 2000). Therefore, innovation aimed at reducing environmental impact may spur positive
innovation spillovers. This element of complementarity could explain why environmental efficiency may be
linked to turnover dynamics.
Another joint motivation is the issues of rent generation and appropriability as well as complementarity in
production between environmental and economic (technological) objectives we discussed in section 3. The latter
may depend on the features of the environmental ‘goods’ we deal with (Bruvoll et al., 2003; Kotchen, 2005;
Rubbelke, 2003; Loschel and Rubbelke, 2005).
We may note that for CO2 this threshold, or turning point of the income environment bellàshaped curve, is
nevertheless outside the range of observed values for turnover growth over 2000-200416. It is then a signal of a
potential future reversal of the trade off into co-dynamics even for mixed pubic goods ,like carbon dioxide,
whose abatement benefits are not always fully appropriated by firms.
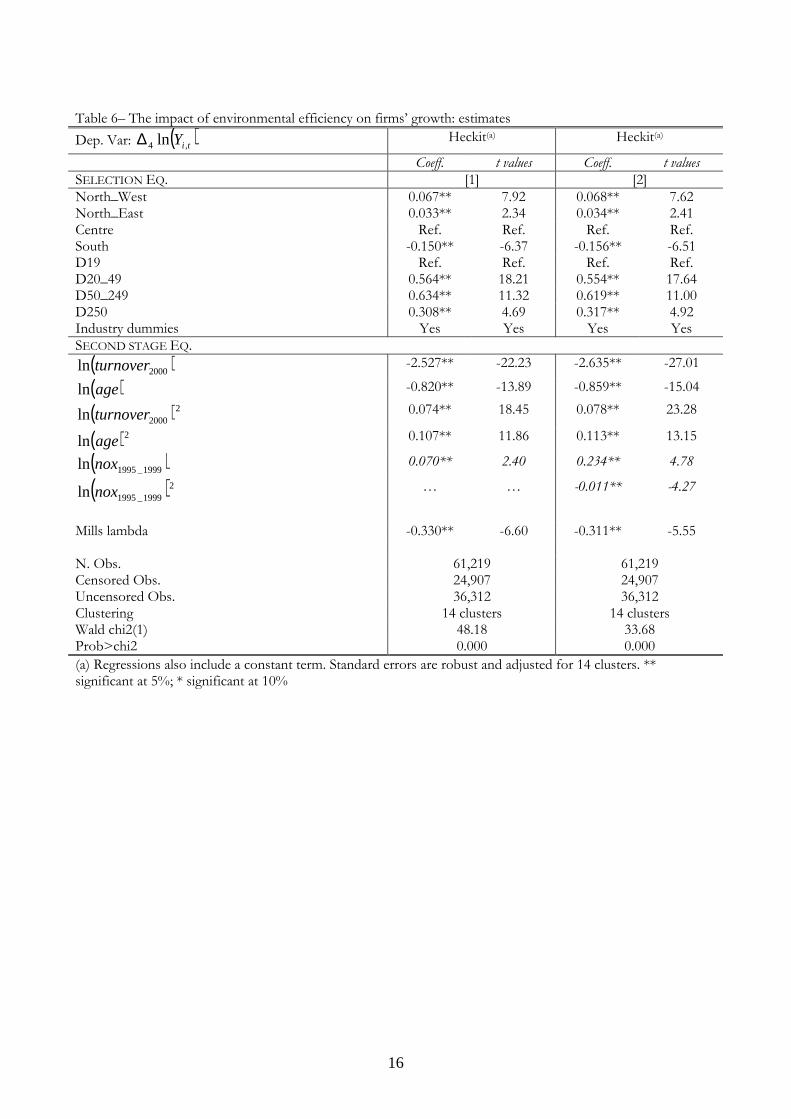
The situation for NOx is just slightly different: recalling that the coefficient in the linear form is negligible in size,
turnover dynamics appear as being associated to a trade off for a certain part of the relationship. Then a joint
dynamics, as before, could characterise the relationship with win win gains. If we estimate the turning point of
the bell curve, we note that the NOx one is lower with respect to CO2. This is plausible. Though this threshold
is still outside the range of observed values, thus predominating the trade off between economic and
environmental performances, the ‘fruits’ of a joint dynamics seem here closer (in time), given the higher
appropriability of rents from innovations improving the NOx-related efficiency.
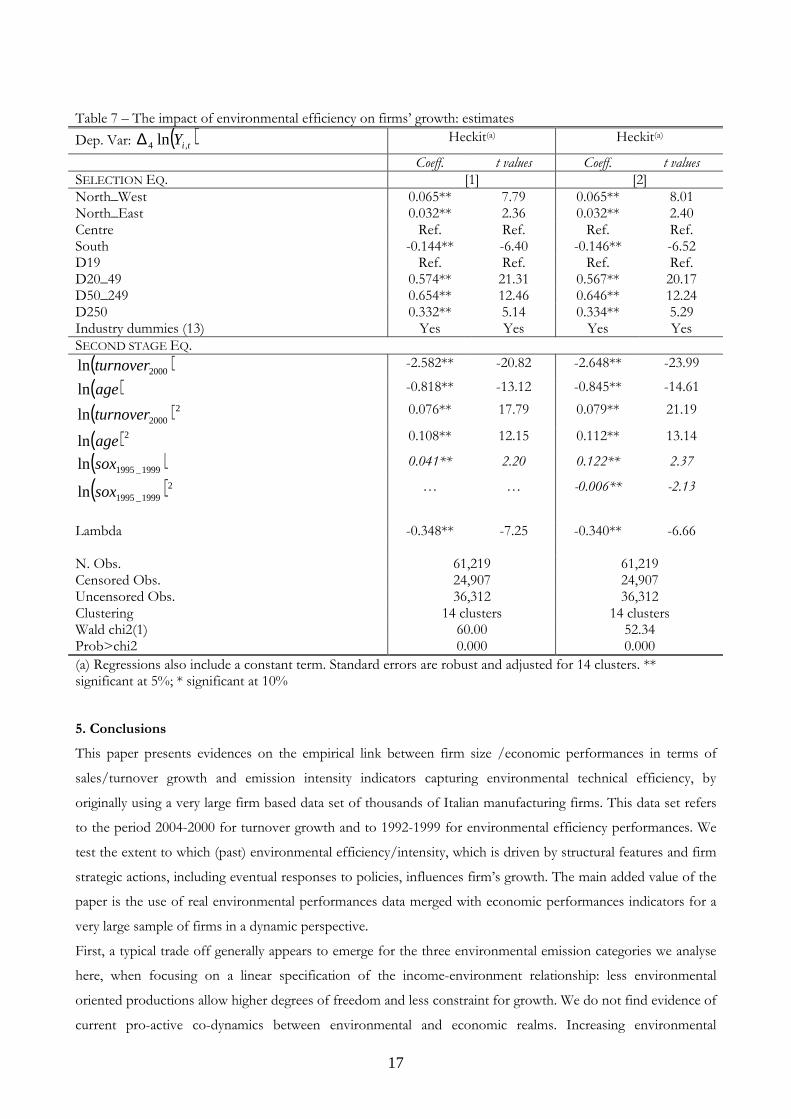
Finally, results for SOx are similar to those for NOx. All in all, all three main environmental indicators tell a
similar story. The short-to-medium term relationship is characterised more by trade off between environmental
efficiency and firm growth in opposition to co-evolutionary dynamics that nevertheless appear ‘at the horizon’
through the non linear relationships robustly emerging from the exploitation of a correction procedure for
‘cluster correlation’. For SOx the threshold turning point show the closest value to real observed ones. Co-
efficiency dynamics are close to be achieved17. Innovation and policy levers, though not directly investigated
here, probably drive stronger trajectories of co-efficiency for SOx, which is the emission that has witnessed the
strongest decrease in the last 20 years.18
16 It is then relevant to calculate the turning point to observe whether this is within the observed range of values. Since it is well within the range, it means that besides a share of firms for which the relationship is not constituted by a trade off, the real dynamic is driven by an opposite trajectory wherein environmental productivity and economic productivity diverge. 17 Mazzanti and Zoboli (2009) note that in the case of air pollutants, provided their emission can improve as a by-product of innovations in energy efficiency and interfuel substitution (i.e. ‘ancillary benefits’ of reducing GHGs), there may also be specific capital stocks capable of reducing some of them, e.g. end-of -pipe technologies reducing SOx, and the new plant/equipment may be both more capital intensive and less air emissions intensive compared to GHG intensity. This may also take place because of regulation. It should be noted that prior to the Integrated Pollution Prevention Control (IPPC) directive and Europe Union’s Emissions Trading Scheme (ETS), GHGs were not regulated directly, whereas most air pollutants have been closely regulated since the 1970s in most countries. It is likely that regulation has been the spur for increasing capital-labour ratio to reduce these pollutants. 18 The results do not change if we use average emission intensity over 1992-1994 instead of 1995-1999 {H1}. The two series ‘average’ are highly correlated. This may mean that more than by the dynamics of emission efficiency, the relationship between economic and environmental objectives is affected by structural and sectoral features, that are affected only in the medium/long run scenario.

15
Table 5 – The impact of environmental efficiency on firms’ growth: estimates
Dep. Var: ( )tiY ,4 ln∆ Heckit(a) Heckit(a)
Coeff. t values Coeff. t values SELECTION EQ. [1] [2] North_West 0.663** 8.05 0.067** 8.28 North_East 0.032** 2.38 0.033** 2.42 Centre Ref. Ref. Ref. Ref. South -0.147** -6.59 -0.150** -6.84 D19 Ref. Ref. Ref. Ref. D20_49 0.569** 20.11 0.563** 19.03 D50_249 0.645** 12.23 0.638** 11.96 D250 0.322** 5.05 0.330** 5.21 Industry dummies (13) Yes Yes Yes Yes SECOND STAGE EQ.
( )2000ln turnover -2.559** -21.32 -2.639** -24.69
( )ageln -0.820** -14.22 -0.852** -15.43
( )22000ln turnover 0.075** 18.08 0.078** 22.02
( )2ln age 0.108** 12.31 0.112** 13.95
( )1999_1995ln cox 0.536** 2.64 0.253** 2.58
( )21999_1995ln cox … … -0.007** -2.37
Lambda -0.340** -6.93 -0.330** -6.60 N. Obs. 61,219 61,219 Censored Obs. 24,907 24,907 Uncensored Obs. 36,312 36,312 Clustering 14 clusters 14 clusters Wald chi2(1) 54.35 50.44 Prob>chi2 0.000 0.000
(a) Regressions also include a constant term. Standard errors are robust and adjusted for 14 clusters. ** significant at 5%; * significant at 10%
16
Table 6– The impact of environmental efficiency on firms’ growth: estimates
Dep. Var: ( )tiY ,4 ln∆ Heckit(a) Heckit(a)
Coeff. t values Coeff. t values SELECTION EQ. [1] [2] North_West 0.067** 7.92 0.068** 7.62 North_East 0.033** 2.34 0.034** 2.41 Centre Ref. Ref. Ref. Ref. South -0.150** -6.37 -0.156** -6.51 D19 Ref. Ref. Ref. Ref. D20_49 0.564** 18.21 0.554** 17.64 D50_249 0.634** 11.32 0.619** 11.00 D250 0.308** 4.69 0.317** 4.92 Industry dummies Yes Yes Yes Yes SECOND STAGE EQ.
( )2000ln turnover -2.527** -22.23 -2.635** -27.01
( )ageln -0.820** -13.89 -0.859** -15.04
( )22000ln turnover 0.074** 18.45 0.078** 23.28
( )2ln age 0.107** 11.86 0.113** 13.15
( )1999_1995ln nox 0.070** 2.40 0.234** 4.78
( )21999_1995ln nox … … -0.011** -4.27
Mills lambda -0.330** -6.60 -0.311** -5.55 N. Obs. 61,219 61,219 Censored Obs. 24,907 24,907 Uncensored Obs. 36,312 36,312 Clustering 14 clusters 14 clusters Wald chi2(1) 48.18 33.68 Prob>chi2 0.000 0.000
(a) Regressions also include a constant term. Standard errors are robust and adjusted for 14 clusters. ** significant at 5%; * significant at 10%
17
Table 7 – The impact of environmental efficiency on firms’ growth: estimates
Dep. Var: ( )tiY ,4 ln∆ Heckit(a) Heckit(a)
Coeff. t values Coeff. t values SELECTION EQ. [1] [2] North_West 0.065** 7.79 0.065** 8.01 North_East 0.032** 2.36 0.032** 2.40 Centre Ref. Ref. Ref. Ref. South -0.144** -6.40 -0.146** -6.52 D19 Ref. Ref. Ref. Ref. D20_49 0.574** 21.31 0.567** 20.17 D50_249 0.654** 12.46 0.646** 12.24 D250 0.332** 5.14 0.334** 5.29 Industry dummies (13) Yes Yes Yes Yes SECOND STAGE EQ.
( )2000ln turnover -2.582** -20.82 -2.648** -23.99
( )ageln -0.818** -13.12 -0.845** -14.61
( )22000ln turnover 0.076** 17.79 0.079** 21.19
( )2ln age 0.108** 12.15 0.112** 13.14
( )1999_1995ln sox 0.041** 2.20 0.122** 2.37
( )21999_1995ln sox … … -0.006** -2.13
Lambda -0.348** -7.25 -0.340** -6.66 N. Obs. 61,219 61,219 Censored Obs. 24,907 24,907 Uncensored Obs. 36,312 36,312 Clustering 14 clusters 14 clusters Wald chi2(1) 60.00 52.34 Prob>chi2 0.000 0.000
(a) Regressions also include a constant term. Standard errors are robust and adjusted for 14 clusters. ** significant at 5%; * significant at 10%
5. Conclusions
This paper presents evidences on the empirical link between firm size /economic performances in terms of
sales/turnover growth and emission intensity indicators capturing environmental technical efficiency, by
originally using a very large firm based data set of thousands of Italian manufacturing firms. This data set refers
to the period 2004-2000 for turnover growth and to 1992-1999 for environmental efficiency performances. We
test the extent to which (past) environmental efficiency/intensity, which is driven by structural features and firm
strategic actions, including eventual responses to policies, influences firm’s growth. The main added value of the
paper is the use of real environmental performances data merged with economic performances indicators for a
very large sample of firms in a dynamic perspective.
First, a typical trade off generally appears to emerge for the three environmental emission categories we analyse
here, when focusing on a linear specification of the income-environment relationship: less environmental
oriented productions allow higher degrees of freedom and less constraint for growth. We do not find evidence of
current pro-active co-dynamics between environmental and economic realms. Increasing environmental

18
efficiency leads to some economic costs in terms of lower firm growth, at least for our manufacturing firms and
in this short/medium run oriented empirical scenario. Viceversa, being less environmentally benign relax the
constraints to growth. However, the size of the estimated coefficients is not large besides CO2: trade off are
statistically significant but quite negligible in terms of effective average impacts. As example, for SOx and NOx
growth is reduced by less than 0.10% for a 1% increase of environmental efficiency; the percentage move up to
half a point of growth for CO2 ‘abatements’. All in all, then, the ‘environmental factor’ does not seem a primary
cost and constraint to growth, if compared to other factors affecting firm targets and firm competitiveness.
In addition, and highly important, non linear analyses of the relationships, nevertheless, tell us to some respect a
different story. Results show that the link between emission efficiency and firm growth is in fact robustly non
linear. Inverted U shapes appear for all three emission efficiency indicators: this may be a signal that both firm
strategies and recent policy efforts, are affecting the relationship between environmental efficiency and economic
performance, possibly turning it in the near future from a trade off to joint complementary/co-dynamics. This
potential co-dynamic between environmental and economic performances appears more likely to be achieved in
the next future for NOx and SOx. This evidence is plausible with the higher appropriability of (higher)
environmental performances deriving from innovation actions of manufacturing firms.
The story we discuss here for Italy over the 1990s is a sort of ‘policy free’ scenario; it is thus consistent that CO2
appears as the environmental factor less likely to be associated to win win complementary income-environment
dynamics in the next future. The endogenous evolution of income and environmental factors linked by the web
of firms-based and sector-specific innovation contents may not suffice, as highlighted by other studies, for
coping with this externality. The relatively less significant evidence for carbon dioxide also calls for policy advices
in favour of more stringent policies for emission that are characterised by a largest part of public good (not
appropriable) content.
Our results could open a new window of empirical evidence that supports the existence of a dynamic and
evolving of trade-off between environmental and economic strategies of industrial firms, up to achieve a
complementarity between the two.

19
References
Audretsch D. Klomp L. Thurik R. (2002), Gibrat’s Law: are the services different? ERIM Research paper series, ERIM Report series reference n. ERS 2002-04-STR, Erasmus University of Rotterdam.
Audretsch D. Klomp L. Santarelli E. Thurik R. (2004), Gibrat’s Law: are the services different?, Review of Industrial organisation, vol.24, pp.301-24.
Arimura T. Hibiki A. Katayama H. (2008), Is a voluntary approach a n effective environmental policy instrument? A case for environmental management systems, Journal of Environmental Economics and Management, vol.55, pp.281-95.
Boscolo, M., Vincent, J., 2003. Non convexities in the production of timber, biodiversity and carbon sequestration. Journal of environmental economics and management 46 (2), 251-68.
Brunnermeier S. Cohen M. (2003), The Determinants of Environmental Innovation in US Manufacturing Industries, Journal of Environmental Economics and Management, vol. 45, pp. 278-93. Cainelli G. Mazzanti M. Zoboli R. (2007), Environmentally-oriented innovative strategies and firm performances in services, nota di lavoro FEEM, Milan Calvo J. (2006), Testing Gibrat’s Law for small young and innovating firms, Small Business economics, vol.26, pp.117-123. Cainelli G. Evangelista R. Savona M. (2006), Innovation and economic performance in services: a firm level analysis, Cambridge Journal of Economics, vol.30, pp.435-458.
Cleff T. Rennings K. (1999), Determinants of Environmental Product and Process Innovation - Evidence from the Mannheim Innovation Panel and a Follow-Up Telephone Survey, European Environment Vol. 9, No. 5, 191-201.
Cole M.A., Elliott R. Shimamoto K. (2005), Industrial characteristics, Environmental regulations and air pollution: an analysis of the UK manufacturing sector, Journal of environmental economics and management, vol.50, n.1, pp. 121-43.
Collins A. Harris R. (2005), The impact of foreign ownership and efficiency on pollution abatement expenditures by chemical plants: some UK evidence, Scottish Journal of Political Economy, vol.52, n.5.
Cohen M. Fenn S. Konar S. (1997), Environmental and Financial performance: are they related?, mimeo. Delmar F. Davidsson P. Gartner W.B., 2003, Arriving at the high growth firm, Journal of Business Venturing, vol.18, n.2,
pp.189-216. Del Monte A. Papagni E. (2003), R&D and the growth of firms. An empirical analysis of a panel of Italian Firms, Research
Policy, vol.32, pp.1003-14. Dunne T. Hughes P. (1994), Age, size, growth and survival: UK companies in the 1980s, Journal of Industrial Economics,
vol.42, pp.115-140. Evans D. S. (1987a), The relationship between firm growth, size and age: estimates for 100 manufacturing industries, The Journal of Industrial Economics, vol. 35, n.4, pp.567-81.
- (1987b), Tests of alternative Theories of firm growth, The Journal of Political Economy, vol.95, n.4 pp.657-674. Femia, A., Panfili, P. (2005), Analytical applications of the NAMEA. Paper presented at the annual meeting of the Italian
Statistics society. Rome, mimeo. Foulon J. Lanoie P. Laplante B. (2002), Incentives for Pollution control: Regulation or Information? Journal of Environmental Economics and Management, vol.44, pp.169-187.
Frondel M. Horbach J. Rennings K. Requate T. (2004), Environmental Policy Tools and Firm-level Management Practices: Empirical Evidence for Germany, CAU economics working paper n.2, Department of Economics, Kiel, mimeo.
Frondel M. Horbach J. Rennings K. (2004), What triggers Environmental Management and Innovation?, RWI discussion papers, n. 15, Essen, RWI, mimeo.
Frondel M. Horbach J. Rennings K. (2004), End-of-Pipe or Cleaner Production? An Empirical Comparison of Environmental Innovation Decisions Across OECD Countries, working paper n.82, Centre for European Economic Research (ZEW), Mannheim.
Gray W. Shadbegian R. (1993), Environmental regulation and manufacturing productivity at the plant level, discussion paper US Department of Commerce, Centre for Economic Studies, Washington D.C.
- (1995), Pollution, Abatement Costs, Regulation, and Plant-level Productivity, NBER working paper 4994, NBER, mimeo. Greenstone M. (2001), The Impacts of Environmental Regulations on Industrial Activity: Evidence from the 1970 and
1977 Clean Air Act Amendments and the Census of Manufacturers, NBER working paper n.8484, NBER, mimeo. Harris R. Trainor M. (2005), Plant level analyses using the ARD: another look at the Gibrat’s Law, Scottish Journal of Political Economy, vol.52, pp.492-518.
Jaffe A. Palmer K. (1997), Environmental regulation and innovation: a panel data study, The review of economics and statistics, vol.79, n.4, pp. 610-619.
Jaffe A. Newell R. Stavins R. (2003), Technological change end the environment, in K-G. Maeler, J.R. Vincent (eds.), Handbook of Environmental Economics. Vol. 1, Elsevier, Amsterdam.
Johnstone N. (2007), Environmental Policy and Corporate Behaviour, Edward Elgar, Cheltenham, UK. Kemp, R., 1997. Environmental Policy and Technical Change. Edward Elgar, Cheltenham. Konar S. Cohen M. (2001), Does the market value environmental performance?, The review of economics and statistics, vol.83,
n.2, pp.281-89. Kotchen, M., 2005. Impure public goods and the comparative statics of environmentally friendly consumption. Journal of
environmental economics and management 49, 281-300. Krozer, Y., Nentjes, A., 2006. An essay on innovations for sustainable development. Environmental Sciences 3 (3), 163-74.

20
Labonne, J., Johnstone, N., 2007. Environmental policy and economies of scope in facility level environmental practices. mimeo.
Laursen, K., Foss, N.J., 2003. New Human resource management practices, complementarities and the impact of innovation performance. Cambridge Journal of Economics 27, 243-63.
Loschel, A., Rubbelke, T.G., 2005. Impure public goods and technological Interdependencies, Fondazione ENI Enrico Mattei Working paper n.60, FEEM, Milan.
Lotti F. Santarelli E. Vivarelli M. (2007), Defending Gibrat’s law’s as a long run regularity, IZA DP n.2744. Lotti F. Santarelli E. Vivarelli M. (2001), The relationship between size and growth: the case of Italian newborn firms, Applied Economics Letters, vol. 8, pp.451-454.
Mansfield K. (1962), Entry, Gibrat’s Law, Innovation and the growth of firms, American Economic Review, vol.52, pp.1023-51. Mazzanti M. Montini A. Zoboli R., (2007), Environmental Kuznets Curves for air pollution in Italy. Evidence from sector
accounting and provincial data, Economia Politica, n.3. Mazzanti M. Zoboli R. (2009), Environmental efficiency and labour productivity: trade-off or joint dynamics?, Ecological Economics, forthcoming.
Mazzanti M. Zoboli R. (2008a), Embedding Environmental Innovation in Local Production Systems: SME strategies, networking and industrial relations, International Review of Applied Economics, forthcoming.
Mazzanti M. Zoboli R. (2008b), Complementarities, firm strategy and environmental innovations. Environmental Sciences 5(1), 17-40.
Mazzanti M. Zoboli R. (2005), The drivers of environmental innovation in local manufacturing systems, Economia Politica, n.3, pp.399-438.
Milgrom, P., Roberts, J., 1990. The economics of modern manufacturing: technology, strategy and organization. The American Economic Review. 80 (3), 511-528
- (1995). Complementarities and fit Strategy, structure, and organizational change in manufacturing. Journal of Accounting and Economics 19(2-3), 179-208.
Mohnen, P., Roller, L.H., 2005. Complementarities in Innovation Policy. European Economic Review 49 (6), 1431-50. Nelson R. Winter S. (1982), An Evolutionary Theory of Economic Change, Belknap Press/Harvard, University Press, Cambridge. Papandreou, A., 2000. Externality, convexity and institutions, Fondazione ENI Enrico Mattei Working paper n. 48, FEEM,
Milan. Pfeiffer F. Rennings K. (1999), Employment impacts of cleaner production, Discussion paper n.46 Centre for European
Economic Research (ZEW), Mannheim. Porter M. - Van der Linde C. (1995), Toward a new Conception of the Environment-Competitiveness Relationship, Journal of Economic Perspectives, vol. 9, n. 4, pp. 97-118.
Rennings K. (2000), Redefining innovation – eco innovation research and the contribution from ecological economics, Ecological Economics, vol.32, n.2, pp. 5-17.
Rennings K. Ziegler A. Ankele K. Hoffmann E. Nill J. (2003), The influence of the EU environmental management and auditing schemes on environmental innovations and competitiveness in Germany. An analysis on the basis of case studies and a large scale survey, Discussion paper 03-14, ZEW, Mannheim.
Rennings K. Ziegler A. Zwick T. (2001), Employment changes in environmentally innovative firms, Discussion paper n.46 Centre for European Economic Research (ZEW), Mannheim.
Rennings K. Zwick T. (2001), The Employment Impact of Cleaner Production on the Firm Level. Empirical Evidence from a Survey in Five European Countries, Discussion paper, Centre for European Economic Research (ZEW), Mannheim.
Rubbelke, D., 2003. An analysis of differing abatement incentives. Resource and energy economics 25 (3), 269-94. Santarelli E. Klomp L. Thurik R. (2006), “Gibrat’s Law: an overview of the empirical literature”, in Santarelli E. (eds.),
Entrepreneurship, growth and innovation: the dynamics of firms and industries, Springer, New York. Ziegler A. Schroder M. Rennings K. (2008), The effect of environmental and social performance on the stock performance
of European corporations, Environmental & Resource Economics, Forthcoming. Wooldridge J. M. (2006), Cluster-Sample Methods in Applied Econometrics: An Extended Analysis, mimeo, Department of
Economics, Michigan State University. - (2003), Cluster-Sample Methods in Applied Econometrics, American Economic Review, vol. 93, 133-138. Ziliak S. Mckloskey D. (2004), Size matters: the standard error of regressions in the American economic review, Journal of Socio economics, vol.33, n.5, pp.527-46.

21
Appendix
Table A.1 – Classification of manufacturing activities
Codes Description DA Food products, beverages and tobacco DB Textile and clothing DC Leather and leather products DD Wood and wood products
DE Pulp, paper, and paper products, publishing and printing
DF Coke, refined petroleum products, and nuclear fuel
DG Chemicals, chemical products, and man-made fibres
DH Rubber and plastic products DI Non-metallic mineral products DJ Basic metals and fabricated metal products DK Machinery and equipment DL Electrical and optical equipment DM Transport equipment DN Other manufacturing