the relation between smartphone use and everyday inattention
TRANSCRIPT

The Relation Between Smartphone Use and
Everyday Inattention
by
Jeremy John Marty-Dugas
A thesis
presented to the University of Waterloo
in fulfilment of the
thesis requirement for the degree of
Master of Arts
in
Psychology
Waterloo, Ontario, Canada, 2017
© Jeremy Marty-Dugas 2017

ii
Author’s Declaration
This thesis consists of material all of which I authored or co-authored: see Statement of Contri-
butions included in the thesis. This is a true copy of the thesis, including any required final revi-
sions, as accepted by my examiners.
I understand that my thesis may be made electronically available to the public.

iii
Statement of Contributions
Jeremy Marty-Dugas was the primary author of the manuscript, conceived the smartphone
questionnaires, and analyzed the data.
Brandon Ralph assisted with the creation of the smartphone usage questionnaires and writing
the manuscript.
Jonathan Oakman provided assistance in conducting and interpreting the data analysis of the
present study.
Daniel Smilek guided the research process, including the creation of the smartphone question-
naires, data analysis, and presentation of the findings in written format.

iv
Abstract
In two studies, we explored the relation between subjective reports of smartphone use and every-
day inattention. We created two questionnaires that measured general smartphone use (i.e. how
frequently people send and receive texts, use social media, etc), and absent-minded smartphone
use (i.e. how frequently people use their phone without a purpose in mind). In addition, partici-
pants completed four scales assessing everyday attention lapses, attention-related errors, sponta-
neous mind wandering and deliberate mind wandering, which were included in order to measure
everyday inattention. The results of both studies revealed a strong positive relation between gen-
eral and absent-minded smartphone use. Furthermore, we observed significant positive relations
between each of the smartphone use questionnaires and each of the four measures of inattention.
However, a series of regression analyses demonstrated that when both types of smartphone use
were used as simultaneous predictors of inattention, the relation between inattention and
smartphone use was driven entirely by absent-minded use. Specifically, absent-minded
smartphone use consistently had a unique positive relation with the inattention measures, while
general smartphone use either had no relation (Study 1) or a unique negative relation (Study 2)
with inattention.

v
Acknowledgements
I wish to thank my supervisor Daniel Smilek for his encouragement, support, and enthusiasm,
during my training as a research. My thanks also go to Brandon Ralph for his skepticism and be-
ing an excellent person to spend time musing about the impact of technology with. I also wish to
thank Jonathan Oakman for his patience and assistance in helping me to understand the finer
points of regression, and to my labmates, Noah and Kristin for their helpful comments and the
stimulating environment they help create in our lab. Finally, I wish to thank the Natural Science
and Engineering Research Council of Canada (NSERC) who have supported our lab and this re-
search with a discovery grant to Daniel Smilek, and the Ontario government for supporting me in
particular with the OGS and Queen Elizabeth II Graduate Scholarships. This work is currently
under review in the journal Psychology of Consciousness: Theory, Research, and Practice.
vi
Dedication
To my parents for all their love and support. Thank you for fostering my curiousity, tenacity, and
interest in learning about the world. Thank you as well for all the accidental calls and texts I re-
ceive on a daily basis. Hopefully, this research will convince you to go back to a rotary phone.
- Jer
vii
Table of Contents
Author’s Declaration ....................................................................................................................... ii
Statement of Contributions ............................................................................................................ iii
Abstract .......................................................................................................................................... iv
Acknowledgements ......................................................................................................................... v
Dedication ...................................................................................................................................... vi
List of Tables ............................................................................................................................... viii
Introduction ..................................................................................................................................... 1
Study 1 ............................................................................................................................................ 6
Method ........................................................................................................................................ 6
Participants .............................................................................................................................. 6
Measures ................................................................................................................................. 6
Procedure ................................................................................................................................ 8
Results ......................................................................................................................................... 9
Psychometrics ......................................................................................................................... 9
Smartphone Use and Daily Inattention ................................................................................. 10
Unique Contributions of Smartphone Use ............................................................................ 12
Study 2 .......................................................................................................................................... 16
Method ...................................................................................................................................... 16
Participants ............................................................................................................................ 16
Measures ............................................................................................................................... 17
Procedure .............................................................................................................................. 17
Results ....................................................................................................................................... 18
Psychometrics ....................................................................................................................... 18
Smartphone Use and Daily Inattention ................................................................................. 18
Unique Contributions of Smartphone Use ............................................................................ 20
Discussion ................................................................................................................................. 24
Concluding Comments.................................................................................................................. 25
References ..................................................................................................................................... 29
Appendix A ................................................................................................................................... 35
Appendix B ................................................................................................................................... 37
viii
List of Tables
Table 1 - Descriptive statistics for Study 1
Table 2 - Item Statistics for general smartphone use and absent-minded smartphone use
Table 3 - Correlations between measure of smartphone use and inattention
Table 4 - Multiple regression predicting everyday inattention measures by general smartphone
use, and absent-minded smartphone use
Table 5 - Hierarchical regression predicting attention-related errors, with general absent-
mindedness and absent-minded smartphone use
Table 6 - Hierarchical regression predicting spontaneous mind-wandering, with general absent-
mindedness and absent-minded smartphone use
Table 7 - Hierarchical regression predicting deliberate mind-wandering, with general absent-
mindedness and absent-minded smartphone use
Table 8 - Descriptive statistics for Study 2
Table 9 - Item Statistics for general smartphone use and absent-minded smartphone use
Table 10 - Smartphone use and inattention measures
Table 11 - Multiple regression predicting everyday inattention by general smartphone use, ab-
sent-minded smartphone use, and participant age
Table 12 - Hierarchical regression predicting attention-related errors, with general absent-
mindedness, participant age, and absent-minded smartphone use
Table 13 - Hierarchical regression predicting spontaneous mind-wandering, with general absent-
mindedness, participant age, and absent-minded smartphone use
Table 14 - Hierarchical regression predicting scores on the deliberate mind-wandering, with
general absent-mindedness, participant age, and absent-minded smartphone use

1
Introduction
In the 21st century, smartphones have become a near constant fixture in our daily lives.
In the United States, for instance, smartphone ownership has jumped from 35% to 68% between
2011 and 2015 (Anderson, 2015). One likely reason for this increase is that smartphones confer a
great deal of utility; they provide a portable means by which we can connect with friends and
family, capture and share high quality photographs, listen to music, navigate our environment,
and access a great deal information via the internet.
Despite the numerous benefits that smartphones might confer, there is reason to believe
that smartphones might be associated with a variety of negative outcomes. For example, research
on general mobile phone use, ranging from mobile devices with only talking and texting capabil-
ities to modern smartphones, has shown that such devices are a serious distraction to drivers. In-
deed, mobile devices have been implicated in approximately 27% of all auto accidents in the
United States (National Safety Council, 2013), as well as recent rail disasters (Reuters, 2008;
The Guardian, 2016). As a secondary task that serves to divide attention, mobile phone conversa-
tions impair performance on a variety of behaviours critical for accident avoidance (Strayer,
2015; Strayer, Drews, & Johnston, 2003; Strayer & Johnston, 2001). Perhaps most troubling, the
effect of using a cellular phone while driving appears to be just as detrimental as driving drunk,
when directly compared in a driving simulator (Strayer, Drews, & Crouch, 2006).
Distraction via mobile phones has also become a primary concern in other real-world
contexts. In the medical industry, for instance (see Gill, Kamath, & Gill, 2012), there have been
claims that patient lives have been endangered by doctor inattention caused by smartphone use
(Halamka, 2011). A recent survey found that among medical professionals performing cardio-
pulmonary bypass, a situation in which vigilance is critical for patient safety, 56% have admitted

2
to using their cellphone during surgical procedures (Smith, Darling, & Searles, 2011). When it
comes to academic performance, the available evidence suggests that students who use their mo-
bile phones to text or talk while completing schoolwork have poorer educational outcomes than
those who do not (Junco & Cotten, 2012), and that ringing phones during a lecture can divide
attention and result in poorer recall of lecture material (Shelton, Elliot, Lynn, & Exner, 2009).
Furthermore, researchers have demonstrated that participants who were more reliant on their
smartphones for information, also used less analytical thinking when completing reasoning tasks
(Barr, Pennycook, Stolz, & Fugelsang, 2015). Mobile phones even seem to impair everyday be-
haviours such as walking, by dividing attention and making people less aware of their surround-
ings (Hyman, Boss, Wise, McKenzie, & Caggiano, 2010). There are consequences to this lack of
awareness, whether it means failing to notice a unicycling clown (Hyman et al., 2010), or falling
from a cliff while playing pokemonGO (CNN, 2016). As mobile phones become ‘smarter’ and
grow in functionality and sophistication, it seems reasonable to assume that distraction and inat-
tention caused by these devices will increase as well.
In the current investigation, we further explored the relation between smartphone use and
daily inattention using an individual differences approach. Individual differences in daily inatten-
tion are often measured through subjective report scales that assess experiences such attention
lapses, everyday foibles related to episodes of inattention, and mind-wandering. Here, we briefly
describe four distinct measures of inattention used in the present study. The Mindful Attention
Awareness Scale – Lapses Only variant (MAAS-LO; Brown & Ryan, 2003; Carriere, Cheyne, &
Smilek, 2008) is a commonly used measure of attention lapses, which contains items such as: “I
find myself doing things without paying attention.” Everyday attention-related foibles are typi-
cally indexed by the Attention-Related Cognitive Errors Scale (ARCES; Cheyne, Carriere, &

3
Smilek, 2006), which requires participants to respond to items such as: “I have gone to the fridge
to get one thing (e.g. milk) and taken something else (e.g. juice).” Finally, two forms of mind-
wandering in everyday life, unintentional and intentional mind-wandering, can be indexed by the
Spontaneous and Deliberate Mind-Wandering questionnaires (MWS and MWD, respectively;
Carriere, Seli, & Smilek, 2013), containing items such as: “I mind-wander even when I’m sup-
posed to be doing something else” and “I allow myself to get absorbed in pleasant fantasy.” It is
important to keep in mind that the foregoing are all general measures of inattention in everyday
life which do not directly inquire about smartphone related activity.
Why might smartphone use be related to such experiences of general inattention in eve-
ryday life? One set of answers to this question concerns the frequency of general smartphone use
(e.g., receiving notifications from apps, emails, or texts). For instance, using a smartphone more
frequently may create more opportunities for attention to be divided, thereby leading to more
attention-related errors. Furthermore, it could be that frequent interruptions from a myriad of no-
tifications, or continuously using smartphones to multi-task (and thereby divide attention), may
erode one’s ability to sustain attention on a single task for extended periods of time. Indeed, it
has been suggested in the media multitasking literature, that those who readily multitask with
media (such as smartphones) might have altered attentional mechanisms compared to light media
multitaskers (Cain and Mitroff, 2011; Lin, 2009; Ophir, Nass, & Wagner, 2009; Ralph, Thomp-
son, Cheyne & Smilek, 2014); the fact that heavy media multi-taskers reportedly have less gray
matter volume in the Anterior Cingulate Cortex seems to support this idea (Loh & Kanai, 2014).
Alternatively, it is possible that frequent smartphone use has no detrimental effect on the atten-
tion system, but that individuals who use their smartphones more frequently simply develop a
preference for engaging with the world in short temporal windows of focal attention. Whether

4
frequent smartphone use leads to more situations of divided attention, degrades the attention sys-
tem, or simply changes personal preferences for distributing attentional resources, one would ex-
pect that individuals who frequently engage in general smartphone-related behaviours (e.g., more
texting, more emailing, or more use of the calendar to organize oneself) will also report more
frequent episodes of general inattention in their everyday life.
Another interesting possibility, which we explore in the current paper, is that it is not the
frequency (i.e., amount) of general smartphone use that matters, but rather the specific way peo-
ple use their smartphones. Particularly, it seems reasonable to hypothesize that individuals who
often use their smartphone specifically in an absent-minded manner may also experience more
episodes of inattention and attention-related errors. Indeed, most smartphone users have experi-
enced using their phones for longer than they intended to, scrolling through information without
a goal in mind, or finding themselves repeatedly checking their phones without even realizing it–
all of which may be categorized as absent-minded behaviours. Indeed, previous research has in-
dicated that checking behaviours occur frequently, despite often being an annoyance to the user
(Oulasvirta, Rattenbury, Ma, & Raita, 2012). Along these lines, absent-minded smartphone use
might reflect and even strengthen one’s overall tendency to be absent-minded, which would
manifest in more absent-mindedness and inattention in everyday life.
To adjudicate between general and absent-minded smartphone use, we constructed two
questionnaires called the Smartphone Use Questionnaire: General (SUQ-G) and the Smartphone
Use Questionnaire: Absent-Minded (SUQ-A). The SUQ-G assesses the frequency of a variety of
basic smartphone behaviours, such as how often individuals send and receive text messages, or
use their phone to browse the web. The SUQ-A, on the other hand, focuses on the frequency of
absent-minded behaviour such as using the smartphone for longer than intended, repeated uncon-
5
scious checking, or engaging in various phone-functions without noticing that one is doing so
(see Appendix A for the full questionnaires).
In what follows, we report two studies wherein we investigated the relation among gen-
eral and absent-minded smartphone use and everyday experiences of inattention using an indi-
vidual differences approach. In both studies, we included measures of general smartphone use
(SUQ-G) and absent-minded smartphone use (SUQ-A) as well as the four self-reported scales of
everyday inattention described below (MAAS-LO, ARCES, MWS and MWD). Study 1 was
conducted using a sample of undergraduate university students. In Study 2 we sought to replicate
our findings from Study 1 with a more diverse sample of participants. We anticipated that in-
creased general smartphone usage would be related to increased frequency of absent-minded
smartphone usage, which would be reflected in a positive correlation between the SUQ-G and
the SUQ-A. Second, we expected that both forms of smartphone usage would be positively relat-
ed to inattention, but that absent-minded use in particular would be related to inattention more
strongly. Finally, our third goal was to explore the unique contributions of general smartphone
use and absent-minded smartphone use when predicting the various measures of inattention.
6
Study 1
Method
Participants. One hundred and eighty-five undergraduates from the University of Water-
loo participated in exchange for partial course credit. Our goal was to collect as many partici-
pants as possible prior to the end of term. Of these, 25 participants failed to complete at least one
of the measures and were thus removed from the sample before data analysis. As our scales were
included with a series of other scales, participants were not explicitly required to own a
smartphone to participate. We investigated smartphone ownership by looking at responses to the
question “How often do you have your smartphone on your person?”. Only one participant indi-
cated “1 – Never” (in fact, this was their response to every smartphone related question) and was
removed, leaving data from 159 participants (85 females) for analysis. Participant age ranged
from 18 – 33 years old, with a mean of 20.42 (SD = 2.25). Three participants declined to provide
their age.
Measures.
Smartphone Use Questionnaires (SUQ-G and SUQ-A). To distinguish between frequent
general use of a smartphone and frequent absent-minded use of a smartphone, we developed two
new questionnaires – the Smartphone Use Questionnaire: General (SUQ-G) and the Smartphone
Use Questionnaire: Absent-Minded (SUQ-A). Both questionnaires contain 10 items that partici-
pants respond to using a 7-point scale ranging from 1 (Never) to 7 (All the time). The full ques-
tionnaires are presented in Appendix A. The SUQ-G was designed to measure the frequency
with which participants engaged in a broad range of smartphone-related behaviours, such as how
often they send and receive text messages, use social media, or browse the web on their
smartphone, containing items such as “When you get a notification on your phone, how often do
7
you check it immediately?” and “How often do you check social media apps such as snapchat,
facebook, or twitter?” On the other hand, the SUQ-A was designed to assess the frequency with
which individuals engaged their phones absent-mindedly. For example, the SUQ-A contains
items such as “How often do you find yourself checking your phone without realizing why you
did it?” and “How often do you lose track of time while using your phone?” In each of the exper-
iments presented here, items from these two questionnaires were intermixed and presented to-
gether in a random order in an attempt to reduce the potential impact of social desirability on re-
sponses to questions about absent-minded use.
Mindful Attention Awareness Scale - Lapses Only (MAAS-LO). The MAAS-LO
(Brown & Ryan, 2003; Carriere et al., 2008) is a 12-item scale that assesses the frequency with
which individuals behave in a mindless or absent-minded fashion. Participants respond to items
such as “I snack without being aware that I’m eating” and “I rush through activities without be-
ing really attentive to them” on a 6-point Likert scale ranging from 1 (almost never) to 6 (almost
always). The MAAS-LO has been demonstrated to have good internal consistency (i.e. above .8)
(Carriere et al., 2008; Ralph et al., 2014)
Attention Related Cognitive Errors Scale (ARCES). The ARCES is a 12-item self-report
measure designed to assess the frequency of everyday performance errors that result from lapses
in sustained attention. Participants indicate responses to statements such as “I have gone into a
room to get something, got distracted, and left without what I went there for” on a 5-point Likert
scale ranging from 1 (never) to 5 (very often). The ARCES has been demonstrated to be both a
reliable and valid scale, such that higher scores on the ARCES predict poorer performance on the
Sustained Attention to Response Task (SART; Cheyne et al., 2006). The ARCES has been con-
sistently demonstrated to have high internal consistency (Cheyne et al., 2006; Ralph et al., 2014).

8
Spontaneous and Deliberate Mind-Wandering (MWS and MWD). The Spontaneous
Mind-Wandering Scale (MWS) and Deliberate Mind-Wandering Scale (MWD) are 4-items sub-
jective reports that inquire about the tendency to experience unintentional / spontaneous episodes
of mind-wandering (MWS), and the tendency to experience intentional / deliberative episodes of
mind-wandering (MWD). On the MWS, participants respond to statements such as “I find my
mind wandering spontaneously”, whereas on the MWD, participants respond to statements such
as “I allow my thoughts to wander on purpose”. On both scales, participants respond to state-
ments using a 7-point scale with respond options ranging from 1 (Rarely) to 7 (A lot). Previous
research has found spontaneous and deliberate mind-wandering to be positively correlated (Car-
riere et al., 2013; Seli, Carriere, & Smilek, 2015), but they have also been shown to be dissocia-
ble as well (for a review, see Seli, Risko, & Smilek, 2016). Each of these scales has been demon-
strated to have high reliability (Carriere et al., 2013).
Procedure. Participants were provided with a link to an online version of the question-
naires. The questionnaires of interest were presented together with 11 other questionnaires, both
of our own and from other researchers, that were unrelated to the current study. After providing
informed consent participants completed the measures, including the two newly developed ques-
tionnaires of smartphone use, along with four scales measuring inattention: the Attention-Related
Cognitive Errors (ARCES), the Mindful Attention Awareness Scale - Lapses Only (MAAS-LO),
as well as the spontaneous (MWS) and deliberate mind-wandering (MWD) scales. The
smartphone and inattention measures were presented in random order and the order of the ques-
tions within each scale was randomized as well.1
1 The inattention measures were used in a separate study that ran concurrently during Study 1. We visually inspected
the data to ensure that Study 1 only included those participants who were answering the inattention scales for the
first time.

9
Results
The results of the present study are described in three sections. In the first section we de-
scribe the psychometric properties of our measures, with a specific focus on the new measures of
smartphone use (SUQ-G and SUQ-A) that we developed. In the second section we analyze the
relation between the smartphone use questionnaires and the measures of inattention (MAAS-LO,
ARCES, MWS, MWD). In the third section, we assess the unique contributions of each type of
smartphone use to the understanding of inattention by conducting a series of regression analyses
using the smartphone questionnaires (SUQ-A and SUQ-G) as simultaneous predictors of each
inattention measure.
Psychometrics. The descriptive statistics corresponding to each of the measures are
shown in Table 1. Both of the new smartphone questionnaires were found to have a good
Cronbach’s alpha (SUQ-G = .78, SUQ-A =.91), indicating the questionnaires had internal con-
sistency. The questionnaires also had reasonable values for skewness and kurtosis, indicating a
relatively normal distribution of scores (i.e. skewness < 2 and kurtosis < 4; see Kline, 1998).
Item statistics for each of the smartphone use questionnaires are presented in Table 2.
Table 1 Descriptive statistics for Study 1 (n = 159)
Scale Mean SD Skew Kurtosis α
SUQ-A 4.55 1.15 -.05 -.27 .90
SUQ-G 4.73 .88 -.05 -.24 .77
MAAS-LO 3.43 .72 -.01 .68 .85
ARCES 3.02 .63 .54 .70 .89
MWS 4.62 1.28 -.44 .12 .90
MWD 4.90 1.30 -.18 -.49 .91
Skew S.E. = .19 Kurtosis SE = .38
10
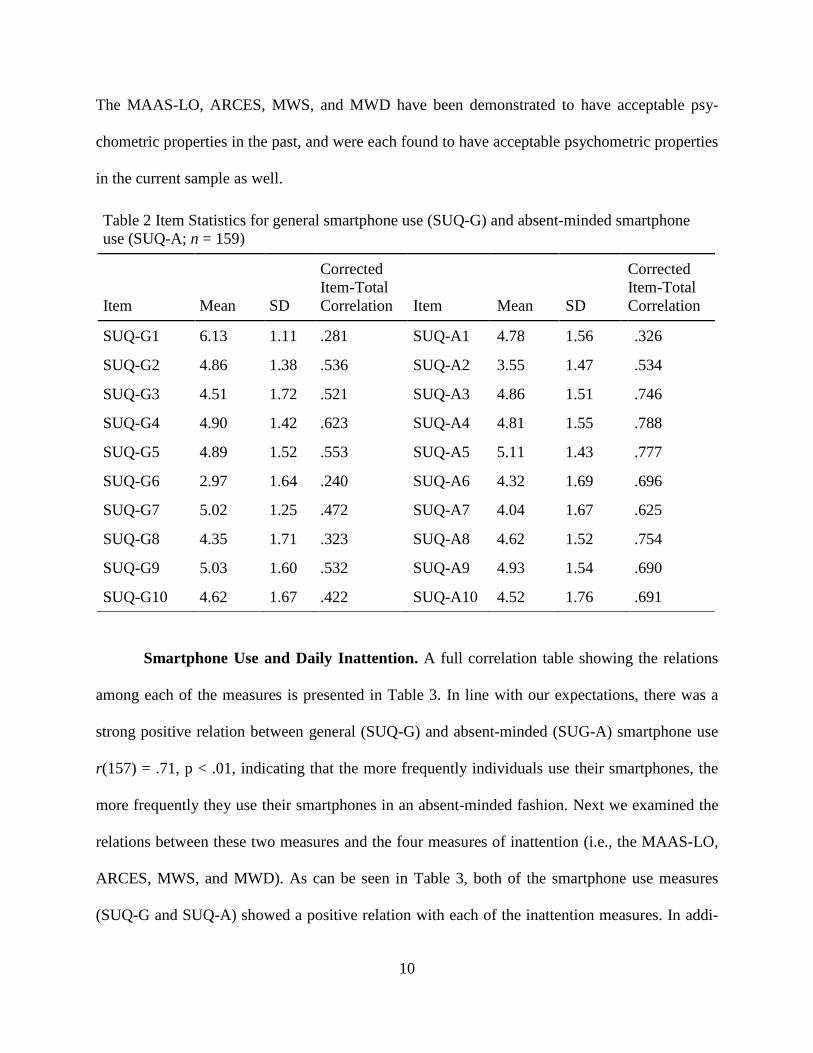
The MAAS-LO, ARCES, MWS, and MWD have been demonstrated to have acceptable psy-
chometric properties in the past, and were each found to have acceptable psychometric properties
in the current sample as well.
Table 2 Item Statistics for general smartphone use (SUQ-G) and absent-minded smartphone
use (SUQ-A; n = 159)
Item Mean SD
Corrected
Item-Total
Correlation Item Mean SD
Corrected
Item-Total
Correlation
SUQ-G1 6.13 1.11 .281 SUQ-A1 4.78 1.56 .326
SUQ-G2 4.86 1.38 .536 SUQ-A2 3.55 1.47 .534
SUQ-G3 4.51 1.72 .521 SUQ-A3 4.86 1.51 .746
SUQ-G4 4.90 1.42 .623 SUQ-A4 4.81 1.55 .788
SUQ-G5 4.89 1.52 .553 SUQ-A5 5.11 1.43 .777
SUQ-G6 2.97 1.64 .240 SUQ-A6 4.32 1.69 .696
SUQ-G7 5.02 1.25 .472 SUQ-A7 4.04 1.67 .625
SUQ-G8 4.35 1.71 .323 SUQ-A8 4.62 1.52 .754
SUQ-G9 5.03 1.60 .532 SUQ-A9 4.93 1.54 .690
SUQ-G10 4.62 1.67 .422 SUQ-A10 4.52 1.76 .691
Smartphone Use and Daily Inattention. A full correlation table showing the relations
among each of the measures is presented in Table 3. In line with our expectations, there was a
strong positive relation between general (SUQ-G) and absent-minded (SUG-A) smartphone use
r(157) = .71, p < .01, indicating that the more frequently individuals use their smartphones, the
more frequently they use their smartphones in an absent-minded fashion. Next we examined the
relations between these two measures and the four measures of inattention (i.e., the MAAS-LO,
ARCES, MWS, and MWD). As can be seen in Table 3, both of the smartphone use measures
(SUQ-G and SUQ-A) showed a positive relation with each of the inattention measures. In addi-
11
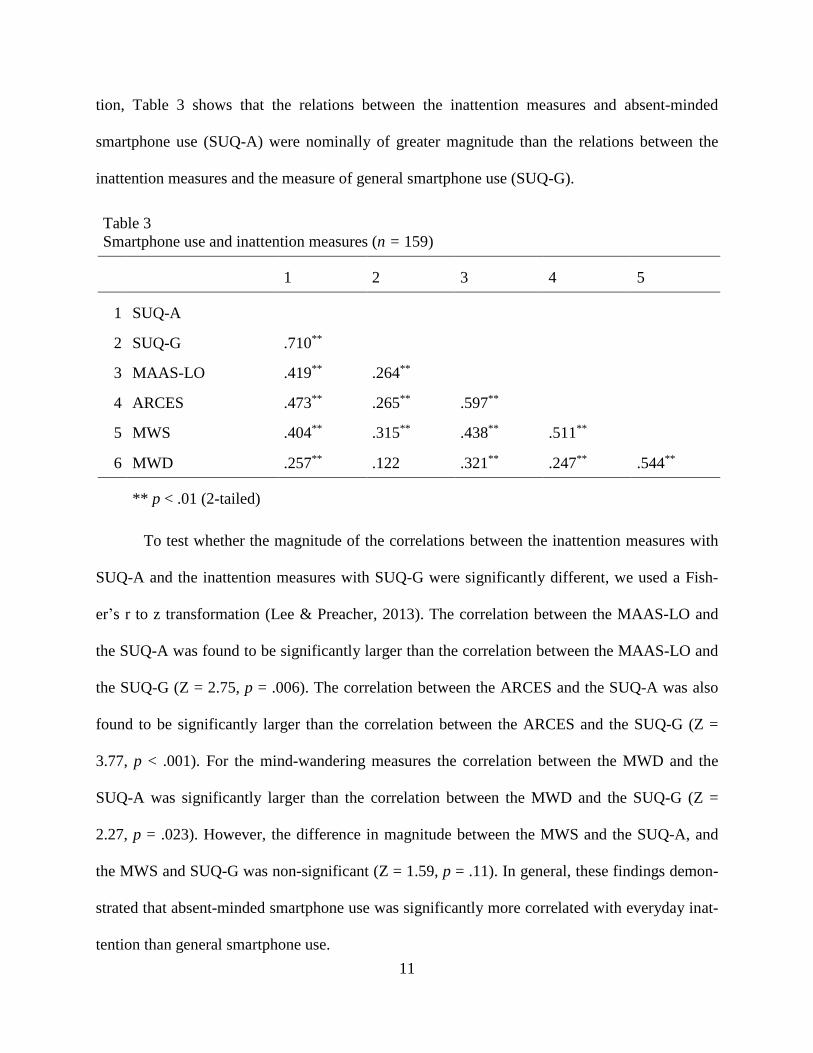
tion, Table 3 shows that the relations between the inattention measures and absent-minded
smartphone use (SUQ-A) were nominally of greater magnitude than the relations between the
inattention measures and the measure of general smartphone use (SUQ-G).
Table 3
Smartphone use and inattention measures (n = 159)
1 2 3 4 5
1 SUQ-A
2 SUQ-G .710**
3 MAAS-LO .419** .264**
4 ARCES .473** .265** .597**
5 MWS .404** .315** .438** .511**
6 MWD .257** .122 .321** .247** .544**
** p < .01 (2-tailed)
To test whether the magnitude of the correlations between the inattention measures with
SUQ-A and the inattention measures with SUQ-G were significantly different, we used a Fish-
er’s r to z transformation (Lee & Preacher, 2013). The correlation between the MAAS-LO and
the SUQ-A was found to be significantly larger than the correlation between the MAAS-LO and
the SUQ-G (Z = 2.75, p = .006). The correlation between the ARCES and the SUQ-A was also
found to be significantly larger than the correlation between the ARCES and the SUQ-G (Z =
3.77, p < .001). For the mind-wandering measures the correlation between the MWD and the
SUQ-A was significantly larger than the correlation between the MWD and the SUQ-G (Z =
2.27, p = .023). However, the difference in magnitude between the MWS and the SUQ-A, and
the MWS and SUQ-G was non-significant (Z = 1.59, p = .11). In general, these findings demon-
strated that absent-minded smartphone use was significantly more correlated with everyday inat-
tention than general smartphone use.

12
Unique Contributions of Smartphone Use. To further investigate the relation between
inattention and the two types of smartphone use we conducted a series of regression analyses.
We predicted each of the inattention measures (MAAS-LO, ARCES, MWS, MWD) using the
SUQ-A and SUQ-G as simultaneous predictors in a linear regression model. Collectively, these
two smartphone measures predicted a significant amount of the variance in each of the measures
of inattention (see Table 4).
Table 4 Multiple regression predicting everyday inattention measures by general smartphone
use, and absent-minded smartphone use (N = 159)
DV IV β t p Zero-order Partial
MAAS-LO
SUQ-G -.10 -.97 .333 .247 -.077
SUQ-A .48 4.52 .001 .405 .339
R = .411, F(2, 157) = 15.97, SE = .659, p < .001
ARCES
SUQ-G -.18 -1.75 .830 .251 -.138
SUQ-A .59 5.75 .001 .460 .417
R = .476, F(2, 157) = 22.97, SE = .557, p < .001
MWS
SUQ-G -.02 -.18 .858 .249 -.014
SUQ-A .37 3.37 .001 .353 .260
R = .354, F(2, 157) = 11.22, SE = 1.21, p = .001
MWD
SUQ-G -.09 -.811 .418 .165 -.065
SUQ-A .35 3.14 .002 .284 .243
R = .291, F(2, 157) = 7.25, SE = 1.26, p = .001

13
As can been seen in Table 4, when the SUQ-A and the SUQ-G are entered as simultaneous pre-
dictors of each of the inattention measures, it is only the SUQ-A that significantly predicted inat-
tention. That is, the unique relation between absent-minded smartphone use and each of the inat-
tention measures was positive, but this was not the case for general smartphone use, which
showed a unique non-significant negative relation to the inattention measures. Furthermore, this
pattern held across all four measures of inattention, suggesting that the relationship between
smartphone use and inattention is driven by absent-minded use, rather than by smartphone use
per se.
Thus far we have shown that absent-minded smartphone use (SUQ-A) is uniquely associated with
each of the inattention measures. However, it is worth considering whether these relations just reflect an
underlying construct of ‘absent-mindedness’ that is related to all measures. Indeed, previous research
has demonstrated that attention lapses (as measured by the MAAS-LO, which is sometimes con-
strued as a measure of absent-mindedness) are related to measures of everyday attention errors
(Cheyne et al., 2006), as well as deliberate and spontaneous mind-wandering (Carriere et al.,
2013; Ralph et al., 2014). To address this issue we conducted a set of hierarchical regressions,
using the MAAS-LO and the SUQ-A as predictors of the remaining inattention measures (ARC-
ES, MWS and MWD). First, we sought to determine whether the SUQ-A uniquely predicted
scores on the ARCES (over and above the variance accounted for by the MAAS-LO, construed
as a measure of absent-mindedness). In Step 1 we used scores on the MAAS-LO to predict
scores on the ARCES, and found that it was a significant predictor of attention-related errors (see
Table 5). In Step 2 we added the SUQ-A, which predicted unique variance in the ARCES, above
and beyond that predicted by the MAAS-LO (see Table 5). Using the same hierarchy, we pre-
dicted scores on the MWS and the MWD. The SUQ-A accounted for unique variance in the
MWS (see Table 6), but fell short of predicting unique additional variance in the MWD (see Ta-
14
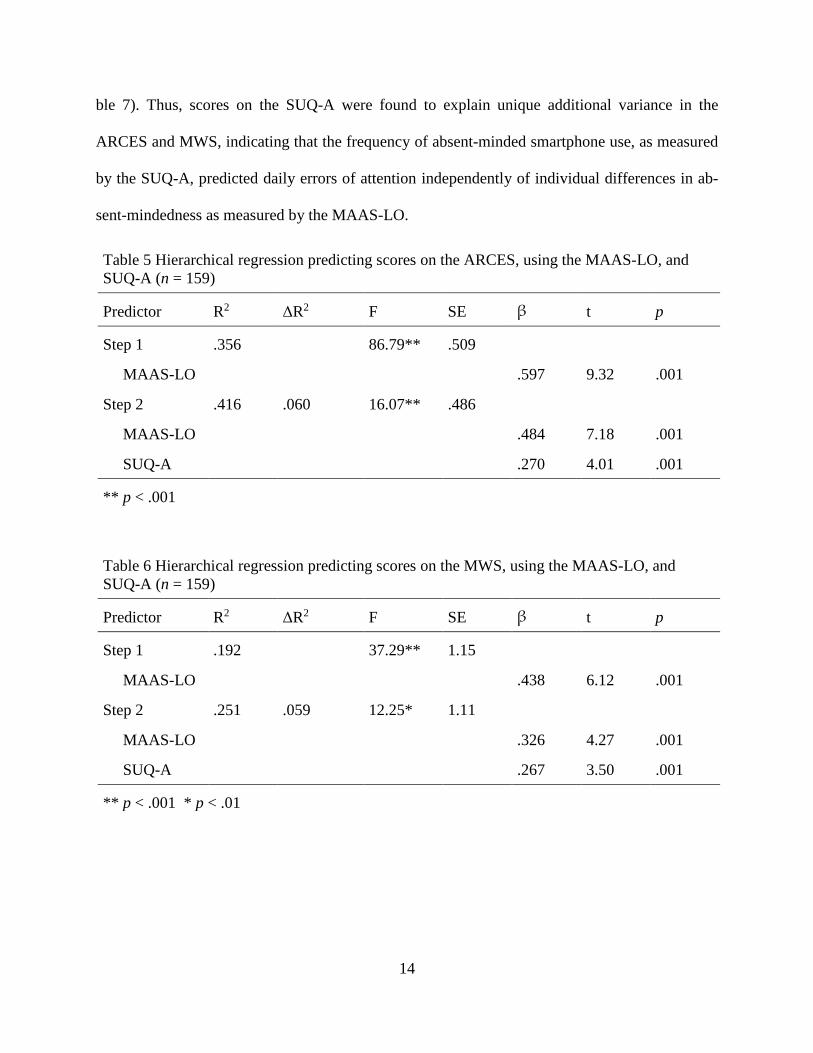
ble 7). Thus, scores on the SUQ-A were found to explain unique additional variance in the
ARCES and MWS, indicating that the frequency of absent-minded smartphone use, as measured
by the SUQ-A, predicted daily errors of attention independently of individual differences in ab-
sent-mindedness as measured by the MAAS-LO.
Table 5 Hierarchical regression predicting scores on the ARCES, using the MAAS-LO, and
SUQ-A (n = 159)
Predictor R2 ΔR2 F SE β t p
Step 1 .356 86.79** .509
MAAS-LO .597 9.32 .001
Step 2 .416 .060 16.07** .486
MAAS-LO .484 7.18 .001
SUQ-A .270 4.01 .001
** p < .001
Table 6 Hierarchical regression predicting scores on the MWS, using the MAAS-LO, and
SUQ-A (n = 159)
Predictor R2 ΔR2 F SE β t p
Step 1 .192 37.29** 1.15
MAAS-LO .438 6.12 .001
Step 2 .251 .059 12.25* 1.11
MAAS-LO .326 4.27 .001
SUQ-A .267 3.50 .001
** p < .001 * p < .01

15
Table 7 Hierarchical regression predicting scores on the MWS, using the MAAS-LO, and
SUQ-A (n = 159)
Predictor R2 ΔR2 F SE β t p
Step 1 .103 18.10** 1.23
MAAS-LO .321 4.25 .001
Step 2 .121 .018 3.21 1.23
MAAS-LO .259 3.214 .002
SUQ-A .148 1.79 .075
** p < .001
In summary, these results demonstrated that each of the newly developed smartphone
measures had strong psychometric properties, which allowed us to assess the relation between
these scales and the measures of inattention with confidence. We observed a strong, positive cor-
relation between the scores on the SUQ-G and the SUQ-A, indicating that those who use their
smartphone more often also tend to use it more absent-mindedly. Additionally, both types of
smartphone use were found to be positively correlated with four distinct measures of inattention.
Nevertheless, the correlations with absent-minded smartphone use were generally of significant-
ly greater magnitude, suggesting this behaviour may be a more important variable for under-
standing everyday inattention. Further, the correlation between smartphone use and inattention
appears to be driven by absent-minded use, rather than smartphone use in general, as demon-
strated by our first set of regressions. Importantly, the frequency of absent-minded smartphone
use predicted everyday attention errors and spontaneous mind-wandering independently of indi-
vidual differences in absent-mindedness, confirming that our measure of absent-minded
smartphone use was not simply redundant with our measure of general absent-mindedness.

16
Study 2
In Study 2 we sought to replicate the results of Study 1 in a more diverse sample, particu-
larly with a greater age-range of participants. Younger populations tend to be more engaged with
smartphones and new technologies in general, compared to older adults, and recent data from the
Pew Research Centre (Poushter, 2016) indicates that this trend has continued. Furthermore, pre-
vious research has demonstrated improvements in sustained attention as people age, both behav-
iourally (showing slower RTs and fewer errors on the SART) and via self-report (Cheyne et al.,
2006; Carriere, Cheyne, Solman, & Smilek, 2010; Cheyne, Carriere, & Smilek, 2013), as well as
reductions in mind-wandering and daydreaming in daily life (Giambra, 1979-80) and in the la-
boratory (Maillet & Rajah, 2013; Jackson & Balota, 2012; Giambra, 1989). Replicating our find-
ings in a larger and more diverse sample allows us to be more confident our results will general-
ize across smartphone users.
Method
Participants. Two hundred and fifty participants were recruited from Amazon Mechani-
cal Turk, and provided with 60 cents for completing a survey approximately five minutes in
length. There was a relatively even distribution of males and females. Participant age ranged
from 19 to 72 years, with mean age of 36.15 (SD = 11.61), thus satisfying our desire to have a
broader age range than is typical in student samples (see Appendix B for additional demographic
information). Following data collection, we ran a script to remove any participants who had not
completed the survey. Seven participants were removed from the dataset after failing an attention
check (see below for details), while eight participants were removed after indicating that they
had responded randomly during the survey, and an additional four were removed for both rea-
sons. Two participants were removed because they indicated they did not own smartphones.

17
Three participants who did not indicate their age were removed as well, leaving us with a total of
226 participants (128 Males)2.
Measures. All measures (SUQ-G, SUQ-A, MAAS-LO, ARCES, MWS, MWD) were in-
cluded and used as per Study 1.
Demographic Survey. In Study 2 participants were also asked to complete a brief de-
mographics survey following their completion of the other measures. Participants were asked to
fill out questions regarding their age, education level and status, income, smartphone ownership,
employment status, English fluency, and gender.
Attention Check Questions. In Study 2 we included two attention check questions at the
end of the survey. The first asked participants how they spent their spare time, and presented a
list of hobbies. Participants who read to the end of the question instructions would know to select
‘other’ and type “I have read the instructions”. The second attention check asked participants to
indicate whether they had answered any part of the survey randomly. Participants were assured
their answer would not affect whether they received their remuneration.
Procedure. After participants provided informed consent, they completed the SUQ-A,
SUQ-G, ARCES, MAAS-LO, MWS, and MWD. The questionnaires, and the items within them,
were presented in a randomized order to each participant. Following completion of these
measures participants were asked to fill out the demographics survey (see Appendix 2). Prior to
completion of the survey, participants were presented with an attention check question, and
asked to indicate (without penalty) whether they had responded randomly during the course of
the experiment.
2 Three participants indicated the same value for their age and gender (i.e. “Age in Years: 29” “Gender: 29”). These
participants were included in all analyses, as Gender was not one of the variables of interest.

18
Results
Psychometrics. We conducted reliability analyses on each of the measures included in
the experiment. The smartphone questionnaires were once again highly reliable in this sample
(SUQ-G = .83, SUQ-A = .93). Each of the inattention measures was once again demonstrated to
have good psychometric properties and good reliability, with Cronbach’s alpha ranging from .90
to .93. Full statistics for each measure are presented in Table 8, and statistics for the individual
items of the SUQ-G and SUQ-A are presented in Table 9.
Smartphone Use and Daily Inattention. We first conducted a correlational analysis to
replicate the results of Study 1, now controlling for each measures’ relation with age. As can be
seen in Table 10, controlling for age did not change the pattern of correlations between
smartphone use and inattention. In either case, the correlations showed the same pattern as in
Study 1. SUQ-A and SUQ-G were once again shown to be highly positively correlated, and both
showed a significant positive correlation with each of the inattention measures. As in Study 1,
the correlations between inattention and absent-minded smartphone use were larger than those
with general smartphone use. We compared the magnitude of the correlations between each
Table 8 Descriptive statistics for Study 2 (n = 226)
Mean SD Skew Kurtosis α
SUQ-A 3.83 1.42 .08 -.90 .94
SUQ-G 4.38 1.04 .04 -.43 .83
MAAS-LO 2.68 .94 -.04 -.77 .92
ARCES 2.51 .64 .17 .25 .90
MWS 3.51 1.53 .06 -.59 .91
MWD 4.12 1.51 -.33 -.50 .93
Skew SE = .16 Kurtosis SE = .32

19
Table 9 Item Statistics for general smartphone use (SUQ-G) and absent-minded smartphone
use (SUQ-A; n = 226)
Item Mean SD
Corrected
Item-Total
Correlation Item Mean SD
Corrected
Item-Total
Correlation
SUQ-G1 5.56 1.39 .392 SUQ-A1 4.58 1.62 .534
SUQ-G2 4.58 1.43 .624 SUQ-A2 3.31 1.59 .682
SUQ-G3 3.87 1.85 .584 SUQ-A3 4.04 1.86 .867
SUQ-G4 4.52 1.50 .662 SUQ-A4 3.91 1.83 .891
SUQ-G5 3.92 1.77 .578 SUQ-A5 4.40 1.71 .804
SUQ-G6 3.98 1.90 .326 SUQ-A6 3.49 1.84 .759
SUQ-G7 4.83 1.39 .580 SUQ-A7 3.26 1.73 .781
SUQ-G8 3.99 1.72 .433 SUQ-A8 3.72 1.83 .844
SUQ-G9 4.15 1.73 .630 SUQ-A9 4.14 1.70 .750
SUQ-G10 4.43 1.59 .512 SUQ-A10 3.47 1.72 .748
inattention measure and the SUQ-A with the magnitude of the correlations between each inatten-
tion measure and the SUQ-G, controlling for age, using a Fisher’s r to z transformation (Lee and
Preacher, 2013). The correlation between the MAAS-LO and the SUQ-A was significantly larger
the correlation between the MAAS-LO and the SUQ-G (Z = 6.025, p < .001, 2-tailed). The cor-
relation between the ARCES and the SUQ-A was significantly larger than the correlation be-
tween the ARCES and the SUQ-G (Z = 5.087, p < .001, 2-tailed). Further, the correlation be-
tween the MWS and the SUQ-A was also significantly larger than the correlation between the
MWS and the SUQ-G (Z = 6.007, p < .001, 2-tailed). Finally, the correlation between the MWD
and the SUQ-A was significantly larger than the correlation between the MWD and the SUQ-G
(Z = 2.424, p < .05, 2-tailed). These findings replicated the pattern from Study 1 and demonstrat-
ed that absent-minded smartphone use was significantly more related to daily inattention than
was general smartphone use.
20
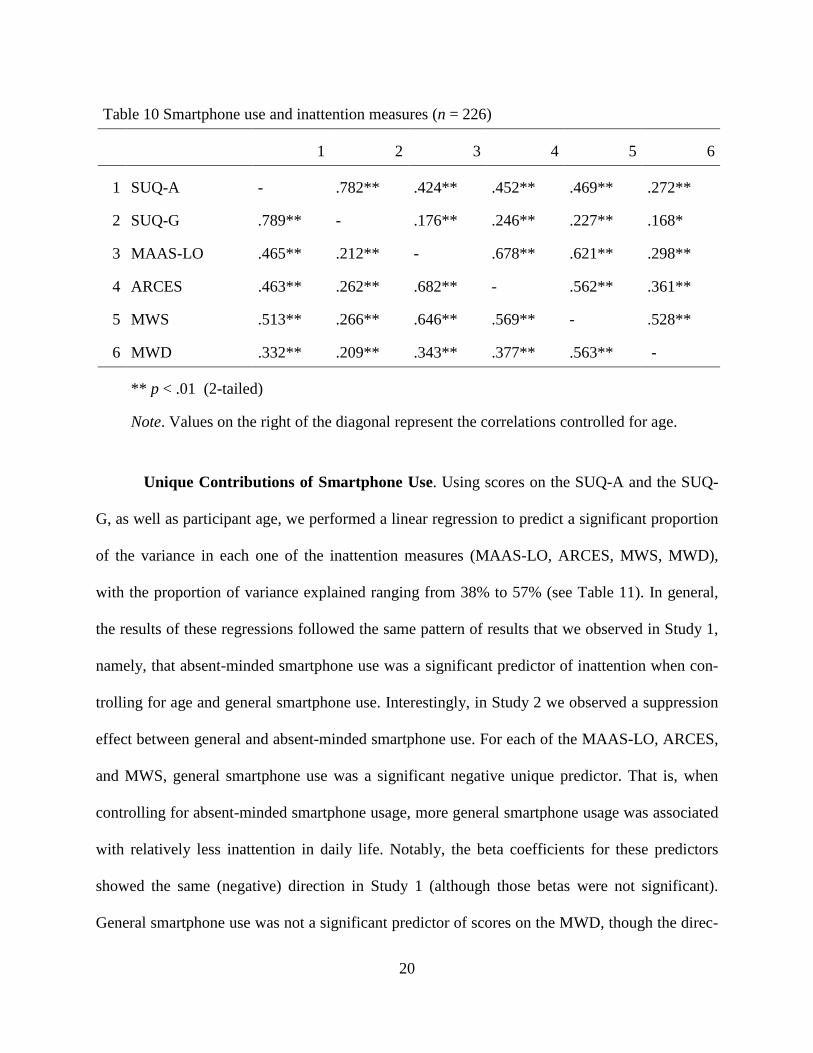
Table 10 Smartphone use and inattention measures (n = 226)
1 2 3 4 5 6
1 SUQ-A - .782** .424** .452** .469** .272**
2 SUQ-G .789** - .176** .246** .227** .168*
3 MAAS-LO .465** .212** - .678** .621** .298**
4 ARCES .463** .262** .682** - .562** .361**
5 MWS .513** .266** .646** .569** - .528**
6 MWD .332** .209** .343** .377** .563** -
** p < .01 (2-tailed)
Note. Values on the right of the diagonal represent the correlations controlled for age.
Unique Contributions of Smartphone Use. Using scores on the SUQ-A and the SUQ-
G, as well as participant age, we performed a linear regression to predict a significant proportion
of the variance in each one of the inattention measures (MAAS-LO, ARCES, MWS, MWD),
with the proportion of variance explained ranging from 38% to 57% (see Table 11). In general,
the results of these regressions followed the same pattern of results that we observed in Study 1,
namely, that absent-minded smartphone use was a significant predictor of inattention when con-
trolling for age and general smartphone use. Interestingly, in Study 2 we observed a suppression
effect between general and absent-minded smartphone use. For each of the MAAS-LO, ARCES,
and MWS, general smartphone use was a significant negative unique predictor. That is, when
controlling for absent-minded smartphone usage, more general smartphone usage was associated
with relatively less inattention in daily life. Notably, the beta coefficients for these predictors
showed the same (negative) direction in Study 1 (although those betas were not significant).
General smartphone use was not a significant predictor of scores on the MWD, though the direc-

21
tion of the relation remained negative, as was the case in Study 1. Unlike the other inattention
measures, scores on the MWD were found to be significantly negatively predicted by participant
age. This result is in line with previous research suggesting that mind-wandering decreases with
age (Giambra, 1977-78, 1979-80; Maillet & Rajah, 2013).
Table 11 Multiple regression predicting everyday inattention by general smartphone use, ab-
sent-minded smartphone use, and participant age (n = 226)
DV IV β t p Zero-order Partial
MAAS-LO
Age -.08 -1.41 .160 -.240 -.09
SUQ-G -.40 -4.29 .001 .212 -.277
SUQ-A .75 7.88 .001 .465 .468
R = .535, F(3, 222) = 29.70, SE = .798, p < .001
ARCES
Age .04 0.71 .480 -.117 .047
SUQ-G -0.28 -2.95 .003 .262 -.194
SUQ-A .70 7.10 .001 .463 .430
R = .495, F(3, 222) = 24.00, SE = .600, p < .001
MWS
Age -.11 -1.82 .070 -.272 -.121
SUQ-G -.35 -3.90 .001 .266 -.253
SUQ-A .76 8.15 .001 .513 .480
R = .569, F(3, 222) = 35.45, SE = 1.27, p < .001
MWD
Age -.18 -2.76 .006 -.271 -.182
SUQ-G -.11 -1.12 .262 .209 -.075
SUQ-A .37 3.50 .001 .332 .229
R = .383, F(3, 222) = 12.75, SE = 1.41, p < .001

22
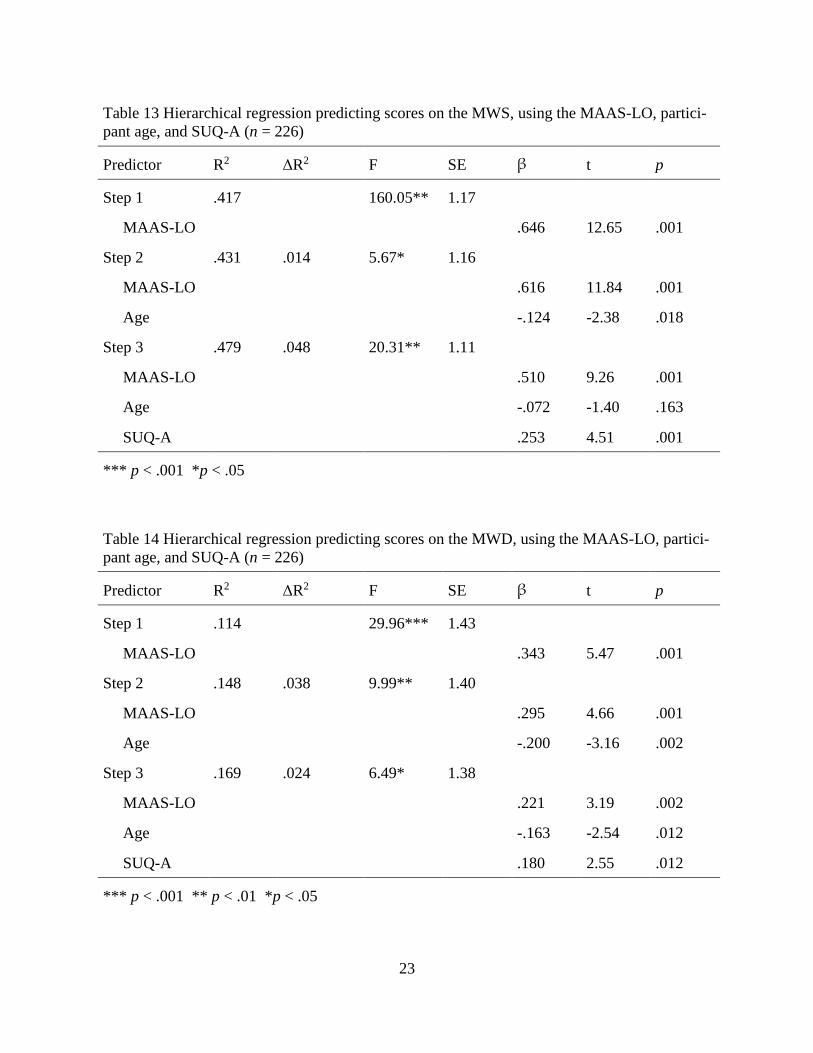
As in our analyses of Study 1, we next conducted a hierarchical regression to determine
whether the SUQ-A could predict scores on inattention measures (ARCES, MWS, MWD) above
and beyond the MAAS-LO, as was the case in Study 1. The MAAS-LO has previously been
demonstrated to be predictive of scores on the other measures of inattention. To remind, the pur-
pose of these analyses was to determine whether the SUQ-A is just an alternative measure of ab-
sent-mindedness, or whether there is a unique contribution of absent-minded smartphone use,
over and above absent-mindedness in general. In the first step we predicted inattention using the
MAAS-LO, the second step added participant age, as both these measures have been previously
established to relate to attention. In step three we included the SUQ-A. For each of the criterion
variables (ARCES, MWS, MWD) the SUQ-A was found to explain a significant amount of vari-
ance above and beyond the MAAS-LO and participant age, as indicated by the change in R2 val-
ue (see Tables 12-14). This suggests that absent-minded smartphone use is independently related
Table 12 Hierarchical regression predicting scores on the ARCES, using the MAAS-LO, par-
ticipant age, and SUQ-A (n = 226)
Predictor R2 ΔR2 F SE β t p
Step 1 .465 194.37** .469
MAAS-LO .68 13.94 .001
Step 2 .467 .002 0.95 .469
MAAS-LO .69 13.76 .001
Age .049 .97 .33
Step 3 .499 .033 14.44** .456
MAAS-LO .61 11.23 .001
Age .092 1.84 .067
SUQ-A .21 3.80 .001
** p < .001
23
Table 13 Hierarchical regression predicting scores on the MWS, using the MAAS-LO, partici-
pant age, and SUQ-A (n = 226)
Predictor R2 ΔR2 F SE β t p
Step 1 .417 160.05** 1.17
MAAS-LO .646 12.65 .001
Step 2 .431 .014 5.67* 1.16
MAAS-LO .616 11.84 .001
Age -.124 -2.38 .018
Step 3 .479 .048 20.31** 1.11
MAAS-LO .510 9.26 .001
Age -.072 -1.40 .163
SUQ-A .253 4.51 .001
*** p < .001 *p < .05
Table 14 Hierarchical regression predicting scores on the MWD, using the MAAS-LO, partici-
pant age, and SUQ-A (n = 226)
Predictor R2 ΔR2 F SE β t p
Step 1 .114 29.96*** 1.43
MAAS-LO .343 5.47 .001
Step 2 .148 .038 9.99** 1.40
MAAS-LO .295 4.66 .001
Age -.200 -3.16 .002
Step 3 .169 .024 6.49* 1.38
MAAS-LO .221 3.19 .002
Age -.163 -2.54 .012
SUQ-A .180 2.55 .012
*** p < .001 ** p < .01 *p < .05

24
to everyday attention-related errors and lapses, as well as spontaneous and deliberate forms of
mind-wandering, over and above trait differences in absent-mindedness.
Discussion
The results of Study 2 replicated and extended the findings from Study 1. We observed a
strong positive correlation between the scores on the SUQ-G and the SUQ-A, once again indicat-
ing that those who use their smartphone more often also tend to use it more absent-mindedly.
Further, while both types of smartphone use were positively correlated with inattention and at-
tention-related errors, regressions analyses suggest that this relationship is driven by absent-
minded, rather than general, smartphone use. Of particular interest was the suppression effect.
While greater absent-minded smartphone use predicted relatively more daily inattention,
smartphone use in general predicted relatively less daily inattention, when controlling for absent-
minded use. Absent-minded smartphone use also predicted additional unique variance in the
three measures of daily inattention independently of individual tendencies toward absent-
mindedness. Thus, in Study 2 the results followed a similar pattern as was observed in Study 1.
This occurred despite having a wider age range.

25
Concluding Comments
A review of the smartphone-use literature certainly paints a negative picture of how these
devices might influence cognition (Hyman et al, 2009; Strayer, 2015; Gill et al, 2012; Barr et al.,
2015). Indeed, it seems reasonable to suspect that one’s general propensity to use smartphones
might be related to one’s propensity to experience episodes of inattention in everyday situations.
For example, perhaps smartphones create more opportunities for distraction, erode our attention-
al mechanisms, or acclimatize us to preferring brief windows of engagement. Given that much
prior work has focused on in-the-moment consequences of smartphone use (i.e., state-level
measures; e.g., while using a driving simulator; Strayer & Johnston, 2001; Strayer et al., 2003;
Strayer et al., 2006), here we adopted an individual differences approach to investigate the rela-
tion between the frequency of smartphone use and everyday experiences of attention (at a broad-
er, trait-level). At the same time, we explored whether it is the frequency of general smartphone
use that predicts experiences of inattention, or a particular type of use that explains the relation
with inattention – namely, absent-minded use of a smartphone.
Our approach led us to four interesting findings: (1) at the trait-level, the overall tendency
to use smartphones more generally, as well as absent-mindedly, positively predicts the likelihood
of experiencing episodes of inattention in everyday situations (i.e., not constrained to in-the-
moment dual-task costs); (2) the relation between absent-minded smartphone use and experienc-
es of inattention was consistently larger than that of general smartphone use with inattention; (3)
when controlling for the shared variance between general and absent-minded smartphone use,
the general propensity to use smartphones either has no relation with inattention (Study 1), or
negatively predicts experiences of inattention (Study 2). That is, in at least one of our samples we
found that when controlling for absent-minded use, individuals who use their smartphone more
26
also reported experiencing less inattention in everyday situations. Lastly, (4) when controlling
for the shared association between general and absent-minded smartphone use, the tendency to
use smartphones absent-mindedly had a pervasively strong and unique positive relation with all
of our measures of inattention. Thus, findings from Studies 1 and 2 support a more nuanced con-
ceptualization of the link between smartphone use and inattention than the one presented by con-
struals of smartphone use as a unitary construct. That is, it is the absent-minded use of
smartphones that drives the apparent relation between smartphone use and experiences of inat-
tention.
Findings presented here highlight the importance of distinguishing between different
types of smartphone-use behaviours. Often, researchers have inquired about the overall tendency
to use smartphones, and how this general use is related to a variety of other behaviours such as
reasoning (Barr et al., 2015), impulse control (Wilmer & Chein, 2016), and even mental illness
such as depression (Becker, Alzahabi, & Hopwood, 2013). Like our initial finding that general
smartphone use predicted experiences of inattention, it is possible other previously documented
relations may be better explained, or even reversed (as in our Study 2), once a particular type of
smartphone behaviour (like absent-minded use) is taken into account.
Our finding that absent-minded smartphone use is the driving force relating smartphone
use to inattention is open to two possible causal interpretations. On the one hand, a troubling
possibility is that using smartphones absent-mindedly may make us interact with other aspects of
the world in an absent-minded fashion. According to this view, absent-minded smartphone use
increases our propensity to experience other episodes of inattention in daily life, possibly by
causing the deterioration of top down mechanisms that support sustained attention. possibly
through causing the deterioration of top down attention control mechanisms. If this is the case,

27
then despite the rather bleak association between absent-minded smart phone use and attention
problems, there may yet be a silver lining. Those wishing to mitigate the supposed attention
damage caused by smartphones only need to curtail a particular behaviour, their absent-minded
usage, rather abandon their smartphone entirely. On the other hand, a much more benign expla-
nation is that absent-minded people simply engage with the world, and therefore devices in the
world, absent-mindedly. Whether it be a smartphone, a laptop, or a pocket-watch, absent-minded
use of any particular device may reflect an underlying general propensity of that individual to be
absent-minded. If this second possibility is the case, then the relation between smartphone use
and inattention observed in the present study, suggest that such devices may be a poor choice for
absent/inattentive individuals. Imagine the absent-minded individual who purchases a
smartphone to get organized and become more efficient, yet has instead simply enabled them-
selves to behave absent-mindedly in a new domain. An interesting possible avenue for future re-
search may be to examine how the design of smartphone apps and operating systems may inter-
act with certain personality variables to reduce or promote absent-minded usage. These two pos-
sibilities reflect an important element in the broader debate as to whether technology is eroding
or somehow shaping our cognitive mechanisms. Indeed, similar concerns have arisen in other
areas as well, for example, whether media multitasking is leading to poorer executive functions
(Loh & Kanai, 2014; Ophir et al., 2009), or whether computers and access to the internet is caus-
ing us to be mentally lazier than we were before their mainstream use (Carr, 2010).
Future directions for this work include investigating which of these two causal interpreta-
tions may better explain the relation between absent-minded smartphone use and inattention in
everyday life. One way to shed light on the causal direction may be through longitudinal studies.
Examining inattention across time among those adopting their first smartphone may provide in-

28
sights into whether smartphone use may lead to greater inattentiveness in general. Such ap-
proaches have been advocated before, with the acknowledgement that the window of opportunity
for conducting such studies is shrinking (Barr et al, 2015). If the number of adults using
smartphones in the United States is any indication (Anderson, 2015), researchers may find that
this window has already closed. Another possibility may be a longitudinal study of child popula-
tions. Such studies would require a control group to account for the confounding variable of bio-
logical maturation, and maintaining the ‘smartphone-free’ control group may not be feasible. A
more fruitful strategy may be to observe whether any attentional benefits are conferred by the
reduction of smartphone use, and of absent-minded use in particular, rather looking for increases
in inattentiveness following the adoption of a smartphone. One such example of this approach
would be an intervention study that examines whether the promotion of mindful smartphone use
(i.e one aimed at reducing absent-minded smartphone use specifically) leads to a corresponding
reduction in inattentiveness in everyday life.
We end by summarizing our work in the context of a recent claim made in the popular
press – that smartphone use has caused the human attention span to shrink, such that “…even a
goldfish can hold a thought for longer” (Watson, 2015). On the surface, by looking at the raw
correlation between smartphone use and inattention, one might incorrectly believe statements
such as these to be true. However, when considering a more nuanced perspective, that different
ways of engage with smartphones might matter, we arrive at a very different conclusion. Here,
we conclude that it is not the general use of a smartphone per se that is linked with inattention.
Rather, it is the propensity to use smartphones in an absent-minded manner that predict the ten-
dency to experience other forms of inattention.
29
References
Anderson, M. (2015). Technology Device Ownership: 2015. Pew Research Center, Washington,
D.C. (October 29th). Retrieved from http://pewinternet.org
Associated Press (2016, April 12). German rail dispatcher ‘playing mobile phone game’ before
train crash. The Guardian. Retrieved from https://www.theguardian.com
Barr, N., Pennycook, G., Stolz, J. A., & Fugelsang, J. A. (2015). The brain in your pocket: Evi-
dence that Smartphones are used to supplant thinking. Computers in Human Behavior, 48,
473.
Becker, M. W., Alzahabi, R., & Hopwood, C. J. (2013). Media multitasking is associated with
symptoms of depression and social anxiety. Cyberpsychology, Behavior and Social Net-
working, 16(2), 132. doi:10.1089/cyber.2012.0291
Brown, K. W., & Ryan, R. M. (2003). The Benefits of Being Present: Mindfulness and Its Role
in Psychological Well-Being. Journal of Personality and Social Psychology, 84(4), 822-
848. doi:10.1037/0022-3514.84.4.822
Cain, M. S., & Mitroff, S. R. (2011). Distractor Filtering in Media Multitaskers. Perception,
40(10), 1183-1192. doi:10.1068/p7017
Carr, N. (2011). The Shallows: What the Internet is doing to our brains (First ed.). New York,
N.Y.: W.W. Norton & Company, Inc.
Carriere, J. S. A., Cheyne, J. A., Solman, G. J. F., & Smilek, D. (2010). Age Trends for Failures
of Sustained Attention. Psychology and Aging, 25(3), 569-574. doi:10.1037/a0019363

30
Carriere, J. S. A., Seli, P., & Smilek, D. (2013). Wandering in Both Mind and Body: Individual
Differences in Mind Wandering and Inattention Predict Fidgeting. Canadian Journal of Ex-
perimental Psychology/Revue Canadienne De Psychologie Expérimentale, 67(1), 19-31.
doi:10.1037/a0031438
Carriere, J. S. A., Cheyne, J. A., & Smilek, D. (2008). Everyday attention lapses and memory
failures: The affective consequences of mindlessness. Consciousness and Cognition, 17(3),
835-847. doi:10.1016/j.concog.2007.04.008
Cheyne, J. A., Carriere, J. S. A., & Smilek, D. (2006). Absent-mindedness: Lapses of conscious
awareness and everyday cognitive failures. Consciousness and Cognition, 15(3), 578-592.
doi:10.1016/j.concog.2005.11.009
Cheyne, J. A., Carriere, J. S. A., & Smilek, D. (2013). Age Differences in Attention Lapses Mask
Age Differences in Memory Failures: A Methodological Note on Suppression. Frontiers in
Psychology, 4 doi:10.3389/fpsyg.2013.00099
Delzo, J. (2016, July 16). Men fall from cliff playing Pokémon Go. CNN. Retrieved from
http://www.cnn.com/2016/07/15/health/pokemon-go-players-fall-down-cliff/
Giambra, L. M. (1979-1980). Sex differences in daydreaming and related mental activity from
the late teens to the early nineties. International Journal of Aging & Human Development,
10(1), 1--34.
Giambra, L. M. (1989). Task- Unrelated- Thought Frequency as a Function of Age: A Laborato-
ry Study. Psychology and Aging, 4(2), 136-143. doi:10.1037/0882-7974.4.2.136

31
Gill, P. S., Kamath, A., & Gill, T. S. (2012). Distraction: An assessment of smartphone usage in
health care work settings. Risk Management and Healthcare Policy, 5, 105-114.
doi:10.2147/RMHP.S34813
Halamka, J. (2011). Order interrupted by text: Multi-tasking mishap. Retrieved from
https://psnet.ahrq.gov/webmm/case/257.
Hyman, I. E., Boss, S. M., Wise, B. M., Mckenzie, K. E., & Caggiano, J. M. (2010). Did you see
the unicycling clown? Inattentional blindness while walking and talking on a cell phone.
Applied Cognitive Psychology, 24(5), 597-607. doi:10.1002/acp.1638
Jackson, J. D., & Balota, D. A. (2012). Mind- Wandering in Younger and Older Adults: Con-
verging Evidence From the Sustained Attention to Response Task and Reading for Compre-
hension. Psychology and Aging, 27(1), 106-119. doi:10.1037/a0023933
Junco, R., & Cotten, S. R. (2012). No A 4 U: The Relationship between Multitasking and Aca-
demic Performance. Computers & Education, (2), 505-514.
doi:10.1016/j.compedu.2011.12.023
Kline, R. B. (1998). Principles and practice of structural equation modelling. New York: Guil-
ford Press.
Lin, L. (2009). Breadth- biased versus focused cognitive control in media multitasking behav-
iors. Proceedings of the National Academy of Sciences of the United States of America,
106(37), 15521-15522. doi:10.1073/pnas.0908642106

32
Loh, K. K., & Kanai, R. (2014). Higher media multi-tasking activity is associated with smaller
gray- matter density in the anterior cingulate cortex. PloS One, 9(9), e106698.
doi:10.1371/journal.pone.0106698
National Safety Council. (2013). Annual estimate of cell phone crashes 2013. Retrieved from
http://www.nsc.org/DistractedDrivingDocuments/CPK/Attributable-Risk-Summary.pdf.
Maillet, D., & Rajah, M. N. (2013). Age- related changes in frequency of mind- wandering and
task- related interferences during memory encoding and their impact on retrieval. Memory,
doi:10.1080/09658211.2012.761714
Ophir, E., Nass, C., & Wagner, A. D. (2009). Cognitive control in media multitaskers. Proceed-
ings of the National Academy of Sciences of the United States of America, 106(37), 15583-
15587. doi:10.1073/pnas.0903620106
Oulasvirta, A., Rattenbury, T., Ma, L., & Raita, E. (2012). Habits make smartphone use more
pervasive. Personal and Ubiquitous Computing, 16(1), 105-114. doi:10.1007/s00779-011-
0412-2
Poushter, J. (2016) Smartphone ownership and internet use continues to climb in emerging econ-
omies. Pew Research Center, Washington, D.C. (February 22nd). Retrieved from
http://pewglobal.org.
Ralph BC, Thomson DR, Cheyne JA, Smilek D (2013) Media multitasking and failures of atten-
tion in everyday life. Psychological research, 78(5), 661–669.
http://dx.doi.org/10.1007/s00426-013-0523-7
33
Seli, P., Carriere, J., & Smilek, D. (2015). Not all mind wandering is created equal: dissociating
deliberate from spontaneous mind wandering. Psychological Research, 79(5), 750-758.
doi:10.1007/s00426-014-0617-x
Seli, P., Risko, E. F., & Smilek, D. (2016). Assessing the associations among trait and state lev-
els of deliberate and spontaneous mind wandering. Consciousness and Cognition, 41, 50-56.
doi:10.1016/j.concog.2016.02.002
Shelton, J. T., Elliott, E. M., Eaves, S. D., & Exner, A. L. (2009). The distracting effects of a
ringing cell phone: An investigation of the laboratory and the classroom setting. Journal of
Environmental Psychology, 29(4), 513-521. doi:10.1016/j.jenvp.2009.03.001
Smith, T. D., Darling, E., & Searles, B. (2011). 2010 Survey on cell phone use while performing
cardiopulmonary bypass. Perfusion, 26(5), 375-380. doi:10.1177/0267659111409969
Strayer, D. L. (2015). Attention and Driving. In J. M. Fawcett, E. F. Risko & A. Kingstone
(Eds.), The Handbook of Attention (pp. 423-442) The MIT Press.
Strayer, D. L., Drews, F. A., & Johnston, W. A. (2003). Cell Phone- Induced Failures of Visual
Attention During Simulated Driving. Journal of Experimental Psychology: Applied, 9(1),
23-32. doi:10.1037/1076-898X.9.1.23
Strayer, D. L., & Johnston, W. A. (2001). Driven to distraction: dual- task studies of simulated
driving and conversing on a cellular telephone. (Research Article). Psychological Science,
12(6), 462.
34
Strayer, D. L., Drews, F. A., & Crouch, D. J. (2006). A comparison of the cell phone driver and
the drunk driver. Human Factors, 48(2), 381.
Reuters. (2008, October 2). Train engineer was texting just before California crash. Reuters. Re-
trieved from http://www.reuters.com.
Wilmer, H., & Chein, J. (2016). Mobile technology habits: patterns of association among device
usage, intertemporal preference, impulse control, and reward sensitivity. Psychonomic Bul-
letin & Review, 23(5), 1607-1614. doi:10.3758/s13423-016-1011-z
Watson, L. (2015, May 15). Humans have shorter attention span than goldfish, thanks to
smartphones. The Telegraph. Retrieved from http://www.telegraph.co.uk.

35
Appendix A
The Smartphone Usage Questionnaire
The following statements are about smartphone usage and certain experiences that you may have
while using your smartphone. We are interested in how frequently you have these experiences on
a typical day.
SUQ-G1. How often do you have your cellphone on your person?
|———————————————————|
1. Never 7 All the Time
SUQ-G2. How frequently do you send and receive text messages or emails?
|———————————————————|
1 Never 7 All the Time
SUQ-G3. To what extent do you have push notifications enabled on your phone?
|———————————————————|
1 Never 7 All the Time
SUQ-G4. How often do you find yourself checking your phone for new events such as text mes-
sages or emails?
|———————————————————|
1 Never 7 All the Time
SUQ-G5. How often do you use the phone for reading the news or browsing the web?
|———————————————————|
1 Never 7 All the Time
SUQ-G6. How often do you use sound notifications on your phone?
|———————————————————|
1 Never 7 All the Time
SUQ-G7. When you get a notification on your phone, how often do you check it immediately?
|———————————————————|
1 Never 7 All the Time
SUQ-G8. How often do you use the calendar (or similar productivity apps?)
|———————————————————|
1 Never 7 All the Time
SUQ-G9. How often do you check social media apps such as snapchat, facebook, or twitter?
|———————————————————|
1 Never 7 All the Time

36
SUQ-G10. How often do you use your phone for entertainment purposes (i.e. apps and games)?
|———————————————————|
1 Never 7 All the Time
SUQ-A1. How often do you open your phone to do one thing and wind up doing something else
without realizing it?
|———————————————————|
1 Never 7 All the Time
SUQ-A2. How often do you check your phone while interacting with other people (i.e. during
conversation)?
|———————————————————|
1 Never 7 All the Time
SUQ-A3. How often do you find yourself checking your phone “for no good reason”?
|———————————————————|
1 Never 7 All the Time
SUQ-A4. How often do you automatically check your phone without a purpose?
|———————————————————|
1 Never 7 All the Time
SUQ-A5. How often do you check your phone out of habit?
|———————————————————|
1 Never 7 All the Time
SUQ-A6. How often do you find yourself checking your phone without realizing why you did it?
|———————————————————|
1 Never 7 All the Time
SUQ-A7. How often have you realized you checked your phone only after you have already been
using it?
|———————————————————|
1 Never 7 All the Time
SUQ-A8. How often do you find yourself using your phone absent-mindedly?
|———————————————————|
1 Never 7 All the Time
SUQ-A9. How often do you wind up using your phone for longer than you intended to?
|———————————————————|
1 Never 7 All the Time
SUQ-A10. How often do you lose track of time while using your phone?
|———————————————————|
1 Never 7 All the Time

37
Appendix B
Demographic Information for Study 2
Education
What is the highest level of education you have completed?
Frequency Percent
Cumulative Per-
cent
Less than Highschool 1 0.44 0.44
Highschool/GED 24 10.62 11.06
Some College/University 64 28.32 39.38
Undergraduate Degree 82 36.28 75.66
Some Graduate School 10 4.42 80.09
Graduate Degree or Higher 45 19.91 100.00
Total 226 100

38
Employment
Are you currently employed (outside of mechanical turk)?
Frequency Percent
Cumulative Per-
cent
Yes - Full Time 147.00 65.04 65.04
Yes - Part Time 33.00 14.60 79.65
No 46.00 20.35 100.00
Total 226.00 100.00
Language
Are you fluent in English?
Frequency Percent Cumulative Percent
Yes and English is my 1st language 206 91.15 91.15
Yes 19 8.41 99.56
No 1 0.44 100.00
Total 226 100

39
Income
Approximately, what is your combined annual household in-
come?
Frequen-
cy Percent Cumulative Percent
Less than 30,000 61 26.99 26.99
30,000 - 39,999 32 14.16 41.15
40,000 - 49,999 25 11.06 52.21
50,000 - 59,999 30 13.27 65.49
60,000 - 69,999 18 7.96 73.45
70,000 - 79,999 21 9.29 82.74
80,000 - 89,999 11 4.87 87.61
90,000 - 99,999 8 3.54 91.15
100,000-109,000 7 3.10 94.25
110,000 - 119,999 1 0.44 94.69
120,000 - 129,000 3 1.33 96.02
130,000 - 139,000 4 1.77 97.79
140,000 - 149,000 2 0.88 98.67
More than 150,000 3 1.33 100.00
Total 226 100
40
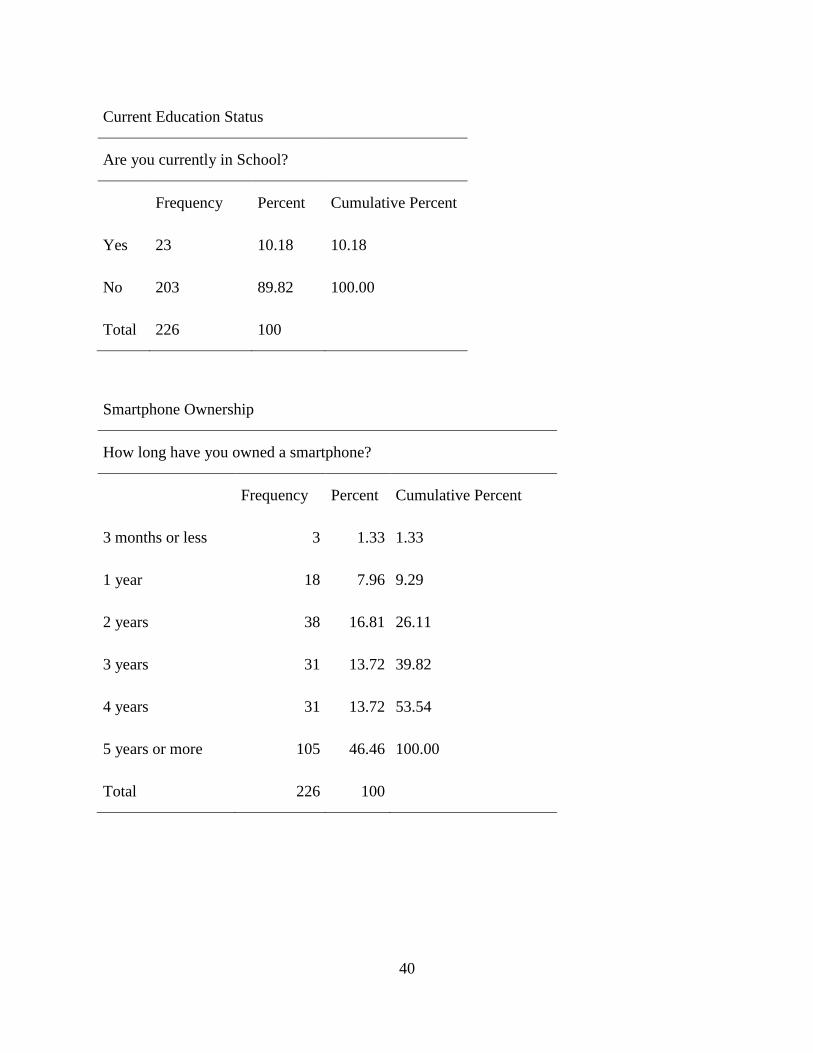
Current Education Status
Are you currently in School?
Frequency Percent Cumulative Percent
Yes 23 10.18 10.18
No 203 89.82 100.00
Total 226 100
Smartphone Ownership
How long have you owned a smartphone?
Frequency Percent Cumulative Percent
3 months or less 3 1.33 1.33
1 year 18 7.96 9.29
2 years 38 16.81 26.11
3 years 31 13.72 39.82
4 years 31 13.72 53.54
5 years or more 105 46.46 100.00
Total 226 100