the regional diffusion of the steam engine in britain - technische
TRANSCRIPT

The Diffusion of the Steam Engine in Eighteenth-Century Britain
Alessandro Nuvolari, Bart Verspagen and Nick von Tunzelmann
Eindhoven Centre for Innovation Studies, The Netherlands
Working Paper 03.26
Department of Technology Management
Technische Universiteit Eindhoven, The Netherlands
December 2003

The Diffusion of the Steam Engine in Eighteenth-Century Britain*
by
Alessandro Nuvolari#
Bart Verspagen#
Nick von Tunzelmann##
Paper to be presented at
50th Annual North American Meetings of the Regional Science Association International
Philadelphia, 20-22 November 2003
#: Eindhoven Centre for Innovation Studies (ECIS), Faculty of Technology Management, Eindhoven University of Technology, P.O. Box 513, 5600 MB, Eindhoven, The Netherlands. E-mail: [email protected] ; [email protected] ##: Science and Technology Policy Research (SPRU), University of Sussex, Mantell Building, Falmer, Brighton, BN1 9RF, United Kingdom. E-mail: [email protected]
* We would like to thank John Kanefsky for providing us with the updated version of his dataset of British steam engines. We are also grateful to Nicoletta Corrocher, Roberto Fontana, Koen Frenken and FrancescoLissoni for helpful discussions. Usual disclaimers apply.

1. Introduction Whilst economic historians have long discussed the nature and the determinants of technical change in the early phases of industrialization (see Habakkuk, 1962; Landes, 1969; Mathias, 1983; just to mention a few classical contributions), comparatively less attention has instead been devoted to the diffusion of new technologies in this historical period. Reviewing the state of the art more than thirty years ago, Rosenberg noted: ...[I]f we focus upon the most critical events of the industrial revolution, such as the introduction of new techniques of power generation and the climactic events in metallurgy, our ignorance of the rate at which new techniques were adopted, and the factors accounting for these rates is, if not total, certainly no cause for professional self-congratulation…..Our knowledge of the sequence of events at the purely technical level remains far greater than our knowledge of the translation of technical events into events of economic significance (Rosenberg, 1976, pp.189-190, note that the original paper was published in 1972). At that time, Rosenberg was undoubtedly right in indicating the existence of a fundamental and largely unexplored research issue. Since then, some considerable progress has been made, so that today we have a number of studies which portray with some accuracy the patterns of diffusion for a number of key technologies of the industrial revolution. To name just a few major contributions, Hyde (1977) has analysed the diffusion of iron production techniques, David (1975, chs. 4, 5) has studied the diffusion of the reaper in the US and in Britain, and von Tunzelmann (1978) and Kanefsky (1979) have examined the diffusion of power technologies. These studies have also ventured some way toward interpreting the factors driving the process of diffusion (sometimes igniting interesting controversies such as in the case of Alan Olmstead’s (1975) critique of David’s study of the reaping machine). Furthermore, in certain cases, the analysis of the diffusion process has also induced some overall reassessment of the role played by specific technologies in the process of economic growth. This paper serves a twofold purpose. The first is to provide a thorough reconstruction of the early diffusion of steam power technology (in the form of Watt and Newcomen engines) by providing estimates for the timing , the pace and the geographical extent of steam engine usage during the eighteenth century. The second goal is to assess the factors influencing the adoption of steam engine technology in this period. In particular, the paper will pay attention to the process of spatial spread of steam engine technology during the eighteenth century. The focus on the geographical aspects of the diffusion process is motivated by the fact that a growing number of contributions have argued (in our view rather compellingly) that a proper understanding of the processes of economic change occurring during the British industrial revolution needs to be based on a regional perspective (Pollard, 1981; Langton, 1984; Hudson, 1989; Berg and Hudson, 1992). These authors claim that industries exhibiting fast rates of output growth and extensive technical and organizational changes displayed a strong tendency towards regional concentrations. From these considerations, it is clear that, when accounting for the diffusion of a technology in this period, due attention must be paid to spatial aspects. The rest of the paper is organised as follows. In the next section we present a brief overview of the development of the steam power technology in the course of the eighteenth century. Clearly the aim of this section is to provide the necessary background (from the history of technology) to our diffusion study. In section 3, we provide a broad outline of the geographical diffusion patterns of Newcomen and Watt engines. In section 4, by estimating “adoption equations” of various types of steam engines by county, we assess the relative role of a number of specific location factors. In the same section, we also attempt to interpret the results of our econometric analysis in a background of historical accounts of the emergence of steam power technology. Section 5 draws conclusions.
2

2. The development of steam power technology during the eighteenth century In the late seventeenth century mining activities began to be severely hampered by flooding problems. Following the scientific investigations of Torricelli and Pascal, there were several attempts to use atmospheric pressure to lift water out of mines. The Savery engine, clearly inspired by the scientific investigations of the time, can be considered as the first successful effort in this direction. The engine was developed in the period 1695-1702. In the Savery engine, steam was first admitted and then condensed inside a “receiving” vessel by pouring cold water over its outside. Following steam condensation, atmospheric pressure drove the water to be pumped up into the vessel. The engine suffered from two major shortcomings, which severely limited its practical utilization. The first defect was the restricted height of operation: the suction lift could raise water only to a height of 20 feet (about six metres). The second was the high fuel consumption due to the need to re-create steam inside the vessel at each stroke. Undoubtedly, the historical importance of the Savery engine lies more in its showing the general potentialities of the use of steam power rather than in its practical applications, although a number of such engines continued in practical use for many years. The Newcomen engine, developed in 1712, resolved the problem of the limited height of operation. The engine consisted of a piston-cylinder arrangement connected to one arm of a working beam. The opposite end of the working beam was connected to the mine pump-rod. Steam was admitted from the boiler into the cylinder by means of a valve. Then a cold jet of water was sprayed into the cylinder, condensing the steam. This created a partial vacuum inside the cylinder, so that the piston was pushed down by atmospheric pressure1 (the top of the cylinder was open), lifting the pump-rod at the other end of the beam. The use of the cylinder-piston arrangement together with the beam made possible the use of the engine for effective mine drainage, as pump-rods could easily be extended to reach the necessary depth. Furthermore, the Newcomen engine was robust, highly reliable and based on a fairly simple working principle. Given these merits, it is not surprising that Newcomen engines soon came into widespread use in mining activities. However, the Newcomen engine had two main technical shortcomings. As with the Savery engine, one deficiency was the high fuel consumption due to the need for cooling and heating the cylinder at each stroke. The second limitation was the irregularity of its movement, which prevented the use of this kind of engine for directly delivering rotary motion.2 Savery and Newcomen formed a partnership to exploit the patent rights of their inventions (Savery had been granted a patent for his invention in 1699). The patent expired in 1733. The problem of the high fuel consumption of the Newcomen engine was successfully tackled by James Watt in the late 1760s. In the Watt engine condensation was carried out in a separate vessel and not in the cylinder, so there was no need to re-heat the cylinder at each stroke. The Watt engine, like the Newcomen engine, consisted of a piston-cylinder arrangement connected with a working beam, but the piston was pushed down by the action of steam and not by atmospheric pressure (the cylinder had a closed top). After having pushed down the piston, the steam was admitted by means of a system of valves into a separate vessel where it was condensed. This allowed for a much higher fuel economy compared to the Newcomen engine.
1 For this reason, Newcomen and Savery engines were also commonly termed “atmospheric” engines. 2 A number of Newcomen engines were successfully used to raise water over a water wheel which, in turn, delivered rotary motion for factory machinery. This type of engine was usually called a “returning engine”. One major limitation of this engine was that the inefficiency of the water-wheel was combined with the inefficiency of the engine. See Hills (1989, p. 49).
3

In the second half of the eighteenth century, there were also a number of attempts to introduce modifications to the Newcomen engine so that it could deliver a steady rotary motion. The most convenient solution was patented in 1780 by James Pickard. It involved the combined use of the crank and a flywheel (Hills, 1989, p. 60). At more or less the same period, Watt, at the insistence of his business partner Matthew Boulton, was also working on the transformation of reciprocating into rotary motion. Pre-empted by Pickard in the use of the crank, Watt was forced to contrive an alternative mechanical device, the “sun and planet” gear. However, after the expiration of Pickard’s patent, in 1794, Boulton and Watt resorted to the use of the simpler and more effective crank (von Tunzelmann, 1978, p. 20). The conversion of reciprocating into rotary motion was also facilitated by the development of the double-acting engine, another invention by Watt, which was patented in 1782. In the double-acting engine steam is alternatively admitted into the cylinder on both sides of the piston. This resulted in a more powerful action, but also in a much more uniform movement of the piston, making the Boulton and Watt double-acting design state-of-the-art for applications requiring rotary motion.
Finally, in the second half of the 1790s, Richard Trevithick developed the first high-pressure engine (Watt engines used steam at a little more than atmospheric pressure). This type of engine did not use the separate condenser, but discharged exhaust steam directly into the atmosphere. For this reason, they were called “puffers”. The main advantage of this type of engines was their compactness and their cheaper cost of installation due to elimination of the condenser, the air pump and the beam (von Tunzelmann, 1978, p. 23). The nineteenth-century development of steam power technology was to be increasingly characterized by the use of higher and higher steam pressures, though usually in combination with condensing. 3. Diffusion patterns in early steam power technology Kanefsky and Robey (1980) compiled a survey of all the steam engines erected in Great Britain in the course of the eighteenth century.3 For each (known) steam engine erected during the period 1700-1800, Kanefsky and Robey recorded the year of construction, the type or design of the engine (i.e. Newcomen, Watt, etc.), the county, and the sector of application.4 It is worth remarking that this dataset intends to cover engine construction and not engine utilization. This means that besides the year of erection there is no other information on the time period over which the engine was actually used, and there is no information on the date at which the engine was scrapped or replaced. As the authors would admit, the data collected by Kanefsky and Robey are probably affected by some biases in both upward and downward directions. The principal source of overestimation is the double counting of engines that were moved from one place to another, whereas underestimation is mainly due to small engines that have left no trace in the records. Notwithstanding these problems (which might result in some revisions in the future), the survey constitutes the most accurate attempt to trace the growth of steam power in Britain over the eighteenth century. In this work, we employ an up-to-date version of this dataset compiled by Kanefsky.5 3 See Kanefsky (1979) for a detailed account of the construction of the database. 4 Other information available for some of the engines are the maker, the cylinder size and the horsepower. 5 The list originally compiled by Kanefsky and Robey contained a total of 2191 steam engines, the new updated dataset contains 2279 engines. The updated version of the list has been kindly provided to us by John Kanefsky. Concerning Watt engines, the updated list by Kanefsky contains 479 engines. Tann (1988) on the basis of a careful examination of the Boulton and Watt papers considers this total too high. Her estimation of the engines constructed by Boulton and Watt by 1800 is 449. In this work, mainly for sake of convenience, we have utilised Kanefsky’s list without attempting corrections.
4

On the basis of the historical outline presented in section 2, the development of steam power technology in the eighteenth century can be divided rather naturally into three distinct “epochs”. The first epoch (1700-1733) goes from the invention of the Savery engine to the expiration of the Savery-Newcomen patent. This phase represents the early introduction of the new technology. The second epoch covers the period 1734-1774. The final period goes from 1775 (the year of the first successful erection of a Watt engine) to 1800 (the year in which Watt’s patent for the separate condenser expired). The maps presented in figure 1 provide a preliminary “impressionistic” view of the geographical (county) distribution of the engines erected in these three periods. Darker (lighter) areas indicate a higher (lower) number of engines. White areas indicate that no engines were erected in that particular county. In addition, map 5 represents the geographical distribution of water wheels (the “predominant” power technology of the period) and map 6 illustrates the prevailing level of coal prices in the various counties in (circa) 1800 (again, darker areas indicate higher prices, lighter areas represent lower prices, and in this case white areas correspond to missing values).6 The spread of steam power technology appears to have been, from the very outset, remarkably wide.7 Available evidence indicates that is highly likely that the first Newcomen engine was erected in Cornwall at the Wheal Vor tin mine in 1710. However, because of the high price of coal, Cornwall did not represent the most fertile soil for the diffusion of the new technology. The erection of the Wheal Vor engine remained a sporadic event and the introduction of Newcomen engines in Cornish mines actually took place only from the 1720s (Rolt and Allen, 1997, p. 45). Coal mining represented of course a much more receptive environment for the new technology, since there coal would be relatively cheap. The Midlands coalfields (Stafford and Warwickshire) were the first location where Newcomen engines could take firm root. The commercialisation of the engine was at first controlled by the Newcomen and Savery partnership. As mentioned in the previous chapter, after Savery’s death in 1715, a syndicate for the exploitation of the patent rights, the “Committee of Proprietors of the Invention for Raising Water by Fire” was constituted. The Committee, under the direction of its secretary John Meres, promoted rather successfully the use of the engines for drainage in various mining areas by means of a network of agents and licensees.8 Apart from the Midlands, as the map of figure 1 indicates, by 1733, Newcomen engines had been adopted in some numbers in Cornwall and in the coalfields in the North East (Northumberland and Durham).
6 The source for the number of water wheels is Kanefsky (1979, pp. 215-216) and for coal prices von Tunzelmann (1978, p. 148). For more details on the sources of the data used in this chapter, see Appendix 4.3. 7 Note that maps 1, 2 and 3 show the distribution of Newcomen and Savery engines considered together. As a consequence, a more precise definition would be “atmospheric engines”. Given the relatively small number of Savery engines installed, the results of our study are not affected by ignoring this distinction. 8 The most active licensee of the “Proprietors” was the partnership formed by Stonier Parrot and George Sparrow who were engaged in the erection of more than fifteen Newcomen engines. According to Flinn (1984, p.120), the high number of engines erected in Warwick and Stafford (far in excess of the two counties’ share in British coal production) is to be accounted for by the fact this was the “home stronghold” of the Parrot-Sparrow partnership. For an account of the activities of Stonier Parrot, see Rowlands (1969).
5

1: Newcomen 2: Newcomen 3: Newcomen engines 1700-1733 engines 1734- 1774 engines 1775-1800
4: Boulton & Watt 5: Water-wheels, c. 1800 6: Coal prices, c.1800 engines 1775-1800 Figure 1: Geographical diffusion of steam technology during the eighteenth century Overall, during the period of the monopoly of the “Proprietors” about one hundred Newcomen engines were constructed. As Smith (1978, p. 12) has aptly remarked, for the time, this must be considered “by any standards a colossal business achievement”. On the other hand, it should also be noted that historians (see for example, Flinn, 1984, p.117) have generally contended that the high level of royalties claimed by the “Proprietors” (up to £350 a year) hampered the diffusion process in this initial phase.9 Be this as it may, one has to acknowledge that, under the “Proprietors”, a group of skilled engine-builders emerged, and although (as we have mentioned 9 Kanefsky’s data provides some quantitative support for this view. From 1710 to 1733, 95 Savery-Newcomen engines were constructed. This is approximately equal to 4 engines erected per year. In the period 1734-1774, instead, 442 engines were built, corresponding to 11 engines per year.
6

in the previous section) one of the main merits of Newcomen’s invention was its relative easiness of construction and maintenance, in this initial phase, the engine still represented a rather sophisticated piece of equipment and its erection probably called for more than ordinary engineering skills. Thus, the formation and consolidation of this base of engine-building skills presumably represented a critical factor for the successful introduction of the engine in various locations. Among these engineers we may mention Henry Beighton, who worked for the Parrot-Sparrow partnership and compiled a table containing some rules of thumb for the proportions of the various components of the engine; Joseph Hornblower, who supervised the erection of various engines first in the Midlands and then in Cornwall;10 Samuel Calley, the son of John Calley (the partner of Thomas Newcomen in the invention of the engine); and Marten Triewald, a Swedish engineer who installed various Newcomen engines in the North East and who would erect a (not very successful) Newcomen engine in Sweden at the Dannemora mine. In the period 1734-1774 Newcomen engines continued to be built in mining areas. However as we can we see from map 2, in this phase, steam power also penetrated new locations. This wider spread of the engine was mainly due to its adoption by the iron sector (Shropshire) where it was used to assist water wheels in blowing coke blast furnaces during drought periods (Hyde, 1977, pp. 69-75). Newcomen engines also began to be constructed in some numbers in Scotland in the counties of the Clyde Valley.11 In this second phase, the “Proprietors” had completely ceased to control the installation of the engines and Newcomen engines were typically erected by local craftsmen, leaving the cylinder, the cylinder bottom and a small number of other critical components to be manufactured by “specialist” firms and then shipped to the location of the engine. In this respect, it is worth noting that, in the course of the eighteenth century, in Britain there existed only four ironworks that could supply cast iron cylinders for steam engine, namely Coalbrookdale and New Willey (in Shropshire), Bersham (in Denbigh) and Carron (Stirling). The period 1775-1800 is characterized by competition between Watt and Newcomen engines. In this phase, typically textile counties such as Lancashire and Renfrew (cotton) and West Riding (wool) began to resort to some use of steam to power machinery. The main difference in the spread of the two types of engines is that Watt engines appeared capable of achieving some penetration (although in low numbers) in the counties of the South East, an area which appears, by and large, to exclude Newcomen engines.
Type of engine Period Number of engines
Moran I statistic
Significance (Normal)
Significance (Randomized)
Newcomen 1700-1733 97 0.167 ** *** Newcomen 1734-1774 442 0.124 * ** Newcomen 1775-1800 616 0.192 *** ***
Boulton & Watt 1775-1800 479 0.074
Table 1: Spatial autocorrelation between engines Notes: *,**,*** indicate significance levels of 10%, 5% and 1% respectively. Table 1 reports Moran I statistics for the three periods we are considering. Moran I statistics assess whether a variable displays a tendency to be systematically clustered in space, or, on the contrary, it is randomly spread. Higher values of Moran I statistic indicate stronger degrees of
10 Joseph Hornblower would decide to settle definitely in Cornwall. He was the grandfather of Jonathan, the inventor of the compound engine. 11 For an account of these cases of early installation of Newcomen engines in Scotland, see Hills (2002), p. 297.
7

spatial autocorrelation. In other words, higher values of the statistic mean that counties with relatively high number of engines tend to be neighbouring (see Appendix 1, for more details on the calculation of Moran I statistic). Table 1 shows that Moran I statistic is higher for Newcomen engines than for Watt engines. Notably, in the case of Newcomen engines the coefficient appears to be significantly different from zero, both when the original variable is assumed to be characterized by a normal distribution and when it is supposed to be generated by an unspecified one (randomized). On the contrary, the Moran I statistic for Boulton and Watt engines does not turn out to be significant. This seems to indicate that the adoption of Boulton and Watt engines was less susceptible of being conditioned by specific locational factors. This finding may be accounted for by two possible sets of factors acting respectively on the demand and the supply side. On the demand side, given its superior fuel efficiency, it is likely that the adoption of Watt engines was less conditioned by the proximity to cheap coal (this is indeed consistent with the penetration of the Watt engine in the South East of England). Concerning the possible existence of spatial constraints from the supply side, it is worth noting that apart, from the early period of the “Proprietors”, the installation of Newcomen engines was typically in the hands of local millwrights and for this reason, the geographical adoption of the engine could have been limited to areas endowed with the necessary amount of engineering skills. On the contrary, as we shall see, Boulton and Watt instead adopted immediately a much wider horizon in their marketing of steam engines, aiming to serve the entire national market for power. To compare the speed of the diffusion between counties, we have fitted logistic curves to our data.12 In particular, we have fixed the saturation level at 100% (which amounts to assuming that all the potential adopters at the end of the diffusion process will have adopted the technology). This allows us to make use of the following log-linear transformation, which can then be easily estimated using ordinary least squares.
tbaP
P
t
te ⋅+=
−1
log (1)
In the equation, is equal to the percentage of adopters that, at time (year) , have erected a steam engine, and the slope parameter b indicates the rate of diffusion (higher values of indicate a faster diffusion process).
tP tb
We have calculated the values for from the last observation (cumulative number of engines erected) in our possession (1800), assuming that this final observation corresponds to levels of saturation going from 5 to 99% , adopting steps of 1%. Within this set of estimations we have
tP
12 Note that here we are not interested primarily in the relative virtues of various types of S curves for the estimation of diffusion process (as one would be when engaged in a forecasting type of exercise). Following Griliches (1957), we estimate logistic trends as “summary devices” for comparing the rate of diffusion across counties. In other words, we are more willing to accept some loss of fit in order to get results that are easily comparable.
8

County Number of engines
First erected
Growth rate
Saturation point reached in 1800
(%)
R2 Intercept (a)
Rate of adoption
(b)
Growth time (∆t)
Midpoint
Cornwall 75 1710 0.048 91 0.968 -4.150 (0.1589)
0.0761 (0.0033)
57.7 1765
Cumberland 23 1717 0.038 5 0.965 -5.946 (0.1975)
0.0367 (0.0028)
119.8 1879
Derby 62 1717 0.050 68 0.989 -4.078 (0.1133)
0.0564 (0.0018)
78.0 1789
Durham 103 1717 0.056 88 0.953 -3.437 (0.1568)
0.0606 (0.0033)
72.5 1774
Gloucester 49 1735 0.060 96 0.977 -3.297 (0.1434)
0.1008 (0.0035)
43.6 1768
Lancashire 85 1719 0.055 5 0.993 -7.725 (0.0977)
0.0579 (0.0015)
76.0 1853
Leicester 10 1724 0.030 78 0.996 -2.601 (0.0917)
0.0510 (0.0015)
86.1 1775
Middlesex 44 1698 0.037 48 0.975 -3.936 (0.1178)
0.0373 (0.0015)
117.7 1803
Northumberland 163 1718 0.063 83 0.965 -3.745 (0.1240)
0.0605 (0.0027)
72.7 1780
Nottingham 16 1728 0.038 41 0.942 -3.262 (0.2261)
0.0390 (0.0041)
112.7 1812
Shropshire 74 1715 0.051 79 0.976 -3.963 (0.1068)
0.0563 (0.0018)
78.1 1785
Somerset 8 1745 0.037 70 0.983 -1.582 (0.0908)
0.0427 (0.0018)
102.8 1782
Stafford 59 1706 0.043 72 0.952 -3.615 (0.1648)
0.0452 (0.0023)
97.2 1786
Warwick 39 1714 0.043 96 0.834 -1.877 (0.3225)
0.0468 (0.0054)
93.9 1754
Worcester 13 1725 0.034 66 0.892 -2.338 (0.2310)
0.0340 (0.0048)
129.1 1794
West Riding 100 1715 0.054 26 0.986 -5.852 (0.0949)
0.0550 (0.0014)
80.0 1821
North Riding 4 1754 0.029 85 0.894 -1.034 (0.4393)
0.0846 (0.0198)
51.9 1766
Carmarthen 5 1750 0.031 5 0.931 -4.580 (0.0946)
0.0292 (0.0050)
150.7 1907
Flint 19 1715 0.034 96 0.916 -2.079 (0.2237)
0.0554 (0.0051)
79.4 1753
Glamorgan 13 1717 0.031 83 0.939 -2.961 (0.2020)
0.0575 (0.0034)
76.4 1769
Ayr 32 1720 0.043 5 0.937 -6.002 (0.2022)
0.0361 (0.0030)
121.8 1886
Clackmannan 5 1764 0.043 5 0.968 -4.573 (0.1154)
0.0416 (0.0039)
105.7 1874
Dumfries 6 1787 0.127 99 0.993 -1.811 (0.1672)
0.4645 (0.0237)
9.5 1791
East Lothian 6 1720 0.022 5 0.702 -4.845 (07303)
0.0171 (0.0105)
257.0 2003
Fife 21 1764 0.083 74 0.850 -2.616 (0.3205)
0.0959 (0.0146)
45.8 1791
Lanark 26 1760 0.081 24 0.976 -4.467 (0.1438)
0.0883 (0.0048)
49.8 1811
Midlothian 26 1720 0.041 5 0.858 -6.004 (0.2566)
0.0329 (0.0039)
133.4 1902
Renfrew 8 1767 0.061 5 0.969 -5.179 (0.2966)
0.0669 (0.0107)
65.6 1844
Stirling 18 1760 0.071 78 0.926 -2.517 (0.2366)
0.0896 (0.0080)
49.1 1788
West Lothian 9 1764 0.060 7 0.949 -3.693 (0.0792)
0.0274 (0.0027)
160.5 1899
Table 2: Rates of diffusion of atmospheric engines
Notes: The growth rate is the average compound growth rate. The logistic trend is estimated using the formula . Standard errors are reported in brackets. Growth time (∆t= ) is the time interval
(in years) for moving from 10% to 90% of the diffusion path. Midpoint = + year in which the first engine was installed in the county.
( )[ ] tbaPP tte ⋅+=−1/log b/81ln)/( ba−
chosen the one with the best fit (highest R2). Tables 2 and 3 give the results, for Newcomen and Watt engines (note that we have performed this exercise only for counties with more than 4
9

engines). The table also reports the growth time (∆t) in terms of the time interval needed for moving from 10% to 90% of the final saturation level and the estimated midpoint of the logistic curve. Finally, we have also calculated average compound growth rates for the number of engines constructed in each county (which represents the “limit” case of a growth rate invariant over time). Table 2 reveals some interesting aspects of the spread of Newcomen engines. Looking at the midpoint values there appears to exist a relatively ordered sequence in the penetration of the engine in various locations. The technology is first adopted in the coal mining areas of the Midlands (Stafford and Warwick), of the North East (Northumberland, Durham) and in Cornwall (copper and tin mining). In a second phase, Newcomen engines are adopted in ironworks (Shropshire). Finally, we have the penetration in typically “textile” counties, such as West Riding (wool) and Lancashire, where the adoption appears to be characterized by slower diffusion rates. It is interesting to note that Scottish counties (Lanark, Fife and Stirling) display the highest rates of diffusion. This is probably to be explained by the initially delayed penetration of the engine in these counties. Presumably, the establishment of the Carron ironworks (which made use of the cylinder boring machine designed by John Smeaton) in Stirling in 1760 spurred the rapid adoption of steam power in Scottish counties from the early 1760s, triggering a “catching-up” type of process.13 Figure 2 charts the estimated diffusion paths for a number counties which were particularly intensive users of Newcomen engines.
0
50
100
150
200
250
300
350
400
1700 1720 1740 1760 1780 1800 1820 1840 1860
Num
bers
of e
ngin
es
0
200
400
600
800
1000
1200
1400
Num
bers
of e
ngin
es (L
anca
shir
e)
West Riding
Lancashire
Northumberland
Durham
Cornwall Shropshire
Figure 2: Estimated diffusion paths for Newcomen engines
If we compare table 2 with table 3, the much higher values of the rates of diffusion for Boulton and Watt engines are immediately evident. The average rate of diffusion (b ) for
13 In the late 1760s and 1770s, Watt himself was involved in the installation of several Newcomen engines in Scotland. The erection of these engines provided Watt, who was until then acquainted only with experimental models, with a good deal of practical experience with the problems related with the installation and operation of full scale engines (Hills, 2002, p. 358).
10

Newcomen engines is equal to 0.07, whereas for Watt engines it is equal to 0.26, indicating that the diffusion process of the latter was indeed much faster.14
County Number of engines
First erected
Growth rate
Saturation point reached in 1800
(%)
R2 Intercept (a)
Rate of adoption
(b)
Growth time (∆t)
Midpoint
Cheshire 17 1778 0.125 49 0.983 -3.875 (0.1756)
0.1699 (0.0096)
25.9 1801
Cornwall 56 1777 0.175 99 0.907 -2.798 (0.3673)
0.2848 (0.0285)
15.4 1787
Cumberland 5 1789 0.132 81 0.985 -0.890 (0.1257)
0.2299 (0.0161)
19.1 1793
Durham 18 1791 0.301 91 0.959 -4.088 (0.6223)
0.6387 (0.0776)
6.9 1797
Gloucester 7 1787 0.139 87 0.972 -2.399 (0.1495)
0.3323 (0.0137)
13.2 1794
Lancashire 74 1777 0.188 5 0.984 -7.749 (0.1534)
0.1967 (0.0088)
22.3 1816
Middlesex 77 1776 0.182 85 0.975 -3.930 (0.1106)
0.2125 (0.0067)
20.7 1794
Northumberland 20 1778 0.133 5 0.950 -6.446 (0.3905)
0.1468 (0.0203)
29.9 1822
Nottingham 18 1786 0.198 99 0.940 -1.958 (0.3065)
0.4402 (0.0373)
10.0 1790
Shropshire 44 1776 0.157 99 0.966 -3.196 (0.2332)
0.2999 (0.0168)
14.7 1787
Stafford 38 1775 0.144 95 0.975 -3.123 (0.2104)
0.2146 (0.0116)
20.5 1790
Warwick 11 1777 0.101 8 0.965 -4.866 (0.1694)
0.1026 (0.0093)
42.8 1824
West Riding 22 1782 0.167 27 0.968 -4.283 (0.1929)
0.1851 (0.0141)
23.7 1805
East Riding 6 1779 0.081 81 0.957 -1.933 (0.1530)
0.1784 (0.0192)
24.6 1790
Table 3: Rates of diffusion of Boulton and Watt engines
Notes: See Table 2. Considering midpoint values, as in the case of Newcomen engines, the adoption of the Watt engine in various locations also seems to have been characterized by a sequential order. First we have Cornwall and Shropshire (where steam engines were mainly used in ironworks), followed by the textile districts of Nottingham and later on of Lancashire and West Riding. The table also indicates a comparatively slow rate of diffusion of the Watt engine in Northumberland (coal mining), where the cheap price of coal presumably gave some advantage to Newcomen engines with respect to Watt. The estimated diffusion curves for Watt engines in a number of steam-using counties are displayed in Figure 3. The rank correlation coefficient between the total number of Newcomen and Watt engines erected in each county (Spearman’s rho) is equal to 0.7, whereas that between the rates of diffusion is equal to 0.53. They are both significant at the 1% level. This finding can be interpreted as indicating that the rates of diffusion and the extent of usage of the two types of engines were affected by a number of common factors.
14 As a term of comparison the rate of diffusion of the high pressure expansive engine in Cornwall estimated by von Tunzelmann (1978, p.258) in the early nineteenth century is equal to 0.25. Von Tunzelmann considers this as a case of a relatively fast diffusion process.
11

0
10
20
30
40
50
60
70
80
90
100
1760 1780 1800 1820 1840 1860 1880
Num
ber o
f eng
ines
0
200
400
600
800
1000
1200
1400
1600
Num
ber o
f eng
ines
(Lan
cash
ire
and
Nor
thum
berl
and)
Lancashire
Middlesex West Riding
Cornwall Shropshire
Stafford
Northumberland
Nottingham
Figure 3: Estimated diffusion paths for Watt engines.
This exploration of the patterns of diffusion reveals that steam engine technology was, from a very early stage, integrated rather successfully into several of the different “regional production systems” which comprised the British economy during the eighteenth century (see Pollard, 1981 for an overview of the distinguishing features of each regional economy). Of course the regional patterns of usage of steam technology were uneven. However, by the end of the eighteenth century steam technology had already become source of power capable of being used in a wide variety of production processes and in different local contexts.
Reciprocating engines
0
0.2
0.4
0.6
0.8
1
1.2
0 100 200 300 400 500 600
Price of Coal (pence per ton)
Shar
e of
Wat
t eng
ines
Surrey
MiddlesexCornwall
CaernarvonOxfordWiltshireMonmouth
CheshireEast Riding
Denbigh
Ireland
Glamorgan
Shropshire
Gloucester
Stafford
WarwickLancashireDurham
Northumberland
Midlothian
West RidingCumberland
LanarkFifeDerby Ayr
Renfrew
StirlingClackmanna
III
Figure 4: Price of Coal and share of Watt reciprocating engines.
12

Rotary engines
0
0.2
0.4
0.6
0.8
1
1.2
0 100 200 300 400 500 600
Price of Coal (pence per ton)
Shar
e of
Wat
t eng
ines
SurreyKent
Middlesex
BerkshireAngleseyOxfor
NorthamptonCambridge
AngusFifeClackmannan
Cheshire
Cornwall
Devon
MidlothianLeicesterStaffordEast Riding
WarwickRenfrew
LancashireLanark
Shropshire
Gloucester
AyrMonmouth
Stirling
Durham
IrelandCumberlandWest Riding Hampshire
Northumberland
Derby
WorcesterGlamorgan
I II
Figure 5: Price of Coal and share of Watt rotary engines
As mentioned in the previous chapter, the distinctive feature of the Boulton and Watt engine was its superior fuel economy with respect to the Newcomen. Watt engines, however were normally more expensive, because of their additional components (separate condenser, air pump, etc.) and because their erection required higher engineering standards. On the basis of the available data on the fuel consumption of the two types of engines and of their capital costs, von Tunzelmann (1978, ch. 4) calculated the threshold levels of the price of coal at which it would have been convenient for a fully rational entrepreneur to adopt a Boulton and Watt engine. Figures 4 and 5 contain scatter diagrams showing the relation between price of coal and the share of Watt engines in the total number of engines erected in the county during the period 1775-1800. We have also plotted the threshold levels as calculated by von Tunzelmann (1978). Note that there are two threshold levels in each diagram: the first (and lower) one (I) indicates the threshold for a new engine, the second one (II), the threshold for the replacement of an existing Newcomen engine with a new Boulton and Watt one.15 Figure 4 considers the case of reciprocating engines (where the gap in fuel efficiency between Newcomen and Watt engine was larger), whereas figure 5 displays the scatter diagram for rotary engines. It is important to remark that these threshold levels are computed for best-practice techniques. Figures 4 and 5 suggest that the price of coal was indeed one of the major determinants (acting on the demand side) dictating the adoption of a Watt vis-a-vis a Newcomen engine. In other words, an interpretation of the patterns of adoption of steam engine in terms of the threshold model is surely consistent with some broad features of the diffusion process. However, considering that most counties are situated in what seems to be a “transitional” state, it is clear
15 The threshold prices calculated by von Tunzelmann are in case of rotary engines 7s. 10d. for installation of a new engine and 14 s. for replacement, in case of reciprocating engines 5s. 10d. for installation and 11s. 3 d. for replacement, see von Tunzelmann (1978, pp. 76-77).
13

that non-economic factors, possibly in combination with information delays and “entrepreneurial failures”, also affected the geographical spread of steam power technology.16 4 An Econometric Model of Engine Adoption In order to shed some additional light on the factors driving the spread of steam power technology we estimate “adoption” equations for eighteenth century steam engines. We focus on the late eighteenth century (1775-1800) and estimate two distinct models for Newcomen and Watt engines. Clearly, the aim is to check whether there were noteworthy differences in the factors driving the diffusion processes of the two type of engines. Our dependent variable is the number of steam engines (Newcomen or Watt) erected in each county in the period 1775-1800. In both cases, the distribution of the variables is skewed, with a non-negligible number of counties having no (i.e. zero) engines. Accordingly, we will make use of negative binomial regressions for estimating the two models (more details on this estimation technique are given in Appendix 2 ). Our explanatory variables are:
i) the price of coal prevailing in the county; ii) a dummy indicating the level of coal prices in a dichotomous way (i.e. low/high, with
low being approximately less than 14 s.). This characterization of the price of coal variable permits us to use in the estimation of the regression equation all the counties and not just the 41 for which coal prices are directly available. Furthermore, one could argue that the dummy specification is a more appropriate representation of “threshold” behaviour. The dummy variable has been constructed considering the studies of the coal mining industry of Flinn (1984), von Tunzelmann (1986) and Turnbull (1987);
iii) the number of water-wheels, which can be considered as a proxy for the demand for power (note that in some applications such as ironworks and textiles, steam engines were initially used the operation of water-wheels during drought periods);
iv) the number of steam engines erected in the previous period (i.e. 1734-1774) which captures, admittedly in a rough way, both the familiarity of potential users with steam technology and the (possibly related) level of “mechanical skills” in the county in question;
v) the number of blast furnaces in operation existing in the county c. 1800; vi) the number of cotton mills existing in the county c. 1800; vii) the number of woollen mills existing in the county c. 1800.
The last three variables are included in order to assess the influence of industries (ironworks and textiles) which were among the most intensive users of steam power. A complete description of the sources and the construction of the variables used is given in Appendix 3. Admittedly, our set of explanatory variables is very far from covering all the potential factors affecting the diffusion of steam technology in the period in question. In particular, our variables consider mainly factors acting on the demand side. Coal prices reflect the cost of a unit of power for the adopter of a steam engine. The number of water wheels is a proxy for the overall demand of power existing in the county (of course, the variable can also capture some “substitution” effect between steam and water power). The sectoral variables (number of blast furnaces, number of cotton mills, number of woollen mills), indicating the size of different branches of economic activities in various counties, are obviously aimed at accounting for the different (steam) power requirements of a number of application sectors. Note that our coverage of application sectors cannot by any means considered as exhaustive. Lack of suitable data has prevented us from 16 This was also the speculative conclusion reached by von Tunzelmann (1978, ch. 4).
14

estimating for a sufficient number of counties the size of a number of sectors which were very intensive users of steam power, such as mining, food and drink (breweries) and waterworks and canals. As already mentioned, the variable “engines erected in the previous period (1734-1774)” aims at capturing the degree of familiarity (of both adopters and suppliers) with steam technology extant in each county. In this sense the variable controls for a mix of effects operating both on the supply and on the demand side. It is fair to say that our model neglects the possible “proactive” role played by the suppliers of the technology in the diffusion process. As we have already mentioned, the high rates of diffusion for Watt engines estimated in table 4.3 were plausibly not only determined by the superior fuel efficiency of the Watt engines, but also by the effectiveness of Boulton and Watt’s organisation of steam engine production and marketing techniques. From the very outset, Boulton and Watt wanted to establish themselves as a leading “national” producer of steam engines. 17 Instead, the construction of Newcomen engines was mainly undertaken by local manufactures with rather narrower and less ambitious business horizons.18 In this respect, Roll (1930) and Dickinson (1936) stressed the critical role played by Boulton’s entrepreneurial and marketing abilities for the success of the partnership.19 Boulton’s efforts ensured that Watt engines were quickly adopted in a wide range of industrial applications, which before had not made much use of steam power (breweries, textiles, etc.). For example, the erection of the famous Albion Mills in London is frequently pointed out as an example of a successful marketing strategy which succeeded in triggering the interest in steam power of many industrialists (in particular, breweries) in the London area.20 Another initiative aimed at broadening the use of steam technology was the publication by Boulton and Watt of small technical booklets (of course only reserved for their customers) providing detailed descriptions of the procedures for erecting and operating their engines. In this way, “distant” customers could
17 In a famous letter to Watt (February 7,1769), Boulton declining the offer of Watt and Roebuck (the first partner of Watt) of becoming the licensee of the Watt engine in three counties, wrote : “…I was excited by two motives to offer you my assistance which were love for you and love of a money-getting ingenious project. I presumed that your engine would require money, very accurate workmanship and extensive correspondence to make it turn to best advantage and that the best means of keeping up the reputation and doing the invention justice would be to keep the executive part out of the hands of the multitude of empirical engineers, who from ignorance, want of experience and want of necessary convenience would be very liable to produce bad and inaccurate workmanship; all of which would affect the reputation of the invention. To remedy which and produce the most profit, my idea was to settle a manufactory near to my own by the side of our canal where I would erect all the conveniences necessary for the completion of engines and from which manufactory we would serve all the world with engines of all sizes. By these means and your assistance we could engage and instruct some excellent workmen (with more excellent tools that would be worth any man’s while to procure for one single engine) could execute the invention 20 per cent cheaper than it would be otherwise executed, and with a great difference of accuracy as there is between the blacksmith and the mathematical instrument maker. It would not be worth my while to make for three counties only, but I find it very well worth to make for all the world” (quoted in Dickinson and Jenkins, 1927, pp.30-31, italics added). 18 For an account of the activities of local producers of atmospheric engines in Lancashire in the second half of the eighteenth century, see Musson and Robinson (1969, pp. 393-426). 19 In his Memoir of Matthew Boulton written in 1809, Watt stressed the role played by Boulton’s entrepreneurial abilities (and by his extensive network of acquaintances) for the successful development of the engine partnership: “Boulton....possessed in a high degree the faculty of rendering any new invention of his own or others useful to the publick, by organizing and arranging the processes by which it could be carried on, as well as promoting the sale by his own exertions and by his numerous friends and correspondents” (cited in Dickinson, 1936, pp. 195-196). 20 The engines constructed for the Albion Mills were among the first rotary double acting engines constructed by Boulton and Watt. The choice of a plant of the almost unprecedented size of the Albion Mills was meant to attract the maximum of attention towards the new engine. From a strictly economic point of view the undertaking was not successful, however, according to many contemporaries, following the “mechanical” success of the mill, double-acting rotary engines were adopted in a variety of industrial mills where direct rotary motion was needed (Westworth, 1933). The engine erected at the Albion Mill also convinced some textile manufacturers in the North to install Boulton and Watt engines for powering their mills, see Hills (1970, p. 156).
15

hopefully be able to cope with minor technical difficulties without the assistance of Boulton and Watt’s men. Furthermore, Boulton and Watt successfully established standard units of measure for both the fuel efficiency (duty) and the power (horsepower) of steam engines. Note that the establishment of a standardized unit of power was an event not only of technically, but especially of economic significance (perhaps one of the main determinants of the successful adoption of the engine in various manufacturing applications). The horsepower unit permitted industrialists to have a rather reliable assessment of their power requirements and it also permitted a rough, but rather effective, cost-benefit analysis of the adoption of various power sources. Rules of thumb soon came into common usage for expressing the power requirements of a number of industrial processes (e.g. in cotton spinning 1 horsepower was typically supposed to drive 100 spindles). From these considerations it is clear that our econometric exercise can hope to provide just a partial appraisal of the determinants of the usage of steam technology in the late eighteenth century. Hence, the results ought to be regarded with care, taking into account the possible influence of factors not included in our set of explanatory variables.
Model (I) (II) (III) (IV) (V) (VI) (VII)Number of Counties 84 84 84 84 41 41 41
Constant 1.122*** (0.334)
0.270
(0.363)1.497***(0.463)
1.390***(0.285)
1.817*** (0.463)
1.962*** (0.405)
2.933*** (0.455)
Coal price -0.003**(0.002)
-0.003** (0.002)
-0.004** (0.002)
Dummy Coal -1.919***(0.359)
-2.021***(0.436)
-1.900***(0.369)
Water wheels 0.003 (0.002)
0.003 (0.003)
0.008** (0.003)
0.002 (0.003)
Engines 0.079*** (0.021)
0.078*** (0.28)
0.087***(0.022)
0.047*** (0.016)
0.049*** (0.016)
Blast furnaces -0.005 (0.043)
0.063 (0.059)
0.008 (0.046)
0.011 (0.045)
0.047 (0.042)
0.059 (0.040)
0.065 (0.048)
Cotton mills 0.003 (0.008)
0.015 (0.014)
-0.002 (0.010)
0.008 (0.008)
0.010 (0.008)
0.012 (0.007)
0.011 (0.008)
Wool mills -0.008 (0.012)
-0.014 (0.013)
-0.018 (0.015)
-0.001 (0.011)
-0.015 (0.011)
-0.011 (0.009)
-0.009 (0.013)
Log likelihood -172.12 -184.82 -186.19 -173.16 -126.33 -126.51 -134.14 α 1.474***
(0.391) 2.586*** (0.603)
2.795***(0.623)
1.572***(0.403)
1.190*** (0.358)
1.214*** (0.361)
2.019*** (0.52)
Moran I statistic 0.044*** 0.028 -0.01 0.045***
Table 4: “Adoption” equations for Newcomen engines, 1775-1800 Notes: Negative binomial estimations. Standard errors in brackets. *,**,*** indicate significance levels of 10,5, and 1%. The α statistic verifies the existence of “overdispersion” ( χ2 test). The Moran I statistic evaluates the possible existence of spatial autocorrelation in the residuals of the regression (the levels of significance are calculated for the case of an unknown distribution (randomised case)). Table 4 gives the results of the set of regressions for Newcomen engines. In all specifications, the α test confirms the existence of overdispersion, supporting our choice of negative binomial estimations. In this respect, one can note that the existence of overdispersion points to the fact that the data exhibit a higher degree of clustering in counties with “high” or “low” number of engines, than in the case of a spatially homogeneous Poisson process.21 It is worth to point out that, in this case, “clustering” strictly refers to the number of engines installed in each county and
21 Silverberg and Verspagen (2003) have originally proposed this intuitive interpretation of the overdispersion test in the context of the temporal clustering of basic innovations.
16

it is not related to the location of the county in space. Clustering in a geographical sense is controlled for by the Moran I statistic. Hence, the existence of overdispersion points to the existence of a sizable divide among counties in terms of the extent of steam usage. The coefficient for the coal dummy variable is significant with a negative sign in all the specifications in which it is included. Similarly, the price of coal (whose inclusion restricts the sample to 41 counties) is also negative and significant. These results confirm rather clearly that the high coal prices deterred the adoption of Newcomen engines. The coefficient for the variable “engines erected in the previous period” is positive and significant in all specifications, showing the positive influence of a certain degree of “previous” familiarity with steam technology. Interestingly enough, with the exception of the water wheels in equation III (a specification which does not include the engine variable), the coefficients of all the other variables do not turn out to be significant. This can be explained by the fact that the main sector of application for Newcomen engine was represented by coal mining (not included in the model for lack of suitable data). It is also worth noting that Newcomen engines were surely successfully adopted in ironworks from the early 1740s. The fact that the coefficient is not significant might probably be explained by considering that the diffusion of Newcomen engines in ironworks actually had begun in the early 1740s, so that a number of adopters had already installed the engines before the period covered by our model. In addition, the adoption of Newcomen engines in ironworks (as well as in cotton mills) was obviously limited by the competition of Watt engines. The transition to steam power mechanization in the wool textile industry (which was concentrated in Yorkshire (West Riding) and in the West of England) was much slower than in cotton. Furthermore, in this industry, the diffusion of steam technology proceeded at two very different paces in the two areas. In West Riding, atmospheric returning engines were rapidly and rather successfully adopted for power carding and spinning machines (jennies). Table 2 indicates that about 100 engines were installed in West Riding by 1800. Instead in the other wool regions of the West of England (Gloucester, Wiltshire) and of Scotland, steam power technology was introduced very slowly (Jenkins and Ponting, 1982, pp. 50-56). The combination of these two contrasting patterns of adoption can help explain why the coefficient for wool mills is not significant. Finally, it is worth noting that the values of the Moran statistic in equation I and IV seem to show the existence some significant spatial clustering in the residuals of the regressions.22 Given the rather “rudimentary” nature of the model we have used, this is of course not surprising. However, it is also possible to interpret this result as pointing to the existence of some unaccounted spatial factors (presumably entrepreneurial failures and/or delays in the spread of information) that affected the extent of usage of Newcomen technology in different locations. Table 5 contains the results of the set of regressions having the number of Watt engines as dependent variable. As in the case of Newcomen engines, the α test is significant in all the specifications and confirms the presence of overdispersion, upholding our choice of negative binomial estimations. The coal dummy is significant with negative sign in two specifications (equation I and equation III). It is worth noting that the (negative) coefficient is lower than in the Newcomen case. In our interpretation, this result rather than reflecting a direct impact of coal
22 Table 4 shows the values of the Moran I statistic for the regression residuals (the significance intervals are computed under the “randomized” assumption). Note that this procedure is not strictly rigorous from an econometric point of view (see Cliff and Ord, 1981, ch. 8 for a discussion of the various procedures for assessing the existence of spatial autocorrelation among regression residuals) and for this reason the results ought to be considered only as a preliminary heuristic assessment.
17
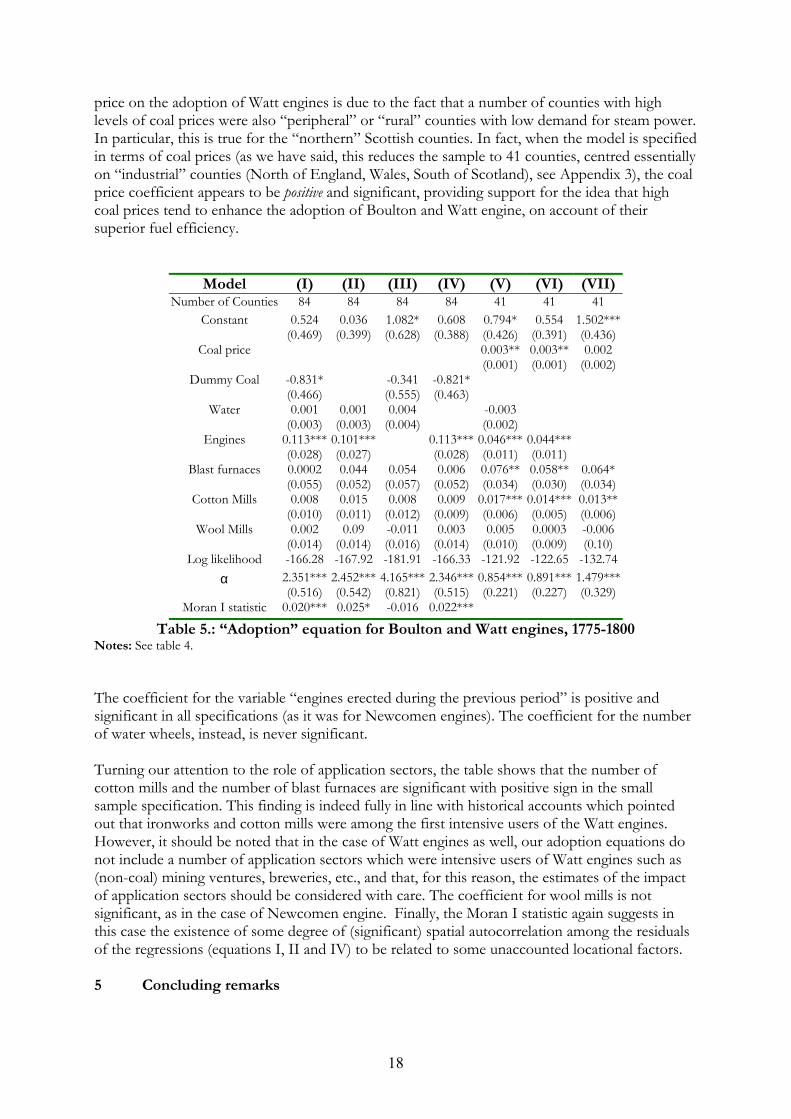
price on the adoption of Watt engines is due to the fact that a number of counties with high levels of coal prices were also “peripheral” or “rural” counties with low demand for steam power. In particular, this is true for the “northern” Scottish counties. In fact, when the model is specified in terms of coal prices (as we have said, this reduces the sample to 41 counties, centred essentially on “industrial” counties (North of England, Wales, South of Scotland), see Appendix 3), the coal price coefficient appears to be positive and significant, providing support for the idea that high coal prices tend to enhance the adoption of Boulton and Watt engine, on account of their superior fuel efficiency.
Model (I) (II) (III) (IV) (V) (VI) (VII) Number of Counties 84 84 84 84 41 41 41
Constant 0.524 (0.469)
0.036 (0.399)
1.082* (0.628)
0.608 (0.388)
0.794* (0.426)
0.554 (0.391)
1.502*** (0.436)
Coal price 0.003** (0.001)
0.003** (0.001)
0.002 (0.002)
Dummy Coal -0.831*(0.466)
-0.341 (0.555)
-0.821*(0.463)
Water 0.001 (0.003)
0.001 (0.003)
0.004 (0.004)
-0.003 (0.002)
Engines 0.113*** (0.028)
0.101*** (0.027)
0.113*** (0.028)
0.046*** (0.011)
0.044*** (0.011)
Blast furnaces 0.0002 (0.055)
0.044 (0.052)
0.054 (0.057)
0.006 (0.052)
0.076** (0.034)
0.058** (0.030)
0.064* (0.034)
Cotton Mills 0.008 (0.010)
0.015 (0.011)
0.008 (0.012)
0.009 (0.009)
0.017*** (0.006)
0.014*** (0.005)
0.013** (0.006)
Wool Mills 0.002 (0.014)
0.09 (0.014)
-0.011 (0.016)
0.003(0.014)
0.005 (0.010)
0.0003 (0.009)
-0.006 (0.10)
Log likelihood -166.28 -167.92 -181.91 -166.33 -121.92 -122.65 -132.74 α 2.351***
(0.516)2.452*** (0.542)
4.165***(0.821)
2.346*** (0.515)
0.854*** (0.221)
0.891*** (0.227)
1.479*** (0.329)
Moran I statistic 0.020*** 0.025* -0.016 0.022***
Table 5.: “Adoption” equation for Boulton and Watt engines, 1775-1800 Notes: See table 4. The coefficient for the variable “engines erected during the previous period” is positive and significant in all specifications (as it was for Newcomen engines). The coefficient for the number of water wheels, instead, is never significant. Turning our attention to the role of application sectors, the table shows that the number of cotton mills and the number of blast furnaces are significant with positive sign in the small sample specification. This finding is indeed fully in line with historical accounts which pointed out that ironworks and cotton mills were among the first intensive users of the Watt engines. However, it should be noted that in the case of Watt engines as well, our adoption equations do not include a number of application sectors which were intensive users of Watt engines such as (non-coal) mining ventures, breweries, etc., and that, for this reason, the estimates of the impact of application sectors should be considered with care. The coefficient for wool mills is not significant, as in the case of Newcomen engine. Finally, the Moran I statistic again suggests in this case the existence of some degree of (significant) spatial autocorrelation among the residuals of the regressions (equations I, II and IV) to be related to some unaccounted locational factors. 5 Concluding remarks
18

How should we interpret these results when considered all together? Overall, they indicate that the level of coal prices was indeed one of the major determinants of the distinctive patterns of adoption of Newcomen and Watt engines, giving further support to the previous studies of von Tunzelmann (1978) and Kanefsky (1979). However, it is also clear that, together with the level of coal prices, a number of other factors were also at work. It must be also acknowledged that the design of the engine did not only determine its fuel efficiency, but also the quality of the power delivered (smoothness and regularity of motion, susceptibility to breakages, etc.). Hence, particular types of engines turned out to better suited for particular applications (in some cases, despite their level of fuel efficiency). This issue is examined more in detail in Frenken and Nuvolari (2003). It would be wrong to assume that the diffusion of Newcomen and Watt engines proceeded neatly along “equilibrium” paths. The available evidence on individual adoption decisions reveals that at the county level, the process of diffusion was driven by an “epidemic” information spread. For example, Boulton and Watt frequently asked their “first” customers in different counties to let potential buyers inspect the engines they had just installed (Hills, 1970, p. 156 and p. 158). Furthermore, in explaining the geographical spread of a new technology, one should consider not only the specific local circumstances, but also the “proactive” role played by the suppliers of the new technology. As a consequence, the high rates of diffusion of Watt engines estimated in table 3 are not simply determined by the superior fuel efficiency of the Watt engine, but they also reflect the effectiveness of Boulton and Watt’s organisation of steam engine production and marketing techniques. Boulton and Watt aimed immediately at establishing themselves as a “national” producer of steam engine. Instead, in the period 1775-1800, the construction of atmospheric engines was mainly in the hands of local manufacturers with “narrower” horizons. The wider spread of Watt engines should be also considered in this light. In this respect, Dickinson (1936) and Roll (1930) emphasized Boulton’s entrepreneurial and marketing abilities, which ensured that steam power, in the form of the Watt engine, was quickly adopted in a wide range of industrial applications (e.g. the food industry especially breweries, textiles, etc.). Overall, the early diffusion process of steam technology appears to have been driven by a complex interplay of factors (resource prices and availability, information delays, entrepreneurial failures) acting contextually both on the user’s and the supplier’s side. On theoretical grounds, one can consider this interpretation as broadly consistent with “evolutionary” diffusion models, where patterns of technological diffusion are seen as the emerging outcome of micro-processes of technological learning and market selection among bounded rational agents (Silverberg, Dosi and Orsenigo, 1988). Appendix 1: The Moran I statistic Moran I statistic is a correlation coefficient which assesses the degree of spatial autocorrelation of a spatial variable. Assume that the variable x is defined over a number locations . We can construct a matrix W (spatial contiguity matrix) which indicates whether two locations have borders in common or not. The matrix is symmetric and each element is equal to 1 when the locations i and
n
ijwj a border in common and to 0 otherwise. The elements on the main diagonal of
the contiguity matrix are equal to 0. In this case Moran I statistic is equal to
19

∑∑ ∑
∑∑
= = =
= =
⋅⋅= n
i
n
j
n
iiij
n
i
n
jjiji
zw
zwznI
1 1 1
2
1 1
)(2
where is xxz ii −= (the deviation of from the mean). Higher values of I indicate a stronger degree of (positive) spatial autocorrelation. Cliff and Ord (1981, pp. 42-46) illustrate how to compute significance intervals for Moran’s I under two different hypotheses: the first one is that the observations
ix
x are normally distributed (normality assumption) whereas the second one assumes that values of x were extracted from one of the possible ! permutations of the
values of the variable n
n x over the locations. n Appendix 2: Negative binomial regression The starting point for cross sectional count data regression analysis is the Poisson regression model. This model assumes that the variable of interest (in our case the number of Newcomen or Watt engines erected in each county in the period 1775-1800) given the vector of explanatory variables
y
x is distributed as follows:
!)(
yeyp
yµµ−
=
with indicating the probability of the variable in question of assuming the value . The parameter
)(yp yµ is called arrival rate of the Poisson process and it is supposed to be a non linear
function of the vectors of explanatory variables, more specifically:
x'ln βµ = where β is the vector of coefficients to be estimated. One major limitation of the Poisson model is the assumption that the mean and the variance of the distribution of the dependent variable are equal. In contrast, very often empirical data have larger variance than the mean (this also happens in our case for both Newcomen and Watt engines). This phenomenon is referred to as overdispersion. It is possible to tackle this issue by adopting a distribution which can allow for overdispersion. A particularly convenient formulation (which is the one that we have employed in this paper) is to assume that the dependent variable is distributed according to a negative binomial density function:
y
yyyp
+
+Γ+Γ
+Γ= −−
−
−
−−
µαµ
µαα
αα
α
11
1
1
11
)()1()()(
This density function has mean equal to µ and variance equal to )1( αµµ + . It is possible to show that when α is equal to 0 this density reduces to the Poisson. Hence, it is possible to control for the adequacy of the Poisson versus the negative binomial distribution by performing a test of the null hypothesis 0=α . In our case, this was done by means of a likelihood ratio test (Cameron and Trivedi, 1998, pp.77-78).
20

Appendix 3: Sources and construction of the data Number of steam engines (Newcomen (“atmospheric”) and Boulton & Watt) installed during the period 1775-1800 and number of engines installed in the period 1734-1774. Data taken from the updated version of the Kanefsky and Robey (1980) list. Price of Coal, c. 1800. Data taken from von Tunzelmann (1978, p. 148). The 41 counties for which coal prices were available are: Cornwall, Devon, Wiltshire, Hampshire, Berkshire, Surrey, Middlesex (London), Kent, Cambridge, Northampton, Oxford, Leicester, Warwick, Worcester, Gloucester, Monmouth, Glamorgan, Shropshire, Stafford, Anglesey, Caernarvon, Denbigh, Cheshire, Derby, Nottingham, Lancashire, East Riding, West Riding, North Riding, Durham, Northumberland, Cumberland, Ayr, Renfrew, Lanark, Stirling, Argyll, Clackmannan, Midlothian, Fife, Angus. Coal dummy, c. 1800. The variable distinguishes between “cheap” and “dear” coal counties. Counties with coal prices higher than 16 s. per ton are considered as having a “high” price of coal. The counties have assigned on the basis of the price list in von Tunzelmann (1978, p. 148) and of the maps and discussion of Flinn (1984), von Tunzelmann (1986) and Turnbull (1987). Low coal price counties: Cheshire, Cumberland, Derby, Durham, Lancashire, Leicester, Monmouth, Northumberland, Nottingham, Shropshire, Stafford, Warwick, Worcester, West Riding, East Riding, Carmarthen, Denbigh, Flint, Glamorgan, Pembroke, Angus, Ayr, Berwick. Clackmannan, Dunbarton, East Lothian, Fife, Kinross, Lanark, Midlothian, Renfrew, Stirling, West Lothian. High coal price counties: Bedford, Berkshire, Buckingham, Cambridge, Cornwall, Devon, Dorset, Essex, Gloucester, Hampshire, Hereford, Hertford, Huntingdon, Kent, Lincoln, Middlesex (London), Norfolk, Northampton, Oxford, Rutland, Somerset, Suffolk, Surrey, Sussex, Westmorland, Wiltshire, North Riding, Anglesey, Brecknock, Caernarvon, Cardigan, Merioneth, Montgomery, Radnor, Aberdeen, Argyll, Banff, Caithness, Dumfries, Inverness, Kincardine, Kircudbright, Moray, Nairn, Peebles, Perth, Ross and Cromarty, Roxburgh, Selkirk, Sutherland, Wigtown. Water-wheels, c.1800. Data taken from Kanefsky (1979), pp. 215-216. The data have been constructed on the basis of contemporary maps (i.e. they are presumably likely to underestimate the actual figures). From more details, see Kanefsky (1979). Blast furnaces, c.1800. Data taken from Scrivenor (1854). The original source is government survey after the proposal of a tax on coal. The data refer to the year 1796 . Cotton Mills, c. 1800. Data taken from Chapman (1970, pp. 257-266). Chapman’s figures are based on insurance records and they mostly refer to the year 1795. For Lancashire we have estimated a figure of 204 mills, which is based on the assumption that the county had 50% of large mills (types B and C) and 50% of type A (i.e., small) mills. This is in line with the considerations contained in Chapman’s paper.
21

Wool Mills, c. 1800. Data taken from Jenkins and Ponting (1982, pp. 34-38). The data refer to the year 1800. When more detailed information was lacking, an equal share of wool mills was assigned to the counties comprised in the wool regions for which Jenkins and Ponting provide figures for the number of wool mills. References Berg, M. and P. Hudson (1992), “Rehabilitating the Industrial Revolution”, Economic History
Review, 45, pp. 24-50. Cameron, A.C. and P.K. Trivedi (1998), Regression Analysis of Count Data (Cambridge: Cambridge
University Press). Chapman, S.D. (1970), “Fixed Capital Formation in the British Cotton Industry, 1770-1815”,
Economic History Review, 23, pp. 235-266. Cliff, A. D. and Ord J. K. (1981), Spatial Processes: Models and Applications (London: Pion). David, P.A. (1975), Technical Choice, Innovation and Economic Growth, (Cambridge: Cambridge
University Press). Dickinson H. W. (1936), Matthew Boulton (Cambridge: Cambridge University Press). Dickinson, H. W. and R. Jenkins (1927), James Watt and the Steam Engine (Oxford: Clarendon). Habakkuk, H.J. (1962), American and British Technology in the Nineteenth Century (Cambridge:
Cambridge University Press). Hills, R. L. (1970), Power in the Industrial Revolution (Manchester: Manchester University Press). Hills, R. L. (1989), Power from Steam. A History of the Stationary Steam Engine (Cambridge: Cambridge
University Press). Hills, R. L. (2002), James Watt: His Time in Scotland, 1736-1774 (Ashbourne: Landmark). Hudson, P. (1989), “The Regional Perspective”, in P.Hudson (ed.), Regions and Industries: A
Perspective on the Industrial Revolution in Britain, (Cambridge: Cambridge University Press). Hyde, C. K. (1977), Technological and the British Iron Industry, 1700-1870 (Princeton: Princeton
University Press). Frenken, K. and A.Nuvolari (2003), “The Early History of the Steam Engine: An Evolutionary
Interpretation using Complexity Theory”, mimeo. Flinn, M. W. (1984), The History of the British Coal Industry, 1700-1830. Volume II (Oxford:
Clarendon Press). Griliches, Z. (1957), “Hybrid Corn: an Exploration in the Economics of Technological Change”,
Econometrica, 25, pp. 501-522. Jenkins, D. T. and K. G. Ponting (1982), The British Wool Textile Industry, 1770-1850 (London:
Heineman). Kanefsky, J. W. (1979), The Diffusion of Power Technology in British Industry, 1760-1870 (University of
Exeter, PhD Thesis). Kanefsky, J. W. and J. Robey (1980), “Steam Engines in 18th Century Britain: a Quantitative
Assessment”, Technology and Culture, 21, pp.161-186. Landes, D. S. (1969), The Unbound Prometheus. Technological Change and Industrial Development in
Western Europe from 1750 to the Present (Cambridge: Cambridge University Press). Langton, J. (1984), “The Industrial Revolution and the Regional Geography of England”,
Transactions of the Institute of British Geographers, 9, pp. 145-167. Mathias, P. (1983), The First Industrial Nation (London:Methuen, 2nd ed.). Musson, A.E. and E.H. Robinson (1969), Science and Technology in the Industrial Revolution
(Manchester: Manchester University Press). Olmstead, A. L. (1975), “The Mechanization of Reaping and Mowing in American Agriculture,
1833-1870”, Journal of Economic History, 35, pp. 327-352.
22

Pollard, S. (1981), Peaceful Conquest. The Industrialization of Europe 1760-1970 (Oxford: Oxford University Press).
Roll, E. (1930), An Early Experiment in Industrial Organisation. Being a History of the Firm of Boulton & Watt, 1775 –1805 (London: Longman).
Rolt, L. T. C, and J. S. Allen (1997), The Steam Engine of Thomas Newcomen (Ashbourne: Landmark, 1st ed. 1977).
Rosenberg, N. (1976), Perspectives on Technology (Cambridge: Cambridge University Press). Rowlands, M. B. (1969), “Stonier Parrot and the Newcomen Engine”, Transactions of the Newcomen
Society, 41 (1968-9), pp. 49-67. Scrivenor, H. (1854), History of the Iron Trade (London). Silverberg, G., Dosi, G. and L. Orsenigo (1988), “Innovation, Diversity and Diffusion: a Self-
Organisation Model”, Economic Journal, 98, pp. 1032-1054. Silverberg, G. and B. Verspagen (2003), “Breaking the Waves: a Poisson Regression Approach to
Schumpeterian Clustering of Basic Innovations”, Cambridge Journal of Economics, 27, pp. 671-693.
Smith, A. (1978), “Steam and the City: the Committee of Proprietors of the Invention for Raising Water by Fire, 1715-1735”, Transactions of the Newcomen Society, 49 (1977-8), pp. 5-20.
Tann, J. (1988), “Fixed Capital Formation in Steam Power, 1775-1825. A Case Study of the Boulton and Watt Engine” in C. H. Feinstein and S. Pollard (eds.), Studies in Capital Formation in the United Kingdom, 1750-1920 (Oxford, Clarendon Press).
Turnbull, G. (1987), “Canals, Coal and Regional Growth during the Industrial Revolution”, Economic History Review, 40, pp. 537-560.
von Tunzelmann, G. N. (1978), Steam Power and British Industrialization to 1860 (Oxford: Clarendon).
Westworth, O. E. (1933), “ The Albion Steam Flour Mill”, Economic History, 2, pp. 380-395.
23

W O R K I N G P A P E R S
Ecis working papers 2003 (December 2003):
03.01 A. Nuvolari Open source software development: some historical perspectives
03.02 M. van Dijk Industry Evolution in Developing Countries: the Indonesian Pulp and Paper Industry
03.03 A.S. Lim Inter-firm Alliances during Pre-standardization in ICT
03.04 M.C.J. Caniëls & H.A. Romijn What drives innovativeness in industrial clusters?Transcending the debate
03.05 J. Ulijn, G. Duysters, R. Schaetzlein & S. Remer Culture and its perception in strategic alliances, does it affect the performance? An exploratory study into Dutch-German ventures
03.06 G. Silverberg & B. Verspagen Brewing the future: stylized facts about innovation and their confrontation with a percolation model
03.07 M.C. Caniëls, H.A. Romijn & M. de Ruijter-De Wildt Can Business Development Services practitioners learn from theories on innovation and services marketing?
03.08 J.E. van Aken On the design of design processes in architecture and engineering: technological rules and the principle of minimal specification
03.09 J.P. Vos
Observing Suppliers observing Early Supplier Involvement: An Empirical Research based upon the Social Systems Theory of Niklas Luhmann
03.10 J.P. Vos Making Sense of Strategy: A Social Systems Perspective
03.11 J.A. Keizer & J.P. Vos Diagnosing risks in new product development
03.12 J.M. Ulijn , A. Fayolle & A. Groen European educational diversity in technology entrepreneurship: A dialogue about a culture or a knowledge management class?

03.13 J.M. Ulijn, S.A. Robertson, M. O’Duill Teaching business plan negotiation: How to foster entrepreneurship with engineering students
03.14 J.E. van Aken The Field-tested and Grounded Technological Rule as Product of Mode 2 Management Research
03.15 K. Frenken & A. Nuvolari The Early Development of the Steam Engine: An Evolutionary Interpretation using Complexity Theory
03.16 W. Vanhaverbeke, H. Berends, R. Kirschbaum & W. de Brabander Knowledge management challenges in corporate venturing and technological capability building through radical innovations
03.17 W. Vanhaverbeke & R. Kirschbaum Building new competencies for new business creation based on breakthrough technological innovations
03.18 K.H. Heimeriks & G.M. Duysters Alliance capability as mediator between experience and alliance performance: an empirical investigation into the alliance capability development process
03.19 G.M. Duysters & K.H. Heimeriks Developing Alliance Capabilities in a New Era
03.20 G.M. Duysters, K.H. Heimeriks, J. Jurriëns
Three Levels of Alliance Management
03.21 B. Verspagen & C. Werker The invisible college of the economics of innovation and technological change
03.22 W. Vanhaverbeke, B. Beerkens, and G. Duysters
Explorative and exploitative learning strategies in technology-based alliance networks
03.23 S.J. van Dijk, G.M. Duysters & A.J.M. Beulens Transparency dilemmas, information technology and alliances in agriculture and food industry
03.24 S.J. van Dijk & M.P.C.D. Weggeman Knowledge sharing in technology alliances
03.25 C. Castaldi & A. Nuvolari Technological Revolutions and Economic Growth:The “Age of Steam” Reconsidered
03.26 A. Nuvolari, B. Verspagen and N. von Tunzelmann The Diffusion of the Steam Engine in Eighteenth-Century Britain