the reflectance spectrum of human skin
TRANSCRIPT
University of Pennsylvania University of Pennsylvania
ScholarlyCommons ScholarlyCommons
Technical Reports (CIS) Department of Computer & Information Science
12-20-1999
The Reflectance Spectrum of Human Skin The Reflectance Spectrum of Human Skin
Elli Angelopoulou University of Pennsylvania, [email protected]
Follow this and additional works at: https://repository.upenn.edu/cis_reports
Part of the Computer Sciences Commons
Recommended Citation Recommended Citation Elli Angelopoulou, "The Reflectance Spectrum of Human Skin", . December 1999.
University of Pennsylvania Department of Computer and Information Science Technical Report No. MS-CIS-99-29.
This paper is posted at ScholarlyCommons. https://repository.upenn.edu/cis_reports/584 For more information, please contact [email protected].

The Reflectance Spectrum of Human Skin The Reflectance Spectrum of Human Skin
Abstract Abstract The automated detection of human skin has become an important task for machine vision systems. Prior vision and graphics research on this topic has primarily focused on images acquired with conventional color cameras. Formal spectrographic analyses have largely been undertaken in the medical domain and focus on the detection of pathology. We have constructed a facility capable of producing accurate, dense and repeatable reflectance measurements. The light reflected from the skin is measured using a high resolution, high accuracy spectrograph under precisely calibrated lighting conditions. This paper presents observations from the first body of data gathered at this facility. From the measurements collected thus far, we have observed population-independent factors of skin reflectance. We show how these factors can be exploited in skin recognition. Finally, we provide a biological explanation for the existence of a distinguishing pattern in human skin reflectance.
Disciplines Disciplines Computer Sciences
Comments Comments University of Pennsylvania Department of Computer and Information Science Technical Report No. MS-CIS-99-29.
This technical report is available at ScholarlyCommons: https://repository.upenn.edu/cis_reports/584
The Reflectance Spectrum of Human Skin
Technical Report MS-CIS-99-29
Elli Angelopoulou GRASP Laboratory
Department of Computer and Information Science University of Pennsylvania
December 20,1999
Abstract The automated detection of human skin has become an important task for machine vision systems. Prior
vision and graphics research on this topic has primarily focused on images acquired with conventional color cameras. Formal spectrographic analyses have largely been undertaken in the medical domain and focus on the detection of pathology.
We have constructed a facility capable of producing accurate, dense and repeatable reflectance measure- ments. The light reflected from the skin is measured using a high resolution, high accuracy spectrograph under precisely calibrated lighting conditions. This paper presents observations from the$rst body of data gathered at this facility. From the measurements collected thus fa?; we have observed population-indepen- dent factors of skin reflectance. We show how these factors can be exploited in skin recognition. Finally, we provide a biological explanation for the existence of a distinguishing pattern in human skin rejkctance.
1 Introduction The understanding of human skin reflectance is motivated by a number of compelling applications. First and foremost is
the automated location and identification of humans from color images. There is a substantial body of work in this area which relies on conventional tri-color RGB sensor data [7] and on chroma-model based approaches [18]. RGB data is prevalent, easy to collect and mimics human color sensitivity. Unfortunately, the RGB model produces significant color- distortions [8]. It is therefore a natural and practical approach to take in investigating skin recognition. What happens, how- ever, if the constraint of using data from an RGB sensor is lifted? Establishing ground-truth measurements of skin reflec- tance provides the foundation for reasoning about new multi-spectral techniques and evaluating existing methods.
Recognition and simulation are closely linked topics. Skin reflectance is also an important aspect of photo-realistic ren- dering of humans. This is clearly a problem of great theoretical, if not to say commercial, interest. Accurate data will lead to improved rendering and possibly display technologies.
The ultimate goal of this work is to build a complete, validated model of human skin reflectance which incorporates a multitude of population and individual-based variables. This goal, ambitious as it is, promises to be of great benefit for the vision and graphics comminutes.
In this work we present our measurement facility and provide a brief error analysis about the accuracy of our measure- ments. We then show how the dense spectral data can be used to discriminate between the reflectance of human skin and a material made to mimic human skin tone. The discriminatory power of the dense spectral sampling is explained by the absorption of visible light by the human skin.
2 Measurement Facility We have constructed a facility capable of physically measuring the spectrum of light reflected from a surface. Our setup,
composed of a light source, a mounting stage for the surface sample and a high resolution spectrograph allows us to pro- duce accurate, dense and repeatable reflectance measurements.

2.1 Illumination The incident illumination is strictly controlled. The light reflected from a surface depends on the direction, the intensity
and the spectrum of the light falling on the surface. We use a single light source located approximately lOOcm from the sample. Our lamp (shown in fig. 1) produces a collimated beam of even irradiance over a small area on the sample, (smaller than lcm2). The source is a quartz halogen lamp encased in an housing which allows focusing and alignment. The beam passes through an IR-cut filter which transmits light from 420nm to 630nm. The light goes also through a UV filter that blocks even further the transmission of light under 415nm.
Fig. 1. Light source illuminating the skin,
2.2 Detection The light reflected from a skin sample is scattered in all possible directions of the viewing hemisphere. We are interested
in measuring only that amount of the scattered light that is reaching a single viewpoint. Thus, a 2m long fiber optic bundle with a 200pm x 6mm sensing area is mounted at the desired viewpoint. A lens mounted in front of the fiber optic cable focuses the light on the tip of the bundle. The facility is designed to measure the Bidirectional Reflectance Distribution Function (BRDF) of various materials. Thus, it allows for the generation of all possible viewpoints by having the fiber optic cable mounted on a motorized goniometer which covers an angle of 180" . The platform on which the sample rests is a motorized stage with 3 degrees of freedom. That allows for the reflectance measurement of anisotropic samples from all possible viewpoints and angles of incidence.
Fig. 2. The reflectance measurement sensor.
As can be seen in fig. 2, the other end of the fiber optic bundle is connected to an Oriel Multispec 77400 spectrograph. The spectrograph uses a diffraction grating to disperse the light into its component wavelengths. We use a 600 lines per mm grating. The dispersed light falls on a photodiode array which takes 1024 measurements in the 390nm to 710nm range approximately. Thus we get reflectance measurements every 0.32 nm. Photodiode arrays have almost an order of magni- tude better signal to noise ratio than the corresponding CCD sensors.
3 Skin Reflectance Data We asked our subjects to rest their right hand on the platform touching the back plate of the stage. Two different samples
were taken for each subject: one for the back of their hand and one for the palm (see fig. 3). The light was falling approxi- mately on the center of the hand. The reflected light was collected via the fiber optic cable which was located 21cm away from the sample. To further improve our signal to noise ratio, we took the average of 10 reflectance measurements for each skin sample.

Each session of data collection included taking a measurement of the dark reference (background) of our apparatus and a sample of the incident light beam. Each of these samples was also collected 10 times to reduce the signal to noise ratio. We also applied a local average smoothing over a 5 pixel area to each sample.
Fig. 3. Experimental setup.
The color of the reflected light depends on the color of incident light. Thus, the true descriptor of the spectral behavior of a material is the ratio of the light reflected from that material over the light that is incident on that material. For non- Lambertian surfaces this ratio changes as the angle of incidence and angle of reflectance change. The ultimate goal is to produce a complete BRDF for in-vivo human skin. Our current measurements are for a 0" angle of incidence and approx- imately 4" angle of reflectance (to avoid placing the fiber optic cable on the direction of the beam) Thus, what we are measuring is:
where BRDF() is the Bidirectional Reflectance Distribution Function, which is a five parameter function, BRDF(B,, (p,;8,, q i ;h) . 8 , cp , are the spherical coordinates of the angle of reflectance, 8 , cp , are the spherical coordi- nates of the angel of incidence and h is the wavelength at which the BRDF is measured. The following figures show the BRDF ratio plotted against the wavelength of the visible part of the electromagnetic spectrum.
Skin Reflectance
450 500 550 600 650 700 Wavelength
Fig. 4. Spectra of the back of the hand.
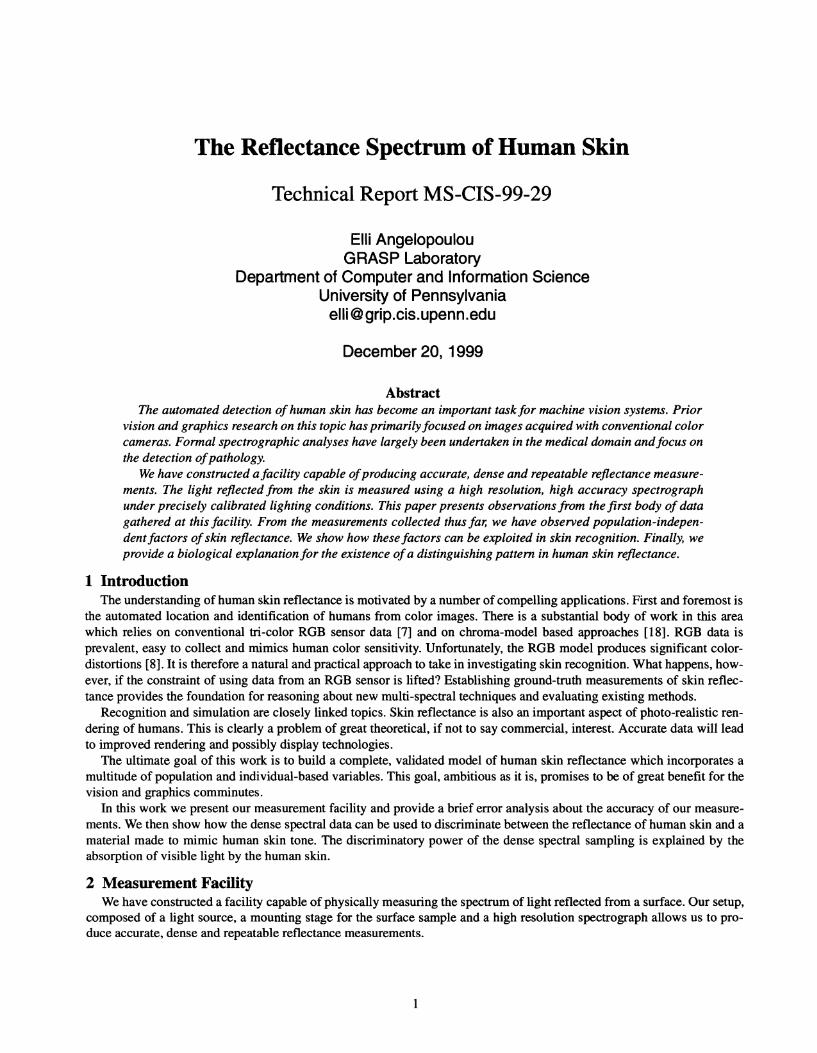
We measured the skin reflectance of 23 volunteers ranging from 20 to 40 years old. Out of the 23 volunteers, 18 were male and 5 female. We tried to get a diverse collection of skin tones: 16 of our subjects were caucasian, 3 were asian, 2 of african descent and 2 were indian. The green plots are the spectra of asians. The magenta and the blue plots are spectra of our african descent and indian volunteers respectively.
Skin Reflectance
0.3 450 500 550 600 650 700
Wavelength
Fig. 5. Spectra of the back of the hand.
The first three figures (fig. 4, fig. 5 and fig. 6)show the spectrum of the back of the hand. Although we collected a diverse set of skin spectra, there is clearly a particular pattern that can be observed. A gradual increase with respect to wavelength can be immediately noticed, with a dip around 575nm.
Skin Reflectance 1
0.1 450 500 550 600
Wavelength
Fig. 6. Spectra of the back of the hand.
The skin spectra of various races are interspersed and no clear classification can be done. There is one exception. One can observe that darker shaded skin, independent of race, reflects a smaller proportion of the incident light (which is how a darker surface can be described) and does not exhibit the curvature variation of the other plots.

Fig. 7 shows a subset of the previous curves after their albedo has been rescaled to vary between 0% and 1%. By divid- ing each reflectance distribution by the maximum value of that distribution we are ignoring the effect of the darkness of skin and are concentrating on the shape of the spectrum.
Normalized Skin Reflectance
Wavelength
Fig. 7. Scaled spectra of the back of the hand.
In order to test whether the variations of the shape of the skin spectra could be attributed to the local skin structure and to melanin, we measured the spectra of the palm of the same volunteers.
Skin Reflectance
0.4 450 500 550 600 650 700
Wavelength
Fig. 8. Spectra of the palm.
For the palms, the measured spectra (fig. 8 and fig. 9) still exhibit the same general pattern as the back of the hand. (A gradual increase with respect to wavelength with a dip around 575nm.) As expected the palm has a more reddish spectrum

than the back of the hand. Notice that the various spectra are much more closely clustered and exhibit an almost identical shape.
Skin Reflectance 1.2
0.4 0.3
0.2 450 500 550 600
Wavelength
Fig. 9. Spectra of the palm.
Fig. 10. shows the palm spectra after their albedo has been rescaled to vary between 0% and 1%. Fig. 7 and fig. 10 show the rescaled spectra of the palm and the back of the hand of the same subjects. Notice that, in the absence of melanin at the palm, the BRDF plots for the darker skinned subjects exhibit the same curvature as the rest of the plots. The closer cluster- ing also indicates that variations in the superficial skin structure, like hair, pores, follicles, wrinkles etc., do have a minor impact on the spectrum of the human skin.
Normalized Skin Reflectance 1
0.2 450 500 550 600 650
Wavelength
Fig. 10. Scaled spectra of the palm.
The measured spectra demonstrate that there is a very specific pattern in the spectral distribution of the color of skin. The next question that arose is whether this pattern is sufficiently unique to provide for the identification of human skin,
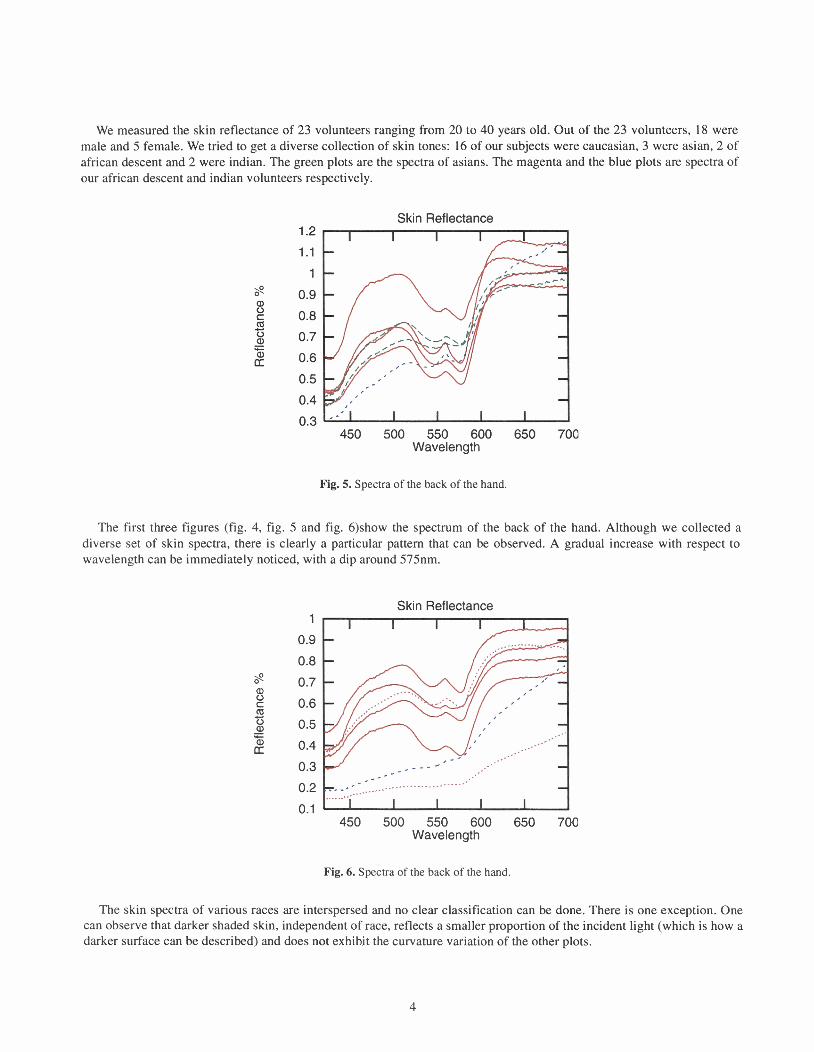
especially when compared to a mannequin which cames the same key features with humans (lips, nose, eyes, arms, legs etc.) We took 5 measurements of the spectrum of light reflected by a mannequin (fig. 11).
Fig. 11. Measuring the reflectance of a mannequin.
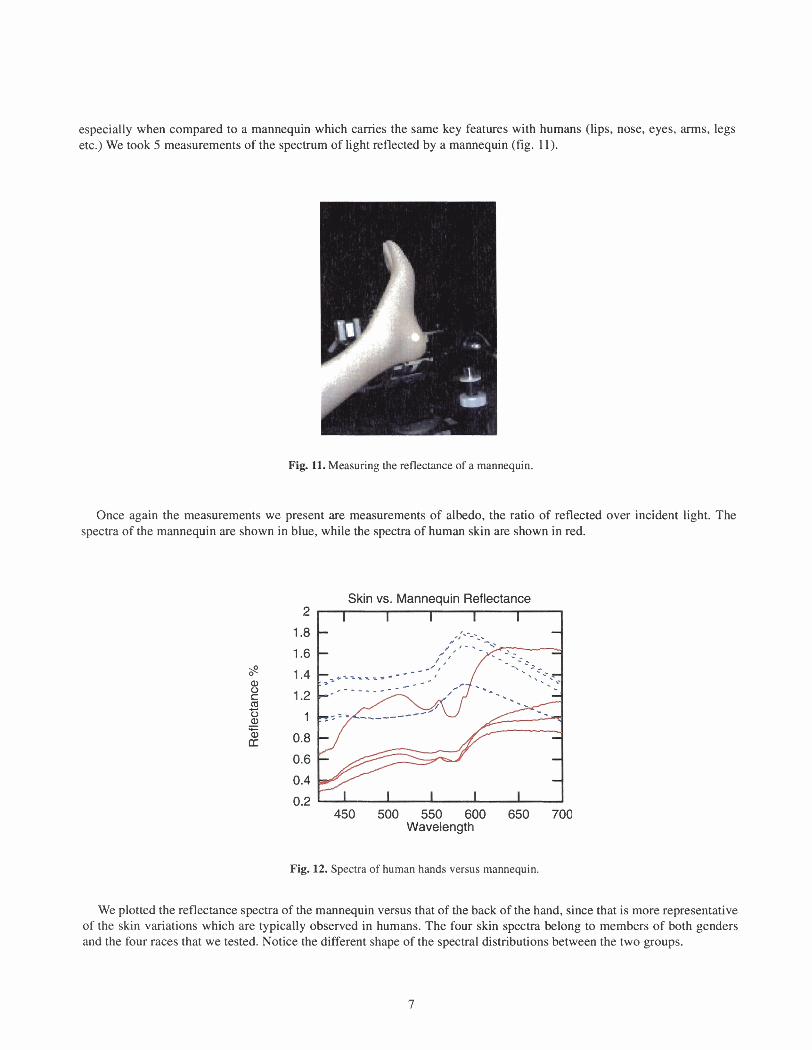
Once again the measurements we present are measurements of albedo, the ratio of reflected over incident light. The spectra of the mannequin are shown in blue, while the spectra of human skin are shown in red.
Skin vs. Mannequin Reflectance 2
1.8
1.6
1.4
1.2
1
0.8
0.6
0.4
0.2 450 500 550 600 650 700
Wavelength
Fig. 12. Spectra of human hands versus mannequin.
We plotted the reflectance spectra of the mannequin versus that of the back of the hand, since that is more representative of the skin variations which are typically observed in humans. The four skin spectra belong to members of both genders and the four races that we tested. Notice the different shape of the spectral distributions between the two groups.

Fig. 13 shows the same spectra as in fig. 12 after they have been rescaled so that the albedo would vary between 0% and 1%. The rescaled mannequin spectra are almost overlapping. In the rescaled plots the existence of two separate spectra becomes more evident than in fig. 12.
Normalized Skin vs. Mannequin Reflectance
0.2 2 450 500 550 600 650 700
Wavelength
Fig. 13. Rescaled spectra of human hand versus mannequin,
4 Error Analysis Before we proceed in analyzing the reflectance data, it is important to evaluate the accuracy of our measuring facility.
To that end, we used 3 calibrated flat disks: a Labsphere Standard Red Spectralon CSTM-SCS-RD-22547, a Labsphere Standard Green Spectralon CSTM-SCS-GN-22547 and a Labsphere Standard Blue Spectralon CSTM-SCS-BL-22547. Labsphere had provided us with the reflectance spectra of these samples. We measured the reflectance spectrum of each of these samples in our spectrographic facility. Fig. 14 shows the measured spectra alongside the spectral distributions pro- vided by Labsphere.
Real vs. Known Reflectance I I I I I - measured red - - - 7 real red - ,
-...-.-. measured green - - - . ,:.ae
.,, ;;y T., v.
real green --- ,I:- .. measured blue -.---- ,: - real blue - - - - .. C
i
- - ------- - I
0 450 500 550 600 650 700
Wavelength
Fig. 14. Calibrated versus measured reflectance spectra.

There is slight dip in our measurements at above 650nm. It is caused by the use of the IR-cut filter in our light source that allows for the transmission of only 15% of the light above 630nm. For each of the three colored samples we computed both the average absolute error and the average square error (see Table 1). The overall average absolute error is 1.67, while the overall average square error is 4.96.
Table 1: Error of Measuring Facility
5 Automatic Detection The preceding error analysis indicates that our skin reflectance measurements are accurate. Eye inspection of the reflec-
tance data shows that there is a persistent pattern that seems to be unique to the human skin. All the measured reflectances, with the exception of the more tanned people, exhibit a localized " W pattern (two dips with a bump in the middle) in the middle of the visible spectrum.
The critical issue is whether this pattern can be automatically detected in a consistent and reliable manner. We devel- oped the following algorithm.
Avg. Square Error
3.22965
0.10275
11.56619
Sample
Red
Green
Blue
" W pattern detection algorithm: 1. Find all the local minima and maxima of the curve (places where the derivative is zero). 2, Find the two smallest local minima after 430nm.
They should be the two dips of the 'W" pattern. 3. Let h,=wavelength of the leftmost dip. 4. Let %=wavelength of the rightmost dip. 6. If h3-h1<50nm
Find the local max between hl and h3. This should be ,the middle bump. Let h2=wavelength of the middle bump.
else No " W pattern is present, because the two smallest local mins. are not close to each other.
Avg. Absolute Error
1.68171
0.26407
3.06967
This algorithm was 100% successful in locating the "W" pattern when it was present. Out of the 46 human skin samples, 44 exhibited the "W" pattern and our algorithm accurately located it all 44 times. The two samples that did not exhibit the pattern were those of the back of the hands of the very dark-toned skin. Similarly, none of the 5 BRDF plots of the manne- quin contained this pattern, so all of them were correctly identified as lacking the pattern.
A statistical analysis was performed on the location of the local minima and maxima that define the " W pattern. We computed the mean and median wavelengths at which the pattern's local extrema occur. We also computed the correspond- ing standard deviations to get a measure of the localization for each of these features. Table 2 summarizes these findings.
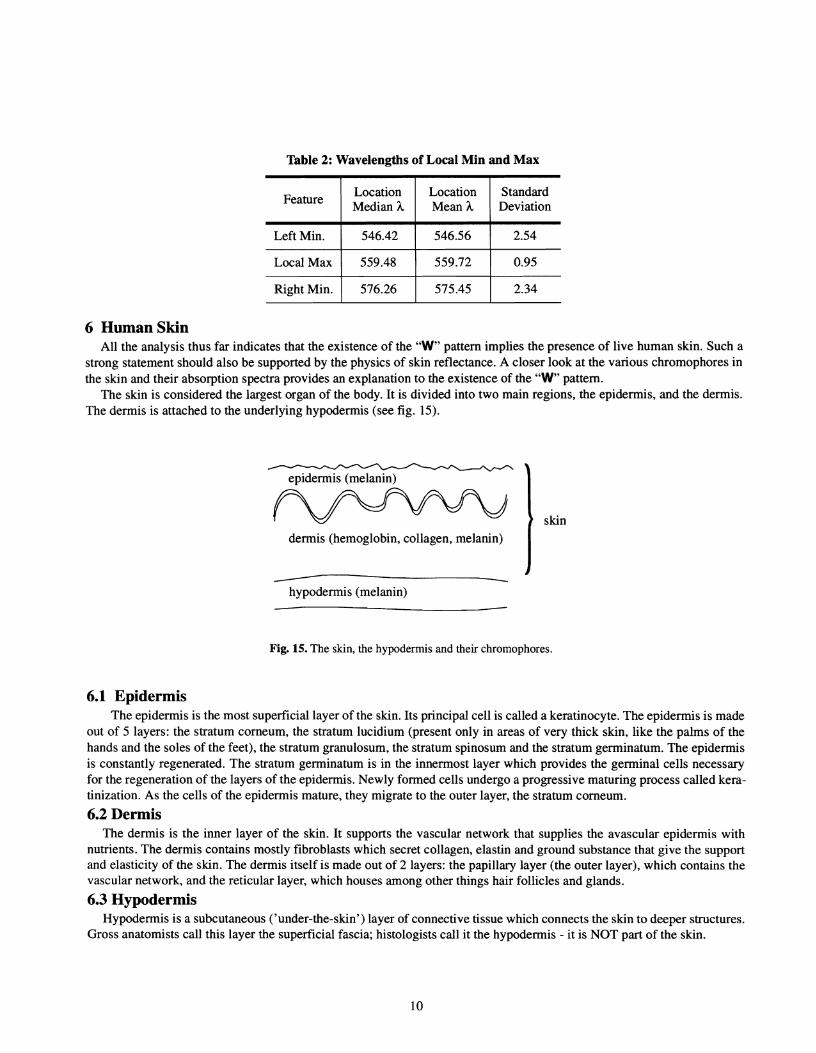
Table 2: Wavelengths of Local Min and Max
6 Human Skin All the analysis thus far indicates that the existence of the "W" pattern implies the presence of live human skin. Such a
strong statement should also be supported by the physics of skin reflectance. A closer look at the various chromophores in the skin and their absorption spectra provides an explanation to the existence of the " W pattern.
The skin is considered the largest organ of the body. It is divided into two main regions, the epidermis, and the dermis. The dermis is attached to the underlying hypodermis (see fig. 15).
epidermis (melanin)
Feature
Left Min.
Local Max
Right Min.
dermis (hemoglobin, collagen, melanin)
Location Mean h
546.56
559.72
575.45
Location Median h
546.42
559.48
576.26
- - hypodermis (melanin)
Standard Deviation
2.54
0.95
2.34
I skin
Fig. 15. The skin, the hypodermis and their chromophores.
6.1 Epidermis The epidermis is the most superficial layer of the skin. Its principal cell is called a keratinocyte. The epidermis is made
out of 5 layers: the stratum corneum, the stratum lucidium (present only in areas of very thick skin, like the palms of the hands and the soles of the feet), the stratum granulosum, the stratum spinosum and the stratum germinatum. The epidermis is constantly regenerated. The stratum germinatum is in the innermost layer which provides the germinal cells necessary for the regeneration of the layers of the epidermis. Newly formed cells undergo a progressive maturing process called kera- tinization. As the cells of the epidermis mature, they migrate to the outer layer, the stratum corneum.
6.2 Dermis The dermis is the inner layer of the skin. It supports the vascular network that supplies the avascular epidermis with
nutrients. The dermis contains mostly fibroblasts which secret collagen, elastin and ground substance that give the support and elasticity of the skin. The dermis itself is made out of 2 layers: the papillary layer (the outer layer), which contains the vascular network, and the reticular layer, which houses among other things hair follicles and glands.
6.3 Hypodermis Hypodermis is a subcutaneous ('under-the-skin') layer of connective tissue which connects the skin to deeper structures.
Gross anatomists call this layer the superficial fascia; histologists call it the hypodermis - it is NOT part of the skin.

7 Formation of Skin Reflectance The reflectivity (BRDF) of the skin at various wavelengths is mainly determined by the chromophores present in the
various layers of the skin [14, 17, 191. In order to explain the presence of the "W'pattern we must take a closer look at the contribution of each of these chromophores.
7.1 Melanin In most individuals, the absorption of the epidermis is usually dominated by the absorption caused by melanin. Melanin
is a class of biological polymer synthesized from tyrosine by a complex series of reactions. There are two types of melanin: eumelanin, a black-brown pigment which is insoluble and is found in brownhlack hair and brown eyes. pheomelanin, reddish pigment which is alkali-soluble and is found in red hair and red feathers.
All healthy individuals have varying degrees of eumelanin in their skin, while pheomelanin is present only to individu- als who carry the corresponding genetic trait. Thus, when people talk about melanin, they typically refer to eumelanin. From this point whenever we mention melanin we will assume that it is eumelanin.
Although melanin is one of the most ubiquitous of natural pigments, its chemical structure is unknown as it is formed by a random polymerization process which ends up incorporating many intermediates into the final heterogeneous process. Since the exact chemical structure of melanin is unknown, human eumelanin can not be artificially generated and studied. Instead, the eumelanin particles from the ink sacs of the cuttlefish Sepia oficinalis are used as a model system. In general, the reflectance spectrum of melanin in the visible range is monotonically increasing with wavelength with maximum absorption occurring in the UV range. Buckley and Grum [I] who compared non-pigmented versus healthy adjacent patches of skin in vitiligo patients observed a similar melanin reflectance curve. This partly explains the predominant ten- dency of skin BRDF to increase with wavelength.
Melanin originates in the melanocytes, which are also found in the epidermis. They are dendritic cells which are sur- rounded by, but not connected to the keratinocytes in the epidermis. Inside the melanocytes is a special type of organelle, the melanosome, which is where melanin is synthesized. The melanosomes are secreted out of the melanocytes and into adjacent keratinocytes via dendritic processes. The keratinocytes which now contain the melanin carrying melanosomes move up through the epidermal layers as part of the constant regeneration process. Thus, melanin is formed in the lower layers of the skin, attaches to the keratinocytes in the form of melanosomes and slowly moves to the outer layers of skin until it reaches the stratum corneum.
The various hues and degrees of pigmentation found in the skin of human beings are directly related to the number, size, and distribution of melanosomes within the melanocytes and other cells. According Jacques [lo] it is estimated that:
in light-skinned adults 1.6-6.3% of the epidermis volume is occupied by melanosomes; in moderately pigmented adults 11-16% of the epidermis volume is occupied by melanosomes; in darkly pigmented adults 18-43% of the epidermis volume is occupied by melanosomes;
7.2 Keratin Keratin is a fibrous protein found in the epidermis. It is formed inside the keratinocytes, during the keratinization pro-
cess. Its fibers cause light scattering, but they are too thin to have a critical effect in skin reflectance.
7.3 Carotene Carotene is one of the chromophores of the dermis, but it can also be present in the blood. It is an unsaturated hydrocar-
bon found as a pigment in many higher plants, particularly carrots, sweet potatoes, and leafy vegetables. Its presence in humans depends on food consumption. Its absorption peaks at 480nm but it has a very weak effect on the overall skin color [I].
7.4 Collagen Collagen is a fibrous protein that can also be found in the dermis. Its fibers are the primary source of light scattering in
the dermis. Jacques [lo] has done extensive analysis on the scattering effects of Collagen but does not mention any impact on the reflectance spectrum of the skin.
7.5 Hemoglobin The dermis is heavily permeated with blood vessels which contain hemoglobin, Hb. Hemoglobin is a protein contained
in the red blood cells (95% of the dry mass of red cells is Hb). Hemoglobin binds very easily to Oxygen, making it the ideal "vehicle" for the transportation of oxygen from the lungs to the tissue. Hb has a unique absorption spectrum with charac- teristic absorption bands at 420nm and in the 545nm-575nm range, right where the " W pattern is observed. Using the measurements of Zijlstra et al [20] we plotted the hemoglobin absorption spectrum versus our skin reflectance measure-

ments (see fig. 16).
Skin Albedo and Oxygenated Hemobglobin
Fig. 16. Skin reflectance vs. hemoglobin absorption.
[I E 0.2 W 3 0.1
The locations of the absorption bands, shown in Table 3, are almost identical to the locations of the " W pattern, which were shown in Table 2.
-
- skin reflectance - \ hemoglobin absorbance ---- :--------- .-........-.d... ..--....
Table 3: Wavelength of Hb02 absorption bands
450 500 550 600 650 Wavelength
These absorption bands occur only when hemoglobin is bound with oxygen. De-oxygenated hemoglobin exhibits shifted absorption bands and the distinct pattern is no longer present. Nonetheless, the majority of hemoglobin in the human blood vessels is oxygenated. More specifically, in the arteries 90-95% of the Hb is oxygenated while 5-10% of the Hb id de-oxygenated. In the veins, more than 47% of the Hb is oxygenated.
Finally hemoglobin like melanin exhibits most of its absorption in the lower wavelengths, contributing to higher skin reflectance in the higher wavelengths. By now, it is clear that the oxygenated hemoglobin in the blood vessels is responsi- ble for the skin-BRDF "W" pattern. Heavily pigmented skin, has increased amounts of melanin which absorbs most of the light in the epidermis, allowing a much smaller percentage of the incident light to reach the vasculature of the dermis. Thus, the hemoglobin absorption bands, although still present are not detectable.
Since the spectrum of skin is closely tied with the chromophores in the skin, one would expect the skin BRDF to be quite different for dead people. Indeed, older studies, by Brunsting and Sheard [l] verify this theory. They performed spec- trophotometric analysis on postmortem skin and in vivo skin of people of approximately the same body type, age, gender and race. Their data indicates the absence of the absorption bands at 540nm, 580nm and 630nm. The reflectance spectrum of postmortem skin looks relatively flat. Almost monotonically increasing ever so slighlty in the red region, i.e as the wavelength increases [I]. Thus, a BRDF database for human skin must be generated using, in-vivo not postmortem skin.
Feature
Left Max.
Local Min.
Right Max.
Location Mean h
542
560
576

As a last note, we would like to point out that the medical and biomedical communities have done extensive work in analyzing the skin reflectance spectrum. However, most of their work is either laser-based, or is concentrating in the infra- red part of the spectrum. There is of course the exception of very early work (1930s) of Edwards and Duntley [6] and Brun- stig and Sheard [I] . An extensive comparison of their results with ours is beyond the scope of this paper. It is however worth noting that our spectrophotometer is of higher accuracy, that the number of our human volunteers is much more extensive and that both these papers are influenced in the interpretation of their results by common gender and racial beliefs of that period.
8 Conclusions We have constructed a facility capable of producing accurate and dense measurements of the reflectance spectrum of
human skin. The initial data of skin spectra gathered at our facility show that despite variations the spectral distribution of skin exhibits a certain pattern. This population-independent pattern can be automatically detected with 100% accuracy. Furthermore, the patteni is directly tied to the human skin composition.
Additional analysis and more measurements of skin reflectance are in progress. We are collecting data from with differ- ent parts of the human body. We are also interested in examining the reflectance data over a variety of age groups. Although the initial samples were collected with specialized equipment, spectral information can be collected with a CCD camera and a set of narrow bandpass filters. Such a setup will provide for the fine sampling of the reflected spectrum and will allow researchers to take advantage of the knowledge of skin reflectance.
References [ I ] Brunsting, L. A. and Sheard, C. 'The Color of the Skin as Analyzed by Spectrophotometric Methods: 11. The Role of Pigmentation."
The Journal of Clinical Investigation, Vol. 7, 1929. pp 574-592.
[2] Brunsting, L. A. and Sheard, C. "The Color of the Skin as Analyzed by Spectrophotometric Methods: 111. The Role of Superficial Blood." The Journal of Clinical Investigation, Vol. 7, 1929. pp 593-613.
[3] Buck, G. B. I1 and Froelich, H. C. "Color Characteristics of Human Complexions." Illuminating Engineering, Vol. 43, No. 1, 1948. pp. 27-49.
[4] Buckley, W. R. and Grum, F. "Reflection Spectrophotometry." Archives of Dermatology, Vol. 83, 1961. pp. 11 1-123.
[5] Clement, C. D. Gray's Anatomy of the Human Body, 13th ed. Williams & Wilkins, 1985.
[6] Edwards, E. A. and Duntley, S. Q. 'The Pigments and Color of Living Human Skin." American Journal ofAnatomy, Vol. 65, No. 1, July 1939. pp. 1-33.
[7] Fleck, M. M., Forsyth, D. A. and Bregler, C. "Finding Naked People." Proceedings European Conference on Computer Vision and Pattern Recognition 1996. Springer-Verlag, 1996. pp. 593-602.
[8] Hall, R. A. and Greenberg, D. P. "A testbed for realistic image synthesis." IEEE Computer Graphics and Applications, Vol. 3, No. 8, 1983. pp. 10-19.
[9] Inokuchi, S., Nakai, H. and Manabe, Y. "Simulation and Analysis of Spectral Distributions of Human Skin." Proceedings Interna- tional Conference on Pattern Recognition, 1998. pp. 1065- 1067.
[lo] Jacques, S. L. "Monthly News and Articles on Biomedical Optics and Medical Lasers." Web-page of Oregon Medical Laser Center, http://omlc.ogi.edu/news/index.html
[l 11 Jacques, S. L. and McAuliffe, D. J. 'The Melanosome: Threshold Temperature for Explosive Vaporization and Internal Absorption Coefficient during Pulsed Laser Irradiation." Photochemistry and Photobiology, Vol. 53, No. 6, 1991. pp. 769-775.
[I21 Kollias, N. and Baqer, A. "Spectroscopic Characteristics of Human Melanin in Vivo." Journal of Investigative Dermatology, Vol. 85, NO. 1, 1985. pp. 38-42.
[13] Kollias, N. and Baqer, A. "On the Assessment of Melanin in Human Skin in Vivo." Photochemistry and Photobiology, Vol. 43, No. 1, 1986. pp. 49-54.
[14] Liibbers, D. W. "Chemical in Vivo Monitoring by Optical Sensors in Medicine." Sensors and Actuators B: Chemical, Vol. 11, 1993. pp. 253-262.
[15] Rea, M. S., Robertson, A. R. and Petrusic, W. M. "Colour Rendering of Skin under Fluorescent Lamp Illumination." Color Research and Application, Vol. 15, No. 2, 1990. pp. 80-92.
[16] Sheard, C. and Brunsting, L. A. "The Color of the Skin as Analyzed by Spectrophotometric Methods: I. Apparatus and Procedures." The Journal of Clinical Investigation, Vol. 7, 1929. pp 559-574.
[17] Sinichkin, Y. P., Uts, S. P. and Pilipenko, E. A. "Spectroscopy of Human Skin in Vivo: 1. Reflection Spectra." Optics and Spectros- copy, Vol. 80, NO. 2, 1996. pp. 226-234.

[18] Temllon, J.-C., David, M. and Akamatsu, S. "Detection of Human Faces in Complex Scene Images by Use of a Skin Color Model and of Invariant Fourier-Mellin Moments." Proceedings International Conference on Pattern Recognition, 1998. pp. 1350-1355.
[19] Van Gemert, M. J. C., Jacques, S. L., Sterenborg, H. J. C. M. and Star, W. M. "Skin Optics." IEEE Transactions on Biomedical Engineering, Vol. 36, No. 12, 1989. pp. 1146-1 154.
[20] Zijlstra, W. G., Buursma, A. and Meeuwsen-van der Roest, W. P. "Absorption Spectra of Human Fetal and Adult Oxyhernoglobin, De-oxyhemoglobin, Carboxyhemoglobin, and Methernoglobin." Clinical Chemistry, Vol. 37, No. 9, 1991. pp. 1633-1638.