the recruitment and assessment process implelmented · pdf filethe recruitment and assessment...
TRANSCRIPT

THE RECRUITMENT AND ASSESSMENT PROCESS IMPLELMENTED BYWORKFORCE RESOURCE, INC.
by
Merry Lienau
A Research Paper
Submitted in Partial Fulfillment of the
Requirement for the
Master of Science Degree
With a Major in
Applied Psychology
Approved: 4 Se
Dr. Richard l~_la
Investigation Advisor
The Graduate College
University Of Wisconsin-Stout
December 2000

Workforce Recruitment ii
ABSTRACT
The Graduate College
University of Wisconsin-Stout
Menomonie, WI 54751
Lienau, Merry K
The Recruitment and Assessment Process Implemented by Workforce Resource, Inc.
M.S. Applied Psychology Dr. Richard Tafalla 12/00 95pp
American Psychological Association (APA) 4th edition
The purpose of this research was to determine the efficacy of the tools employed by
Workforce Resource, Inc. to assist Andersen Corporation's Menomonie facility in the
hiring of their production associates. Workforce Resource, Inc., assists Company's in the
St. Croix and Chippewa Valley's with their recruitment and assessment needs. Andersen
Corporation contracted with Workforce Resource Inc., to under take the assessment of
applicants for their production associate positions. The recruitment announcement
specifically requested applicants to include in their application materials information such
as work history, education, flexibility, and team experience. The announcement also
requested that applicants apply with a cover letter and one page resume and they submit
their materials to the Dunn County Job Center. This study analyzed and reviewed the
data from tools used to assess the applicant's success in progressing in the hiring process.
Applicants who met the minimal expected criteria were referred for an assessment of
their math, language, finger and manual dexterity skills. Statistical reports are also

Workforce Recruitment iii
provided examining the math and language levels for the available
manufacturing/industrial labor pool in West Central Wisconsin. Results of the study
show that for applicants to be referred on for an interview they needed to score highly
across all of the variables. This research also suggested that applicants who made an
effort to upgrade their math skills had a much higher success rate in the hiring process.

Workforce Recruitment iv
ACKNOWLEDGEMENT
I would like to express my appreciation to my advisor, Dr. Richard Tafalla, for his
guidance and support throughout the period of research and preparation of this study.
Sincere appreciation is also extended to Dr. Thomas Franklin for his friendship, support
and assistance with the results of this study.
A special thanks also goes to Nancy Volbrecht for her support and immense
assistance during this study.
I would also like to recognize and thank my brother Dr. Jon Behling for his
immeasurable support given without reservation. A very special thanks to Sharon
Franklin whose friendship and encouragement over the years made this possible. And
most of all a very very special thanks and appreciation to my husband Timothy for his
love, guidance, patients and the support he has given me over the years.

Workforce Recruitment v
TABLE OF CONTENTS
Abstract ii
Acknowledgement iv
List of Tables vi
Chapter 1: Statement of Purpose 9
Chapter 2: Introduction 12
Recruitment and Selection of a Quality Workforce 13
Pre-employment Assessments 15
Assessment of Applicants Basic Skills 17
Literature Summary 20
Chapter 3: Methodology 23
Chapter 4: Results 31
Chapter 5: Discussion 73
References 77
Appendix A 79
Appendix B 80
Appendix C 81
Appendix D 82
Appendix E 83
Appendix F 84
Appendix G 85
Appendix H 88
Appendix I 89
Appendix J 91
Appendix K 95
Workforce Recruitment vi
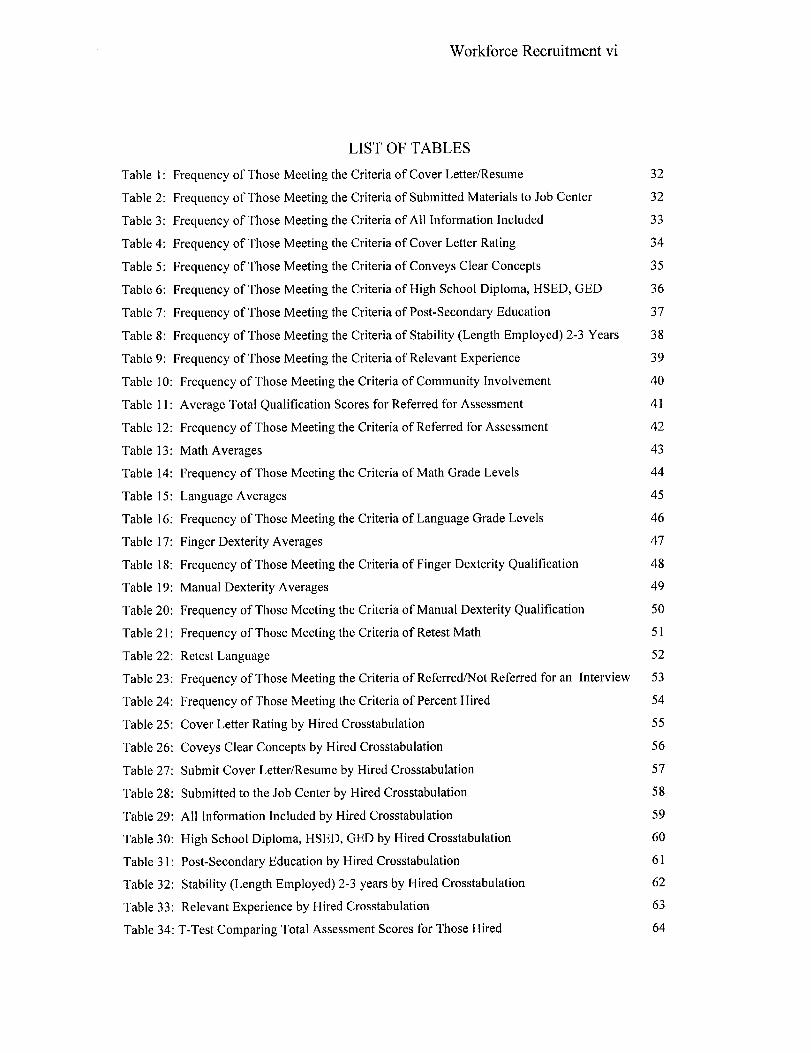
LIST OF TABLES
Table 1: Frequency of Those Meeting the Criteria of Cover Letter/Resume 32
Table 2: Frequency of Those Meeting the Criteria of Submitted Materials to Job Center 32
Table 3: Frequency of Those Meeting the Criteria of All Information Included 33
Table 4: Frequency of Those Meeting the Criteria of Cover Letter Rating 34
Table 5: Frequency of Those Meeting the Criteria of Conveys Clear Concepts 35
Table 6: Frequency of Those Meeting the Criteria of High School Diploma, HSED, GED 36
Table 7: Frequency of Those Meeting the Criteria of Post-Secondary Education 37
Table 8: Frequency of Those Meeting the Criteria of Stability (Length Employed) 2-3 Years 38
Table 9: Frequency of Those Meeting the Criteria of Relevant Experience 39
Table 10: Frequency of Those Meeting the Criteria of Community Involvement 40
Table 11: Average Total Qualification Scores for Referred for Assessment 41
Table 12: Frequency of Those Meeting the Criteria of Referred for Assessment 42
Table 13: Math Averages 43
Table 14: Frequency of Those Meeting the Criteria of Math Grade Levels 44
Table 15: Language Averages 45
Table 16: Frequency of Those Meeting the Criteria of Language Grade Levels 46
Table 17: Finger Dexterity Averages 47
Table 18: Frequency of Those Meeting the Criteria of Finger Dexterity Qualification 48
Table 19: Manual Dexterity Averages 49
Table 20: Frequency of Those Meeting the Criteria of Manual Dexterity Qualification 50
Table 21: Frequency of Those Meeting the Criteria of Retest Math 51
Table 22: Retest Language 52
Table 23: Frequency of Those Meeting the Criteria of Referred/Not Referred for an Interview 53
Table 24: Frequency of Those Meeting the Criteria of Percent Hired 54
Table 25: Cover Letter Rating by Hired Crosstabulation 55
Table 26: Coveys Clear Concepts by Hired Crosstabulation 56
Table 27: Submit Cover Letter/Resume by Hired Crosstabulation 57
Table 28: Submitted to the Job Center by Hired Crosstabulation 58
Table 29: All Information Included by Hired Crosstabulation 59
Table 30: High School Diploma, HSED, GED by Hired Crosstabulation 60
Table 31: Post-Secondary Education by Hired Crosstabulation 61
Table 32: Stability (Length Employed) 2-3 years by Hired Crosstabulation 62
Table 33: Relevant Experience by Hired Crosstabulation 63
Table 34: T-Test Comparing Total Assessment Scores for Those Hired 64

Workforce Recruitment vii
Table 35: Math Level by Hired Crosstabulation 65
Table 36: Math Score Averages for Hired and Not Hired 66
Table 37: Language Level by Hired Crosstabulation 67
Table 38: Language Score Averages for Hired and Not Hired 68
Table 39: Frequency of Those Meeting the Criteria of Percent Hired After Math Retest 69
Table 40: Frequency of Those Meeting the Criteria of Percent Hired After Language Retest 70
Table 41: Discriminate Analysis - Equality of Group Means 72

Workforce Recruitment 9
CHAPTER ONE
STATEMENT OF THE PROBLEM
The purpose of this research was to examine and determine the efficacy of
the recruitment and assessment criteria used in making hiring decisions for
Andersen Corporation's Menomonie facility. Several measures are used in the
hiring process, and this study was done to determine which of these were the best
predictors of hiring. This research provides insight into the basic skill levels
related to math and language aptitudes of the available manufacturing/industrial
labor pool in West Central Wisconsin.
Andersen Corporation is a worldwide market leader in the wood window
and patio door industry. Andersen Corporation's Menomonie Facility is a
212,000 square feet assembly facility that manufactures custom windows.
Andersen Corporation is committed to its employees and staying at the top of its
business. They believe in hiring talented individuals and providing them with
challenges. They are dedicated to giving back to the community and encourage
their employees to be very community minded. Employees rotate their
positions/work centers and teams every two hours. During one two hour rotation,
employees may be assembling a window, the subsequent rotation they may be
reading blueprints and changing the specification in the computer to manufacture
the windows.

Workforce Recruitment 10
Andersen Corporation chose Menomonie, Wisconsin because of its close
proximity to the Twin Cities, access to rail, interstate highway and a regional
airport. Menomonie also has a manufacturing company who is a major producer
of flat plate glass required by Andersen Corporation.
Application and assessment criteria was collected for 1,344 applicants for
the position of Production Associate between April and September 2000. The
assessment criteria was determined jointly between the Investigator and Ms. Julie
DuBoise the Human Resource Generalist for Andersen Corporation.
Statistical reports were generated for each of the selection criteria,
detailing the percent of applicants meeting minimal expectations. Relationships
between variables were examined to determine if any significant correlation
existed between applicants hired and selection criteria. Examples of interest
were, applicants who were hired did they score the highest in math and language
skills. In addition, did any of the other collected variables show a correlation to
hiring such as education or ability.
Data were also collected for a number of applicants referred to Andersen
Corporation for interviews following initial selection procedures by Workforce
Resource, individuals actually interviewed and hired following the selection
procedures.
In addition, the investigator will analyze the relationship between the
selection criteria used and it's effectiveness in the hiring process.

Workforce Recruitment 11
With this information both Workforce Resource and Andersen
Corporation will recognize areas in the assessment and hiring process that are
effective and areas that may need further modification in order to increase the
effectiveness of their assessment and hiring process. This research will provide
Workforce Resource, Secondary and Post Secondary institutions, with an
understanding of the basic math and language aptitudes of the present labor pool,
and ultimately could be used by teaching institutions in making the necessary
changes in curricula to enhance the math/language skills of the present and future
labor pools in West Central Wisconsin.
Workforce Recruitment 12
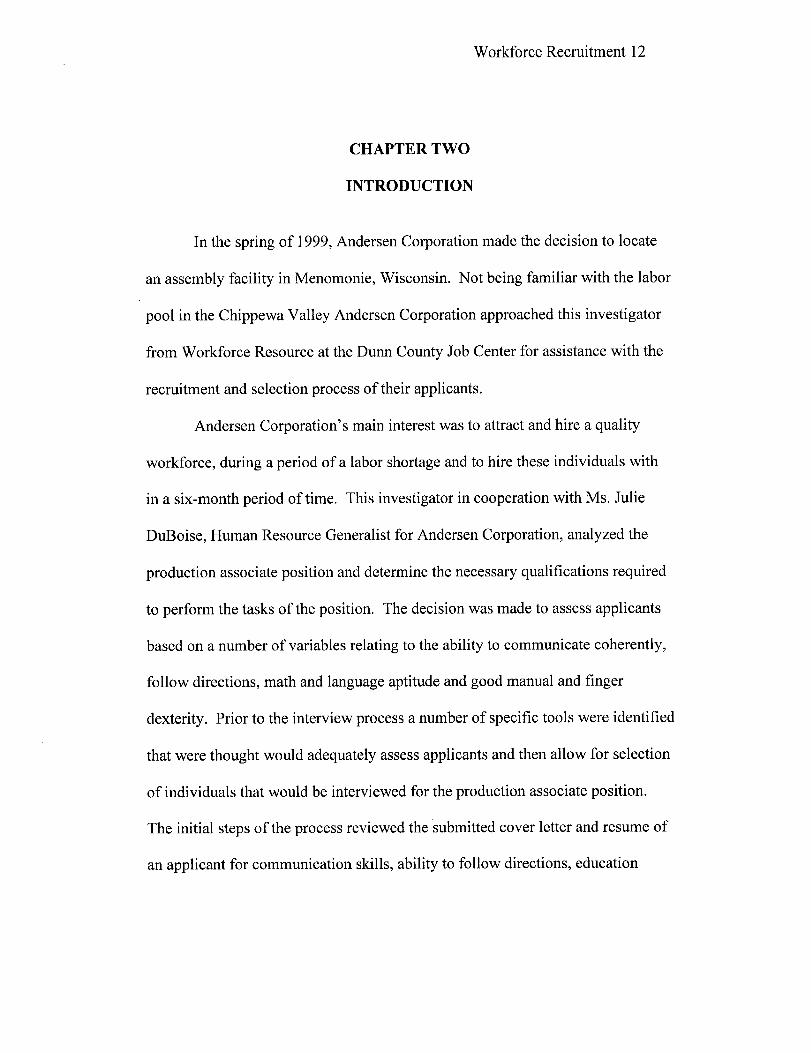
CHAPTER TWO
INTRODUCTION
In the spring of 1999, Andersen Corporation made the decision to locate
an assembly facility in Menomonie, Wisconsin. Not being familiar with the labor
pool in the Chippewa Valley Andersen Corporation approached this investigator
from Workforce Resource at the Dunn County Job Center for assistance with the
recruitment and selection process of their applicants.
Andersen Corporation's main interest was to attract and hire a quality
workforce, during a period of a labor shortage and to hire these individuals with
in a six-month period of time. This investigator in cooperation with Ms. Julie
DuBoise, Human Resource Generalist for Andersen Corporation, analyzed the
production associate position and determine the necessary qualifications required
to perform the tasks of the position. The decision was made to assess applicants
based on a number of variables relating to the ability to communicate coherently,
follow directions, math and language aptitude and good manual and finger
dexterity. Prior to the interview process a number of specific tools were identified
that were thought would adequately assess applicants and then allow for selection
of individuals that would be interviewed for the production associate position.
The initial steps of the process reviewed the submitted cover letter and resume of
an applicant for communication skills, ability to follow directions, education
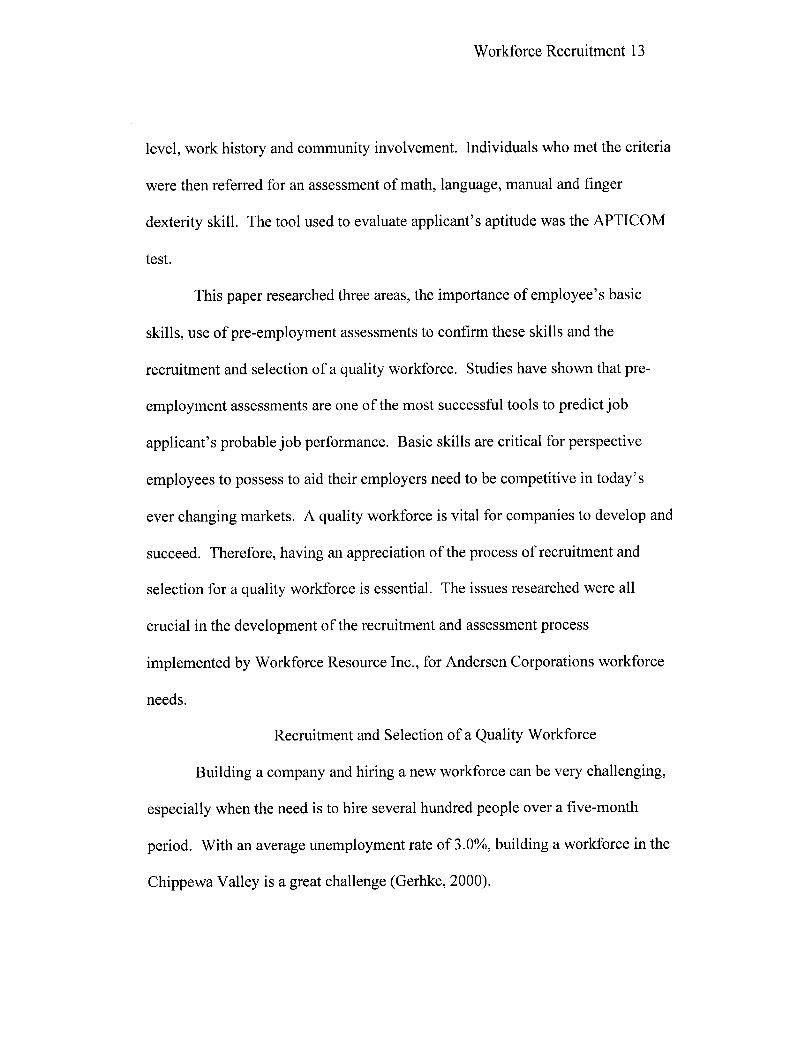
Workforce Recruitment 13
level, work history and community involvement. Individuals who met the criteria
were then referred for an assessment of math, language, manual and finger
dexterity skill. The tool used to evaluate applicant's aptitude was the APTICOM
test.
This paper researched three areas, the importance of employee's basic
skills, use of pre-employment assessments to confirm these skills and the
recruitment and selection of a quality workforce. Studies have shown that pre-
employment assessments are one of the most successful tools to predict job
applicant's probable job performance. Basic skills are critical for perspective
employees to possess to aid their employers need to be competitive in today's
ever changing markets. A quality workforce is vital for companies to develop and
succeed. Therefore, having an appreciation of the process of recruitment and
selection for a quality workforce is essential. The issues researched were all
crucial in the development of the recruitment and assessment process
implemented by Workforce Resource Inc., for Andersen Corporations workforce
needs.
Recruitment and Selection of a Quality Workforce
Building a company and hiring a new workforce can be very challenging,
especially when the need is to hire several hundred people over a five-month
period. With an average unemployment rate of 3.0%, building a workforce in the
Chippewa Valley is a great challenge (Gerhke, 2000).

Workforce Recruitment 14
To optimize the available workforce pool during the recruitment process,
it is pertinent to use as many resources as possible to draw a quality workforce.
To accomplish this the use of various sources such as existing employees,
newspaper advertisements, the Internet, press releases, and broadcast media are
often engaged (Canadian Manager, 1998). There is a draw back to utilizing such
an assortment of resources, applicants are attracted that may not have the skills
necessary for the position, thus make the selection process difficult and
challenging
According to Griffin (2000), when recruiting and selecting a quality
workforce, a new employer in the community must ensure that the long-term
vision and potential profitability of the company is shared with the community.
An employer with a positive public image will find recruitment efforts are greatly
enhanced and as a result more and better-qualified applicants will seek
employment with that employer (Mondy & Noe, 1996). In addition, a report from
Business West pertaining to a Lucas Group study indicates that in the recruitment
and selection of applicants in the current tight labor market, it is key to act quickly
when making an offer of employment to quality, competent candidates (Business
West, 2000).
Quality employees are key for a company to grow, manufacture a quality
product, and remain stable in the market (Griffin, 2000). The knowledge, skills
and abilities of your employees are crucial and will contribute to the growth and

Workforce Recruitment 15
prosperity of the company (Pollack, 2000). In the selection process of a new
employee is it important to determine the most desirable skills for the future
workforce? According to a study conducted by the American Society for
Training and Development in conjunction with the US Department of Labor, there
are specific skills an employer is looking for when recruiting and selecting quality
employees. These skills include: applicants who portray an interest in learning;
demonstrate good communication skills; have the ability to problem solve;
portray a high self-esteem; show motivation, and understand the importance of
teamwork (Clark, 1996).
Pre-employment Assessments
For a company to obtain a competitive edge in the market place today,
pre-employment assessment is essential. Advantages to pre-employment
assessments are increased productivity, job satisfaction, effective communication
and a reduction in turnover (Myers, 1998).
The use of pre-employment assessments as a tool for analyzing the
strengths and weaknesses of the job applicant will aid the employer in identifying
individuals for the provision of a quality workforce. When an employer hires an
applicant who meets the assessment criteria that the employer is seeking for a
quality employee, the employer will find that the employee will quickly fit in and
they become highly productive and profitable for the company. Research

Workforce Recruitment 16
confirms that individuals who were top performers on assessments proved to be
top producers (Walsh, 1999).
Testing is key in a tight labor market. Boeing, Seattle's aircraft maker,
extensively and successfully uses pre-employment testing for their assembly
workers. Integral parts of the assessment include work aptitude, which includes
math, verbal and spatial aspects. Boeing views pre-employment assessment as
critical in the recruitment process, to prevent the old nepotistic adage of "Your
father worked here so you can have a job here to," (Nicholson, 2000).
According to Waln (1999), research has proven that testing of applicants
increases the likelihood of hiring successful candidates who will increase
company profitability through the quality of their work and conscientiousness of
their work ethic. The US military and private business has successfully used
ability assessments for many years. These assessments measure general
intelligence such as basic language and math skills that are identifiers in how well
a person can solve problems (Waln, 1999). According to Mercer (1994), one of
the main reasons to evaluate applicants is to predict their aptitude in reference to
problem solving. Aptitude assessments accurately evaluate math, vocabulary,
grammar and the ability to deal with detail (Anfuso, 1995).
Companies who manufacture products find that when they use technology
such as computers on their assembly systems it is critical to perform pre-
employment testing. One study found that large portions of companies, 95%, use

Workforce Recruitment 17
pre-employment testing in their selection criteria (Smith, 1994). According to a
more recent study conducted by Corporate University Review, the American
Management Association discovered that seven out of 10 companies conduct pre-
employment assessments (Greenberg, 1999).
Aptitude assessments are one of the most successful predictors of an
employee's potential job performance. Research shows that applicants who
perform poorly on pre-employment assessments will perform poorly on the job
(Switchenberg, 1999).
The APTICOM which is the aptitude assessment tool used by Workforce
Resource to assess Andersen Corporation applicants is validated against the U.S.
Department of Labor's General Aptitude Test Battery (APTICOM, 2000). A
study by industrial psychologists John Hunter and Frank Schmidt shows that the
General Aptitude Test Battery effectively predicts job performance, as measured
by job evaluations and supervisors ratings. The National Research Council
performed approximately 100 studies that found the General Aptitude Test
Battery to be equally predictive for whites and minorities, therefore preventing
any discrimination in the testing process (D'Souza, 1995).
Assessment of Applicant Basic Skill
The employer's competitive edge in this global economy is its employee's
basic skill level such as reading, writing, computing and solving basic math
problems (Hays, 1999).
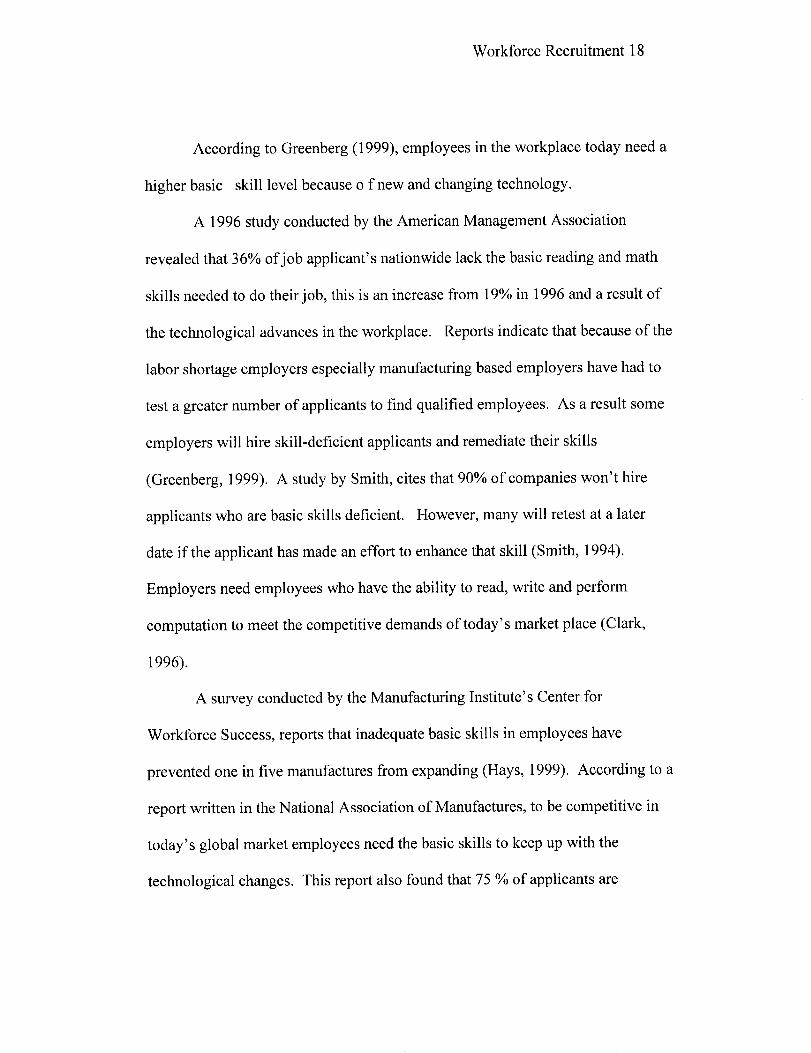
Workforce Recruitment 18
According to Greenberg (1999), employees in the workplace today need a
higher basic skill level because o f new and changing technology.
A 1996 study conducted by the American Management Association
revealed that 36% of job applicant's nationwide lack the basic reading and math
skills needed to do their job, this is an increase from 19% in 1996 and a result of
the technological advances in the workplace. Reports indicate that because of the
labor shortage employers especially manufacturing based employers have had to
test a greater number of applicants to find qualified employees. As a result some
employers will hire skill-deficient applicants and remediate their skills
(Greenberg, 1999). A study by Smith, cites that 90% of companies won't hire
applicants who are basic skills deficient. However, many will retest at a later
date if the applicant has made an effort to enhance that skill (Smith, 1994).
Employers need employees who have the ability to read, write and perform
computation to meet the competitive demands of today's market place (Clark,
1996).
A survey conducted by the Manufacturing Institute's Center for
Workforce Success, reports that inadequate basic skills in employees have
prevented one in five manufactures from expanding (Hays, 1999). According to a
report written in the National Association of Manufactures, to be competitive in
today's global market employees need the basic skills to keep up with the
technological changes. This report also found that 75 % of applicants are
Workforce Recruitment 19
considered unqualified by more than one quarter of the companies hiring. These
companies are declining these applicants based on inadequate skills in one or
more of the following basic skill areas: reading, writing, communication and/or
math (National Association of Manufactures, 2000). In a study conducted by
Hays, 1999, it was stated that an estimated 10 percent of Americans couldn't read
or write. Once these individuals enter the workforce it is difficult to identify them
because of their fear of admitting to their employer and/or family that they lack
these skills (Hays, 1999).
A study conducted by the National Institute for Literacy, employees who
lack the basic skills required for the job result in a $60 billion loss in productivity
for American companies each year. Reasons for this may include high-tech
assembly lines which may have complicated directions, employees who do not
understand shipping instructions or do not understand warning signs therefore
resulting in workplace accidents or damage to equipment. In order for companies
to remain competitive in today's global economy they demand the labor pool
from which they hire be well educated (Hays, 1999).
Georgia-Pacific is an example of a company who realized the importance
of basic skills literacy in the workplace to remain competitive. They worked with
representatives from the local technical college to develop an assessment tool
targeting the reading and math skills of both their employees and applicants.
Applicants whose scores were low were given the opportunity to attend training to

Workforce Recruitment 20
improve their basic skill level. Increases in basic skill levels were noted
following training. As a result, Georgia-Pacific has made it a requirement that all
individuals who apply to their company complete a basic skills course at a local
community college before applications are accepted and considered (Davis,
1997).
According to Parnell (1991), a large percentage of high school graduates
lack basic skills. The U.S. Department of Labor stated that teachers must
effectively teach these skills so that qualified workers have technical and basic
skills for success in today's workforce. It is imperative that teachers are educated
on the importance of basic skills in the workplace. Once teachers comprehend the
importance they can prepare their students to learn and understand how these
skills are applied in the work setting (Echternacht & Wen, 1997).
Most companies who manufacture products feel that a partnership
between business and education are a key process in the development of an entry-
level workforce. The National Association of Manufactures has made a dire
warning that if we do not train, prepare and develop young people prior to
entering the workforce, our competitive edge will be lost to other countries
(National Association of Manufactures, 2000).
Literature Summary
Employers have found that notifying the community through the use of
media of their immediate need to hire personnel proved to be successful.

Workforce Recruitment 21
Employers with a positive image are able to draw from a larger pool of
perspective employees because of this positive image.
The use of pre-employment testing as a tool in assessing applicants for
perspective employment is key to the success of developing a quality workforce.
And more specifically, assessment of basic math and language skills will assist in
determining the future productivity of the employee. Companies who use pre-
employment testing along with other assessment tool in the hiring process will
reap the benefits of a quality workforce therefore increasing profitability.
Evidence supported that the most pertinent basic skill for an employee to
possess is reading, writing, math and communication. One of the reasons for pre-
employment tests is to evaluate the competency of applicants in the basic skill
areas. These skills are necessary to adjust to the continual technological changes
that occur within a company. A workforce that possess these skills will more
quickly and skillfully adapt to change, therefore increasing the profitability of the
company.
Evidence suggests that there is a weakness in the educational system in
teaching the importance of basic skill as related to the workplace. The basic skills
that have shown to be the weakest are math, language and communication. These
are all essential in the workplace for successful problem solving and critical
thinking. It is a known fact that a minimum of 10 percent of Americans cannot
read or write, therefore reducing the available literate workforce to employers. It
Workforce Recruitment 22
is important for educators and employers to form a partnership. This partnership
will aid the educational community to fulfill the needs of employers regarding the
basic skills necessary for their potential workforce.
This study examined the variables used to assess Andersen Corporation
applicants and determine which variables were the most effective predictors of
hiring in the hiring process.

Workforce Recruitment 23
CHAPTER THREE
METHODOLOGY
Participants
Subjects for this study consisted of individuals from the Chippewa Valley
and the surrounding area who applied for advertised Production Associate
positions with Andersen Corporations, Menomonie, WI. facility. The number of
individuals responding to the advertisement placed by Andersen Corporation
through September of 2000 were 1,344. Data regarding race, gender and age of
the subjects was not available. From this pool of laborers, 254 did not satisfy the
initial requirements established by the investigator and Andersen Corporation.
The initial screening removed from the potential pool of laborers those that did
not meet the minimum level of a score of 12 out of a possible score of 20 on the
initial assessment tool. In addition, another 140 participants had scores ranging
above 12, but when called to be scheduled for assessment either did not show or
declined to proceed with the application process.
Instrument
There were two instruments used in the assessment process. The first
instrument was the application assessment criteria used to evaluate and assess
applicant's submitted application materials. The second instrument was the
Workforce Recruitment 24
APTICOM a computerized assessment of vocational aptitudes and educational
skill development.
Application Assessment Criteria
The application assessment criteria instrument included five specific
variables. These variables included communication skills, ability to follow
directions, education level, work history and community involvement. Each
variable was evaluated individually and the following numerical rating scale was
used. A rating of (2) if the applicant definitely met the criteria, a rating of (1) if
the applicant somewhat met the criteria and a rating of (0) if the applicant did not
meet the criteria. To assess communication skill these ratings were assigned to
the cover letter based on how well it was written and if it conveyed clear
concepts. The second section related to the ability to follow directions, including
if the applicant submit a cover letter and one page resume, was it submitted to the
Job Center, and did it include all information requested by Andersen Corporation
in the advertisement. The third section included education. Did the applicant
indicate he/she had a high school diploma, a high school equivalency diploma
(HSED) or a general equivalency diploma (GED)? The fourth section was work
history, did the applicant show stability in their work history and was their work
history relevant to manufacturing. The last criteria examined was whether or not
the applicant conveyed any level of community involvement. A complete copy of
the instrument is attached see Appendix A.

Workforce Recruitment 25
APTICOM
The APTICOM was an instrument developed and validated by the
Vocational Research Institute, a division of the Jewish Employment and
Vocational Service, Philadelphia, Pennsylvania. The specific sections of the
APTICOM that were used to assess Andersen Corporation applicants were finger
dexterity, manual dexterity, math and language skills Appendix B.
Andersen Corporation required a level 2 math aptitude for the production
associate position. Level 2 is equivalent to a grade level of 4-6. Applicants are
given a total of 15 minutes to complete level 1 through 4 of the math. A level 1 is
met when an applicant being assessed answers 5 correct questions out of 7
questions. Level 1 is equal to a grade level of 1-3. Level 1 measures ability to
add and subtract two digit numbers. Multiply and divide 10's and 100's by 2, 3,
4, and 5. Perform the four basic arithmetic operations with coins as part of a
dollar. Perform operations with units such as cup, pint and quart; inch, foot, yard;
and ounce and pound. A level 2 is met when an applicant being assessed answers
5 correct questions out of the 7 questions. Level 2 of math is equal to grade level
of 4-6. Level 2 measures the ability to add, subtract, multiply and divide all units
of measure. Perform the four operations with like common and decimal fractions.
Compute ratio, rate and percent. Draw and interpret bar graphs. Perform
arithmetic operations involving all American monetary units. Some of the
applicants also met a level 3 of math this is equal to 7-8 grade. A level 3 is met

Workforce Recruitment 26
when applicants being assessed answers 6 correct questions out of 8 questions.
Level 3 required applicants to compute discount, interest, profit and loss;
commission, markup and selling price; ratio and proportion and percentage.
Calculate surface, volumes, weights and measures; algebra and geometry. Refer
to Appendix C for math skill development instructions, Appendix D for example
of score cut-off for mastery of skill level and Appendix E for an analysis of the
results by topic area.
Andersen Corporation required a level 3-language aptitude for the
production associate position. A level 1 is met when an applicant being assessed
answers 5 correct questions out of 7 questions. A level 1 is equal to a grade level
of 1-3. A level 2 is met when an applicant being assessed answers 5 correct
questions out of 7 questions. A level 2 is equal to a grade level of 4-6. A level 3
is met when an applicant being assessed answers 6 correct questions out of 8
questions. A level 3 is equal to a grade level of 7-8. A level 4 is met when an
applicant being assessed answers 6 correct questions out of 8 questions. A level 4
is equal to a grade level of 9-12. Applicants are given a total of 10 minutes to
complete the language aptitude assessment. A level 1 assesses the ability to
recognize meanings of two or three syllable words. Compare similarities and
differences between words and series of numbers. Print simple sentences
containing subject, verb, object and series of numbers, names and addresses.
These individuals have the ability to speak simple sentences using normal word

Workforce Recruitment 27
order and present and past tense. A level 2 is equal to 4-6 grade level. Level 2
assesses the ability to use passive vocabulary, look up unfamiliar words in a
dictionary for meaning, spelling and pronunciation. Read instructions for
assembling an item. Write compound and complex sentences, using cursive style,
proper end punctuation and employing adjectives and adverbs. And the ability to
speak using pauses, emphasis, correct pronunciation, variations in word order,
using present and future tense. A level 3 of language skills is equal to 7-8 grade
level. Level 3 assesses the ability to read novels, atlases and encyclopedias. Read
safety rules, instructions in the use and maintenance of tools and equipment,
methods and procedures in mechanical drawings and layout work. These
individuals have the ability to write reports with proper format, punctuation,
spelling, grammar and using all parts of speech. They also have the ability to use
correct English when speaking. For language skill development instructions see
Appendix F, for example of score cut-off for mastery of skill level see Appendix
D and for an analysis of the results by topic area see Appendix E.
A score of at least 5 correct out of the 7 questions related to level 1 meant
the applicant had mastered level 1 or grade level 1-3. A score of at least 5 correct
out of the 7 questions related to level 2 meant the applicant had mastered level 2
or grade level 4-6. A score of at least 6 correct out of the 8 questions related to
level 3, which meant the applicant, mastered level 3 or 7-8 grade level.
Workforce Recruitment 28
Andersen Corporation required a minimum finger dexterity score of 80
percent for the production associate position. Participants were given 2 minutes
to work with the finger dexterity module. The dexterity module required
repetition beginning on the left side of the board, putting a spacer on a rivet and
moving them to a hole as fast as they can, then going to the right side of the board
and putting the spacer on the rivet and moving them to the hold as fast as they
can. Then going back to the left side and disassembling the pieces and putting
them back in their original spots and the same with the right side. They continued
this process for 2 minutes, see Appendix G for finger dexterity assessment
instructions, see Appendix H for example of finger dexterity module.
Andersen Corporation required a minimum manual dexterity score of 80
percent for the production associate position. Participants were given 2 minutes
to work with the manual dexterity module. The dexterity module required
repetition, turning the middle peg over with your dominate hand then moving the
pegs from the upper to the lower part of the board at the same time. Then going
back to the middle peg turning it and moving the pegs from the bottom to the
upper part of the board. They continued this process for 2 minutes, see Appendix
I for manual dexterity assessment instructions and Appendix H for an example of
the module.

Workforce Recruitment 29
Procedure
During the month of April and May, 2000 Andersen Corporation placed a
want ad in area newspapers and on Wisconsin's Job Net see Appendix J. The
advertisement stated the type of position available, what the qualifications were
for the position and how to apply. Once the application was submitted the staff of
Workforce Resource reviewed the application material based on the criteria
outline in instrument one Appendix A. The highest total score for all variables
used in Instrument one was 20. Individuals with scores of 12 or higher were
referred on for assessment of manual, finger, math and language skills.
Applicants were assessed in groups of five. The skills assessment took
approximately one hour, and Workforce Resource staff then interpreted the
results. For instrument two, the minimum score required of individuals in the
four criteria/variables assessed were as follows: Finger and manual dexterity = 80
percent or more; Math = GED level 2, equivalent to fourth to sixth grade school
level; Language = GED level 3, equivalent to seventh to eight grade school level
Appendix K. Applicants who met the minimum criteria were then referred on to
Andersen Corporation to be considered for an interview. Those who did not meet
the minimum criteria in math and language were allowed to be retested following
a referral to their local technical college for remediation in that skill area. Once
they remediated the skill area they were told they could contact Workforce

Workforce Recruitment 30
Resource to be scheduled for a reassessment in the area in which they did not
meet a minimum standard, individuals were given three opportunities to reassess.

Workforce Recruitment 31
CHAPTER FOUR
RESULTS
Tables 1 through 12 contain the results from the assessment tools
employed in instrument one. These were communication skills, ability to clearly
follow directions and convey concise ideas, education level, relevant work
history, stability of work history and finally community involvement. As a result
of analysis of the tools employed in instrument one, 82% of the applicants were
allowed to participate in the second round of screenings related to finger and
manual dexterity, math and language aptitudes.
Ability to Follow Directions
Tables 1 through 3 measure the ability of applicants to follow directions.
The advertisement in local newspapers and the job order on Wisconsin's JobNet
specifically requested the following: a cover letter, one page resume and that the
materials be submitted to the Dunn County Job Center. It also indicated that the
production associate must have a willingness to learn multiple tasks (positions),
have a team-focused attitude and ability to think independently. Table 1 and 2
reports that approximately 90% of the applicants provided a cover letter and one
page resume and submitted it to the Job Center as directed.

Workforce Recruitment 32
Table 1
Frequency of those meeting the criteria of Cover Letter/Resume
Frequency Valid Percent
Valid Does Not Meet Criteria 9 9.0
Somewhat Meets Criteria 7 .6
Definitely Meets Criteria 993 90.4
Total 1,099 100.0
Missing System 245
Total 1,344
Table 2
Frequency of those meeting the criteria of Submitting materials to the Job Center
Frequency Valid Percent
Valid Does Not Meet Criteria 70 6.4
Definitely Meets Criteria 1,029 93.5
Total 1,099 100.0
Missing System 245
Total 1,344

Workforce Recruitment 33
Table 3 reports that only 33% of the applicants provided all the information
requested such as reference to a team-focused attitude and willingness to learn
multiple tasks/positions. As a result many applicants failed to garner all of the
points available to them by not providing all of the requested information in their
cover letter and resume.
Table 3
Frequency of those meeting the criteria of All Information Included
Frequency Valid Percent
Valid Does Not Meet Criteria 129 11.7
Somewhat Meets Criteria+0 610 55.5
Definitely Meets Criteria 360 32.8
Total 1,099 100.0
Missing System 245
Total 1,344

Workforce Recruitment 34
Cover Letter Criteria
Table 4 and 5 report the measured results of the criteria regarding the
number of errors related to grammar, spelling, whether the cover letter was typed
or whether it conveyed clear concepts. In the qualification section of the
advertisement, it was stated that a cover letter and good communication skills
were required for the position. Table 4 shows that only 39% of the applicants met
all of the requirements for the cover letter.
Table 4
Frequency of those meeting the criteria of Cover Letter Rating
Frequency Valid Percent
Valid Does Not Meet Criteria 245 22.3
Somewhat Meets Criteria 431 39.2
Definitely Meets Criteria 423 38.5
Total 1,099 100.0
Missing System 245
Total 1,344

Workforce Recruitment 35
Table 5 shows that 63% of the applicants conveyed clear concepts within
the cover letter. It appeared that the cover letter rating criteria were somewhat
more discriminating amongst applicants on whether they would be referred on to
the next level of the application process.
Table 5
Frequency of those meeting the criteria of Conveys Clear Concepts
Frequency Valid Percent
Valid Does Not Meet Criteria 121 11.0
Somewhat Meets Criteria 282 25.7
Definitely Meets Criteria 696 63.3
Total 1,099 100.0
Missing System 245
Total 1,344

Workforce Recruitment 36
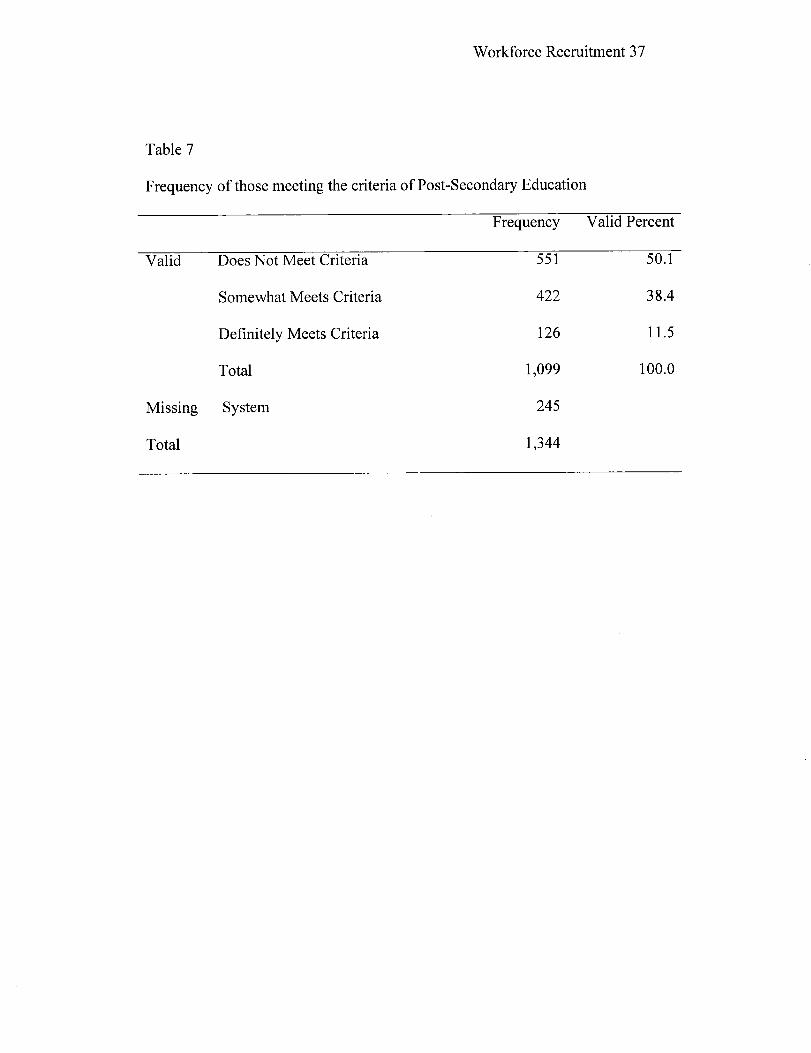
Education Criteria
The next criteria used in evaluation of applicants related to education
level. Table 6 and 7 measures education level of the labor pool and distinguishes
between high school and post secondary educated applicants. A required
qualification of the production associate position is that the participant have a
High School diploma or equivalent (High School Equivalency diploma-HSED or
a General Education Diploma-GED. Table 6 reports 85% of the applicants met
this qualification and among the available applying labor pool in the Chippewa
Valley only approximately 12% had a post secondary education, and another 38%
had some training program or equivalent that would relate to education beyond
the High School degree.
Table 6
Frequency of those meeting the criteria of High School Diploma, HSED, GED
Frequency Valid Percent
Valid Does Not Meet Criteria 139 12.6
Somewhat Meets Criteria 26 2.4
Definitely Meets Criteria 934 85.0
Total 1,099 100.0
Missing System 245
Total 1,344
Workforce Recruitment 37
Table 7
Frequency of those meeting the criteria of Post-Secondary Education
Frequency Valid Percent
Valid Does Not Meet Criteria 551 50.1
Somewhat Meets Criteria 422 38.4
Definitely Meets Criteria 126 11.5
Total 1,099 100.0
Missing System 245
Total 1,344

Workforce Recruitment 38
Work History
Work history appears to have able been very valuable tool in
distinguishing viable applicants for the production associate position. Table 8
reports stability of work history.
Table 8
Frequency of those meeting the criteria of Stability (Length Employed) 2-3 years
Frequency Valid Percent
Valid Does Not Meet Criteria 163 14.8
Somewhat Meets Criteria 48 4.4
Definitely Meets Criteria 888 80.8
Total 1,099 100.0
Missing System 245
Total 1,344

Workforce Recruitment 39
Table 9 shows that slightly less than 45% of the applicants had any
relevant work experience. Andersen Corporation considered applicant who had a
manufacturing background to have relevant work experience. Thus this variable
proved to be a valuable discriminating tool amongst applicants.
Table 9
Frequency of those meeting the criteria of Relevant Experience
Frequency Valid Percent
Valid Does Not Meet Criteria 348 31.7
Somewhat Meets Criteria 262 23.8
Definitely Meets Criteria 489 44.5
Total 1,099 100.0
Missing System 245
Total 1,344

Workforce Recruitment 40
Community Involvement
Andersen Corporation portrays and values a strong philosophy regarding
the community service amongst its employees. Andersen Corporation had
specified that this variable be considered when assessing application materials.
Table 10 reports community involvement, surprisingly, only approximately 16%
of the applicants expressed some level of involvement in their community and
thus it appears to be another highly distinguishing variable among applicants.
Table 10
Frequency of those meeting the criteria of Community Involvement
Frequency Valid Percent
Valid Does Not Meet Criteria 919 83.6
Somewhat Meets Criteria 75 6.8
Definitely Meets Criteria 105 9.6
Total 1,099 100.0
Missing System 245
Total 1,344

Workforce Recruitment 41
Total Qualification Score and Percent Referred for Assessment Met
As previously mentioned, a total score for this portion of the assessment
process was calculated by the establishment of a point system. Each variable had
the potential for providing the applicant with 2 points if he/she definitely met the
requirement, 1 point if the applicant only somewhat and 0 points if the applicant
did not meet the criteria. Table 11 shows the average score of all applicants
following the testing provided in instrument one. Of 1,099 individuals assessed,
the mean score was approximately 13 out of 20 with a standard deviation of 4.1
points.
Table 11
Average Total Qualification Scores for Referral for Assessment
N Minimum Maximum Mean Std.Deviation
Total Assessment 1,099 .00 20.00 12.96 4.1
Score 1,099
Valid N (listwise)

Workforce Recruitment 42
Table 12 reports that based on a previously established score of 12 or
more, 254 applicants were not referred on for further assessment or approximately
19%. Of those referred on for the math, language and dexterity assessment, only
950 or 71% of the original 1,344 applicants chose to continue in the selection
process.
Even though 1,089 people were referred for assessment, not all of them
chose to go any further in the selection process. Of those referred, 950 (71% of
the original 1,344 applicants) continued in the selection process.
Table 12
Frequency of those meeting the criteria of Referred for Assessment
Frequency Valid Percent
Valid Yes 1,090 81.1
No 254 18.9
Total 1,344 100.0
Total 1,344
Workforce Recruitment 43
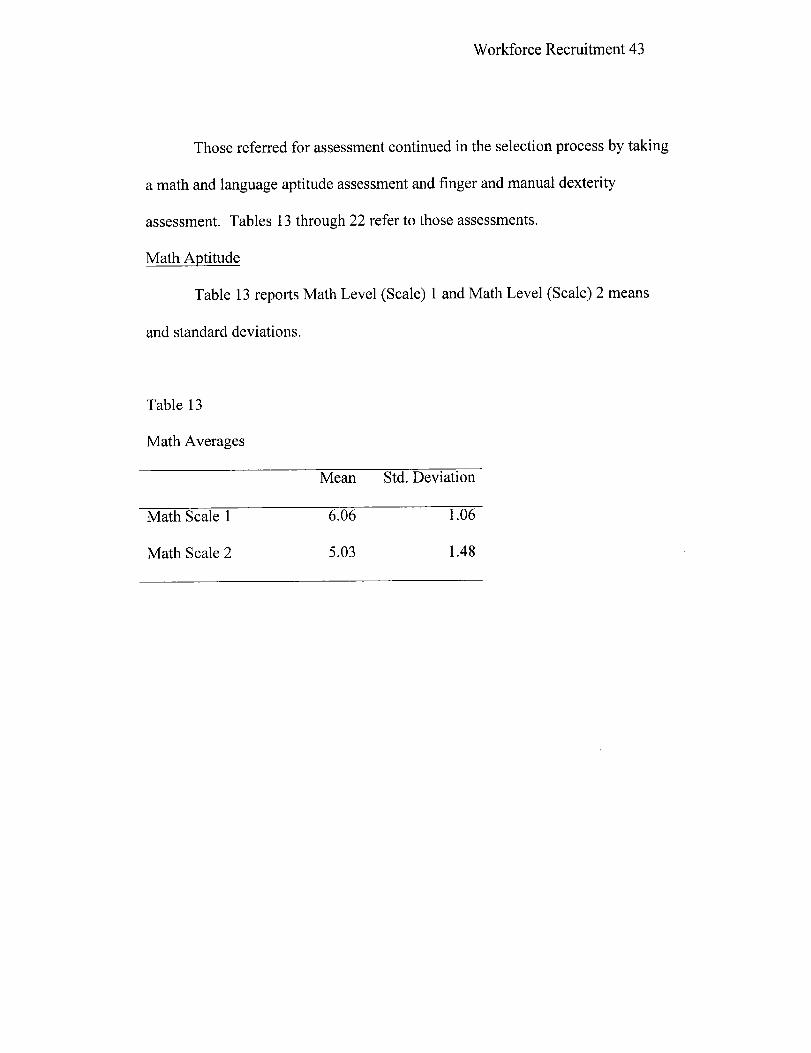
Those referred for assessment continued in the selection process by taking
a math and language aptitude assessment and finger and manual dexterity
assessment. Tables 13 through 22 refer to those assessments.
Math Aptitude
Table 13 reports Math Level (Scale) 1 and Math Level (Scale) 2 means
and standard deviations.
Table 13
Math Averages
Mean Std. Deviation
Math Scale 1 6.06 1.06
Math Scale 2 5.03 1.48
Workforce Recruitment 44
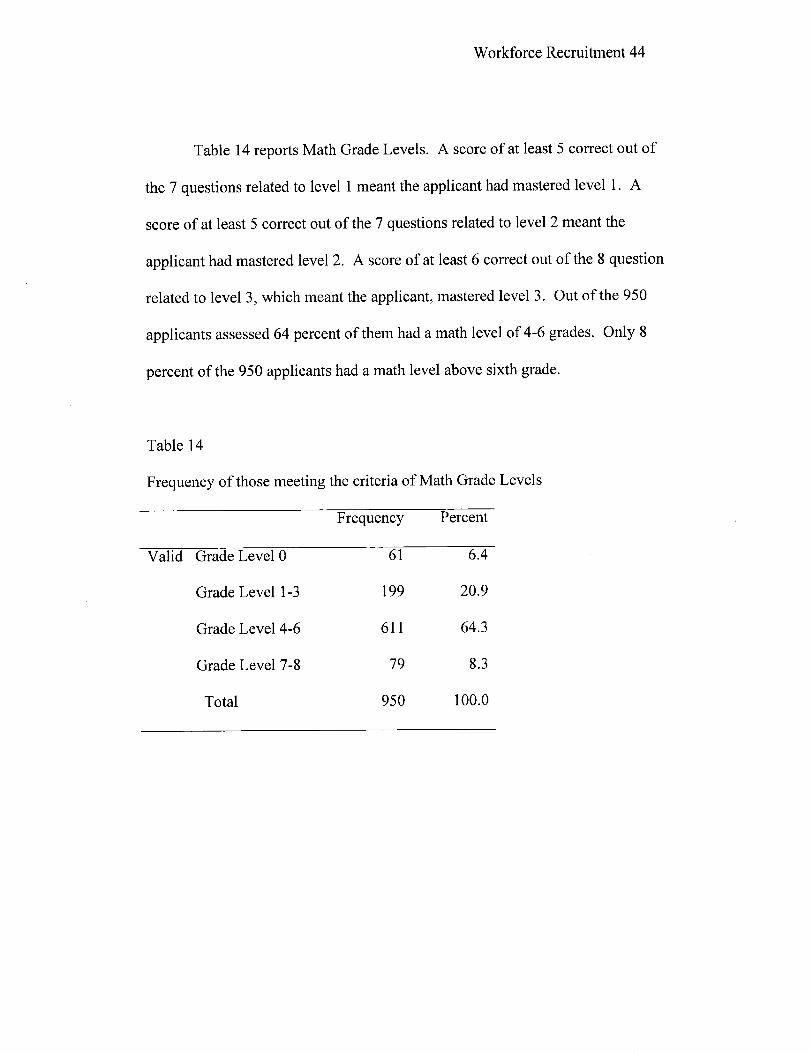
Table 14 reports Math Grade Levels. A score of at least 5 correct out of
the 7 questions related to level 1 meant the applicant had mastered level 1. A
score of at least 5 correct out of the 7 questions related to level 2 meant the
applicant had mastered level 2. A score of at least 6 correct out of the 8 question
related to level 3, which meant the applicant, mastered level 3. Out of the 950
applicants assessed 64 percent of them had a math level of 4-6 grades. Only 8
percent of the 950 applicants had a math level above sixth grade.
Table 14
Frequency of those meeting the criteria of Math Grade Levels
Frequency Percent
Valid Grade Level 0 61 6.4
Grade Level 1-3 199 20.9
Grade Level 4-6 611 64.3
Grade Level 7-8 79 8.3
Total 950 100.0

Workforce Recruitment 45
Language Aptitude
Table 15 reports Language levels (Scale) 1, 2 and 3 average mean and
standard deviation.
Table 15
Language Averages
Mean Std. Deviation
Language Scale 1 6.65 .80
Language Scale 2 5.73 1.05
Language Scale 3 7.03 1.45

Workforce Recruitment 46
Table 16 reports the results of the language aptitude tests. The majority
of applicants (89%) mastered a language level of grade 7 or above. It appears that
according to the standards required by Andersen Corporation, that the math
aptitude assessment was more highly discriminating among applicants than the
language aptitude assessment.
Table 16
Frequency of those meeting the criteria of Language Grade Levels
Frequency Percent
Valid Grade Level 0 16 1.7
Grade Level 1-3 24 2.5
Grade Level 4-6 63 6.6
Grade Level 7-8 584 61.5
Grade Level 9-12 263 27.7
Total 950 100.0
Workforce Recruitment 47
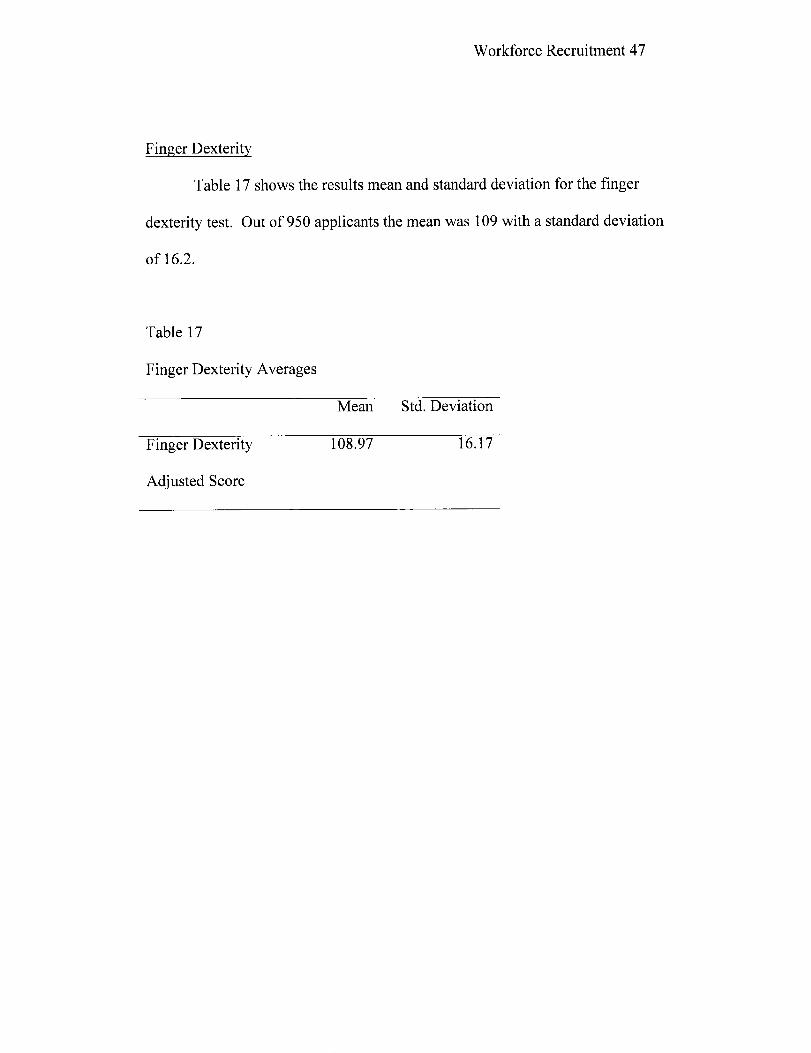
Finger Dexterity
Table 17 shows the results mean and standard deviation for the finger
dexterity test. Out of 950 applicants the mean was 109 with a standard deviation
of 16.2.
Table 17
Finger Dexterity Averages
Mean Std. Deviation
Finger Dexterity 108.97 16.17
Adjusted Score

Workforce Recruitment 48
Table 18 reports Finger Dexterity Levels. A minimum score of 80 was
required by Andersen Corporation to be considered for the production associate
positions. Ninety nine percent of the 950 participants had a score of 80 or higher.
Table 18
Frequency of those meeting the criteria of Finger Dexterity Qualification
Frequency Valid Percent
Valid Qualified at 80 or Higher 939 98.8
Not Qualified 11 1.2
Total 950 100.0

Workforce Recruitment 49
Manual Dexterity
Table 19 shows the results mean and standard deviation for the manual
dexterity test. Out of 950 applicants the mean was 129 with a standard deviation
of 11.7.
Table 19
Manual Dexterity Averages
Mean Std. Deviation
Manual Dexterity 128.73 11.64
Adjusted Score

Workforce Recruitment 50
Table 20 reports a minimum score of 80 was required to be considered for
the production associate positions. 99.6 % of the 950 participants had a score of
80 or higher.
Table 20
Frequency of those meeting the criteria of Manual Dexterity Qualification
Frequency Valid Percent
Valid Qualified at 80 or Higher 946 99.6
Not Qualified 4 .4
Total 950 100.0

Workforce Recruitment 51
Retested for Math and Language Qualifications
Following the language and math aptitude test, a number of individuals
took the opportunity to retake the tests after not meeting the levels required by
Andersen Corporation. Table 21 reports that 6 percent of the total participants, or
57 individuals, took the opportunity to retake the math assessment because their
initial math level was under level 2.
Table 21
Frequency of those meeting the criteria of Retest Math
Frequency Percent
Valid Yes 57 6.0
No 893 94.0
Total 950 100.0

Workforce Recruitment 52
Table 22 reports that 2 % of the participants, or 18 individuals, retested in
language because their language level was under level 3.
Table 22
Frequency of those meeting the criteria of Retest Language
Frequency Percent
Valid Yes 18 1.9
No 932 98.1
Total 950 100.0

Workforce Recruitment 53
Referral for Interview
Table 23 reports the number and percent of those who meet the skills
assessment criteria and were referred for an interview. Of those assessed 70
percent were referred for an interview. Thirty percent did not meet the minimum
criteria and were not referred for an interview.
Table 23
Frequency of those meeting the criteria of Referred/Not Referred for an Interview
Frequency Percent
Valid Referred for Interview 661 69.6
Not Referred for Interview 289 30.4
Total 950 100.0
Workforce Recruitment 54
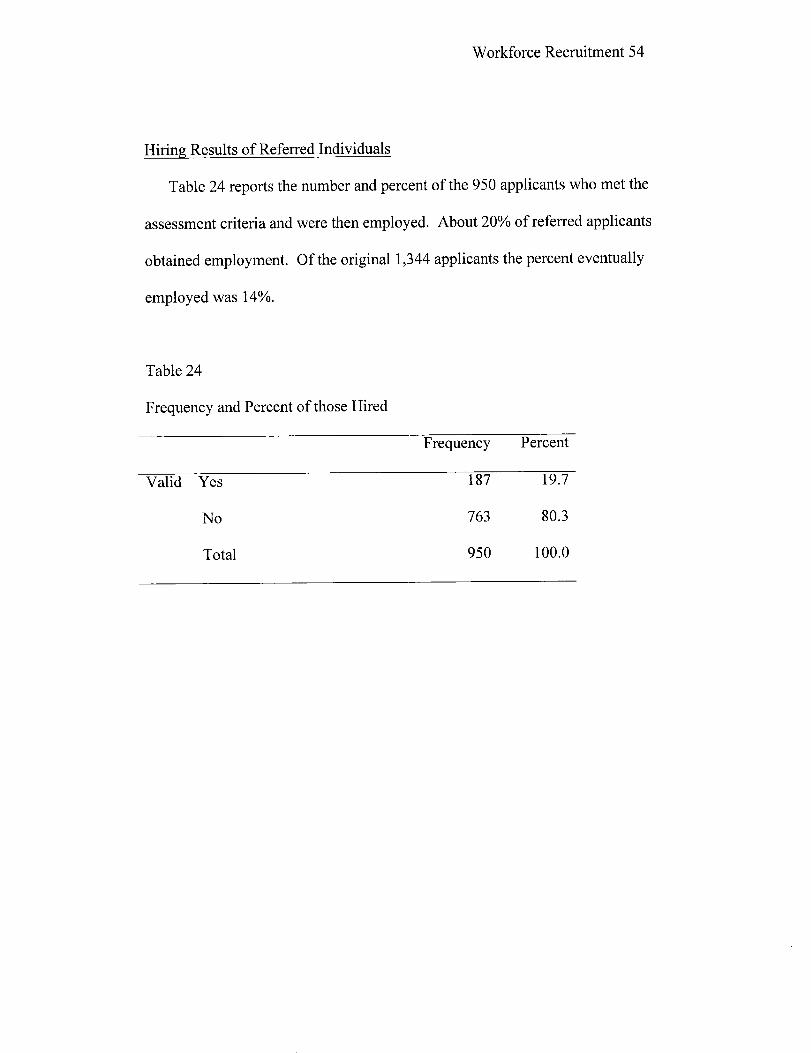
Hiring Results of Referred Individuals
Table 24 reports the number and percent of the 950 applicants who met the
assessment criteria and were then employed. About 20% of referred applicants
obtained employment. Of the original 1,344 applicants the percent eventually
employed was 14%.
Table 24
Frequency and Percent of those Hired
Frequency Percent
Valid Yes 187 19.7
No 763 80.3
Total 950 100.0

Workforce Recruitment 55
Relationships between Assessment Criteria and Employment
Each of the initial assessment criteria was significantly related to obtaining
employment, with the exception of community involvement. People who
somewhat or definitely met each of those criteria were significantly more likely to
be employed. Tables 25 through 33 report those results.
Table 25 shows that crosstabulation of cover letter rating by hired or not
hired category the chi square result was X2=18.01(2);p<.01.
Table 25
Cover Letter Rating by Hired Crosstabulation
Count
Hired
Yes No Total
Cover Letter Does Not Meet Criteria 15 230 245
Rating Somewhat Meets Criteria 76 355 431
Definitely Meets Criteria 55 368 423
Total 146 953 1,099

Workforce Recruitment 56
Table 26 shows the crosstabulation of the ability to convey clear concepts
rating by hired or not hired category. The chi square result was
X2=16.07(2);p<.01.
Table 26
Conveys Clear Concepts by Hired Crosstabulation
Count
Hired
Yes No Total
Conveys Clear Does Not Meet Criteria 2 119 121
Concept Somewhat Meets Criteria 40 242 282
Definitely Meets Criteria 104 592 696
Total 146 953 1,099

Workforce Recruitment 57
Table 27 shows the crosstablulation of submitting a cover letter and
resume rating by hired or not hired categories. The chi square result was
x 2=14.23(2);p<.01.
Table 27
Submit Cover Letter/Resume by Hired Crosstabulation
Count
Hired
Yes No Total
Submit Cover Does Not Meet Criteria 1 98 99
Letter/Resume Somewhat Meets Criteria 1 6 7
Definitely Meets Criteria 144 849 993
Total 146 953 1,099

Workforce Recruitment 58
Table 28 shows the crosstabulation of submitting application materials to
the Job Center rating by hired or not hired categories. The chi square result was
X2=1 1.63(2);p<.01.
Table 28
Submitted to Job Center by Hired Crosstabulation
Count
Hired
Yes No Total
Submitted to Does Not Meet Criteria 0 70 70
Job Center Definitely Meets Criteria 146 882 1,028
Total 146 953 1,099

Workforce Recruitment 59
Table 29 shows the crosstablutation of inclusion of all information rating
by hired or not hired category. The chi square result was X2=19.82(2);p<.01.
Table 29
All Information Included by Hired Crosstabulation
Count
Hired
Yes No Total
Submit Cover Does Not Meet Criteria 1 98 99
Letter/Resume Somewhat Meets Criteria 1 6 7
Definitely Meets Criteria 144 849 993
Total 146 953 1,099

Workforce Recruitment 60
Table 30 shows the crosstablution of high school diploma, HSED or GED
rating by hired or not hired category. The chi square result was 217.74(2);p<.01.
Table 30
High School Diploma, HSED, GED by Hired Crosstabulation
Count
Hired
Yes No Total
High School Does Not Meet Criteria 4 135 139
Diploma, HSED, GED Somewhat Meets Criteria 1 25 26
Definitely Meets Criteria 141 793 934
Total 146 953 1,099

Workforce Recruitment 61
Table 31 shows the crosstablulation of post-secondary education by hired
or not hired category. The chi square result was X2=8.87(2);p<.01.
Table 31
Post-Secondary Education by Hired Crosstabulation
Count
Hired
Yes No Total
Post Secondary Does Not Meet Criteria 57 494 551
Education Somewhat Meets Criteria 66 356 422
Definitely Meets Criteria 23 103 126
Total 146 953 1,099
Workforce Recruitment 62
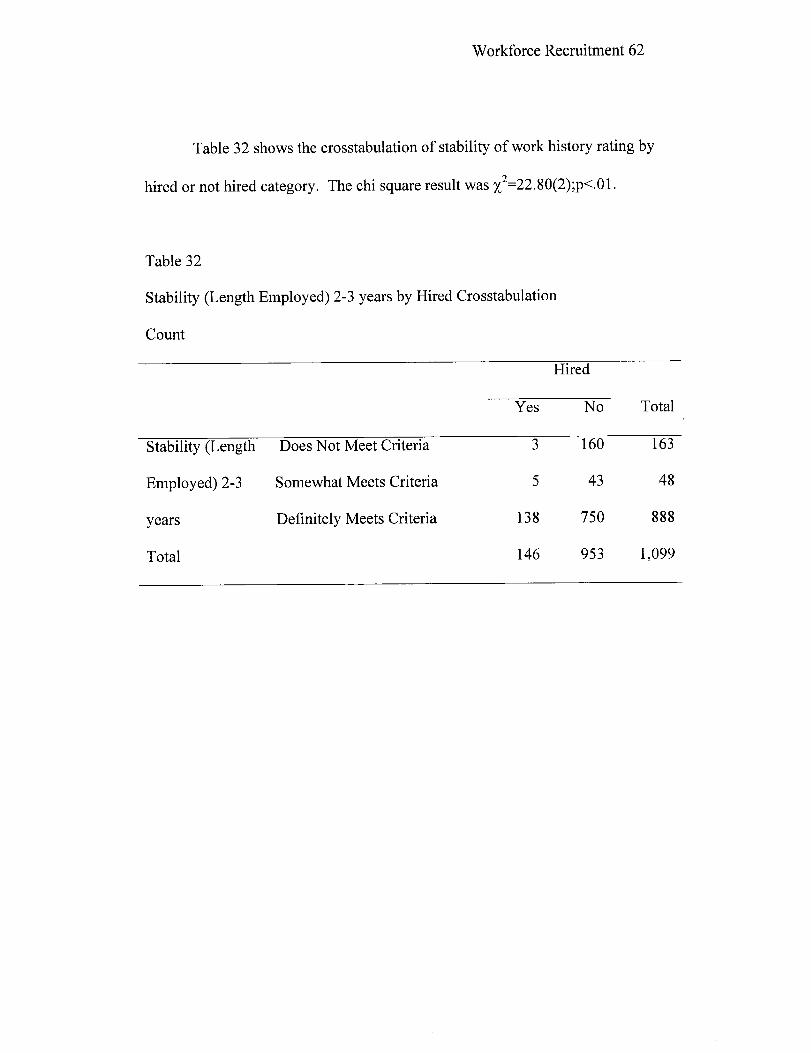
Table 32 shows the crosstabulation of stability of work history rating by
hired or not hired category. The chi square result was X2=22.8 0 (2 );p<.01.
Table 32
Stability (Length Employed) 2-3 years by Hired Crosstabulation
Count
Hired
Yes No Total
Stability (Length Does Not Meet Criteria 3 160 163
Employed) 2-3 Somewhat Meets Criteria 5 43 48
years Definitely Meets Criteria 138 750 888
Total 146 953 1,099
Workforce Recruitment 63
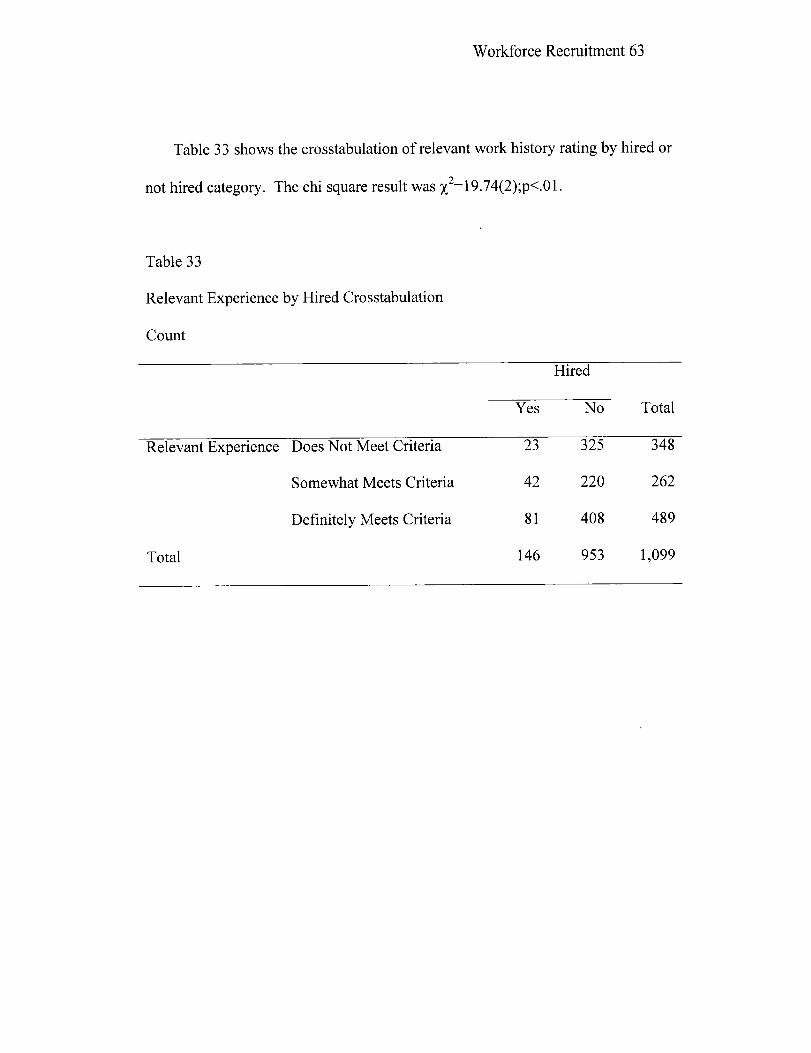
Table 33 shows the crosstabulation of relevant work history rating by hired or
not hired category. The chi square result was X2 =19.74(2);p<.01.
Table 33
Relevant Experience by Hired Crosstabulation
Count
Hired
Yes No Total
Relevant Experience Does Not Meet Criteria 23 325 348
Somewhat Meets Criteria 42 220 262
Definitely Meets Criteria 81 408 489
Total 146 953 1,099

Workforce Recruitment 64
Table 34 showed the means and standard deviations for a t test comparing
total assessment scores for those hired and not hired showed significantly higher
assessment scores for those hired (t=5.87, df=1097, p<.01). This result is reported
in Table 34.
Table 34
T-Test Comparing Total Assessment Scores for Those Hired and Not HiredHired N Mean Std. Deviation
Total Assessment Score Yes 146 14.79 1.60
No 953 12.68 4.30

Workforce Recruitment 65
Chi Square analyses were used to examine the relationships between each
final assessment criterion (following referral for final assessment based on initial
assessment results) and whether the applicant was or was not hired. These
analyses revealed which assessment criteria actually discriminated among
applicants for employment.
Table 35 shows the crosstabulation of math grade levels rating by hired or
not hired category. The chi square result was X2 =88.2(3);p<.01. Higher levels of
math were related to hiring success.
Table 35
Math Level by Hired Crosstabulation
Count
Hired
Yes No Total
Math Grade Level 0 61 61
Level Grade Level 1-3 0 200 200
Grade Level 4-6 167 444 611
Grade Level 7-8 20 58 78
Total 187 763 950

Workforce Recruitment 66
Table 36 reports the mean math score for hired applicants was M=2.11
(SD=2.31) while the mean for those not hired was M=1.65 (SD=2.73). This
difference in average scores was statistically significant (t=8.26, df=948, p<.01).
Table 36
Math Score Averages for Hired and Not Hired
Hired N Mean Std. Deviation
Total Math Score Yes 146 2.11 2.31
No 953 1.65 2.73
Workforce Recruitment 67
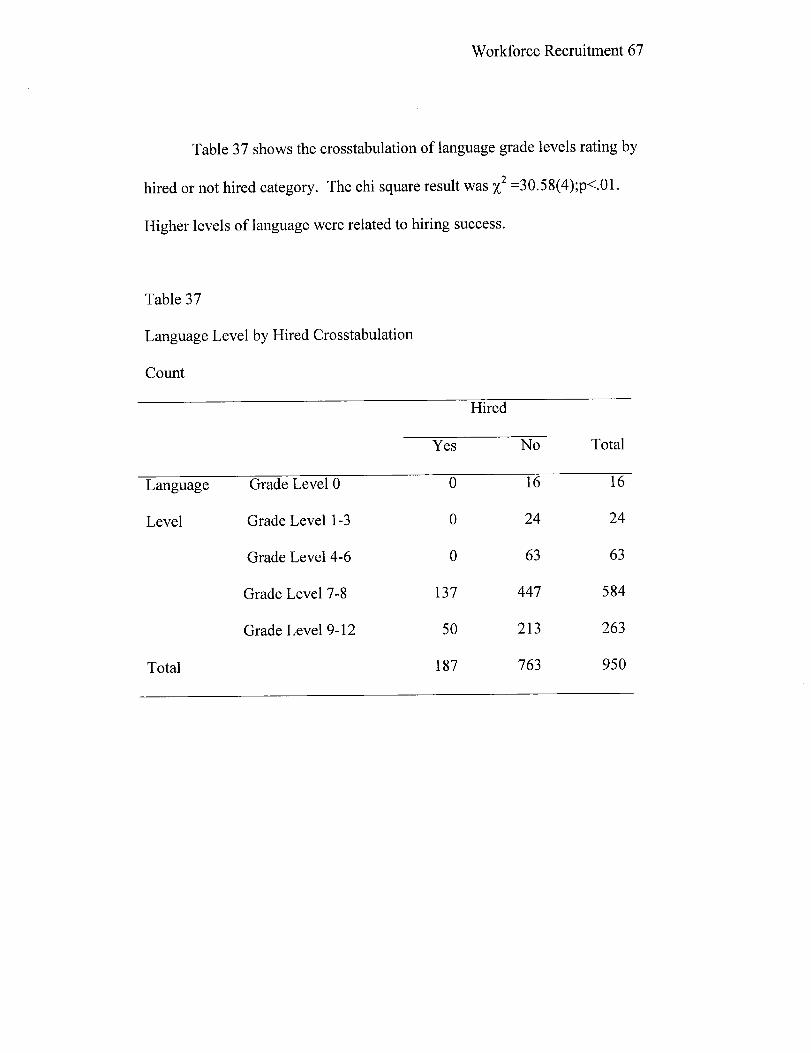
Table 37 shows the crosstabulation of language grade levels rating by
hired or not hired category. The chi square result was x2 =30.5 8(4 );p<.01.
Higher levels of language were related to hiring success.
Table 37
Language Level by Hired Crosstabulation
Count
Hired
Yes No Total
Language Grade Level 0 0 16 16
Level Grade Level 1-3 0 24 24
Grade Level 4-6 0 63 63
Grade Level 7-8 137 447 584
Grade Level 9-12 50 213 263
Total 187 763 950

Workforce Recruitment 68
Table 38 The mean language score for hired applicants was M=3.27
(SD=.44) while the mean for those not hired was M=3.07 (SD=.82). This
difference in average scores was statistically significant (t=3.17, df=948, p<.05).
Table 38
Language Score Averages for Hired and Not Hired
Hired N Mean Std. Deviation
Total Language Yes 146 3.27 .44
Score No 953 3.07 .82

Workforce Recruitment 69
When applicants were given the opportunities to retest for math and
language qualifications, many of them not only retested, but also were eventually
hired. Making efforts to remediate in math and language paid definite dividends
for employment. Table 39 reports the percent of applicants hired after retesting
for the math.
Table 39
Frequency and Percent of Hired after Math Retest
Frequency Percent
Valid Yes 30 52.6
No 27 47.4
Total 57 100.0
a. Retest Math = Yes

Workforce Recruitment 70
Table 40 reports the percent hired after language retest.
Table 40
Percent Hired after Language Retest
Frequency Percent
Valid Yes 12 66.7
No 6 33.3
Total 18 100.0
a. Retest Language = Yes
Workforce Recruitment 71
Differences Between Those Hired and Not Hired
To determine if there was a difference between those individuals hired and
those not hired and the selection variables a discriminant analysis was employed.
Discriminant analysis is a valuable tool in this situation because there are to very
distinct groups those hired and those not hired, which is a prerequisite for the use
of this tool. For this assessment 22 variables, which were used to differentiate
among hired and non-hired individuals. Initially each variable was analyzed
individually. Table 41 reports the results of the discriminant analysis. The results
showed that of these predictive variables none of them were significant regarding
the difference between those hired and those not hired. However, of those 22
variables there were six variables that showed to have the most impact on those
hired and those not hired, those six variable in order were referred/not referred for
an interview .881, retest Math .829, retest language .807, cover letter rating .796,
manual dexterity .790 and stability (length employed) 2-3 years .786.

Workforce Recruitment 72
Table 41
Discriminant Analysis - Equality of Group Means
Wilks'
Lambda F Sig.Math Scale 1 .987 9.594 .002Math Scale 2 .923 61.895 .000Math Level .918 65.790 .000Language Scale 1 .995 3.459 .063Language Scale 2 .998 1.805 .179Language Scale 3 .986 10.824 .001Language Level .986 10.837 .001Finger Dexterity Adjusted Score .997 1.934 .165Finger Dexterity Qualification .996 2.728 .099Manual Dexterity Adjusted Score .990 2.698 .006Manual Dexterity Qualification .999 .980 .322Referred/Not Referred for an Interview .881 99.569 .000Retest Math .923 61.333 .000Retest Language .963 28.366 .000Cover Letter Rating .988 8.976 .003Conveys Clear Concepts .993 5.395 .020Submit Cover Letter/Resume .999 .571 .450All Information Included .999 .743 .389High School Diploma, HSED, GED .999 .558 .455Post Secondary Education .999 .989 .320Stability (Length Employed) 2-3 years .998 1.606 .205Relevant Experience .999 .947 .331
Workforce Recruitment 73
CHAPTER FIVE
DISCUSSION
This paper examined the effectiveness of instruments and variables used
by Workforce Resource, Inc., in the assessment process of identifying qualified
applicants for the position of production associate for Andersen Corporation's,
Menomonie facility. Through this research we have identified the best predictors
of which skills or variables were necessary for an individual to have in order for
them to be hired as a production associate. In addition, due to the large number of
individuals analyzed, the investigator was able to report means (averages) of math
and language skills for the available manufacturing labor pool in West Central
Wisconsin.
Data was analyzed on each of the nine variables used to initially assess an
individual's application materials. The purpose of this analysis was to classify
individuals into one of three categories: individuals who did not meet, somewhat
met and definitely met the criteria previously established for each variable. Based
on pre-set standards, individuals meeting a 12 out of 20 points were selected and
referred on for assessment of math, language, manual and finger dexterity skills.
This study also determined if any or all of the initial nine variables employed
were of value to Workforce Resource, Inc., and Andersen Corporation in
discriminating amongst the most qualified applicants within the application pool.

Workforce Recruitment 74
From the data collected it was reported that of the initial pool of 1,344
applicants 82% expressed the cognitive ability to read and follow directions as
specified in the advertisement. Eighty one percent of the initial applicant pool
were referred for assessment.
The second portion of the application process employed tools that
analyzed and assessed an individual's math and language aptitude as well as
manual and finger dexterity. From the resulting analysis, it was shown that math
aptitude appeared to be the most highly discriminating of these variables among
the potential group of hired versus non-hired individuals. Data indicted that only
8% of those assessed had a higher than sixth grade math level. These findings are
consistent with a study conducted by the American Management Association,
which revealed that 36% of job applicants nationwide lack the basic reading and
math skills needed to do their job. This data suggests that there is a lack of
retention of math skills of individuals once they leave secondary educational
institutions and move into employment.
A crosstabulation analysis was employed of all 22 variables used in the
selection and assessment process. This was carried out to determine which
variables were associated significantly with the group of hired individuals and
conversely with the non-hired group. Data suggested that each of the initial
assessment criterion with the exception of community involvement was distinctly
related to individuals obtaining employment.
Workforce Recruitment 75
Andersen Corporation preferred that applicants have a stable work history
with no gaps during the past 2-3 years. Only 80% of the applicants met this
criterion, thus suggesting that this variable was of relative importance in the
assessment of application materials and whether an applicant would be selected
for further assessment.
Finger dexterity and manual dexterity were not significantly related to
hiring success. Most applicants met dexterity criteria. Consequently those
criteria did not discriminate for employment decisions.
No one variable stood out as being significant in determining an
individual's progression through the hiring process. Results indicated that
applicants needed to score highly in each of the nine variables as well as those
variables relating to math, language, finger and manual dexterity in order to be
referred on for an interview.
To determine the differences between those individuals hired and not hired
a discriminate analysis was employed. The results showed, of the nine variables
used to assess the initial application materials, the two most important variables
were the clarity of the cover letter and the stability of the applicant's employment
history. Regarding the math and language assessments, data indicates the
importance of training and reassessment of math skills was the ultimate success of
an individual in being hired. Of those who retook the math assessment, 53% were
hired and 67% of those who retook the language assessment were hired. This

Workforce Recruitment 76
data indicate that individuals who make the effort to remediate and up grade their
skill levels have a much higher success rate in the hiring process versus
individuals who do not make an effort.
Demographics such as gender and age were not gathered for this study.
This data would have been valuable to gather to investigate the potential
correlation with other variables used in this hiring process.
Additional research may include a comparison of pre and post scores of
those individuals retested in math and language. This comparison would
determine if the educational development levels were increased due to taking the
same test a second time or remediating the skill.
Of those individuals assessed for finger dexterity, 99% had a score of 80
or higher and manual dexterity 99.6% had a score of 80 or higher. It is suggested
by the investigator that this assessment be employed in the future by Andersen
Corporation and other Corporations hiring for similar manufacturing positions.
They may want to consider increasing the cutoff score to 92 -108 which would be
in the proper range for this position. This would aid the interviewers in
discriminating amongst potential employees.
Workforce Recruitment 77
References
Anfuso, D. (1995). Look beyond skills when making hiring decisions.Personnel Journal, 74, 94-95.
APTICOM, (2000). [on-line] Available: www.vri.org/apticom/index.htm
Business West (2000). Tight Employment Market Affecting RecruitmentPractices. 66-67.
Canadian Manager (1998). Why traditional hiring systems don't work. 16-18.
Clark, S. (1996). Seven key skills that execs seek in job candidates.Philadelphia Business Journal, 15, 27-30.
Davis, M. (1997). Getting workers back to the basics. Training &Development, 51, 14-16.
D'Souza, D. (1995). The testing trap. Chief Executive, 107, 50-52.
Echternacht, L., & Wen, L. (1997). The importance of workplace basicscompetencies (scans) as perceived by beginning business... College StudentJournal, 31, 37-45.
Gerhke, B. (2000). West Central Wisconsin Labor Force and EmploymentEstimates. West Central Employment Review (Department of WorkforceDevelopment),2
Greenberg, R., (1999). Job seekers' basic skills score low. CorporateUniversity Review, 7, 10-12.
Griffin, F., & Fox, J. (2000). Facing Up to Labor Shortage. Compensation& Benefits Review, 32, 34-40.
Hays, S., (1999). The ABC's of Workplace Literacy. Workforce, 78, 70-75.
Klecka, W., (1986). Discriminant Analysis, Beverly Hills, California:SAGE Publications, Inc.

Workforce Recruitment 78
Management Review, (1999). 1999 AMA Survey on Workplace Testing.44-48.
Mercer, M., (1994). Use pre-employment tests. HR Focus, 71, 3-5.
Mondy, R., & Noe, R., (1996). Recruitment. Human Resource Management(pp.150-154). New Jersey: A Simon & Schuster Company.
Myers, M., (1998). Employee assessments vital to competitiveness.Business Journal: Serving Jacksonville & Northeast Florida, 13, 21-24.
National Association of Manufactures. (2000). Available:www.nam.org/workforce /survey.html
Nicholson, G., (2000). PRE-EMPLOYMENT SCREENING. Workforce79, 72-76.
Occupational Outlook Quarterly, 43 (1999). 17
Pollack, P., (2000). Four fundamentals for hiring your first employees.Business Journal Serving Charlotte & the Metropolitan Area, 15, 24-26.
Smith, B., (1994). Growth slows in basic skills testing. HR Focus, 71, 21.
Switchenberg, B., (1999). Hiring and Keeping Employees. WaterEngineering & Management, 146, 7-8.
Waln, R., (1999). Proper employment testing can predict success on job.Kansas City Business Journal, 18, 31-33.
Walsh, T., (1999). Hiring by design, not by chemistry. Business Journal(Central New York, 8, 17-19.

Workforce Recruitment 79
ANDERSEN CORPORATION
Applicant _ Date Submitted;_Phone:Screener: Date:
Assessment of Application Desnitely Somewhat Does Nol TotinaFinal Ases sment DoeNoCriteria ('required) Meets (2) Meets (l) Meet(o) Pt. Criteria Meets M, et
1. Comnuncation skills . · 1. Math I' .-Cover letter well written ' . Language -Conveys clear concepts _3. FinaBrerxtrit 2. Ability tofollow directions: 4. Marnl exter ty *Suomit cover letter/resume (lpg) ' : .T:-Submitted to Job Center _-Ali information included_
-HS Diploma, HSED. GED -Post Secondary Education; Program: . -
4. Work>HIistty . ^ /^• ' - • ,• , -;,^ y.. F -' »v^ "-Stability (length employed) 2-3 yrs' : _,-Relevant experience
5ciinui itnvolveiientiFi -
TOTAL ____ ___________
.,Srhedule for Assessmenl _ Non-Selct
__ Assessrrent Dale _ Date Letter Sen.... .'.. i.—Final Refer: Non-Refer: — [
Dote of Rele'ral;

Workforce Recruitment 80
Appendix B Workforce Recruitment 80
Vocational and Career Assessment that Works
l Aptitudes measured by,Apticom:
l• -••':!•.l£?o General Learning Ability
Numerical Aptitudea Form Perception
I^I"^^..fill:. <e Motor Coordination
e Manual Dexterity
Apticom is the premier career assessment * Verbal Aptitudesystem for special needs populations. The use of e Spatial Aptitude
a dedicated computer and a game like format i Clerical Perceptionmake Apticom fun to take and eases the anxiety e Finger Dexterityof being "tested". Eye-Hand-Foot
CoordinationWithin 90 minutes Apticom delivers a multiple Coordination
aptitude battery, interest inventory and educational nterest Areas measuredskills battery in one easy to administer device. The b Apticom:use of a single platform to present the three batteriesallows for the production of a single report which Artisticintegrates the information and presents vocational Srecommendations.Scien e Plants and Animals
The aptitude battery is validated against the U. S. a ProtectiveDepartment of Labor's General Aptitude Battery and e Mechanicalthe interest inventory is validated against the U. S. e IndustrialEmployment Service interest inventory. e Business Detail
l SellingThe Apticom is also available in a Spanish bi-lingual a Accommodatingversion that allows both the administration and e Humanitarianreporting functions to be conducted in English or ain - nunin
S sLeading - InfluencingSpanish. j I Physical Performing
Apticom's reports can be printed on its dedicated Okidata® printer or can be downloaded to a PC For E ational Skiprinting. Click here for :d measured by Apticom:
* Mathematicso Language
Rsc a neirt s prod-uct ;nffrrnaios-mn/! vrn /Fr>,icec R e qL1a?:~"R f

Workforce Recruitment 81
Appendix C Workforce Recruitment 81
Test InstructionsTEST 2: MATH SKILLS DEVELOPMENT
Time Limit: 151 Minutes
Test Panels: Math Skills Development PracticeMath Skills Development (02)
Probe Position: Plug into left or right side, depending on preferred hand forexaminee.
Begin with Math Skills Development Practice Panel mounted on APTICOM console.Check the TEST PATTERN window to make sure that "00" appears. Read aloud:
]. )IHISiTEST S lNEfDElCTOlMASl YURMT
Check to make sure the TEST PATTERN WINDOW displays "00". DepresstheSTART button and continue:
Allow time for answering the three questions, then proceed:
Depress S TOP button f time has not yet expired.ipthepanel (orhavethe exam-inee do so) to reveal the test side. Mount the panel so that the "02" appears in theupper right-hand comer. Check the TEST PATTERN window to make sure that "02"is displayed. Depress the START button as you say:
57
I~~~~~ ~~~ S-lllillSIBIIIBISIIIS
"° ~ ~ BGNNW __..>< '- '-- 57

Workforce Recruitment 82
Appendix D Workforce Recruitment 82
APTICOM A5B. PAGE 4
NAME: ID#: DATE:
EDUCATIONAL SKILLS DEVELOPMENT BATTERYCOMPREHENSIVE SCORE REPORT
SECTION I. SCALE SCORES
The table below reports the number of correct responses, thenumber of items attempted and the highest possible score for eachscale within the mathematics and language tests. When an "X" isreported in the far right column, under " Cut-Off Achieved ", the"X" indicates that there is evidence that you have mastered skillsat' the- identified level(s).
Educational Number Number Maximum Cut-offDevelopment Level Correct Attempted Score Achieved
Language 1 7 7 7 XLanguage 2 6 7 7 XLanguage 3 8 8 8 XLanguage 4 6 8 8 X
Math 1 5 7 7 xMath 2 4 7 7Math 3 3 8 8Math 4 1 8 8

Workforce Recruitment 83
Appendix E Workforce Recauitment 83-
APTICOM A5B -- PAGE 5
NAME: IDt: DATE:-
SECTION II. PERFORMANCE ANALYSIS
The table below reports an analysis of your results by topicarea. The number reported to the left of a slash is the number ofcorrect responses; the number to the right of a slash is the numberof items of that type on the test. A review of these findings mayhelp you identify your areas of greatest strength or weakness
A. LANGUAGE DEVELOPMENT
Topic Area Scale 1 Scale 2 Scale 3 Scale 4 Totals
Spell/Vocab 2/ 2 1/ 1 3/ 3Vocabulary. 2/ 2 3/ 3 5/ 5 4/ 4 14/14Ref'Skills 1/ 1 0/ 1 1/ i 1/ 1 3/ 4Punct/Caps 1/ 1 1/ 1 1/ 1 3/ 3Verb Forms 1/ 1 2/ 2 1 1 0/ 2 4/ 6
Totals....... 7/ 7 6/ 7 8/ 8 6/ 8 27/30
B. MATHEMATICS DEVELOPMENT
Topic Area Scale l Scale 2 Scale 3 Scale 4. Totali
Computation 4/ 6 -- 2/ 4 0/ 2 6/12Measurement 1/ 1 1/ 1 2/ 2Ratio/Percent 1/ 2 2/ 3 3/ 5Algebra O/ 1 0/ 2 0/ 3Geometry 1/ 2 1/ 2 2/ 4Trigonometry 0/ 4 0/ 4
Totals....... 5/ 7 4/ 7 3/ 8 1/ 8 13/30
• • •.:-",.• •' ' / -'$ . ••.

Workforce Recruitment 84
Appendix F Workforce Recruitment 84
Test InstructionsTEST 1: LANGUAGE SKILLS DEVELOPMENT
Time Umi: I0 Minutes
Test Panels: Language Skills Development PracticeLanguage Skills Development (01)
Probe Position: Plug into left or right side, depending on preferred hand forexaminee.
Begin with Language Skills Development Practice panel mounted on APTICOMconsole. Check the TEST PATTERN window to make sure that "00" appears. Readaloud:
NOWTHAT YOU KNOW HOW.TO USE THEPROBE, LEr.T GOoN T( THE iRST iTiET,
LANGUAG('SKILLS DEVELOPMENT. THIS TESTIS NTEND
STENGTHS IN USING THENGLtSHLAI ND
I-WHERE YOU OULDDEVELOP GREATER SKILLHEE I.
ENTIONDSOFOUESTIONSONTHTESTPSERl
PLEASEiR E S
Depress the START button. Allow time for answering the three questions; then pro-ceed:
I: ~~~~~CtieE •COBI ANSfLOrPlBHill #l III H
: (;T-YOS S ETU 'E'"
Continue on next page

Workforce Recruitment 85
Appendix G Workforce Recruitment 85
Test Instructions
TEST 7: FINGER DEXTERITYTime Limit: 2 Minutes
Test Panels: None
Probe Position: Probe must be removed.Dexterity Module: Place module so that words "RIVET", 'SPACER" and "ASSEM-
BLY" are horizontal and the lower edge of the module is alignedwith the edge of the table top. Place rivets and spacers in holesrespectively labelled "RIVET" and "SPACER". Place spare rivetsand spacers in holes labelled SPARES.Set MANUAL/FINGER switch on FINGER.Check Test Pattern window for pattern number "07".Substitute words in parentheses for left-handed examinees.
Begin with examinee seated and parts disassembled, inserted in appropriateholes.
NOW YOU ARE GOING TO WORK WITH THE DEXTERITY MODULE FOR A TEST OF CI:
FINGER DEXTERITY. PLEASE DO NOT MOVE ANY RIVETS OR SPACERS UNTIL I TELL
YOU TO BEGIN.
Point to left rivet, spacer and assembly hole and then right rivet, spacer andassembly hole.
YOU AR.E GOING TO PUT THIS SPACER ON THIS RIVET AND MOVE THEM TO THiS-:-
HOLE:AS FiSAS YOU CAN. NEXT, YOU ARE GOING TO PUTTHIS SACERON THIS
RIVET AN MOVETHEM TO THIS HOLE AS FAT AS YOU CAN, THEN YV -ARE-,· : , .f-.^ ' -'' - -. .' -;.: : ': .. : ..-,::.'. ,.S: , .
GOIN0i T APART THE ASSEMBLIES AN PUT EAH PIECE A'ACKWH
Test administrator should be seated, in front of dexterity module, and shouldask examinee(s) to. stand alongside and watch. Demonstrate.complete cycle(left then right assembly, then successive left and right disassembly), twice.When inserting rivet in spacer, insert rivet into spacer opening which wasoriginally within the dexterity module.
Push START button.
Continue on next page

Workforce Recruitment 86
Appendix G Workforce Recruitment 86
PIUTE RIYET WITH YOUl RIGHT HAND (LEFT HAND); USE YOUR LEFT HAND.
(RIITHANT CPkf UPTHIE SACIR AND PUT IT ON THE RIVET. THEN. ODING
Timefr I YcU nHTsHAD LET HAND) e IN c ouTTHE mINTO THiSiHOlE.oDOlTHE
$asem w d HEE P mantS hELIGHT GOES ON WseN BOylm ASSEWLIES ARE IN
-;semb e E YeURR T H (LEf HAND) TO r iesolE THE RIVET FROM tHE
s palY lla THE FT.OCE THE RIVET IS OUT RMOVE .TH SPACERWITH
movI.ed HADitHT HANt' REPLACE THEa PiECES IN THEIR OtRIGINAL HOLES .l
00 :9O+AFRTHING FOR THE PAR~TSONTHEN ' Ri(4T WHEN ALL TESEPARAE
;pIC W A INN.N EIPLTH E LIGHTGOES ON. .^•^ '^ .- ;0:,
Push STOP button.
YOU WIL KEEP PUTTING THE SPAERS AND RIVETS rHER, THEN TA^ NG
THEMAP , FA AS YOU CA UNTILTIME UP.NOWYO WILL AVE A
Push START button, and then say
BEGIN..
Time for 30 seconds. If necessary, encourage examinee to simultaneouslypick up rivet and spacer for assembly phase. Make sure test-taker placesassembly with dominant hand. During disassembly, make sure examinee hirstdisassembles on lett side of board. The rivet should first be extracted Irom thespacer and hole with the dominant hand and then the spacer should be re-moved with the non-dominant hand. Encourage the examinee to replacepieces simultaneously.
STOPI
Begin test with parts disassembled, inserted in appropriate holes.
Continue on next page

Workforce Recruitment 87
Appendix G Workforce Recruitment 87
YOU WILL HAVE 2 MINUTES FOR THIS TEST. PUT SPACERS AND RIVETS TOGETHER
AND TAKE THEM APART AS FAST AS YOU CAN. IF YOU DROP A RIVET OR SPACER
ON THE FLOOR. USE ONE OF THE SPARE PARTS.
Push START button, and then say:
-BEG. IN.' -• :' — . ' • . . ;•- " - .
(Alter the administration of Ihis test, move the dexterity toggle switch on theback of APTICOM to "MANUAL" position.)
Note: If rivets or spacers are removed from holes prior to depression ofSTART button. APTICOM will not be correctly programmed! Rivets andspacers must be in "slart" position when START button is depressed:

Workforce Recruitment 88
Appendix H Workforce Redrultment 88
Manual DexterityInsturment
^^_ . .____ __
I I i(
OPERATERESET EB
SYSTIIM aL
vI ) v(D (aDSTART SEQENCe BATTERY
STOP PRINT FINOER
OEXERITY MAU
® "" FOOTCONTROL BOX PRINTER CONTROL
M M~iiOW:;8i- 1) c." @::i 0
V0 <®D
Finger Dexterity insturment
0 0
,FTI~' o ( o
0 0UKMM.* MMMILV~~~~~~~~~~~~~~~~~~~,r'

Workforce Recruitment 89
Appendix I or or ce
Test InstructionsTEST 9: MANUAL DEXTERITY
Time Limit: iF MinutesTest Panels: None
Probe Position: Probe must be removed.
Dexterity Module: Place module so that words "MOVE" and "IURN" are horizontaland the lower edge or the module is aligned with the edge of thetable lop. Place the peg with protrusion in middle hole with protru-sion directed upward. Place a regular peg in each of the two topholes. Place spare pegs in holes labelled SPARES.
Set MANUAL/FINGER switch on MANUAL.
Check rest Pattern window for pattern number "09".
Substitute words in parentheses for left-handed examinees.
Begin with examinee(s) standing and pegs in upper holes. Peg with protrusionshould be seated in middle hole. wide end down
Point
--: '. •'f'U I'"....Ts PEfs: S
TWs! ad1L3stra N lE MoldE LE PEi AmGIN AND ak
Test administralor should sit n Iront of dexterity module and ask oxaminee(s)to stand alongside and watch. Demonstrate full cycle (rotation of middle peg,sirnullaneous movement of upper pegs to botlom, rotation of middle peg,simullaneols movement of lower pegs to top), twice.
Push START and say:
Continue on next page

Workforce Recruitment 90
Appendix I Workforce Recruitment 90
Push STOP button.
Push START button, and then say:
Time for 30 seconds.
Begin test with pegs in upper holes and middle peg wide end down.
Push START, and then say:
(After administration of this test, move dexterity toggle switch on back ofAPTICOM to FINGER position.)
Note: If a peg is removed from a hole prior to depression of START button,APTICOM will not be correctly programmedl All pegs must be in placewhen START is depressed.

Workforce Recruitment 91
Appendix J Workforce Recruitment 91
Asas prud memberofthiscommunity. Andersen liinCoporatiorn is grateful or the eantusiasm that cu Rhas been generated by the consbuction of its new assembly facility In Menomonirt Wi. For those ot youwho would like to join us there, we offer the followingtinfoirnation and suggestions:
Produtction Associates attdPettlons Available: We will graduaily be hiring a ,,total ofB(120Produrctin Assciales over thecu Cre;of the coming year to work in our assmbly work .center. This is a unniquey interesting position. equir-ing evefy Asoiate to learn attd perfom a variety f ' arrmbly funcionrs. The first start date will bie ate-ay.
aualrfications: ;* HIh sdcho dip a or HSED prfeterted
Fexibility and wilhingness to leam multiple psilins
· Team-oumsed attiude
Good coimunmicans skills
Ability to tink independently
· 2-3 years' wor experence preiel d
To Apply: Pleas submit a one-agontly resume plkucar llwer lo: Dunn County Job Cener, 401 TechnologyDr. EaS, SueB200, Menomoni. Wt 547tS1 E
Compensatlon: $10hr. to sar, upto $13hr. within2 years, with an opporlunity of up to SI 4/hr.
Bmirt: Medital. dental. pension. 40 l(k), employeestock ownership program, proft sharing
'T*7hose of you who have Balready submitted your /lcredentials directly to .Anderson,' please re- ..apply in the manner
t--edabo-.
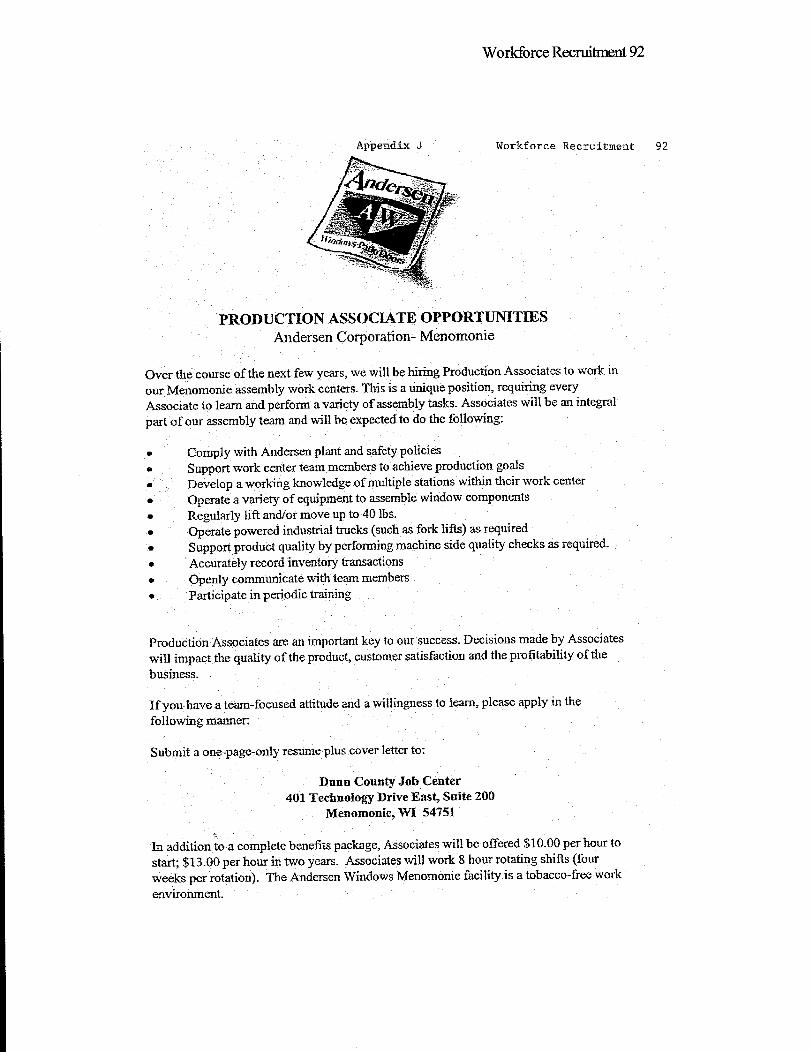
Workforce Recruitment 92
Appendix J Workforce Recruitment 92
PRODUCTION ASSOCIATE OPPORTUNITIESAndersen Corporation- Menomonie
Over the course of the next few years, we will be hiring Production Associates to work in
our Menomonie assembly work centers. This is a unique position, requiring every
Associate to learn and perform a variety of assembly tasks. Associates will be an integral
part of our assembly team and will be expected to do the following:
· Comply with Andersen plant and safety policiesSupport work center team members to achieve production goals
0 Develop a working knowledge of multiple stations within their work center
* Operate a variety of equipment to assemble window components
• Regularly lift and/or move up to 40 Ibs.* Operate powered industrial trucks (such as fork lifts) as required
Support product quality by performing machine side quality checks as required.
• Accurately record inventory transactions* Openly communicate with team members• Participate in periodic training
Production Associates are an important key to our success. Decisions made by Associates
will impact the quality of the product, customer satisfaction and the profitability of the
business.
If you have a team-focused attitude and a willingness to learn, please apply in the
following manner:
Submit a one-page-only resume plus cover letter to:
Dunn County Job Center401 Technology Drive East, Suite 200
Menomonie, WI 54751
In addition to a complete benefits package, Associates will be offered $10.00 per hour to
start; $13.00 per hour in two years. Associates will work 8 hour rotating shifts (four
weeks per rotation). The Andersen Windows Menomonie facility is a tobacco-free work
environment.

Workforce Recruitment 93
"'f -. 'l-i0, II: l : ii, ltl4rt.f : L ^-.
Appendix J Workforce Recruitment 93
1 ANDERSEN CORPORATIONJOB DESCRIPTION
JOR CODE: NrA TITLE: Production Asocsiat
DEPARTMENT: Menomonie ManufacKurinf GRADE: Hourly FLSA: Non-exempt
SUMMARY: Perforrms repetitive work station or line assembly operations to assemble components into a
complete window unit by performing the following duties:
ESSENTIAL DUTIES AND RESPONSIBILITIES:
Performs any assembly-type functions, using hand or power tools.
Operates pneumatic nailers and staplers to fasten window components.
Operates frame nailer to assemble the wooden window frame.
Hand assist pumping system to glue covers to frames,
Lifts, secures, and fastens window sash into frame.
Operates sash pinner to assemble sash components.
Lifts and places glass lights into sash frame.
polls and presses glazing bead roll around glass perimeter.
Places window unil into carton and manually transport to pick-up area.
Rotates through multiple work stations on a daily basis.
Records inventory transactions using required tools and software,
Openly coinmunicates wilh team leader. service person, and other team members to maintain production
flow.
Performs and records machine side quality checks as required. Reads and interprets process data.
Interacts in team pass-down and completes housekeeping responsibilities.
Operates powered industrial trucks (such as fork lifts) as required.
Operates any equipmenl needed to perform job.
performs related duties as needed by supervision.
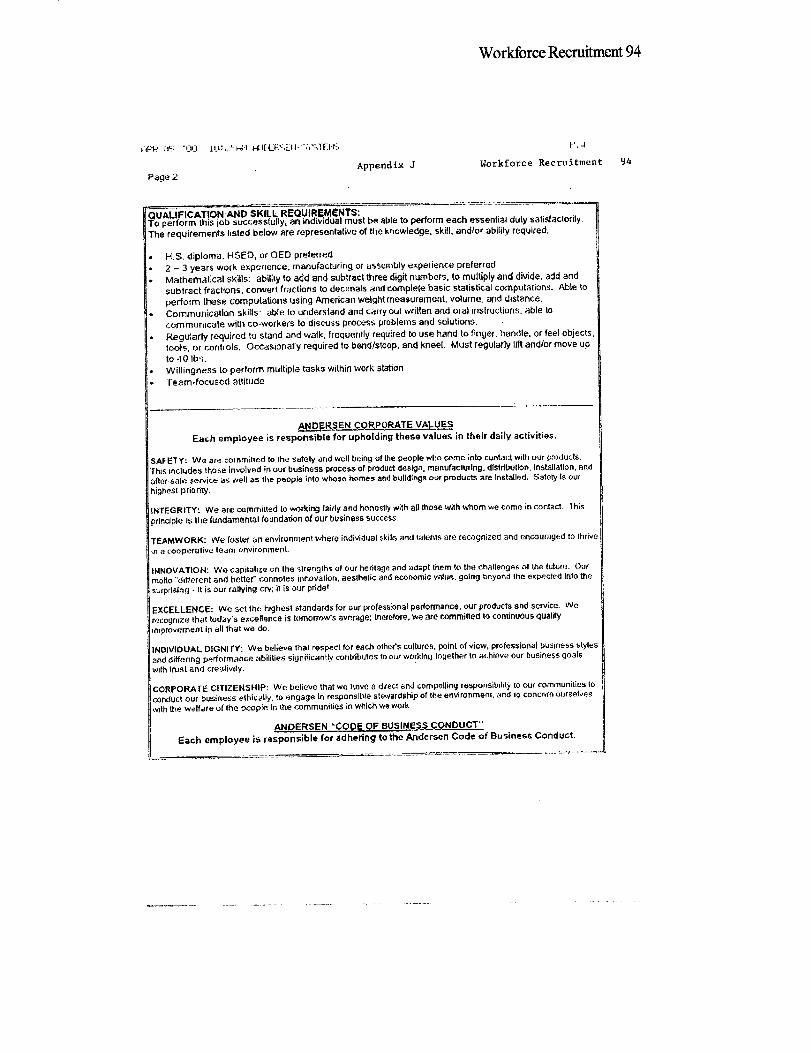
Workforce Recruitment 94
iF-•' n'7 'LI. 1 I:..H;•I HII[,IF"tLF" I -U-,',TEI'r•. P. 4
Appendix J Workforce Recruitment 94
Page 2
QUALIFICATION-AND SKILL REQUIREMENTS:To perform this job successfully, an individual must be able to perform each essential duty salisfaclorly.
The requirements listed below are representative of the knowledge, skill, and/or ability required.
* H.S, diploma. HSED, or GED preferred
2 - 3 years work experience, manufacturing or assembly experience preferred
. Mathematical skills: ability to add and subtract three digit numbers, to multiply and divide. add and
subtract fractions, convert fractions to decimals and complete basic statistical computations. Able to
perform these computations using American weight measurement, volume. and distance.
* Communication skills: able to understand and carry out written and oral inslructions, able lo
communicate with co-workers to discuss process problems and solutions.
Regularly required to stand and walk, frequently required to use hand to finger. handle, or feel objects,
tools, or controls. Occasionally required to bend/stoop, and kneel. Must regularly lift and/or move up
to 40 Ibs.. Willingness to perform multiple tasks within work station
* Team-focused attitude
ANDERSEN CORPORATE VALUES
Each employee is responsible for upholding these values in their daily activities.
SAFETY: We are committed to the safely and well being of the people who come into contact with our pruducts.
rhis includes those involved in our business process of product design. manufacturing. distribution. Installation, and
aftur-sale ervice as well as the people into whose homes and buildings our products are Installed. Safety Is our
highest priority.
INTEGRITY: We are committed to working fairly and honestly with all those with whom we come in contact. this
principle Is the fundamental foundation of our business success
TEAMWORK: We foster an environment where individual skills and talents are recognized and encouraged to thrive
in a cooperative team environment.
INNOVATION: We capitalize on the strenglhs of our heritage and adapt them to the challenges ot the uuture. Our
motto "different and better" onnotes innovalion. aeslhelic and economic value. going beyond the expected Into the
surprising -It is our rallying cry; it is our pride!
EXCELLENCE: We set the highest standards for our professional performance. our products and service. We
recognize that today's excelence is tomorrow's average; Inerefore, we are committed to continuous quality
improvement in dll that we do.
INDIVIDUAL DIGNI r: We believe that respect for each other's culturos, point of view, professional business styles
and differing performance abilities signilicanlly contributes to Olur workini logether lo achieve our business goals
with trust and creativity.
CORPORATE CITIZENSHIP: We believe that we have a direct and compelling responsibility to our communities lo
conduct our business ethically. to engage In responsible stewardship of the environment, and lo concern ourselves
with the welfare of the people In the communities in which we work
ANDERSEN "CODE OF BUSINESS CONDUCT'
Each employee is responsible for adhering to the Andersen Code of Business Conduct.
I ________________________________________________________________________________________ - - -

Workforce Recruitment 95
Appendix K Workforce Recruitment 95
Tarae2D Leves and Sdcool Grade Lrevls
GED Leve Giade Levae1 1-32 4-6\3 7-T4 9-125 Cllege I-2s College 3-