the recent increase in atlantic hurricane activity: … · 10/10/2000 · the recent increase in...
TRANSCRIPT

sensed observations together with a transferfunction derived from in situ observations.The net basin-integrated effect of El Ninoand La Nina events on the rates of biolog-ical production in the equatorial Pacific issignificant and plays a strong role in thelargest known natural year-to-year pertur-bation of the global carbon cycle (5, 25,31). Future observations will provide datato validate the approach on larger spatialscales, extending it to off-equatorial re-gions and possibly to global scales.
References and Notes1. R. T. Barber, F. P. Chavez, Science 222, 1203 (1983).2. F. P. Chavez, R. T. Barber, Deep-Sea Res. 34, 1229
(1987).3. R. T. Barber, J. E. Kogelschatz, in Global Ecological
Consequences of the 1982-83 El Nino-Southern Os-cillation, P. W. Glynn, Ed. (Elsevier, New York, 1989),pp. 21–53.
4. J. W. Murray, R. T Barber, M. R. Roman, M. P. Bacon,R. A. Feely, Science 266, 58 (1994).
5. F. P. Chavez et al., Science 286, 2126 (1999).6. D. Turk, M. R. Lewis, W. G. Harrison, T. Kawano, I.
Asanuma, J. Geophys. Res. 106, 4501 (2001).7. R. W. Eppley, B. J. Peterson, Nature 282, 677 (1979).8. R. A. Feely, R. Wanninkhof, T. Takahashi, P. Tans,
Nature 398, 597 (1999).9. J. W. Murray, J. N. Downs, S. Storm, C. L. Wei, H. W.
Jannasch, Deep-Sea Res. 36, 1471 (1989).10. M. A. Pena, M. R. Lewis, W. G. Harrison, Mar. Ecol.
Prog. Ser. 80, 265 (1992).11. J. J. McCarthy, C. Garside, J. L. Nevins, R. T. Barber,
Deep-Sea Res. 43, 1065 (1996).12. M. Rodier, R. LeBorgne, Deep-Sea Res. 44, 2085
(1997).13. P. Raimbault et al., J. Geophys. Res. 104, 3341
(1999).14. F. P. Wilkerson, R. C. Dugdale, J. Geophys. Res. 97,
669 (1992).15. M. J. McPhaden et al., J. Geophys. Res. 103, 14169
(1998).16. J. Picaut, A. J. Busalacchi, in Radar Altimetry, L. Fu, A.
Cazenave, Eds. (Academic Press, New York, in press).17. M. J. McPhaden, Science 283, 950 (1999).18. C. L. Leonard, C. R. McClain, Int. J. Remote Sensing 17,
721 (1996).19. P. Falkowski, R. T. Barber, V. Smetacek, Science 281,
200 (1998).20. The 20°C isotherm depth (a proxy for the thermo-
cline depth) was determined from the TOPEX/Poseidon-derived sea surface height based on re-lationships established from the depth profiles oftemperature collected by the TAO buoy array. Thealtimeter-derived sea level was binned into 10-dayaverages, with a spatial averaging of 1° 3 1°degree. The depth of the 20°C isotherm was de-rived from eight buoys spread along the equatorialband, and these data were also averaged over thesame 10-day interval as used for altimetric heights.The two data sets, covering a time period from to1992 to 2000, were matched with respect to timeand space grids. Anomalies in sea level and 20°Cdepth were then obtained by subtracting the meanseasonal cycle of the sea level and 20°C depth,derived from the period 1993–1996, from the orig-inal time series (1992–2000). The mean formulat-ed over this period is representative of the mean asdetermined from longer data sets of surface wind,sea surface temperaure, and tide gauges (32). Thedepth of the 20°C isotherm across the entire equa-torial domain (140°E to 100°W, 1°N to 1°S) for theperiod 1992–2000 was then calculated by addingthe interannual anomalies as determined fromTOPEX/Poseidon sea level anomalies to the meanstate.
21. The values for depth-integrated new production andcoincident thermocline depths were obtained from avariety of sources at different times and locations inthe equatorial Pacific band from 1°N to 1°S. These
included data from 145°E to 165°W during Novem-ber-December 1994, December 1995–January 1996,January 1997, and December 1997–January 1998 (6);at 155°W for mean conditions, El Nino 1998 onset, ElNino 1998 maturity, and La Nina 1999 (5); at 87°Wduring June 1988 (9); at 135°W in April 1988 (10); at140°W in February-March 1992 and August-Septem-ber 1992 (11); at 167°E in October 1994 (12) (onereported station was removed from the analysis); at150°W during November 1994 (13); at 150°W inFebruary-March 1988 (14); and at 140°W in March1992 and October 1992 [(33) with adjustments madein the day length for consistency with the otherdata]. New production was determined from ship-board measurements of 15N-labeled nitrate, with theexception of (5), where we use reported primaryproduction and the f ratio to determine the rates ofnew production.
22. D. A. Siegel, D. J. McGillicuddy Jr., E. A. Fields, J.Geophys. Res. 104, 13359 (1999).
23. To evaluate the importance of local upwelling in ouranalysis, TAO data were used to compute zonal windstress, assuming a constant drag coefficient (1.2 31023) and air density. We calculated 10-day averagesof the wind stress around the center dates of the newproduction data. The stresses were either averagedspatially over the same zonal intervals as the newproduction sections, or were computed at the longi-tude of new production data for values derived froma single location. The wind stresses were added to theregression of new production on thermocline depthin a stepwise fashion. The incremental improvementto the explained variance (4%) is not statisticallydifferent from zero. The reason for the relative lack ofimprovement when including local zonal wind stressis that large-scale, remotely wind-forced upwelling,as manifest through thermocline depth variations, isthe principal physical process driving vertical fluxes ofheat and nutrients into the surface layer, rather thanlocal wind-forced upwelling. The primacy of non–local wind–forced dynamics in affecting large-scalethermocline depth variations and surface layer prop-
erties is a common feature of most current theoriesof ENSO (34, 35).
24. B. M. Uz, J. A. Yoder, V. Osychny, Nature 409, 597(2001).
25. M. J. Behrenfeld et al., Science 291, 2594 (2001).26. The relative importance of other physical process-
es, such as meridonal advection, local upwelling,salinity variations, and internal wave dynamics,will differ in areas outside the equatorial band.Based on recent observations, we anticipate thatalthough the general form of our model will havewide applicability, the coefficients relating sea lev-el to thermocline height and relating thermoclinedepth to new production may vary somewhat indifferent areas.
27. R. Murtugudde, S. Signorini, J. R. Christian, A. J. Busalac-chi, C. R. McClain, J. Geophys. Res. 104, 18351 (1999).
28. C. Meinen, M. J. McPhaden, J. Phys. Oceanogr., 31,1324 (2001).
29. J. J. Cullen, Limnol. Oceanogr. 40, 1336 (1995).30. R. C. Dugdale, F. P. Wilkerson, Nature 391, 270
(1998).31. P. J. Rayner, I. G. Enting, R. J. Francey, R. Lagerfields,
Tellus 51B, 213 (1999).32. E. C. Hackert, A. J. Busalacchi, R. Murtugudde, J.
Geophys. Res. 106, 2345 (2001).33. P. Wheeler, unpublished Joint Global Ocean Flux
Study data (see http://usjgofs.whoi.edu/jg/dir/jgofs/eqpac/).
34. D. S. Battisti, J. Atmos. Sci. 45, 2889 (1988).35. P. S. Schopf, M. J. Suarez, J. Atmos. Sci. 45, 549 (1988).36. The authors are grateful to T. Mudge and D. McClurg
for assistance with data processing and to C. McClain,I. Asanuma, and T. Kawano for insight and opportu-nities to pursue this research. Financial support wasprovided by NASA’s Mission to Planet Earth Program,the Natural Sciences and Engineering Research Coun-cil of Canada, and NOAA’s Office of Atmospheric andOceanic Research.
10 October 2000; accepted 13 June 2001
The Recent Increase in AtlanticHurricane Activity:
Causes and ImplicationsStanley B. Goldenberg,1* Christopher W. Landsea,1
Alberto M. Mestas-Nunez,2 William M. Gray3
The years 1995 to 2000 experienced the highest level of North Atlantic hur-ricane activity in the reliable record. Compared with the generally low activityof the previous 24 years (1971 to 1994), the past 6 years have seen a doublingof overall activity for the whole basin, a 2.5-fold increase in major hurricanes($50 meters per second), and a fivefold increase in hurricanes affecting theCaribbean. The greater activity results from simultaneous increases in NorthAtlantic sea-surface temperatures and decreases in vertical wind shear. Becausethese changes exhibit a multidecadal time scale, the present high level ofhurricane activity is likely to persist for an additional ;10 to 40 years. The shiftin climate calls for a reevaluation of preparedness and mitigation strategies.
During 1970–1987, the Atlantic basin expe-rienced generally low levels of overall tropi-cal cyclone activity. The relative lull wasmanifested in major hurricane (1) activity(Fig. 1), major hurricane landfalls on the EastCoast of the United States and overall hurri-cane activity in the Caribbean. A brief resur-gence of activity in 1988 and 1989 made it
appear that the Atlantic basin was returningto higher levels of activity similar to the late1920s through the 1960s (2). This notion waslater discarded when the activity returned tolower levels from 1991–1994 (3), due in partto the long-lasting (1990–1995) El Ninoevent (4 ). This event ended in early 1995 andwas followed later that year by one of the
R E P O R T S
20 JULY 2001 VOL 293 SCIENCE www.sciencemag.org474
most active Atlantic hurricane seasons onrecord (5). Activity has been well above av-erage each year since 1995, except for 1997.Here we address the question of whether ornot the increase in activity reflects a long-term climate shift, as suggested by previousstudies (6–9), and provide evidence that con-firms this suggestion based on changes inoceanic and atmospheric conditions.
The North Atlantic basin (including theNorth Atlantic Ocean, the Caribbean Sea, andthe Gulf of Mexico) exhibits substantial in-terannual and interdecadal variability of trop-ical cyclone activity. This variability is espe-cially pronounced in major hurricane activity.Interdecadal major hurricane fluctuations oc-cur in both landfall locations (10) and overallactivity (11–13). Most of the deadliest and
costliest Atlantic tropical cyclones (10) aremajor hurricanes. Major hurricanes accountfor just over 20% of the tropical storms andhurricanes that strike the United States butcause more than 80% of the damage (14 ).
Most Atlantic tropical cyclones form fromatmospheric easterly (African) waves thatpropagate westward from Africa across thetropical North Atlantic and Caribbean Sea,primarily between 10° and 20°N [termed the“main development region” (MDR) (15, 16 )(see Fig. 2A)]. The Atlantic tropical cyclonesnot spawned by African waves usually formpoleward of 25°N. African waves account for;60% of the Atlantic basin tropical stormsand nonmajor hurricanes but ;85% of majorhurricanes (17 ). Almost all major hurricanesformed from African waves begin develop-ment (i.e., attain tropical depression status) inthe MDR (15) and, thus, are more sensitive toclimatic fluctuations in the tropics.
Although the number of easterly waves inthe tropical Atlantic is fairly constant from yearto year, the fraction that develop into tropicalcyclones varies substantially (18, 19). The keyto understanding the fluctuations on interannualand interdecadal scales is the MDR. The climat-
ic forcing that affects that region can be sepa-rated into local and remote factors. In combina-tion, these factors influence the number ofwaves that develop into tropical cyclones duringeach hurricane season. Local factors occur in theactual region and have a direct thermodynamicor dynamic connection to development. Remotefactors occur away from the MDR, but areassociated (via teleconnections) with conditionsin that region. All factors vary on disparatetemporal and spatial scales, and there is consid-erable interdependence between some of them.The extremely active 1995 season, for example,resulted from the juxtaposition of virtually all ofthe factors known to favor development (5).Among the local tropical Atlantic factors are thelower stratospheric Quasi-Biennial Oscillation(20, 21), sea-level pressure (5, 20, 22), lowertropospheric moisture (5), sea-surface tempera-ture (SST) (23–25), and vertical shear of thehorizontal environmental wind (15, 26). Thetwo local factors addressed here are SST andvertical shear.
In general, when looking for long-term vari-ability, it is necessary to look at the oceansbecause their large thermal and mechanical in-ertia provide long-term memory and predictabil-ity (27). The oceans are the primary energysource for tropical cyclones. Localized SSTsplay a direct role in providing moist enthalpy topower incipient tropical cyclones (5, 25).Warmer SSTs decrease atmospheric stability,which increases the penetration depth of a vor-tex, thus, making developing tropical cyclonesmore resistant to vertical wind shear (28). LocalSST greater than 26.5°C is usually considered tobe a necessary condition for tropical cyclonedevelopment (26), and higher SST can increaseoverall activity (23–25). Multidecadal variationsin major hurricane activity have been attributedto changes in the SST structure in the Atlantic(2, 12, 13) because tropical North Atlantic SSTscorrelate positively with major hurricane activ-
1National Oceanic and Atmospheric Administration/Atlantic Oceanographic and Meteorological Laborato-ry/Hurricane Research Division, Miami, FL 33149,USA. 2Cooperative Institute for Marine and Atmo-spheric Studies/University of Miami, Miami, FL 33149,USA. 3Colorado State University, Department of At-mospheric Sciences, Fort Collins, CO 80523, USA.
*To whom correspondence should be addressed. E-mail: [email protected]
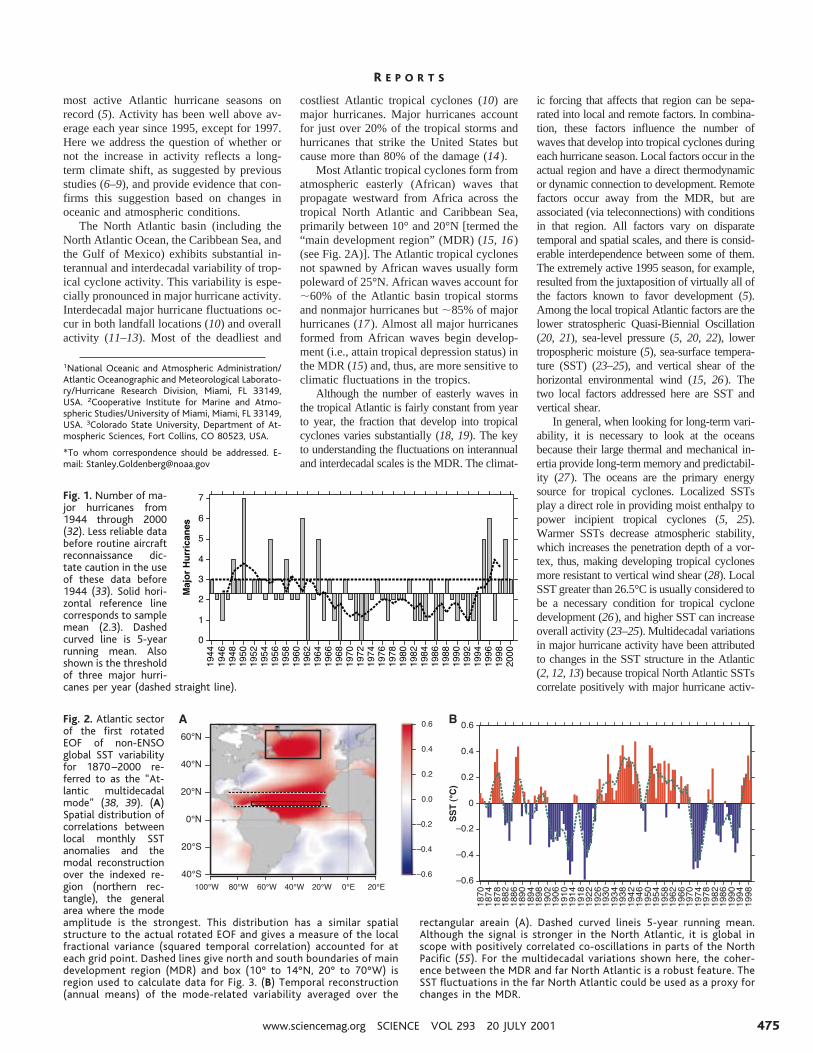
Fig. 1. Number of ma-jor hurricanes from1944 through 2000(32). Less reliable databefore routine aircraftreconnaissance dic-tate caution in the useof these data before1944 (33). Solid hori-zontal reference linecorresponds to samplemean (2.3). Dashedcurved line is 5-yearrunning mean. Alsoshown is the thresholdof three major hurri-canes per year (dashed straight line).
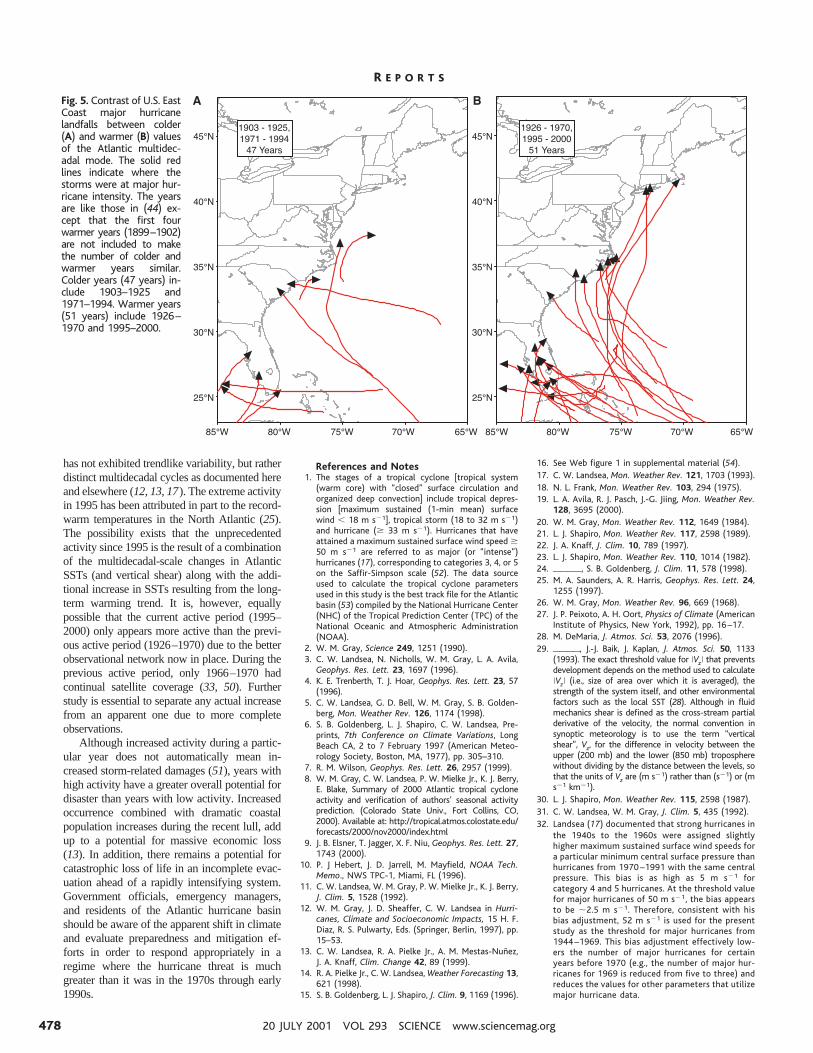
Fig. 2. Atlantic sectorof the first rotatedEOF of non-ENSOglobal SST variabilityfor 1870–2000 re-ferred to as the “At-lantic multidecadalmode” (38, 39). (A)Spatial distribution ofcorrelations betweenlocal monthly SSTanomalies and themodal reconstructionover the indexed re-gion (northern rec-tangle), the generalarea where the modeamplitude is the strongest. This distribution has a similar spatialstructure to the actual rotated EOF and gives a measure of the localfractional variance (squared temporal correlation) accounted for ateach grid point. Dashed lines give north and south boundaries of maindevelopment region (MDR) and box (10° to 14°N, 20° to 70°W) isregion used to calculate data for Fig. 3. (B) Temporal reconstruction(annual means) of the mode-related variability averaged over the
rectangular areain (A). Dashed curved lineis 5-year running mean.Although the signal is stronger in the North Atlantic, it is global inscope with positively correlated co-oscillations in parts of the NorthPacific (55). For the multidecadal variations shown here, the coher-ence between the MDR and far North Atlantic is a robust feature. TheSST fluctuations in the far North Atlantic could be used as a proxy forchanges in the MDR.
R E P O R T S
www.sciencemag.org SCIENCE VOL 293 20 JULY 2001 475

ity. Although North Atlantic SSTs directly im-pact tropical cyclone activity as a local thermo-dynamic effect, it appears unlikely that this istheir only physical link to hurricane activity. Forinfluencing activity on interannual time scales,this local effect plays either a negligible role (formajor hurricanes) or at best a secondary role (forall hurricanes) (24).
The dominant local factor for tropical cy-clone activity is the magnitude of the verticalshear of the horizontal wind between the upperand lower troposphere, ?Vz?. Strong Vz inhibitsthe formation and intensification of tropical cy-clones [e.g., (15, 26)], primarily by preventingthe axisymmetric organization of deep convec-tion. Local ?Vz? . ;8 m s21 is generally unfa-vorable for development (29). The climatologi-cal mean vertical wind shear, Vz, for August-September-October (ASO), the peak 3 monthsof the Atlantic hurricane season during whichvirtually all major hurricanes form, is westerlywith a magnitude ?Vz? greater than 8 m s21 overmuch of the basin (15, 16). Climatologicallyhigh values for ?Vz? are one of the main reasonswhy conditions in the Atlantic basin are notespecially conducive to tropical cyclone devel-opment. The tropical North Atlantic SST ap-pears to act in concert with the overlying tropo-spheric circulation such that warmer SSTs cor-respond to reduced ?Vz? in the MDR (12, 24).
A key remote factor is SST variability inthe central and eastern equatorial PacificOcean associated with El Nino–Southern Os-cillation (ENSO). Positive Pacific SST anom-alies associated with warm-phase ENSO (ElNino) have been linked to increased ?Vz? overthe MDR, and conversely for cool-phaseENSO (La Nina) (15, 20, 30). Another re-mote factor that has been linked to interan-nual and multidecadal variability in Atlanticbasin tropical cyclone activity is rainfall vari-ability over the western Sahel (2, 31), withpositive rainfall anomalies associated withreduced ?Vz? over the MDR (15).
The most obvious indicator of a possiblelong-term shift are the changes in the tropicalcyclone activity itself. The total number oftropical storms and nonmajor hurricanes inthe North Atlantic basin has remained fairlyconstant from decade to decade (13). Thenumbers of major hurricanes and of Caribbe-an hurricanes, however, exhibit strong mul-tidecadal variability. The late 1920s to the1960s were very active, while both the 1900sthrough mid-1920s and the 1970s through theearly 1990s were quiescent (2, 12, 13).
The events of each year reflect a combina-tion of temporal scales. Interannual fluctuationsin activity occur in both high and low activityperiods (Fig. 1). However, inhibitory influencesduring relatively inactive multidecadal periodsset a limit on the possible level of activity.During 1944–1970 (the portion of the previousactive multidecadal period shown in Fig. 1), theaverage number of major hurricanes per year
was 2.7 (32–34). Six of the years produced fouror more major hurricanes. In contrast, the aver-age for the quieter period of approximatelyequal duration, 1971–1994, was only 1.5, withno years having more than three major hurri-canes. The quieter period’s threshold of threemajor hurricanes was then exceeded in 1995 forthe first time since 1964. The average number ofmajor hurricanes for 1995–2000 is 3.8 (34).Three of those years had four or more. The NetTropical Cyclone activity (NTC) for the NorthAtlantic, another measure of activity (8), showsa similar combination of interannual and mul-tidecadal fluctuations (35). The only year since1995 with below average activity was 1997,when the Atlantic hurricane activity was sup-pressed by the strongest El Nino event of thiscentury (36). Even with 1997 included, themean number of major hurricanes and meanNTC for 1995–2000 are the highest of anyconsecutive 6 years in the 1944–2000 record.While this recent period spans only 6 years, itclearly belongs to a different low-frequency cli-mate regime than the previous 24 years (1971–1994).
Studies of global SSTs using empirical or-thogonal function (EOF) analysis [e.g., (37)]have shown that the primary source of interan-nual SST variability is the ENSO region. Toanalyze the relation of Atlantic tropical cycloneactivity with Atlantic SST anomalies in a waythat is independent of ENSO, it is helpful to firstremove the teleconnected effects of ENSO onthe Atlantic Ocean (38). The first rotated non-ENSO SST mode (39) represents interannual tomultidecadal variability (Fig. 2). Because themode’s temporal variability is dominated bymultidecadal-scale fluctuations (Fig. 2B) withthe largest amplitudes in the Atlantic, we refer toit as the “Atlantic multidecadal mode.” Thepositive phase of the mode’s spatial pattern (Fig.2A) has warm SSTs in the tropical North Atlan-tic from 0° to 30°N (which includes the MDR)and in the far North Atlantic from 40° to 70°N.This mode is not local to the MDR; it is insteada large-scale feature that, because it is alsopresent in the MDR, affects Atlantic tropicalcyclone activity. The primary region for SSTanomalies that would affect tropical cyclonesdirectly would be in and just north of the MDR,i.e., ;10° to 25°N (24, 40).
These multidecadal-scale fluctuations inSSTs closely follow the long-term fluctuationsin Atlantic tropical cyclone activity (13). Thetime series for the Atlantic multidecadal mode(Fig. 2B), major hurricanes (Fig. 1) and NTC(35) all show similar multidecadal-scale shifts.Ignoring interannual fluctuations, major hurri-cane activity is high from 1944 through at least;1964 (Fig. 1), NTC is high through ;1969(35) and the Atlantic multidecadal mode is pre-dominately warm until ;1970 (Fig. 2B). Then,major hurricane activity and NTC are mostlybelow average and the Atlantic multidecadalmode colder from the early 1970s through the
early 1990s. All three quantities have increaseddramatically since 1995. Note also that the twobusiest periods in the 1970s and 1980s, 1979–1981 and 1988–1990 (35), coincide with twoshort warming periods, 1979–1981 and 1987–1990 (see Fig. 2B), indicating the possibility ofsignificant relations on shorter (decadal) timescales. The correlations between the 5-year run-ning mean of the Atlantic multidecadal modewith the major hurricane and NTC runningmeans are 0.72 and 0.81, respectively (41).
It has been hypothesized that multidecadalchanges in oceanic temperatures, major hurri-cane activity and Sahel rainfall are related tofluctuations in the intensity of the thermohalinecirculation in the North Atlantic (12, 42). Afaster thermohaline circulation is suggested tobe associated with warmer SSTs in the NorthAtlantic and colder SSTs in the South Atlantic.These conditions would enhance Sahel rainfalland decrease ?Vz? in the MDR. In other words,the decadal-scale SST fluctuations affecting At-lantic hurricane (particularly major hurricane)activity would likely produce the connection viachanges in the upper- and lower-level zonalatmospheric circulations over the MDR (40). Itis also possible, but less likely, that the changesin atmospheric circulation are forcing the SSTchanges. However, it is doubtful that long-termincreased tropical cyclone activity could causewarmer North Atlantic SSTs since hurricanesresult in a cooling of SSTs through verticalmixing and upwelling (e.g., 43).
Figure 3 shows the fluctuations in ?Vz? aver-aged for ASO for the south-central portion ofthe MDR where the strongest correlations be-tween ?Vz? and major hurricanes occur (15, 16).Although there is substantial interannual vari-ability in ?Vz?, primarily associated with ENSO,this is being modulated by the obvious multi-decadal-scale fluctuations. These fluctuationsshow a switch from conducive (high percentag-es of low ?Vz?) to suppressed (low percentages oflow ?Vz?) conditions in 1970, almost coincidentwith the shift in major hurricanes (Fig. 1), NTC(35) and SSTs (Fig. 2B). In Fig. 3, however, theswitch back to conducive conditions appears tostart in 1988 (44), 7 years earlier than the switchfor the other parameters. Even though 1991through 1994 exhibit a short-term return to lessconducive values, 1988 through 1990 had themost favorable values since 1969. Figure 2shows some evidence of North Atlantic SSTwarming for a few years around 1988 followedby several cooler years in the early 1990s beforethe major warming in 1995. The warmingaround 1988 is much more evident in the Atlan-tic multidecadal mode values for ASO and inthe actual ASO SSTs for the MDR (not shown).Nonetheless, the dominant shift to warmer val-ues clearly takes place in 1995, which is whenoccurrences of more than three major hurricanesand hyperactive years [NTC $ 150%; (35)]resumed.
For almost every measure of tropical cy-
R E P O R T S
20 JULY 2001 VOL 293 SCIENCE www.sciencemag.org476

clone activity, the differences between thewarm and cold phases of the mode are statisti-cally significant (34, 44). The single exceptionis the number of U.S. Gulf Coast landfallingmajor hurricanes. This is because the Gulf ofMexico activity does not have a significantrelationship with ?Vz? fluctuations in the MDR(11, 12, 15) or to the multidecadal North At-lantic SST fluctuations (Fig. 2A). The greatestdifferences (ratios) are for major hurricanes,hurricane days, U.S. East Coast major hurricanelandfalls, and especially Caribbean hurricanesand U.S. damage. The Caribbean Sea hasshown dramatic changes in hurricane activity—averaging 1.7 occurrences per year during thewarm periods compared with only 0.5 per yearduring the cold period (34). The current warmperiod has produced an average of 2.5 occur-rences per year with an unprecedented (since1944) six hurricanes in the region during 1996.These multidecadal changes are illustrated inFig. 4, which clearly shows the enhancement ofoverall Caribbean hurricane activity duringwarmer periods. Not only is the entire Caribbe-an region much less active during the colderperiod (Fig. 4A), but the only hurricanes that
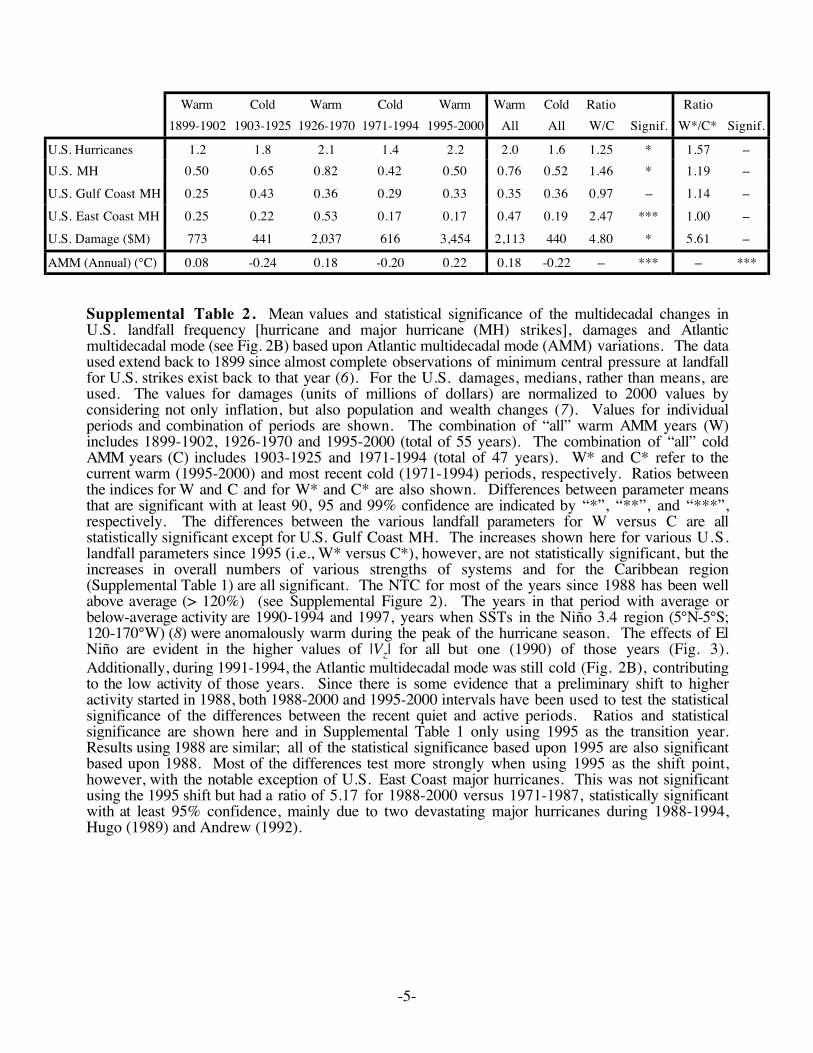
developed during that period in the CaribbeanSea east of ;73°W formed during the twointermittent short warming periods (1979–1981and 1987–1990) discussed earlier. Large multi-decadal fluctuations of major hurricane land-falls are especially evident for the U.S. EastCoast from the Florida peninsula to New En-gland and are illustrated in Fig. 5. No majorhurricanes made landfall from 1966–1983.This relatively quiet period was similar to, butmore extreme than, the low activity period dur-ing the first two decades of the 20th century. Incontrast, during 1947–1965, 14 major hurri-canes struck the East Coast (13). Overall, theUnited States has experienced about five timesas much in median damages from tropicalstorms and hurricanes during the warm (highactivity) than during the cold (low activity)phases of the Atlantic multidecadal mode (44).
The Atlantic tropical cyclone record, which(except for U.S. landfall data) is not consideredreliable before 1944 (33), shows less than onecomplete cycle of the multidecadal signal. Therecord for the SST signal represented by theAtlantic multidecadal mode (Fig. 2B), however,which has demonstrated a robust relation to the
observed activity, shows about two completecycles-—with some proxy records extendingback several additional cycles (42). In addition,U.S. landfall data are able to show almost twoperiods of the signal (13, 44). Because of themultidecadal scale of the Atlantic SST variabil-ity portrayed here, the shift since 1995 to anenvironment generally conducive to hurricaneformation—warmer North Atlantic SSTs andreduced vertical wind shear—is not likely tochange back soon (45). This means that duringthe next 10 to 40 years or so, most of theAtlantic hurricane seasons are likely to haveabove average activity, with many hyperactive,some around average, and only a few belowaverage. Furthermore, consistent with experi-ence since the active phase began in 1995, therewould be a continuation of significantly in-creased numbers of hurricanes (and major hur-ricanes) affecting the Caribbean Sea and basin-wide numbers of major hurricanes. The Gulf ofMexico, however, is expected to see only minordifferences. Tragic impacts of the heightenedactivity have already been felt, especially in theCaribbean [e.g., Hurricanes Georges and Mitch(46)]. In addition, an increase in major hurri-cane landfalls affecting the U.S. East Coast isanticipated, but has not yet materialized (47).
One may ask whether the increase in activitysince 1995 is due to anthropogenic globalwarming. The historical multidecadal-scalevariability in Atlantic hurricane activity is muchgreater than what would be “expected” from agradual temperature increase attributed to globalwarming (5). There have been various studiesinvestigating the potential effect of long-termglobal warming on the number and strength ofAtlantic-basin hurricanes. The results are incon-clusive (48). Some studies document an increasein activity while others suggest a decrease (49).Tropical North Atlantic SST has exhibited awarming trend of ;0.3°C over the last 100years (38); whereas Atlantic hurricane activity
Fig. 3. Percentage ofsouth-central portion(10°–14°N, 20°– 70°W)of the main develop-ment region (see Fig.2A) where ?Vz? , 6 ms21 (values extremelyconducive for tropicalcyclone development)for ASO. Dashed curvedline is 5-year runningmean. Higher and lowerpercentages indicateconditions that are moreor less conducive to de-velopment, respectively.
Fig. 4. Contrast of Caribbean hurricanes between colder (A) and warmer(B) values of the Atlantic multidecadal mode. The solid green (thin) andred (thick) lines indicate where the hurricanes were at nonmajor andmajor hurricanes intensities, respectively. Tropical storm intensity isindicated by dotted lines in cases where a hurricane weakened to tropical
storm strength and then re-intensified to hurricane status. The years aresimilar to (34) except that the first nine warmer years (1944–1952) arenot included to make the number of colder and warmer years equal. Thecolder years (24 years) include 1971–1994. The warmer years (24 years)include 1953–1970 and 1995–2000.
R E P O R T S
www.sciencemag.org SCIENCE VOL 293 20 JULY 2001 477
has not exhibited trendlike variability, but ratherdistinct multidecadal cycles as documented hereand elsewhere (12, 13, 17). The extreme activityin 1995 has been attributed in part to the record-warm temperatures in the North Atlantic (25).The possibility exists that the unprecedentedactivity since 1995 is the result of a combinationof the multidecadal-scale changes in AtlanticSSTs (and vertical shear) along with the addi-tional increase in SSTs resulting from the long-term warming trend. It is, however, equallypossible that the current active period (1995–2000) only appears more active than the previ-ous active period (1926–1970) due to the betterobservational network now in place. During theprevious active period, only 1966–1970 hadcontinual satellite coverage (33, 50). Furtherstudy is essential to separate any actual increasefrom an apparent one due to more completeobservations.
Although increased activity during a partic-ular year does not automatically mean in-creased storm-related damages (51), years withhigh activity have a greater overall potential fordisaster than years with low activity. Increasedoccurrence combined with dramatic coastalpopulation increases during the recent lull, addup to a potential for massive economic loss(13). In addition, there remains a potential forcatastrophic loss of life in an incomplete evac-uation ahead of a rapidly intensifying system.Government officials, emergency managers,and residents of the Atlantic hurricane basinshould be aware of the apparent shift in climateand evaluate preparedness and mitigation ef-forts in order to respond appropriately in aregime where the hurricane threat is muchgreater than it was in the 1970s through early1990s.
References and Notes1. The stages of a tropical cyclone [tropical system
(warm core) with “closed” surface circulation andorganized deep convection] include tropical depres-sion [maximum sustained (1-min mean) surfacewind , 18 m s21], tropical storm (18 to 32 m s21)and hurricane ($ 33 m s21). Hurricanes that haveattained a maximum sustained surface wind speed $50 m s21 are referred to as major (or “intense”)hurricanes (17), corresponding to categories 3, 4, or 5on the Saffir-Simpson scale (52). The data sourceused to calculate the tropical cyclone parametersused in this study is the best track file for the Atlanticbasin (53) compiled by the National Hurricane Center(NHC) of the Tropical Prediction Center (TPC) of theNational Oceanic and Atmospheric Administration(NOAA).
2. W. M. Gray, Science 249, 1251 (1990).3. C. W. Landsea, N. Nicholls, W. M. Gray, L. A. Avila,
Geophys. Res. Lett. 23, 1697 (1996).4. K. E. Trenberth, T. J. Hoar, Geophys. Res. Lett. 23, 57
(1996).5. C. W. Landsea, G. D. Bell, W. M. Gray, S. B. Golden-
berg, Mon. Weather Rev. 126, 1174 (1998).6. S. B. Goldenberg, L. J. Shapiro, C. W. Landsea, Pre-
prints, 7th Conference on Climate Variations, LongBeach CA, 2 to 7 February 1997 (American Meteo-rology Society, Boston, MA, 1977), pp. 305–310.
7. R. M. Wilson, Geophys. Res. Lett. 26, 2957 (1999).8. W. M. Gray, C. W. Landsea, P. W. Mielke Jr., K. J. Berry,
E. Blake, Summary of 2000 Atlantic tropical cycloneactivity and verification of authors’ seasonal activityprediction. (Colorado State Univ., Fort Collins, CO,2000). Available at: http://tropical.atmos.colostate.edu/forecasts/2000/nov2000/index.html
9. J. B. Elsner, T. Jagger, X. F. Niu, Geophys. Res. Lett. 27,1743 (2000).
10. P. J Hebert, J. D. Jarrell, M. Mayfield, NOAA Tech.Memo., NWS TPC-1, Miami, FL (1996).
11. C. W. Landsea, W. M. Gray, P. W. Mielke Jr., K. J. Berry,J. Clim. 5, 1528 (1992).
12. W. M. Gray, J. D. Sheaffer, C. W. Landsea in Hurri-canes, Climate and Socioeconomic Impacts, 15 H. F.Diaz, R. S. Pulwarty, Eds. (Springer, Berlin, 1997), pp.15–53.
13. C. W. Landsea, R. A. Pielke Jr., A. M. Mestas-Nunez,J. A. Knaff, Clim. Change 42, 89 (1999).
14. R. A. Pielke Jr., C. W. Landsea, Weather Forecasting 13,621 (1998).
15. S. B. Goldenberg, L. J. Shapiro, J. Clim. 9, 1169 (1996).
16. See Web figure 1 in supplemental material (54).17. C. W. Landsea, Mon. Weather Rev. 121, 1703 (1993).18. N. L. Frank, Mon. Weather Rev. 103, 294 (1975).19. L. A. Avila, R. J. Pasch, J.-G. Jiing, Mon. Weather Rev.
128, 3695 (2000).20. W. M. Gray, Mon. Weather Rev. 112, 1649 (1984).21. L. J. Shapiro, Mon. Weather Rev. 117, 2598 (1989).22. J. A. Knaff, J. Clim. 10, 789 (1997).23. L. J. Shapiro, Mon. Weather Rev. 110, 1014 (1982).24. iiii, S. B. Goldenberg, J. Clim. 11, 578 (1998).25. M. A. Saunders, A. R. Harris, Geophys. Res. Lett. 24,
1255 (1997).26. W. M. Gray, Mon. Weather Rev. 96, 669 (1968).27. J. P. Peixoto, A. H. Oort, Physics of Climate (American
Institute of Physics, New York, 1992), pp. 16–17.28. M. DeMaria, J. Atmos. Sci. 53, 2076 (1996).29. iiii, J.-J. Baik, J. Kaplan, J. Atmos. Sci. 50, 1133
(1993). The exact threshold value for ?Vz? that preventsdevelopment depends on the method used to calculate?Vz? (i.e., size of area over which it is averaged), thestrength of the system itself, and other environmentalfactors such as the local SST (28). Although in fluidmechanics shear is defined as the cross-stream partialderivative of the velocity, the normal convention insynoptic meteorology is to use the term “verticalshear”, Vz, for the difference in velocity between theupper (200 mb) and the lower (850 mb) tropospherewithout dividing by the distance between the levels, sothat the units of Vz are (m s21) rather than (s21) or (ms21 km21).
30. L. J. Shapiro, Mon. Weather Rev. 115, 2598 (1987).31. C. W. Landsea, W. M. Gray, J. Clim. 5, 435 (1992).32. Landsea (17) documented that strong hurricanes in
the 1940s to the 1960s were assigned slightlyhigher maximum sustained surface wind speeds fora particular minimum central surface pressure thanhurricanes from 1970 –1991 with the same centralpressure. This bias is as high as 5 m s21 forcategory 4 and 5 hurricanes. At the threshold valuefor major hurricanes of 50 m s21, the bias appearsto be ;2.5 m s21. Therefore, consistent with hisbias adjustment, 52 m s21 is used for the presentstudy as the threshold for major hurricanes from1944 –1969. This bias adjustment effectively low-ers the number of major hurricanes for certainyears before 1970 (e.g., the number of major hur-ricanes for 1969 is reduced from five to three) andreduces the values for other parameters that utilizemajor hurricane data.
Fig. 5. Contrast of U.S. EastCoast major hurricanelandfalls between colder(A) and warmer (B) valuesof the Atlantic multidec-adal mode. The solid redlines indicate where thestorms were at major hur-ricane intensity. The yearsare like those in (44) ex-cept that the first fourwarmer years (1899–1902)are not included to makethe number of colder andwarmer years similar.Colder years (47 years) in-clude 1903–1925 and1971–1994. Warmer years(51 years) include 1926–1970 and 1995–2000.
R E P O R T S
20 JULY 2001 VOL 293 SCIENCE www.sciencemag.org478

33. Although these data are available since 1851, only thedata for the years since 1944, when routine aircraftreconnaissance of Atlantic tropical cyclones began, areconsidered very reliable. The greatest reliability startsaround the mid-1960s when operational satellite detec-tion of Atlantic tropical cyclones began (50). Beforesatellite coverage, a portion of the lifetimes of manysystems had probably been missed.
34. See Web table 1 in supplemental material (54).35. See Web figure 2 in supplemental material (54).36. G. D. Bell, M. S. Halpert, Bull. Am. Meteorol. Soc. 79,
S1 (1998).37. C. K. Folland, J. A. Owen, M. N. Ward, A. W. Colman, J.
Forecasting 10, 21 (1991). EOF analysis is a multivariatestatistical technique commonly used in climate studies.It allows one to capture the main spatial and temporalvariability of climate variables as a few “empiricalmodes.” These modes, however, do not always representphysical modes.
38. D. B. Enfield, A. M. Mestas-Nunez, J. Clim. 12, 2719(1999). They represented ENSO as the leading complexEOF of global 1856–1991 SST anomalies in the inter-annual (1.5 to 8 year) band. Contrary to conventionalEOF analysis, complex EOF analysis allows accountingfor phase propagation in a single mode. The ENSOmode and a linear trend were then removed from theSST anomalies and an EOF analysis was used to studythe residual (non-ENSO) variability.
39. A. M. Mestas-Nunez, D. B. Enfield, J. Clim. 12, 2734(1999). They applied an orthogonal rotation to thefirst 10 global non-ENSO EOFs (38) to investigate thepresence of regionalized centers of variability. Rotat-ed EOFs are generally less sensitive to samplingerrors than conventional EOFs and thus may bebetter indicators of physical modes.
40. F. Vitart, J. L. Anderson, J. Clim. 14, 533 (2001). Theyperformed tests with an atmospheric general circulationmodel to determine if the SST anomalies in the lower(;0°–40°N) or higher (40°–60°N) latitude Atlantic aremost responsible for multidecadal scale variations intropical cyclone activity. The results strongly suggestthat the contributions are only from the lower latitudeSST anomalies. Their study also attributes at least aportion of the impact to changes in the vertical shearassociated with the warmer SSTs.
41. These correlations are statistically significant withgreater than 90 and 95% confidence, respectively, usinga significance test which accounts for serial correlation.R. E. Davis, J. Phys. Oceanogr. 6, 247 (1976).
42. T. L. Delworth, M. E. Mann, Clim. Dyn. 16, 661 (2000).43. L. K. Shay, R. L. Elsberry, P. G. Black, J. Phys. Oceanogr.
19, 649 (1989).44. See Web table 2 in supplemental material (54).45. Instrumental and proxy data (1650 A.D. to present) as
well as model simulations suggest that Atlantic multi-decadal variability deviates significantly from a simplestochastic process (42). This evidence also indicates thatthe signal is broad band (30 to 70 years) and not asingle peak in the spectrum. With a broad-band signal itis difficult to predict when sign changes will occur. Dueto its multidecadal nature, however, it is reasonable tosay that if the signal has recently changed sign, it willprobably not change back soon.
46. R. J. Pasch, Weatherwise 52(no. 2), 48 (1999).47. See “Persistent East Coast trough” in supplemental ma-
terial (54).48. A. Henderson-Sellers et al., Bull. Am. Meteorol. Soc.
79, 19 (1998).49. See “North Atlantic versus North Pacific activity” in
supplemental material (54).50. C. J. Neumann, B. R. Jarvinen, C. J. McAdie, J. D. Elms,
Tropical Cyclones of the North Atlantic Ocean, 1871-1998. (National Climatic Center, Asheville, NC,1999), pp. 11–15.
51. See “Disasters during low activity years” in supple-mental material (54).
52. R. H. Simpson, Weatherwise 27(no. 4), 169 (1974).53. B. R. Jarvinen, C. J. Neumann, M. A. S. Davis, NOAA
Tech. Memo., NWS NHC 22, Miami, FL (1984).54. Web figures 1 and 2, tables 1 and 2, and supple-
mental text is available at Science Online atwww.sciencemag.org/cgi/content/full/293/5529/474/DC1.
55. D. B. Enfield, A. M. Mestas-Nunez, Geophys. Res. Lett.28, 2077 (2001). Their study shows that the Atlantic
multidecadal fluctuations significantly influence thehydrology of the United States.
56. We thank H. Willoughby, F. Marks, J. Gamache, A. Barn-ston, L. Shapiro, P. Reasor, R. Rogers, R. Burpee, and M.Finke for comments on the manuscript and helpful dis-cussions; S. Feuer and J. Harris for assistance in process-ing the wind data; D. Enfield for assistance with SST dataand helpful suggestions; N. Dorst and S. Murillo for othertechnical support; S. Taylor, B. Goldenberg, and R. Simon
for editing assistance; and D. Lewis for additional helpfulsupport. In addition, we wish to thank M. DeMaria and ananonymous reviewer for their insightful comments andN. Ward for suggestions that helped initiate this study.Partial funding for this research comes from the NOAAOffice of Global Programs (Pan-American ClimateStudies).
20 February 2001; accepted 8 June 2001
A Phosphatocopid Crustaceanwith Appendages from the
Lower CambrianDavid J. Siveter,1* Mark Williams,2 Dieter Waloszek3
Here we describe a phosphatocopid arthropod with preserved soft anatomyfrom Lower Cambrian rocks of Shropshire, England, which provides evidence forthe occurrence of Crustacea, including Eucrustacea, in the Early Cambrian. Thefind identifies an important, stratigraphically early source of well-preservedfossils (Konservat-Lagerstatte).
Most metazoan groups first appear in thefossil record during the Cambrian Period, butthe nature and validity of the so-called “Cam-brian Explosion” are unresolved. Some pro-pose that cladogenic events gave rise to themetazoans in the Proterozoic [e.g., (1, 2)].Others conclude that the Cambrian explosionis real (3). Still others maintain that in mostcases the appearance of modern body plans(‘crown groups’), including those of extantarthropod classes, was later than the earlyCambrian (4) and favor a model of progres-sive diversification through the end of theProterozoic to beyond the Cambrian.
Our material is from the Protolenus Lime-stone (5), which is correlated to the ToyonianStage of Siberia (6 ) and is of Branchian agein terms of the Newfoundland standard forthe Avalonian microplate [circa 511 millionyears ago (Ma); base of Cambrian circa 543Ma] (7 ). The specimens are an example of“Orsten”-type preservation [e.g., (8)]; theyare phosphatized and were recovered withacetic acid techniques. Phosphatocopids are aclade (9) of about 60 species of globallywidespread, Lower to Upper Cambrian bi-valved arthropods [see (10, 11)] that aremostly known from their purportedly primaryphosphatic (12, 13) carapaces. Rare phospha-tocopid specimens with preserved soft partanatomy (which has been secondarily phos-phatized) are known chiefly from UpperCambrian concretionary Orsten limestones of
Sweden (12, 13). They have also been report-ed from the Middle Cambrian (14 ) (isolatedlimbs only) and the Lower Cambrian (15)(two specimens, showing only the labrumand sternum).
The specimens are classified as Arthropo-da, Crustacea, Phosphatocopida sp.
Material. The specimens are two carapac-es, both bearing soft part anatomy [OxfordUniversity Museum of Natural History(OUM)]. OUM A.2209 shows a labrum, ster-num, and the remains of the left second, third,and fourth appendages and possibly the leftfirst appendage; its right-side appendages aremostly obscured by matrix. OUM A.2209bears a labrum and sternum.
Locality and stratigraphy. The fossilscame from a temporary trench excavation(made by D.J.S. and M.W.), near Comleyhamlet, Shropshire [Protolenus Limestone(Protolenid-Strenuellid Biozone), Lower Com-ley Limestones, Comley “Series”].
Description. The subspherical shaped cara-pace consists of two halves (“valves”) of equalsize (Fig. 1, A through C); it has no hinge lineor interdorsum and has a permanent gape ofabout 80°; its dorsal margin is 340 mm (OUMA.2209) to 330 mm (OUM A.2209) long. Thedoublure is well developed and is confluentwith the inner lamella cuticle lining each valve.
The only visible structure that is possiblypart of an antennula is a slender setulate seta onthe left side of the labrum, projecting almostvertically, just below the endopod of the leftsecond antenna (Fig. 1C). The second antenna(Figs. 1, A and D, and 2) consists of a coxa butwith a gnathobasic endite carrying two or pos-sibly three spines, a basis whose endite has twomain spines flanked by four smaller spines, andan endopod consisting of three podomeres, inwhich the proximal podomere bears one long
1Department of Geology, University of Leicester,Leicester LE1 7RH, UK. 2British Geological Survey,Keyworth, Nottingham NG12 5GG, UK. 3Section forBiosystematic Documentation, University of Ulm,D-89069 Ulm, Germany.
*To whom correspondence should be addressed. E-mail: [email protected]
R E P O R T S
www.sciencemag.org SCIENCE VOL 293 20 JULY 2001 479

-1-
The Recent Increase in Atlantic Hurricane Activity:Causes and Implications
Science July 20, 2001
Stanley B. Goldenberg*, Christopher W. Landsea, Alberto M. Mestas-Nuñez and William M. Gray
Persistence of East Coast Trough
Historically, about one-third of the Atlantic major hurricanes make landfall on the continental U.S.
coastline. Between 1995-2000, 23 major hurricanes formed in the Atlantic basin, but only three [Opal
(1995), Fran (1996), and Bret (1999)] have come ashore as major hurricanes. If the historical one-
out-of-three ratio of U.S. major hurricane landfalls to basin-wide major hurricanes had applied during
the last six years, then there would have been 7-8 major hurricane landfalls. The U.S. East Coast has
been protected by an anomalous mid- and upper-tropospheric trough located offshore during the last
six hurricane seasons (e.g., 1). The persistence of this trough has caused most of otherwise
northwest-moving major hurricanes to recurve to the northeast before they reached the U.S. If the
position and strength of the trough is related to the changes in the Atlantic multidecadal mode and
hurricane activity, then the trough could possibly persist as long as the conducive conditions (warmer
SSTs) remain. If the condition of the trough is independent from the other conditions, then the

-2-
trough could shift while the Atlantic is still favorable and we would subsequently see an increase in
East Coast landfalls. Based on previous landfall records for U.S. major hurricanes, it appears
probable that the trough and other associated steering patterns are not related to the North Atlantic SST
changes, since when conducive conditions were in place during earlier periods, there were also large
numbers of U.S. East Coast landfalls. The status of the trough (and other associated steering
patterns) seem to vary such that, within active eras, there are shifts of preferred landfall locations -- as
shown in the hundred-year record of landfalls for U.S. major hurricanes (2). It has been suggested
that the shifts in landfall locations are associated with the phase of the North Atlantic oscillation
(NAO) (3). Additional research needs to be done to examine these relationships.
North Atlantic versus North Pacific Activity
In contrast with the large increase in Atlantic basin activity during the last six years, total tropical
cyclone activity for the North Pacific basins (including East, Central and West) has decreased. If one
combines Atlantic and North Pacific activity, there is a net downward trend for 1995-2000 (4). It has
been shown that overall Atlantic activity tends to be negatively correlated with activity in most other
basins (5). Hence, an interpretation of the recent elevated activity in the Atlantic as a measure of
increases in global tropical cyclone activity is not consistent with world-wide experience.
Disasters During Low Activity Years
Even relatively inactive years can produce extreme hurricane disasters. It is not the number of
systems that develop that determines the amount of damage, but rather the number that impact land,
and where the landfalls occur. When a single major hurricane strikes a heavily populated coast, it
causes far more damage than several major hurricanes hitting nearly empty shoreline. For example,
Hurricane Andrew in 1992, the only major hurricane during a relatively inactive year (NTC = 66%;
see Supplemental Figure 2), caused ~$27 billion in damage, compared with less than $6 billion in
damage to the United States during 1995, one of the most active years on record (NTC = 231%). In
addition, fresh-water flooding disasters can occur even from weaker systems.

-3-
References and Notes
1. C. W. Landsea, G. D. Bell, W.M. Gray, S. B. Goldenberg, Mon. Weather Rev. 126, 1174
(1998).
2. P. J Hebert, J. D. Jarrell, M. Mayfield, NOAA Tech. Memo. NWS TPC-1, Miami, FL (1996).
3. J. B. Elsner, K.-b. Liu, B. Kocher, J. Clim. 13, 2293 (2000).
4. W. M. Gray, C. W. Landsea, P. W. Mielke Jr., K. J. Berry, E. Blake, Summary of 2000
Atlantic tropical cyclone activity and verification of authors’ seasonal activity prediction.
Colorado State University, CO, 2000. (Available at:
http://tropical.atmos.colostate.edu/forecasts/2000/nov2000/index.html).
5. J. B. Elsner, B. Kocher, Geophys. Res. Lett. 27, 129 (2000).
6. C. J. Neumann, B. R. Jarvinen, C. J McAdie, J. D.Elms, Tropical Cyclones of the North
Atlantic Ocean, 1871-1998. 11-30 (National Climatic Center, Asheville, NC, 1999).
7. R. A. Pielke Jr., C. W. Landsea, Weather Forecasting 13, 621 (1998).
8. A. G. Barnston, M. Chelliah, S. B. Goldenberg, Atmos.-Ocean 35, 367 (1997).
9. Monthly mean wind data used in this study are derived from the gridded (2.5° interval) fields
from the National Center for Environmental Prediction (NCEP) - National Center for
Atmospheric Research (NCAR) reanalysis project. E. Kalnay et al., Bull. Am. Meteorol. Soc.
77, 437 (1996).
10. S. B. Goldenberg, L. J. Shapiro, J. Clim. 9, 1169 (1996).

-4-
Supplemental Table 1 . Mean values and statistical significance of the multidecadal changes inAtlantic tropical cyclone activity and |Vz| parameter (see Fig. 3) based upon Atlantic multidecadalmode (AMM) variations (see Fig. 2B) for various indices of activity that are considered reliable since1944 (6). (Note that the |Vz| data are only available 1948-2000.) Means for individual periods and of“all” warm (1944-1970 and 1995-2000: 33 years) (W) and “all” cold (1971-1994: 24 years) (C)AMM years are shown. The last two columns show ratios between the indices for W versus C years,and for the current warm (1995-2000) (W*) versus most recent cold (1971-1994) (C*) periods.Differences between parameter means for W and C as well as W* and C* are all significant with atleast 99% confidence.
Warm Cold Warm Warm Cold Ratio Ratio
1944-1970 1971-1994 1995-2000 All All W/C W*/C*
Tropical Storms 9.8 8.5 13.1 10.5 8.5 1.24 1.54
Hurricanes 6.2 5.0 8.2 6.6 5.0 1.32 1.64
Major Hurricanes 2.7 1.5 3.8 2.9 1.5 1.93 2.53
Hurricane Days 27.7 16.5 39.5 29.8 16.5 1.81 2.39
NTC (%) 114.3 75.5 164.5 123.4 75.5 1.62 2.18
Caribbean Hurricanes 1.5 0.5 2.5 1.7 0.5 3.40 5.00
Low |Vz| region (%) 70.7 32.6 58.8 68.2 32.6 2.09 1.80
-5-
Supplemental Table 2. Mean values and statistical significance of the multidecadal changes inU.S. landfall frequency [hurricane and major hurricane (MH) strikes], damages and Atlanticmultidecadal mode (see Fig. 2B) based upon Atlantic multidecadal mode (AMM) variations. The dataused extend back to 1899 since almost complete observations of minimum central pressure at landfallfor U.S. strikes exist back to that year (6). For the U.S. damages, medians, rather than means, areused. The values for damages (units of millions of dollars) are normalized to 2000 values byconsidering not only inflation, but also population and wealth changes (7). Values for individualperiods and combination of periods are shown. The combination of “all” warm AMM years (W)includes 1899-1902, 1926-1970 and 1995-2000 (total of 55 years). The combination of “all” coldAMM years (C) includes 1903-1925 and 1971-1994 (total of 47 years). W* and C* refer to thecurrent warm (1995-2000) and most recent cold (1971-1994) periods, respectively. Ratios betweenthe indices for W and C and for W* and C* are also shown. Differences between parameter meansthat are significant with at least 90, 95 and 99% confidence are indicated by “*”, “**”, and “***”,respectively. The differences between the various landfall parameters for W versus C are allstatistically significant except for U.S. Gulf Coast MH. The increases shown here for various U.S.landfall parameters since 1995 (i.e., W* versus C*), however, are not statistically significant, but theincreases in overall numbers of various strengths of systems and for the Caribbean region(Supplemental Table 1) are all significant. The NTC for most of the years since 1988 has been wellabove average (> 120%) (see Supplemental Figure 2). The years in that period with average orbelow-average activity are 1990-1994 and 1997, years when SSTs in the Niño 3.4 region (5°N-5°S;120-170°W) (8) were anomalously warm during the peak of the hurricane season. The effects of ElNiño are evident in the higher values of |Vz| for all but one (1990) of those years (Fig. 3).Additionally, during 1991-1994, the Atlantic multidecadal mode was still cold (Fig. 2B), contributingto the low activity of those years. Since there is some evidence that a preliminary shift to higheractivity started in 1988, both 1988-2000 and 1995-2000 intervals have been used to test the statisticalsignificance of the differences between the recent quiet and active periods. Ratios and statisticalsignificance are shown here and in Supplemental Table 1 only using 1995 as the transition year.Results using 1988 are similar; all of the statistical significance based upon 1995 are also significantbased upon 1988. Most of the differences test more strongly when using 1995 as the shift point,however, with the notable exception of U.S. East Coast major hurricanes. This was not significantusing the 1995 shift but had a ratio of 5.17 for 1988-2000 versus 1971-1987, statistically significantwith at least 95% confidence, mainly due to two devastating major hurricanes during 1988-1994,Hugo (1989) and Andrew (1992).
Warm Cold Warm Cold Warm Warm Cold Ratio Ratio
1899-1902 1903-1925 1926-1970 1971-1994 1995-2000 All All W/C Signif. W*/C* Signif.
U.S. Hurricanes 1.2 1.8 2.1 1.4 2.2 2.0 1.6 1.25 * 1.57 --
U.S. MH 0.50 0.65 0.82 0.42 0.50 0.76 0.52 1.46 * 1.19 --
U.S. Gulf Coast MH 0.25 0.43 0.36 0.29 0.33 0.35 0.36 0.97 -- 1.14 --
U.S. East Coast MH 0.25 0.22 0.53 0.17 0.17 0.47 0.19 2.47 *** 1.00 --
U.S. Damage ($M) 773 441 2,037 616 3,454 2,113 440 4.80 * 5.61 --
AMM (Annual) (°C) 0.08 -0.24 0.18 -0.20 0.22 0.18 -0.22 -- *** -- ***

-6-
Supplemental Figure 1. Climatological winds from the NCEP/NCAR Reanalysis (9) for 1948-2000 averaged for August-September-October (ASO). Streamlines and isotachs (m s-1) are shown.
-7-
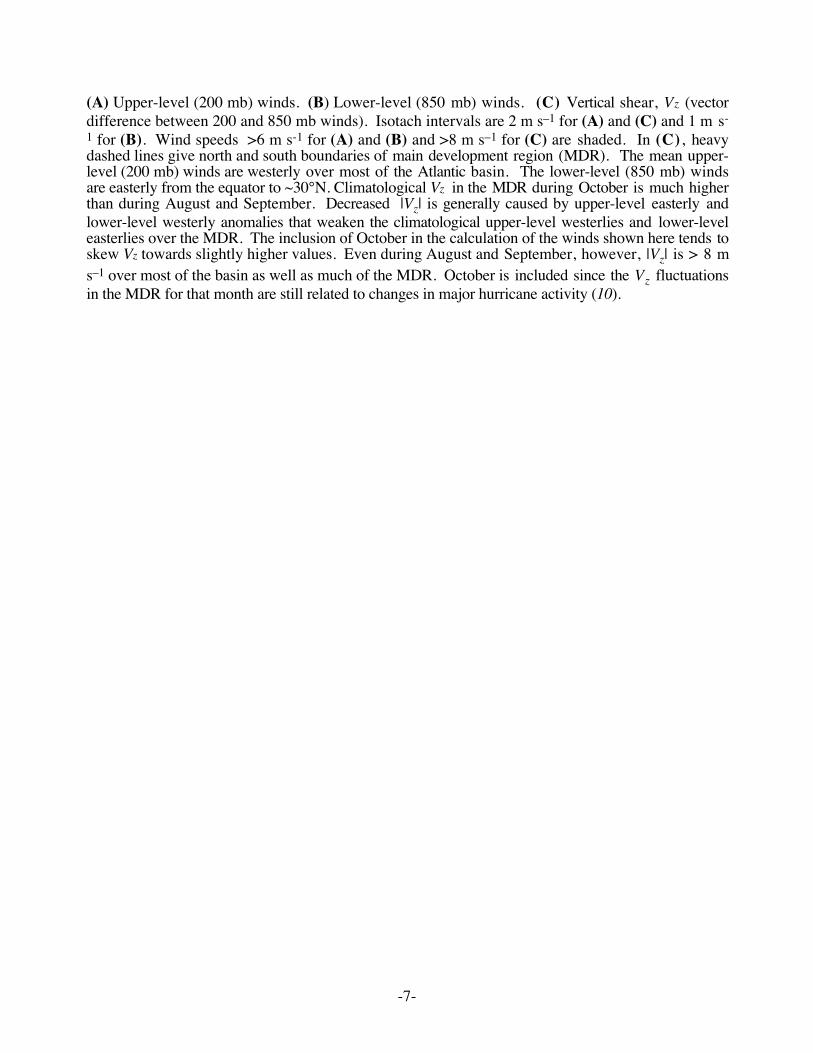
(A) Upper-level (200 mb) winds. (B) Lower-level (850 mb) winds. (C) Vertical shear, Vz (vectordifference between 200 and 850 mb winds). Isotach intervals are 2 m s–1 for (A) and (C) and 1 m s-
1 for (B). Wind speeds >6 m s-1 for (A) and (B) and >8 m s–1 for (C) are shaded. In (C), heavydashed lines give north and south boundaries of main development region (MDR). The mean upper-level (200 mb) winds are westerly over most of the Atlantic basin. The lower-level (850 mb) windsare easterly from the equator to ~30°N. Climatological Vz in the MDR during October is much higherthan during August and September. Decreased |Vz| is generally caused by upper-level easterly andlower-level westerly anomalies that weaken the climatological upper-level westerlies and lower-leveleasterlies over the MDR. The inclusion of October in the calculation of the winds shown here tends toskew Vz towards slightly higher values. Even during August and September, however, |Vz| is > 8 ms–1 over most of the basin as well as much of the MDR. October is included since the Vz fluctuationsin the MDR for that month are still related to changes in major hurricane activity (10).
-8-
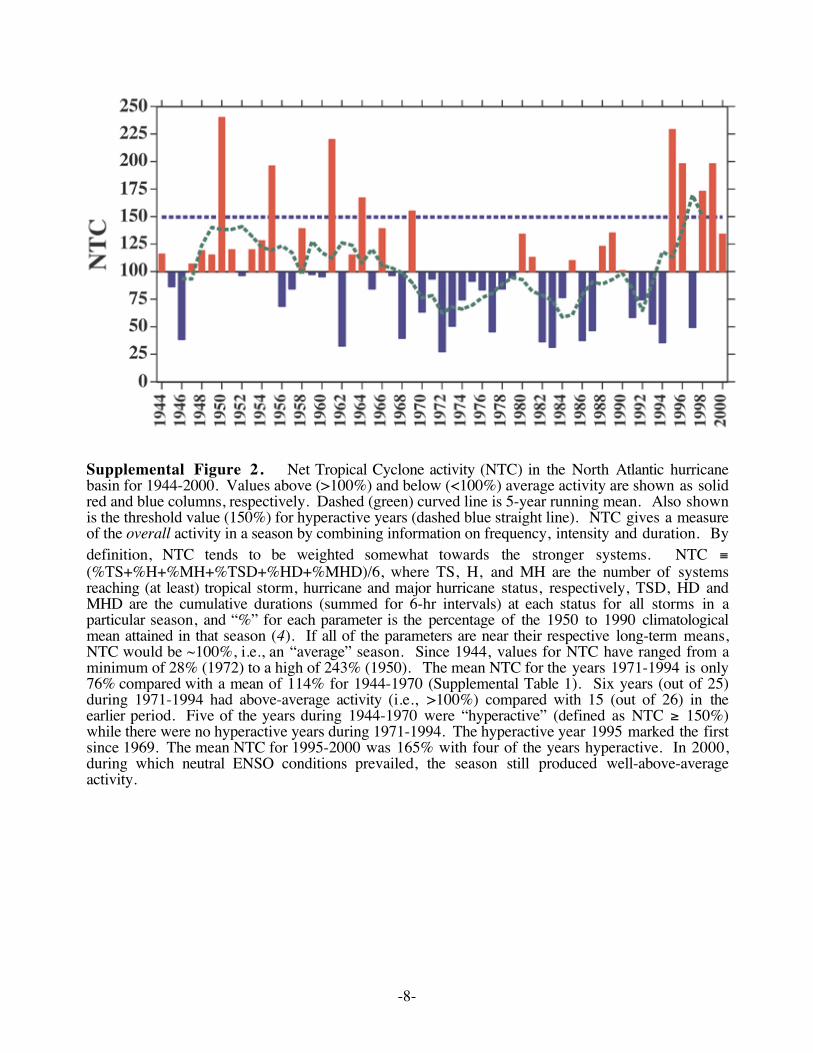
Supplemental Figure 2. Net Tropical Cyclone activity (NTC) in the North Atlantic hurricanebasin for 1944-2000. Values above (>100%) and below (<100%) average activity are shown as solidred and blue columns, respectively. Dashed (green) curved line is 5-year running mean. Also shownis the threshold value (150%) for hyperactive years (dashed blue straight line). NTC gives a measureof the overall activity in a season by combining information on frequency, intensity and duration. Bydefinition, NTC tends to be weighted somewhat towards the stronger systems. NTC ≡(%TS+%H+%MH+%TSD+%HD+%MHD)/6, where TS, H, and MH are the number of systemsreaching (at least) tropical storm, hurricane and major hurricane status, respectively, TSD, HD andMHD are the cumulative durations (summed for 6-hr intervals) at each status for all storms in aparticular season, and “%” for each parameter is the percentage of the 1950 to 1990 climatologicalmean attained in that season (4). If all of the parameters are near their respective long-term means,NTC would be ~100%, i.e., an “average” season. Since 1944, values for NTC have ranged from aminimum of 28% (1972) to a high of 243% (1950). The mean NTC for the years 1971-1994 is only76% compared with a mean of 114% for 1944-1970 (Supplemental Table 1). Six years (out of 25)during 1971-1994 had above-average activity (i.e., >100%) compared with 15 (out of 26) in theearlier period. Five of the years during 1944-1970 were “hyperactive” (defined as NTC ≥ 150%)while there were no hyperactive years during 1971-1994. The hyperactive year 1995 marked the firstsince 1969. The mean NTC for 1995-2000 was 165% with four of the years hyperactive. In 2000,during which neutral ENSO conditions prevailed, the season still produced well-above-averageactivity.