the recent homebuyer tax credit: evaluation and … recent homebuyer tax credit: evaluation and...
TRANSCRIPT
The Recent Homebuyer Tax Credit:
Evaluation and Lessons for the Future
By Karen Dynan, Ted Gayer and Natasha Plotkin
POLICY BRIEF| JUNE 28, 2013

THE RECENT HOMEBUYER TAX CREDIT: EVALUATION AND LESSONS FOR THE FUTURE
2
By early 2008, the U.S. housing market was in critical condition. Existing home sales had fallen nearly 50
percent from their peak in September 2005. Home prices, after having doubled in value between 2000
and 2006 (as measured by CoreLogic’s national housing price index), had subsequently dropped 16
percent and showed no signs of bottoming out. Housing starts were down more than 50 percent from
their high two years earlier. Meanwhile, the rate of foreclosure was more than twice as high as it was at
the peak of the housing boom.
Broader economic conditions had also started to deteriorate. According to the National Bureau of
Economic Research, the economy peaked at the end of 2007; in the following quarter, the nation’s output
of goods and services shrank at an annual rate of almost 2 percent. Payrolls declined by 84,000 in
February 2008—the largest monthly decline since 2003 and a harbinger of more trouble to come.
With the housing sector at the heart of the nation’s economic problems, policymakers took a number of
steps to promote housing demand and otherwise mitigate the crisis. Among them was a homebuyer tax
credit, first passed as part of the Housing and Economic Recovery Act of 2008 and then modified and
extended twice, as part of the American Recovery and Reinvestment Act of 2009, and the Worker,
Homeownership, and Business Assistance Act of 2009. The Government Accountability Office estimated
in 2010 that the three phases of the federal homebuyer tax credit would ultimately cost the federal
government $22 billion dollars. A number of states provided complementary incentives to homebuyers,
most often in the form of a short-term loan that effectively advanced the credit, but in some cases in the
form of an additional credit.
In an in-depth study of the federal homebuyer tax credit and complementary state-level initiatives, we
look at how the programs were structured and, based on their features, what effects one would expect on
the economy (Dynan, Gayer, and Plotkin, 2013). We also look for evidence of how the programs affected
housing market conditions, both while in progress and after they ended. Using a variety of analytical
techniques, we find that these initiatives likely provided a modest short-term boost to housing demand,
but that some of these effects were reversed after the expiration of the credits.
Background
The federal first-time homebuyer tax credit was first introduced in July 2008 as part of the Housing and
Economic Recovery Act of 2008 (HERA), a package of measures meant to stem the tide of foreclosures
and falling house prices. The HERA homebuyer tax credit resembled an interest-free loan: Eligible first-
time homebuyers received a refundable tax credit equal to 10 percent of the purchase price of a principal
residence, up to $7,500, which buyers were subsequently required to repay in 15 annual installments as a
surcharge on their income taxes.1 To qualify, homebuyers had to have income in certain ranges and make
their purchases after April 8, 2008 and before July 1, 2009. Table 1 shows the details of the HERA credit,
as well as those of its successors.
The homebuyer credit was modified and extended through November 30, 2009, as part of the American
Recovery and Reinvestment Act (ARRA), passed in February 2009. ARRA eliminated the repayment
requirement (as long as purchasers remained in their homes for three years) and increased the maximum
value of the credit to $8,000. In November 2009, the credit was expanded and extended a third time
1For homes sold prior to the credit being paid back in full, homebuyers are required to put any gain on the home toward repayment of the loan (up to the amount of the unpaid balance).

THE RECENT HOMEBUYER TAX CREDIT: EVALUATION AND LESSONS FOR THE FUTURE
3
under the Worker, Homeownership, and Business Assistance Act of 2009 (WHBAA). To qualify for the
credit, homebuyers now had through April 2010 to sign a contract and through June 2010 to close the
purchase. In addition to preserving the credit for first-time homebuyers, WHBAA introduced a new credit
worth up to $6,500 for repeat homebuyers who had lived in their previous residence for five years or
longer. WHBAA also raised the income limits for eligibility.
As concerns arose in June 2010 that banks were struggling to close a backlog of transactions in time for
homebuyers to claim the credit, the homebuyer tax credit program was extended once more such that
buyers that had signed a contract by April 30 had until September 30 to close the purchase. At the end of
September, the credit was finally allowed to expire. Table 1 provides a summary of the different phases of
the homebuyer tax credit.
In September 2010, the Government Accountability Office published a report detailing take-up of the
homebuyer tax credit through July 3, 2010. Of the 3.3 million claims received through that time, about
half were associated with the ARRA credit. However, the available data for the WHBAA credit were very
incomplete as many participating homebuyers had not yet even closed their transactions, let alone file
their claims. Taking into account both the funds that would ultimately be paid out through all phases of
the program and the amount that would be paid back (principally by households that took advantage of
the HERA tax credit), the GAO estimated that the full cost of the homebuyer tax credit to the government
would be $22 billion. According to Keightley (2009), about 20 percent of this estimated cost reflected the
HERA phase, 30 percent the ARRA phase, and 50 percent the WHBAA phase.
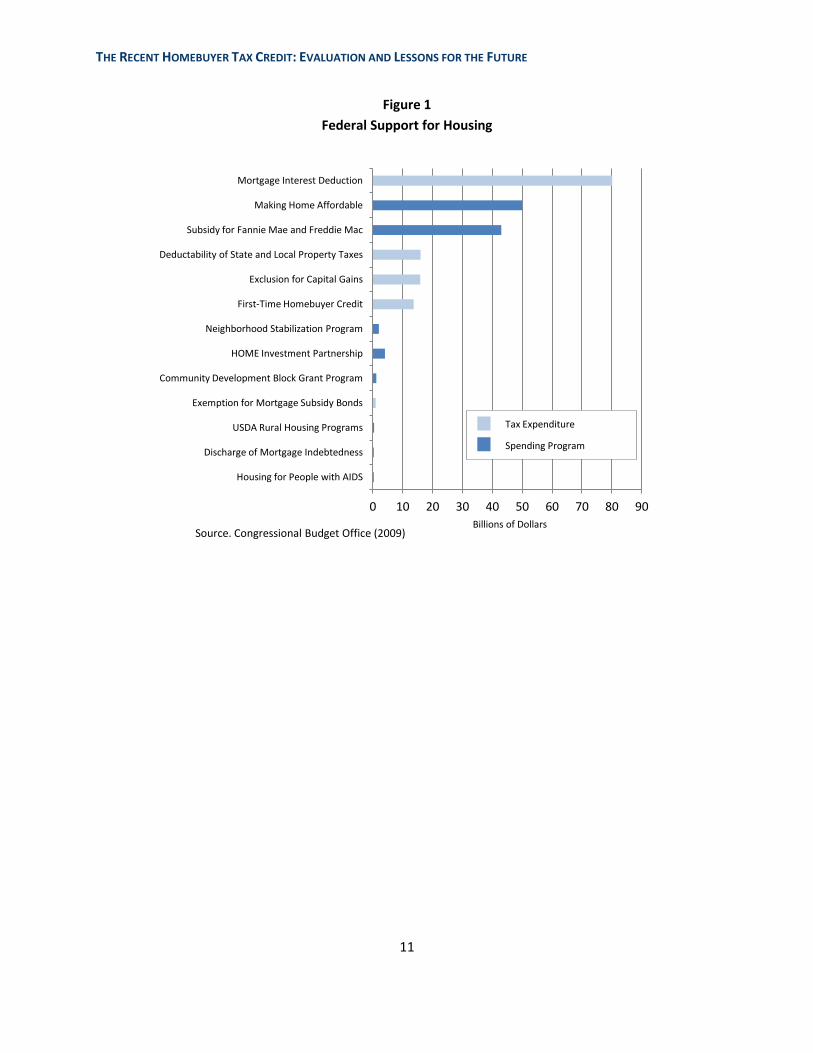
Although this amount is large in absolute terms, it is small relative to the total tax subsidy that the U.S.
government directs toward the housing sector each year. Figure 1 shows estimates of federal support for
housing from the Congressional Budget Office (CBO). According to these estimates, the federal
government provided a subsidy for homeownership through the tax system of about $127 billion in 2009,
only 11 percent of which was associated with the first-time homebuyer tax credit. A much larger share was
accounted for by the mortgage interest deduction, which cost the government about $80 billion in that
year. CBO’s estimate of total federal support for housing in 2009—including all spending and tax breaks
associated with owned homes and with rental housing—was $280 billion, of which the homebuyer tax
credit represented just 5 percent.
The amount of subsidy provided by the homebuyer tax credit varied across regions. Figure 2 maps the
total credit amount claimed by each state’s taxpayers (according to the GAO report) divided by the
number of households in the state. The resulting per-household amount is a measure of the degree to
which the credit might be expected to influence conditions in the state. States in the Central Western
region had the high per-household amount, while all but one of the states with the lowest amounts were in
the Northeast and Midwest.
In the months following the passage of ARRA, many states introduced programs designed to complement
or augment the federal homebuyer tax credit. Table 2 summarizes these programs. Eighteen states
allowed eligible homebuyers to take out a short-term low- or no-interest loan around the time of
purchase, using the value of their forthcoming credit as collateral. A key goal of these programs was to
help cash-constrained households make a downpayment or pay closing costs. The interest rates on these
loans generally rose to the rate of interest on the homebuyers’ first mortgage, or a slightly higher rate, at
some pre-determined date shortly after tax time the following year to encourage homebuyers to repay

THE RECENT HOMEBUYER TAX CREDIT: EVALUATION AND LESSONS FOR THE FUTURE
4
their loans in a timely fashion.2
An additional four states—California, Georgia, Maine, and Utah— introduced tax credits or grants that,
like the federal program, simply subsidized the purchase of a home. Table 2 summarizes these programs.
The details varied widely across programs. For example, the California program had two parts—one
aimed at purchasers of new homes and another aimed at first-time buyers. The credit was non-refundable
and had to be divided over three years. Maine simply provided a grant to eligible first-time buyers that
could be applied to a downpayment or closing costs.
How Might a Homebuyer Tax Credit Affect the Economy?
Homebuyer tax credit programs typically aim to help the housing market by increasing housing demand.
The idea is that such a credit effectively lowers the cost of buying a home, which should induce more
home purchases. The programs may also encourage more home purchases because cash-constrained
buyers that are able to “monetize” the credit prior to purchase through a bridge loan or other means may
find it easier to make a downpayment or pay closing costs.
We note that an increase in home purchases does not necessarily translate into an equivalent increase in
housing demand. As argued by Gayer (2009), there may be little or no additional demand associated with
purchases by households that already own a home (such as the repeat buyers who took advantage of the
WHBAA credit) because they are likely to be selling a home at the same time. Further, many first-time
homebuyers may be leaving a home they rented, therefore reducing demand for rental housing.
However, to the extent that a homebuyer tax credit does generate additional net housing demand, one
might expect several potential follow-on effects that are important to macroeconomic activity:
Higher home prices create “housing wealth effects.” Higher housing demand should raise home prices,
and research suggests that housing capital gains tend to induce homeowners to raise their consumption
of non-housing goods and services. (Households that have yet to purchase a home are made worse off if
home prices rise, but the available evidence suggests that the net effect on aggregate consumption is
positive.)
Higher home prices reduce foreclosures. Homeowners that move from negative to positive equity when
home prices rise gain the option of selling their homes and paying off their loans in full if they find that
they do not have enough income to make their mortgage payments. In such cases, households still
suffer dislocation and its consequential hardships, but they avoid the damage to their credit records that
would occur if they were foreclosed upon, and fewer foreclosures are less disruptive for communities. In
addition, smaller bank losses should leave the financial system stronger and make credit more widely
available.
Higher home prices facilitate refinancing. Homeowners that move into positive equity when home
prices rise should also find it easier to refinance. If they can refinance into lower rate loans, they can
reduce their required mortgage payments and increase the cash they have available to spend.
Reductions in inventories of unpurchased homes encourage new construction. A sufficiently large
increase in housing demand could potentially absorb all of the excess inventory in an ailing housing
2 The federal government also introduced a program to help some homebuyers monetize their credit early, but it was more restrictive than most state programs because it was limited to buyers with FHA loans and the buyers still had to pay the required 3.5 percent FHA downpayments with their own funds.

THE RECENT HOMEBUYER TAX CREDIT: EVALUATION AND LESSONS FOR THE FUTURE
5
market, which could, in turn, result in more homebuilding and higher construction-related
employment.
Higher income stimulates broader demand. The wealth effects and boost to cash flow from refinancing
already discussed should lead to more demand for non-housing goods and services. Such demand
should also be boosted by the increase in disposable income of those claiming the homebuyer tax credit
(assuming that these households do not put all of the windfall back into increased housing services).
Similarly, the higher income of the various parties involved in real estate transactions (e.g. realtors,
appraisers, and lenders) would be expected to boost broader demand.
One critical caveat to any assessment of the potential benefits of a homebuyer tax credit is that much of
the observed impact of a time-limited credit may represent a “pulling forward” of home purchases that
ultimately would have been made at some later date anyway. In doing so, it may delay a necessary
correction in the market (e21, 2013). On the other hand, there can be benefits to accelerating economic
activity if the costs of an economic slump increase disproportionately with its size. For example, firms
may decide not to lay off workers when demand declines if the downturn is perceived as likely to be short-
lived, reducing the hardships suffered by the workers and making it easier for the economy to rebound.
Two other caveats apply but are outside the scope of our analysis. First, the benefits from any boost to
economic activity associated with a homebuyer tax credit need to be weighed against alternative uses of
the funds. Thus, policymakers contemplating the use of such a program in the future should not just look
at the effects of the homebuyer tax credit in isolation but also at the evidence regarding other
countercyclical measures such as broad-based tax relief and infrastructure spending, and how all these
options stack up against the deadweight loss associated with future tax increases needed to fund this
current spending. Second, like most transfers, a homebuyer tax credit has important distributional effects.
For example, as noted above and emphasized by Baker (2012), higher home prices benefit those who
already own homes but hurt those that plan to buy homes in the future. Future policy discussions
concerning the homebuyer tax credit need to consider the desirability of such effects.
Empirical Evaluation of the Homebuyer Tax Credit
Our empirical analysis of the recent homebuyer tax credit focuses on a subset of the channels of impact
discussed above. In particular, we look at the response of home sales, home prices, and home construction
to the credit. As a result, our results speak mainly to the effects on the housing market. Although, the
broader impact of the credit—such as the influence of any housing wealth effects on the demand for non-
housing goods and services—are also potentially important, there were too many other developments at
the time to identify these effects with any precision.
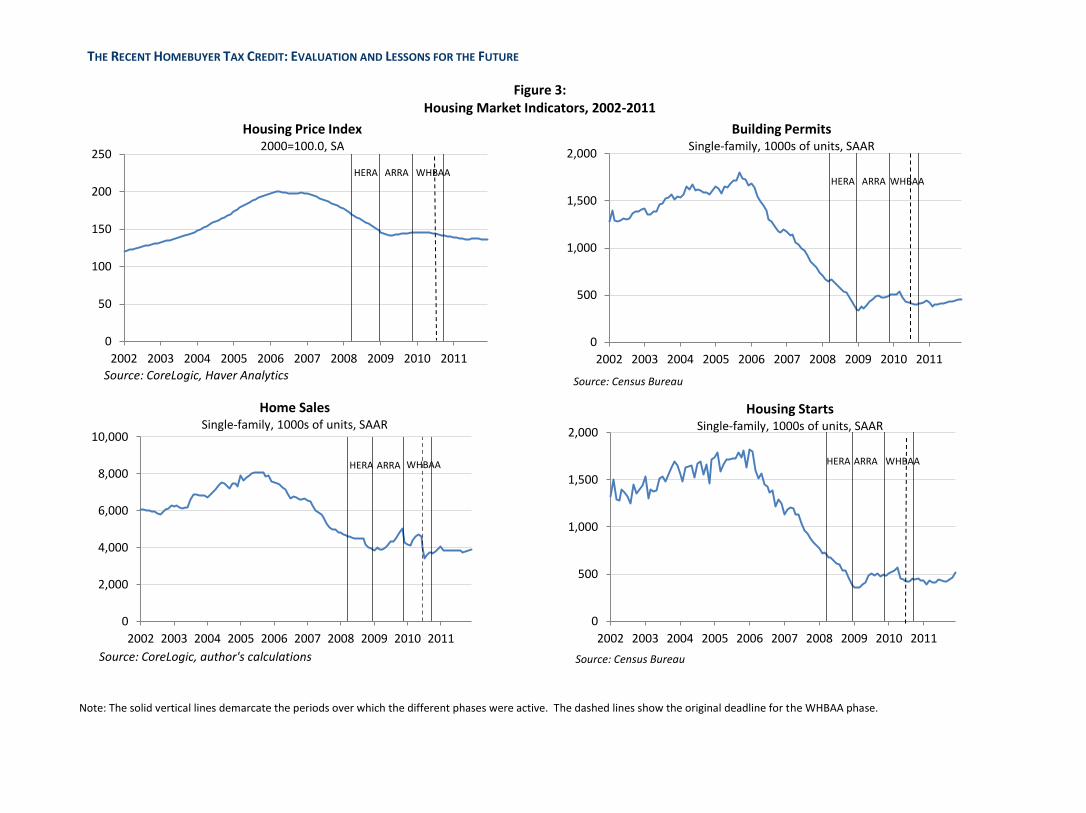
Figure 3 plots single-family home prices, sales, construction permits, and construction starts at the
national level over the last decade. The vertical lines demarcate the periods over which the HERA, ARRA,
and WHBAA phases of the homebuyer tax credit were active, with an additional line in the second panel
marking the original deadline to close transactions to claim the WHBAA credit, before the program was
extended. During the HERA phase, when the program essentially provided an interest-free loan to
homebuyers, the different indicators of housing activity appear to have continued to decline at the same
rapid rate as before the program was introduced. However, almost immediately after ARRA was passed,
the rapid deterioration in housing market conditions came to an end.
Home sales rose a bit in subsequent months before spiking toward the scheduled end of the ARRA
THE RECENT HOMEBUYER TAX CREDIT: EVALUATION AND LESSONS FOR THE FUTURE
6
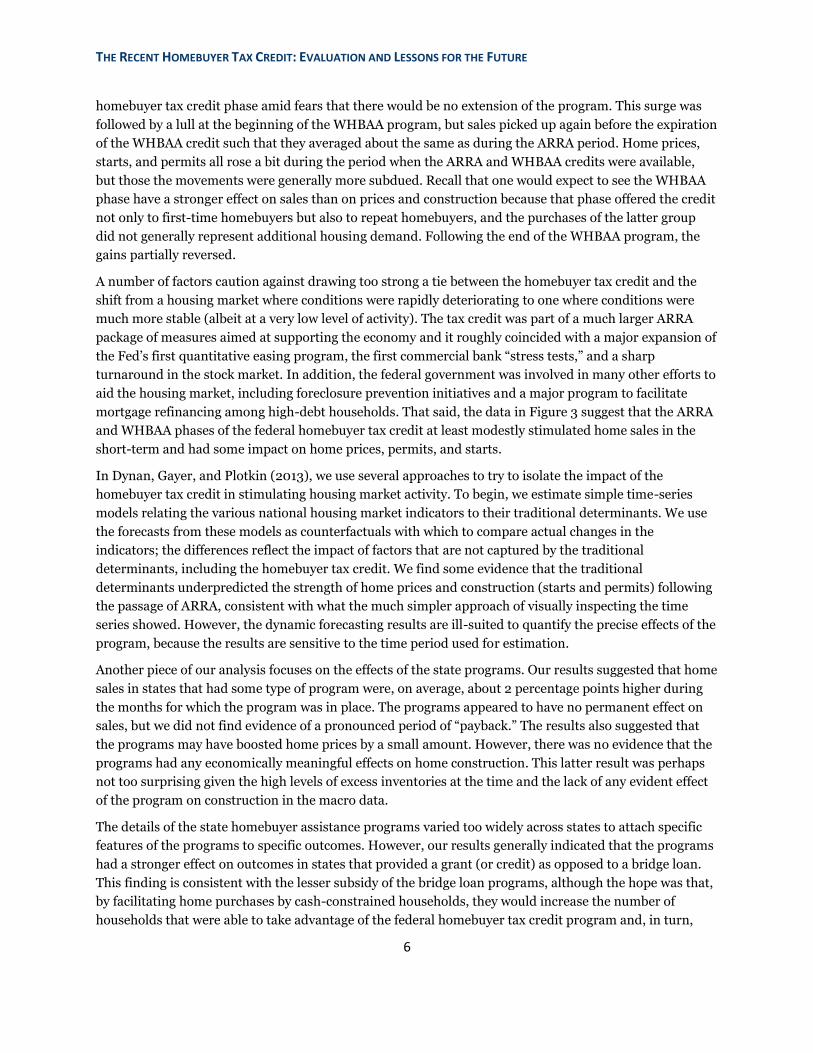
homebuyer tax credit phase amid fears that there would be no extension of the program. This surge was
followed by a lull at the beginning of the WHBAA program, but sales picked up again before the expiration
of the WHBAA credit such that they averaged about the same as during the ARRA period. Home prices,
starts, and permits all rose a bit during the period when the ARRA and WHBAA credits were available,
but those the movements were generally more subdued. Recall that one would expect to see the WHBAA
phase have a stronger effect on sales than on prices and construction because that phase offered the credit
not only to first-time homebuyers but also to repeat homebuyers, and the purchases of the latter group
did not generally represent additional housing demand. Following the end of the WHBAA program, the
gains partially reversed.
A number of factors caution against drawing too strong a tie between the homebuyer tax credit and the
shift from a housing market where conditions were rapidly deteriorating to one where conditions were
much more stable (albeit at a very low level of activity). The tax credit was part of a much larger ARRA
package of measures aimed at supporting the economy and it roughly coincided with a major expansion of
the Fed’s first quantitative easing program, the first commercial bank “stress tests,” and a sharp
turnaround in the stock market. In addition, the federal government was involved in many other efforts to
aid the housing market, including foreclosure prevention initiatives and a major program to facilitate
mortgage refinancing among high-debt households. That said, the data in Figure 3 suggest that the ARRA
and WHBAA phases of the federal homebuyer tax credit at least modestly stimulated home sales in the
short-term and had some impact on home prices, permits, and starts.
In Dynan, Gayer, and Plotkin (2013), we use several approaches to try to isolate the impact of the
homebuyer tax credit in stimulating housing market activity. To begin, we estimate simple time-series
models relating the various national housing market indicators to their traditional determinants. We use
the forecasts from these models as counterfactuals with which to compare actual changes in the
indicators; the differences reflect the impact of factors that are not captured by the traditional
determinants, including the homebuyer tax credit. We find some evidence that the traditional
determinants underpredicted the strength of home prices and construction (starts and permits) following
the passage of ARRA, consistent with what the much simpler approach of visually inspecting the time
series showed. However, the dynamic forecasting results are ill-suited to quantify the precise effects of the
program, because the results are sensitive to the time period used for estimation.
Another piece of our analysis focuses on the effects of the state programs. Our results suggested that home
sales in states that had some type of program were, on average, about 2 percentage points higher during
the months for which the program was in place. The programs appeared to have no permanent effect on
sales, but we did not find evidence of a pronounced period of “payback.” The results also suggested that
the programs may have boosted home prices by a small amount. However, there was no evidence that the
programs had any economically meaningful effects on home construction. This latter result was perhaps
not too surprising given the high levels of excess inventories at the time and the lack of any evident effect
of the program on construction in the macro data.
The details of the state homebuyer assistance programs varied too widely across states to attach specific
features of the programs to specific outcomes. However, our results generally indicated that the programs
had a stronger effect on outcomes in states that provided a grant (or credit) as opposed to a bridge loan.
This finding is consistent with the lesser subsidy of the bridge loan programs, although the hope was that,
by facilitating home purchases by cash-constrained households, they would increase the number of
households that were able to take advantage of the federal homebuyer tax credit program and, in turn,
THE RECENT HOMEBUYER TAX CREDIT: EVALUATION AND LESSONS FOR THE FUTURE
7
increase the effect of the federal programs on a state’s housing markets.
Conclusions and Policy Lessons
In principle, a homebuyer tax credit can offset weakness in the housing market and broader economy. Our
empirical analysis of the recent homebuyer tax credit program was limited by the difficulty of isolating the
effects of the program in national- and state-level data when so many other dramatic developments were
occurring at the same time. That said, we find evidence that the HERA homebuyer tax credit, which
essentially amounted to an interest-free loan, did little to stop the rapid deterioration of the housing
market conditions after the bursting of the home price bubble. The more generous ARRA and WHBAA
homebuyer tax credits coincided with a stabilization of the market (albeit at a low level), although there
were many other policy and economic developments that likely contributed importantly to this shift. Our
results—based on analysis of the federal program and the similar programs provided by some states—
suggest that the ARRA and WHBAA homebuyer tax credits provided a modest boost to home sales and
home prices while they were available, with some of the changes partially reversed after the expiration of
the credits.
Based on our study, we offer the following lessons to future policymakers contemplating the use of a
homebuyer tax credit as a stabilization tool:
When offered on a time-limited basis, a homebuyer tax credit will to some extent “pull forward” sales
that would have occurred anyways. As a result, a time-limited credit will typically be followed by a
period of partial “payback.” However, there can be benefits to accelerating economic activity if the
costs of an economic slump increase disproportionately with its size.
To induce a net increase in the demand for owner-occupied homes, a homebuyer tax credit should
target first-time homebuyers. There may be little or no additional demand associated with purchases
by households that already own a home (such as the repeat buyers who took advantage of the WHBAA
credit) because they are likely to be selling a home at the same time. Consideration should also be
given to the implications for the rental market, as many first-time homebuyers may be leaving a home
they rented.
Homebuyer tax credit programs have important distributional effects. Future policy discussions need
to consider the desirability of such effects.
The benefits from any boost to economic activity associated with a homebuyer tax credit need to be
weighed against alternative uses of the funds. More research is not only needed on the benefits of the
homebuyer tax credit but also on the benefits associated with other forms of economic stimulus
compared to the costs of such policies.
Complementary programs that allow homebuyers to “monetize” their homebuyer tax credits sooner
(such as the bridge loan programs offered by states and the FHA) should facilitate home purchases by
cash-constrained households and, in turn, increase the impact of a credit. Our analysis found little
evidence that these programs made a difference in the recent episode, but further study is warranted.
The state-level programs that were somewhat similar in structure to the federal program (offering
grants or credits) yielded clearer evidence of a modest impact on housing market conditions than the
federal programs. This may be a result of having better variation with which to test for effects, but it
could also reflect a better ability by states to design programs that are tailored to the specific
conditions prevailing in their own housing markets. Future research on this topic is also warranted.
THE RECENT HOMEBUYER TAX CREDIT: EVALUATION AND LESSONS FOR THE FUTURE
8
References
Baker, Dean. 2012. “First-Time Underwater: The Impact of the First-time Homebuyer Tax Credit.” Center
for Economic and Policy Research Report (April). Available at:
http://www.cepr.net/documents/publications/housing-2012-04.pdf.
Dynan, Karen E., Ted Gayer, and Natasha Plotkin. 2013. “An Evaluation of Federal and State Homebuyer
Tax Incentives” (June).
Congressional Budget Office. 2009. “An Overview of Federal Support for Housing” (November). Available
at: http://www.cbo.gov/topics/housing/reports?page=1&destination=topics%2Fhousing%2Freports
e21. 2013. “Housing Recovery on Firm Footing of Economic Fundamentals” (May 30). Available at:
http://economics21.org/commentary/housing-recovery-firm-footing-economic-fundamentals.
Gayer, Ted. 2009. “Extending and Expanding the Homebuyer Tax Credit Is a Bad Idea.” Brookings
Upfront Blog (October 9).
Keightley, Mark P. 2009. “An Economic Analysis of the Homebuyer Tax Credit.” Congressional Research Service (December). Available at: http:// http://assets.opencrs.com/rpts/R40955_20091201.pdf.

THE RECENT HOMEBUYER TAX CREDIT: EVALUATION AND LESSONS FOR THE FUTURE
9
Table 1 Major Phases of the Homebuyer Tax Credit
Housing and
Economic Recovery
Act of 2008
American Recovery
and Reinvestment Act
of 2009
Worker, Homeownership,
and Business Assistance Act
of 2009
Eligible purchase
dates
Apr. 8, 2008 -
Dec. 31, 2008a
Jan. 1, 2009 -
Nov. 30, 2009
Nov. 7, 2009-
April 30, 2010 (deadline for
contract); Closing required by
June 30, 2010, extended to
Sep. 30, 2010b
Buyer type
First-time First-time First-time and repeat (if they
had owned and lived in their
homes for 5 years)
Maximum amount
$7,500 $8,000 $8,000 for first-time buyers
$6,500 for repeat buyers
Income phase-out
($ 000s)
Single: $75-95
Joint: $150-170
Single: $75-95
Joint: $150-170
Single: $125-145
Joint: $225-245
Repayment required
Yes Noc Noc
Maximum purchase
price
None None $800,000
a. The HERA credit was available through July 1, 2009, but since the ARRA credit was strictly more generous, we assume that taxpayers would have chosen to take advantage of that credit instead.
b. Members of the armed services were subject to an extended deadline.
c. Provided the homebuyer owned and lived in the home for 36 months following purchase (rule waived for members of the armed services).

THE RECENT HOMEBUYER TAX CREDIT: EVALUATION AND LESSONS FOR THE FUTURE
10
Table 2 State Programs Complementing the Federal Homebuyers Tax Credit
Bridge Loan Programsa
Type of
program
Amountb Interest
ratec
Program
startd
Program
ende
Loan
due State % price Max.
Colorado
Loan 3.5 6000 0 Jan-09 Jun-10 Dec-10
Florida Loan
8000 0 May-09 Jun-10 Jun-10
Idaho Loan 5 7000 3 Mar-09 Jun-10 Jul-10
Illinois Loan 3.5 6000 0 Jul-09 Nov-09 Jun-10
Kentucky Loan
4500 0 May-09 Nov-09 Jul-10
Massachusetts Loan
8000 0 Jul-09 Nov-09 Jun-10
Missouri Loan 6 6750 0 Jan-09 Nov-09 Jun-10
Nebraska Loan 8.5 6800 5 Dec-09 Jun-10 Dec-10
New Jersey Loan 10 5000 0 Apr-09 Dec-09 Jun-10
New Mexico Loan 8 6500 0 Apr-09 Dec-09 Jun-10
New York Loan 10 8000 0 Jan-10 Jun-10 Jun-11
Ohio Loan 3
0 Jan-09 Nov-09 Aug-10
Oklahoma Loan 6 6000 2 Aug-09 Nov-09 Dec-09
Pennsylvania Loan 10 5500 0 Jan-09 Nov-09 Jun-10
South Dakota Loan 6 6000 0 Jun-09 Nov-09 Jul-10
Tennessee Loan 3.5
0 Apr-09 Nov-09 Jun-10
Texas Loan 5 7000 0 Jul-09 Dec-09 Mar-10
Virginia Loan 5
0 Jun-09 Jun-10 Jun-11
California Credit 5 10,000 n/a Mar-09 Aug-10 n/a
Georgia Credit 1.2 1800 n/a Jun-09 Nov-09 n/a
Maine Grant 4 5000f n/a Jun-09 unclear n/a
Utah Grant n/a 6000f n/a Mar-09 Nov-09 n/a
a. Additional restrictions applied to most programs.
b. Loan amounts are equal to the listed percent of the home purchase price up to the listed maximum.
c. Loan “due date” is date at which the interest rate rises if the loan has not yet been paid back.
d. We could not find specific information about the start dates for FL, TN, and VA, so we estimated these dates using related
information such as when press releases were issued.
e. We could not find specific information about the end dates for CO and SD, so we estimated these dates using related
information such as when loans were due.
f. Programs had two phases; amount reduced in the second phase.
THE RECENT HOMEBUYER TAX CREDIT: EVALUATION AND LESSONS FOR THE FUTURE
11
Figure 1
Federal Support for Housing
0 10 20 30 40 50 60 70 80 90
Housing for People with AIDS
Discharge of Mortgage Indebtedness
USDA Rural Housing Programs
Exemption for Mortgage Subsidy Bonds
Community Development Block Grant Program
HOME Investment Partnership
Neighborhood Stabilization Program
First-Time Homebuyer Credit
Exclusion for Capital Gains
Deductability of State and Local Property Taxes
Subsidy for Fannie Mae and Freddie Mac
Making Home Affordable
Mortgage Interest Deduction
Billions of Dollars
Tax Expenditure
Spending Program
Source. Congressional Budget Office (2009)

THE RECENT HOMEBUYER TAX CREDIT: EVALUATION AND LESSONS FOR THE FUTURE
12
Figure 2 Amount of Homebuyer Credit Claimed per Household by State
ARRA and WHBAA, through July 3, 2010
Note: Amount for each state calculated by dividing GAO’s (2010) estimate of total amount of credit claimed by tax filers in a state by the total number of households in that state.
THE RECENT HOMEBUYER TAX CREDIT: EVALUATION AND LESSONS FOR THE FUTURE
0
Figure 3: Housing Market Indicators, 2002-2011
0
50
100
150
200
250
2002 2003 2004 2005 2006 2007 2008 2009 2010 2011
Housing Price Index 2000=100.0, SA
HERA ARRA WHBAA
Source: CoreLogic, Haver Analytics
0
2,000
4,000
6,000
8,000
10,000
2002 2003 2004 2005 2006 2007 2008 2009 2010 2011
Home Sales Single-family, 1000s of units, SAAR
HERA ARRA WHBAA
Source: CoreLogic, author's calculations
0
500
1,000
1,500
2,000
2002 2003 2004 2005 2006 2007 2008 2009 2010 2011
Building Permits Single-family, 1000s of units, SAAR
HERA ARRA WHBAA
Source: Census Bureau
0
500
1,000
1,500
2,000
2002 2003 2004 2005 2006 2007 2008 2009 2010 2011
Housing Starts Single-family, 1000s of units, SAAR
HERA ARRA WHBAA
Source: Census Bureau
Note: The solid vertical lines demarcate the periods over which the different phases were active. The dashed lines show the original deadline for the WHBAA phase.