the reaction between iodine and silver under severe pwr
TRANSCRIPT

283
'"" CH9700209
The Reaction between Iodine and Silver under Severe PWRAccident Conditions.
An Experimental Parameter Study.
F. Funke, G.-U. Greger, A. Bleier, S. Hellmann, W. Morell
AbstractAn extensive experimental parameter study was performed on the kinetics in the reactionsystems k/Ag and F/Ag in a laboratory-scale apparatus. Starting with h or F solutions andsilver powder suspensions, the decrease of soluted t or F, respectively, due to fixation on thesilver particles, was monitored as function of time using the radioactive tracer 1-131.
The measured data were analyzed using a model of first order kinetics with respect to theiodine concentration. However, the analysis using first order kinetics had to be performedseparately in an early, fast reaction phase (0-5 min) and in a late, slow reaction phase (5-30).The reason for this unexpected behaviour was not identified. Thus, rate constants, two foreach test, were deduced from 14 VAg main tests and from 36 F/Ag tests.
No dependencies of the rate constants were found on the parameters temperature (variedbetween 25°C and 160°C), pH (3-7), initial iodine concentration (1E-4-1E-6 mol/1), presenceof boric acid (2000 ppm), type of silver educt (different powders, plate, coarse shreddings ofcontrol rod material), and pretreatment of the silver educt (hydrogen reduction) prior to thetests. However, the stirring of the reaction solution generally enhanced the kineticshighlighting the importance of mass transfer. The F/Ag reaction proceeded only if there wasno inertization of the reaction solution by sparging with nitrogen.
The temperature-independent rate constant for the early, fast fe/Ag reaction phase is 2E-5 m/s.However, a smaller rate constant of 6E-6 m/s is recommended for use in source termcalculations with IMPAIR, which already contains a first order model. Analogeously, thetemperature-independent F/Ag reaction rate constant is 8E-6 m/s in an early, fast reactionphase. For use in source term calculations, a smaller rate constant of 2E-6 m/s isrecommended. The lower bound of the F/Ag rate constant was 3E-8 m/s which could be usedin very conservative source term calculations. If there is a boiling sump, and neglectingoxidation effects due to radiation, inertizing conditions would be more appropriate to theF/Ag system and in this case the F/Ag reaction should be switched off.
Inconsistencies in the literature data on the solubilities of silver iodide at high temperatureswere clarified experimentally. The solubility of stoichiometric Agl suspended in water atT=160°C was measured by taking several samples from the homogenous solution andamounts to 1.3E-5 mol/1. This value fits well with the majority of the literature data in anArrhenius type representation.
The data of this work are helpful in quantifying the effect of silver iodide as an iodine sink inLWR severe accidents.
All authors: Siemens AG, Power Generation Group (KWU), D-91050 Erlangen, P.O. Box 3220, F. R. Germany
284
1. INTRODUCTION
The knowledge of the chemical behaviour of radioiodine in the containment during ahypothetical core melt accident is essential for the prediction of the source term to theenvironment using available iodine codes. An important aspect so far not sufficientlycontained in the modelling arises from the presence of large amounts of silver in PWRsilver/indium/cadmium control rods. The chemical reaction between iodine and silver leads tothe formation of non-volatile silver iodide. Consequently, this reduces the iodine volatility oreven represents a permanent iodine sink in PWR severe accidents, provided that silver iodideis stable against radiation.
Due to its high volatility at core melt temperatures, silver (Ag) is evaporized and can reach thecontainment sump. The Ag inventory in a PWR exceeds that of iodine by up to a factor of 100and therefore even small quantities of silver reaching the sump represent a significant reactionpartner for iodine. A literature study showed that Ag particles in the aqueous phase react withmolecular iodine Cb) and with iodide ions (T) by formation of silver iodide (Agl) layers on theAg particles surfaces. Agl has a very low solubility in water and is non-volatile under severeaccident containment boundary conditions. Provided furthermore that it withstands radiolyticdisintegration, Agl represents a permanent iodine sink. It is therefore essential to model theaqueous silver/iodine chemistry in severe accident iodine codes taking into accountparameters in the sump boundary conditions that have to be identified experimentally.
The present knowledge on the silver/iodine reaction indicates that Agl layers on the Agparticles are formed by reaction of Ag particles with I2 and with water-soluble iodide T.However, it is not clear from published literature, how boundary conditions in the sump watersuch as pH, temperature etc. influence the formation of low-soluble Agl. Additionally, thereare uncertainties in the literature on the solubility of Agl in water at high temperatures up to160°C. Due to lacking information on these questions, the influence of silver on the iodinevolatility under severe accident containment conditions can therefore not adequately bemodeled in the existing iodine codes (INSPECT, IODE, IMPAIR, LIRIC). An experimentalparameter study was therefore performed in order to create a data basis which allows animproved modeling of the silver/iodine chemistry in severe accident iodine codes.

285
2 EXPERIMENTAL
2.1 PrincipleThe experiments on the kinetics in the reaction systems h or I~ with silver were planned inorder to clearly define boundary conditions kept fixed during the tests and to take varioussamples out of the reaction mixture during the tests without interupting them.
Remark: throughout the whole paper we use the expression iodine as representing in generalall different iodine species. Instead, in cases where the chemical symbols are used (I2 forelemental iodine or T for iodide in aqueous solution) a distinction between the various iodinespecies is necessary.
2.2 ApparatusTests at T < 100°C were performed in the apparatus shown in the Figure 1. A glass vesselwith 12 cm inner diameter and 20 cm height contained the reaction suspension consisting ofsmall silver particles and aqueous iodine solution. The vessel was placed on a magneticstirring hot plate. The cover is equipped with a sampling line, a thermometer, a cooler, and aseparatory glass funnel for dosing of the silver suspension at the beginning of each test. Asecond vessel besides the reaction vessel originally contained a sodium hydroxide solutionand serves to collect the reaction suspension at the end of each test. This second vessel isequipped with a security valve.
Tests at T = 160°C were performed essentially in the same way as for lower temperatures, buta glass autoclave was employed as reaction vessel. Dimensions and equipment wereessentially very similar to those of the apparatus for T<100°C tests.
2.3 MethodA standard method was developed in the course of the experiments and is described in thefollowing.
An aqueous solution (1 liter) of either I2 or T was brought to a defined pH in the reactionvessel. Iodine tracer acitivity (usually about 4E6 Bq 1-131) was added.
A suspension of silver powder (10 ml water with adjusted pH and containing lg Ag) wasprepared and filled into the separatory funnel. A supersonic pretreatment of the silver/watermixture was performed prior to the test to destroy agglomerates and to prevent whirl-up ofsilver particles onto the surface of the suspension. In some tests, silver plates were usedinstead of silver powder.
Tests were initiated by the addition of the silver suspension to the iodine solution within30 seconds. In most tests the suspension was stirred. Durations of the tests were up to300 minutes.
Samples were usually taken after 2 min, 5 min, 10 min, 20 min, 30 min, 60 min, 120 min,200 min and 300 min to determine the amount of unreacted iodine. Shortly before eachsampling the stirrer was switched off in order to let the silver particles be deposited on thebottom of the reaction vessel and to be able to take samples out of the homogeneous aqueoussolution (without Ag or Agl-coated Ag particles). Additionally, the samples were filteredabove glass filters to remove Agl coated particles. The remaining 1-131 activity of the sample,being representative for the unreacted iodine concentration in the rection vessel, wasmeasured.
At the end of each test, the reaction suspension was transferred into the second vessel where I2in the aqueous phase was reduced to non-volatile F by NaOH. The suspension was filtered

286
and the filter content was washed with Na2S2C>3 to redissolve the iodine on the Agl particles.The 1-131 measurement of this washing solution yielded the iodine loading on the Agparticles.
2.4 Test matrixA large number of parameters was variied in the tests as described below The complete testmatrices are given in Table 1 (main tests in the WAg system), Table 2 (pre-tests in the 17Agsystem) and Table 3 (main tests in the T/Ag system). It was found during the course of theprogramme that the pre-tests in the F/Ag reaction system yielded data of the same quality asin the following main tests and consequently, the pre-test data were included in the analysis ofthe parameter study.
Five different stiver educts were used:
• fine powder with 2.0 - 3.5 ^m diameter, 0.2 m2/g specific surface, delivered by Aldrich,
• fine powder with 2.0 - 3.5 um diameter, 0.34 m2/g specific surface, delivered by Johnson-Matthey,
• 60 mesh powder, 0.13 m2/g specific surface, delivered by Aldrich,
• coarse shreddings of silver/indium/cadmium control rod material, total surface = 0.186 m2,
• silver metal sheet, total surface = 0.01 m2.
In some tests, freshly reduced silver powder (reduced by hydrogen) was used.
The tests were essentially performed at temperatures of 25°C (room temperature), 80°C and160°C, thereby covering the whole severe accident temperature range that is relevant forGerman containments.
All tests with h were done atpH 3 so as to avoid the hydrolysis which would render the dataanalysis too complex. In tests with I~ the pH was varried between 3,5 and 7.
Prior to most tests, a 10 minutes gas sparging was performed with either air (oxidizingconditions), argon or nitrogen (inertization).
The initial iodine concentration was variied between 1E-2 g/1 and 1E-4 g/1, i.e. aboutlE-4mol/l and 1E-6 mol/1, respectively. The initial iodine concentration of 1E-2 g/1 isconsistent with the iodine concentration in the containment sump assuming that the wholeiodine LWR inventory (typically 15-20 kg, depends also on bumup) reaches the sump with avolume of about 1500 - 2000 m3. For comparison, the Ag concentration was usually 1 g/1 andtherefore exceeded the iodine concentrations by factors of 100 or 10000.
The suspension was stirred in most tests. Non-stirring leads to the deposition of the silverpowder on the bottom of the vessel. Sampling is then performed out of an inhomogeneoussolution and renders the interpretation of results difficult.
Boric acid was added in some tests with T in an accident-relevant concentration(2000 ppm B).
2.5 Measurement of the solubility of Agl at 160°CStoichiometreic Agl was prepared by adding an AgNCb solution to an 1-131 tracered KIsolution. The precipitated Agl was filtered and washed.
The Agl powder (in the order of 200 mg) was placed in an autoclave together with 600 ml2000 ppm boric acid. The autoclave was equipped with the same instruments as described insection 2.2. The Agl suspension was stirred. Two hours after the temperature of 160°C was
287
reached, several samples were taken. A filter at the beginning of the sampling line retainedsolid Agl particles. The activity of the samples was measured and yielded the concentration ofsoluble iodine ([T]).

288
3 DATA EVALUATION AND RESULTS
14 tests were performed with I2/Ag reaction and 36 tests with FYAg reaction. This does notinclude further numerous pre-tests and blind tests. The most valuable representation of testresults is the measured concentration of unreacted iodine in the suspensions as function oftime.
3.1 Ia/Ag dataFrom the numerous measurements in the I2/Ag system, Figure 2 shows typical results for thedecrease of I2 with time. The results of three tests are given with variation of pH and variationof gas sparging through the reaction solution before the tests. All three curves show a verysimilar behaviour as function of time. More than 50 % of the iodine is removed by the silverparticles already after 2 minutes (the first sample). Afterwards, the decrease of I2 continues butproceeds much slower. Usually, only negligible percentages of unreacted I2 were detectedafter 30 minutes.
The kinetic approach to determine the rate constant for the chemical reaction
2 Ag +12 -» 2 Agl
was as follows:
+ ¥1 d[AgJ]/dt = - d[I2J/dt = k [L2] [Ag] S 1000 (1)
with [Agl] silver iodide concentration (mol/1)
[I2] I2 concentration (mol/1)
[Ag] Ag concentration (g/1)
S specific surface of the silver particles (m2/g)
k rate constant (m/s)
1000 factor due to the employed dimensions
Since the reaction between iodine and silver is a surface reaction, the reaction rate should beproportional to the product of [Ag] and S, this product furtheron being called S\ the Agsurface concentration given in m2/l. If it is assumed that the Ag surface concentration remainsconstant, then (1) reduces to a first order kinetics with respect to I2:
+ Vt d[AgI]/dt = - d[I2]/dt = k [I2] S' 1000 (2)
By integration of (2) the solution is obtained which was applied for the analysis of the data.
P2] = [l2L=o exp(-k S' 1000) (3)
As is obvious from Figure 2, (3) cannot be applied over the whole data for a given test.Therefore, two time ranges (,,early phase" and ,4ate phase") were analyzed separately using(3). The early phase was defined as the 0 min to 5 min phase, and the late phase was definedas the 5 min to 30 min phase. Thus, from each test two rate constants were derived.
3.217Ag dataFrom the numerous measurements in the T/Ag system, Figure 3 shows typical results for thedecrease of T with time. Keeping constant all other parameters, only the initial iodineconcentration was varied between 1E-2 g/1 and 1E-4 g/1 in this case. The two curves show avery similar behaviour as function of time. As in the I2/Ag tests, there is a rapid decrease ofthe iodine (here F) in an early reaction phase. In a second phase the decrease of T proceedsmuch slower.

289
The kinetic approach to determine the rate constant for the chemical reaction
Ag + T -»Agl
was analogous to that from the tyAg reaction so that a rate law similar to (3) results:
[T] = [rj«=o exp(-k S' 1000) (4)
As is obvious from Figure 3 the same phenomenon as in the t/Ag tests occurs: (4) cannot beapplied over the whole data for a given test. Therefore, the two reaction phases as defined forthe fc/Ag tests were also applied to the analysis of the F/Ag tests and each test yielded tworate constants, one for the early phase and one for the late phase.
It is essential to note that the I7Ag reaction, in contrast to the k/Ag reaction, only took place ifthere was no inertizing gas (argon or nitrogen) bubbled through the reaction vessel before thetest. Obviously the oxidizing conditions at the silver surface play an essential role in thereaction mechanism.
3.3 Solubility of Agl at 160°CThe solubility of Agl in aqueous solution is given by the equilibrium of the reaction
The solubility product is then
L = [Ag+][T] (5)
Since stoichiometric Agl was used in the present tests, [Ag*] is equal to [T] and (5) becomes
L = [Tf or lgL = 21g[T] (6)
The result of a literature research [Gmelin 1972] on solubilities of Agl is given in Table 4including the cited original publications. These data are also shown in Figure 4 as function ofthe inverse temperature, together with the data point measured in the present work (filledsquare, [T]=l-3E-5 mol/1 at T=160°C). The meanings of the different data and different linesin Figure 4 are discussed later.

290
4. DISCUSSION
4.1 Parameter dependencies of the tyAg reactionEach of the Figures 5 to 13 contains the same data, namely the rate constants of thereaction in 12 tests in the above defined early and late phase of the tests. In each figure,different symbols are used to indicate the relevant tests for the comparison in order to detectparameter dependencies on the reaction rate. Data marked as open circles in these figures aregenerally not considered in the comparisons. It is important to note that the tests 8, 31 and 32were done without stirring of the suspension so that the reaction rate is obviously reduced dueto the slower h transport to the settled Ag particles.
Figure 5 studies the influence of inertization on the reaction rate. Two very similar tests areselected both with 1E-2 g/1 initial I2 concentration, temperature of 25°C and stirring of thesuspension. Test 1 was with oxidizing conditions, test 2 with inertization using Ar. The othertests are not regarded in this comparison. No dependency on the parameter inertization isfound for each reaction phase (early and late phase).
Figure 6 studies the influence of temperature on the reaction rate. No dependency on theparameter temperature is found. The activation energy for the k/Ag reaction in the iodinecodes can therefore be set to 0.
Figures 7 and 8 show that there is no dependency on the parameter initial I2 concentration onthe reaction rate at both temperatures, T=25°C and T=80°C. A separate analysis of Aglmonolayers reveals that, if a 100 fold smaller initial h concentration is used, then a 100 foldsmaller number of Agl monlayers is observed. The degree of Agl loading on the Ag particlesis therefore no parameter to be modelled in iodine codes.
Figure 9 shows that there is no dependency on the parameter pretreatment of the silver educton the reaction rate. Freshly reduced Ag powder reacts with the same rate as untreated Agpowder.
Figure 10 shows that there is no dependency on the parameter type of the silver educt on thereaction rate. Neither the granulometry of the silver particles nor a different chemicalcomposition (note that test 5 was performed using coarse shreddings of Ag/In/Cd control rodmaterial) has a significant influence.
Figures 11 and 12 clearly demonstrate the dependency of the reaction rate on the parameterstirring at the two temperatures 25°C and 80°C.
Figure 13 again studies the temperature dependency in tests without stirring. As alreadyconcluded from Figure 6, no dependency on the reaction rate is found.
It follows from the proceeding comparisons that the parameters inertization, temperature,initial I2 concentration, type and pretreatment of the silver educt do not influence significantlythe VAg reaction rate. However, stirring significantly influences the reaction rate. Theparameter pH was kept constant at 3 in order to avoid complicating hydrolysis effects.
From this observation, mean values of the rate constants were calculated on all tests withstirring and, separately, on all tests without stirring. This was done for both reaction phases,the early and the late phase. The results and the corresponding ranges of measured reactionrates are given in Table 5.
It turns out that in tests with stirring the rate constant of the early reaction phase is about2E-5 m/s and thus about a factor of 3 faster than that of the later phase being 6E-6 m/s.

291
The two mean values of the rate constants in tests without stirring are about 4E-6 m/s, both inthe early phase and in the late phase. Additionally, this value is close to the value of the latephase in tests with stirring.
The present interpretation of all these observations is that the k/Ag reaction in the presentexperiments is composed of two different processes, the chemical reaction between h and Agat the Ag surface and the I2 transport from the bulk solution through a boundary layer to theAg surface. Following this, the rate constant of the first fast reaction phase represents the firstprocess, whereas the slower rate constant in the second reaction phase reflects retarding htransport towards the Ag surface. At the beginning of the reaction, there is enough I2 in thevicinity of the Ag surface for the deposition onto the surface. This means an initial rapid I2decrease in this boundary layer. Further I2 deposition is then governed by the I2 transporttowards the Ag surface, being slower than the first process of chemical reaction even in thecase of stirring.
It is obvious that, compared to the applied model in chapter 3, a more sophisticateddescription of the reaction mechanism is needed to consistently model the measured data.
4.2 Parameter dependencies of the I7Ag reactionFrom the chemical point of view the F/Ag reaction needs some oxidizing step. This isconfirmed experimentally by the observation that the reaction took place only if noinertization was performed prior to the tests.
The analysis of any parameter dependencies was performed analogously to the 12/Ag analysisin Figures 5-13. Each of the Figures 14 to 20 contains the same data, namely the rate constantsof the 17Ag reaction in the above defined early and late phase of the tests. In each figure,different symbols are used to indicate the relevant tests for the comparison in order to detectparameter dependencies on the reaction rate. Data marked as open circles in these figures aregenerally not considered in the comparisons. It is important to note that the tests 30 and 33were performed without stirring of the suspension.
Error analyses were performed only for the late phase reaction rates in the F/Ag system. Theerrors for the early phase rate constants can be assumed to be similar to those of the k/Agsystem shown in the Figures 5-13.
Figure 14 studies the influence of inertization on the reaction rate. The pre-tests 8, 16 and 17and the main tests 19 and 27, performed with Ar or N2 inertization of the suspension prior tothe tests. These tests show no reaction or have a significant reduced reaction rate. Thisconfirms the above chemical expectation of oxidizing conditions as being necessary for thereaction. If oxygen was removed from the aqueous phase, e.g. by sump boiling, then theinertizing conditions would be more appropriate to the F/Ag system (neglecting oxidationeffects due to radiation). In this case, according to the results of the present work, the F/Agreaction should be switched off.
The following comparisons are consequently done only with tests without inertization.
Figure 15 studies the influence of temperature on the reaction rate at a constant pH 5. Nosignificant dependency on the parameter temperature is found. The activation energy for theF/Ag reaction in iodine codes can therefore be set to 0.
Figure 16 does not exclude a slight pH dependency. Further aspects on the parameter pH arediscussed separately later in this chapter.
Figure 17 shows that there is no dependency on the parameter initial F concentration.

292
The type of Ag educt (different powders, plate) and the presence or absence of boric acid doalso not influence the reaction rate as seen in Figures 18 and 19, respectively.
Figure 20 shows (as expected) that the stining enhances the reaction rate in the F/Ag systemas was also seen in the k/Ag system.
To summarize, the following parameters do not influence significantly the rate constants inthe F/Ag reaction: temperature, pH in the early phase, initial F concentration, boric acid andtype of Ag educt. Contrary to these observations, both, ineitization of the reaction suspensionand non-stirring decrease the reaction rate or even prevent the reaction.
From Figure 16 a certain pH dependency could arise for the late phase rate constant (k in thetime range 5-30 min). To study this possible effect in more detail, mean values of the rateconstants were formed using all test results excluding those with inertization and withoutstirring. Table 6 shows 4 groups of averaging: averages on all pH 3 tests, all pH 5 tests and allpH 7 tests are given. Additionally, a mean value was calculated for all tests. Upper and lowerbounds determined from the test results are also given. Obviously, for each pH the mean valueis consistent with the bounds of the tests at the other pH values. Therefore, within theaccuracy of the tests of the present work, no pH dependency is found.
The rate constants in the early phase are generally slightly higher than in the late phase. Themean value of all tests without inertization and with stining yields k(0-5min)=8.3E-6 m/s witha lower bound of 1.4E-6 m/s and an upper bound of 2.8E-5 m/s.
The rate constant in the late phase of the reaction variies largely between 3.3E-8 m/s and2.0E-5 m/s. For conservative source term modelings, the lower value is recommended. For aglobal modeling of the F/Ag reaction, the temperature-independant rate constant 2.2E-6 m/sfrom Table 6 can be used.
As for the k/Ag system, the F/Ag system reveals two different reaction phases which areinterpreted to be correlated with two different processes, a fast chemical reaction at the surfaceand a slower F transport towards the surface. It is questionable whether the accuracy of thedata in this work is good enough to draw more detailed conclusions on the reactionmechanism.
The observation of the two different reaction phases does not seem to be an effect by silverparticle agglomeration in the tests of this work since (1) no agglomeration effect was observedoptically, and (2) a test with silver plate also showed the different kinetics in the two phases.
4.3 The solubility of AglThe data shown in Figure 4 can be divided into 4 groups. The first group represents the bulkof data measured in the vicinity of room temperature. The second group is given by the datashown as crosses and connected by a dashed line, originating from one single author only. Athird group consists of data measured at about 300°C. The fourth group is composed only ofthe single data point measured in the present work.
Obviously, the first group data (measurements by various authors) systematically differ fromthe second group data (measured by only one author). In addition, the second group datadeviates from the combination of the first, third and fourth group data. Since no explanationfor the deviations was found, the second group data were excluded from furtherconsiderations.
Arrhenius type fits were performed to selected data groups according to
[F] = A • exp( B/T) (7)

293
with the free parameters A and B to be determined from the data. T is the temperature inKelvin.
The straight line in Figure 4 is a fit only to the group 1 data with the parameters A=32 mol/1and B=-65OO K. The point-dotted line is a fit to the sum of data from the groups 1 and 3 withthe parameters A=2.4 mol/1 and B=-5800 K. The dotted line was already a fit given in theliterature to low temperature solubilities with the parameters A=5.6 mol/1 and B=-590O K.
The measured data point of the present work at T=160°C is consistent with all three fits.There is no preference of one of the several algebraic representations to the data. However,taking into account the present measurement and most of the literature data, the uncertainty ofthe solubility at T=160°C and also at other elevated temperatures relevant to severe accidentsis now lower than a factor of about 3. Thus, the amount of iodine, that can be bound as low-soluble Agl in severe accidents, can be calculated with reasonable accuracy at each severeaccident relevant temperature.
The Agl solubilities presented in the present work were determined in experiments withoutirradiation. Severe accident related dose rates could destroy the low-soluble Agl moleculesand liberate soluble iodine. Following this, the significance of Agl as an iodine sink would bereduced. This aspect will be investigated experimentally in the 4th framework programme ofthe European Union.

294
5 SUMMARY
The kinetics of the reaction of I2 and of F with Ag in the aqueous phase was investigated in alarge parameter study on a laboratory scale. In both cases, low-soluble Agl is formed on theAg particles.
The data evaluation was performed using first order kinetics with respect to the iodine (I2or F) concentration. However, it was necessary to define an early reaction phase (0-5 min)which was fast, and a late reaction phase (5-30 min) which was slow. Both reaction phaseshad to be analyzed separately. Thus, from each test, two rate constants were derived.
In the t/Ag reaction the parameters inertization, temperature, initial I2 concentration, type andpretreatment of the silver educt do not influence significantly the reaction rate. However, non-stirring significantly reduces the reaction rate. A pH 3 was kept constant in all I2/Ag tests inorder to avoid complicating hydrolysis effects.
In the F/Ag reaction the parameters temperature, pH in the early phase, initial Fconcentration, boric acid and type of Ag educt do not influence significantly the rateconstants. However both, non-stirring and inertization of the reaction suspension decrease thereaction rate or even prevent the reaction.
The early phase rate constant of the 12/Ag reaction is 2E-5 m/s in test with stirring. This valuereduces to 6E-6 m/s in the late phase. Tests without stirring yield about 4E-6 m/s in bothreaction phases, a value similar to the late phase result with stirring. Conservative modelingsof severe accident source terms should include the late phase rate constant being morerepresentative to containment sumps which are not stirred.
The early phase rate constant of the I7Ag reaction is 8E-6 m/s in tests with stirring. This valuedecreases to 2E-6 m/s in the late phase. The lower bound is 3E-8 m/s which can be used inconservative source term calculations and which then would also take into account that thecontainment sump is not well stirred just as in the laboratory tests. Under sump boilingconditions and neglecting oxidation effects due to radiation, the F/Ag reaction should beswitched off according to the results of the present work.
The reaction of I2 with Ag is somewhat faster than that of F with Ag. The reaction mechanismis not fully understood and a model to describe the kinetics consistently over the whole testduration is still missing.
The solubility of Agl was measured at T=160°C and amounts to 1.3E-5 mol/1. Together withmany literature data, the solubility of Agl, which increases with temperature according to anArrhenius law, can now be calculated over the whole temperature range relevant in severeaccident containment situations with reasonable accuracy.
The tests of the present work were performed without irradiation. Possible radiationinfluences on the iodine/silver reaction kinetics, as well as on the radiolytic stability of Agl,will be investigated in the 4th Framework Programme of the European Union.
With the above given rate constants and a simple first order kinetics with respect to iodineconcentration it is now possible to quantitatively assess the effect of Agl as an iodine sink as afunction of time in severe accidents in LWR's using Ag/In/Cd control rods.

295
6 REFERENCES
[Bedel 1938]
[Galinker 1961]
[Gavrish 1955]
[Gmelin 1972]
[Goodwin 1894]
[Hass 1933]
[Jurio 1971]
[Klein 1956]
[Lieser 1957]
[Lieser 1960]
[Mironov 1963]
[Nedoma 1971]
[Owen 1938]
[Soulier 1966]
[Thiel 1900]
C. BedelCompt. Rend. 207 (1938) 632-634IS . Galinker, M.L. GavrishTr. Khar'kovsk Sel'skokhoz. Inst. 35 (1961) 43-58M.L. Gavrish, I.S. GalinkerDokl. Akad. Nauk SSSR102 (1955) 89-91Gmelins Handbuch der anorganischen Chemie8. Auflage, Silber, Band B2Verlag Chemie, Weinheim, 1972H.M. GoodwinZ. Physik. Chem. 13 (1894] 577/656,646K. Hass, K. JellinekZ. Physik. Chem. A162 (1933) 153/73,164R.L. Jurio, B. Ungerer, R.J. ManueleJ. Chem. Educ. 48 (1971) 122-124E. KleinZ. Elektrochem. 60 (1956) 1003-1007 undWiss. Phot. Intern. Konf., Köln 1956, S. 225-229K.H. LieserZ. Anorg. Allgem. Chemie 292 (1957) 97-113K.H. LieserZ. Anorg. Allgem. Chemie 304 (1960) 296 - 306V.E. MironovRadiokhimiya5 (1963) 118-125J. NedomaChem. Listy 65 (1971) 71-76B.B. Owen and S.R. BrinkleyJ. Am. Chem. Soc. 60 (1938) 2233-2239J.P. Soulier, J. GauthierCompt. Rend. C 263 (1966) 1485-1487A. ThielZ. Anorg. Allgem. Chemie 24 (1900) 1/64,57
7 ACKNOWLEDGEMENTS
The investigation of the silver/iodine chemistry as reported in this paper was funded by theBundesministerium für Forschung und Technologic

Table 1. Test matrix for the main tests in the U/Ag system.
"Test 8" was performed as a series of three separate tests (8a, 8b, 8c) but with identical boundary conditions. Only one sampling wasdone after different test durations.
Test
1
2
3
4
5
6
7
8a
8b
8c
9
10
11
12
31
32
Silver educt
Specific surface
Manufacturer
powder0.20 m2/gAldrich
"
coarse shreddingsof control rod
0.186 m2
"
powderO.13m2/gAldrich
powder0.20 mVgAldrich
»
"
"
•<
••
"
T
25°C
X
X
X
X
X
X
X
X
X
emperatu
80°C
re
160°C
t
1!ijji
i
x !1 x i1 ;! x !
90°C
X
X
100°C!
3
X
X
X
X
X
pH5
x !X
X
X
X
X
X
7
11
•
i
X < ''A • i
X
X
X
1
[
Atmrx
Air
X
X
X
X
X
X
X
sphere
Ar/Nj
X
X ;
X
X
X
X
1 x:ii
Iritis
10*
\gfl]
X
X
X
X
dlU10^
lft/1]
X
! x
X
X
X
X
X
xx |x 1X
x
Remarks
powder, fleshlyreduced Ag surface
without stirring
without stirring
without stirring
autoclave
autoclave
without stirring
without stirring

Table 2. Test matrix for the pre-tests in the I7Ag system.
Test
Pre-I
Pre-2
Pre-3
Pre-4
Pre-5
Pre-6
Pre-7
Pre-8
Pre-9
Pre-10
Pre-11
Pre-12
Pre-13
Pre-14
Pie-15
Pre-16
Pre-17
Ag educt
Specific surface
Manufacturer
powder0.20 m2/gAldrich
"
"
"
M
(1
powder0.34 m2/g
John.-Matth.
M
T
25°C
X
X
X
X
X
X
X
X
X
emperahi
80°C
X
X
X
X
X
X
X
i
x !
re
160°C
I
3
X
X
X
X
X
X
X
PH5
X
X
X
y !
t!•
X
7
X
X
X
X
X
II !
Atmoe
Air
X
X
X
X
X
X
X
X
X
X
X
X
X
sphere
Argon
N2
N2
N2
N2
Initial III
102 I 104
lefl] ! mX
X
X
x !
x i
x iX
X
X
X
X
x !
! xY
X \\
X
Remarks
H3BO3(2000 ppmB)
deionized water
Ag cone, reducedby a factor 7.25
(29 mg in 210 ml)
NaOH
N2 sparging
H3BO3(2000 ppmB)
NaOH
NaOH+HJBOJ
(2000 ppmB)
NaOH
NaOHN2 sparging
N2 sparging
ISJ
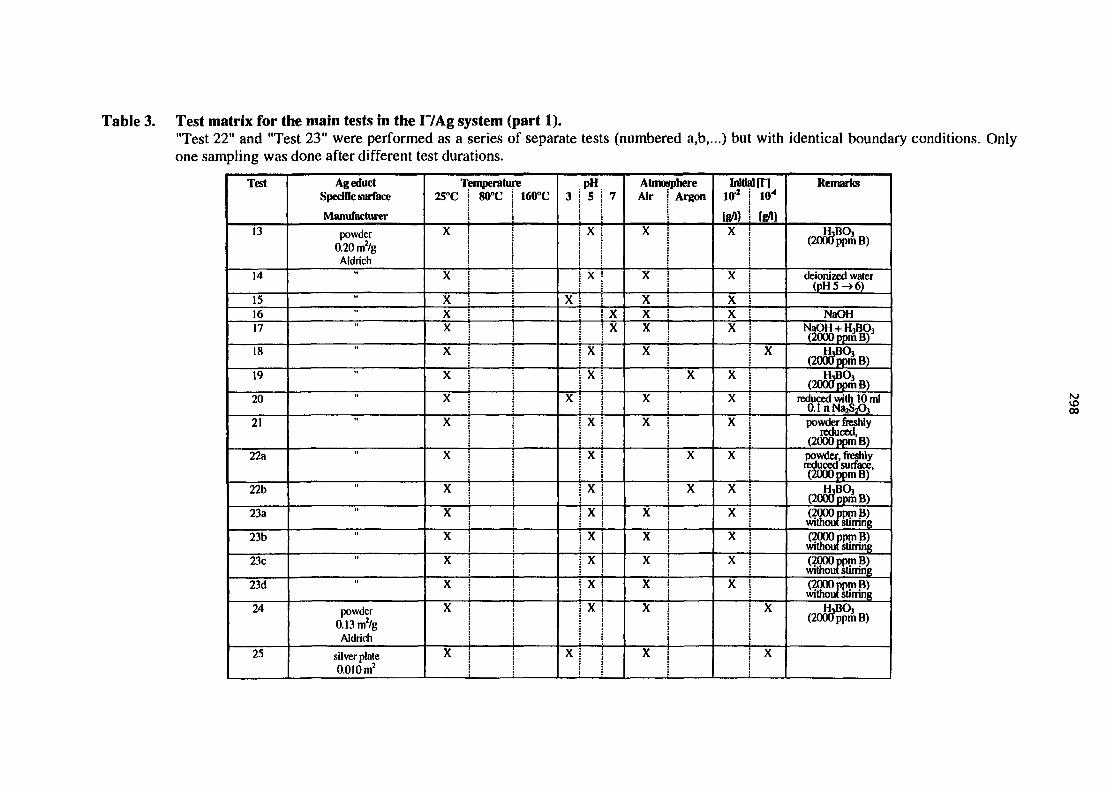
Table 3. Test matrix for the main tests in the I7Ag system (part 1)."Test 22" and "Test 23" were performed as a series of separate tests (numbered a,b,.one sampling was done after different test durations.
.) but with identical boundary conditions. Only
Test
13
14
151617
18
19
20
21
22a
22b
23a
23b
23c
23d
24
25
Ag eductSpecific surface
Manufacturer
powder0.20 m2/gAldrich
"
"
powder0.13 ttvVgAldrich
silver plate0.010 m2
T25°C
}£
X
XXX
X
X
X
X
X
X
X
X
X
X
X
X
emperatui80°C
re160°C 3
X
X
X
pH5
X
X
X
X
V"
x
X
7
XX
xX
X
X !
x |i
AtmosphereAir j Argon
|X
X
XX IX
X
X
X i
X
x
i X:
X
x |X
X !
X
X
Wtb1(T2
[gfl]X
X
XXX
X
X
X
X
X
X
X
X
X
din
[g/>]
X
X
X
Remarks
H,BOj(200OppmB)
deionized water(pH5->6)
NaOHNaOH + HjBQa(2000ppmBf
H3BO3(200OpprnB)
H3BO3(200OpptnB)
reduced with 10 mlO. lnNaAO,powder freshly
reduced,(2000 ppmB)
powder, freshlyreduced surface,(2000 ppmB)
H3BO3(2000ppmB)(2000 ppmB)without stirring(2000 ppmB)without stirring(2000 ppmB)without stirring(2000 ppmB)without stirring
HjBO,(2000ppmB)
NJ
00

Table 3 (cont.). Test matrix for the main tests in the I /Ag system (part 2).
Test
26
27
28
29
3033
Ag eductSpecific surface
Manufacturer
powder0.20 m2/gAldrich
"II
"
T25°C
emperature80°C | 160°C
I
{
X
X
|1 100°Ci 90°C
X
X
PH
t;
XX
X
X
X
X
AtmosphereAir I Argon
j•
X j
i!i x
steam
steam +air
- ! -
Initii10 2
[grt]X
X
X
X
X
din104
w
X
Remarks
H3BO3(2000 ppmB)
H3BO3(2000ppinB)
autoclaveH3BO3(2000ppinB)
autoclaveH3BO3
(2000ppmB)without stirringwithout stirring

300
Table 4. Literature data on Agl solubilities.
T(°C)
18
18
20
25
25
5
15
25
35
45
300
309
320
349
365
20
20
25
25
25
100
20
40
60
80
[ I ](mom)
5.74E-9
5.72E-9
6.7E-9
9.7E-9
1.08E-8
1.78E-9
4.17E-9
9.08E-9
1.859E-8
3.599E-8
8.1E-5
1.1E-4
1.6E-4
2.3E-4
2.87E-4
9.02E-9
1.0E-8
1.46E-8
9.66E-9
1.66E-8
8.63E-7
1.45E-7
2.56E-7
4.00E-7
5.83E-7
lg[T]
-8.241
-8.243
-8.174
-8.013
-7.967
-8.750
-8.380
-8.042
-7.731
-7.444
-r.092
-3.959
-3.796
-3.638
-3.542
-8.045
-8.000
-7.836
-8.015
-7.781
-6.064
-6.839
-6.592
-6.398
-6.234
Reference in [Gmelin 1972]
[Lieser 1957]
[Mironov 1963]
[Lieser 1960]
[Goodwin 1894]
[Thiel 1900]
[Owen 1938]
I I
I I
n
M
[Gavrish 1955] and [Galinka 1961]
t i
t i
••
••
[Jurio 1971]
[Nedoma 1971]
[Soulier 1966]
[Hass 1933]
[Klein 1956]
if
[Bedel 1938]
II
i t
i t

301
Table 5. Rate constants in the reaction between I2 and Ag.
Reaction phase
Early phase
0- 5min
Late phase
5 - 30 min
Early phase
0-5min
Late phase
5 - 30 min
Stirring
yes
yes
no
no
Mean value for k
(m/s)1.8E-5
6.1E-6
3.6E-6
4.3E-6
Range of k values
(m/s)1.7E-6-4.4E-5
2.6E-7-1.6E-5
1.7E-6-6.8E-6
5.6E-7 - 8.4E-6
Table 6. Rate constants in the reaction between r and Ag.
pH
3
5
7
3 + 5+7
Mean value for k;late phase (5-30min)
(m/s)3.9E-6
1.9E-6
1.2E-6
2.2E-6
Range of k values
(m/s)
l.OE-7 - 1.2E-5
6.9E-8-2.0E-5
3.3E-8-4.9E-6
3.3E-8 - 2.0E-5

302
Figure 1. Test apparatus to measure the kinetics in the systems VAg and I7Agat T < 100°C.
4j /
2
11
1
2
3
4
5
6
7
8
9
10
11
reaction vessel
magnetic stirrer
cooler
iodine safety filter
temperature control
sampling line
dosing unit
second vessel (used at end of test)
NaOH
pump
hot plate

303
Figure 2. Decrease of h in the aqueous phase for three tests.
The main parameters for the comparison are:
Test 1: pH 3, T=25°C, [I2]o=lE-2 g/1, no inertization
Test 2: pH 3, T=25°C, p2]o=lE-2 g/1, inertization with argon
Test 3: pH 3, T=25°C, [I2]o=lE-4 g/1, no inertization
All tests with 0.2 m2/g specific Ag surface
100 F
c
"oC
o

304
Figure 3. Decrease of V in the aqueous phase for two tests.
The main parameters for the comparison are:
Test 13: pH 5, T=25°C, [I2]o=lE-2 g/1, no inertization
Test 18: pH 5, T=25°C, [I2]o=lE-4 g/1, no inertization
All tests with 0.2 m2/g specific Ag surface
100
0

305
Figure 4. Agl solubilities as logarithm of the I~ concentration in the aqueous phaseabove stoichiometric Agl.
Data were taken from [Gmelin 1972] except for the filled square which wasmeasured in the present work. Due to the many measurements at low temperatures,data symbols are overlapping in this regime in Figure 4. However, the wholeliterature data set is contained in Table 4.
The lines represent fits to different selected data groups.
Group 1: Data between 5°C and 45°C
Group 2: Data by [Bedel 1938], connect by a dashed line
Group 3: Data above 300°C
Group 4: measured in the present work
300°C 5°C
U
1.00E-02
Group 3 v • X Group 4
i,eeE-090,0015 0,002 0.O0Z5 0,003 0,0035 0,004
1/T (1/K)
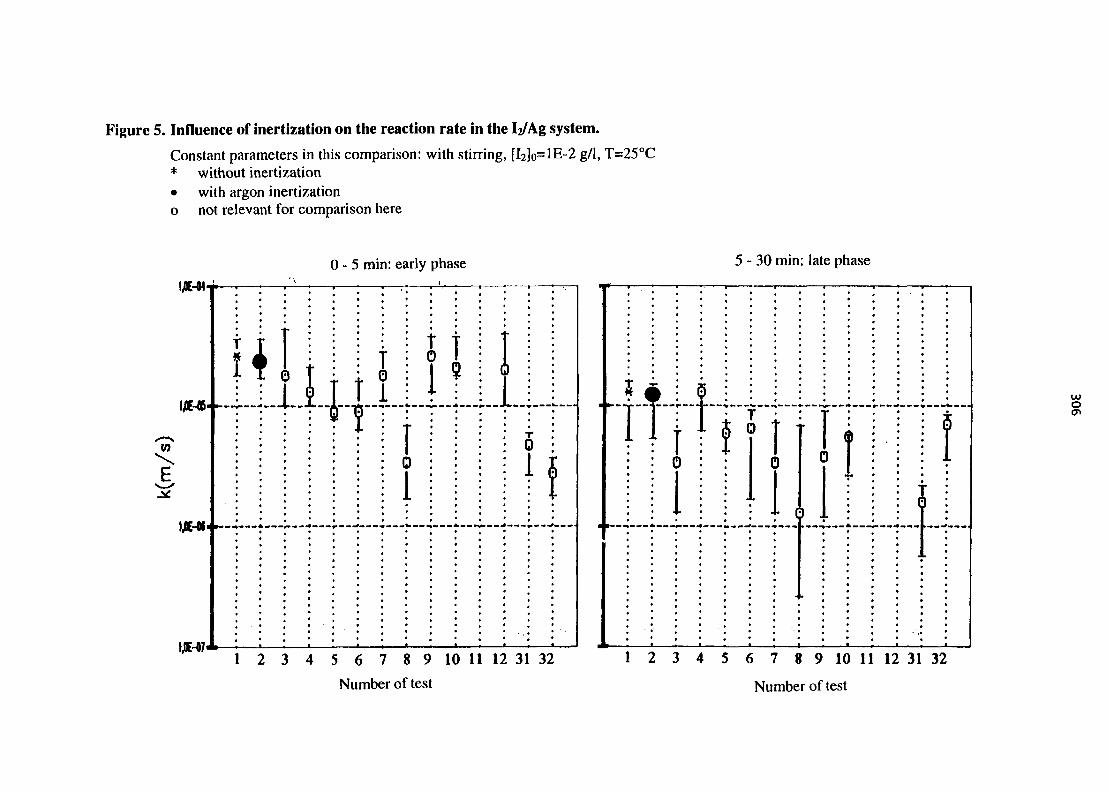
Figure 5. Influence of inertization on the reaction rate in the VAg system.
Constant parameters in this comparison: with stirring, [I2]o=lE-2 g/1, T=25°C* without inertization• with argon inertizationo not relevant for comparison here
0 - 5 min: early phase 5-30 min: late phase
4 T i i 4 = I «I H T i ; ! •
A—- J - — A . Mr • — - » • . ••
S
u . - — •* * - * f — - J - — — % M *. — w
H t l f so
1JQE-071 2 3 4 5 6 7 8 9 10 11 12 31 32
Number of test
1 2 3 4 5 6 7 8 9 10 11 12 31 32
Number of test

Figure 6. Influence of temperature on the reaction rate in the WAg system.
Constant parameters in this comparison: with stirring, [I2]O=1E-2 g/1* T=25°C• T=80°C• T=160°Co not relevant for comparison here
0 - 5 min: early phase 5 - 30 min: late phase
1JCE-M
MUlitUJU t ? f M i U
M M ! i TA : : : * 0 1 i
tJDE-07-
oj
1 2 3 4 5 6 7 8 9 10 11 12 31 32
Number of test
1 2 3 4 5 6 7 8 9 10 11 12 31 32
Number of test

Figure 7. Influence of initial h concentration on the reaction rate in the tyAg system at T=25°C.* [I2]o=lE-2 g/1• [I2]0=lE-4 g/1o not relevant for comparison here
0 - 5 min: early phase
1J0E-4S. — - — - -
1J0CHM- ~
1/E-07'1 2 3 4 5 6 7 8 9 10 11 12 31 32
Number of test
5-30 min: late phase
f f ] t ] T"f TT 0
I
1 2 3 4 5 6 7 8 9 10 11 12 31 32
Number of test

Figure 8. Influence of initial h concentration on the reaction rate in the tyAg system at T=80°C.* [I2]o=lE-2g/l• [l2]0=lE-4g/lo not relevant for comparison here
0-5 min: early phase 5-30 min: late phase
Hi i !H 6 S : S : : : : : :
rrrrrnTti
1 2 3 4 5 6 7 8 9 10 11 12 31 32
Number of test
1 2 3 4 5 6 7 8 9 10 11 12 31 32
Number of test
UIo
3
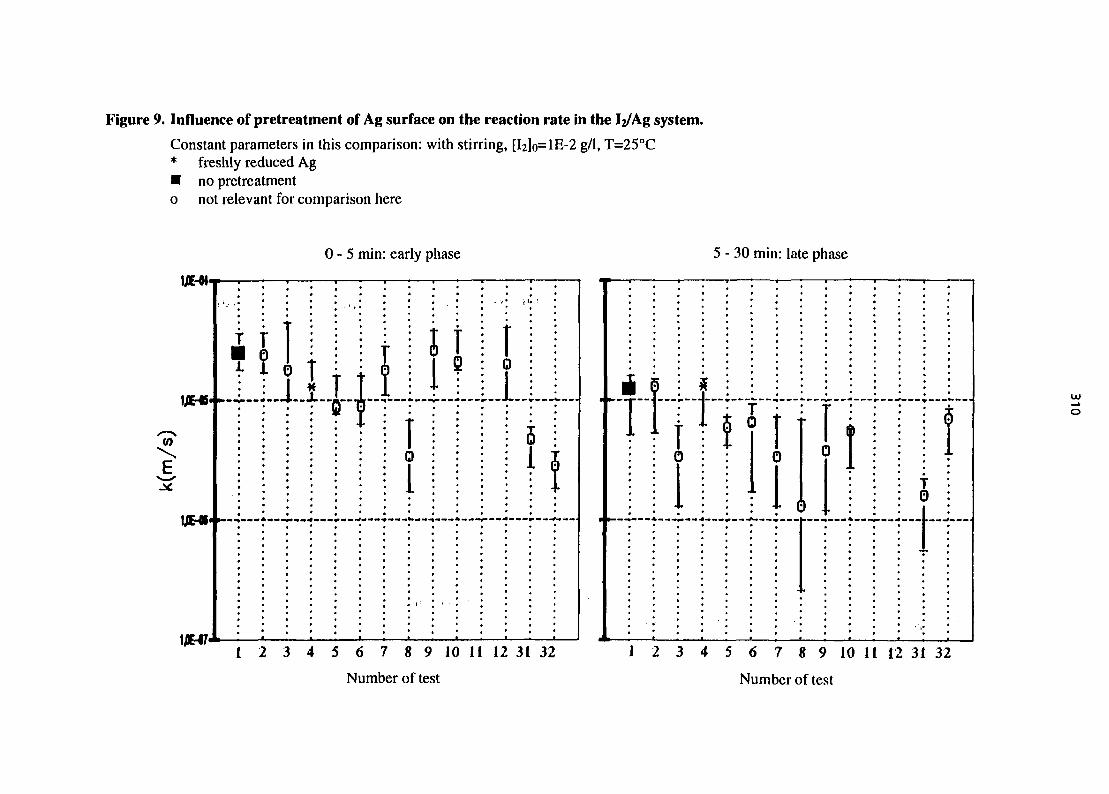
Figure 9. Influence of pretreatment of Ag surface on the reaction rate in the VAg system.
Constant parameters in this comparison: with stirring, [I2]o=lE-2 g/1, T=25°C* freshly reduced Ag• no pretreatmento not relevant for comparison here
0 - 5 min: early phase 5-30 min: late phase
MM*
S M M | i tt I * • 1 • iniliriiM H i t T
o
t I s t T I0 o
t
1 2 3 4 5 6 7 8 9 10 11 12 31 32
Number of test
1 2 3 4 5 6 7 8 9 10 11 12 31 32
Number of test

Figure 10. Influence of type of Ag educt on the reaction rate in the I^Ag system.
Constant parameters in this comparison: with stirring, [I2]O=1E-2 g/1, T=25°C* Ag powder with 0.2 m2/g or 0.13 m2/g specific surface• course shreddings of Ag/In/Cd control rod materialo not relevant for comparison here
w
If
0 - 5 mi n: early phase
1J0E-O7
H l l t T l i HM j h i l i iM i ! M i 1 i
:t '
0 .
If
1 2 3 4 5 6 7 8 9 10 11 12 31 32
Number of test
It
5-30 min: late phase
MLI11S
t
1 2 3 4 5 6 7 8 9 10 11 12 31 32
Number of test

Figure 11. Influence of stirring on the reaction rate in the VAg system at T=25°C.* with stirring• without stirringo not relevant for comparison here
to
0 - 5 min: early phase
I i T T irT
i Ii i i i i l
0
5 •
H
5-30 min: late phase
rtTTTTTTTTTTitM i i l l M r i
to
1 2 3 4 5 6 7 8 9 10 11 12 31 32
Number of test
2 3 4 5 6 7 8 9 10 11 12 31 32
Number of test

Figure 12. Influence of stirring on the reaction rate in the 12/Ag system at T=80°C.* with stirring• without stirringo not relevant for comparison here
0 - 5 min: early phase 5-30 min: late phase
1J0E-M
0 Q : : : T : ? •
? l i t * ; ? 0 $ : $ : i : j : :
tTtTFTTTi
1JW71 2 3 4 5 6 7 8 9 10 11 12 31 32
Number of test
1 2 3 4 5 6 7 8 9 10 11 12 31 32
Number of test
U I

Figure 13. Influence of temperature on the reaction rate in the h/Ag system in tests without stirring.* T=25°C• T=90°C• T=100°Co not relevant for comparison here
0 - 5 min: early phase
tjOE-671 2 3 4 5 6 7 8 9 10 11 12 31 32
Number of test
5-30 min: late phase
I ' I
i i
1 i H s t r I0 0
t
^v
2 3 4 5 6 7 8 9 10 U 12 31 32
Number of test

315
Figure 14. Influence of inertization on the reaction rate in the F/Ag system.• inertization with N2 or Ar• no inertization (presence of air)
l.OE-04
l.OE-05 • -|
1.0E-06
1.0E-08
0 - 5 min: early phase
: • : ; : • •
i.1""."^11
1.0E-07 • -i--^--^--;
I 2 3 i 5 6 7 g 9 10 11 12 13 14 15 16 17 13 14 15 16 17 18 19 21 23a 23b 2* 25 26 27 29 33
1.0E-04
l.OE-05 • -
1.0E-06 - .-»-•—;
1.0E-08
5-30 min: late phase
U
1.0E-07 • —^—;--i—;—^ +~ j -
I M M i f M M :LiiillliUil
N 111!
< i i t! 2 3 4 6 7 8 9 10 11 12 14 17 13 14 15 16 17 18 19 2124 25 26 27 29 33
Pre-tests Main tests

316
Figure 15. Influence of temperature on the reaction rate in the F/Ag system.A T=25°C• T=80°C• T=160°Cx not relevant for comparison here (performed under inertizing conditions)
l.OE-04
1.0E-05 • -i-i-T-S'-T-
l.OE-08 J
0 - 5 min: early phase
?i ? ? i j L i j [ i j : 1 J L; •• °
D i •*•• \ iQ :
l.OE-06 ^~^-r-T--:-:--f-->-:--T--:--:--7-->->-T--:~:--i-:--!--i--:--i-^-:--
X1.0E-07 • -i-^~-+-^-r-i-:-^i-:-:-;-;-
i i t i i i i* >* " s v *•I ; .( i 5 A 7 H v 10 II i: H 14 15 16 i7 13 14 15 16 17 18 19 21 23a 23b 24 25 26 27 29 33
l.OE-04
1.0E-05
l.OE-06 • •
1.0E-07
1.0E-0B
5-30 min: late phase
EiT T : : : : : : : | +A : : • : : : _ 0 :
i !T ! ifTTTs
6 : 0
1 2 3 4 6 7 8 9 10 II 12 14 17 13 14 15 16 17 18 19 21 24 25 26 27 29 33
Pre-tests Main tests

317
Figure 16. Influence of pH on the reaction rate in the r/Ag system.A p H 3• pH5• pH7x, o not relevant for comparison here
1.0E-04
l.OE-05
1.0E-07 - -
l.OE-08
0 - 5 min: early phase
* • "iTTTfTii
l.OE-06 • -4--:--:—:--:--:-
I 2 3 4 5 6 7 8 9 10 11 12 13 14 15 16 17 I? 14 15 16 17 18 19 21 23a 23b 24 25 2627 29 33
1.0E-04
l.OE-05 > -
l.OE-08
5-30 min: late phase
l.OE-06 • .~-r~:-4-- -f- •-+- -:-i.;-«-«-r
1.0E-07 • .-;--;---; r—i-^-i-
I 2 3 4 6 7 8 9 10 II 12 14 17 13 14 15 16 17 18 19 21 24 25 26 27 29 33
Pre-tests Main tests

318
Figure 17. Influence of initial F concentration on the reaction rate in the F/Ag system.• [T]o=lE-2 g/1• [T]o=lE-4g/lx, o not relevant for comparison here
l.OE-04
l.OE-05
1.0E-06 • -
1.0E-07 • -•:-
1.0E-08
1.0E-04
0 - 5 min: early phase
A \A,
i i ; ; I ; ! ! * ; :r
: ) J 5 t - m i l l l l i : 13 14 I5 16 17 I3 14 15 16 17 IS 19 21 23a 23b 24 25 26 27 29 33
l . O E - 0 5 • —:-
1.0E-06 • -
1.0E-07 -
1.0E-08
5-30 min: late phase
Ttf-
Til
rr--i—i-j-4-4-4--
MfJifl i i i f inMifj i i i•r-ar"f—'—~—--A-
I
I 2 3 4 6 7 8 9 10 11 12 14 17 13 14 15 16 17 18 19 2124 25 26 27 29 33
Pre-tests Main tests

319
Figure 18. Influence of type of Ag educt on the reaction rate in the r/Ag system.A powder with 0.20 m /g specific surface• powder with 0.13 m2/g specific surface• silver plateo powder with 0.34 m2/g specific surfacex not relevant for comparison here
1.0E-04
l.OE-05 • -jy^i
1.0E-06 • -r
1.0E-07 • -
1.0E-08
0 - 5 min: early phase
: X •
: 1 a 5 h 7 X 9 III II 12 13 14 U 16 17 13 U 15 lfi 17 18 1 9 2 1 23a 23b 24 15 2 6 2 7 29 33
1.0E-04 T
l.OE-05 < --:
l.OE-06 • .«--•—:
l.OE-07 • - - -
1.0E-08
5-30 min: late phase
x
ifijiiitTiiii ••"i
i
! 2 3 4 6 7 8 9 10 11 12 14 17 13 14 15 16 17 18 19 21 24 25 26 27 29 33
Pre-tests Main tests

320
Figure 19. Influence of boric acid on the reaction rate in the I7Ag system.A with boric acid• without boric acidx not relevant for comparison here
1.0E-04
l.OE-05 • -*-,
-JC
1.0E-08
0 - 5 min: early phase
# : : • :
l.OE-06 • -~.>-r-r~>->-T~:-v-*-:-:-1
1.0E-07 > -•;--:--;-:-,•--
U .1.: 3 •: 5 ft 7 K y 10 II 12 13 14 15 16 17 13 14 L5 16 17 18 !9 21 23a 23b 2-4 25 26 27 29 33
1.0E-04:
l.OE-05 • ~
l.OE-06 • -
1.0E-07 • >----
1.0E-08
5-30 min: late phase
ifjitHitHtHrtttti
ii*mmPH#tit
i T
I
i. I UI 2 3 4 6 7 8 9 !0 11 12 14 17 13 14 15 16 17 18 19 21 24 25 26 27 29 33
Pre-tests Main tests

321
Figure 20. Influence of stirring on the reaction rate in the F/Ag system.• with stirring• without stirringx not relevant for comparison here
l.OE-04
l.OE-05 • -*-*-:-f-;---t-:~j
1.0E-06 • -i
1.0E-07 • -
1.0E-08
0 - 5 min: early phase
m*W1 i 1 L th 7 s 9 10 II 12 13 14 15 Ih 17 i 3 14 15 16 17 18 19 21 23a 23b 24 25 26 27 29 33
Pre-tests Main tests