the raman laser spectrometer for the exomars rover mission
TRANSCRIPT

ExoMars Rover Mission
The Raman Laser Spectrometer for the ExoMarsRover Mission to Mars
Fernando Rull,1 Sylvestre Maurice,2 Ian Hutchinson,3 Andoni Moral,4 Carlos Perez,4 Carlos Diaz,4 Maria Colombo,4
Tomas Belenguer,4 Guillermo Lopez-Reyes,1 Antonio Sansano,1 Olivier Forni,2 Yann Parot,2 Nicolas Striebig,2
Simon Woodward,5 Chris Howe,5 Nicolau Tarcea,6 Pablo Rodriguez,4 Laura Seoane,4 Amaia Santiago,4
Jose A. Rodriguez-Prieto,4 Jesus Medina,1 Paloma Gallego,4 Rosario Canchal,4 Pilar Santamarıa,4
Gonzalo Ramos,4 and Jorge L. Vago7; on behalf of the RLS Team
Abstract
The Raman Laser Spectrometer (RLS) on board the ESA/Roscosmos ExoMars 2020 mission will provideprecise identification of the mineral phases and the possibility to detect organics on the Red Planet. The RLSwill work on the powdered samples prepared inside the Pasteur analytical suite and collected on the surface andsubsurface by a drill system. Raman spectroscopy is a well-known analytical technique based on the inelasticscattering by matter of incident monochromatic light (the Raman effect) that has many applications in labo-ratory and industry, yet to be used in space applications. Raman spectrometers will be included in two Marsrovers scheduled to be launched in 2020. The Raman instrument for ExoMars 2020 consists of three main units:(1) a transmission spectrograph coupled to a CCD detector; (2) an electronics box, including the excitation laserthat controls the instrument functions; and (3) an optical head with an autofocus mechanism illuminating andcollecting the scattered light from the spot under investigation. The optical head is connected to the excitationlaser and the spectrometer by optical fibers. The instrument also has two targets positioned inside the roveranalytical laboratory for onboard Raman spectral calibration. The aim of this article was to present a detaileddescription of the RLS instrument, including its operation on Mars. To verify RLS operation before launch andto prepare science scenarios for the mission, a simulator of the sample analysis chain has been developed by theteam. The results obtained are also discussed. Finally, the potential of the Raman instrument for use in fieldconditions is addressed. By using a ruggedized prototype, also developed by our team, a wide range ofterrestrial analog sites across the world have been studied. These investigations allowed preparing a largecollection of real, in situ spectra of samples from different geological processes and periods of Earth evolution.On this basis, we are working to develop models for interpreting analog processes on Mars during the mission.Key Words: Raman spectroscopy—ExoMars mission—Instruments and techniques—Planetary sciences—Marsmineralogy and geochemistry—Search for life on Mars. Astrobiology 17, 627–654.
1. Introduction
The Raman Laser Spectrometer (RLS) is part of thePasteur instrument suite (together with MicrOmega and
MOMA) accommodated in the analytical laboratory drawer(ALD) on board the ExoMars rover, scheduled to land onMars on March 19, 2021.
Raman spectroscopy is based on the analysis of spectralfingerprints due to the inelastic scattering of light wheninteracting with matter.
When monochromatic radiation of wavenumber n0 im-pinges on a transparent material—such as a liquid, a gas, ora crystal—most of the radiation is transmitted in the samedirection of incidence, but a small portion is scattered in all
1Unidad Asociada UVa-CSIC al Centro de Astobiologıa, University of Valladolid, Valladolid, Spain.2IRAP, University Paul Sabatier—CNRS—Obs. Midi-Pyrenees, Toulouse, France.3Department of Physics and Astronomy, Space Research Centre, University of Leicester, Leicester, United Kingdom.4Instituto Nacional de Tecnica Aeroespacial (INTA), Madrid, Spain.5Rutherford Appleton Laboratory Space, Didcot, United Kingdom.6Institute of Physical Chemistry, Friedrich-Schiller University, Jena, Germany.7ESA-ESTEC, Noordwijk, the Netherlands.
ASTROBIOLOGYVolume 17, Numbers 6 and 7, 2017ª Mary Ann Liebert, Inc.DOI: 10.1089/ast.2016.1567
627
Dow
nloa
ded
by 1
57.8
8.13
9.13
3 fr
om w
ww
.lieb
ertp
ub.c
om a
t 03/
25/1
9. F
or p
erso
nal u
se o
nly.

directions. If the spectral distribution of the scattered radi-ation is analyzed, the highest intensity is found at the samewavenumber n0 (of the incident light), but a tiny spectralcomponent can be observed at wavenumbers n0 – nm. Thisnm shift is a result of the incident light’s interaction with theatomic vibration modes characteristic of the illuminatedmaterial.
The radiation scattered with the same incident wave-number (energy or wavelength) is called the Rayleigh scat-tering. The radiation components scattered with the pair ofwavenumbers n0–nm and n0+nm receive the name of Ramaneffect—after the Indian physicist Chandrasekhara VenkataRaman, and his collaborator K. S. Krishnan observed it for thefirst time in Calcutta at the beginning of 1928 (Raman andKrishnan, 1928). The Raman spectrum consists of a spectraldistribution of wavenumbers at both sides of the incidentwavenumber light (Fig. 1). The bands at wavenumbers n0–nm
are referred as the Stokes Raman bands, whereas the bands atwavenumbers n0+nm are called the anti-Stokes Raman bands(Long, 1976, 2002).
The discovery of the Raman effect is an interesting his-torical subject because the same phenomenon was observedalmost simultaneously by Leonid Mandelstam and GrigoryLandsgberg in Russia (Landsberg and Mandelstam, 1928)
and by Jean Cabannes, Aime Cotton, and Yves Rocard inFrance (Rocard, 1928). Old references to this effect inthe Russian and French literature contain the names ofthe correspondent codiscoverers. Only, after the 60s did theinelastic scattering of light become widely known as theRaman effect in scientific literature.
The observed Raman spectrum of a molecule representsits vibrational modes, that is, the collective motions of allthe atoms vibrating with the same frequency, synchroni-cally, with respect to their equilibrium position and withdifferent amplitudes. The description of the vibrations ismade in terms of the normal modes of vibration and each ofthese modes of vibration is represented by a normal coordinate.For a nonlinear molecule or atomic system of N atoms, thenumber of normal modes/coordinates (and therefore possiblevibrations) is 3N–6 (for a detailed study of the molecular vi-brations, please refer to Wilson et al., 1955; Ferraro and Zio-mek, 1969; Poulet and Mathieu, 1970; Rull, 2012).
Raman scattering is a very weak effect. Its intensity iswith a function of the electronic polarization induced by theexciting radiation in the sample’s molecules or atoms linkedby chemical bonds. The physical property involved in theexpression of the Raman process is the first derivative ofthe electronic polarizability. The Raman effect intensity can
FIG. 1. The RLS evolution line with the main steps during the development process. It is interesting to note the period inwhich several options for the combined Raman-LIBS were analyzed. RLS, Raman Laser Spectrometer.
628 RULL ET AL.
Dow
nloa
ded
by 1
57.8
8.13
9.13
3 fr
om w
ww
.lieb
ertp
ub.c
om a
t 03/
25/1
9. F
or p
erso
nal u
se o
nly.

be interpreted in terms of the general radiation–matter in-teraction framework. Starting with the first prediction ofinelastic scattering of light made by Adolf Smekal in 1923(Smekal, 1923), several models have been developed toestimate the Raman intensity of molecules, gases, liquids,and crystals using classical and quantum mechanics de-scription. A vast literature is available covering its de-scription, interpretation, and applications (Szymanski, 1967;Long, 1977, 2002; Slater, 2001; Rull, 2012).
Raman scattering intensity follows the same fourth powerlaw as Rayleigh scattering: the intensity of the Stokes andanti-Stokes Raman bands are proportional to (n0 – nm)–4.This fact has consequences for the design of the excitationradiation source and will be discussed in detail later on.
The Raman technique remained a curiosity in physicslaboratories for many years until the discovery of the laser—the ideal excitation source. A great expansion of Ramanapplications ensued as a result of its coupling with the mi-croscope (to give micro-Raman) (Delhaye and Damelincourt,1975; Damelincourt, 1979; Rosasco, 1980; Delhaye et al.,1996), and also thanks to the use of optical fibers and, morerecently, to the technical advances derived from the minia-turization of optics and detectors (Pelletier, 1999; McCreery,2000; Lewis and Edwards, 2001; Dubessy et al., 2012). Atpresent, the number of applications of Raman spectroscopy ishuge; in material science, chemistry, pharmacy, health sci-ences, and geology, among many others.
The main advantages of the Raman technique are asfollows: (1) it is nondestructive, given the laser irradianceon the sample is below the threshold to induce thermaldamage. This is critical for organic samples and also forthermolabile materials; (2) no sample preparation needed;(3) it can be used in micro- or macromodes, at close or atlong distances, with no physical contact with the samples;(4) it is very fast (spectra in favorable conditions take lessthan a fraction of second); and (5) the spectral bands providedefinitive characterization of the irradiated material’s com-position. These advantages are also the reason why Ramanwas proposed as a powerful analytical technique for plane-tary exploration (Wang et al., 1998; Ellery and Wynn-Williams, 2003; Popp and Schmitt, 2004).
To date, Raman spectroscopy has never been used forspace or planetary exploration although a previous devel-opment led by H. Hasking and A. Wang was foreseen for thetwin MER rovers, Spirit and Opportunity (Wang et al.,1998, 2003). The RLS instrument for ExoMars was the firstone selected for a rover mission on Mars. However, thecurrent launch schedule for ExoMars coincides with that ofthe NASA Mars 2020 mission, opening new and interestingpossibilities for the Raman technique since two Raman in-struments are being developed for Mars 2020. One namedSHERLOC is a resonance Raman and luminescence spec-trometer that uses deep-UV laser excitation (Beegle et al.,2014) and works at close distance. The second (SuperCam)is a combined instrument implementing several techniques(LIBS, Raman, time resolved fluorescence [TRF], infrared[IR], and visible) working in standoff mode (Gasnault et al.,2015). The LIBS, Raman and TRF spectroscopies are ex-cited with a pulsed laser.
In this article, the interest is focused on the description ofthe RLS instrument. We explain how it will contribute to theobjectives of the ExoMars 2020 mission, how it will be
accommodated in the rover and used to analyze samples.We also discuss the Raman technique’s synergies with otherinstruments in the payload. Finally, we present the out-come of experiments performed over the past few yearswith a simulator of the Raman operation mode and withscience portable prototypes at the field while preparing theinstrument.
2. The RLS History
The RLS in its current configuration is the result of a longprocess and continuous evolution that began with theEXLIBRIS proposal presented by Maurice and Rull (2003)on behalf of an international consortium in response to thePasteur call for ideas issued by ESA on May 2003 (ESA,letter Number 3, 2004). EXLIBRIS envisaged a combinedRaman-LIBS instrument, accommodated on a mast, whichworks at a distance of *2.5 m and uses a small ND:YAGpulsed laser. Although the standoff mode was not consid-ered for the mission, the instrument was selected as part ofthe Pasteur payload.
At the same time, other proposals were also presented:GENTNER, for a Raman-LIBS spectrometer working incontact mode—led by E. Jessberger ( Jessberger and Cas-tellucci, 2003)—and MIRAS, a combination of microscopyand UV Raman spectroscopy—led J. Popp (Popp and Thomas,2003).
Because of the synergies between these concepts and therelationship between the members of the different teams, ajoint international consortium was formed for the develop-ment of a combined Raman-LIBS instrument among Spain,France, the United Kingdom, Germany, and the Netherlands.
The instrument was foreseen to work in contact mode—both outside the rover on surface samples with an opticalhead attached to the rover’s robotic arm, and inside the roverwith another optical head analyzing cores obtained by thedrill. The robotic arm, the drill, and the sample preparationand distribution system were part of the service instrumentsenvisaged in the initial ExoMars Pasteur payload (ExoMarsMission Configuration proposed at the ESA’s ESWG#2,31_August-2_September 2005).
The first Raman-LIBS prototype was developed as anelegant bread board (BB) under an invitation to tenderemitted by ESA on June 2005, with TNO as the companyresponsible for its technical realization, and with Monocromin charge of developing the excitation lasers at 1064 nm(pulsed) and 660 nm (CW) (Bazalgette Courreges-Lacosteet al., 2007).
From this former concept the instrument evolved with themission. The following stages took place: (1) elimination ofthe rover’s robotic arm and therefore only Raman-LIBS in-side, (2) no LIBS and only Raman on solid cores inside, and(3) finally only Raman inside on powdered samples (theExoMars Payload: confirmation of the payload suite follow-ing restructuring of the mission; ESAPB_HME [2009]45.REV.1.1 14-May [2009]). In Figure 1, the historical evo-lution of the Raman instrument for ExoMars is presented.
In the current configuration, the RLS instrument willoperate on samples collected from the surface and thesubsurface (down to 2 m) with the ExoMars rover drill. Thesamples will be crushed into a fine powder with a graindistribution having as average grain size 200–250 mm (Vago
RAMAN, EXOMARS 629
Dow
nloa
ded
by 1
57.8
8.13
9.13
3 fr
om w
ww
.lieb
ertp
ub.c
om a
t 03/
25/1
9. F
or p
erso
nal u
se o
nly.

et al., 2017). Thereafter, one of two dosing stations willdeposit powder in a sample container in the carrousel. Thecarrousel will then move to flatten the surface of the powderbefore presenting it to the ALD instruments for analysis.
Since context information, such as the relationship be-tween the different minerals, is necessary to clearly identifya rock, the collected sample will be observed by way of ahigh-resolution camera (PanCam) and the close-up imager(CLUPI) before crushing. The physical modifications suf-fered by the sample during the crushing and distributionprocess may have an impact on the resulting Raman spectra(Foucher et al., 2013). However, analyzing powder can haveits positive counterpart in that it seems to facilitate the de-tection of minor phases in some cases (Lopez-Reyes et al.,2013a).
Along this process, two main aspects were the objectsof special attention: (1) the laser wavelength and (2) thespectrometer. The laser selection (532 nm in this case) wasbased on several criteria. One is the possibility to inducefluorescence on the sample. Fluorescence is considered ‘‘themajor enemy of Raman’’ because this electronic effect in-hibits to a large extent the observation of vibrational bands.Other effects, such as the grain size on powdered samples,can also induce a strong background that harms spectralquality (Foucher et al., 2013).
If only fluorescence is taken into account, then the use oflong wavelength excitations and, in particular, IR excitation(i.e., 1064 nm) would be the right choice. However, otheraspects have to be considered as well. Among those, theRaman efficiency—in terms of its fourth power law—andthe detector’s spectral response are the most important.
As it has been previously mentioned, the intensity ofRaman scattering is proportional to (l0–l)–4 or (n0–n)4—ifwavelength or wavenumber are, respectively, used. Excita-tions in the UV (at 250 nm) and in the visible (at 500 nm)are, respectively, around 300 and 20 times more efficientthan at 1064 nm. Another important consideration is theabsolute wavenumber or wavelength at which a particularRaman band appears. This position depends on the excita-tion’s l0 (or n0). The whole Raman shift covers normallythe range 0–4000 cm–1. A band observed at the limit of4000 cm–1 has an absolute position of 625 nm when excitedat 500 nm, and 1852.5 nm when excited at 1064 nm. Again,this spectral region is around 60 times stronger with the500 nm excitation than with a 1064 nm excitation taking intoaccount the fourth power factor (see Edwards and Chalmers,2005; Dubessy et al., 2012 for details).
For the ExoMars scientific objectives, the identification ofCH and OH functional groups is of great relevance. As theyappear as Raman shift in the range 2800–3650 cm–1, the useof an excitation that allows a better response in this spectralrange is of particular importance.
The second aspect guiding laser wavelength selection isdetector efficiency. Most detectors show the maximumresponse in the visible, with a decrease in efficiency ofalmost half when approaching the IR. Moving the excita-tion to the red and IR also shifts the Stokes-Raman bands’absolute position, thus reducing the possibility to observeappropriately the key spectral features related to the CHand OH groups.
Although specific modern detectors show enhanced re-sponse at the two wings of the visible spectrum (UV and IR),
the evaluation of all aspects previously discussed favors thechoice of an excitation in the visible. The fluorescence limi-tations will be analyzed in detail in the operations modesection.
The spectrometer selection also poses some questions thatdeserve discussion. Although for space applications, sizeand weight are the main driving parameters, the instru-ment’s overall spectral performance is of great importance,in particular, spectral range, spectral resolution, and opticalresponse (throughput).
Under these conditions, and considering that having nomobile parts is highly desirable, the main possibilities avail-able to the designer are those afforded by transmission andreflection gratings. In the case of RLS, after a detailed analysisof several options, the team selected a transmission holo-graphic grating concept. The main advantage of this opticalconfiguration is that the spectral resolution does not dependon focal length—as is the case for a reflection configuration(Pelletier, 1999; Slater et al., 2001; Dubessy et al., 2012), thusallowing a compact and luminous geometry in which lighttraverses the grating as a collimated beam.
3. RLS Technical Description
The RLS instrument comprises the following three mainunits: the spectrometer unit (SPU), the optical head unit(iOH), and the electronics control unit (ICEU), which alsoincludes the laser excitation source. Other elements are thecalibration target (CT), to be used on ground and during themission; the electrical harness (EH) for power and signalcommunication between units; and the optical harness (OH)connecting the laser to the optical head, both for illumi-nating the sample and for collecting the Raman light anddelivering it to the spectrometer.
The SPU, the laser, the iOH, the CT, and the general co-ordination of the whole instrument undertaking are the re-sponsibility of the Spanish team. The ICEU is under theresponsibility of the French team, who is also developing thepower board. The CCD detector, the front-end electronics(FEE), and the electronics board controlling the CCD detectorare contributed by the UK team. The OH connecting the laserto the iOH and the iOH to the SPU are provided by the Ger-man team. A general overview of the RLS team organizationis presented in Figure 2.
The RLS instrument has been designed to fulfill theExoMars scientific requirements for the rover’s Raman spec-trometer. They are (exm-rl-icd-esa-00008-1.0-RLS_E-ICD):
(1) Identify organic compound and search for life;(2) Identify mineral products and indicators of biologic
activity;(3) Characterize mineral phases produced by water-
related processes;(4) Characterize igneous minerals and their alteration
products;(5) Characterize the water/geochemical environment as a
function of depth in the shallow subsurface.
The RLS instrument will operate inside the rover’s ALDusing its internal optical head. A typical sequence of oper-ations is as follows. The rover uses its drill to collect asample, which is imaged by PanCam and CLUPI. Shortlythereafter the sample is transferred to the ALD. Once in the
630 RULL ET AL.
Dow
nloa
ded
by 1
57.8
8.13
9.13
3 fr
om w
ww
.lieb
ertp
ub.c
om a
t 03/
25/1
9. F
or p
erso
nal u
se o
nly.

ALD, a rock crusher reduces the sample to particulatematter that is deposited in a small, refillable container. Acarousel can position this refillable container under each ofthe ALD instruments’ observation positions.
In Figure 3, the RLS instrument block diagram is pre-sented, and in Figure 4, its accommodation inside the rover.
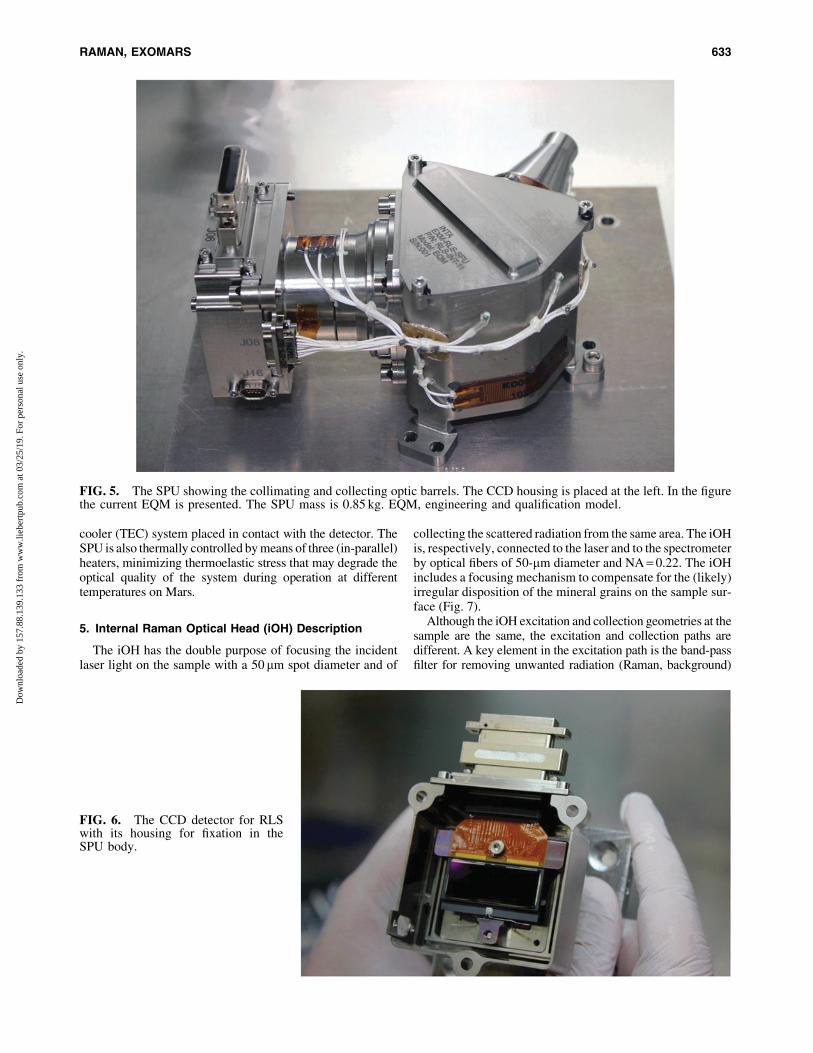
4. SPU Description
The SPU is a transmission spectrograph that uses a ho-lographic grating, which disperses the Raman signal that isprojected on the charge-coupled device (CCD) detectoroperated at cold temperature (Fig. 5). The spectrometermain subsystems are (1) the collimating and collecting op-tics, (2) the dispersive grating element, and (3) the de-tector. The collimating optics collects the light from the50-mm-diameter entrance optical fiber (which is fixed to thespectrometer by a MiniAVIM connector) and produces a
well-collimated beam. With the fiber NA = 0.22 and a col-limator a focal length of 69.71 mm, the two-doublet lensessystem reaches by design a #F-number of 2.27. The col-lection optics is a four-lenses subsystem with a focal lengthof 48.82 mm and #F-number 1.59. The lenses are manu-factured with space application glass from SCHOTT Co.
The dispersive element is a transmission-volume-phaseholographic grating from Wasatch with 1800 lines/mm. Thisconfiguration allows covering the optical range from 533 to676 nm with a spectral resolution between 6 and 8 cm-1.
The dispersed Raman lines are focused on the CCD de-tector. This detector is an e2v technologies’ CCD deviceworking in back-illuminated configuration and mounted inSiC carrier. The full frame has 2048 · 512 pixels (15 mmsize) (Fig. 6).
To reduce noise and improve the scientific performance, thedetector is operated in the range -10�C to -40�C. This tem-perature is guaranteed by a current-controlled thermoelectric
FIG. 2. The RLS team orga-nization and key personnel.
RAMAN, EXOMARS 631
Dow
nloa
ded
by 1
57.8
8.13
9.13
3 fr
om w
ww
.lieb
ertp
ub.c
om a
t 03/
25/1
9. F
or p
erso
nal u
se o
nly.

FIG. 3. The Raman instrument block diagram.
FIG. 4. The RLS accommodation inside the rover. In red the ICEU box, in green the SPU, and in yellow the iOH. Theoptical and electrical hardness of the units is also presented. SPU, spectrometer unit.
632
Dow
nloa
ded
by 1
57.8
8.13
9.13
3 fr
om w
ww
.lieb
ertp
ub.c
om a
t 03/
25/1
9. F
or p
erso
nal u
se o
nly.
cooler (TEC) system placed in contact with the detector. TheSPU is also thermally controlled by means of three (in-parallel)heaters, minimizing thermoelastic stress that may degrade theoptical quality of the system during operation at differenttemperatures on Mars.
5. Internal Raman Optical Head (iOH) Description
The iOH has the double purpose of focusing the incidentlaser light on the sample with a 50 mm spot diameter and of
collecting the scattered radiation from the same area. The iOHis, respectively, connected to the laser and to the spectrometerby optical fibers of 50-mm diameter and NA = 0.22. The iOHincludes a focusing mechanism to compensate for the (likely)irregular disposition of the mineral grains on the sample sur-face (Fig. 7).
Although the iOH excitation and collection geometries at thesample are the same, the excitation and collection paths aredifferent. A key element in the excitation path is the band-passfilter for removing unwanted radiation (Raman, background)
FIG. 5. The SPU showing the collimating and collecting optic barrels. The CCD housing is placed at the left. In the figurethe current EQM is presented. The SPU mass is 0.85 kg. EQM, engineering and qualification model.
FIG. 6. The CCD detector for RLSwith its housing for fixation in theSPU body.
RAMAN, EXOMARS 633
Dow
nloa
ded
by 1
57.8
8.13
9.13
3 fr
om w
ww
.lieb
ertp
ub.c
om a
t 03/
25/1
9. F
or p
erso
nal u
se o
nly.

induced by the laser in the fiber. In addition the fiber’s surface ispolished with an angle for avoiding backscatter radiation re-turning to the laser unit.
The combination of a notch- and a long-pass filter in thecollection path removes laser reflection and Rayleigh scatteringwith an OD of 10 (Fig. 8). The autofocus mechanism can movethe focusing optics along a –1 mm travel range using a linearball bearing guide. A linear encoder allows determining theoptical position, which is optimized by evaluating the lowintensity of the laser reflection in a closed-loop algorithm. Thespatial resolution achievable is of the order of –2mm.
6. Instrument Control and ExcitationUnit (ICEU) Description
The ICEU is composed of three electronic boards (DC/DC power board, DPU board, and FEE board). The ICEUalso contains the excitation unit (the laser) and its control(Fig. 9).
The power (DC/DC) board is responsible for conditioningthe rover-provided +28 V primary voltage into the requiredunit and subunit voltages in a highly stable and safe con-figuration. Within this board is also accommodated the laserdriver, which controls—by using a very accurate closed loop(PID)—the current supply for the laser pumping diode,guarantees stable optical power output from the laser.
The processor (DPU) board carries out several keyfunctions for the Raman spectrometer control, spectral op-eration, data storage, and communications with the rover.The DPU main functionalities are described below:
– To process the received video data coming from theFEE.
– To execute the firmware for the actuator drivers to al-low autofocus operation in the iOH.
– To implement the telemetry acquisition function.– To provide data storage (both for scientific data and
software code).– To communicate with the rover via its CAN-Bus.– To provide clocking plus power up reset functions.– To provide the reception (digitalization) and condition
of the thermal sensors and voltage chain.– To provide the firmware for the thermal control.
The FEE board provides the required biasing and controlsignals to drive the CCD detector on the SPU unit. Thecommanding of the FEE function comes from the FPGA(processor module inside the ICEU) and the biasing is fedthrough from the internal supply lines generated at thepower module. The FEE also receives the video data comingfrom the CCD (analogue), digitalizing it and transmitting itto the processor module.
The excitation laser unit located inside the ICEU is acritical part of the Raman instrument. The laser must ensurethe required wavelength, narrow bandwidth, and intensityrequired for stimulating the Raman effect in the mineralgrains during instrument operation, maintaining the stabilityof these parameters under all conditions on Mars. In par-ticular, it is the temperature range that imposes the toughestchallenge to the laser. To guaranty an adequate laser exci-tation during the whole mission, we have implemented aredundant configuration using two diode lasers opticallycoupled to the exciting optical fiber.
The laser has required a long (more than 7 years) andvery hard effort from the Spanish team. Its design startedfrom scratch, without previous space heritage in the sci-entific and technical teams or in the industry responsible(MONOCROM).
6.1. Laser description
The laser diode is a q-mount wavelength stabilizedtechnology pump diode with an optical output at 808 nmworking in the temperature range from 15�C to 45�C.Nevertheless, for obtaining optimum, repeatable, and stableperformance, a fixed working temperature (around 25�C,
FIG. 7. The RLS (EQM) optical Raman head (iOH).
FIG. 8. The iOH optical design showing the excitationand collection paths.
634 RULL ET AL.
Dow
nloa
ded
by 1
57.8
8.13
9.13
3 fr
om w
ww
.lieb
ertp
ub.c
om a
t 03/
25/1
9. F
or p
erso
nal u
se o
nly.

with 0.1�C thermal resolution) was set. The laser’s emissionis very stable (wavelength position below –50 pm), quitenarrow (FWHM below 30 pm). The power output rangesbetween 10 and 20 mW.
The laser diode is directly focused on the active mediumby way of a microlens that allows a high density of pump-ing. This consists in a neodymium-doped (1%) yttrium-aluminum garnet ceramic (Nd:YAG), generating a 1064 nmemission. Its front face is coated with a reflective materialspecifically designed for 1064 and 532 nm wavelengths, sothen acting as a front mirror for the laser cavity.
To emit at 533 nm, a second harmonic generator (SHG)crystal is used. The SHG—or frequency doubler—requires afine-tuned thermal stabilization to perform efficiently. Inthis design, a beta-barium borate SHG crystal was used.
A difficult aspect related to the redundant laser design iscombining both beams in a single output fiber. A solutionwas found by using a polarizer cube, which can let throughtwo beams with linear polarization perpendicular to eachother. For example, the primary beam will be horizontal andthe redundant beam will be vertical. The polarizer cube letsthrough the beam coming from the outermost channel andreflects the beam from the internal channel. In this way, bothbeams can trace the same geometrical path toward theoutput fiber, illuminating the same spot. Of course, to per-form such combination, a perpendicular polarization of both
beams has to be performed. This is made by using a po-larization rotator, which consists of a quartz half wave plate(532 nm) turning 90� the polarization of the redundant laserchannel with respect to the primary channel. This rotator isplaced in the redundant path, after the end mirror and beforethe polarizer cube.
Another device included in the laser is the double po-larization beam splitter at 45�, which sends most of thegreen light (94.5%) toward the output receptacle, but letspass a small amount (5.5%) through to the feedback pho-todiode—this is needed for implementing an accurate outputpower control by means of a PID closed loop. These coat-ings let pass both polarization directions, the one comingfrom the inner diode and the one from the outer diode, toallow for feedback control of both channels at once. Inaddition, as before, the mirror does not let through morethan 5% of the IR radiation (808 and 1064 nm).
This system also includes a mirror with a hole. The holein the mirror allows either of the two linearly polarizedbeams (not existing at the same time) to go through towardthe focusing lens in the optical receptacle. After the sampleis illuminated, nonlinearly polarized light is reflected backfrom it through the output fiber and the lens. The reflectedbeam has a diameter slightly larger than the hole andtherefore some of the light is reflected by the mirror anddirected toward the autofocus photodiode. The better the in-
FIG. 9. The electronic control unit with the different boards stacked in a vertical configuration. From top to bottom: FEEboard, FPGA board, PWR board, laser, optical fibers, and the baseplate assembly. FEE, front-end electronics.
RAMAN, EXOMARS 635
Dow
nloa
ded
by 1
57.8
8.13
9.13
3 fr
om w
ww
.lieb
ertp
ub.c
om a
t 03/
25/1
9. F
or p
erso
nal u
se o
nly.

focus position reached by the optical head focuser, thehigher the reflected light will be on the photodiode.
The laser has to be thermally controlled, which is criticalfor stability and for achieving optimum performance. Thiscontrol is implemented by a thermoelectric module in aclosed PID loop with the thermal sensors. These are two(redundant) Pt-1000 thermal sensors placed inside the laserhousing, below the pumping diodes, for getting an accuratemeasure of the highest temperatures expected.
All the components are placed in a laser housing made ofoxygen-free, high-conductivity copper with a gold coating.The main optical components are placed over KOVAR padson the laser board by using a solder jet bump technique(Ferrando et al., 2010). Solder jet bumping is a low-stress,highly stable, organic-free soldering technique. The tech-nology is based on the application of small bumping drop-lets of soldering alloy jetted by pressurized nitrogencapillary. Being the solder jet bumps made with a smalldiameter (100–200mm) and melted by a very precise IRlaser pulse, just a small thermal stress is induced on theoptical components during reflow and soldering.
Finally, the laser housing has an ultraclean air pressurizedenvironment (1 atmosphere) to avoid contamination. Thishas been achieved by using a hermetic design for thehousing cover and for every component that closes thehousing (photodiodes, optical receptacle, and electricalfeedthrough). Leak rates obtained with the hermetic sol-dering process are below 10-8 mbar$l/s. Figure 10 shows thelaser optical details and the housing.
7. CT Description
The RLS CT is a 1-mm-diameter disk sample of PET(polyethylene terephthalate) placed on a cylindrical foot(Fig. 11). The CT is fixed to the rover carrousel on theRaman optical head field of view, at the same height as therefillable sample container. PET was selected after testing
several minerals, single crystals, and polymers because itsspectrum shows a sufficient number of fine bands for cali-bration purposes and also because of its mechanical, ther-mal, and low outgassing properties (compatible with themission planetary protection rules). The CT is used for RLSinstrument calibration on Mars, and also during assembly,integration, testing (AIT) and prelaunch activities to verifythe calibration and performance of the RLS instrument.
Two identical units of the CT will be placed in therover’s carrousel. One under the optical head in the sample,processing and distribution subsystem (SPDS) nominal(fixed) position to be used for the AIT and cruise phasesallowing, if necessary, on-cruise instrument operation andcalibration. Thus, this CT unit will be used during the AITphase for the verification of the instrument health andperformance. The second CT will be utilized during theoperations phase, once on Mars. The reason for this is thatthe configuration of the carrousel and instruments insidethe ALD does not allow the RLS instrument to be cali-brated right before operation without disturbing the mar-tian sample surface.
On Mars, calibrating just before operating the instrumentis critical for assessing with picometer resolution the laserwavelength, and also the laser power, at sampling time(since both parameters are highly dependent on the lasertemperature). This information will be crucial for a properinterpretation of the scientific data obtained, as the positionof the characteristic Raman peaks can change slightly as aresult of temperature variations affecting the laser.
8. Electrical and Optical Harness Description
The various elements of the electrical and OH have beendesigned to connect (electrically and optically) the RLSinstrument’s main units (SPU, iOH, and ICEU), adaptingtheir length to the ALD layout and to the inside routing andfixation needs.
FIG. 10. Left: The optical RLS (EQM) laser design in the redundant configuration. It is possible to see the main lasercomponents: two diodes, the mirrors, and the cube join both beams. Right: The hermetic laser housing.
636 RULL ET AL.
Dow
nloa
ded
by 1
57.8
8.13
9.13
3 fr
om w
ww
.lieb
ertp
ub.c
om a
t 03/
25/1
9. F
or p
erso
nal u
se o
nly.

The EH is composed of three different elements, the EH#1for command and control of the optical head; the EH#2 tothermally control the spectrometer structure and TEC of theCCD; and the EH#3 for communicating with the CCD and theFEE. The EH uses MicroD connectors; its design was made tominimize mass allowing a flexible routing and a safe operation.
The OH comprises two different patchcords, first theOH#1 for sending the laser light to the optical head (and forreceiving the backscattered laser light for autofocus pur-poses) and the OH#2 for taking the Raman signal back to theSPU. The OH configuration is based on MiniAVIM 50-mmAPC connectors.
9. Software Description
The on-board software of the RLS instrument allowsperforming low-level characterization and unit to systemtesting campaigns. The on-board software is divided intotwo main software products: (1) the application software, incharge of performing the full control of the instrument bymanaging the iOH, CCD, thermal control, laser, CANbuscommunications, and failure detection, isolation, and safeprocedures; and (2) the boot software, which performs theinitialization sequence and on-flight patching of the appli-cation software.
The RLS application software provides simple opera-tional units so that any commanded sequence can be per-formed in a safe manner, while allowing full operationalflexibility. This operational concept is based on three levels:telecommands are the elemental operations that can beperformed by the instrument. Predefined sequences of tele-commands are grouped into actions, providing the buildingblocks of the operation. Sequences of different actions (andother tasks) will be grouped in higher level building blockscalled Tasks. During the operational phase of the mission,the Activity Plan, built as a sequence of tasks and actions,will be interpreted by the rover to handle the instrumentoperation by translating tasks into the corresponding se-
quence of actions, and these into the final sequence of tel-ecommands that can be interpreted by the instrument.
10. RLS Operational Concept
The measurements carried out by the RLS will be per-formed as described within the ExoMars Rover ReferenceSurface Mission, which includes six experiment cycles (withtwo samples each, one extracted from a surface target andthe other at depth) and two vertical surveys (with fivesamples each extracted at different depths). For more in-formation about the Reference Surface Mission, pleaseconsult Vago et al. (2017), also in this issue.
The RLS instrument can analyze several points on thesample surface presented by the SPDS. This will be donebased on an autonomous operational concept that takes intoaccount the sample nature and available resources (energy,time and data bandwidth). Two main complementary oper-ating modes have been established to optimize the experi-ments on Mars.
� Automatic: Predefined coordinates for the completecoverage of the sample container, acquiring multiple,consecutive spots over the sample. In this mode, theRLS instrument can perform a random mapping on thesample surface. During automatic scanning, the roverdisplaces the target following a preconfigured sequenceof movements under the RLS optical head. RLS takes20 shots at regularly spaced spots on the target. RLScan continue measuring spots by moving the SPDSbackward, thus analyzing more spots, until the re-sources allocated for Raman measurements arereached. This will depend on the efficiency of each spotanalyzed and the resources spent for their acquisitions.
� Cooperative: This entails a coordinated analysis usingthe ALD instruments. An on-board process running onthe rover’s computer analyses the results obtained bythe imaging-IR spectrometer MicrOmega to determineparticularly interesting targets for RLS and MOMA-
FIG. 11. The Raman CTs EQM (right) mounted in its support. The PET Raman spectrum (left) shows enough number offine bands covering all the instrument spectral range. CT, calibration target.
RAMAN, EXOMARS 637
Dow
nloa
ded
by 1
57.8
8.13
9.13
3 fr
om w
ww
.lieb
ertp
ub.c
om a
t 03/
25/1
9. F
or p
erso
nal u
se o
nly.

LDMS (please see Vago et al. [2017], this issue). Thefirst instrument to analyze the sample grains, MicrO-mega, will acquire multispectral images of the samplein a relatively wide area, providing a general view ofthe materials. In case something of special interest isfound, the SPDS will position the sample under theRLS instrument spot for detailed analysis with Ramanspectroscopy and under MOMA LDMS for a firstanalysis of organic content with laser desorption massspectrometry. The combination of RLS, MicrOmega,and MOMA-LDMS data will provide the necessaryinputs to decide if the sample is analyzed with MOMA-gas chromatograph mass spectrometry (GCMS). Thereason is that the number of ovens available for theGCMS is limited, so only a subset of samples will beanalyzed with this technique.
11. RLS Spectral Acquisition
The operation mode at instrument level is understood asthe series of operations and algorithms that the instrumentneeds to execute autonomously for obtaining a Ramanspectrum of the highest possible quality. The definition ofthe operations mode needs to implement the actions that thehuman operator normally performs on Earth (laser focusingon the sample, adjustment of the spectrum’s acquisitiontime, elimination of fluorescence .) in a system able toautonomously decide the best parameter combination for aparticular measurement. An additional difficulty that theRaman spectral acquisition poses for automatic methodsderives from the great difference between the molar scat-tering efficiency of different materials, which can reach 4–5orders of magnitude.
When acquiring Raman spectra in the laboratory, thereare many instrument parameters, especially for the CCDdevice, that must be configured to optimize spectra. Amongthese are gain, readout speed, and even temperature. How-ever, under Mars operational conditions, the number ofparameters requiring adjustments has to be reduced to theminimum. Here two operational-level parameters, Integra-tion Time (ti) and Number of Accumulations (na), have beenselected as the key parameters. Both can be easily modifiedwithout affecting the instrument performance, but just totaloperation time. However, several undesired effects such asfluorescence and cosmic rays can severely modify the ref-erence spectra and thus impair the ti and na calculation.
Taking into account these considerations, the instrumentneeds to identify and correct several issues to efficientlyacquire Raman spectra:
� Saturation avoidance: if spectra saturate, this can leadto errors in the operation flow. Thus, it is of paramountimportance that the spectra used for reference do notsaturate.
� Fluorescence detection and removal: the fluorescenceeffect on a Raman spectrum increases the backgroundlevel of the spectrum, potentially decreasing the signal-to-noise ratio (SNR) of the Raman signals. Given thatthe fluorescence background can decrease when thesample remains illuminated by the laser, RLS imple-ments a method for automatically calculating the fluo-rescence quenching time based on the backgrounddecreasing rate. The control applied by RLS basically
consists in quenching the fluorescence emission bykeeping the laser on for several seconds/minutes andreading spectra periodically. The effect of the laser is tosaturate the energy states of the fluorescence emission,resulting in a gradual decrease of the background.When the difference between two consecutive spectrabecame stable and lower than the precedent difference,the RLS algorithm stops and the next spectrum is thereal one taken as a measure.
Fluorescence is very common in terrestrial samplesbecause organics are ubiquitous on Earth. However, itis not expected to observe this effect on Mars veryoften. Nevertheless, the algorithm is of prime impor-tance in case organic traces are detected and also whenother fluorescence sources appear on the samples.
� Cosmic ray detection and removal: Cosmic ray is animportant source of spectral perturbation and, in par-ticular, on Mars where there is a higher flux than onEarth. To reduce and control this effect, the RLS in-strument apart from the shield on the CCD and othercritical elements will use dedicated algorithms to detectand remove cosmic rays and spikes that can appear inthe reference Raman spectra, and which could causefailures in the algorithms if considered as peaks. Detailsof the methodology can be seen in Lopez-Reyes (2015).
� SNR calculation for on-board operations: RLS instru-ment implements an algorithm for the calculation of thespectral quality of a spectrum. These data will be usedas the essential reference parameter in the acquisitionparameter adjustment algorithms. Details can be alsoseen in Lopez-Reyes (2015).
After these aspects have been analyzed and corrected (incase), the algorithm provides the adjustment of the inte-gration time and the number of accumulations adequate tooptimize the spectral quality-based spectrum.
12. RLS ExoMars Simulator and BB
To achieve the maximum scientific return from the RLSinstrument once on Mars, it is necessary to perform exper-iments on Earth under the same operational conditions af-forded by the rover. To do so, the team has developed twomain tools: (1) the RLS ExoMars simulator at the UnidadAsociada UVa-CSIC-CAB and (2) the RLS BB at INTA(Fig. 12) (Lopez-Reyes et al., 2013a). The scientific simu-lator allows performing many scientific experiments underconditions similar to those provided by the ALD of theExoMars rover. It also provides the means to define anddevelop the necessary algorithms for the automation of theinstrument. The basic configuration of the ExoMars simu-lator consists of an XYZ micrometric positioning systemwith an optical head attached to the Z axis, and a refillablecontainer attached to the XY positioners. With this system,samples can be analyzed at the mineral grain scale with athree-dimensional positioning accuracy of 2.5 mm. TheRaman optical head has a spot size of 50mm, which matchesthe requirements of the flight instrument. An internal camerapermits imaging the sample through the same optical path.In addition, the Raman optical head is coupled to an externalcamera so that the sample can be imaged by using differentfields of view. The system is also designed to flatten thesample powder with an SPDS-like design, and to position
638 RULL ET AL.
Dow
nloa
ded
by 1
57.8
8.13
9.13
3 fr
om w
ww
.lieb
ertp
ub.c
om a
t 03/
25/1
9. F
or p
erso
nal u
se o
nly.

the sample under the instrument’s optical head, which willautomatically focus on the sample surface.
In addition, the RLS ExoMars simulator has beenequipped with a martian chamber to allow performinganalysis of samples on a relevant environment (CatalaEspı, 2015). This chamber (Fig. 13) allows analyzing thesamples at temperatures and atmosphere representativeof the ones that will be found inside the ExoMars roverduring operation.
The BB has been conceived to evaluate the entire instru-ment’s behavior. This analysis includes verification and vali-dation of all the scientific requirements previously analyzedwith the simulator. In addition, the BB can be utilized toverify the radiometric model, Raman spectral quality, thecalibration procedure, as well as the operation mode. The BBhas been built in several steps, starting from commercial, off-the-shelf components and improving to flight representativecomponents. And while the science demonstrator can onlywork in terrestrial ambient conditions, the BB can operate inmission relevant conditions (temperature and pressure).
13. Ground Segment
The RLS ground segment combines a fully functionalreplicate of the instrument together with the instrumentdatabase (IDB) and Instrument Data Analysis Tool of RLS(IDAT) to do the following:
� Assess the activity plan to be uplinked as commands tothe instrument in the mission’s operational phase—viathe rover operations control center (ROCC).
� Generate engineering and scientific data products afterRLS operation in the processing pipelines at ROCC,and combine data product generation of different in-struments and ancillary data from the rover.
Data resulted from each sample acquisition will be sci-entifically cross-correlated with that obtained by other in-struments.
� Generate a set of key performance indicators after eachoperation to provide a broad overview of the scientifictrends of the instrument.
The IDB provides tables (in the SCOS2000 format) andthe RLS processing pipeline (following PDS4 standard) tocomply with the long-term use of the RLS data hosted in theESA archives.
IDAT is a ground segment system software/hardware toolthat will be used during the operational phase of the mission,not only for instrument health assessment but also for short(and long)-term science exploitation. Short-term use ofIDAT will, on a daily basis, provide the scientific teamoperating the rover with very fast scientific results to maketactical decisions for the following day’s rover activities.Having this information analyzed after a very short time(minutes) after the reception of the data from the spacecraftis of paramount importance to take the best tactical courseof action. However, this kind of operation also imposes verystrict requirements regarding the robustness and reliabilityof the methods applied for the analyses. It also requires thedevelopment and population of databases both under ter-restrial and martian conditions. The comparative analysis of
FIG. 12. The RLS simulator (left) and BB (right). Both are complementary tools for developing and testing the Ramaninstrument. BB, bread board.
RAMAN, EXOMARS 639
Dow
nloa
ded
by 1
57.8
8.13
9.13
3 fr
om w
ww
.lieb
ertp
ub.c
om a
t 03/
25/1
9. F
or p
erso
nal u
se o
nly.

samples under terrestrial and martian conditions shows thatno noticeable structural changes are detected with the dif-ference on temperature, pressure, and atmospheric condi-tions between the two planets. Only in some specific casesof very high hydrated phases, minor changes in the OHvibrations were observed. And as the general trend, theRaman widths slightly decrease as a consequence of the lowtemperature under martian conditions.
In addition, implementation of routines for the automatedanalysis of the results is included. These tools will also beavailable to the scientific team for detailed (and slower)analysis of the data, providing support for the long-termscience use of the RLS data products by the team (Fig. 14).
14. Raman Performances and Scientific Capabilitiesof RSL Within the Mission Framework
14.1. Laboratory analyses with the RLS simulator
To fulfill the mission’s scientific goals, the Raman in-strument must obtain good quality spectra from the widevariety of materials available at the landing site and en-countered while roving on Mars. The main informationsources about these materials and their spectral responsesare the previous missions, the meteorites (in particularmartian meteorites), and the potential martian analogues onEarth. As no Raman has been placed on the martian surfaceuntil present, the real materials on which Raman spectros-copy can be applied, and on the basis of which spectraldatabases and models for interpretation of the geologicalprocesses on Mars can be developed, are those obtainedfrom martian meteorites and terrestrial objects.
Raman spectroscopy has demonstrated to be a powerfulmethod for precise analysis of martian meteorites and the
RLS team has studied several of them (Rull and Martinez-Frias, 2003; Rull et al., 2004; Gonzalez-Toril et al., 2005;Rogero et al., 2007).
On the contrary, terrestrial analogues are very interesting.Although no place on Earth is like Mars, several locationsoffer the possibility to analyze geological processes, and therelated materials, that can be compared with those producedon Mars in the past. Of particular importance are thosematerials related to liquid water alteration processes becauseunderstanding the hydrologic cycle of Mars is a key aspectof understanding its geological cycle. The team has ana-lyzed materials from a wide range of places on Earth.Among these are Rio Tinto, Jaroso Ravine, and Tenerife inSpain, Svalbard Islands (Arctic), Barberton (South Africa),and Mauritania.
The methodology used consisted in a double study. At thefield, in situ analysis with portable science prototypes of theRaman under development for ExoMars; and in the labo-ratory, using conventional micro-Raman techniques and thespectral operation simulator (Lopez-Reyes et al., 2013b)allowing reproducing the real RLS operation on Mars(Figs. 12 and 13).
Although the spectral information during the operationwill be obtained by observation with the Raman opticalhead 20 points in a single line on the sample surface, thesimulator allows several other options, such as two-dimensional mapping, surface height profiling by using theoptical head autofocus device, and finally, the capability tocombine other techniques such as an imager in the visibleor in the IR. This last case is of prime importance becausethe possibility to perform combined science between Ra-man and the IR spectrometer MicrOmega, also onboard theALD, adds a very important extra value to the spectral
FIG. 13. The martian chamber for RLSpowdered sample analysis. The chamberalso includes a flattening system workingunder martian conditions to compare thesurface characteristics with the preparedunder terrestrial conditions.
640 RULL ET AL.
Dow
nloa
ded
by 1
57.8
8.13
9.13
3 fr
om w
ww
.lieb
ertp
ub.c
om a
t 03/
25/1
9. F
or p
erso
nal u
se o
nly.

observations. This combined science rests on the ability ofthe rover to place both instruments over the same spot in asequential way.
In Figures 15 to 19, some results obtained by the simu-lator working in terrestrial conditions are presented.
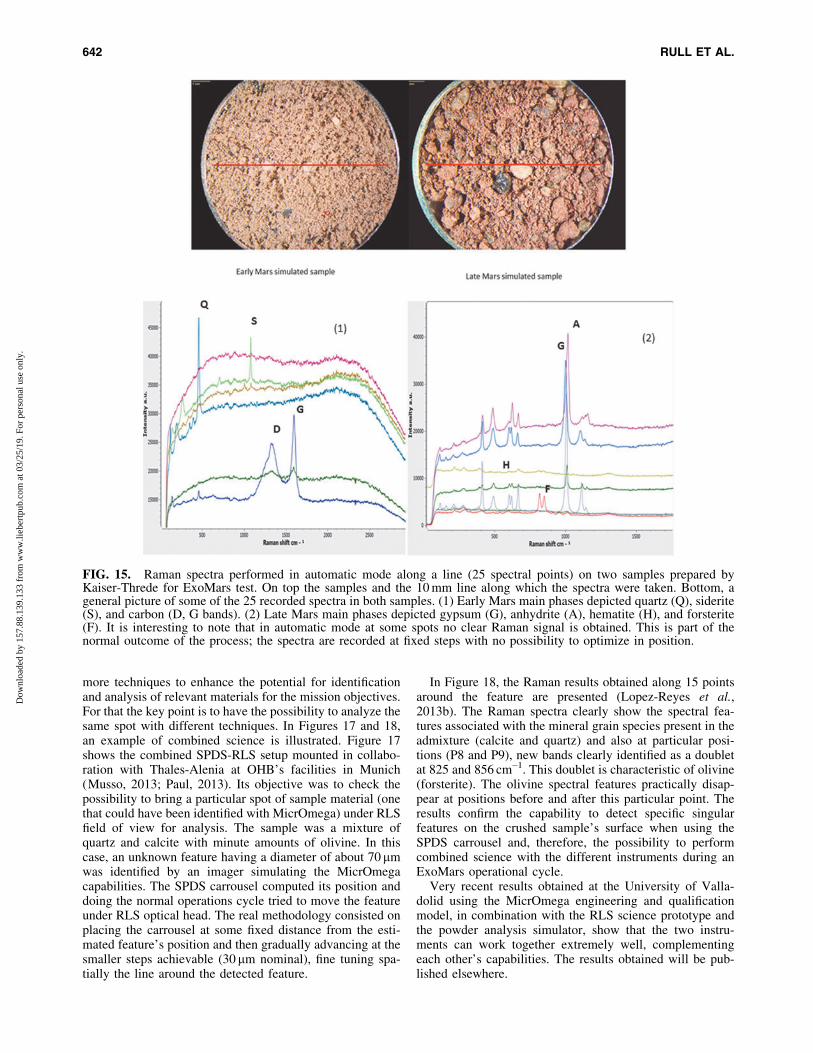
In Figure 15 are shown Raman spectra performed in au-tomatic mode on two simulant samples of early and lateMars average materials prepared by ESA and Kaiser-Threde. Some of the spectra obtained from 25 points along aline are presented overlaid to demonstrate the real resultsobtained by the simulator after an automatic scanning inwhich at each spot the spectral acquisition parameters areobtained from algorithms. It is easy to see that the spectralquality is different at each spot and in some cases, it is hardto obtain useful spectral information. In other cases, thespectra are of high quality. Nevertheless, from the whole setof spectra, it was possible to identify all the mineral phasespresent in the samples, including minor phases. In earlyMars sample, the components detected were quartz, mus-covite, albite, siderite, chlorite, and hematite. In late Marssample, the minerals identified were gypsum, anhydrite,hematite, forsterite, and minor quartz and actinolite. Themineral identification was performed by using the spectraldatabases developed in this project and confirmed with theliterature. These minerals were also confirmed with XRD asa complementary technique, although some of the minorphases were difficult to identify unambiguously. The carbonfeatures were not detected by XRD.
The point-by-point technique also permits quantifying therelative amounts of mineral phases in complex admixtures.The method uses spectra normalized by the maximum in-
tensity at each point and the average over all the pointsanalyzed along the line (see Lopez-Reyes et al., 2012,2013b for details). This process allows increasing the ac-curacy and detection limit.
In Figure 16, an example is presented for a binary ad-mixture of calcite and gypsum. Concentrations (1:99 and90:10) are shown in Figure 16A, B, although the wholerange from 1:99 to 99:1 was analyzed. These figures rep-resent, for 30 points analyzed on each sample, the relativemaximum intensity of the most representative peaks ofcalcite (blue) and gypsum (red).
The results show that it is possible to see the minorconcentration phase at many spots along the line. This is animportant result verified in several other examples becauseto experimentally demonstrate the simple analysis along aline in the bulk powdered sample is enough to characterizethe mineral composition of the whole sample, given a suf-ficient number of spots are analyzed. Furthermore, when theintensity data for each compound from the 30 points are av-eraged, the calibration curve shown in Figure 16C is obtained.For comparison, the calibration curve obtained with XRD onthe same admixture is shown in Figure 16D. As shown, theresults with RLS improve the calibration curve obtained whenusing XRD in terms of curve linearity and detection thresh-olds, opening the possibility of pseudo-quantifying mineralphases during operation on Mars, without the need to performcorrections on the calibration curve. Details on this work canbe found in Lopez-Reyes et al. (2012, 2013b).
Another interesting aspect of the operation with the RLSinside the framework of the ExoMars mission operationcycle is the possibility to combine the potential of two or
FIG. 14. A general picture of some of the main tools developed for the RLS operation and scientific activities prior andduring the mission. These tools are grouped in two main systems: one related with the construction and management ofspectral databases under terrestrial and martian conditions and the other related with the spectral treatment, includingautomatic recognition of spectra.
RAMAN, EXOMARS 641
Dow
nloa
ded
by 1
57.8
8.13
9.13
3 fr
om w
ww
.lieb
ertp
ub.c
om a
t 03/
25/1
9. F
or p
erso
nal u
se o
nly.
more techniques to enhance the potential for identificationand analysis of relevant materials for the mission objectives.For that the key point is to have the possibility to analyze thesame spot with different techniques. In Figures 17 and 18,an example of combined science is illustrated. Figure 17shows the combined SPDS-RLS setup mounted in collabo-ration with Thales-Alenia at OHB’s facilities in Munich(Musso, 2013; Paul, 2013). Its objective was to check thepossibility to bring a particular spot of sample material (onethat could have been identified with MicrOmega) under RLSfield of view for analysis. The sample was a mixture ofquartz and calcite with minute amounts of olivine. In thiscase, an unknown feature having a diameter of about 70mmwas identified by an imager simulating the MicrOmegacapabilities. The SPDS carrousel computed its position anddoing the normal operations cycle tried to move the featureunder RLS optical head. The real methodology consisted onplacing the carrousel at some fixed distance from the esti-mated feature’s position and then gradually advancing at thesmaller steps achievable (30mm nominal), fine tuning spa-tially the line around the detected feature.
In Figure 18, the Raman results obtained along 15 pointsaround the feature are presented (Lopez-Reyes et al.,2013b). The Raman spectra clearly show the spectral fea-tures associated with the mineral grain species present in theadmixture (calcite and quartz) and also at particular posi-tions (P8 and P9), new bands clearly identified as a doubletat 825 and 856 cm-1. This doublet is characteristic of olivine(forsterite). The olivine spectral features practically disap-pear at positions before and after this particular point. Theresults confirm the capability to detect specific singularfeatures on the crushed sample’s surface when using theSPDS carrousel and, therefore, the possibility to performcombined science with the different instruments during anExoMars operational cycle.
Very recent results obtained at the University of Valla-dolid using the MicrOmega engineering and qualificationmodel, in combination with the RLS science prototype andthe powder analysis simulator, show that the two instru-ments can work together extremely well, complementingeach other’s capabilities. The results obtained will be pub-lished elsewhere.
FIG. 15. Raman spectra performed in automatic mode along a line (25 spectral points) on two samples prepared byKaiser-Threde for ExoMars test. On top the samples and the 10 mm line along which the spectra were taken. Bottom, ageneral picture of some of the 25 recorded spectra in both samples. (1) Early Mars main phases depicted quartz (Q), siderite(S), and carbon (D, G bands). (2) Late Mars main phases depicted gypsum (G), anhydrite (A), hematite (H), and forsterite(F). It is interesting to note that in automatic mode at some spots no clear Raman signal is obtained. This is part of thenormal outcome of the process; the spectra are recorded at fixed steps with no possibility to optimize in position.
642 RULL ET AL.
Dow
nloa
ded
by 1
57.8
8.13
9.13
3 fr
om w
ww
.lieb
ertp
ub.c
om a
t 03/
25/1
9. F
or p
erso
nal u
se o
nly.

FIG. 16. Pseudo-quantification of mineral phases in admixtures using the point by point spectra obtained with thesimulator. In this example a binary combination of calcite and gypsum is used for calibration. Detection limit reachedaround 1%. Above, the relative intensity of the main peaks of calcite (blue) and gypsum (red) in 30 points of binarymixtures in proportion 90:10 (A) and 1:99 (B). Below, calibration curves obtained with RLS (C) and with XRD (D) on thesame samples. Extracted from Lopez-Reyes et al. (2013). (Color graphics available at www.liebertonline.com/ast)
FIG. 17. The SPDS setup at Kaiser-Threde facilities in Munich (right), including the crushing and dosing stations and thecarrousel and the setup with the RLS optical head and visible camera head (left) to simulate the combined sciencepositioning capabilities. SPDS, sample, processing, and distribution subsystem.
643
Dow
nloa
ded
by 1
57.8
8.13
9.13
3 fr
om w
ww
.lieb
ertp
ub.c
om a
t 03/
25/1
9. F
or p
erso
nal u
se o
nly.

As it has been mentioned previously, no importantspectral modifications have been observed under the changefrom Earth to Mars conditions on fine grained powderedsamples. This means that the vast majority of materialspresent the same Raman spectrum on Earth than undermission operation conditions and no corrections are neces-sary, allowing the use of terrestrial spectral databases.
A different problem that needs to be stressed is thethermal behavior of the mineral grains, in particular for thefine-grain fraction, when illuminated by the laser under bothplanetary conditions. In Figure 19, some results are pre-sented on jarosite a key mineral in the geology of Mars.Jarosite is a thermolabile material and was analyzed insidethe Mars chamber with the simulator. In the experiment, thelaser irradiance on the sample was changed at differenttemperatures in the range 5�C to -25�C, under pure CO2
atmospheric composition and typical Mars pressure. Foreach irradiance level, visual images of the surface andRaman spectra were taken. These experiments were com-pared with the same performed at room temperature and
terrestrial atmospheric conditions. Details can be seen (CatalaEspı, 2015). The laser irradiance levels to avoid thermaldamage and structural changes are in average *60% of thoseon Earth. And this value is not very different for other ther-molabile materials as hematite or goethite. These resultsare considered of prime importance for the spectrometerdesign and its safety when operating on Mars, in particular,considering the possibility of detecting organic compounds.In consequence, the laser power output has been reducedaccordingly to a safe level for avoiding this issue but not toolow to reduce the spectral quality in the majority of thesamples to be observed.
It is also noticeable in Figure 19, the difference between thevisual aspect of the potential thermal damage and the Ramanspectral response. A sample spot irradiated at 0.28 and 0.36kW/cm2 laser irradiance shows a different color (brown in thiscase) than the same spot irradiated at very low level indicatingapparent thermal damage. Nevertheless, the spectra still arethe same with only small differences in the S/N ratio. Whenthe irradiance increases over 0.45 kW/cm2, also the spectra
FIG. 18. Raman spectra obtained on a powdered sample in which a particular feature is detected with an imager on thesurface. After performing the complete scanning with the imager, the carrousel allows to recover the position of theparticular feature. For that an estimated position before the possible real position is placed under the RLS-optical head andan automatic Raman scanning is performed using a 30 mm step. The feature is reached by the Raman head and identified asolivine using the characteristic spectral doublet at 824 and 856 cm-1. The images depicted on the right side of the figure areassociated with the zoomed spectra and stress the difficulty to visually detect this feature, which is unambiguously detectedby the spectrometer.
644 RULL ET AL.
Dow
nloa
ded
by 1
57.8
8.13
9.13
3 fr
om w
ww
.lieb
ertp
ub.c
om a
t 03/
25/1
9. F
or p
erso
nal u
se o
nly.

change dramatically indicating real structural damage. This isa relevant result because on Mars, the RLS instrument willwork without imaging the sample and only the spectral re-sponse will be obtained.
14.2. RLS in situ field analysis
Raman spectroscopy has found many field applications,but not only. Although it is mainly used for mineralogy, thistechnique is also very useful in cultural heritage work,where the spatial resolution (mineral grain scale achiev-able), the typical fast data acquisition—and nondestructivecharacter—allow the reliable identification of materials indifferent conditions without any sample preparation. In ourcase, two RLS science prototypes have been developed forthose studies. These instruments use the same configuration,optical design, laser illumination, and spot size as the flightmodel, but are built with commercial components. They arealso ruggedized for use in harsh environments (cold, hot,dust, etc.) in the field (Fig. 20). Under most conditions,ambient sunlight is a problem that can be avoided to a greatextent by using a protective device in the optical head.
In any case, real Raman spectra in the field normallyshow a high background and a small signal-to-noise ratio.Then, additional spectral manipulations—such as background
subtraction, filtering, and signal-to-noise enhancement, amongothers—become necessary. These manipulations are part ofthe instrument software included in the IDAT.
The experiments and the data volume collected over thelast years are huge. Therefore, we only present but a smallfraction of these results here looking for interesting andrepresentative areas.
Hydrated iron-bearing sulfates and iron oxyhydroxidesbecame very important minerals for the Mars geologicaldescription after they were detected in Meridiani Planumby the Miniaturized Mossbauer spectrometer MIMOS IIonboard the Opportunity rover (Klingelhofer et al., 2004;Squyres et al., 2004). In particular, the presence of jarosite(KFe3+
3(SO4)2(OH)6) was regarded as a strong mineralogi-cal evidence of wet and probably highly acidic conditionsthat prevailed in the Hesperian (3.7 to 3.0 Gy ago) (Clarket al., 2005).
After this discovery, potential Mars analog sites on Earth,in which jarosite is produced by different mineralogenesisprocesses, have become the subject of great interest (Frostet al., 2006; Edwards et al., 2007; Sobron et al., 2009; Rullet al., 2014). Among those, the Jaroso Ravine (Almerıa, SESpain), the world type locality of jarosite, and the Rio Tintosite (Huelva, SW Spain), where a wide range of hydratedsulfates can be found (Frost et al., 2005; Sobron et al., 2009;
FIG. 19. Effect of laser irradi-ance level on the Raman spectralquality of thermolabile samples(jarosite in this case) under relevantmartian conditions. The irradiancethreshold for thermal damage isabout 60% of the level under ter-restrial conditions. Nevertheless,the visual effect of the damage isnot directly correlated with thespectral modifications. (A) Spectrain the range of irradiance 0.051 to0.362 kW/cm2 show the same jar-osite spectral features despite thecolor change from the original tobrown. (B) Spectrum obtained with0.452 kW/cm2. In this case a dra-matic structural modification isobserved. Visually only a darken-ing of the central area of the spotlaser is observed. (C) The darken-ing area increases in this picture butthe color is not markedly differentfrom (B). The Raman spectrumshows no vibrational features, onlythe thermal response. (Color gra-phics available at www.liebertonline.com/ast)
RAMAN, EXOMARS 645
Dow
nloa
ded
by 1
57.8
8.13
9.13
3 fr
om w
ww
.lieb
ertp
ub.c
om a
t 03/
25/1
9. F
or p
erso
nal u
se o
nly.

Rull et al., 2014), are considered important potential analogsites of the mineralogenetic processes that occurred onHesperian Mars, and also from an astrobiological point ofview (Fernandez-Remolar et al., 2005; Martinez-Frıas et al.,2004).
In Rio Tinto, Raman analysis has been performed atseveral periods of the year (Fig. 21), alone or in com-bination with other instruments participating in Marsmissions—in particular, using a prototype of the MIMOSII Mossbauer spectrometer on board Spirit and Opportunity
FIG. 20. The RLS science prototype adapted to work in field conditions (left) and under operation in the Arctic in anAMASE (NASA-ESA) expedition (right).
FIG. 21. Rio Tinto (SW-Spain) near its source at different periods of the year [(A) May, (B) June, (C) July, and (D)September] showing the characteristic acidic water and precipitates.
646 RULL ET AL.
Dow
nloa
ded
by 1
57.8
8.13
9.13
3 fr
om w
ww
.lieb
ertp
ub.c
om a
t 03/
25/1
9. F
or p
erso
nal u
se o
nly.

FIG. 22. Raman and Mossbauer, working together in Rio Tinto. On the area of Pena del Hierro (top) dominated by Fe-oxides and in the river bank (bottom) dominated by sulfate efflorescences.
FIG. 23. (Left) Mossbauer spectrum obtained on the Rio Tinto efflorescences depicted in Figure 22 (bottom). (Right)Raman spectra obtained at some points of the same area. Mossbauer spectrum shows a very intense signal of jarosite andminor signal of copiapite. Raman spectra show mainly copiapite (A) with different hydration degree and minor jarosite (B).It is assumed copiapite is at the surface forming a narrow layer and jarosite is below this layer.
RAMAN, EXOMARS 647
Dow
nloa
ded
by 1
57.8
8.13
9.13
3 fr
om w
ww
.lieb
ertp
ub.c
om a
t 03/
25/1
9. F
or p
erso
nal u
se o
nly.

FIG. 24. Raman spectrum (a) of a sample (b) collected from the Rio Tinto source banks. The broad spectral featurescorrespond to disordered carbon (D) (*1350 cm-1) and (G) (1500–1600 cm-1) bands originating from bacterial activities.Besides the primary minerals [mainly quartz (A)], small amounts of jarosite (B) can be also identified.
FIG. 25. A jarosite outcrop (top-left) of several meters long in the Jaroso Ravine (SE Spain) and a piece of about 10 cmcollected from this outcrop containing practically pure jarosite (top-right). The Raman spectrum (baseline corrected) of thepiece taken in situ (bottom).
648
Dow
nloa
ded
by 1
57.8
8.13
9.13
3 fr
om w
ww
.lieb
ertp
ub.c
om a
t 03/
25/1
9. F
or p
erso
nal u
se o
nly.

rovers (Figs. 22 and 23) (Rull et al., 2008; Klingelhoeferet al., 2016) and the Terra XRD a prototype of the CheMininstrument on board Curiosity rover (Rull et al., 2010a;Sobron et al., 2014).
From the whole collection of spectra, up to 13 differentminerals were identified around the source of Rio Tinto byapplying in situ Raman spectroscopy. This number rose to19 minerals with the additional Raman analyses usingmicro-Raman laboratory instruments on collected samples.The complementary Mossbauer and XRD instruments con-firmed most of these mineral phases (Rull et al., 2008;Klingelhofer et al., 2016). It is interesting to note that Ra-man and Mossbauer sampling the same area observe thesame minerals (given the mineral phases are active forMossbauer), but in some cases their relative amount seemsdifferent. This effect is related with the different depth ofanalysis. Raman accesses only the surface (around 100mm)and Mossbauer can observe deeper (about 1 mm). An ex-ample is presented in Figure 23 with the results obtained ondeposits of sulfate efflorescences showed in Figure 22(bottom) (details from Klingelhofer et al., 2016).
Finally, the total number of detected minerals with RLS isvery close to the whole minerals described in the literature
in the area, in particular in the case of sulfates (Buckbyet al., 2003). To avoid ambiguity on whether the analyzedminerals are primary or secondary phases, the sampleswere analyzed immediately, as soon as they arrived at ourlaboratory.
Raman spectroscopy can also supply useful informationabout biogenic processes related to mineral formation underacidic conditions. Figure 24 shows an example collectedfrom the Rio Tinto banks with effects of bacterial acido-philic activity on the primary minerals (quartz and pyrite)(Klingelhofer et al., 2016). The Raman results also indicatea small amount of jarosite and a strong, broad spectralfeature with very clear disordered carbon D (*1350 cm-1)and G (1550–1600 cm-1) bands. Although in general thepresence of carbon D and G bands should not be consideredconclusive proof of biogenic activity, in this case the bandsprovide evidence of acidophilic bacterial activity—we cansee the bacterial colonies. These results illustrate thatRaman spectroscopy can be a valid tool in the search forpossible remains of life on minerals.
A wide range of Raman analyses were also performed inthe Jaroso Ravine (Frost et al., 2005, 2006, 2007; Venegas,2014), several of them in combination with Mossbauer
FIG. 26. The Raman spectrometer working in collaboration with the robotic arm of a NASA rover prototype duringAMASE 2008 expedition. The goal is to verify if the particular features recognized by the rover imager are of astro-biological interest. Raman spectra taken at the same surface area without moving and touching the selected sample allowidentifying the mineral composition [dolomite (D) and spectral evidence of beta-carotene (B, C)].
RAMAN, EXOMARS 649
Dow
nloa
ded
by 1
57.8
8.13
9.13
3 fr
om w
ww
.lieb
ertp
ub.c
om a
t 03/
25/1
9. F
or p
erso
nal u
se o
nly.

spectroscopy (Rull et al., 2008). Raman results from the hostrocks show that muscovite and graphite are the prevalentminerals, in addition to oxyhydroxides (anatase, rutile, he-matite, magnetite, goethite, and lepidocrocite) and silicates(zircon, quartz, orthoclase, and anorthoclase). Other morelocalized minerals also identified in rock veins were barite,siderite, and quartz and small amounts of pyrite andsphalerite.
Although jarosite is perhaps the most characteristic sul-fate in the Jaroso Ravine (Fig. 25), also barite and othersulfates were identified by Raman analysis of hydrothermalbreccias both in situ and in the laboratory. These includegypsum, anglesite, and a variety of hydrated sulfate mineralssuch as natrojarosite, alunite, botryogen, copiapite, ferrico-piapite, halotrichite, epsomite, hexahydrite, rozenite, andszomolnokite (Frost et al., 2005, 2006; Venegas, 2014).
Our Raman instrument team participated in severalAMASE expeditions to the Arctic’s Svalbard islands (Steeleet al., 2008; Rull et al., 2010b; Sansano et al., 2011). Weused two Raman configurations, a standoff setup that uses apulsed laser at 532 nm and a contact one based on the RLSExoMars science prototype. Results when using the latterinstrument are presented here.
One of the AMASE campaign objectives was to operatevarious rover instruments in a mission realistic scenario. OurRaman spectrometers were used extensively. Of particularinterest are the experiments with a higher astrobiology in-terest. In Figure 26, some of the results obtained are pre-sented. In this case, the combination of a rover with imagercapabilities on the robotic arm is looking for particularfeatures in the rocks surface possibly related with biogenicactivity. Raman is used for confirmation at the same spots ofthe mineralogy of the rocks and the potential identificationof traces of organics. In Figure 26 can be seen this is thecase and beta-carotene was identified as the remains of li-chens activity on the rocks’ surface.
Raman spectroscopy is very sensitive to the presence oforganic compounds and can be useful for flagging present orpast biological activity. As an example, we present Ramanspectra obtained on carbonaceous matter from BarbertonGreen Belt chert samples (Venegas, 2014). The goal is tocompare Raman results obtained on bulk samples where thecarbonaceous features can be visually detected and thespectral characteristic placed in their mineralogical contextwith the powdered sample analysis in automatic mode.What spectral information is retained in the powder analysis
FIG. 27. In situ Raman spectra of some of the different layers corresponding to a chert sample from Komati River(Barberton Greenstone Belt (BGB), South Africa. The position of the (D) and (G) bands of carbon is shown allowingdetecting differences between the dark and white layers, which correspond to differences in the maturation process of theoriginal material.
650 RULL ET AL.
Dow
nloa
ded
by 1
57.8
8.13
9.13
3 fr
om w
ww
.lieb
ertp
ub.c
om a
t 03/
25/1
9. F
or p
erso
nal u
se o
nly.

is of great interest. In Figure 27, the Raman spectra of alayered sample from Komati River obtained with a labora-tory instrument in micromode are shown. Raman allowsdetecting the mineralogy of the sample: mainly quartz withminute amounts of orthoclase and muscovite and oxihydr-oxides and traces of carbonates. It is worth mentioning thepresence of rutile and anatase. The first order of carbonvibrational bands is also shown. The dark layers have dif-ferent D and G band spectral features, which correspond todifferent maturity stages of the carbonaceous matter (seeVenegas, 2014, for details).
Figure 28 corresponds to Raman spectra of a crushedportion of the upper part of the sample. The powder wasprepared in a similar form than what the rock crusher in theExoMars rover will produce. The Raman spectra were ac-quired in automatic mode on 30 spots along a line. Thespectra were presented in overlaid mode to have a generalpicture of the whole results. We see that practically all thespectral features observed in the original sample (beforecrushing) are also detected in the powder, including differ-ences in the carbon D and G bands. Nevertheless, the carbonbands were present at all the spots in the sample as a con-sequence of the crushing procedure.
15. Conclusions
The combined science possibilities afforded by theExoMars rover ALD instruments MicrOmega (IR), RLS
(Raman), and MOMA (organic identification by massspectrometry) are extremely powerful. In particular, Ramanand IR spectroscopy provide complementary informationon all mineral phases present in a sample—crystalline andamorphous. Raman can also be a very good tool for flaggingthe presence of organic molecules, and in some cases mayidentify some compounds too. This information will be usedon ExoMars to guide the further search for possible bio-molecules by MOMA.
On the ExoMars rover, it will be possible to imagethe sample before crushing it. Raman measurementswill be conducted on the resulting powder, and hence itwill not be possible to perform a more traditional,combined visual Raman analysis. Nevertheless, ourlaboratory results with the RLS instrument prototypedemonstrate that we can recover most (and in somecases all) Raman spectral features when working with asufficient number of sampling points on the particulatesample material.
Acknowledgments
Financial support for this work was made available for theSpanish team through the Projects AYA2008-04529-4 andAYA2011-30291-C02-02 (Ministry of Science and In-novation, Spain, and FEDER funds of EU) and theESP2013-48427-C3-1,2,3-R and ESP2014-56138-C3-1,2,3-R Projects of MINECO.
FIG. 28. Raman spectra (30 points) along a line on a portion of the sample shown in Figure 27 crushed in a similar waythat the ExoMars ALD-crusher will produce. The spectra clearly show all the mineral phases detected in a spectral mappingof the surface made at the laboratory, including the carbonaceous bands. Nevertheless, the mineral grain spatial contextassociated at each spectrum is lost. ALD, analytical laboratory drawer.
RAMAN, EXOMARS 651
Dow
nloa
ded
by 1
57.8
8.13
9.13
3 fr
om w
ww
.lieb
ertp
ub.c
om a
t 03/
25/1
9. F
or p
erso
nal u
se o
nly.

Author Disclosure Statement
No competing financial interests exist.
References
Bazalgette Courreges-Lacoste, G., Ahlers, B., and Rull Perez, F.(2007). Combined Raman spectrometer/laser-induced break-down spectrometer to the next ESA mission to Mars. Spec-trochim Acta A Mol Biomol Spectrosc 68:1023–1028.
Beegle, L., Bhartia, R., White, M., DeFlores, L., Abbey, W.,Wu, Y.-H., Cameron, B., Moore, J., Fries, M., Burton, A.,Edgett, K.S., Ravine, M.A., Hug, W., Reid, R., Nelson, T.,Clegg, S., Wiens, R., Asher, S., and Sobron, P. (2015)SHERLOC: Scanning habitable environments with Ramanand luminescence for organics and chemicals. 2015 IEEEAerospace Conference, Big Sky, MT, USA, doi: 10.1109/AERO.2015.7119105.
Buckby, T., Black, S., Coleman, M.L., and Hodson, M.E.(2003) Fe-sulphate-rich evaporative mineral precipitates fromthe Rio Tinto, southwest Spain. Mineral Mag 67:263–278.
Catala Espı, A. (2015) Development of Mars SimulationChamber in support for the science associated to the RamanLaser Spectrometer (RLS) Instrument for ESA’s ExoMarsmission. Thesis, University of Valladolid.
Clark, B.C., Morris, R.V., McLennan, S.M., Gellert, R., Jolliff,B., Knoll, A.H., Squyres, S.W., Lowenstein, T.K., Ming,D.W., Tosca, N.J., Yen, A., Christensen, P.R., Gorevan, S.,Bruckner, J., Calvin, W., Dreibus, G., Farrand, W., Klingel-hoefer, G., Waenke, H., Zipfel, J., Bell, III J.F., Grotzinger,J., McSween, H.Y., and Rieder, R. (2005) Chemistry andmineralogy of outcrops at Meridiani Planum. Earth PlanetSci Lett 240:73–94.
Delhaye, M. and Dhamelincourt, P. (1975) Raman microsprobeand microscope with laser excitation. J Raman Spectrosc3:33–43.
Delhaye, M., Barbillat, J., Aubard, J., Bridoux, M., and DaSilva, E. (1996) Instrumentation. In Raman Microscopy-Developments and Applications, edited by G. Turrell and J.Corset, Academic Press, London; pp 52–173.
Dhamelincourt, P. (1979) Etude et realisation d’une micro-sonde a effet Raman–quelques domaines d’application.Unpublished. Thesis, Universite des sciences et Techniquesde Lille, 200 pp.
Dubessy, J., Caumon, M.C., Rull, F., and Sharma, S.(2012). Instrumentation in Raman spectroscopy: ele-mentary theory and practice. In Raman SpectroscopyApplied to Earth Sciences and Cultural Heritage, editedby J. Dubessy, M.C. Caumon and F. Rull; EMU Notes inMineralogy, V. 12; European Mineralogical Union andthe Mineralogical Society of Great Britain and Ireland,London; pp 83–165.
Edwards, H.G.M. and Chalmers, J.M. (2005) Practical Ra-man spectroscopy and complementary techniques, in Ra-man spectroscopy in archaeology and art history. RSCAnalytical Spectroscopy Monographs, Cambridge, UK, pp41–67.
Edwards, H.G., Vandenabeele, P., Jorge-Villar, S., Carter, E.,Rull Perez, F., and Hargreaves, M.D. (2007) The Rio TintoMars analogue site: an extremophilic Raman spectroscopicstudy. Spectrochim Acta A Mol Biomol Spectrosc 68(4):1133–1137.
Ellery, A. and Wynn-Williams, D. (2003) Why Raman spec-troscopy on Mars?—a case of the right tool for the right job.Astrobiology 3:565–579.
ESA Progress Letter Number 3, 2004. Pasteur InstrumentPayload for The ExoMars Rover Mission. 30 January 2004.
ESA Aurora Exploration Program. (2008) ExoMars ScientificPayload Requirements, Document, EXM-PL-RSD-ESA-00001 Issue 2, Rev. 0. Available online at www.esa.int/esaMI/Aurora/index.html
ExoMars Payload: confirmation of the payload suite followingrestructuring of the mission. (2009) Document ESAPB_HME(2009) 45.REV.1.1, May 14, 2009.
Fernandez-Remolar, D., Morris, R., Gruener, J.E., Amils, R.,and Knoll, A.H. (2005) The Rio Tinto Basin, Spain: miner-alogy, sedimentary geobiology, and implications for inter-pretation of outcrop rocks at Meridiani Planum, Mars. EarthPlanet Sci Lett 240:149–167.
Ferrando, S., Galan, M., Thiele, H., Glier, M., and Goepel,M. (2010) Innovative optical techniques used in the Ramaninstrument for Exomars. In International Conference onSpace Optics, ICSO 2010 4–8 October 2010 Rhodes,Greece.
Ferraro, J.R. and Ziomek, J.S. (1969) Introductory GroupTheory and Its Application to Molecular Structure, PlenumPress, New York; 291 pp.
Foucher, F., Lopez-Reyes, G., Bost, N., Rull-Perez, F., Ruess-mann, P., and Westall, F. (2013) Effect of grain size dis-tribution on Raman analyses and the consequences for in situplanetary missions. J Raman Spectrosc 44:916–925.
Frost, R.L., Weier, M.L., Kloprogge, J.T., Rull, F., and Frias,M. (2005) Raman spectroscopy of halotrichite from Jaroso,Spain. Spectrochim Acta A 62:66–180.
Frost, R.L., Wain, D.L., Reddy, B.J., Martens, W., Martinez-Frias, J., and Rull, F. (2006) Sulphate efflorescent mineralsfrom El Jaroso Ravine, Sierra Almagrera, Spain - A scanningelectron microscopic and infrared spectroscopic study. J NearInfrared Spectrosc 14:167–178.
Frost, R.L., Weiera, M., Martinez-Frias, J., Rull, F., and Reddy,J. (2007) Sulphate efflorescent minerals from El Jaroso Ra-vine, Sierra Almagrera—an SEM and Raman spectroscopicstudy. Spectrochim Acta A Mol Biomol Spectrosc 66:177–183.
Gasnault, O., LeMouleic, S., Herkenhoff, K.E., Bridges, N.,Rapin, W., Langevin, Y., Mangold, N., Maurice, S. Wiens,R., Pinet, P., Newsom, H., and the ChemCam Team. (2015).SuperCam Remote Micro-Imager on Mars 2020. In Lunarand Planetary Science Conference, Houston, TX, USA.XLVI:2990.
Gonzalez-Toril, E., Martınez-Frıas, J., Gomez Gomez, J.M.,Rull, F., and Amils, R. (2005) Iron meteorites can supportthe growth of acidophilic chemolithoautotrophic microor-ganisms. Astrobiology 5:406–414.
Jessberger, E.K. and Castellucci, E.M. and the Gentner team.(2003) GENTNER – a Miniaturised Laser Instrument forPlanetary in-situ Analysis. Call for Ideas: Pasteur InstrumentPayload for the ExoMars Rover Mission. CI-Pasteur-13.
Klingelhofer, G., Morris R.V., Bernhardt, B., Schroder,C.,Rodionov, D.S., de Souza Jr. P.A., Yen, A., Gellert, R., Ev-lanov, E.N., Zubkov, B., Foh, J., Bonnes, U., Kankeleit, E.,Gutlich, P., Ming, D.W., Renz, F., Wdowiak, T., Squyres,S.W., and Arvidson, R.E. (2004) Jarosite and hematite atMeridiani Planum from Opportunity’s Mossbauer spectrom-eter. Science 306:1740–1745.
Klingelhofer, G., Rull, F., Venegas, G., Gazquez, F., andMedina, J. (2016) Mossbauer and Raman spectroscopicin situ characterisation of iron-bearing minerals in Mars Ex-ploration and cultural heritage. Chapter 3, In Redox-active
652 RULL ET AL.
Dow
nloa
ded
by 1
57.8
8.13
9.13
3 fr
om w
ww
.lieb
ertp
ub.c
om a
t 03/
25/1
9. F
or p
erso
nal u
se o
nly.

Minerals: Properties, Reactions and Applications in NaturalSystems and Clean Technologies, edited by I.A.M. Ahmedand K.A. Hudson-Edwards; EMU Notes in Meneralogy, V.16; European Mineralogical Union and the MineralogicalSociety of Great Britain and Ireland. DOI: 10.1180/EMU-notes.17.3.
Landsberg, G., and Mandelstam, L. (1928) A novel effect oflight scattering in crystal. Naturwissenchaften 16:557–558.
Lewis, I.R., and Edwards H.G.M. (2001) Handbook of RamanSpectroscopy: From the Research Laboratory to the ProcessLine, Marcel Dekker, New York.
Long, D.A. (1977) Raman Spectroscopy, McGraw-Hill Inter-national Book Company, New York.
Long, D.A. (2002) The Raman Effect: A Unified Treatment ofthe Theory of Raman Scattering by Molecules, John Wiley &Sons, Ltd. Chichester, UK.
Lopez-Reyes, G. (2015) Development of algorithms andmethodological analyses for the definition of the operationmode of the Raman Laser Spectrometer Instrument. Thesis,University of Valladolid, January-2015.
Lopez-Reyes, G., Rull, F., Catala, A., Sanz, A., Medina, J.,Hermosilla, I., and Lafuente, B. (2012) A simple statisticalmethod for the pseudo-quantification of mineral phaseswithin the ExoMars Raman RLS instrument. In GeoRaman2012. Nancy.
Lopez-Reyes, G., Rull, F., Venegas, G., Westall, F., Foucher,F., Bost, N., Sanz, A., Catala-Espı, A., Vegas, A., Hermosilla,I., Sansano, A., and Medina, J. (2013a) Analysis of the sci-entific capabilities of the ExoMars Raman Laser Spectro-meter instrument. Eur J Mineral 25:721–733.
Lopez-Reyes, G., Catala, A., and Rull, F. (2013b) SPDS-RLS-E2E test report 1.0, November 28, 2013.
Martinez-Frıas, J., Lunar, R., Rodriguez-Losada, J.A., Delga-do, A., and Rull, F. (2004) The volcanism related multistagehydrothermal system of El Jaroso (SE Spain): implicationsfor the exploration of Mars. Earth Planet Space 56:v–viii.
Maurice, S. and Rull, F. (2003) Exlibris: EXomars laser in-duced breakdown/Raman integrated spectrometers. Call ForIdeas Pasteur Instrument Payload For The Exomars RoverMission.
McCreery, R.L. (2000) Raman Spectroscopy for ChemicalAnalysis. Wiley-Interscience, John Wiley & Sons, Inc., NewYork; 420 pp.
Musso, F. (2013) SPDS and RLS bread boards E2E test est-upand test plan description 1.0.
Paul, S. (2013) SPDS-RLS combined BB test procedure (EXM-RM-TRR-KT-004).
Pelletier, M.J., editor. (1999) Analytical Applications of RamanSpectroscopy, Blackbell Science, Paris.
Popp, J. and Schmitt, M. (2004) Raman spectroscopy breakingterrestrial barriers! J. Raman Spectrosc 35:429–432.
Popp, J. and Thomas, N. (2003) Extended-MIRAS: the instru-mental approach for the in situ search of traces of extinct andextant life on Mars. Call for ideas pasteur instrument payloadfor the exomars rover mission.
Poulet, H. and Mathieu, J.P. (1970) Spectres de vibration etsymetrie des cristaux, Gordon and Breach, Paris.
Raman, C.V. and Krishnan, K.S. (1928) A new type of sec-ondary radiation. Nature 121:501–502.
Rocard, M.Y. (1928) Les nouvelles radiations diffussees.Comptes Rendus 186:1107.
Rogero, C., Gonzalez-Toril, E., Martinez-Frias, J., Rull, F., andAmils, R. (2007) Surface composition evolution of Toluca
because of the action of the bacteria: X-ray photoelectronspectroscopy study. Astrobiology 7:528–529.
Rosasco, G.J. (1980) Raman microprobe spectroscopy. In Ad-vances in Infrared and Raman Spectroscopy, edited by R.J.H.Clark and R.E. Hester, Vol. 7, Chichester, Wiley Heydon, pp223–282.
Rull, F. (2012) The Raman effect and the vibrational dynamicsof molecules and crystalline solids. In ‘‘Raman SpectroscopyApplied to Earth Sciences and Cultural Heritage, edited byJ. Dubessy, M.C. Caumon, and F. Rull; EMU Notes inMineralogy, V. 12; European Mineralogical Union and theMineralogical Society of Great Britain and Ireland, London;pp 1–58.
Rull, F. and Martinez-Frias, J. (2003) Identification of calcitegrains in the Vaca Muerta mesosiderite by Raman spectros-copy. J Raman Spectrosc 34:367–370.
Rull, F. and Martinez-Frıas, J. (2006) Raman spectroscopy goesto mars. Spectrosc Eur 18:18–21.
Rull, F., Martinez Frias, J., Sansano, A., Medina, J., and Ed-wards, H.G.M. (2004) Comparative micro-Raman study ofthe Nakhla and Vaca muerta meteorites. J Raman Spectrosc35:497–503.
Rull F., Fleischer I., Martinez-Frias J., Sanz, A., Upadhyay, C.,and Klingelhofer, G. (2008) Raman and Mossbauer spectro-scopic characterisation of sulfate minerals from the marsanalogue sites at Rio Tinto and jaroso ravine, Spain. Lunarand Planetary Science XXXIX, No. 1616.
Rull, F., Klingelhofer, G., Sarrrazin, P., Medina, J., Fleischer, I.,Blake, D., Martin Ramos, D. (2010a) Combined Raman-LIBS, Moessbauer and XRD in-situ mineral analysis ofevaporite minerals at rio tinto (SPAIN), Astrobiology ScienceConference. No. 5472.
Rull, F., Sansano A., and Sobron, P. (2010b) In-situ Raman-LIBS analysis of regoliths during AMASE 2008 and 2009expeditions. 41st Lunar and Planetary Science Conference,No. 2731.
Rull, F. Munoz-Espadas, M.J.R., Lunar, R., and Martınez-Frıas,J. (2010c) Raman spectroscopic study of four Spanishshocked ordinary chondrites: Canellas, Olmedilla de Alarcon,Reliegos and Olivenza., Phil Trans R Soc A 368:3153–3166.
Rull, F., Guerrero, J., Venegas, G., Gazquez, F., and Medina, J.(2014) Spectroscopic Raman study of sulphate precipitationsequence in Rio Tinto mining district (SW Spain). EnvironSci Pollut Res 21:6783–6792.
Sansano, A., Lopez-Reyes, G., Medina, J., Rull, F., andAMASE’10 Team. Analysis of Arctic Carbonates Profilesby Raman Spectroscopy using Exomars’s RLS set up inEuropean Planetary Science Congress EPSC-DPS. 2011.Nantes.
Slater, J.B., Tedesco, J.M., Fairchild, R.C., and Lewis, I.R.(2001) Raman spectrometry and its applications to the indus-trial environments—from the research laboratory to the pro-cess line. In Handbook of Raman Spectroscopy, edited by I.R.Lewis and H.G.M. Edwards, Marcel Dekker, Inc., New York;pp 41–144.
Smekal, A. (1923) Zur quantentheorie der dispersion. Natur-wissenschaften 11: 873–875.
Sobron, P., Sobron, F., Eide, U.M., Nielsen, C.J., and Rull F.(2009) Model-based measurements of diffusion of sulfuricacid into water using Raman spectroscopy. Appl Spectrosc63:1382–1388.
Sobron, P., Bishop, J.L., Blake, D., and Rull, F. (2014) NaturalFe-bearing oxides and sulfates from the Rio Tinto Mars an-alog site: critical assessment of VNIR spectroscopy, laser
RAMAN, EXOMARS 653
Dow
nloa
ded
by 1
57.8
8.13
9.13
3 fr
om w
ww
.lieb
ertp
ub.c
om a
t 03/
25/1
9. F
or p
erso
nal u
se o
nly.

Raman spectroscopy and XRD as mineral identification tools.Am Mineral 99:1199–1205.
Squyres, S.W., Arvidson, R.E., Bell, III, J.F., Calvin, W.M.,Christensen, P.R., Clark, B.C., Crisp, J.A., Farrand, W.H.,Herkenhoff, K.E., Johnson, J.R., Klingelhoefer, G., Knoll,A.H., McLennan, S.M., McSween, H.Y., Morris, R.V., Rice,J.W., Rieder, R., and Soderblom, L.A. (2004) In situ evidencefor an ancient aqueous environment at Meridiani Planum,Mars. Science 306:1709–1714.
Steele, A.A., Amundsen, H.E.F., Conrad, P.G., Benning, L., andFogel, M. (2008) Arctic Mars Analogue Svalbard Expedition(AMASE) 2007. Lunar and Planetary Science XXXIX, No.2368.
Szymanski, H.A. (1967) Raman spectroscopy: Theory andPractice. Plenum Press, New York.
Turrell, G., Delhaye, M., and Dhamelincourt, P. (1996) Char-acteristics of Raman microscopy. In Raman Microscopy-Developments and Applications, edited by G. Turrell and J.Corset, Academic Press, New York; pp 27–49.
Vago, J.L., Gardini, B., Kminek, G., Baglioni, P., Gianfiglio,G., Santovincenzo, A., Bayon, S., and van Winnendael, M.(2006) ExoMars – Searching for life on the red planet. ESABulletin, European Space Agency 126(May):16–23.
Vago J.L, Westall F., Pasteur Teams, Landing Site SelectionWorking Group, and Other Contributors. (2017) Habitabilityon early Mars and the search for biosignatures with theExoMars Rover. Astrobiology 17:471–510.
Venegas, G. (2014) Raman study of sulphates formed by hy-drothermal, evaporitic and weathering processes in the southeast of Spain: implications for the exploration of Mars.Thesis, University of Valladolid.
Wang, A., Haskin, A.L., and Cortez, E. (1998) A Ramanspectroscopic sensor for in situ mineral characterization onplanetary surface. Appl Spectrosc 52:477–487.
Wang, A., Haskin, L.A., Lane, A.L., Wdowiak, T.J., SquyresS.W., Wilson, R.J., Hovland, L.E., Manatt, K.S., Raouf, N.,and Smith, C.D. (2003) Development of the Mars MicrobeamRaman Spectrometer (MMRS). J Geophys Res 108(E1):5005–5025.
Wilson, E.B., Decius J.C., and Cross P.C. (1955) MolecularVibrations: The Theory of Infrared and Raman VibrationalSpectra. McGraw Hill Co., New York.
Address correspondence to:Fernando Rull
Unidad Asociada UVa-CSIC al Centro de AstobiologıaUniversity of Valladolid
Facultad de CienciasCampus Miguel Delibes 8
Valladolid 47002Spain
E-mail: [email protected]
Submitted 23 July 2016Accepted 22 March 2017
Abbreviations Used
AIT¼ assembly, integration, testingALD¼ analytical laboratory drawer ()
BB¼ bread boardCCD¼ charge-coupled device
CLUPI¼ close-up imagerCT¼ calibration targetEH¼ electrical harness
EQM¼ engineering and qualification modelFEE¼ front-end electronics
FPGA¼ Field Programmable Gate ArrayGCMS¼ gas chromatograph mass spectrometryICEU¼ Instrument Control and Excitation UnitIDAT¼ Instrument Data Analysis Tool
IDB¼ instrument databaseiOH¼ internal Optical Head
IR¼ infraredOH¼ optical harness
RLS¼Raman Laser SpectrometerROCC¼ rover operations control center
SHG¼ second harmonic generatorSNR¼ signal-to-noise ratio
SPDS¼ sample, processing, and distribution subsystemSPU¼ spectrometer unitTEC¼ thermoelectric coolerTRF¼ time resolved fluorescence
654 RULL ET AL.
Dow
nloa
ded
by 1
57.8
8.13
9.13
3 fr
om w
ww
.lieb
ertp
ub.c
om a
t 03/
25/1
9. F
or p
erso
nal u
se o
nly.