the r and omegahat - oxford statisticsripley/r-omega.pdf · xml (extensible markup language) is the...
TRANSCRIPT

The R and Omegahat
Projects in Statistical Computing
Brian D. Ripley
RSS Statistical Computing Section, 21 November 2001
http://www.stats.ox.ac.uk/∼ripley

Outline
• Statistical Computing
– History
– S & R
– The Omegahat Project
• Applications and Interfaces
– Web Servers
– Embedding — Medieval Chant, Dynamic Graphics
– Databases
• The Future?
A useful reference is the DSC-2001 proceedings athttp://www.ci.tuwien.ac.at/Conferences/DSC-2001/Proceedings/

Statistical Computing and S
Scene-setting: Statistical Computing
1980
Mainly Fortran programming, or PL/I (SAS).Batch computing (SAS, BMDP, SPSS, Genstat) with restricted range ofplatforms.
Some small interactive systems (GLIM 3.77, Minitab).
Very poor interactive graphics (2400 baud to a Tektronix storage tube if youwere lucky). Flatbed and drum plotters, microfilm for publication-qualityoutput off-line.
Mainly home-brew solutions in research. (GLIM macros?)

1990
PCs become widespread, but FPUs still uncommon. Sun etc workstationsavailable for researchers, and for teaching in a few places.
Graphics could be pretty good (postscript printers, ca1000 × 1000 pixelscreens), but often was not, and mono text terminals were still widespread.
C was beginning to be used, as more portable than Fortran. (Few PC Fortrancompilers then and now.)
Still SAS, SPSS etc as batch programs.
S beginning to be make an impact on research and teaching.
2001
Little spread in machine speed (min 800MHz, max 2GHz), fast FPUs areuniversal.
Colour everywhere, usually 24-bit colour.
The video-games generation is now at university.
Few people would dream of writing a complete program for a research idea:prototype and distribute in a higher-level language such asS or Matlab orGauss or Ox or. . . .
Fortran is still used in scientific computing, but C or C++ is preferred, andJava has its advocates. SAS lives on as pseudo-batch program.
Lots of specialized tools are widespread, such as Perl, Python, Webbrowsers.
XML (eXtensible Markup Language) is the flavour of the year.
Scene-setting: The ‘S’ Language
Largely the work of one person, Dr John M. Chambers of Bell Laboratories(formerly AT&T, now Lucent Technologies).
Awarded the prestigious 1998Association for Computing Machinery Awardfor Software Systems for, in the words of the citation,
the S system, which has forever altered how people analyze,visualize, and manipulate data.
For the last decade it has been the major vehicle for the delivery of newstatistical methodology to end users.
S has a long history: the GR-Z graphics system goes back to 1976. JMCis now a Bell Labs Fellow, and is working onOmegahat, so that can beconsidered the successor toS.

S History
The names have changed (‘New S’ and ‘QPE’ came and went) but theflavours ofS are now known mainly by the colours of the covers of thebooks co-authored by Chambers.
S1 1984 brown macro-based extension languageS2 1988 blue user-written extensions as first-class objectsS3 1991 white classes, some statistical functionalityS4 1998 green more rigorous class system
All were Unix programs written in C and Fortran.
S-PLUS R© was first produced in 1988 by a start-up in Seattle calledStatis-tical Sciences which in 1993 acquired exclusive marketing rights toS andmerged withMathSoft. In 2001 they demerged and becameInsightful.
S is not thought of by its developers as a statistical system, rather asaninteractive environment for data analysis and graphics, a system withinwhich to do statistics.
S-PLUS has been available for a limited range of Unix platforms and DOSand then Windows. It was not available for Linux until 1998, and never forMacintoshes. Current versions are based on S4.
S-PLUS is very widely used for teaching statistics at graduate level. Someof the early enthusiasts were earth scientists, and it has been used forservice teaching. It has had less impact for mainstream undergraduateteaching, despite radical approaches like Nolan & Speed (2000)Stat Labs:Mathematical Statistics through Applications.
S-PLUS is now pretty successful in several commercial sectors (finance,pharmaceuticals, manufacturing). A recent push is to Web-based delivery(StatServer R© andS-PLUS Analytic Server) with planned moves towardsdata mining.
What is R?

R History
R is a system originally written by Ross Ihaka and Robert Gentleman of theUniversity of Auckland (so the naming is clear) in about 1994. To the userit looks like a dialect of theS language, but the internal implementationis based on ideas from Scheme (a member of the LISP family). It is ‘notunlike’ S3, and becoming more likeS4.
Probably this started as a research project, but versions were used at Auck-land for elementary classes, on Macintoshes with 2Mb of memory.
By 1997 other people had become involved, and acore team had been setup with write access to the source code. (No one kept records of who joinedwhen.) There was a Windows version, and Linux users pushed developmentforward, there being noS-PLUS version available for Linux.
I became involved in 1998, and a member of the core team in Jan 1999.
The first non-beta version ofR, 1.0.0, was released on 29 Feb 2000. Thereare several releases a year (probably six in 2001).
Where is R now?
It is a system available as source code (atwww.r-project.org) that com-piles on almost all current Unix and Linux systems, and has binary versionsfor the major Linux distributions (Red Hat, SuSE, Debian, Mandrake),FreeBSD, MacOS X and 32-bit Windows and classic Macintosh (which alsoruns on MacOS X).
It is distributed under GPL2 (the GNU Public Licence).
The core system is fairly small but can be extended bypackages, 10 of whichship withR and about 150 are available (13 ‘recommended’) from CRAN(cran.r-project.org and mirrors). Collectively these cover a wide rangeof statistical functionality, mainstream and oddball.

R vs S-PLUS
The two systems co-exist, uneasily at times.
• S-PLUS is commercial.R is freely distributable.
• R is much smaller and runs on less powerful machines. On Windowsit fits on four floppies and (I’m told) runs on an 8Mb Windows 95machine.
• S-PLUS is monolithic:R has a small core plus many extensions.
• S-PLUS on Windows has a ‘menus and dialog boxes interface’.Rdoes not, and although there are means to program one, in C, Tcl/Tkor Java, they are laborious. [Demos by PD]
• Their performance is about equal, butR is much more tolerant ofbadly-written code that can makeS-PLUS crawl.
• There is not much to choose in quality these days. I suspectR hasmore bugs, but they will be fixed faster by subject-matter experts.
• Both have 2D graphics of very high quality.
• R is currently missing the rich facilities ofS for multi-panel plots(Trellis graphics) but alpha versions are available.
• But both are poor on 3D graphics and dynamic and interactive graph-ics. S-PLUS on Windows is better than on Unix, and an add-on forRon Windows is under development. [Rgl by Duncan Murdoch: Demolater]
It seems clear that the research emphasis in statistical computing has shiftedfrom S to R: John Chambers is now a member of theR core team. Thefuture looks like collaboration rather than competition.
What is Omegahat?
The Omegahat Language
Instead ofS version 5, John Chambers and his colleague Duncan TempleLang in 1998 started another track, a language called Omega. This aroseout of discussion with (some of) theR developers and Luke Tierney onweb-based software and distributed computing.
Thehat was a contribution of Bill Venables to give a statistical flavour.
The Omegahat language (www.omegahat.org) is an interactive environ-ment, effectively an interactive front-end to Java. It seems to have a handfulof users.
The Omegahat project has also a range of Java packages implementingmethods of interest in statistical applications.

The Omegahat Project
The aims of the project are wider, to provide a vehicle for collaboration instatistical computing, particularly to provide re-usable components.
As such it includes the wholeR core team, theS and XLISP-STAT devel-opers and several other people with cognate interests.
There is also a range of inter-system interfaces, for example betweenRor S and Java (of course), Perl, Python, Xalan, Netscape, Gnumeric andPostgreSQL. Also, a CORBA interface forR and forS.
The project is also an umbrella, at present for one sub-project on interfacesto DBMSs.
Omegahat uses a new-BSD licence that is more permissive than GPL2.
Applications and Interfaces

What is R being used for?
With a freely-distributable product, it is hard to know! However, users tendto ask for help, and a few contribute.
One of my main motivations for being involved is a (perhapsthe) major use,to provide a first-class statistical system to students and researchers in thethird world.
There are now many examples ofR being used for large-scale data analysis.It was used for election forecasting in Austria and in the UK (by DavidFirth). My group use it to analyse 100Mb brain images.
There are several applications in gene-expression arrays, at least two ofwhich are commercial systems built onR, and one,sma, is available fromCRAN.
It is clear that researchers in many commercial companies are buildingsystems aroundR.
Web-based Statistical Teaching
There are two harnesses,Rcgi (Mike Ray, U. East Anglia) andRweb (JeffBanfield, Montana State), to runningR sessions from Web browsers. Bothprovide a simplified teaching interface.
Rweb provides ‘a set of point and click modules that are useful for introduc-tory statistics courses and require no knowledge of theR language’.
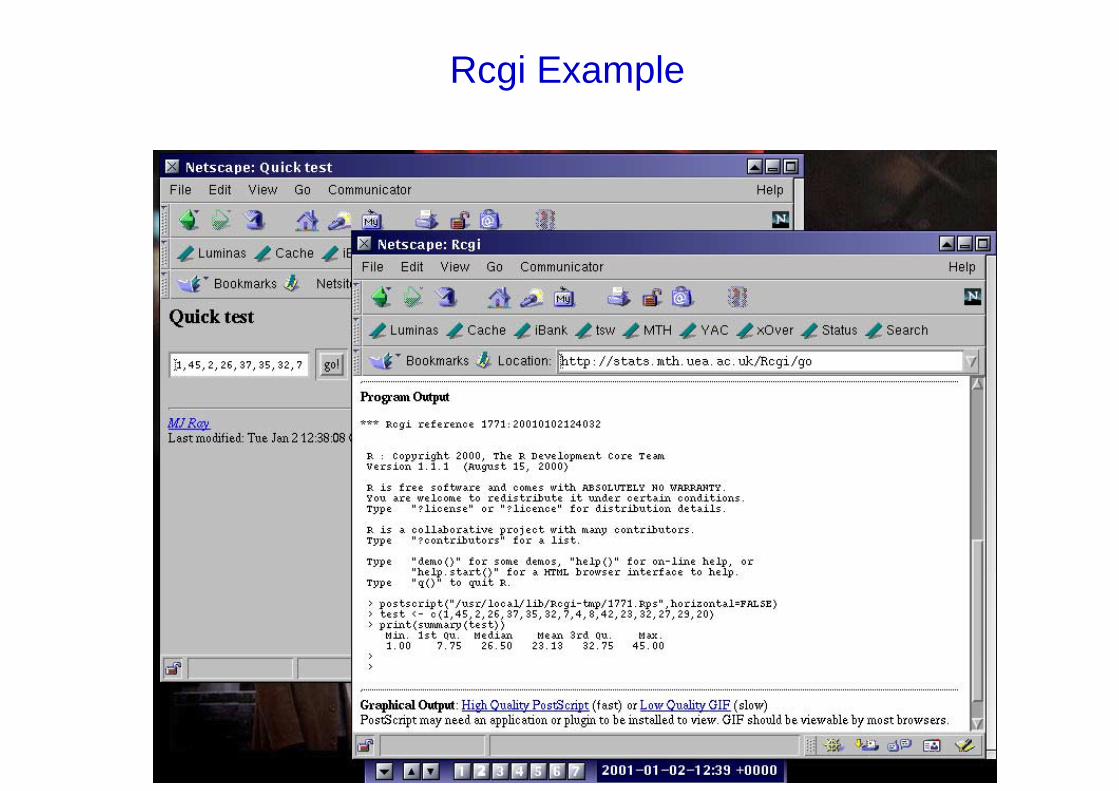
Rcgi Example
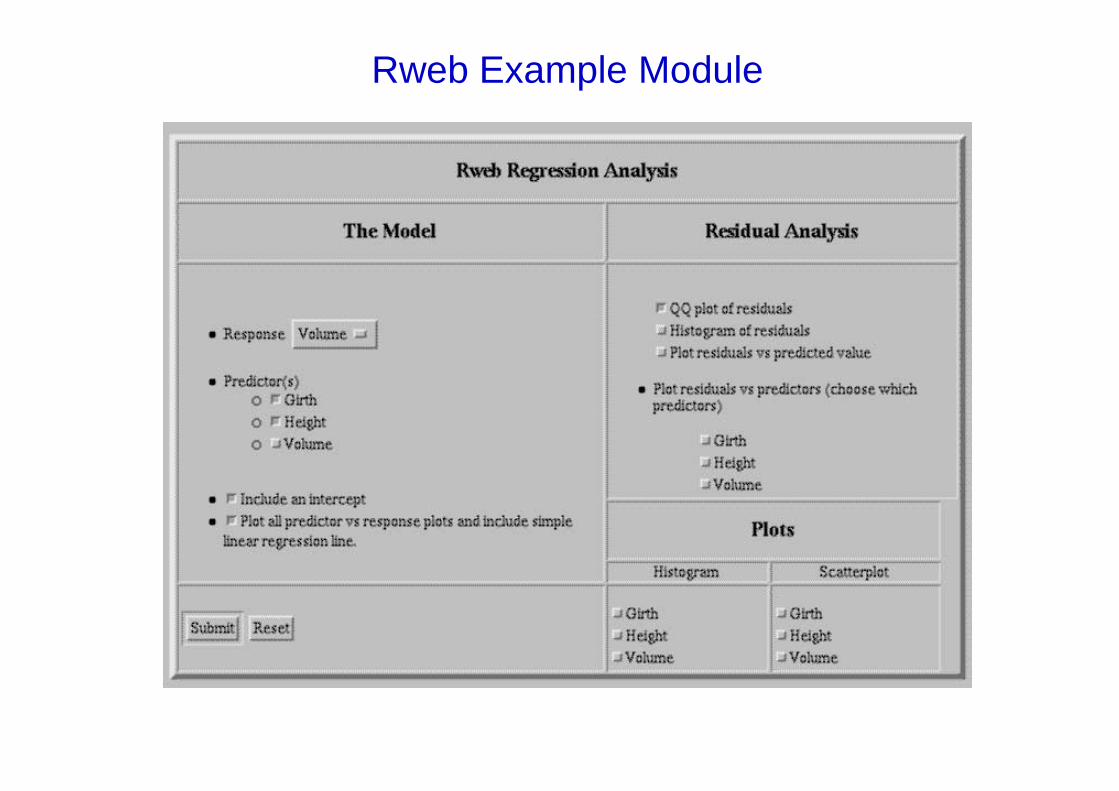
Rweb Example Module
Embedding
Embedding can be taken much, much, further.
It is most advanced on Windows, where Thomas Baier’s DCOM interfaceallows R to be called from Excel, Visual Basic,. . . , but there is also aUnix/Linux version ofR as a shared library.
These enableR to do what it does best, statistical analysis and presentationgraphics.
The Omegahat project hasR embedded in Netscape, Gnumeric (a spread-sheet) and PostgreSQL (a DBMS) on Unix/Linux, although I have neverseen a successful demonstration.
Analysing Chant —An Example of R Embedding
Medieval Chant
Musicologists undertaking detailed analyses of manuscripts of WesternChristian liturgical chant dating back to the ninth century CE would wel-come computer assistance. (Emma Hornby & John Caldwell, Faculty ofMusic in Oxford, statistics by Ruth Ripley.)
The early manuscripts employ several different notations, usingneumesrather than notes. There are about twenty-five neumes, plus markings.
There a few thousand known chants with further variations betweenmanuscripts. Ideally one would use optical character recognition to readthem in: exploring the feasibility of that was a (successful) project for aMaster’s student this summer.
At present chants are entered by a point-and-click data entry system writtenin Visual Basic.

Part of a Chant — Original
Two (annotated) verses of a chant, scanned and enhanced.
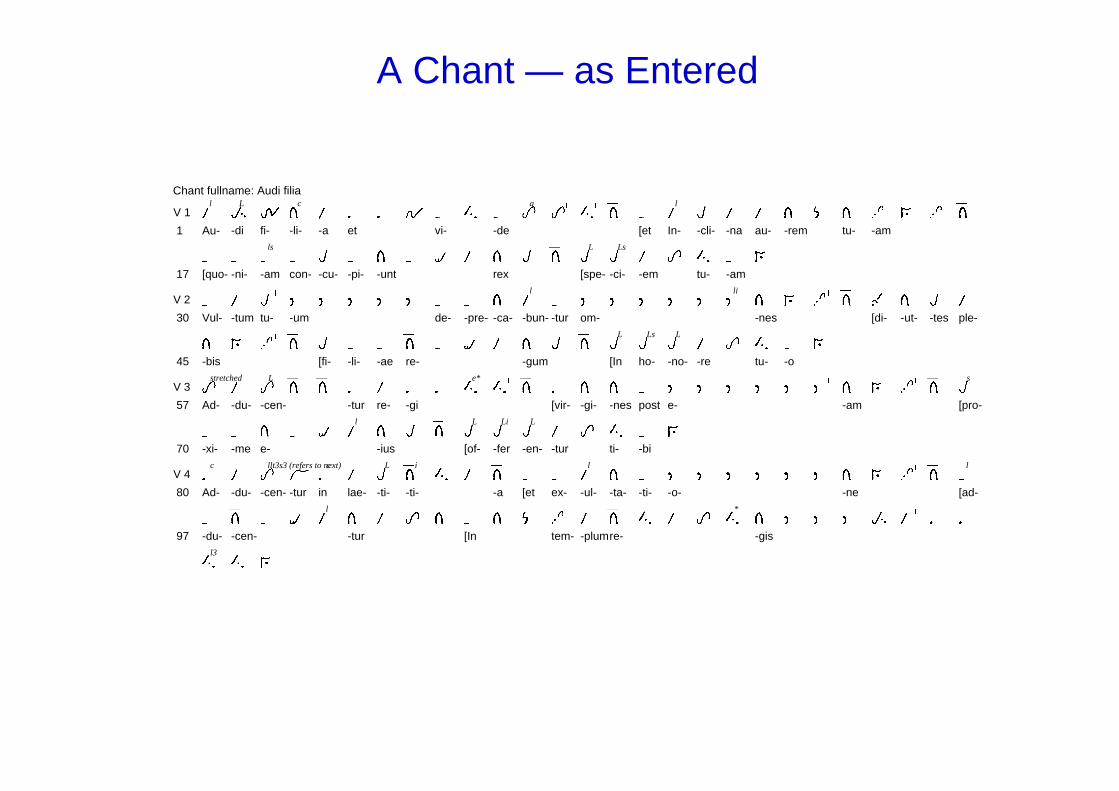
A Chant — as Entered
Chant fullname: Audi filia
V 1
1 Au-:
l
-di ,
L
fi-7
-li-&
c
-a:
et1 1 -
G
vi-8 %
-de8 6
q
6G%G&D
[et8
In-:
l
-cli-)
-na:
au-:
-rem& (
tu-&
-am5 / 5
G&D
17 [quo-8
-ni-8
-am8
ls
con-8
-cu-)
-pi-8
-unt& 8 2 :
rex& ) &
D
[spe-)
L
-ci-)
Ls
-em: 6
G
tu-%
-am8 /
V 2
30 Vul-8
-tum:
tu-)G
-um$ $ $ $ $
G
de-8
-pre-8
-ca-&
-bun-:
l
-tur8
om-$ $ $ $ $ $
li
-nes& / 5
G&D
[di-3
-ut-&
-tes)
ple-:
45 -bis& / 5
G&D
[fi-)
-li-8
-ae8
re-&D
8 2 :-gum& ) &
D
[In)
L
ho-)
Ls
-no-)
L
-re: 6
tu-%
-o8 /
V 3
57 Ad-6
stretched
-du-:
-cen-6
L
&D
&D
-tur1
re-:
-gi1 1 %
e*
%G&D
[vir-1
-gi-&
-nes&
post8
e-$ $ $ $ $ $
G
-am& / 5
G&D
[pro-)
s
70 -xi-8
-me8
e-& 8 2 :
l
-ius& ) &
D
[of-)
L
-fer)
Li
-en-)
L
-tur: 6
ti-%
-bi8 /
V 4
80 Ad-1
c
-du-:
-cen-6
llt3s3 (refers to next)
-tur;
in1
c
lae-:
-ti-)
L
-ti-&Di
%G:
-a&D
[et8
ex-8
-ul-:
l
-ta-&
-ti-8
-o-$ $ $ $ $ $
-ne& / 5
G&D
[ad-8
l
97 -du-8
-cen-&D
8 2 :l
-tur& :
G6G&
[In8G& (
tem-5
-plum:
re-&D
% :G6 %
*
-gis& $ $ $ , :
G1 1
%l3
% /
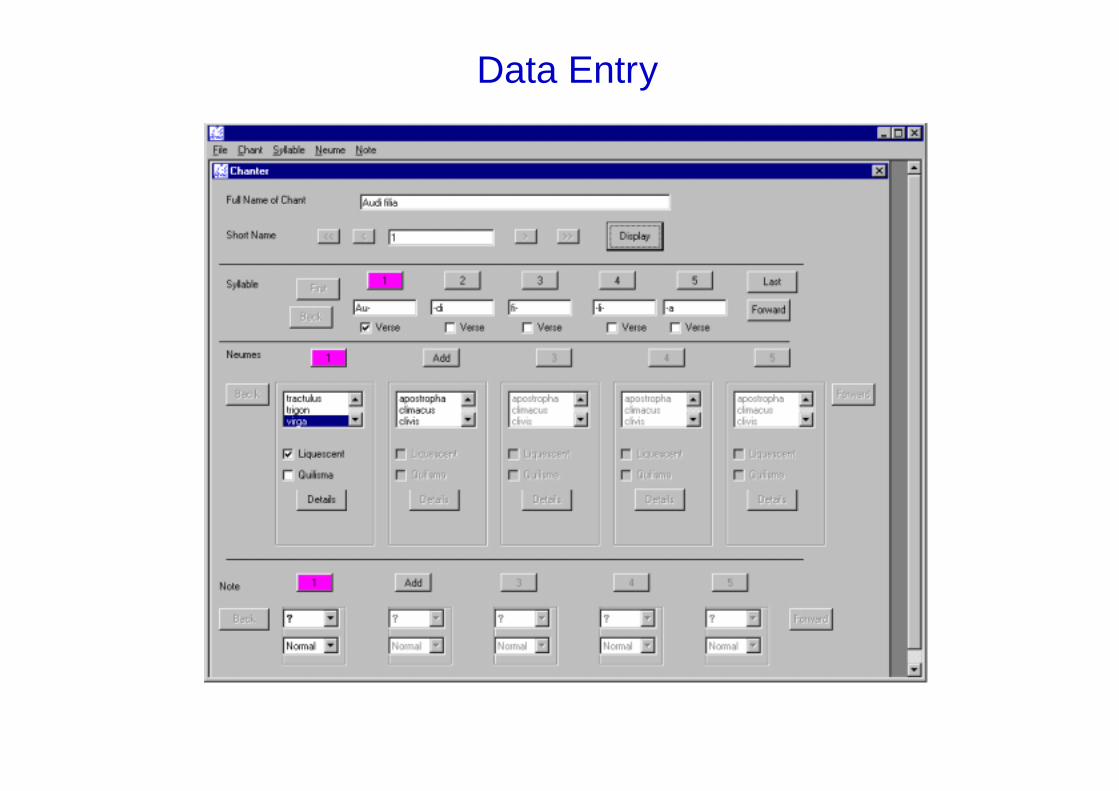
Data Entry
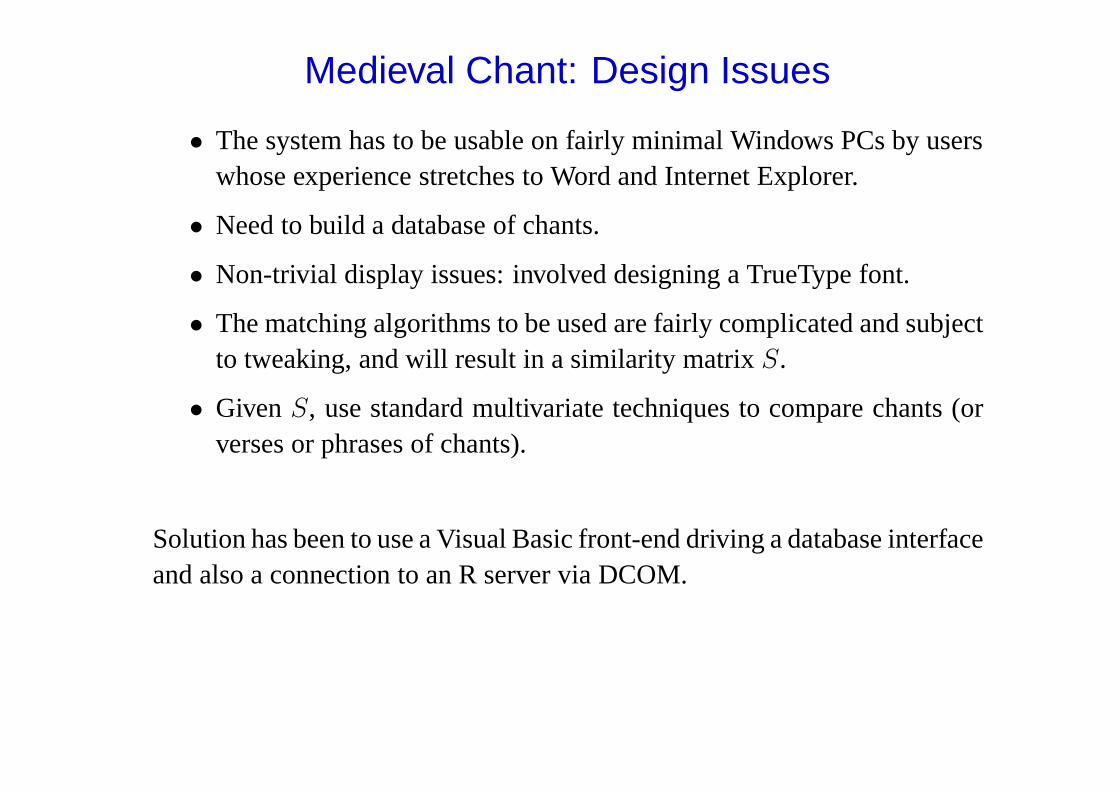
Medieval Chant: Design Issues
• The system has to be usable on fairly minimal Windows PCs by userswhose experience stretches to Word and Internet Explorer.
• Need to build a database of chants.
• Non-trivial display issues: involved designing a TrueType font.
• The matching algorithms to be used are fairly complicated and subjectto tweaking, and will result in a similarity matrixS.
• GivenS, use standard multivariate techniques to compare chants (orverses or phrases of chants).
Solution has been to use a Visual Basic front-end driving a database interfaceand also a connection to an R server via DCOM.

Sample Results: Analysis
4/4
4/1
3/1
2/1
1/4
2/4
3/4
4/3
1/3
2/3
3/3
1/1
3/2
4/2
1/2
2/2
0.0
0.2
0.4
0.6
0.8
1.0
Dendrogram of phrases within the four verses of a chant, with groupshighlighted.
Embedding into R

Dynamic Visualization
We have mentioned thatR is lacking dynamic graphics. The obvious wayto fill the gap is to borrow from another project, and Open Source licensingis intended to make such collaborations easy.
The XGobi system was developed at Bellcore/AT&T in the late 80’s andearly 1990’s and provides an advanced dynamical graphics system. Itruns under X Windows under Unix (and under Windows with an Xserver).Its developers were intending to move to the Gtk+ toolkit (developed forGIMP), and wanted a scripting language.
Out of this cameGGogi (www.ggobi.org, still alpha/beta) which can runstandalone (under Unix or Windows) or be embedded inR (or S-PLUS onUnix) which provides a scripting language.
This is currently incomplete, but one can currently select points and feed theresults back toR, and eventually ‘interesting’ projections will be able to bepassed back.

Ggobi ‘Grand Tour’ Example

Database Interfaces

Databases
or more properly, DBMSs (DataBase Management Systems). Several types
• Text andcsv files.
• Spreadsheets (programs and formats), likeExcel.
• Flat file databases likeDBase.
• Hierarchical databases.
• ‘Lean’ relational databases likeAccess, MySQL, MiniSQL (akamSQL)andSQLite.
• Heavyweight relational databases likeOracle, DB/2, Informix, Sybase,SQL Server, PostgreSQL.
Sometimes the user has a choice of database, but often not.
Standard DBMS Interfaces
Most DBMSs come with amonitor, a text-based client, and some have GUIclients (notably Access, which looks very like a set of spreadsheets).
Almost all have a C or C++ API. And they are almost all different. (I amtold Sybase andSQL Server share a common interface (TDS).)
The actual commands are normally sent in a dialect of SQL (StructuredQuery Language). This has ISO standards, rarely complied with.
Having multiple standards with multiple levels encourages non-compliance.

Statistics and DBMSs
Why would you want to be involved with DBMSs?
• That’s where the data are kept!
• DBMSs may be good ways to store analyses.
• Some DBMSs are designed for fast queries on large databases.
So there are two separate issues:
• Efficiently extracting data from a database (or storing results back in adatabase).
• Using the DBMS to do some of the calculations.
R / S-PLUS Interfaces
There are five DBMS-specific interface packages on CRAN,
RPgSQL for PostgreSQL by Tim KeittRMySQL for MySQL by David James & Saikat DebRoyRmSQL for MiniSQL by Torsten HothornROracle for Oracle by David JamesRSQLite for SQLite by David James
using the C interfaces. All run on Linux, and I have runRMySQL on Windows(with some difficulty). Those by David James have similar user interfaces.
S-PLUS 5.1/6.0 on Unix (and not Linux) have connections to import datafrom Informix, Oracle andSybase databases.
RMySQL andROracle have siblings forS-PLUS.
Cross-Database Solutions
ODBC (Open DataBase Connectivity) is an X/Open and ISO standard fora common interface to relational databases. It is common in the Windowsworld, and has been much enhanced by Microsoft and used as the basis oflater developments (ADO,. . . ). On Windows, spreadsheets and even textfiles are covered.unixODBC has a text driver too.
ODBC drivers are available for all the common DBMSs (not all freely).
CRAN has a packageROBDC (by Michael Lapsley) which interfaces toODBC driver managers on Windows and Linux/Unix.
Two other cross-database solutions worth noting are JDBC (Java. . . ) andPerl DBI. Either could be used via the Omegahat R/S interfaces to thoselanguages.
RS-DBI and Rdbi
Both are commonS-language interface with multiple (planned) backendsinterfacing to different DBMSs. Currently there is a backend toRdbi forPostgreSQL, and toRS-DBI for MySQL, Oracle andSQLite.
More collaboration is needed!
Transparency
One idea is to be able to treat a database table as anR data frame, withindexing operations delegated to the DBMS. See the DSC-2001 proceedingsfor the current state and pros and cons.

The Future?
Where are R and Omegahat going?
This is hard to predict: volunteer projects go where the volunteers want totake them. But some predictions:
• TheS language and (first) theR implementation will gain real object-oriented features.
• There will be a strong push towards establishing a synergy withDBMSs.
• There will be moves to ‘literate data analysis’ with XML as the glue.
• Threads, events, exceptions,. . . ,will at last be tackled seriously.
• Cross-platform support will continue to be taken seriously.

Component-based Systems
• It is no longer credible to apply for large research grants to re-implement statistical methods.
• The commercial sector is finding it hard to cover the costs of re-implementing statistics (although people will pay for interfaces).
• Incremental development based on re-use and enhancement looks verypromising.