the qualitative and quantitative analysis of steviol · pdf filethe primary extracts from the...
TRANSCRIPT

Introduction
With an emphasis on decreasing calorie intake, more and more individuals are focusing on lowering their sugar consumption from foods and beverages.
In response to this, food/beverage manufacturers are now introducing the highly touted sugar substitute rebaudioside A (Reb A), in place of all or most of the sugar in certain foods and beverages. The primary interest in Reb A is the fact that it is a naturally derived sweetener considered to be at least 400 times sweeter than sugar and, therefore, can be added to products in considerably lower concentrations. The use of Reb A has been especially accelerated now that it is considered as Generally Recognized as Safe (GRAS) by the U.S. FDA1. Reb A and stevioside, both steviol glycosides, are the primary extracts from the Stevia rebaudiana plant from South America, particularly from Paraguay. Along with Reb A and stevioside, two secondary steviol glycosides, rebaudioside B (Reb B) and rebaudioside C (Reb C), may also be introduced into food/beverage products as part of the stevia extracts, though both of these are not as sweet.
The Qualitative and Quantitative Analysis of Steviol Glycosides by HPLC- PDA in Energy/Vitamin Drinks
A P P L I C A T I O N N O T E
Author:
Wilhad Reuter
PerkinElmer, Inc. Shelton, CT
Liquid Chromatography

2
HPLC Conditions
ColumnPerkinElmer Brownlee™ 5 µm 250 x 4.6 mm Validated C18 (Part# N9303561)
Mobile Phase32% acetonitrile 68% 10 mM Na2HPO4 buffer; pH 2.7 with phosphoric acid
Analysis Time 25 min.
Flow Rate 1.0 mL/min.
Oven Temp 40 ºC
Detection Flexar PDA Plus at 210 nm; Bandwidth = 5
Injection Volume 5 µL
Table 1. HPLC Method Parameters
As the use of stevia extracts as sweeteners has gained significant momentum, due to its limited availability, there is a growing concern of both adulteration and label claim accuracy in products reported to contain these extracts. With the above in mind, this application highlights the HPLC separation of Reb A, stevioside, Reb B and Reb C, as well as the analysis of these components in a selection of three energy/vitamin drinks. The chromatographic conditions were so chosen as to closely match the latest monograph covering steviol glycosides, including the four listed above, published by the Joint FAO/WHO Expert Commission on Food Additives (JECFA)2. This monograph, specifying the use of HPLC and a UV-based detector, is considered the internationally recognized method for analyzing steviol glycosides in food and beverage products. The USP monograph for Reb A closely parallels the JECFA monograph, though the USP’s chromatographic method prescribes a more complex gradient approach3. Following the JECFA protocol, 210 nm was chosen as the analytical wavelength since steviol glycosides adequately absorb only in this region.
Experimental
Hardware/SoftwareFor all chromatographic separations, a PerkinElmer Flexar™ Binary HPLC system (binary pump, autosampler, vacuum degasser and column oven) was used. Detection was accomplished using a PerkinElmer Flexar PDA Plus™ photodiode array detector and a 50 mm flow cell. All instrument control, analysis and data processing was done via PerkinElmer Chromera™ software.
Method ParametersThe HPLC method parameters are shown in Table 1.
Solvents, Standards and SamplesAll solvents and diluents used were HPLC grade and filtered via 0.45 µm filters. All steviol glycoside standards were obtained from ChromaDex® Inc. (Irvine, CA). These included rebaudioside A (Reb A), rebaudioside B (Reb B), rebaudioside C (Reb C) and stevioside. All standard dilutions were made using 30:70 acetonitrile/water.
Samples included three different energy/vitamin drinks labeled X, Y and Z, purchased at a local grocery store. As drink X was expected to contain a significantly higher concentration of Reb A, drink X was first diluted 1:1 with 30:70 acetonitrile/water. Drinks Y and Z were injected neat. Before injection, all samples and standards were first filtered via 0.45 µm filters to remove small particles.
Results and Discussion
Figure 1 shows the high level standard chromatogram of Reb A, stevioside, Reb C and Reb B, eluting in that order. This 200/100 ppm standard contained 200 ppm Reb A and 100 ppm for the other three analytes. From this stock solution, six additional serial dilutions were made, down to a 1.0/0.5 ppm standard.
A small impurity (IP) was noticed eluting just after Reb B. For quantitative accuracy, where detectable, this impurity was exponentially skimmed off as part of Reb B integrations.
Figure 2 shows the overlay of six replicate 200/100 ppm standard injections, demonstrating the exceptional reproducibility that can be expected.
Figure 1. Chromatogram of upper level standard (200/100 ppm); IP = impurity peak.
Figure 2. Overlay of six replicate 200/100 ppm standard injections.

3
Figure 3 shows the lower level standard (1.0/0.5 ppm) for these analytes. Based on these results, using a S/N limit of 10/1, the LOQs (limit of quantitation) for these analytes were calculated to be 0.5, 0.4, 0.6 and 0.7 ppm, respectively. Two additional matrix peaks (“MP”) were detected but not identified. These peaks’ individual spectral profiles were all considerably different from that of steviol glycosides.
Using Reb A and stevioside as examples, Figure 4 shows the linearity over the 1.0/0.5 ppm to 200/100 ppm concentration range, respectively. Both were found to be exceptionally linear within their ranges. It should be noted that the upper concentrations were chosen to accommodate the expected high-end concentrations within the analyzed samples and that the actual upper limit of linearity may be higher.
Subsequently, using the same chromatographic conditions, three energy/vitamin drinks were analyzed: drink X, drink Y and drink Z. The resulting chromatogram for drink X (1:1 dilution; red) is shown in Figure 5, overlaid upon the 200/100 ppm standard (black). Thereupon, drink X appears to contain predominately Reb A with just a small amount Reb B. This is consistent with the label claim, which lists Reb A as a significant ingredient. The quantitative results are listed in Table 2. An additional matrix peak (“MP”) was detected but not identified, though this peak’s spectral profile was considerably different from that of steviol glycosides.
Figure 3. Chromatogram of lower level standard (1.0/0.5 ppm). MP = matrix peak.
Figure 4. Linearity plots of Reb A (1.0-200 ppm) and stevioside (0.5-100 ppm).
Figure 5. Chromatogram of Drink X diluted 1/1 with 30:70 acetonitrile/water (red) overlaid with 200/100 ppm standard (black).
Figure 6. Chromatogram of drink Y (red) overlaid with 25/12.5 ppm standard (black).
Figure 7. Chromatogram of drink Y spiked 1/1 with 5/2.5 ppm standard.
Figure 6 shows the chromatographic result for drink Y (neat; red) overlaid upon the 25/12.5 ppm standard (black). In this case, there appears to be a slight retention time shift as compared to the standard. This was possibly due to a matrix effect. To further confirm peak identity, drink Y was spiked with standard, by diluting drink Y 1:1 with the 5/2.5 ppm standard. Per Figure 7, the resulting chromatogram shows a perfect overlay of the common analytes, confirming the retention time shift to be a matrix effect. Based on these results, drink Y was shown to contain predominantly Reb A and stevioside, with a smaller amount of Reb C. This is also consistent with the label claim for drink Y to contain steviol extract. The quantitative results are listed in Table 2. Four additional matrix peaks (“MP”) were detected but not identified. These peaks’ individual spectral profiles were all considerably different from that of steviol glycosides.
For a complete listing of our global offices, visit www.perkinelmer.com/ContactUs
Copyright ©2014, PerkinElmer, Inc. All rights reserved. PerkinElmer® is a registered trademark of PerkinElmer, Inc. All other trademarks are the property of their respective owners. 011916_01 PKI
PerkinElmer, Inc. 940 Winter Street Waltham, MA 02451 USA P: (800) 762-4000 or (+1) 203-925-4602www.perkinelmer.com
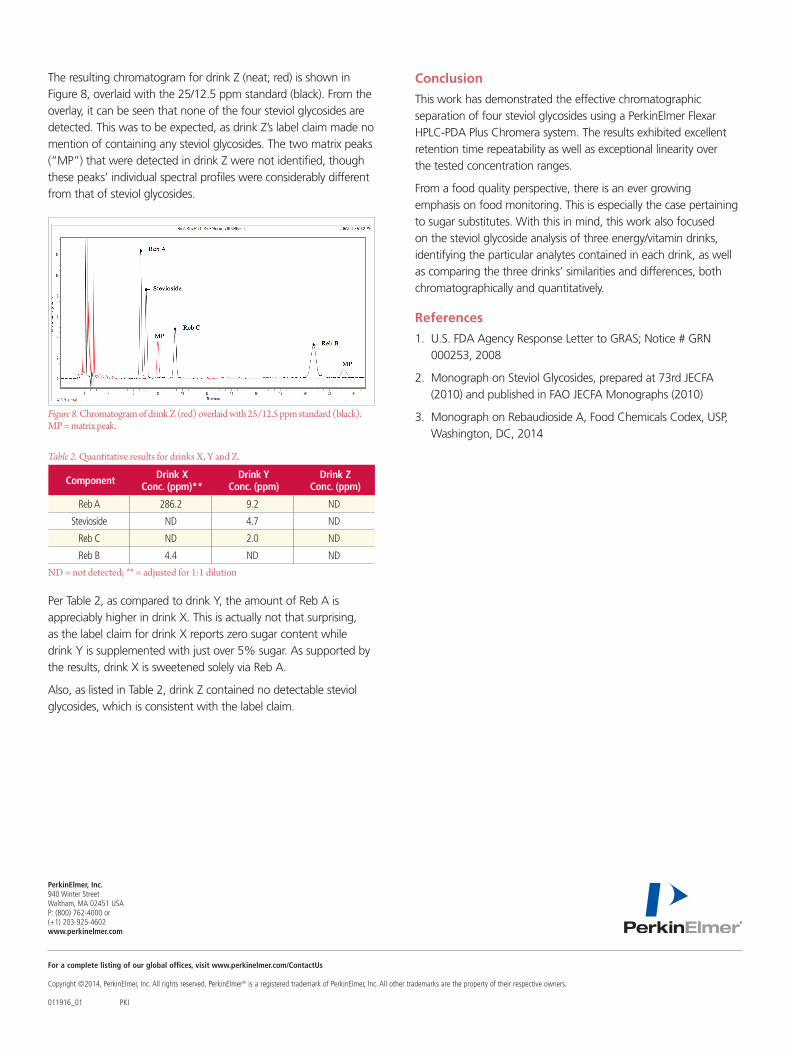
The resulting chromatogram for drink Z (neat; red) is shown in Figure 8, overlaid with the 25/12.5 ppm standard (black). From the overlay, it can be seen that none of the four steviol glycosides are detected. This was to be expected, as drink Z’s label claim made no mention of containing any steviol glycosides. The two matrix peaks (“MP”) that were detected in drink Z were not identified, though these peaks’ individual spectral profiles were considerably different from that of steviol glycosides.
Per Table 2, as compared to drink Y, the amount of Reb A is appreciably higher in drink X. This is actually not that surprising, as the label claim for drink X reports zero sugar content while drink Y is supplemented with just over 5% sugar. As supported by the results, drink X is sweetened solely via Reb A.
Also, as listed in Table 2, drink Z contained no detectable steviol glycosides, which is consistent with the label claim.
Figure 8. Chromatogram of drink Z (red) overlaid with 25/12.5 ppm standard (black). MP = matrix peak.
Component Drink X Conc. (ppm)**
Drink Y Conc. (ppm)
Drink Z Conc. (ppm)
Reb A 286.2 9.2 ND
Stevioside ND 4.7 ND
Reb C ND 2.0 ND
Reb B 4.4 ND ND
Table 2. Quantitative results for drinks X, Y and Z.
ND = not detected; ** = adjusted for 1:1 dilution
Conclusion
This work has demonstrated the effective chromatographic separation of four steviol glycosides using a PerkinElmer Flexar HPLC-PDA Plus Chromera system. The results exhibited excellent retention time repeatability as well as exceptional linearity over the tested concentration ranges.
From a food quality perspective, there is an ever growing emphasis on food monitoring. This is especially the case pertaining to sugar substitutes. With this in mind, this work also focused on the steviol glycoside analysis of three energy/vitamin drinks, identifying the particular analytes contained in each drink, as well as comparing the three drinks’ similarities and differences, both chromatographically and quantitatively.
References
1. U.S. FDA Agency Response Letter to GRAS; Notice # GRN 000253, 2008
2. Monograph on Steviol Glycosides, prepared at 73rd JECFA (2010) and published in FAO JECFA Monographs (2010)
3. Monograph on Rebaudioside A, Food Chemicals Codex, USP, Washington, DC, 2014