the pursuit of long- run economic growth in africa pursuit of long- run economic growth in africa 3...
TRANSCRIPT

1
ONE
The Pursuit of Long- Run Economic Growth in Africa
An Overview of Key Challenges
Haroon Bhorat and Finn Tarp
Historically, the African continent has been largely dismissed as a
case of regional economic delinquency, with the levels of growth nec-essary to reduce poverty and in equality deemed to be consistently unat-tainable. In the last de cade, however, signifi cantly higher levels of economic growth have ushered in a new era to the region, suggesting it may, potentially, serve “as the fi nal growth frontier with the last of the great untapped markets, ripe for rapid growth and development” (Bhorat and others 2015a). Data from The Economist and the Interna-tional Monetary Fund (2011) support these assertions, as six of the fast-est growing economies globally over the period 2001 to 2010 were in Sub- Saharan Africa (SSA hereafter): Angola, Nigeria, Ethiopia, Chad, Mozambique, and Rwanda. This volume specifi cally refers to the fol-lowing six economics as the African Lions: Ethiopia, Ghana, Kenya, Mozambique, Nigeria, and South Africa.

2 Bhorat and Tarp
The 1980s is often referred to as the continent’s lost de cade. The combination of massive external economic shocks; governance failures; under- investment in vital social ser vices; signifi cant macroeconomic imbalances; poor infrastructure; and structural trade defi cits (Devara-jan and Fengler 2012; Collier and Gunning 1999) undermined the early pro gress achieved after in de pen dence from Africa’s colonial mas-ters. Orthodox stabilization and structural adjustment programs domi-nated the policy agenda (Tarp 1993, 2001) and stagnation continued well into the 1990s. The post-2000 African economic boom, in contrast, has been built around a composite of factors, including improved macro-economic policy; high commodity prices; signifi cant improvement in the quality of governance and institutions; technology (mobile phones in par tic u lar); demographic growth; urbanization and the rise of new, dynamic African cities; and, in some cases, better targeted social pol-icy. In turn, these factors, regularly supported by substantial infl ows of foreign aid (Tarp 2015), have enabled the growth momentum on the continent to be maintained.
Not surprising given where African countries found themselves in the mid-1990s, socioeconomic indicators— poverty, in equality, access to social ser vices, institution development, and infrastructure levels— remain weak in Africa (see Arndt, McKay, and Tarp 2016) and typically lag behind developing nations in other regions of the world. There are also concerns related to the sustainability of recent economic per for-mance and socioeconomic advance for vari ous reasons. First, an impor-tant part of this growth has been driven by dependence on extractive resources, which are volatile and subject to exogenous factors. Further, being a capital- intensive sector, there remains limited scope to address the rapidly increasing supply of labor through resource- based develop-ment. Second, emerging labor trends indicate that agriculture’s share of employment is diminishing, with the ser vices sector absorbing a signifi cant share of the labor force (Newman and others 2016a). How-ever, due to low human capital levels, the majority of these workers are employed on the fringes of the economy, working mainly in informal low wage and low productivity jobs. The manufacturing sector in most of these countries is shrinking following a considerable decline in man-ufacturing value added between 1990 and 2000. Third, while in equality

The Pursuit of Long- Run Economic Growth in Africa 3
is notoriously diffi cult to capture, it does appear as if in equality indica-tors are widening through the continent, driven by wage differentials across sectors, differences in human capital levels, and urban and rural splits. Fi nally, many African countries are at dif fer ent stages of demo-graphic transition— shifts from a high fertility, high mortality phase to a low fertility, low mortality state— a state associated with dividends that should, ideally, contribute to economic growth and development, which does not, however, seem to be materializing (Oosthuizen 2015).
A BRIEF MACROECONOMIC OVERVIEW
Africa’s postcolonial growth history may be divided into two distinct phases. The fi rst, between 1965 and 1990, was characterized fi rst by pro-gress and then by dismal growth in the 1980s. More recently, growth has surged. This chapter pres ents a brief overview of key macroeconomic indicators for Africa broadly, and specifi cally for our sample of six Afri-can economies.
Table 1-1 pres ents an overview of infl ation, exchange rates, and cur-rent and fi scal accounts, as well as external debt, for the vari ous African subregions. It is evident that macroeconomic per for mance has signifi -cantly improved across SSA, as demonstrated by infl ation, which dropped from exceptionally high rates in 1990–94 to single- digit values in the two subsequent periods.
Over this period, these economic regions experienced slight ex-change rate depreciation against the US$, but since then, the exchange rates have stabilized closer, possibly, to their equilibrium value. Despite signifi cant currency depreciations, exports have not increased suffi -ciently to improve the current account balances. For example, Kenya experienced what has been termed a clogged “exports engine” (World Bank 2014) as the exports of goods as a percent of GDP declined in the period between the mid-2000s and 2014, while imports of goods con-tinued to increase. However, over this period, Kimenyi and others (2015) note that Kenyan ser vices exports continued to expand, although not suf-fi ciently to offset the widening gap between exports and imports. Over-all, however, current account defi cits within the context of a developing

4 Bhorat and Tarp
nation do not indicate fi scal imprudence, as external funds (that is, es-pecially aid) often supplement domestic resources.
Although the majority of the current fi scal accounts remain nega-tive, they are within a narrow and sustainable range for the dif fer ent regions. It is also apparent that external debt has been relatively well managed, as debt to Gross National Income (GNI) levels has fallen steadily since 1990 for all regions of the continent. This is in part due to debt relief, but is also partially a result of vari ous African economies diversifying their output, resulting in a signifi cant proportion of these states fi nancing investment through (fast- expanding) domestic credit markets rather than through external debt.
TABLE 1-1. Macroeconomic Overview for Africa, 1990–2013
Macroeconomic indicatorPeriod
averagesCentral Africa
East Africaa
North Africa
Southern Africab
West Africa
Infl ation (%) 1990–94 923.05 17.58 11.21 78.5 11.432000–04 28.59 4.43 2.04 21.55 4.772010–13 3.15 4.57 4.94 7.25 5.44
Offi cial exchange rate (LCU per US$, period average)c
1990–94 284.13 174.13 22.22 3.83 253.352000–04 596.83 411.55 36.6 22.06 648.792010–13 553.94 552.12 61.17 243.12 933.39
Current account balance (% of GDP)d
2005–09 22.5 6.67 7.95 5.55 7.212010–12 1.55 7.86 0.78 9.5 11
Fiscal balance (% of GDP) 1990–94 3.82 3.29 2.78 3.5 0.662000–04 1.98 3.88 5.25 2.02 2.662010–12 4.46 2.55 2.74 0.7 2.65
External debt stocks (% of GNI)
1990–94 113.36 86.51 92.58 111.12 116.912000–04 129.74 79.06 67.16 72.69 166.082010–13 24.02 45.75 36.87 32.48 43.51
Source: Bhorat and others (2015a) based on data obtained from World Bank Development Indicators, 2014, and International Money Fund Government Finance Statistics, 2014.
a. Somalia is excluded from East Africa for lack of data.b. Zimbabwe is excluded from Southern Africa because of episodes of hyperinfl ation and
economic crisis.c. LCU = Local currency units relative to the US$. Sao Tome and Principe and Madagascar are
excluded from the exchange rate data due to rapidly depreciating currencies, which will result in distortions for the Southern Africa results.
d. There is no current account data for Africa before 2005.
The Pursuit of Long- Run Economic Growth in Africa 5
Growth within the African Lion states was often accompanied with signifi cant welfare gains. In South Africa and Ethiopia, signifi cant welfare gains were observed, as mea sured by increasing access to social ser vices, improved housing and basic infrastructure, and a reduction in poverty levels. Overall, while table 1-1 paints a positive picture of the state of Africa’s macroeconomic environment, risks arise from po liti cal instability, war and confl ict, and external shocks such as changes to commodity prices, as well as the spread of disease (Bhorat and others 2015a).
STRUCTURAL ECONOMIC TRANSFORMATION
AND INCLUSIVE GROWTH
Along with the rapid economic expansion across Africa in the post-2000 period, the continent experienced quickly rising average income levels, as well as shifts in the composition of output of the vari ous economies. Tables 1-2 and 1-3 provide additional insight into these fundamental changes.
Table 1-2 demonstrates that most regions experienced real annual GDP growth exceeding 4 percent over the 2000 to 2014 period, with the exception of Southern Africa, where growth dipped slightly below this threshold. South Africa, the most dominant economy, experienced contractions in overall growth. As already alluded to, growth accelerated relative to the previous de cade in all regions, including countries such as Ghana and Mozambique. Lastly, we note an increasing trend in real per capita Gross Domestic Product (GDP), except in the North Africa region, which experienced economic and po liti cal turmoil following the social upheaval wrought by the Arab Spring.
While these economic indicators are promising, it is necessary to take a closer look to discuss the overall sustainability of Africa’s economic expansion and assess whether this growth translates into the achieve-ment of Africa’s development objectives of equitable growth and is also reducing poverty. To understand whether growth is sustainable, it is impor tant to come to grips with the drivers of growth. Economic the-ory and cross- country evidence suggest that a more diverse economic

6 Bhorat and Tarp
base— achieved through structural transformation— increases the like-lihood of sustained economic per for mance and growth. Such struc-tural transformation involves the reallocation of labor from low- to high- productivity sectors, and the rate of such structural change can encourage growth signifi cantly. Rodrik (2014) posits that rapid indus-trialization or structural change toward high- productivity sectors can
TABLE 1-2. Real GDP and GDP per Capita in Africa for 1990, 2000, and 2014
Annual average % change
Region Indicator 1990 2000 2014 1990–2000 2000–14
North Africa Total GDP (US$million)
180,909 282,313 383,649 4.6 2.2%
Average GDP per capita (US$)
1,470 2,576 2,588 5.8 0.00
West Africa Total GDP (US$million)
97,388 123,580 294,148 2.4 6.4
Average GDP per capita (US$)
481 545 713 1.3 1.9
East Africa Total GDP (US$million)
34,700 45,860 155,279 2.8 9.1
Average GDP per capita (US$)
453 367 1,933 2.1 12.6
Central Africa Total GDP (US$million)
37,467 39,327 86,648 0.5 5.8
Average GDP per capita (US$)
1,731 2,070 3,233 1.8 3.2
Southern Africa Total GDP (US$million)
222,742 271,265 461,063 2.0 3.9
Average GDP per capita (US$)
2,230 2,653 2,387 1.8 0.8
Source: Word Development Indicators, 2014, and based on updated fi gures from Bhorat and others (2015a).
The Pursuit of Long- Run Economic Growth in Africa 7
help shift countries into middle or upper income status; this follows the notion that modern manufacturing industries exhibit unconditional convergence to the global productivity frontier.
Table 1-3 pres ents the contribution of the vari ous sectors to GDP between 1990 and 2012. We see that the agricultural sector remains a dominant contributor to GDP, particularly in West, East, and Central Africa, although there has been an observable downward trend in agri-culture in most regions. In the African case, where industrialization has taken place, it has generally been dominated by mining rather than manufacturing activities. In fact, in most regions and periods since the 1990s, manufacturing has declined substantially. This weakness in manufacturing represents a key indicator alluding to the vulnerability of the growth and development trajectory of many of Africa’s econo-mies. In contrast, the tertiary ser vices sector has grown to be the largest contributor to GDP for most SSA nations.
Africa’s growth dynamic thus far has been characterized, on aver-age, by a move into resource- based production, with small gains spill-ing over into manufacturing output. Indeed, some of the highest growth has been recorded in low- skilled, low productivity jobs in the urban ser vices sectors of these economies (see Newman and others 2016a). Africa’s transition away from primary sector activities toward tertiary sector activities has, in other words, not resulted in a discernable shift toward a more sustainable growth path. Attempting to quantify the ef-fect of this structural change, McMillan and others (2014) estimate that this restructuring made a sizeable negative contribution to overall eco-nomic growth between 1990 and 2005, by as much as 1.3 percent per annum on average.1 In this sense, their estimates show that labor moved in the wrong direction, becoming less productive. In Nigeria, Ajakaiye and others (2015) also fi nd that the manufacturing sector has become more capital- intensive over time, hampering the capacity of this sector to absorb signifi cant volumes of labor. Rodrik (2014) characterizes this phenomenon as premature deindustrialization, where a signifi cant pro-portion of the population is absorbed into low- productive, informal sec-tor work. This begs the question whether Africa will be able to skip a stage of economic development that all other developing nations have gone through (namely moving from a core, vibrant manufacturing base

TAB
LE 1
-3.
Sect
oral
Bre
akdo
wn
of E
cono
mic
Act
ivity
in A
fric
a (R
egio
nal A
vera
ges),
199
0, 2
000,
and
201
0–12
Perc
ent o
f GD
P
Reg
ion
Sect
or19
9020
0020
1020
1120
1219
90–2
000
% c
hang
e20
00–1
2 %
cha
nge
Nor
th A
fric
aA
gric
ultu
re21
.46
18.8
114
.18
14.3
314
.95
2.65
3.87
Indu
stry
a31
.83
34.4
035
.59
35.6
535
.69
2.58
1.29
Man
ufac
turi
ng15
.17
14.2
813
.87
13.9
312
.89
0.89
1.38
Ser v
ices
46.7
146
.78
50.2
450
.02
49.3
60.
072.
58
Wes
t Afr
ica
Agr
icul
ture
34.9
734
.47
31.2
729
.54
28.8
30.
505.
64In
dust
ry21
.82
23.4
122
.37
24.4
729
.18
1.59
5.77
Man
ufac
turi
ng9.
568.
916.
005.
875.
990.
652.
92Se
r vic
es43
.21
42.1
247
.26
47.1
243
.08
1.10
0.96
Eas
t Afr
ica
Agr
icul
ture
39.9
132
.74
32.6
332
.92
35.9
57.
173.
21In
dust
ry16
.60
16.5
818
.45
18.6
517
.06
0.02
0.49
Man
ufac
turi
ng8.
827.
818.
418.
267.
841.
010.
03Se
r vic
es43
.49
50.6
848
.92
48.4
346
.99
7.19
3.69
Cen
tral
Afr
ica
Agr
icul
ture
30.8
325
.01
32.3
232
.13
39.7
35.
8314
.72
Indu
stry
27.2
638
.49
36.7
137
.90
27.5
911
.23
10.9
0

Man
ufac
turi
ngb
10.9
77.
054.
064.
134.
353.
912.
71Se
r vic
es41
.91
36.5
130
.97
29.9
732
.68
5.40
3.83
Sout
hern
Afr
ica
(wit
h So
uth
Afr
ica)
Agr
icul
ture
18.4
414
.68
12.1
511
.78
9.15
3.76
5.54
Indu
stry
34.6
833
.21
32.8
432
.98
31.7
31.
471.
49M
anuf
actu
ring
17.9
215
.39
14.7
814
.16
11.4
42.
533.
95Se
r vic
es46
.88
52.4
055
.01
55.2
459
.13
5.52
6.72
Sout
hern
Afr
ica
(wit
hout
Sou
th A
fric
a)A
gric
ultu
re19
.59
15.6
414
.84
13.0
212
.63
9.97
3.96
Indu
stry
34.2
333
.34
31.7
833
.11
33.3
232
.14
0.89
Man
ufac
turi
ng17
.44
15.0
914
.71
14.8
314
.28
2.35
0.81
Ser v
ices
46.1
851
.26
53.3
853
.86
54.0
557
.89
5.08
Sour
ce: B
hora
t and
oth
ers (
2015
a) b
ased
on
data
from
the
Wor
d D
evel
opm
ent I
ndic
ator
s, 20
14.
a. In
dust
ry c
orre
spon
ds to
ISIC
div
isio
ns 1
0–45
and
incl
udes
man
ufac
turi
ng (I
SIC
div
isio
ns 1
5–37
). It
com
pris
es v
alue
add
ed in
min
ing,
man
ufac
turi
ng
(als
o re
port
ed a
s a se
para
te su
bgro
up),
cons
truc
tion,
ele
ctri
city
, wat
er, a
nd g
as.
b. M
anuf
actu
ring
and
Ser
vice
s are
subs
ets o
f Ind
ustr
y.

10 Bhorat and Tarp
toward growth) and effectively reap the benefi ts of a mining- and services- led growth path in the pursuit of long- run growth and employment creation. On current evidence, it would appear that a “manufacturing- absent” growth and development path is not a sustainable path to pros-perity for the African continent.
Growth, Poverty, and In e qual ity Interactions in Africa
It is widely acknowledged that economic growth is essential for poverty reduction. Evidence suggests that the absolute value of the elasticity of poverty with re spect to economic growth ranges between 1 and 5 (Ravallion and Chen 1997), meaning that a 1 percent increase in GDP will have the effect of lowering poverty by between 1 and 5 percentage points. This range suggests that economies differ in their ability to trans-late growth into poverty reduction, implying that economic growth is a necessary but insuffi cient condition for rapid poverty alleviation. As will be shown, African elasticity estimates tend to be lower than globally comparable averages in line with Arndt and others (2012), who compare Mozambique and Vietnam and point to the impact of initial structural characteristics.
Another major contributor to less poverty reduction following rapid economic growth is the level of in equality. High and increasing in-equality weakens the effect of growth on poverty (Ravallion 1997; Fosu 2009). Evidence also suggests that the initial level of income in equality within an economy is impor tant in predicting the overall impact of growth on poverty (Ravallion 1997, 2001), where, all else constant, higher levels of initial income in equality are associated with a lower im-pact of growth on poverty. Gini coeffi cients, which mea sure in equality and poverty, recorded for the African continent are high relative to the rest of the world, thus the distribution of income is of par tic u lar impor-tance in our context. Fi nally, the structure and nature of an economy’s growth path will further infl uence poverty and in equality outcomes. Evidence suggests, for example, that growth built on labor- intensive manufacturing is more poverty- reducing and less in equality- inducing than growth in capital- intensive sectors such as mining and fi nancial ser vices (Ravallion and Datt 1996; Khan 1999; Ravallion and Chen 2007).
The Pursuit of Long- Run Economic Growth in Africa 11
This relationship is a cause for concern for the many African econo-mies where “manufacturing- absent” growth, together with a signifi cant emphasis on the natu ral resource sector, characterizes their growth trajectories.
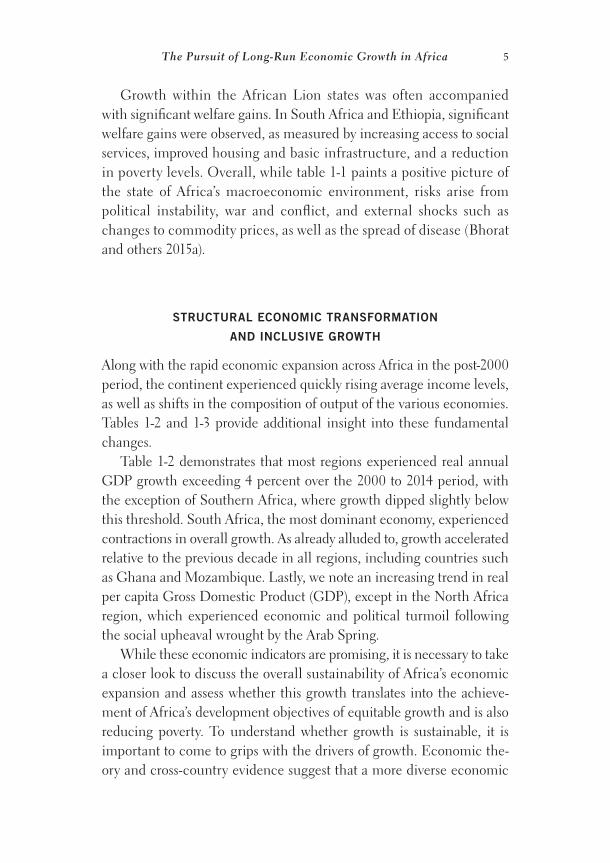
The Growth– Poverty– In equality Nexus in AfricaIt follows from the previous section that Africa’s improvement in mac-roeconomic per for mance has not translated into equally high- impact outcomes in poverty reduction levels. Figure 1-1 shows that, while ex-treme poverty has fallen in the region since the 1990s, almost 50 percent of SSA’s population continues to live below the poverty line. Figure 1-1 also confi rms that poverty in Africa is not falling as rapidly as in South and East Asia.
Figure 1-1 indicates that the proportion of the population living in extreme poverty in the African region, except for North Africa, is approxi-mately 39 to 46 percent, which is noticeably higher than the poverty rates of all other developing regions of the world. Further, the depth of poverty in Africa is also more extreme than in other developing regions. For those living below the poverty line in Africa, the average consumption level is just 70 US cents a day, considerably below that of other regions, which are all close to attaining the US$1 a day level (Africa Pro gress Panel 2014). Hence, excluding North Africa, about two thirds of the population living below the poverty line in Africa are living in extreme poverty.
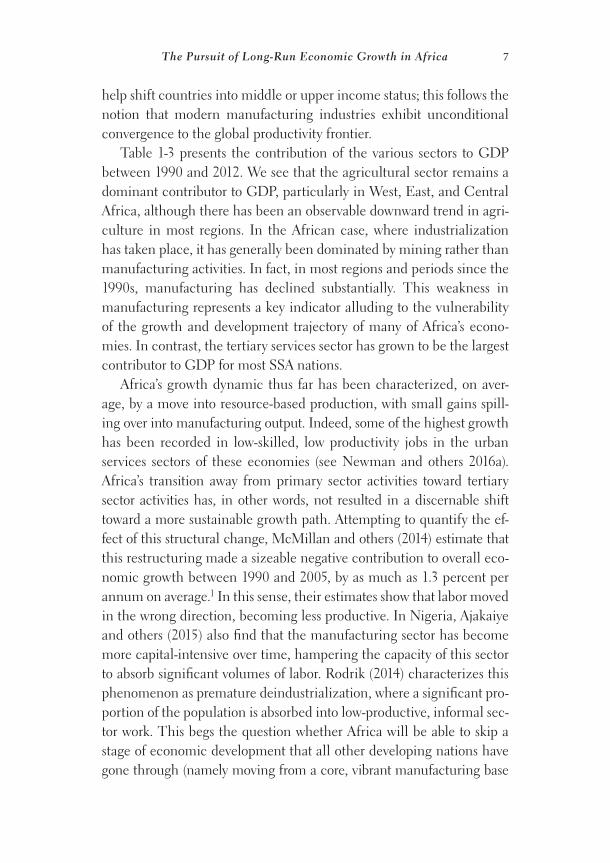
The estimated growth elasticity of poverty, indicating the percentage change in poverty following a percentage change in growth, provides an indication of the poverty- reducing impact of Africa’s growth. Figure 1-2 pres ents Africa’s growth elasticity of poverty for the two de cades since 1990. SSA had an elasticity of 0.7, indicating that growth of 1 percent was estimated to have reduced poverty by only 0.7 percent, as compared with an elasticity of approximately 2 in the rest of the world.
Several key factors help explain this difference in elasticity. In addi-tion to higher population growth and the structural features referred to in Arndt and others (2012), three factors can be noted. First, the higher poverty levels and lower incomes in SSA mean that equal absolute changes in both these indicators translate into smaller and larger changes, respectively, which then arithmetically reduces the growth

12 Bhorat and Tarp
elasticity of poverty for SSA (World Bank 2013). Second, it has been shown that higher initial in equality hampers the poverty reducing power of growth. Fosu (2009) calculates the income– growth elasticities for thirty countries in SSA over the 1977 to 2004 period and reveals sub-stantial variation in the estimates, from 0.63 in Namibia to 1.4 in Ethio-pia. Many African countries exhibit high and increasing levels of in equality. In addition, aggregate evidence indicates that the average Gini coeffi cient for the African continent is 0.44, a value that is higher than that of the developing country average of 0.416 (Bhorat and others 2015a). Ultimately, then, the high initial levels of income in equality in many African economies will serve to reduce the estimated growth– poverty elasticities derived for the region.
Last, it is not only growth that matters, but also the pattern and struc-ture of economic growth within individual economies. Cross- country
FIGURE 1-1. Poverty Headcount Changes from 1981–2008
Source: PovcalNet (World Bank), 2014, based on Bhorat and others (2015a).
80
60
40
20
Percent of population in poverty
1980 1990 2000 2010
East Asia and PacificLatin America and the CaribbeanSouth AsiaSub-Saharan Africa
East Europe and Central AsiaMiddle East and North AfricaWorld total

The Pursuit of Long- Run Economic Growth in Africa 13
evidence makes it clear that growth in labor- intensive sectors such as agriculture or manufacturing are typically more poverty- reducing than growth in capital- intensive sectors such as mining (Khan 1999; Ravallion and Chen 2007; Loayza and Raddatz 2010). From the previous data analy sis, it is evident that growth for a signifi cant proportion of Afri-can economies is centered around capital- intensive sectors and many countries tend to exhibit a pattern of development where the largest con-tributions to GDP have moved from agriculture to activities in mining, construction, and ser vices, with the notable absence of a manufacturing sector.
Labor Market CharacteristicsIn examining the in equality– growth relationship, labor demand re-sponses during growth episodes within an economy will often shape and infl uence the private distributional impacts of growth. An example of this has been the shift toward the demand for highly skilled labor during periods of economic growth. This asymmetric response in occu-pational demand to growth is critical to understanding how economic growth can have distributional and poverty reduction effects. Bhorat and others (2015a) conclude that, in South Africa, for example, the secondary
FIGURE 1-2. Growth Elasticity of Poverty by Regiona
Source: Bhorat and others (2015a).a. Controls include initial consumption, in equality, and an indicator for a natu ral resource share
> 5 percent of GDP. Country fi xed effects are controlled for in all results.
–0.69–1
–2
–3
–4 –3.81
–3.07
–2.02
No controls With controls
Sub-Saharan Africa Rest of the world
Percent

14 Bhorat and Tarp
and tertiary sectors witnessed a rise in the proportion of high- skilled labor force between 2001 and 2012. At the same time, the primary and tertiary sectors saw declining proportions of unskilled labor, overall suggesting that fi rms in South Africa are investing in capital and skills, causing the shift away from unskilled labor.
The greatest degree of pressure within the labor market is likely to stem from the entry of young workers into the labor market. Figure 1-2 pres ents the projected increase in the size of the working- age popula-tion between 2010 and 2030. The magnitude of the expected growth to 2030 in Africa’s youth population (15–24 years of age) is estimated at 2.5 times the growth in the youth population of Latin Amer i ca, and over three times the growth in Asia. Lam and Leibbrandt (2013) provide an example from Africa’s most highly populated country, Nigeria, to illus-trate the extent of the youth bulge in Africa. They show that, while growth in the 15–24 age group in Nigeria has fallen from its mid-1990s peak, it is expected to remain above 2 percent until 2030, resulting in Nigerian youth continuing to make up a third of the labor force for the entire period (Bhorat and others 2015a).
The fact that Africa’s working- age population is expected to grow so quickly, and particularly the working-age youth, highlights the fact that the continent is not as far along in its demographic transition as many other regions of the world, alluding to the increasing challenge of job creation for the continent (Bhorat and others 2015a).
Regarding the structure of the labor market, table 1-4 summarizes the global labor market, including Sub- Saharan Africa. A key defi n-ing feature of the African labor market is that an exceptionally high proportion— approximately 74 percent—of the SSA labor force is self- employed, as opposed to being engaged in wage employment.2 Income from self- employment, which is directly dependent on the profi ts of the enterprise/surplus of house hold activities, is historically more variable than wage employment. Also noteworthy is that the majority of the labor force (56 percent) is engaged in agricultural activities, while 77 percent of the self- employed workers fi nd themselves in the agricultural sector, having a compounding effect on the volatility of house hold incomes.
Thus, the agricultural sector, as well as the rural labor market, is extremely impor tant for the livelihood of citizens in the SSA region,

TAB
LE 1
-4.
The
Glo
bal L
abor
Mar
ket a
t a G
lanc
e, 2
010a
Mill
ions
of p
eopl
e
Reg
ion
Wag
e em
ploy
men
tSe
lf-
empl
oym
ent
Self-
empl
oyed
Em
ploy
edU
nem
ploy
ed L
abor
forc
eA
gric
ultu
reN
on- a
gric
ultu
re
SSA
6123
618
155
297
2332
0(0
.19)
(0.7
4)(0
.56)
(0.1
7)(0
.93)
(0.0
7)(1
.00)
Oth
er n
on- O
EC
D1,
118
1,06
858
448
42,
186
134
2,32
0(0
.48)
(0.4
6)(0
.25)
(0.2
1)(0
.94)
(0.0
6)(1
.00)
OE
CD
333
507
4338
332
415
(0.8
0)(0
.12)
(0.0
2)(0
.10)
(0.9
2)(0
.08)
(1.0
0)
Glo
bal t
otal
1,51
21,
354
772
581
2,86
618
93,
055
(0.5
0)(0
.44)
(0.2
5)(0
.19)
(0.9
4)(0
.06)
(1.0
0)
Sour
ce: B
hora
t and
oth
ers (
2015
b). T
he d
ata
are
base
d on
the
Wor
ld B
ank’
s Int
erna
tiona
l Inc
ome
Dis
trib
utio
n D
atab
ase
(I2D
2) d
atas
et, w
hich
is a
ha
rmon
ized
set o
f hou
se ho
ld a
nd la
bor f
orce
surv
eys d
raw
n fr
om a
mul
titud
e of
cou
ntri
es.
a. E
stim
ated
per
cent
age
of re
gion
al la
bor f
orce
is sh
own
in p
aren
thes
is.

16 Bhorat and Tarp
acting as a potential conduit for poverty reduction and job creation. Working on the land in rural areas is generally low- income work and the sectors potential to help transition workers out of poverty must be developed.
The number of working poor in Africa— defi ned as those living in house holds earning less than US$2 a day— currently at 193 million people, constitutes almost two- thirds of the total employed and is approximately eight times the number of unemployed in the region. The pattern of the changes in the number of the ultra- poor ( those earning below US$1.25 a day) is consistent and shows a distinct re distribution of the world’s working poor from East Asia and South East Asia and the Pacifi c to South Asia and Africa, with almost a third of the world’s working ultra- poor residing in SSA, up from 18 percent in 2000 (Bhorat 2013). Thus, while the proportion of the working poor to total em-ployment in SSA has seen gradual improvement since 2000, the fun-damental jobs challenge in the region remains the prob lem of the working poor.
Ultimately, then, policies targeting the working poor and, in par tic-u lar, increasing the productivity and competitiveness of the sectors they are located in, remains crucial to reducing the high incidence of pov-erty in many African economies. As one example, transforming the infor-mal sector to become a more sustainable employer with backward and forward linkages to formal sector fi rms provides another focus for equi-table development. Fi nally, growing Africa’s wage employment base must be a key ele ment of a growth strategy for African policymakers. Expanding the manufacturing sector, as noted, is another ele ment of a job- generating growth strategy, which has worked in the high- success economies of East Asia (Bhorat and others 2015a; Newman and others 2016a, 2016b).
A THREE- PART STORYLINE: EMERGING
BARRIERS TO LONG- RUN GROWTH
The detailed country case studies that follow this chapter suggest at least three major common themes that serve, in part, to characterize the nature of the growth challenges and constraints in Africa, which, if
The Pursuit of Long- Run Economic Growth in Africa 17
unchecked, could reinforce a pattern of low growth accompanied with limited poverty- reducing impact. These themes are a resource- led growth path, an absent manufacturing sector, and the increasing informalization of the work force. In upcoming sections, we discuss each in turn and provide pos si ble policy recommendations.
Resource- Led Growth
Numerous studies highlight the developmental benefi t of the diversifi -cation of an economy’s productive structure. Additionally, these studies also argue that the type of products the economy diversifi es toward also matters signifi cantly. One of the most infl uential studies in reviewing the relationship between resource- rich African countries and overall growth is the well- known cross- country regression fi nding by Sachs and Warner (2001). This paper fi nds a negative and statistically signifi cant coeffi cient for the variable capturing resource dependence (primary product exports as a share of GDP), when controlling for other growth variables such as geography and institutions.
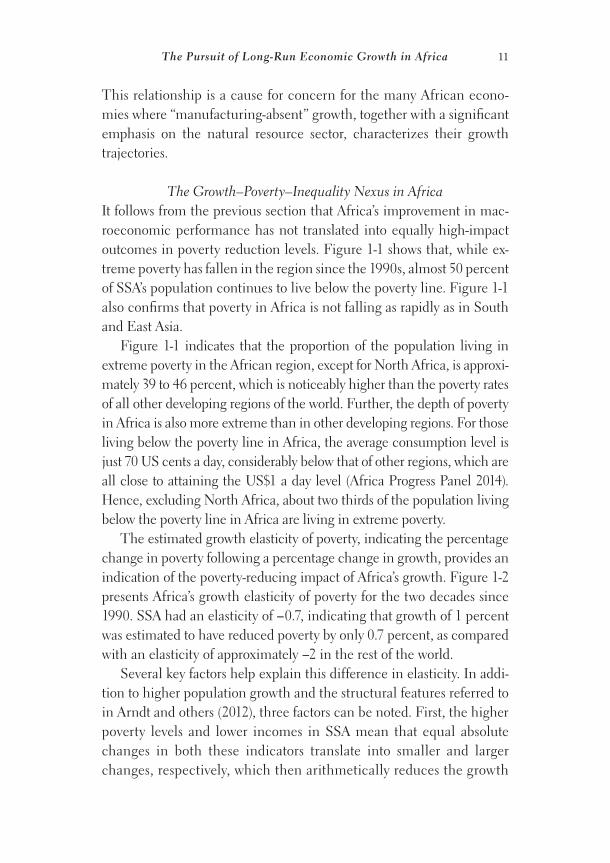
Bhorat, Steenkamp, and Rooney (forthcoming), test for this natu ral resource curse hypothesis in Figure 1-3 by showing the relationship be-tween natu ral resource intensity (as mea sured by the amount of arable land) and the log of GDP per capita for a cohort of high, middle, and low income countries as well as some selected African countries. They observe a weak negative relationship between the two variables (0.11). More specifi cally, a country that has a high natu ral resource endow-ment is more likely to be poorer than those countries with a lower natu-ral resource endowment, ceterus paribus. While this negative corre-lation suggests the potential presence of the natu ral resource curse, further interrogation remains necessary to better understand the country- specifi c dynamics as well as the infl uence of mineral resources on overall growth levels.
Proponents of the resource curse effect argue for a number of chan-nels through which resources adversely impact economic development. First, the terms of trade argument posed by Prebisch (1959) argues that the price of commodities relative to manufactured goods is said to fol-low a downward trajectory over time and, thus, countries specializing

18 Bhorat and Tarp
in resource- intensive activities will experience declining terms of trade over time. Second, Sachs and Warner (1995, 2001) argue that, following a commodity boom, the growth of the resource sector crowds out man-ufacturing activity. Third, a po liti cal economy- type argument contends that resource- abundant countries are less likely to develop sound institu-tions because of elites competing over resources rents. It is argued that countries characterized by weak institutions have a higher likelihood of armed confl ict. Fi nally, commodity prices tend to exhibit high levels of volatility that, coupled with export concentration in natu ral resource– based exports, result in broader macroeconomic volatility.
However, there are, as well, other studies that contest the resource curse hypothesis. First, Mehlum, Moene, and Torvik (2006) propose a
FIGURE 1-3. Resource Intensity Relative to per Capita GDP
Source: Bhorat, Steenkamp, and Rooney (forthcoming), using the BACI International Trade Database.a. The natu ral resource intensity associated with a country’s export basket (2013) is constructed
using data from the UNCTAD Revealed Factor Intensity Database developed by Shirotori, Tumurchudur, and Cado (2010). The construction of this mea sure follows the same technique that is applied by Hausmann, Hwang, and Rodrik (2007) when the use revealed technology content data (known as the PRODY mea sure) to construct a mea sure of the productivity level associated with a country’s export basket (known as the EXPY mea sure). In essence, the mea sure is a weighted average of the revealed natu ral resource intensity for a country, using each exported product’s share of a country’s export portfolio as weights.
7
6.5
6
5.5
5
4.5
4 6 8 10 12
Log of revealed natural resource intensitya
High income: OECD
Log of GDP per capita (constant 2005 US$)
Middle incomeAfrica
High income: non-OECDLow income
NER
MLIMWI
CAF
ERI
SLEDJI
ZAFBEN
ZARGIN
BDI RWACOM
KENGNQ
SYC
MUS
LBYGABCPV
TUNDZAMARAGOCOGEGY
MRTZMBGIN
GHA CIVNGASTP
CMR
UGAGNB
LBRMDGETH
SENTCDTZAZWETGOGMB
MOZBFA
The Pursuit of Long- Run Economic Growth in Africa 19
“conditional resource curse” whereby the quality of a country’s institu-tions infl uences whether it is able to successfully exploit its natu ral resource abundance. They fi nd that resource- rich countries with weak institutions are associated with low growth, whereas resource- rich coun-tries with strong institutions are associated with high growth. Second, Bravo- Ortega and Gregorio (2007) highlight the importance of the country’s human capital levels. Specifi cally, they argue that low levels of human capital and resource abundance are associated with low lev-els of growth, whereas high levels of human capital and resource abun-dance are associated with higher levels of economic growth. Fi nally, Maloney and Lederman (2008) fi nd little evidence for the curse and, instead, propose a “curse of concentration,” for countries that are overly dependent upon the exports of just a few natu ral resource– based prod-ucts are associated with the negative growth effects.3
In summary, an abundance of mineral resources will not automati-cally limit a nation’s economy to low levels of growth and development. Rather, any mea sur able developmental benefi ts will arise from the inclusion or the absence of a broader set of requirements for growth, such as the quality of institutions, human capital levels, and a suffi -ciently diversifi ed economy. And in the fi nal analy sis, it is impor tant to keep in mind that, if available resources are spent wisely, then growth is likely to ensue. The country chapters that follow will directly and indi-rectly attest to the challenges posed to the African growth agenda for African economies that fi nd themselves heavi ly dependent on resource revenues to fuel fi scal revenue, economic growth, and employment generation.
An Absent African Manufacturing Sector
During the 1970s, manufacturing in Africa thrived due to import- substitution industrialization. However, when economic liberalization and the privatization of state enterprises became rampant under stabili-zation and structural adjustment in the 1980s, African manufacturing went into secular decline, as the continent could not compete with low- wage Asian countries. Import competition led to the contraction of many domestic industries, resulting in labor moving toward less pro-ductive sectors. According to Page (2014), African countries were not

20 Bhorat and Tarp
well prepared for import competition due to state- led import substitu-tion creating high protection and heavy import de pen dency, but other factors, including bad luck, were also at play. Newman and others (2016b) provide a comprehensive set of comparative studies of indus-trial development in Africa and Emerging Asia.
Figure 1-4 shows a steady decline or fl atlining in the contribution of manufacturing to economic output across fi ve African regions, particu-larly from 1990. Since 2000, there has been a marginally upward trend for manufacturing in North and East Africa spurred on by the increas-ing incidence of light manufacturing and medium technology manu-facturing, respectively.
An alternative approach to assessing manufacturing per for mance is to analyze the per for mance of manufacturing exports, as the ability to ex-port and compete in global markets suggests a level of success and indus-
FIGURE 1-4. Manufacturing as a Proportion of GDP by Subregion, 1994–2013
Source: World Development Indicators, 2015.
20
5
10
15
Percent of GDP
1994 1996 1998 2000 2002 2004 2006 2008 2010 2012 2014
Central AfricaNorth AfricaWest Africa
East AfricaSouthern Africa

The Pursuit of Long- Run Economic Growth in Africa 21
trial strength. Following the poor per for mance in manufacturing output across most of Africa, the trends in export per for mance are equally disap-pointing. As illustrated in fi gure 1-4, West Africa’s share of manufacturing in exports rose promisingly from 1995 levels to a peak of 24 percent in 2004 before declining back to 1995 levels in 2013, at just under 16 percent of GDP. An encouraging trend is emerging in East Africa, where, on average, manufacturing goods as a proportion of exports has risen from 17.2 percent in 1995 to 20.4 percent currently. Over time, manufacturing exports reached a peak of 27 percent of exports from the East African re-gion in 2006, after which it gradually declined and has now stabilized.4
While this proportion varies signifi cantly across the African Lions in focus here, the share of manufacturing as a proportion of GDP is highest in Kenya, Mozambique, and South Africa. Manufacturing in South Africa declined by almost 10 percent between 1994 and 2014. This contraction in South Africa followed the inability to compete in global manufacturing export markets, increased global competition, and volatile real exchange rates. Kenya has failed to capitalize on the manufacturing exports in spite of its location, the presence of a large and skilled labor force, and its market- focused orientation. Additionally, Kenya has signifi cant resource endowment to enable agricultural indus-tries to transform from small- scale downstream industries into expanded upstream manufacturing industries. This would serve a dual purpose of increasing growth and lowering unemployment.
Several trends are observed when focus shifts to the nature of manu-facturing exports undertaken by African countries. First, as expected, exports typically consist of primary products. The volume of these exports continues to be high even when compared with developing country counter parts in South Asia, Latin Amer i ca, and the Ca rib bean. Second, it is estimated that over half of these manufacturing exports are capital- intensive in nature and heavi ly resource- based. In Mozambique, for example, the economy remains dominated by agriculture (27 percent) and private and public ser vices (51 percent), while manufacturing has grown more slowly than other sectors and has declined as a share of GDP (18 percent). Growth in the Mozambican manufacturing sector is driven entirely by investments in two aluminum smelters attracted to the country by its preferential tax structure. Smelting is, by nature, a capital- intensive

22 Bhorat and Tarp
activity, which limits its overall contribution to manufacturing jobs. Fi-nally, manufacturing exports out of Africa have relatively low technology content. Despite the Ethiopian government designating the manufactur-ing sector as the conduit to achieving middle- income country status by 2025 and establishing vari ous incentives to spur growth, growth remains low (estimated at 5 percent) and employment within this sector is minis-cule in relation to the size of the employment challenge.
Positive results from the continent, however, indicate that most economies are in transition, as the share of agriculture relative to GDP has declined while the contribution of ser vices has grown signifi cantly. A closer look at the data reveals that growth in the intermediate sector has principally been driven by expansion of the mining sector, whereas the manufacturing sector has experienced stagnation. Furthermore, the share of manufacturing exports in manufacturing output has remained signifi cantly low historically, which, as alluded to, begs the question of whether service- led growth can deliver a suffi cient volume of jobs.
We now turn our attention to examining the pos si ble range of con-straints on manufacturing per for mance in Africa, as well as pos si ble so-lutions. We briefl y analyze the role of skills, capital accumulation, the regulatory environment, and vari ous infrastructure costs.
Low Capital AccumulationA positive relationship is observed in the relationship between capital accumulation and GDP. This is true for both human capital and physical capital. In general, an increase in wealth is associated with an increase in the use of human capital in exports. Most African countries are not capital abundant when compared to other low- income countries in other regions of the world. Nigeria and South Africa are two excep-tions, as they have a similar level of capital stock and wealth compared to other middle- income countries. However, manufacturing in Nige-ria has transformed to be more capital intensive amid a large and growing labor force. This is accompanied by a signifi cant reduction in the proportion of workers in this sector, as well as an increasing de-mand for a more skilled labor force. Overall, however, this lack of both physical and human capital stock, and the intensity of its use in produc-tion, suggests that Africa will continue to strug gle to industrialize.

The Pursuit of Long- Run Economic Growth in Africa 23
Using the Atlas of Economic Complexity toolkit developed by Haus-mann and others (2007), one can explore the link between the sum of knowledge available within an economy to produce goods (the com-plexity) and connectedness to traded products and what this implies for structural transformation.5 Countries at lower levels of economic com-plexity, mainly African countries, have relatively disconnected productive structures and, thus, their ability to diversify and undergo structural trans-formation is constrained. In essence, the complexity index alludes to the fact that these marginalized countries do not possess the productive knowledge and capabilities needed to shift their production structure to more complex products, particularly manufactured products. The peripheral nature of their product space does not afford them opportu-nities to diversify and grow in complexity.
Japan and Switzerland are currently ranked fi rst and second, respec-tively, on the Atlas of Economic Complexity out of 124 states for which
FIGURE 1-5. African Lions’ Atlas of Economic Complexity Rankings, 2013a
Source: Atlas of Economic Complexity (2013).a. Total rankings, 124.
Ethiopia Ghana Kenya Mozambique Nigeria South Africa
50
100
Ranking
116
101
79
111
122
60

24 Bhorat and Tarp
information is available. The higher the ranking, the better the trans-formation and connectedness of that economy. Figure 1-5 summarizes the fi ndings for the six African Lion states. The fi ndings are instructive. They suggest that only South Africa and Kenya have some degree of economic complexity, as they are ranked somewhere in the middle of the distribution. The remaining four countries in our sample are ranked close to the bottom of the distribution in terms of economic complex-ity. Nigeria is second from last in global distribution of economic com-plexity, reinforcing the idea of the country’s overreliance on crude oil. It is fair to argue, in addition, that the majority of low complexity econ-omies in this sample are from Sub- Saharan Africa.
Governance, Infrastructure, and Unit Labor CostsDespite extensive upgrades, Africa’s business environment continues to be plagued by costly ineffi ciency and onerous bureaucratic require-ments. Eifert, Gelb, and Ramachandran (2008) analyze the cost of doing business in Africa to conclude that the high indirect cost shares observed in fi rms in poorer African countries refl ect under lying weak fundamentals, which, in turn, reduces the competitiveness of Afri-can fi rms relative to those in Asian and Latin American developing countries.
Figure 1-6 plots the World Bank’s Ease of Doing Business rank for Africa, Latin Amer i ca, and South Asia. The higher the rank, the less conducive the country is for business. Africa’s average rank is 142, com-pared to Latin Amer i ca’s 98 and South Asia’s 137. Ele ments of the busi-ness environment, such as the time it takes to set up a business and get electricity and access to credit, all remain critical areas that need re-form. Fi nally, weaknesses in the rule of law and regulation mean that African fi rms pay higher bribes (as a proportion of sales) and lose a greater fraction of their sales value to crime and theft than fi rms in other developing countries (Eifert and Ramachandran 2004).
All these factors point toward an environment that is not fully con-ducive to the start up and operation of effi cient small, micro, and medium sized enterprises (SMMEs), as well as a thriving informal sector. This is, no doubt, one of the contributory factors to the low productivity of the manufacturing sector in Africa. Furthermore, these business con-straints may also limit the entry of formal, foreign manufacturing fi rms

The Pursuit of Long- Run Economic Growth in Africa 25
into the market given that the business environment is a key cost factor for fi rms, in addition to the estimated return on investment.
While the Doing Business Indicators have occupied a central place in the dialogue about enterprise development in Africa, it is, as argued in Newman and others (2016a, 2016b), critical to keep the overall con-text and constraints in mind in developing appropriate policy. Esti-mates suggest that poor infrastructure hampers economic growth in Africa by at least 2 percent each year and lowers private sector produc-tivity by up to 40 percent (Kaberuka 2013). Poor infrastructure poses a fundamental threat to Africa’s potential for growth arising from its manufacturing sector. Table 1-5 indicates that, while infrastructure provision in Africa has grown over the period under examination, cur-rent levels remain very low when compared with developing nations in other regions of the world. For example, the road density network as a proportion of land area is estimated at 24.3 in Africa, compared to an average of 54.2 for non- African developing countries. Furthermore, evi-dence points to the fact that roads in Africa— which are the main means
FIGURE 1-6. Ease of Doing Business in Africa vs. Latin Amer i ca and South Asia, 2015
Source: World Bank Doing Business Report, 2015.
Africa Latin America South Asia
50
100
Average ranking
144
103
127

26 Bhorat and Tarp
of transporting freight— are unpaved and in poor condition (Pricewater-houseCoopers 2012). Transport costs are cripplingly high and electric-ity production remains low and unpredictable.
Ineffi cient logistics contribute signifi cantly to the cost of doing busi-ness in Africa and weaken the ability to leverage a comparative advan-tage in, say, food pro cessing industries, where perishables require short transit times. Rail infrastructure remains poor and out of date, with few upgrades by most African states. Ports, key to facilitating international trade, are in undersupply and often do not function effi ciently, which, in turn, limits their overall ability to handle large volumes of traffi c. A case in point is Kenya, which, through the port city of Mombasa, ser vices fi ve landlocked neighboring countries that are fairly resource- rich: Ethio-pia, South Sudan, Uganda, Rwanda, and Burundi. To further benefi t from this comparative advantage, it is necessary for Kenya to prioritize improvising ports and other transport networks and to develop trans-port nodes.
High unit labor costs in Africa are also cited as a reason for the poor per for mance of manufacturing in Africa. Ceglowski and others (2015)
TABLE 1-5. Infrastructure Indicators, Africa versus Non- African Developing Countries
Region Year
Electricity production (kWh per capita)
Improved sanitation
facilities (% population with access)
Improved water
source (% of population with access)
Road density (km of road
per 100 sq km of land area)
Africa 1990 514.24 41.60 63.66 n.a.2010 762.91 49.45 75.06 n.a.
Africa excluding South Africa
1990 457.13 41.23 63.35 n.a.2010 705.86 48.93 74.77 24.30
Non- African developing countries
1990 1,515.15 67.57 83.27 n.a.2010 1,889.98 78.58 90.48 54.2
Source: World Bank World Development Indicators, 2015.n.a. = not available.
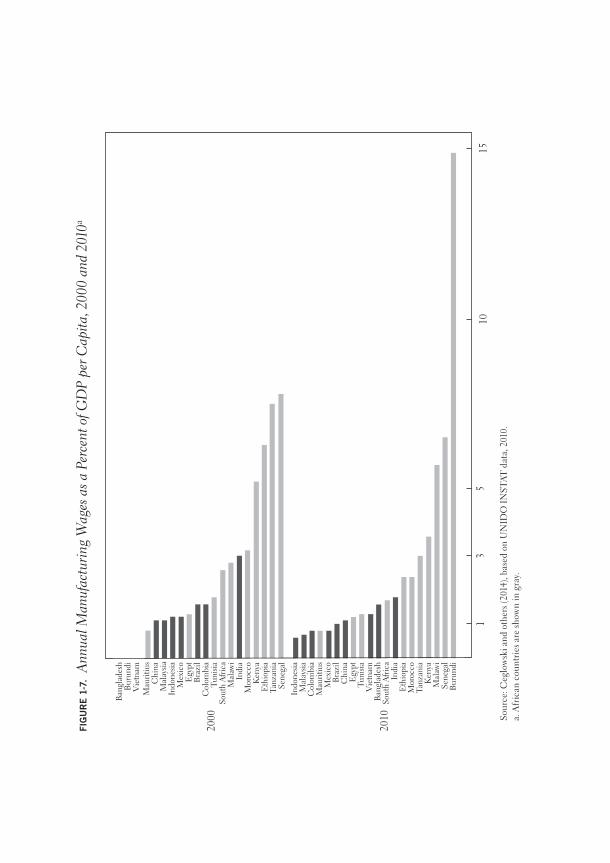
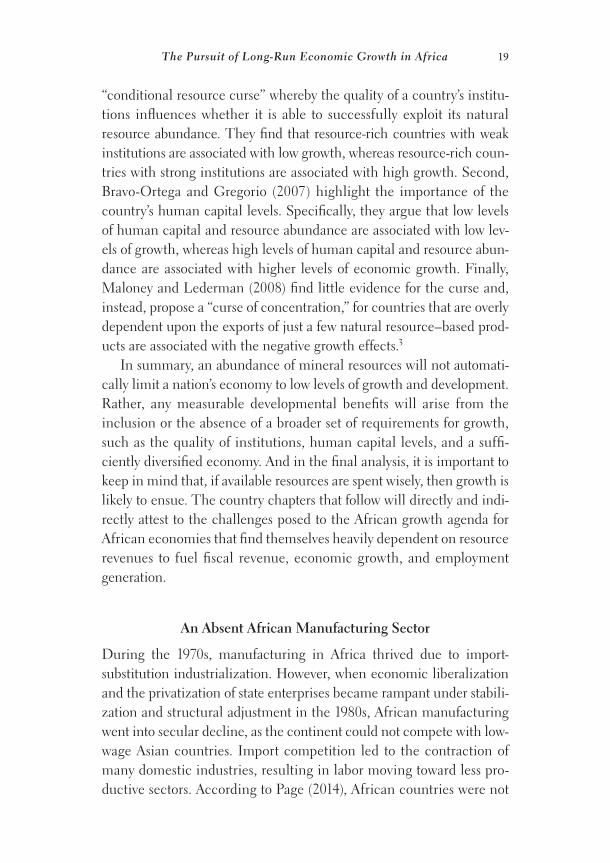
FIG
UR
E 1
-7.
Ann
ual M
anuf
actu
ring
Wag
es a
s a P
erce
nt o
f GD
P pe
r Cap
ita, 2
000
and
2010
a
Sour
ce: C
eglo
wsk
i and
oth
ers (
2014
), ba
sed
on U
NID
O IN
STAT
dat
a, 2
010.
a. A
fric
an c
ount
ries
are
show
n in
gra
y.
Ban
glad
esh
Ban
glad
esh
Bur
undi
Vie
tnam
Vie
tnam
Mau
ritiu
s
Mau
ritiu
s
Chi
na
Chi
na
Mal
aysia
Indo
nesia
Mex
ico
Mex
ico
Egy
pt
Egy
pt
Bra
zil
Bra
zil
Col
ombi
a
Col
ombi
a
Tuni
sia
Tuni
sia
Sout
h Af
rica
Sout
h Af
rica
Mal
awi
Mal
awi
Indi
a
Indi
a
Mor
occo
Mor
occo
Ken
ya
Ken
ya
Eth
iopi
a
Eth
iopi
a
Tanz
ania
Tanz
ania
Sene
gal
Sene
gal
Indo
nesia
Mal
aysia
Bur
undi
1015
53
1
2000
2010

28 Bhorat and Tarp
fi nd that high unit labor costs are a key explanatory factor as to why African manufactured exports remain globally uncompetitive. Figure 1-7 provides the authors’ estimates of formal sector manufacturing wages in Africa. Wages in Sub- Saharan Africa have increased between 2000 and 2010 and are much higher than in Asian countries. In 2010, Afri-can countries occupied the highest seven positions with regard to manufacturing wages. Only Tunisia, Egypt, Mauritius, and, to a lesser extent, South Africa can match the Asian countries in terms of costs. However, and to be sure, wages are only one ele ment hampering the pro gress of the manufacturing sector. The business environment fur-ther infl uences operational costs and, therefore, long- run returns on investment. Investors are willing to pay a wage premium in countries where there is good infrastructure and the population is well educated.
It is worth noting that manufacturing is a heterogeneous sector of an economy and encompasses a variety of industries and products. For instance, manufactured output varies according to the inputs that go into production, such as capital, labor, and natu ral resources. To capi-talize on long- run growth opportunities, it is, thus, crucial for African economies to work on improving the quantity and quality of human capi-tal, to ensure there is an enabling and effi cient regulatory environment, and to improve overall infrastructure levels.
Informalization of Labor
The expansion of the African informal economy in the 1990s is often linked to trade liberalization and structural adjustment programs that re-sulted in civil ser vice employees exiting the sector, as well as global com-petition that resulted in lowered staffi ng levels for previously protected industries (Verick 2006; Calvès and Schoumaker 2004). Despite limited data and studies in this area, the general consensus is that the informal sector plays an impor tant role in Sub- Saharan Africa. A 2015 report by the African Development Bank reports that informal economic activities ac-count for approximately 55 percent of GDP across the continent and as much as 70 percent of employment in the Sub- Saharan Africa region. Benjamin and Mbaye (2009) use house hold level data from the West Af-rican Economic and Monetary Union to conclude that in Benin, Burkina

The Pursuit of Long- Run Economic Growth in Africa 29
Faso, and Senegal, the informal sector has, on average, contributed 74 percent, 49 percent, and 54 percent, respectively, to GDP since 2000.
In Kenya, in a trend that might apply across the other African econ-omies, weak relationships are observed between economic growth and reduction in unemployment. This might imply that a signifi cant pro-portion of individuals are employed within the informal sector that is not as responsive to economic growth such that, while growth in wage employment closely tracks GDP, no such relationship is observed for the informal sector. In addition, Gelb and others (2009) observe a strong correlation between rising unemployment and the development of the informal sector, where this sector acts as an employer of last resort for those unable to fi nd wage employment.6 Moreover, individuals em-ployed in the informal sector have been observed to have, on average, lower levels of education relative to those in the formal sector, which requires a skilled and educated labor force (La Porta and Shleifer 2008).
An International Labor Organ ization (ILO) report published in 2013 shows that the SSA’s working poor not only constitutes almost two- thirds of the total employed but is also approximately eight times the number of unemployed in the region. Unsurprisingly, then, evidence indicates that poverty is signifi cantly higher among individuals em-ployed in the informal sector (Benjamin and Mbaye 2009). Findings from Mozambique indicate the presence of a minority of workers earning a stable wage income, even in urban areas that provide more economic opportunities. Furthermore, wage differentials are prevalent depending on the aggregate economic sector where earnings are obtained. This is particularly true in Kenya, where vari ous barriers exist to limit labor mobility between the informal and the higher- paying formal sector. A wage differential of US$36 is calculated between Ethiopian workers in the formal and informal sectors while, in Ghana, earnings are pre-sumed to be the lowest in the informal sector, with average daily earnings being estimated at 37.5 percent of public sector earnings and 32.1 percent of the average earnings in the private formal sector.
Within the informal economy, certain sectors are clearly dominant across the continent. Domestic work in the private homes of others, home- based work, and street vendors dominate the African informal sector (International Labor Organ ization 2013).7 The 2013 ILO report estimates

30 Bhorat and Tarp
that, in Africa, the number of domestic workers has increased from 4.2 million in 1995 to 5.3 million by 2010, where 73 percent are women. Further research has shown that informal sector fi rms are signifi cantly less productive than formal fi rms (Gelb and others 2009; La Porta and Shleifer 2008). There is evidence from selected economies to indicate that retail trade and other non- tradables absorb the majority of informal sector workers (Verick 2006). South Africa, with a relatively smaller infor-mal sector, indicates higher concentration in the retail trade, domestic work in private house holds, construction, and transport ( Wills 2009).
In the case of the African Lions, labor mobility from agriculture to the ser vices sector requires closer interrogation, as it often masks the fact that, despite increases in overall employment share, there is a decline in overall labor productivity. This implies that the bulk of these new workers are mainly located in the informal sector, often have low levels of education, and are undertaking risky or low- paying jobs. The Nige-rian ser vices sector is characterized as a low productivity sector, and any infl ows of labor will have the effect of lowering overall per capita pro-ductivity, which diminishes any inter- sectoral shift effects. (It is similar in Ghana, which has an employment elasticity of 0.47. New jobs are being created in the informal sector generating a signifi cant proportion of the working poor, estimated at 22 percent of the overall working pop-ulation). The share of employment in Kenya’s informal sector was esti-mated at 83 percent in 2014, following an average increase of 72 percent over a thirty- year period. The widespread growth of the Kenyan infor-mal sector is largely attributable to the fact that the formal sector is not growing rapidly enough to absorb the growing labor force as a result of constraints to capital accumulation within this sector.
A rising informal sector is also signifi cant because workers within this sector are often excluded from contributory social insurance schemes that require an employment relationship. Therefore, raising the productivity of the informal sector becomes an impor tant policy ob-jective. This implies, fi rst, addressing issues surrounding the business regulatory environment that need to be addressed to develop this sec-tor, including improving access to credit and provision of insurance products. Second, investment in basic infrastructure such as electricity, road networks, and information technology is fundamental. Third, wage differentials resulting from the proportion of unskilled labor in
The Pursuit of Long- Run Economic Growth in Africa 31
the informal sector necessitates the upgrading of skills for individuals within this sector. This has a dual effect, as it may help generate viable fi rms as well as contributing to overall sectoral productivity. Last, policy strategies and programs should be put in place to make the informal sector more dynamic and formal, to deliver quality employment opportunities.
CONCLUSION
The analy sis presented in this chapter suggests that, despite signifi cant advances in terms of macroeconomic stability, it is evident that the struc-ture of the African region’s growth remains of concern. The pattern of growth that is resource- dominant and manufacturing- absent would not seem to be the standard economic development path followed by all economies that have successfully transitioned from low- to high- income country status. The dominance of resources in production and exports and ser vices and agriculture in employment would, in turn, not appear to be the most appropriate strategy for long- term and sustained poverty- reducing growth. This lack of complexity in production, underpinned by constraints in infrastructure, a poor regulatory and governance frame-work, and high unit labor costs serve to reinforce challenges to growth, development, and employment generation strategies of this continent. In the chapters that follow, we hope to elucidate, at the country level, how these challenges are being played out in six African economies.
NOTES
The authors would like to thank Arabo Ewinyo and Kirsten van der Zee for their outstanding and invaluable research assistance.
1. A similar result is observed for Latin Amer i ca, with Asia being the only one of the three regions where the contribution of structural change to eco-nomic growth over this period was positive.
2. According to the International Labor Organ ization (ILO) (1993), wage employment refers to jobs “where the incumbents hold explicit (written or oral) or implicit employment contracts which give them a basic remuneration” in the form of wages. Self- employment is defi ned as “jobs where the remuneration

32 Bhorat and Tarp
is directly dependent upon the profi ts (or the potential for profi ts) derived from the goods and ser vices produced (where consumption is considered to be part of profi ts).”
3. A case study analy sis of Scandinavian countries by Blomstrom and Kokko (2007) argues that the current diverse high- tech manufacturing industries in these countries were developed upon the foundation of knowl-edge- and technology- intensive natu ral resource industries. For example, the high- tech telecom com pany, Nokia, emerged from a forestry com pany.
4. This aggregate positive trend is driven primarily by increasing growth in Burundi, Tanzania, and Uganda.
5. See this atlas at http:// atlas . cid . harvard . edu / media / atlas / pdf / Harvard MIT _ AtlasOfEconomicComplexity . pdf.
6. Maloney (2004) is a key proponent for the role that the informal sector could play in advancing better outcomes for entrepreneurs relative to em-ployment within the formal sector. However, he also acknowledges the dif-fi culties faced by workers in this sector, namely restrictive access to formal credit markets and weaker property rights.
7. Home- based work relates to own- account workers and subcontracted workers that carry out remunerated work in or very near their own homes. These types of jobs include the manufacturing of crafts and related trade, the opera-tion of small con ve nience stores or informal pubs, or brick- makers and con-struction workers. Street vendors also make up a considerable portion of urban informal work in Africa (12 to 24 percent). Street vendors include those who sell goods at fl ea markets, street- side hairdressers, and those who sell fruit, vegeta-bles, and other food on city streets (International Labor Organ ization 2013).
REFERENCES
Addison, Tony, Finn Tarp, and Saurabh Singhal. 2015. “Aid to Africa: The Changing Context.” In The Oxford Handbook of Africa and Economics, Volume II: Policies and Practices, edited by J. Lin and C. Monga (Oxford University Press), pp. 698–710.
Africa Pro gress Panel (APP). 2014. “Grain Fish Money: Financing Africa’s Green and Blue Revolutions.” Africa Pro gress Report 2014. ISBN 978-2-9700821-4-9 http:// app - cdn . acwupload . co . uk / wp - content / uploads / 2014 / 05 / APP _ APR2014 _ 24june . pdf
Ajakaiye, Olu, Afeikhena T. Jerome, Olufunke A. Alaba, and David Nabena. 2015. Understanding The Relationship between Growth and Employment in Nigeria (2015/124. Helsinki: UNU- WIDER).
Arndt, Channing, Andres Garcia, Finn Tarp, and James Thurlow. 2012. “Poverty Reduction and Economic Structure: Comparative Path Analy sis for Mozambique and Vietnam.” Review of Income and Wealth 58, no. 4, pp. 742–63.
The Pursuit of Long- Run Economic Growth in Africa 33
Arndt, Channing, Andy McKay, and Finn Tarp, eds. 2016. Growth and Pov-erty in Sub- Saharan Africa (Oxford University Press).
Aryeetey, Ernest, and William Baah- Boateng. 2015. Understanding Ghana’s Growth Success Story and Job Creation Challenges (2015/140. Helsinki: UNU- WIDER).
Benjamin, Nancy, and Ahmadou Aly Mbaye. 2009. The Informal Sector in Francophone Africa: Firm Size, Productivity, and Institutions (Washing-ton, D.C.: World Bank).
Bhorat, Haroon. 2013. The Challenge of Job Creation: Input to the Post-2015 HLP Agenda (Unpublished Mimeograph. Cape Town: Development Policy Research Unit, University of Cape Town).
Bhorat, Haroon, Francois Steenkamp, and Christopher Rooney. Forthcoming 2016. Africa’s Manufacturing Malaise (Unpublished Mimeograph. Cape Town: Development Policy Research Unit, University of Cape Town).
Bhorat, Haroon, Karmen Naidoo, and Kavisha Pillay. 2015a. “Aspiring Africa: Overcoming Development Challenges to Meet Its Long- Term Vision.” Mimeograph presented at Developmental States Conference (Pretoria).
— — —. 2015b. “Growth, Poverty, and In e qual ity Interactions in Africa: An Overview of Key Issues” (Helsinki: Mapping the Future of Development Economics [Anniversary Conference], September 17–19).
Blomstrom, Magnus, and Ari Kokko. 2007. “From Natu ral Resources to High- Tech Production: The Evolution of Industrial Competitiveness in Sweden and Finland.” In Natu ral Resources: Neither Curse nor Destiny, edited by Daniel Lederman and William Maloney (Washington, D.C.: World Bank), pp. 213–46.
Bravo- Ortega, Claudio, and José Gregorio. 2007. “The Relative Richness of the Poor? Natu ral Resources, Human Capital and Economic Growth,” Working Paper (Washington, D.C.: World Bank Group).
Calvès, Anne- Emmanuèle, and Bruno Schoumaker. 2004. “Deteriorating Economic Context and Changing Patterns of Youth Unemployment in Urban Burkina Faso: 1980–2000.” World Development, Elsevier, vol. 32, Aug., pp. 1341–54.
Ceglowski, Janet, Stephen Golub, Ahmadou Aly Mbaye, and Varun Prasad. 2015. “Can Africa Compete with China in Manufacturing? The Role of Relative Unit Labor Costs,” Working Paper 201504 (Cape Town: Devel-opment Policy Research Unit).
Collier, Paul, and Jan Willem Gunning. 1999. “The IMF’S Role in Struc-tural Adjustment.” The Economic Journal 109, no. 459, pp. 634–51.
Devarajan, Shantayanan, and Wolfgang Fengler. 2012. “Is Africa’s Recent Eco-nomic Growth Sustainable?” (Institut français des relations internationals (Ifri), Notte de l’Ifri, October 2012. Programme Moyen- Orient/Maghreb).
The Economist and IMF. 2011. “Africa’s Impressive Growth.” Retrieved from The Economist: www . economist . com / blogs / dailychart / 2011 / 01 / daily _ chart

34 Bhorat and Tarp
Eifert, Ben, Alan Gelb, and Vijaya Ramachandran. 2008. “The Cost of Doing Business in Africa: Evidence from Enterprise Survey Data.” World Devel-opment 36, no. 9, pp. 1531–46.
Eifert, Ben, and Vijaya Ramachandran. 2004. “Competitiveness and Private Sector Development in Africa: Crosscountry Evidence from the World Bank’s Investment Climate Data,” Occasional Paper series (Cornell Uni-versity: Institute for African Studies).
Fosu, Augustin K. 2009. “In e qual ity and the Impact of Growth on Poverty: Comparative Evidence for Sub- Saharan Africa.” Journal of Development Studies 45, no. 5, pp. 726–45.
Gelb, Alan, Taye Mengistae, Vijaya Ramachandran, and Manju KediaShah. 2009. “To Formalize or Not to Formalize? Comparisons of Microenterprise Data from Southern and East Africa,” Working Paper 175 (Washington, D.C.: Center for Global Development).
Hausmann, Ricardo, César A. Hidalgo, Sebastián Bustos, Michele Cos-cia, Sarah Chung, Juan Jimenez, Alexander Simoes, Muhammed A. Yıldırım. 2007. “The Atlas of Economic Complexity: Mappying Paths to Prosperity” (Harvard’s Center for International Development (CID)).
Hausmann, Ricardo, Jason Hwang, and Dani Rodrik, 2007. “What You Ex-port Matters,” Journal of Economic Growth, Springer, vol. 12, pp. 1–25.
International Labor Organ ization (ILO). 1993. Fifteenth International Con-ference of Labour Statisticians, Report of the Conference. (Geneva: ICLS/15/D.6 (Rev. 1) International Labour Offi ce).
— — —. 2013. Women and Men in the Informal Economy: A Statistical Picture, 2nd ed.
International Monetary Fund (IMF). 2011. Regional Economic Outlook: Sub- Saharan Africa Recovery and New Risks (Washington, D.C.: Inter-national Monetary Fund).
Kaberuka, Donald. 2013. “Sustaining Africa’s Economic Growth: The Chal-lenges of Inclusion and Financing Infrastructure.” (Speech by the Presi-dent of the African Development Bank at the AACB Symposium on Fi-nancial Inclusion. AfDB, October). http:// www . afdb . org / en / news - and - events / article / sustaining - africas - economic - growth - the - challenges - of - inclusion - and - fi nancing - infrastructure - afdb - president - donald - kaberuka - 12215/
Khan, Haider. 1999. “Sectoral Growth and Poverty- Alleviation: A Multiplier Decomposition Technique Applied to South Africa.” World Development 27, no. 3, pp. 521–30.
Kimenyi, Mwangi S., Francis M. Mwega, and Njuguna S. Ndung’u. 2015. The African Lions: Kenya Country Case Study (2015/134. Helsinki: UNU- WIDER).
The Pursuit of Long- Run Economic Growth in Africa 35
La Porta, Rafael, and Andrei Shleifer. 2008. “The Unoffi cial Economy and Economic Development.” Brookings Papers on Economic Activity 2, (Brookings), pp. 275–364.
Lam, David, and Murray Leibbrandt. 2013. Global Demographic Trends and Their Implications for Employment. Paper prepared as background re-search for the Post-2015 UN MDG Development Agenda on Employ-ment and Employment Growth. http:// www . post2015hlp . org / wp - content / uploads / 2013 / 05 / Lam - Leibbrandt _ Global - Demographic - Trends - and - their - Implications - for - Employment . pdf
Loayza, Norman, and Claudio Raddatz. 2010.“The Composition of Growth Matters for Poverty Alleviation.” Journal of Development Economics 93, no. 1, pp. 137–51.
Maloney, William. 2004. “Informality Revisited.” World Development 32, no. 7, pp. 1159–78.
Maloney, William F., and Daniel Lederman. 2008. “In Search of the Miss-ing Resource Curse.” Economía: Journal of the Latin American and Ca-rib bean Economic Association, vol. 9, no. 1.
McMillan, Margaret, Dani Rodrik, and Ignio Verduzco- Gallo. 2014. “Glo-balization, Structural Change, and Productivity Growth with an Update on Africa.” World Development 63, pp. 11–32.
Mehlum, Halvor, Karl Moene, and Ragnar Torvik. 2006. “Institutions and the Resource Curse.” Economic Journal, vol. 116, issue 508, pp. 1–20.
Newman, Carol, John Page, John Rand, Abebe Shimeles, Måns Söderbom, and Finn Tarp. 2016a. Made in Africa: A New Industrial Strategy (Brookings).
— — —, eds. 2016b. Manufacturing Transformation: Comparative Studies of Industrial Development in Africa and Emerging Asia (Oxford University Press).
Oosthuizen, Morne. 2015. “Bonus or Mirage? South Africa’s Demographic Dividend.” Journal of the Economics of Ageing 5, April, pp. 14–22.
Page, John. 2014. “Africa’s Failure to Industrialize: Bad Luck or Bad Policy?” Africa in Focus (Brookings).
Prebisch, Raúl. 1959. “Commercial Policy in the Underdeveloped Coun-tries.” American Economic Review 49, pp. 251–73.
Pricewater houseCoopers. 2012. Africa Gearing Up: Future Prospects in Africa for the Transportation and Logistics Industry (Johannesburg).
Ravallion, Martin. 1997. “Can High- In equality Developing Countries Es-cape Absolute Poverty?” Economics Letters 56, pp. 51–57.
— — —. 2001. “Growth, In e qual ity, and Poverty: Looking Beyond Averages.” World Development 29, no. 11, pp. 1803–15.
Ravallion, Martin, and Shaohua Chen. 1997. “What Can New Survey Data Tell Us about Recent Changes in Poverty and Distribution?” World Bank Economic Review 11, no. 2, pp. 357–82

36 Bhorat and Tarp
— — —. 2007. “China’s (Uneven) Pro gress Against Poverty.” Journal of Devel-opment Economics 82, pp. 1–42.
Ravallion, Martin, and Gaurav Datt. 1996. “How Im por tant to India’s Poor Is the Sectoral Composition of Economic Growth?” World Bank Eco-nomic Review 10, no. 1, pp. 1–25.
Rodrik, Dani. 2014. An African Growth Miracle? (Prince ton: NBER Work-ing Paper No. 20188, Institute for Advanced Study).
Sachs, Jeffrey D., and Andrew M. Warner. 1995. Natu ral Resource Abundance and Economic Growth (NBER Working Paper No. 5398, December).
— — —. 2001. “The Curse of Natu ral Resources.” Natu ral Resources and Eco-nomic Development 45, pp. 827–38.
Shirotori, M., Cadot, O., and Tumurchudur, B. 2010. Revealed Factor Inten-sity Indices at the Product Level (Policy Issues in International Trade and Commodities No. 44). New York: United Nations Conference on Trade and Development.
Tarp, Finn. 1993. Stabilization and Structural Adjustment: Macroeconomic Frameworks for Analysing the Crisis in Sub- Saharan Africa (London and New York: Routledge).
— — —. 2001. “ ‘Aid and Reform in Africa.’ Review of World Bank volume by S. Devarajan, D. R. Dollar and T. Holmgren.” Journal of African Economies 10, no. 4, pp. 341–53.
— — —. 2015. Aid Effectiveness (United Nations Development Group (UNDG)). https:// undg . org / wp - content / uploads / 2015 / 01 / Background - Study - on - Aid - Effectiveness . pdf
Verick, Sher D. 2006. The Impact of Globalization on the Informal Sector in Africa (Berlin: Economic and Social Policy Division, UNECA, and Institute for the Study of Labor). http:// www . iza . org / conference _ fi les / worldb2006 / verick _ s872 . pdf
Wills, Gabrielle. 2009. South Africa’s Informal Economy: A Statistical Profi le (WIEGO Working Paper (Urban Policies), No. 6, April 2009). ISBN 978-92-95095-08-3.
World Bank. 2013. Africa’s Pulse: An Analy sis of Issues Shaping Africa’s Eco-nomic Future (Washington, D.C.), p. 7.
— — —. 2014. “ Kenya: A Sleeping Lion or Speedy Lioness?” Country Economic Memorandum (Washington, D.C.).